Embed Size (px)
Citation preview

PROTECTIVE TRADE POLICY AND GLOBAL FILM MARKET: A CROSS-
SECTIONAL ANALYSIS OF REGULATORY TRADE BARRIERS AND THEIR
IMPACTS ON THE COMPETITIVE STATUS OF NATIONAL FILM INDUSTRIES
2000-2007
by
CUNFANG REN
(Under the Direction of Spencer F Tinkham)
ABSTRACT Acknowledging the economic and cultural significance of developing national
film industries, and in responding to the debate concerning cultural protectionism in the
international community, this study aimed to investigate one key issue that would shed
some light on the practical function of cultural protectionism, namely, do trade
protectionism methods work? How do they work? Do they work toward their stated
objectives? The research was conducted based on an investigation of six trade protective
policies on the development of national film industries in 78 countries over an eight-year
period from 2000 to 2007. It developed two composite TB indices and ten film
performance measurement dimensions. The result found the criticisms on the negative
impact of protective trade policies were exaggerated. Trade protective policies showed
positive composite long-term effects on increasing film productions, market share, box
office revenues, and film screens over the studied years. They also had short-term

II
contributions to increase film import diversity. The largest negative impact of trade
protections was on export, but the impact was for a short-term only.
Individually, quota was the most beneficial variable that showed significant
contribution on eight film performance indicators. Subsidy was another contributing
factor, but it was also most affected by time. Investment restrictions showed sustaining
negative effects on consumer spending and admissions. The main negative impact of
service restrictions was on film export. Taxation reduced audience spending. Tariff
played double roles in increasing film admission and screens, but reduced consumer
spending and import diversity.
Overall, increasing the quality of trade protections mattered. Because economic
development played the single most important role in determining national film
performances, for countries with less developed national economies or unfavorable
cultures for competing in current market environments, qualitative trade protections
might help in promoting domestic production and market share. Depending on the
combination of different protective methods, regulatory trade policies can play an
important role toward benefiting the local film industry.
INDEX WORDS: Protective Trade Policy, Regulatory Trade Barriers, National Film Industry, Culture Protectionism, Trade, Effect, Effectiveness, Impact

III
PROTECTIVE TRADE POLICY AND GLOBAL FILM MARKET: A CROSS-
SECTIONAL ANALYSIS OF REGULATORY TRADE BARRIERS AND THEIR
IMPACTS ON THE COMPETITIVE STATUS OF NATIONAL FILM INDUSTRIES
2000-2007
by
CUNFANG REN
B.A., Hebei University, Hebei, China, 1993
M.A., Peking University, Beijing, China, 1996
M.M.C., University of Georgia, Georgia, USA, 2004
A Dissertation Submitted to the Graduate Faculty of The University of Georgia in Partial
Fulfillment of the Requirements for the Degree
DOCTOR OF PHILOSOPHY
ATHENS, GEORGIA
2011

IV
© 2011
Cunfang Ren
All Rights Reserved

V
PROTECTIVE TRADE POLICY AND GLOBAL FILM MARKET: A CROSS-
SECTIONAL ANALYSIS OF REGULATORY TRADE BARRIERS AND THEIR
IMPACTS ON THE COMPETITIVE STATUS OF NATIONAL FILM INDUSTRIES
2000-2007
by
CUNFANG REN
Major Professor: Spencer F. Tinkham
Committee: Louise Benjamin Santanu Chatterjee
C. Ann Hollifield Electronic Version Approved: Maureen Grasso Dean of the Graduate School The University of Georgia December 2011

iv
DEDICATION
This dissertation is dedicated to the people whose work adds value and
enrichment to the cultural property of human beings.

v
ACKNOWLEDGEMENTS
There are many people for whom I am grateful. My greatest appreciation goes to
my committee member, Dr. Spencer Tinkham, Dr. Ann Hollifield, Dr. Luis Benjamin,
and Dr. Santanu Chatterjee, for their continuous support during the process of writing my
dissertation. Dr. Spencer Tinkham was always available to help me with my research
work. Without his continuous support and consultations, this work might never get a
chance to complete. Dr. Ann Hollifield has been a role model for me during my program
of study. Her combined strategic thinking and active attitude toward research always
inspired me. I am also very grateful to Dr. Louis Benjamin who gives me continual
support and encouragement. She continued to serve on my committee, even after having
left the University of Georgia for several years. I also want to thank my external
department committee member, Dr. Santanu Chatterjee, who always offers new
perspectives from an economist’s point of view, which is an essential part of this
interdisciplinary study. I heartily appreciate all my committee members for the
commitment you made to support my dissertation.
Special thanks also go to Dr. Hugh Martin, for his advice and guidance during the
early stages of the dissertation. His invaluable assistance helped establish a solid
foundation for the later work of the dissertation.
I would also like to extend my deepest appreciation to Mr. Bernadette Perez, the
Executive Assistant of Worldwide Government Policy from the Motion Picture
Association of America, who offered full assistance in helping me access the essential

vi
data for the dissertation. Dr. Steve Wildman from Michigan State University, Dr. Steve
Siwek from Economists Incorporated, and Dr. Akbar Marvasti from the University of
Southern Mississippi all provided generous guidance for carrying the research. Without
this critical assistance, the data gathering process would not have been as smooth as it
turned out to be.
Thanks to my entire family and friends, who provided emotional support during
times of difficulty. At times, when I felt so frustrated that I could not move on, it is my
husband who stands by me, giving me the courage to continue. Thanks also to my lovely
kids. It is the motive to become a better mother for them that keeps me from giving up
mid-way. Thanks also go to my parents and my in-laws. They always hold high
expectations for me. My mother-in-law came to the United States several times to support
my program of study and my dissertation writing. Without her help, I couldn’t finish the
key part of my dissertation. Thanks to all for your love and support.

vii
TABLE OF CONTENTS
Pages
ACKNOWLEDGEMENTS................................................................................................ v
CHAPTER
1 INTRODUCTION ........................................................................................... 1
Background .............................................................................................. 1
Trade Liberation and Worldwide Hollywood.......................................... 2
The Cultural Protection Movement ......................................................... 4
Statement of Problem............................................................................. 10
Purpose of the Study .............................................................................. 12
Dissertation Organization ...................................................................... 13
2 LITERATURE REVIEW ............................................................................. 15
Overview................................................................................................ 15
Why Do Cultural Industries Matter?...................................................... 15
Two Theoretical Frameworks ................................................................ 18
Should Culture Be Protected?................................................................ 34
Effectiveness of Protectionism Policies................................................. 41
Chapter Summary .................................................................................. 54
3 METHODOLOGY ....................................................................................... 56
Overview................................................................................................ 56
Research Questions................................................................................ 56

viii
Hypotheses............................................................................................. 58
Defining Variables ................................................................................. 62
Model Functions and Statistic Techniques ............................................ 83
Chapter Summary .................................................................................. 83
4 RESULTS .................................................................................................... 85
Overview................................................................................................ 85
Descriptive Statistics.............................................................................. 85
Correlation Analyses.............................................................................. 88
Regression Analyses .............................................................................. 96
Summary of Results............................................................................. 148
5 CONCLUSION AND DISCUSSION ....................................................... 158
Overview.............................................................................................. 158
Effect of Trade Protections on National Film Performances............... 158
The Effectiveness of Trade Protection Methods.................................. 169
Factors That Contribute To National Film Development .................... 182
Limitation and Recommendations for Future Research ...................... 190
Concluding Remarks............................................................................ 191
REFERENCES ............................................................................................................... 194
APPENDIX: LIST OF COUNTRIES AND THEIR MAJOR PARAMETERS IN YEAR
2000 AND 2007.............................................................................................................. 214

1
CHAPTER 1 INTRODUCTION
Background
In the year of 1921, Germany became the first nation to put into effect a quota on
film import, followed by Austria (1925), Britain and Italy (1927), France and UK (1928),
and other European countries including Czech (Segrave, 1997). The protection was
established in view of the increasing penetration of Hollywood films from the U.S. and
was aimed to protect domestic film industries, along with the political interest of
government who viewed the motion picture as a major tool for ideological and
propaganda purposes. Since then, history only sees the tensions escalate between
Hollywood and the film industries of other nations.
Accompanying the dominance of, and resistance to, Hollywood industry are
enormous debates in the international arena and scholastic community concerning the
justification of trade protectionisms in the film industry. The debates were integrated in
larger discussions about the validation, effect, and effectiveness of cultural protectionism.
Beginning in the last two decades of the twentieth century, the huge movement toward
trade liberation and the increasing incorporation of domestic industries into international
trade regimes made trade protections even more controversial. Countries feel the
increasing needs to protect their own industries, while at the same time face increasing
pressures when exercising their powers to protect their cultures. Under these
circumstances, a review of the current debates toward cultural protectionism and an

2
exploration of the effect of trade protections might provide valuable insight for cultural
policy makers.
Trade Liberation and Worldwide Hollywood
Hollywood emerged as a world film leader after World War I (Ulff-MØller, 2001).
In 1926, about 90 percent of the world film screens were captured by U.S. films (Segrave,
1997, p. 66). Hollywood dominance accelerated with the U.S. government’s increasing
commitment to free trade since after World War II. In the 1960s and 1970s, the open
market campaign in the communication field, under the slogan of ‘free flow of
information’, encountered the most heated debate and resistance in the third world
nations who called for a New World Information and Communication Order (NWICO)
(Herman & McChesney, 1997). In the 1970s and 1980s, driven by the findings of the
UNESCO studies (Nordenstreng & Varis, 1974; Varis, 1984) about the one-way flow of
television and feature film programs from the U.S. to the rest of the world, the fear of the
third world over American hegemony and cultural imperialism intensified.
Throughout the 1980s and 1990s, liberal trade ideology was globally campaigned
(Comor, 1997) and opening export markets became major policy goals of the U.S.
government (Pearson, 2004). Led by the U.S. and through rounds of multilateral talks
under General Agreement on Tariffs and Trade (GATT ), the World Trade Organization
(WTO), as well as other regional and bilateral trade negotiations, the world saw a swift
trend of trade liberalization, privatization, and commercialization (Hufbauer & Warren,
1999). The heavily regulated media industry did not avoid this change. In the film sector:
Eastern Europe was liberated in late 1980s; Korea opened its distribution market in 1987;
India relaxed restrictions on film import, foreign ownership, and dubbing in 1993;

3
Canada opened film productions to private capitals and U.S. investment in the late 1970s
and the early 1980s; Britain reduced screen quota in 1981; Switzerland deregulated the
film imports and theater ownership restrictions in 1993; Mexico totally repealed screen
quotas in 1994 (Segrave, 1997). From Asia to Europe, from North America to Latin
America, the film markets gradually opened, under both economic and political pressures
(Herman & McChesney, 1997). The structural changes were also felt in the broadcasting
and telecommunications industry where commercialized and privatized systems were
established worldwide (Herman & McChesney, 1997).
Corresponding to this process of media liberalization was the increased
dominance of U.S. films and the decline of domestic films in other nations. According to
Segrave (1997), the domestic share of Korea fell from 50 percent in 1980 to less than 40
percent in 1990s; Most European countries had a domestic share under 20 percent.1 In
Korea, allowing foreign direct distribution resulted in 80 percent of box office revenues
went to the U.S. films in 1988. Canada’s opening of film productions to foreign
investment resulted in a huge flow of U.S. investment and productions of Hollywood-
styled films. Mexico’s repeal of its screen quota in 1994 led to a total collapse of film
productions in the years that followed. Productions fell from 100 to 4 films per year. And
similar situations occurred in Germany, Britain, France, Spain, Turkey, and elsewhere.
The market share of foreign films in the U.S. had also declined dramatically over
the years, falling from 10 percent in 1960s to 7 percent in 1986, less than 2 percent in
1991, and 1/3 of 1 percent in 2005 (Marvasti & Canterbery, 2005; Segrave, 1997). In
2004, the top 10 foreign language films took only one percent of the U.S. national box
office revenues, according to Screen Digest (2005). This made the U.S. market almost 1 Except France that has a market share of 35% in the same period of time.

4
close for foreign competition, even though the U.S. claimed to be a market free of
regulatory barriers.
Over the same period of time, exports of the U.S. films increased dramatically
(Scott, 2002b). In the 1970s, Hollywood earned 1/3 of revenue from overseas (Thussu,
2007). In 1991, 43 percent of its total revenue came from foreign markets (Wasko, 1994).
In 2000, the revenues from overseas markets exceeded domestic box office receipts.
Compared with the 1986 level, export revenues grew at a rate of 426 percent, far
exceeding (151 times) the growth rate of gross domestic revenues at 28.3 percent (Scott,
2002a). By 2005, more than half of box office revenues came from foreign markets
(Thussu, 2007) and the U.S. owned between 40 percent and 90 percent of the movies
shown in most parts of the world (Miller, Govil, Richard, & John, 2005).
Therefore, Wasko (1994) declared, deregulation and technological innovation
mainly fostered the competitive advantages of Hollywood. And in the long run, the trend
“has clearly favored Hollywood’s increasing domination” (Rosen, 2003, p. 119).
The Cultural Protection Movement
Originating in Europe in the 1920s, the resistance to the U.S. film dominance
from other countries has never stopped. In the 1930s, protection of domestic media
industry became formal legislations in Canada (Herman & McChesney, 1997). In the
1960s and 1970s, the campaign for NWICO constituted the most intense struggle over
‘free flow of information’ from the first world (Ó Siochrú, Girard, & Mahan, 2002). In
1989, the EU “Television without Frontiers Directive” (the “Directive”) went into effect
with the aim of limiting U.S. television and films in the European market. The movement
of resistance culminated in the fall of 1993 when North America Free Trade Agreement

5
(NAFTA) and GATT negotiations were concluded with cultural exclusions became the
focal point of the negotiations (McAnany & Wilkinson, 1996). Therefore, in association
with the increased movement toward trade liberalization, the drive for cultural protections
also helped shape the rules concerning treatment of cultural industries in international and
regional free trade regimes.
Cultural Exceptions in GATT
GATT, under the very basic principles, the most-favored-nation requirement
(Article I) and national treatment provision (Article III), requires members to conduct
trade on a nondiscrimination basis (Kim, 2000; Pearson, 2004; Pool & Stamos, 1990).
However, concerns over the U.S. hegemony in film productions and its cultural
influences (Duarte & Cavusgil, 1996) and the insistence of the European countries in
continuing import restrictions on films (Galperin, 1999) finally led the cinematograph
films exempted from free trade requirement at the signing of GATT. As a result, Article
IV of the GATT, Special Provisions Relating to Cinematograph Films, allowed using
screen quotas to reserve screen times for locally produced films (Kim, 2000). The aim
was to limit the negative effect of U.S. dominance rather than promote local productions,
according to Duarte & Cavusgil (1996). Protection measures were also allowed
temporarily, according to Cahn and Schimmel (1997), “…when international competition
threatens the survival of a domestic industry…” under Article XIX “Emergency Action
on Imports of Particular Products” (p. 3), or when concerning “national treasures of
artistic…value…” (pp. 2-3) under Article XX (f). The latter includes literary, pictorial,
musical works, and audiovisual works (Cahn & Schimmel, 1997).
6
“Cultural Exclusions” under WTO-GATS
As an important agreement included in the WTO framework, General Agreement
on Trade in Service (GATS) was governed by the same principles as GATT: most-
favored nation requirement, national treatment, and free market access (Galperin, 1999).
During the negotiations that led to the establishment of GATS, enormous debates
occurred over the treatment of the audiovisual industry, mainly between the European
Union (EU) and the U.S. (Kim, 2000). The EU wanted to exclude the sector from GATS,
and the United States disagreed. Finally, the members reached an “agreement to
disagree,” which in effect excluded the industry sector from GATS provisions (Cahn &
Schimmel, 1997, p. 8). As a result, countries are free to use quotas, subsidies, Co-
production treaties, and other methods to promote domestic productions unless they make
special commitments to liberalize audiovisual sectors (Bernier, 2004). This “positive
approach” (Bernier, 2004) allows countries to liberalize the sector progressively,
according to their own conditions. Up to now, the majority of the countries reserve the
sector from making any specific commitment.2
Bilateral FTA and U.S. New Strategies
Although GATT and WTO-GATS framework offer legitimate cause for culture
protections, the protections can only be considered a temporary reconciliation rather than
a final resolution. According to Article IV(d) of GATT, screen quotas, although
permitted, were subject to further negotiations for their final elimination (Kim, 2000).
2 According to Kim (2000) and (Bernier, 2003), 14 countries made specific commitments in the audio-visual sector at the conclusion of Uruguay negotiations, including Dominican Republic, Hong Kong, India, Israel, Japan, Kenya, Korea, Malaysia, Mexico, New Zealand, Nicaragua, Singapore, Thailand and the United States. 13 developing countries made commitment when joining WTO, including Albania, Armenia, Central African Republic, China, Dominican Republic, El Salvador, Gambia, Georgia, Jordan, Kyrgyzstan, Lesotho, Oman, Panama.
7
Similarly, under Article XIX GATS, the audiovisual sector was included in “mandated
sectors,” which means they are automatically included in new round of trade liberating
negotiations (Chiang, 2007; Ó Siochrú, Girard, & Mahan, 2002), and the negotiations are
actually already underway between EU and the U.S., according to Galperin (1999).
Furthermore, the U.S. has been more successful in continuing its effort to
liberalize trade in media products at regional and bilateral level. Disappointed by the
cultural exclusions under GATS, the United States has become more active in regional
and bilateral Free Trade Agreements (FTAs). Regional and bilateral negotiations over
cultural trade are relatively less complex compared to those at the multilateral level (Ó
Siochrú, Girard, & Mahan, 2002). Using economic power, political pressures, and
sometimes the threat of retaliations (Cahn & Schimmel, 1997) are common tricks in
forcing foreign governments to comply. As a result, the majority of bilateral FTAs
include cultural issues (Ó Siochrú, Girard, & Mahan, 2002).
Canada provides an example of exception. Under NAFTA, Canada was able to
exempt cultural industries from the agreement. However, retaliation from the U.S. was
permitted in responding to the exception under the “notwithstanding” clause specified in
Article 2005 (Beale, 2002). It means that any restrictions from Canada could lead to U.S.
retaliations with a method equivalent to the loss by the U.S. companies (Ó Siochrú,
Girard, & Mahan, 2002). This retaliation clause makes the exception, at practice,
meaningless because the possible price for any restrictions could be high.
Negative List Approach
Bernier (2004) examined the FTAs that the U.S. concluded with Chile, Singapore,
Central American States, Australia, and Morocco from 2002 to 2004 and found several

8
new strategies the U.S. developed in dealing with cultural trade. Among them, one
apparent change of the U.S. strategies is a shift from GATS positive list approach to a
negative list approach to scheduling commitments. In this approach, unless countries
make reservations/exceptions on their schedule, all members are included in the
agreement. Therefore, the burden is shift to countries who wish to exclude sectors from
trade agreements.3
Electronic Commerce
Another important change is the shift of attention to digital communication
networks. In these FTAS, existing protections in the traditional audiovisual sector are
more tolerated. More focus is put on preventing future protections in digital networks
and electronic commerce (Bernier, 2004). Therefore, even if current protections could
remain as status quo, countries lose the power of setting up protections for the industry as
it continues to develop digitally, which is the key to future development.
IP Right
Although cultural industry was temporarily excluded from the GATS agreement,
the completion of the Uruguay round of trade negotiations “marked a big milestone of
trade liberalization” (Pearson, 2004, p.13). As a result of the negotiation, service industry,
intellectual property rights, and trade-related investment issues were all included within
the free trade regime, the WTO. And these three aspects all have significant potential
impacts on cultural trade.
3 According to Bernier (2004), countries who wish to exclude certain sectors must explain and to obtain the consent of the other contracting State or States. The result would quite depend on individual country’s negotiation power and adequacy in preparation and expressions.

9
Of particular importance is the inclusion of the Agreement on Trade-Related
Aspects of Intellectual Property Rights (TRIPS) in the agreement, which is highly related
to the audiovisual sector. Due to U.S. producers’ increasing complaints about loss of
revenues from audiovisual piracy, strengthening copyright protection has been a recent
priority of the U.S. The integration of TRIPs into WTO regime marked a big victory for
industrialized countries (Ó Siochrú, Girard, & Mahan, 2002). As a result of TRIPs,
developing countries are forced to apply IP standards of the industrialized nations and
lose the right of adjusting their standards according to their own schedules and
development status.
Copyright protections and IP rules are also highlighted in regional and bilateral
FTAs. By joining FTAs with the U.S., countries must agree to make changes in their
legal frameworks, enact copyright and IP laws, and ensure the enforcement of laws, as
seen in the case of Mexico, for instance, when the country prepared itself for signing into
NAFTA (McAnany & Wilkinson, 1996).
The Cultural Diversity Movement
Unsatisfied with the progress under the “cultural exception” movements, the
UNESCO (United Nations Educational, Scientific and Cultural Organization) Convention
on the Protection and Promotion of the Diversity of Cultural Expressions was adopted in
2005. This declared a new wave of cultural protection movement under the cultural
diversity strategy. The convention emphasizes the significance of preserving cultural
diversity and the sovereign right of national states to protect/promote their cultural
expressions through policy measures (Chiang, 2007; Jin, 2008). However, the convention

10
does not provide binding rules or generate rights, therefore offers little help for countries
to compete in the market (Nurse et al., 2006).
How Far Can Cultural Protections Go?
Overall, cultural exception, cultural exclusions, and cultural diversity movement
legitimize cultural protections currently exercised in many countries (Ó Siochrú, Girard,
& Mahan, 2002). However, the protection is only short-term. Under the increasing move
toward global economic integration, how far cultural protections can go is not clear.
Further, due to the changing media environment and new U.S. strategies on cultural
protections, the effectiveness of the protectionism is also in question.
Statement of Problem
“Economic globalization has called into question the traditional basis for state
intervention in the cultural sphere” (Raboy, Bernier, Sauvageau, & Atkinson, 1994, p. 1).
As cultural trade was introduced into international free trade regimes, the power of
individual nations to exercise cultural protections is restricted. By joining multilateral,
regional, bilateral FTAs, countries agree to abide by rules that limit their right to pass
laws and regulations concerning market and trade relations (Ó Siochrú, Girard, & Mahan,
2002). They also must make sure their domestic regulations conform with certain
international standards, which many criticize tend to favor the most powerful
governments and corporations (Ó Siochrú, Girard, & Mahan, 2002). The U.S. can also
topple foreign protections through WTO rulings (Crane, 2002), such as in the Sports

11
Illustrated Case (Beale, 2002).4 Wide-spread economic integration makes protections
further invisible. As an example, Canada obtained a cultural exclusion in its 1988 U.S.-
Canada FTA and NAFTA. However, as revealed by Martin (1996), Canada’s cultural
market is very open. Therefore, U.S. capitals can flow freely into the market and easily
control the capital investment in the film market. This actually makes the cultural
exclusions useless.
Quite often, the policy goals of nation states to protect their domestic cultures
contradict with the interest of pursuing greater economic integration with the U.S. As a
result, the nation states often prefer to sacrifice cultural interests in order to achieve the
economic goals. This is the case in Korea during its FTA negotiations with the U.S. In
the year 2007, Korea was forced to halve its film screen quota under extreme pressure
from the United States (Sung-Jin, 2006). This case bears some symbolic meanings, since
Korea has been at the forefront in resisting Hollywood dominance and also has made
great achievement and success (Jin, 2008). Korea has been considered a banner for other
nations to follow. If previous protections on films have been effective, what would the
impact of this rapid policy change in screen quotas be on its film industry?
Historically, the U.S. imposed various restrictions on media investment and
ownership (Wasko, 1994) and provided extensive legal and financial aid during
Hollywood’s development and expansion (Segrave, 1997). Governments of other nations,
however, find them hard to do the same under the current trend of global liberalization.
Development of digital communications networks further challenges traditional
protection techniques. 4 In late December 1995, Canada enacted an 80 percent excise tax on Canadian advertising on non-Canadian magazines. The U.S. suit Canada to WTO. In 1999, Canada was ruled to withdraw the tax under WTO ruling. 40% loss of Canadian magazine titles was reported in the following years.
12
Under these circumstances, trade protective policies met increasing criticism. The
necessity for, and effectiveness of, such protection is being questioned (Wildman, 1995;
Wildman & Siwek, 1988, 1993). Many countries are struggling to balance the need
between protecting domestic cultural productions and participating in the international
economy. These countries face increasing challenges as they try to establish effective
cultural policies that can balance national interests while increasing social well-being. In
these circumstances, answers to the question of how far can cultural protectionisms go, or
should protective trade policies in cultural products and services continue, should be
based on a comprehensive examination of the impact and effectiveness of current
protective techniques in this new era.
Purpose of the Study
This dissertation investigated the impact of various widely-used policies for
protecting one important aspect of cultural industry, the national theatrical film industry.
Motion pictures are capable of “portraying each nation’s unique culture and lifestyle,”
(Wildman & Siwek, 1988, p. 136) and affect people’s attitudes, beliefs, and ways of
living. The unique ideological and social-cultural functions of films get them special
treatment from current international free trade regime. Due to Hollywood’s large scale of
penetration, however, the existence and development of film industries in many nations
are seriously threatened. The huge revenues at stake for U.S. filmmakers have
encouraged the U.S. government to seek reduction and elimination of trade barriers. This
makes the task of seeking effective protective methods even more pressing.
Despite the enormous debate over cultural protections and the pressing task of
evaluating the effectiveness of current protective policies, empirical studies on the impact

13
and effectiveness of policies protecting cultural industries are limited (Dupagne &
Waterman, 1998; Hanson & Xiang, 2006; Lee & Bae, 2004; H. Lee, 2008; Lee, Kim, &
Kim, 2008). Further, these studies are mostly based on small numbers of sample
countries and employ time-invariant measures. These make their findings hard to
generalize. Studies on international trade in films are especially sparse (Hanson & Xiang,
2006; Jayakar & Waterman, 2000), with fewer studies on protective trade policies in the
film industry (Lee & Bae, 2004; Lee, Kim, & Kim, 2008). Findings from these studies
are also inconsistent.
The study investigated the effect and effectiveness of trade protective policies on
national film development over the eight year period from 2000 to 2007. It took a deep
look at the different trade barrier variables and their functions in the development of local
film industries. It also identified several key factors that are significant in determining the
development of national films in three functional areas and ten different measurement
dimensions. Understanding the functions of these key factors, together with an
understanding of the direction and significance of different trade barrier variables,
hopefully, will offer constructive input for countries that are under the way of forming
strategic plans for future cultural development. Results from this study will also have
implications for researchers, cultural activists, and policymakers who are interested in the
connections between trade integration and development of domestic media industries
with diverse cultural output.
Dissertation Organization
The dissertation was organized as follows: Chapter 2 reviewed literature on the
debate over cultural protectionism. This included a review of the theoretical frameworks

14
for the cultural debate, rationale for and against cultural protections, and research on the
impact and effectiveness of protective policies. The chapter ended with a summary of the
gap of existing literature and introduction of the dissertation research. Chapter 3 detailed
the research questions, hypothesis, and methodologies used to conduct the research.
Findings were presented in Chapter 4, followed by conclusions and discussions in
Chapter 5.

15
CHAPTER 2 LITERATURE REVIEW
Overview
The conflicting interests surrounding the production of the motion picture
industry and other cultural industries are highlighted much more in the debates on
cultural protectionism. This chapter reviews existing scholastic works and arguments
toward cultural protectionism. Specifically, the review was based on arguments from two
theoretical frameworks, and mainly covers scholastic arguments toward cultural
protectionism in three aspects:
1. Why do cultural industries matter?
2. Should cultural industries be protected?
3. Do protective policies over cultural industries work?
This review will not only help to put the current research in a historical
background of previous scholastic research, but also help provide a basis for this study in
forming research questions, defining research variables, constructing research
methodologies, and conducting data analysis.
Why Do Cultural Industries Matter?
What is the nature of films? What are the differences of films from other products,
such as cars or shoes? Answers to these questions reflect basic theoretical differences in
considering the nature of cultural products and services by the different parties involved.

16
In the report prepared for the Caribbean Community and Common Market
(CARICOM), Nurse et al. (2006) defined cultural industries as industries that produce
“aesthetic, identity and copyrightable goods, services and intellectual property” (p. 22).
The definition reveals four distinct characteristics of cultural products and
services (INCP, 2003; Sanghera, 2000). First, cultural goods and services are the creative
output of individuals and organizations. Second, cultural products and services are
intellectual properties. The products are knowledge-based, adding value to current
knowledge base of society, and are protected by intellectual property rights. Third,
cultural goods are dual-products: they are commodities, but they also convey values,
cultures, symbolic meanings, and identities. Fourth, cultural goods and services are
representative of a country’s unique identity, not substitutable with products or services
from another culture (Diversity, 2004).
The contribution of cultural industries also lies in two aspects; that of economic
and that of social cultural in nature. Economically, cultural industries create income,
employment, and export earnings. Cultural industries include printing media, music,
cinema, audiovisual and multimedia productions, and often incorporate creative
industries and cultural heritage such as performing arts, museums, and cultural tourism
(INCP, 2003; Nurse, et al., 2006; UNESCO, 2005, 2006). They are important factors for
economic development. The contribution of cultural industry in economy is intensified
with knowledge-based industries being the key driving force of development. In the U.S.,
for instance, cultural and other copyright-based industries account for 11.12 percent of
the gross domestic product (GDP) and 12.96 percent of the growth achieved in 2005, and
remains the largest and fastest growing economic sector (Siwek, 2006). Cultural

17
industries are among the fastest growing industries in the world. According to UNESCO
(2005), culture and creative industry account for more than 7 percent of global gross
product and will reach 10 percent in the following years. They are also important in
keeping trade balanced internationally. In the U.S., for instance, the film industry is
among the few industries that enjoy a trade surplus. An empirical examination (Disdier,
Tai, Fontagne, & Mayer, 2007) revealed cultural exchanges helped raise overall trade
volume,5 implying trade in cultural goods affect overall awareness and perceptions of the
importing countries.
Cultural industries are also linked with heritage and tourism. They benefit the
economy by attracting visitors, businesses, residences, and investments (Guetzkow,
2002). Cultural tourism accounts for 40 percent of the total annual visitors in some major
cities and they appear to spend more, according to Nurse, et al. (2006). Exploiting
cultural heritage to improve national image (Tomooka, Kanno, & Kobayashi, 2002),
revitalize cities, neighborhoods, and communities (Guetzkow, 2002; Kwok & Low, 2002),
to promote tourism and economic prosperity have been documented as successful
strategies in cultural economic studies (Coy, 2000; Guetzkow, 2002). For instance, using
cultural symbols to improve national prestige proves successful for the modernization of
Japan (Tomooka, Kanno, & Kobayashi, 2002) and Singapore (Kwok & Low, 2002).
Cultural industries also create social capital, an intangible value to society.
Cultural industries produce symbolic goods that involve collective experiences and public
expressions (Guetzkow, 2002; Martin, 2004). For a country, cultural products create the
symbols that define the identity of the country and its inhabitants. They increase the sense
5 The study found 10 percent increase in cultural trade lead to 3.2 percent increase in overall trade, indicating cultural trade as a significant facilitating factor over non-cultural trade.

18
of collective identity and social cohesion, promote psychological ties and build social
networks (Sanghera, 2000, p. 4). An examination of China’s media development since
1979 (P. S.-n. Lee, 1994) suggests that social consensus, integration, and stability were
obtained more through cultural interaction than through political or educational
communications. This integrative function reinforces economic growth.
Finally, consumption of cultural products has network externalities (Rauch &
Trindade, 2006). Current consumption of cultural goods not only facilitates future
cultural productions, but also fosters innovation and creativity that enhance future
economic performance (Bernier, 2003c; Sanghera, 2000; UNESCO, 2006). Therefore, the
value and impact of cultural products goes “far beyond their economic dimension” (Moo-
Hyun, 2003, p. 1). Preserving cultural expression, maintaining the viability of domestic
culture, and promoting cultural diversity is a “fundamental human right” (Moo-hyun,
2003, p. 2).
Two Theoretical Frameworks
The dual nature of cultural products as both commodity and “bearers of identity,
values and meaning,” (UNESCO, 2005, p. 1) often gives rise to tensions between
countries who emphasize one versus the other in cultural policy-making at the
international level. At the center of the disputes is the disagreement on how cultural
products should be classified (J. Kim, 2000). Different approaches are taken based on two
different paradigms: the free market paradigm and the political economic paradigm. The
two paradigms differ, not only in viewing the nature of cultural products, but also in
evaluating cultural trade, explaining U.S. dominance in cultural trade, and in viewing of
cultural protections.

19
The Free Market Paradigm
The free market paradigm is based on economic analysis of trade and U.S.
dominance. It derives mainly from pure economic perspective and is constrained to
economic explanations of trade. It argues media products are like other commodities,
and should be regulated by market forces (Renaud, 1993). The uneven international flow
of cultural products is mainly a result of free-market laws. Trade in media products and
services should apply the same principles of the GATT or GATS. Free trade without
government intervention is most desirable (Wildman & Siwek, 1988).
Trade Economics and Free Trade Rationale
Free trade ideology is mainly based on economic analyses of trade that shows free
trade leads to a greater benefit than no trade (Pugel & Lindert, 2000, p. 121). The idea
originated in Britain in the 18th century (Oatley, 2006), and is best expressed in classic
trade theory (Adam Smith’s theory of absolute advantage, David Ricardo’s Principle of
comparative advantage in the early 19th century). The theory emphasized relative
production cost as a cause for trade. A country should specialize in producing goods that
it makes at absolute, or relatively low cost, and trade for goods its trade partner produces
at a lower price. Trade benefits both countries, as it allows countries to consume beyond
their production capability at lower prices (Pugel & Lindert, 2000). Therefore, classic
theory concludes that a market-based system for resource allocation can maximize profit
and utility. Free trade without government intervention allows for the highest social
welfare (Oatley, 2006).
Developments after Ricardo focus on different aspects of trade, but the general
consensus that free trade is greater than no trade stays the same. For instance, Heckscher-

20
Ohlin Model, developed in 1933, focuses on differences in relative factor endowment,
such as each country’s stock of labor, and capital, as a basis for trade. Basically, the
model predicts countries will export commodities that are produced using more of the
countries’ abundant factor(s) in exchange for imports of goods that use more of their
scarce factor(s) (Appleyard, Field, & Cobb, 2006). In this case, factors used in export
industries and consumers of import goods gains. Factors used in import competing
industries and consumers of export goods lose. Countries are still better-off overall, as
gains are greater than losses (Pugel & Lindert, 2000). The H-O model mainly describes
trade in goods that are produced using static factors. It implies, however, that countries
with larger stocks of skilled and efficient cultural workers and financial support will
export more of their goods.
Overall, classic trade theories focus on a two-country world, and are based on
unrealistic assumptions of perfect competition, identical preferences, constant return to
scale, homogenous goods, and inter-industry trade (Schultz, 1999). The theories cannot
explain the increasing volume of intra-industry trade (exports and imports of the same
goods), nor can it explain trade with product differentiation and under economies of scale,
such as trade of cultural products.
In contrast, modern trade theory focuses on explaining monopolistic competition,
product differentiation, scale economies, and intra-industry trade (Pugel & Lindert, 2000;
Schulze, 1999), and therefore are more applicable to cultural trade. For instance,
according to the Linder Theory (1961), product differentiation (a different variety of the
same product) can be a basis for trade because consumer tastes differ. Trade occurs
between similar countries for differentiated products that cater to audience tastes and

21
preferences that are not being served in the importing country. Product differentiation can
also result from a technological gap. According to Vernon’s Product Life-Cycle Theory
(1966), trade generally flows from technologically advanced countries to technologically
lagging countries. The latter catch-up when industry develops and technologies diffuse.
The cycle ends with an industry’s decline. In both cases, trade is beneficial. It allows
consumer access to greater variety of products, and at lower product prices.
Most cultural trade occurred among similar economies for heterogeneous
products (Schultz, 1999), therefore, can be explained by the Linder Theory. Cultural
industries, such as film, depend on specialized production technologies. Countries with
advanced production technologies may also export more of their cultural products.
However, since cultural production involves creative content production, technology by
itself may not determine the direction of export.
Modern trade theory also emphasizes the role of scale economy. Economies of
scale occur when unit production cost falls as the size of the output increases. Scale
economy can happen at the firm level (internal economies of scale), and at the industry or
country level (external economies of scale) (Appleyard, Field, & Cobb, 2006). When
operating under increasing returns to scale, firms or industries tend to focus on producing
different product varieties at large scale. Intra-industry trade occurs when countries
specialize in producing different varieties of goods at large scale, and trade for goods that
do not have similar advantages in production (Krugman, 1980). In this case, total output
increases and price decreases. Consumers have access to a greater product variety and
diversity. Producers enter more markets. Therefore, trade enhances social welfare in

22
general. This rationale of trade is often used by media economists in explaining the
benefit of trade, as illustrated later in this dissertation.
Modern theory extends classic theory in considering more complex trade
conditions. However, the consensus favoring free trade remains the same as classic trade
theories. According to their arguments, free trade is optimal. The more trade, the more
benefit. This provides the basic rationale for international free trade regimes such as
GATT and the WTO.
Economics of Media Trade
Several economic characteristics of media products make free trade rationale
applicable:
First, strong economies of scale exist in media productions. Media goods enjoy
scale economies because of high first copy costs that are spread across each subsequent
unit of output. While the cost of producing the master copy of a film is extremely high,
each additional copy can be manufactured at an extremely low cost, using the latest
digital technologies. Therefore, producers benefit by increasing the scale of production.
Countries with larger production scale in media products, such as films, will benefit from
concentrating on manufacturing and exporting more products.
Second, economies of scale also exist in distribution. Media products are public
goods. A public good is not “used-up” by a single consumer, and therefore can be sold
and resold to different consumers (Hollifield, 2004; Hoskins, McFadyen, & Finn, 1997;
Priest, 1994; Wildman & Siwek, 1988). Each new sale adds more profit than cost,
because most of the cost of production is incurred in producing the master copy, and the
cost to reach additional consumers is insignificant (Duarte & Cavusgil, 1996). Therefore,

23
increasing exports and addition of new consumers enhance economies of scales, lower
the unit cost of the products, and help production companies to overcome the soaring cost
(Hoskins, et al., 1997; Marvasti & Canterbery, 2005). Thus, for media products such as a
movie, once created, the profit is directly related to the consumer numbers they reach
(Duarte & Cavusgil, 1996). International sale is a natural extension of home market. It
allows media companies to reach the largest possible number of consumers and benefit
from external economies of scale.
Third, media productions involve high risk. All investments in productions are
upfront (Hollifield, 2004), yet, consumer demand is hard to predict. Research indicated
the lifespan of a film in theaters was short, and the majority of the box office revenues
were earned during the first three weeks of screening (De Vany & Walls, 1999). The risk
in production is intensified with rising competition and soaring production costs. Media
products compete with available substitutes for limited consumer income and time. The
“experience good” nature of media products means consumers cannot evaluate the value
of the good until it is consumed (Chang & Ki, 2005). Media companies attempting to
differentiate their products using various strategies, such as using famous stars and
intensive marketing, which leads to soaring cost of productions. The high risk of
production and uncertain audience demand means media producers have an incentive to
cash-in on a few successful products, spreading the cost by distributing those products to
more markets. In the past two decades, the U.S. not only benefited from growth in
secondary market (DVD, VOD, Pay TV, etc. ), but also from expanding to overseas
markets (Marvasti & Canterbery, 2005).

24
Therefore, a combination of scale economies, public good nature, and high
production risk makes large-scale production and global trade economically efficient.
Economic Analysis of U.S. Dominance
The free market paradigm also uses an “economically inspired analysis”
(Biltereyst, 1996, p. 5) to explain the US media dominance. According to this paradigm,
several free market rules offer competitive advantages to larger nations and lead to the
U.S. dominance in media trade.
The Home Market Effect (HME)
HME, sometimes referred to as the new economic geography model, was derived
from Krugman (Helpman & Krugman, 1985; Krugman, 1980, 1991). The HME is the
tendency for industries with economies of scale, differentiated product and trade costs
concentrated in large countries, making them the net exporters of these goods (Hanson &
Xiang, 2004). The HME implies a link between a country's market size and direction of
trade. The model was advanced by some media economists (Hoskins & Mirus, 1988;
Waterman, 1988; Wildman & Siwek, 1988) to explain the dominance of large, wealthy
countries, mainly the U.S., in world media trade. According to them, large market size
offers competitive advantages in several aspects.
First, market size enhances both internal and external economies of scale.
Marvasti’s empirical study (Marvasti, 1994) found countries with greater population and
higher income export more films and recorded music. A later study of U.S. trade in
motion pictures from 1961-1988 (Marvasti, 2000) confirmed that trade surplus is directly
enhanced by population size (scale of domestic market). Therefore, market size provides
U.S. producers comparative advantages to enjoy economies of scale.

25
Second, large and wealthy countries have larger consumer demand. According to
Wildman & Siwek (1988), producers respond to larger consumer demand with higher
production budgets, which results in higher quality and more competitive products.
Therefore, market size increases quality, quantity, and variety of products.
Third, Waterman (1988) emphasized consumer spending as a driving force for
media development. According to Waterman (1988), large wealthy markets have greater
consumer spending. Greater consumer spending leads to more developed media
infrastructure, which in turn, increases audience demand, investment, productions and
exports. The relationship between consumer spending and media development are
empirically supported by researchers (Dupagne & Waterman, 1998; Jayakar & Waterman,
2000; Waterman, 1988, 1993, 2005; Waterman & Jayakar, 2000; Waterman & Lee, 2007;
Waterman & Rogers, 1994).
Fourth, large wealthy countries have more capabilities in creating high-budget
films. Using famous stars, recorded directors, sequels, special effects, and intensive
marketing are common in the U.S. films. These strategies effectively differentiate
Hollywood films, drive consumer demand, and enhance box office performance. The
capability of the U.S. companies in bearing the soaring production and distribution cost is
incomparable by other nations, and proves to be the greatest barrier for foreign
competition (Marvasti & Canterbery, 2005).
Finally, large markets have less cultural discount in trade. Audiences have the
tendency to prefer media products that use their own culture or language, due to language
barriers (Wildman & Siwek, 1988) and cultural discount (Hoskins & Mirus, 1988) in
media consumption. U.S. films enjoy less language barrier due to large English
26
populations worldwide. Cultural discounts also asymmetrically favor large, wealthy
countries (Schulze, 1999, 2003). This is because products from large countries have
larger potential markets.6 Producers enjoy scale economies and are more likely to recoup
investment at home and make a profit abroad. U.S. producers are also good at
overcoming cultural discount by producing common denominator products with low
cultural value (Hoskins & Mirus, 1988), as well as using localization strategies (Crane,
Kawashima, & Kawasaki, 2002). Therefore, U.S. films are well-received worldwide.
Over time, the wide spread of Hollywood films further reduced the cultural
discount. Researchers (Disdier, Tai, Fontagne, & Mayer, 2007; Schulze, 2003) indicate
that cultural consumption is addictive: the more one consumes a particular product, the
more one’s ability to appreciate the products, the more one demands the product. This
implies that cultural discount decreases with accumulation of consumption capital. As
U.S. films are widely consumed at a global level, cultural discount for the films are
further decreased. In contrast, foreign films are still widely resisted by the U.S. audiences
because of low consumption experiences. Therefore, cultural discount between two
countries are not asymmetric (Disdier, Tai, Fontagne, & Mayer, 2007). The cultural
discount factor tends to favor the dominant films and disadvantages films from non-
dominant cultures.
The importance of market size in determining trade directions has been tested
empirically. The studies generally confirm market size as an important determinant of
motion picture exports (Marvasti, 1994, 2000), market share of domestic films (Lee &
Bae, 2004; Oh, 2001), and consumer movie spending and market share of film industries
6 The potential markets for products from large countries are large home market with no cultural discount plus small foreign market with discount.

27
(Jayakar & Waterman, 2000; Waterman, 2005; Waterman & Jayakar, 2000; Waterman &
Lee, 2007). In International Trade in Art, Schulze (1999) found countries with a higher
GDP not only have higher volume of art trade, but also have higher art trade-to-total-
trade ratio.
Industry structure and market characteristics
In addition, researchers have pointed out other competitive characteristics of the
U.S. industry and market. For instance, Hoskins and McFayden (1991), using Porter’s
theory of competitive advantages (Porter, 1986, 1990), identified factors for U.S. success,
such as first mover advantages, technological leaders in production, cost leaders resulting
from vertical integration and economies of scale and scope, and a powerful global
distribution network. Highly developed commercialized infrastructure and specialized
financing service provides favorite investment conditions (Waterman, 1993). Competitive
domestic market, a large pool of talented personnel, and diverse population yield
products with high quality and a broad appeal (Hoskins, McFadyen, & Finn, 1997).
Furthermore, the geographical concentration in Hollywood provides the U.S. film
industry an easily accessible market for specialized services and labor pools at low cost,
allowing the industry to enjoy high external economies of scale (Schulze, 1999).
The Political Economy Paradigm
Economic analysis provides a basis for understanding media industry and
international trade. However, the analysis focuses mainly on profit and utility
maximization of individuals, and ignores the important political and cultural implications
of the media industry (Renaud, 1993). Furthermore, ascribing the U.S.’s success in the
international media market to mere free market force is not confirmed by history.
28
Political economy studies social and power relations within the production,
distribution, and consumption of resources (Mosco, 1996). It argues “pure markets,
unencumbered by political intervention and regulation, do not exist and is impossible”
(Maswood, 2000, p. 1). An important theory developed from political economic
paradigm is the cultural imperialism thesis that emerged in the 1960s. According to the
thesis, the U.S. cultural dominance is purposeful, with political and capitalist interest
involved (Crane, 2002). The free flow of media products allows U.S. media corporations
to control media production and dissemination in other countries. This, in turn, promotes
American ways of life and social values, leading to American hegemony over other
people’s social, political and ideological lives (Schiller, 1969, 1976). Therefore, free
trade is considered “the mechanism by which a powerful economy penetrates and
dominates a weaker one,” (Schiller, 1969, pp. 8-9) and thus, an instrument for cultural
and media imperialism. It not only harms cultural industries in developing countries, but
also reduces cultural diversity. From this point of view, cultural policy to prevent the
harmful effects of free trade is needed.
The Process of U.S. Dominance
From the political economic perspective, trade dominance by the United States is
not merely the result of competitive advantages or product appeal/quality, but also the
result of complex interactions between political, cultural, and economic forces. For
instance, Schiller (1969, 1976) considered U.S. media dominance the result of a
purposeful and careful plan of the government, who wanted to promote U.S. television
programs and films that disseminate American political, ideological and cultural values
and used the media as a tool for mind-controling people in the other countries.

29
Historically, the rise and dominance of the Hollywood film industry in the 1910s
were due to the partnership between MPEAA, the film industry’s export cartel, and U.S.
government (Segrave, 1997; Ulff-MØller, 2001). In the book Hollywood's film wars with
France: film-trade diplomacy and the emergence of the French film quota policy, Ulff-
MØller (2001) traced the key diplomatic history between France and the U.S. using
government and industry archival documents. The study revealed the wide presence of
diplomatic, economic, political and legal maneuverings during the history of
Hollywood’s foreign expansion. During the process, the State Department, the U.S.
embassy, and the Department of Commerce worked together, providing government
support “at the highest executive level” (Ulff-MØller, 2001). Similarly, Pendakur (1985)
documented diplomatic support of the U.S. government in forcing India’s government to
relax import restrictions. Guback (1969, 1974) also outlined the U.S. government’s legal,
monetary, and financial assistance to the film industry during its international expansions,
from the passage of Webb-Pomerene Export Trade Association Act of 1918,7
Informational Media Guaranty Program of 1948, to Overseas Private Investment
Corporation of 1971. Therefore, the role of the U.S. government in promoting its
businesses can be widely observed.
The Consequence of U.S. Dominance
Scholars also worry about the long-term social-cultural impact of free trade,
globalization, and U.S. media dominance. Cultural products reflect and promote
producers’ culture. Free trade allows transmission of western life styles and value
7 The Webb-Pomerene Export Trade Association Act of 1918 legalized MPEAA export cartels and export collusions which was illegal domestically under Sherman Antitrust Act. This Act is crucial for U.S. overseas success, according to Ulff-MØller (2001) and Guback (1969, 1974).

30
systems, such as western commercialism and consumerism (Schiller, 1969, pp. 8-9).
Therefore, the dominance of western/U.S. cultural product is translated into a new kind of
Western colonialism or imperialism. Global spread of commercialized culture would also
destroy the rich diversity of world cultures (Seo, 2005), alienate local cultures (Biltereyst,
1996), and lead to cultural homogenization or standardization (Crane, 2002).
Foreign cultural penetration also threatens national identity and cultural
sovereignty (Seo, 2005). Lozano (1996) examined the effect of Mexico border youths’
heavy exposure to the U.S. media on their self-perceptions and national identity. The
study found that exposure to U.S. music and films moderately increased the degree of
dissatisfaction of nationality and preference to be U.S. citizens among Mexico border
youth. Since U.S. films were so dominant in Mexico youths’ film consumption, the
influence of foreign values and ideologies could be considerable. The study also implied
that influence would be further increased with rising English language fluency.
The cultural imperialism argument has faced increasing criticism since the early
1990s (Jin, 2004). Prompted by the globally liberalized and commercialized media
systems, media developed in many part of the world, resulting in emerging regional and
national cultural industries, such as the industries in Latin America, India, and Korea
(Thussu, 2007). This seems to challenge the imperialism argument. In addition, the
acknowledgement of audiences’ active role in selecting cultural proximate programming
(Straubhaar, 1991) and interpreting western content (Liebes & Katz, 1990) also
challenges the media effects advocated by cultural imperialism thesis and helps explain
and predict a further flourishing of national/regional productions. Straubhaar (1991)
stated development could happen asymmetrically. UNESCO World Culture Report

31
(UNESCO, 1998) also argued development resulting from media globalization could lead
to greater diversity.
Under the above circumstances, some scholars prefer a multi-level (Straubhaar,
1996), multi-directional (Thussu, 2007) approach in analyzing global media structures
and flows. For instance, Straubhaar (1996) argued development occurred at four different
levels; global, regional, national and sub-national. Although the U.S. still dominated at
the global level, growth at the other three levels could not be neglected. The result of
media globalization would be regionalization rather than cultural homogenization
(Straubhaar, 1996; Straubhaar, Fuentes, Giraud, & Campbell, 2002).
Similarly, Crane (2002) reviewed several cultural globalization models and
suggested the global networking model as a useful tool in evaluating the roles and
importance of regional cultural developments. According to Crane (2002), in the global
networking model, there is no concentrated center. Cultural products flow from multiple
directions, interact, and are mutually influenced. This leads to a “cultural hybridization”
instead of cultural hegemony.
However, does cultural hybridization or regionalization conclude the cultural
imperialism thesis? Many argued not (Iwabuchi, 2007; Schulze, 2003; Thussu, 2007).
Cultural hybridization is the result of two underlying forces: glocalization and local
globalization (the author). Glocalization is a globalization strategy that tailors “cultural
products to local conditions” (Iwabuchi, 2007, p. 70). Investing in local productions,
forming alliances with local partners through joint ventures, and producing using local
cultural resources all help localize products. These practices do not reduce U.S.
dominance, but help increase the dominance, as Iwabuchi (2007) argued.

32
At the same time, the hegemonic culture is increasingly integrated into local
productions due to its increasing influences on non-U.S. media (Thussu, 2007). The
influences are strengthened through consumption of U.S. media products, adoption of
commercial operation and administration systems, financial investments, cross-border
cooperation, as well as national integration into global networks (Iwabuchi, 2007),8 until
gradually the U.S. films become part of national culture (Schulze, 2003). The result is the
production of hybridized version of local products.
For instance, according to Rego & Pastina (2007), Latin American Telenovelas
borrow production formulas from the U.S. programs which talked about universal themes.
Similarly, in Korea, the success of its domestic film industry is mostly explained by its
structural transformation in production, distribution, and exhibition that models that of
Hollywood (Seo, 2005). The result of the transformation is the production of Hollywood-
styled Korean blockbuster films.
The process is self-enforced, driven by commercial interest. The process
sometimes is also planned with the strategy of local globalization. Local globalization
refers to the strategy of adapting local production for global distribution, or reframing
national/local cultures for global consumers (Crane, 2002). The result is the production of
globalized version of local products. In this process, the cultural values in local
productions are often decreased.
Overall, the cultural imperialism process is “multi-faceted” (Sreberny-
Mohammadi, 1997a, p. 51). Direct export of goods, adopting foreign capitals, production
formulas, as well as organizational structures and business operation models all help
8 Iwabuchi (2007) called Sony’s purchase of Columbia Pictures an example of national integration into global networks.

33
institutionalize western commercial systems and commercialism cultural values and
strengthen the influence of dominate cultures (Schiller, 1996; Sreberny-Mohammadi,
1997b). In addition, the export of religious, educational, language, travel and tourism,
media and the transfer of technologies all help “laid the ground for the ready acceptance
and adoption of mediated cultural products which came much, much later” (Sreberny-
Mohammadi, 1997a, p. 51). Iwabuchi (2007) called glocalization and local globalization
a “restructuring” (p. 81) process of media globalization in which the global media market
was decentralized and dispersed, but the western dominance and the uneven transnational
cultural flows were intensified. Therefore, Schiller (1991) said that although the cultural
domination thesis had originally been formulated in the early 1960s, “the
acknowledgement of and the struggle against cultural imperialism are more necessary
than ever” (Schiller, 1991, p. 26).
Concluding Marks on the Two Perspectives
Collins (1993) argues both perspectives on trade in media products have value.
The free market paradigm helps explain industry structure and trade flows (Maswood,
2000), but fails to account for the social and cultural impact of trade on importing
countries. The media imperialism perspective acknowledges the economic and
ideological impact of imported media, but ignores how media imports increase the
diversity of choices available to consumers. A combination of the two perspectives would
be helpful in cultural policy making, since it takes into consideration political, cultural,
and economic forces (Collins, 1993; Maswood, 2000).

34
Should Culture Be Protected?
Based on the above two perspectives, arguments for and against cultural
protectionism are also advanced. The debate focuses on different views of cultural
products and different strategies that should be used to promote cultural development.
The Cultural Protection Rationale
Non-Economic Argument for Protection
Cultural researchers and policy makers argue that trade theories should not be
applied to media products without accounting for their unique properties (UNESCO,
2006). Cultural products shape our view of the world (Hesmondhalgh, 2002). They are
fundamental parts of people’s life in a democratic society (Raboy, Bernier, Sauvageau, &
Atkinson, 1994). The special role of cultural industries suggests a purely economic
analysis may ignore important costs from trade in cultural products.
Preservation of cultural productions concerns national sovereignty and cultural
identity. Culture is unique because it cannot be substituted by culture from another
country (Diversity, 2004). Nations have the sovereignty to adopt policies that guarantee
domestic cultural productions and exclude messages that threaten local cultures (Duarte
& Cavusgil, 1996). This makes traditional theories of comparative advantage and
specialization non-applicable to cultural industries.
Preservation of domestic cultures also concerns the diversity of world cultures (J.
Kim, 2000). Unregulated markets naturally favor production concentration, multinational
conglomerates, and mass-appeal products because they can maximize producers’ profits.
This will ultimately lead to homogenous products, reduced cultural diversities, and fewer

35
choices for consumers (Collins, 1993; Seo, 2005). In this sense, government intervention
may be necessary to promote diverse productions and to increase consumer choices
(Hoskins, McFadyen, & Finn, 1997).
Economic Argument for Protections
According to strategic trade theory, deviation from free trade may be beneficial,
under certain circumstances (Maswood, 2000). The first case is when short-term
protections lead to long-term gains, such as in infant industry protections. Protecting
infant industry becomes important when economies of scale exists (Appleyard, Field, &
Cobb, 2006). Trade protections allow late starters to expand operations until they realize
sufficient economies of scale and become competitive. This argument, however, only
supports short-term protections that would expire once the industry becomes competitive.
It does not support protections for industries that are not true “infants.”
Protections are also needed for industries that rely on protections for survival,
such as the weak, declining, or dying industries (Pugel & Lindert, 2000). For instance,
protections are essential when firms in small countries cannot compete head-to-head with
large companies from larger countries. According to Marvasti & Canterbery (2005), trade
barriers are determined endogenously in responding to growing U.S. exports. As
previously illustrated, strong economies of scale and HME give large countries
incomparable advantages in production and competition. The public goods nature of
media products, and low incremental cost in production and distribution allow
international U.S. sales at a lower-than-cost price, similar to dumping (Hoskins, Mirus, &
Rozeboom, 1989). Producers in small countries, on the other hand, can not recoup
production costs in the domestic market and must rely on additional support for existence.
36
This makes direct competition difficult, if not impossible. U.S. control of distribution
networks makes competition even more difficult. Countries must resort to protections for
survival and development. Therefore, the existence of economies of scale and HME
adjust for protections in the media industry (Bernier, 2003c; Papandrea, 1998).
Strategic trade policies are also justified when some industries have strategic
value, can generate positive externalities, or are critical to national interest (Maswood,
2000; Pugel & Lindert, 2000), such as in the case of cultural industries. Cultural
industries produce national symbols and increase national pride. Cultural and media
consumptions generate external benefits in strengthening national identity, increasing
national pride, making viewers better informed citizens (Hoskins, McFadyen, & Finn,
1997). Therefore, governments have the sovereignty to guarantee domestic cultural
protections. Cultural protections are further justified because of market failure. Because
external benefits are not accounted for in calculating producers’ revenues, producers do
not have incentives to provide products that offer such benefits. Therefore, mere market
mechanisms do not lead to productions that bring the most social welfare. In this case,
government interventions can remedy the market failures in cultural productions.
Therefore, “showing free trade is better than no trade is not the same thing as
showing free trade is better than sophisticated government intervention,” as Krugman
(Krugman, 2000, p. 23) has argued. The economic arguments for protections suggest
trade barriers will help countries develop cultural industries if they lack natural
competitive advantages (Hoskins, McFadyen, & Finn, 1997). The alternative of no
protection means that less developed media industries may not be able to compete with
foreign firms, leading to a loss of domestic cultural production and the associated artistic
37
and cultural benefits (Peltzman, 1976). This may lead to economic and cultural
dependency on foreign media, reducing domestic control over cultural expression and
government policy. Given the increasingly important role of the media in distributing
knowledge, the arguments also suggest that protections will create more chances for
general economic development.9
Counter Argument for Intervention
Criticisms of the Non-Economic Argument
Economists are generally skeptical of the arguments for cultural protections. They
emphasize cross-cultural exchanges and markets with monetary and material incentives
as the best mechanisms for cultural innovation and vitality (Seo, 2005). They also
question the notion of national identity (Noam, 1993) and the role of cultural productions
in reinforcing national identity (Bernier, 2003c). Noam (1993) referred national culture as
the political tool of government to reinforce social norms, group loyalty, and state control.
The notion of national culture ignores the differences among ethnic groups, social classes,
and people of different ages and genders in tastes and preferences. Moreover, the impact
of foreign cultural products on another culture is limited because consumers connect the
foreign message from their own cultural backgrounds, according to the 1990 study of
Katz and Liebes.
For profit and utility maximization purposes, the free market paradigm
emphasizes consumers’ rights as individuals more than the nations’. In this view, the
9 Other common arguments for trade protections include producing tax revenue for governments, production of goods that are invaluable for national defense, improving the balance of trade, improving terms of trade, increasing employment, fostering national pride, and the presence of external benefits (Hoskins, McFadyen, & Finn, 1997).

38
freedom of people to express opinions and make choices without intervention is a more
fundamental human right in democratic societies. Trade protections deprive people of the
right to enjoy diverse cultural products from other countries. Therefore, trade protections
are also criticized as reducing cultural diversities (Collins, 1993; Noam, 1993).
Criticisms of the Economic argument for protections
Infant industry argument. In general, it is difficult to identify the long-term
growth potentials of an industry (Appleyard, Field, & Cobb, 2006). If protection is
granted to an industry that is not a “true infant,” the cost can be extremely high. The
media industries in many countries are not true infants. Furthermore, even if an industry
has the potential to grow, according to Wildman and Siwek (1988), competition will only
help the industry become healthy. Protections may end up being costly and long-lasting,
without actually helping the industry.
Externality argument. The existence of externality is elusive, hard to verify and
to measure (Pugel & Lindert, 2000). It is also difficult to evaluate whether the benefits of
trade protections are worth the cost (Krugman, 2000). Difficulties also lie in identifying
and implementing effective policies (Pugel & Lindert, 2000). In the media industry,
protections are often criticized, leading to productions with no external value (Hoskins,
McFadyen, & Finn, 1997; Wildman & Siwek, 1988).
Strategic theory and the need for protection. According to Noam (1993),
comparisons between the marginal cost of distribution for foreign media products, and
the total cost of production for domestic products, is inappropriate. Foreign and domestic
media are not close substitutes, and therefore do not compete directly with each other.

39
Therefore, the argument for protections due to U.S. competition and domination is not
justified.
Protections are also unnecessary because, based on the product life cycle theory,
the U.S. dominance in media productions will eventually wane and other nations will
catch up. Trade barriers will slow the process by blocking cultural exchanges that are
essential in promoting the development of domestic media industries (I. Pool, 1977).
They also negatively affect domestic cultural industries by reducing the growth of sales,
leaving consumers with fewer choices, and shrinking industry infrastructure and finances
(Collins, 1993; Waterman, 1988, 1993; Wildman & Siwek, 1988; Noam, 1993). In the
absence of trade barriers, however, local and regional media productions will increase,
due to the development of new production technologies (Waterman, 1988, 1993;
Wildman, 1995; Wildman & Siwek, 1993). This has been observed in the emergence of
regional television productions in Latin America (Antola & Rogers, 1984; Straubhaar,
Campbell, & Cahoon, 1994; Straubhaar & Viscasillas, 1991; Waterman, 1988, 1993;
Waterman & Rogers, 1994). Therefore, the dominance of U.S. media products is not a
concern in the long-run. Eventually, cultural production will shift from one center to
multiple centers, and the one-way flow of trade will be replaced with multi-directional
flows (Pool, 1977).
Counter-Protection Rationale
The cost of protections. Economists also evaluate protections based on a
calculation of cost and benefit. According to Pugel and Lindert (2000), the cost of
protections can be very high if measured as percentage of protections. These include the
cost of administering and enforcing protections, the cost of losing incentive for

40
innovations and developing new technologies. Consumer welfare is also reduced by
consuming less variety at higher prices. The cost is especially high if trade restrictions
provoke retaliation and trade war by trade partners, which is harmful to all countries
involved (Pool & Stamos, 1990; Pugel & Lindert, 2000).
Protection of interest group. Protections are also criticized as benefiting special
interest groups. According to the capture theory of regulation (Peltzman, 1976), trade
protections are often designed to benefit special interest groups at the expense of the
national interest. This is because politicians are under pressure from various interest
groups whose support is essential for them to win an election/reelection. Therefore,
politicians are “captured,” and have the tendency to make regulations favorable to the
industries’ interests. In this case, the cost of protections would be high, but the benefit
would be low.
Benefit from Opening Market. On the other hand, the benefit from opening
market is high. According to Oatley (2006), a 2005 study of the World Bank found that
eliminating trade barriers and increasing international trade, since the Second World War,
dramatically decreased the world’s transportation and telecommunications costs, raised
national income and growth rate, and reduced poverty and global inequality in poverty. In
the media industry, commercialization and privatization help improve media
infrastructures, drive consumer demands and financial investments (Waterman, 1988,
1993; Wildman, 1995; Wildman & Siwek, 1993).
Difficulty in protection. Finally, increasing technological and economic
integrations make restricting media import restrictions increasingly impractical. Methods
to protect a specific national culture will not work when consumers can access media

41
using multiple channels and technologies. Further, transaction of media products involves
selling of both physical and intangible products (Duarte & Cavusgil, 1996). In
international trade, a tariff is easy to count when film reels pass the border, but taxing on
Internet movies is difficult. With media content increasingly represented by bits and
bytes through digital technologies, the difficulties of monitoring intangible transactions
rise.
Effectiveness of Protectionism Policies
Argument over cultural protections also includes the debate on the impacts and
effectiveness of protections. Theoretically, welfare implications of protections differ with
different protection instruments. According to the “Specificity Rule,” policy tools that are
closest to the cause of distortions are the most efficient (Pugel & Lindert, 2000).
Trade Protection Instruments and Their Welfare Effects
Historically, both industrialized and developing countries have applied various
trade barriers (TB) to protect their domestic industries. Commonly used methods of trade
interventions include tariff and non-tariff barriers (NTBs).
Tariff
A tariff is a monetary tax imposed on imported goods at the border (Appleyard,
Field, & Cobb, 2006). Generally, a tariff benefits import competitors at the burden of
consumers. Consumers pay higher prices for imported goods due to tariffs but
government gets tax revenues. Tariff barriers have been greatly reduced as a result of
multiple trade negotiations. Current trade negotiations have shifted to NTBs, which are
more complicated, more common in cultural trade, and more concerned by trade partners.

42
NTBs in media industry include quantitative restrictions (QRs), subsidies,
investment and service barriers, government censorship, licensing, monopoly, and taxes
(Acheson, Maule, & Filled, 1989; Hoskins, McFadyen, & Finn, 1997; MPAA, 2006).
Quota
Quota is the most common quantitative restriction method. Import quota sets the
quantity limits allowed for entry into a country, normally by year (Pugel & Lindert, 2000).
Content quota requires a certain percentage of content be of domestic origin. For instance,
audiovisual quota is used in the film (as screen quotas), television, and radio sectors (as
broadcast quotas), which requires a minimum of days or proportions of time devoted to
domestic films/programs, or restrict the days or proportions of time for imported
films/programs (Bernier, 2003b). Screen quota is the oldest form of quantitative
protections and, as noted in Chapter 2, is currently allowed under Article IV of GATT,
although subject for further negations for elimination under GATS.
Quota is considered a more “…damaging form…of government intervention…”
(Bernier, 2003b, p. 8). Economically, quota leaves consumers with products of less
desirable, less variety, or at higher costs (Pool & Stamos, 1990). Government gets no
revenue from quota. The benefit goes to domestic producers (Pugel & Lindert, 2000) or
import licensees (Pool & Stamos, 1990). Productions are not higher with quotas (Pool &
Stamos, 1990). Depending on the methods government used to grant import licenses or
define local productions, quota can be costly, subjective, and not efficient (Pugel &
Lindert, 2000).

43
Subsidy
Subsidy provides direct funding for domestic productions. The funds are normally
from government revenues, industry taxes, or loans, grants, or prizes (Hoskins,
McFadyen, & Finn, 1997). According to Bernier (2003a), subsidy was exempt from MFN
treatment under GATS (Annex on Article II exemptions). Therefore, unless members
make specific commitments, they remain free to subsidize their audiovisual industry. In
practice, most countries have subsidies on audiovisual productions and services.
Subsidies are most visible in western European countries, such as in France and Sweden
(Toepler & Zimmer, 2002). Even for countries that make commitments to open
audiovisual sectors, the majority of them reserve subsidies from the commitments,
including the U.S. (Bernier, 2003a).
In international policies, subsidy is generally preferred to tariff and quota because
the impact of subsidy on imports is smaller compared to tariff and quota (Tomooka,
Kanno, & Kobayashi, 2002). Subsidy also leads to fewer consumer losses because they
influence only producers. According to the “Specificity Rule,” a subsidy directly supports
domestic productions and is a more positive method to promote national industries
(Collins, 1993; Renaud, 1993). However, countries differ in their capacities to subsidize
industries. Developing countries may suffer from limited financial resources to promote
their cultural industries (Bernier, 2003a).
Service Restriction
Service restrictions in trade exist in many countries. According to Marvasti and
Canterbery (2005), service barriers are especially widespread in North America, Western
Europe and South America. Commonly existing service barriers include dubbing

44
restrictions, local printing requirements, distribution restrictions, etc. But they are less
visible and often transparent (Appleyard, Field, & Cobb, 2006). Therefore, the welfare
effects are hard to analyze.
Trade-Related Investment Measure
Investment restrictions consist of various policies that restrict foreign investment
within a country, such as foreign ownership restrictions, performance requirement,10 and
restrictions on remittance. Arguments for investment/ownership restrictions mainly lie in
the belief that enterprises controlled by local investors would more likely generate local
products (Bernier, 2003b). Media industries also play too important a role in democratic
societies to allow for foreign ownership in production. Under GATS, countries that
reserve the audiovisual sector or foreign investment from free market access can exercise
control over foreign investment activities. However, countries that have made
commitments without restrictions, or countries that join the WTO after the signing of
GATS can no longer set up the restrictions concerning market access for foreign
investors (Bernier, 2003b).11 The welfare effects of investment restrictions are also hard
to analyze. Countries need to balance the needs for foreign investment capitals and the
need to protect domestic industries.
In addition to the above methods, government can also establish entry barriers
through various tax policies, licensing requirements, censorship, or controls of import
distribution (Hoskins, McFadyen, & Finn, 1997). They can also control foreign entry
10 Performance requirement mandate foreign investor to export certain percentage of output, or require certain percentage of domestic inputs, according to (Appleyard, Field, & Cobb, 2006) 11 Most developed countries reserve audiovisual industry from market access or reserve investment restrictions on media sector even if commit free market access in the sector, including the U.S. See (Bernier, 2003b) for details.
45
through government procurement provisions,12 administrative classification,13 or through
trading preferences such as regional trading blocs (Pugel & Lindert, 2000). Overall, the
economic analysis on the welfare effects of cultural protectionisms need to be evaluated
based on a combination of factors and on the balance of cost and benefits (Appleyard,
Field, & Cobb, 2006).
Economic Literature on the Impact of Trade Protectionism Policies
Research on the impact of trade restrictions is abundant in economics (Bureau,
Chau, Fare, & Grosskopf, 2003; Chau, Färe, & Grosskopf, 2003; Dardis, 1986; Dardis &
Cooke, 1984; Kalirajan, 2001; Lee & Swagel, 1997; Nwaokoro, 2008; Syropoulos, 1992;
Tyers, 1985; Winkelmann & Winkelmann, 1998). Added to the literature are studies on
the effect of trade liberalization (Boyd, Doroodian, & Abdullatif, 1993; Cramer, Wailes,
& Shui, 1993; Heien & Sims, 2000; Jensen & Tarr, 2008; Mehta, 2000; OECD, 2003;
Santos-Paulino, 2002; Tekle, Kameyama, & Ito, 2008; Zhua, Buongiorno, & Brooks,
2001) and openness (Dardana, 2004; Rattso & Torvik, 1998). These studies span various
agricultural and manufacturing industry sectors.
Mixed results are derived from these studies. For instance, some research found
trade restrictions policies mainly increased the cost for food distribution service,
(Kalirajan, 2001) and consumers (Dardis, 1986; Dardis & Cooke, 1984). Winkelmann &
Winkelmann (1998) also found that quotas negatively affected term-of-trade. Dardana
(2004), however, found fewer trade restrictions lowered the speed of economic growth.
12 Government Procurement Provisions restrict purchase of foreign products by home government agencies and give preferences toward domestic suppliers. 13 Administrative classification refers to tariffs on imported goods differ by type of good, the actual tax charged vary according to classification.

46
Syropoulos (1992) also demonstrated that, in certain circumstances, quotas can increase
competition and welfare.
Research on trade liberalization found tariff liberalization brought little welfare
impact on the lumber trade (Boyd, Doroodian, & Abdullatif, 1993) and the trade of forest
products (Zhua, Buongiorno, & Brooks, 2001). Removing of QRs was found related to
increased imports in India (Mehta, 2000). Relaxation of local content requirement and
foreign investment restrictions, however, were found leading to welfare gains in the oil
and gas industries in Kazakhstan (Jensen & Tarr, 2008). Liberalization of trade was also
found positively related to export performances (Santos-Paulino, 2002).
Therefore, general conclusions are hard to make from existing literature due to the
differences in measurements, circumstances, and focuses of trade policy aspects.
Although, theoretically, free trade will increase total output, improve quality, and lower
prices, the effect may differ by country and by industry. According to Hufbauer &
Warren (1999), opening market generally favors firms with competitive advantage at the
expense of others. Study of Tomooka, et al. (2002) also confirmed that restrictive trade
policies made small countries less well-off, but could be beneficial for large countries
under certain circumstances.
Effectiveness of Protectionisms in the Media Industry
An empirical study of Marvasti (1994) found trade barriers (TB) effective in some
media industries. For instance, the study found quantitative restrictions (QR) increased
net export of books. Subsidies also raised export of books and pre-recorded music.
Another study of Marvasti (2000) found U.S. tariff protections effectively improved the

47
film industry’s trade surplus. However, as TBs were not endogenously determined in the
US, the implications of the result for other countries may be limited.
Francois & Ypersele (2002) indicated trade restrictions in the film industry could
support heterogeneous productions rather than Hollywood-styled productions that
appealed to the mass audiences. However, taking consideration of audience demand and
competitions, the heterogeneous productions may not guarantee a space in the markets.
Therefore, the effect of trade restrictions, or the effectiveness of trade restrictions, in
achieving the stated goals in the film industry is not clear. Marvasti & Canterbery (2005)
argued protections were endogenously determined in the film industry, i.e., the
protections were established due to U.S. large-scale penetration. The protections were
mostly ineffective due to the formidable competitions from the U.S. films, with its huge
production scale, production and marketing cost, and tight control of distribution
networks. Hanson & Xiang (2006), however, examined U.S. motion picture export to 33
Europe countries and found policy trade barriers effectively raised trade cost, and
therefore reduced film imports from U.S.
Therefore, findings from the studies are also inconsistent, varying by industry
sectors and circumstances. Debates on the effectiveness of protectionisms also exist
concerning which policy instrument should be used or is more effective.
Quota
In the audiovisual industry, quotas are mostly criticized as ineffective. First of all,
quotas affect competition only if set higher than the share of domestic products without
protection (Hoskins, McFadyen, & Finn, 1997). Otherwise, quotas will not help domestic
producers such as the failure of French screen quotas, according to Ulff-MØller (2001).

48
Second, administration of the quota policies can be complex and costly. One
difficulty exists in classifying national films. In practice, the nationality of films can be
defined using three methods: by nationality of inputs, cultural identity of content, or by
financial presence (Chiang, 2007). The first method defines a product by the nationality
of its key personnel. This method can hardly ensure product contains national content or
external cultural values, as is the case in Canada (Acheson & Maule, 1990, 1992;
Acheson, Maule, & Filled, 1989). Increasing international co-production arrangements
make the nationality of products even harder to define. The second method defines
nationalities of products by content. This leads to content analyses of the products, which
are more subjective, less transparent, and more easily being used as a censorship tool
(Chiang, 2007). The last method determines nationalities of products by financial
presence. This mostly favors U.S. products, since U.S. capitals are presented worldwide.
Third, the impact of quotas depends on their implementation and enforcement.
Theater owners or broadcasters worry more about profits than product externalities.
Without strict monitoring mechanisms, they tend to choose imported films that attract
more viewers and have higher profit potentials. They also tend to show domestic
programs with low cultural values, or at non-peak hours. Therefore, loose enforcement
will allow them to sidestep the quota requirements. This is the case in Korea when screen
quotas were not effectively enforced before 1994, according to Lee, Kim and Kim (2008).
This is also the case in EU when the “where practicable” clause makes the broadcasting
quota requirement ineffective in practice (Middleton, 2003). 14 In many countries, it is
14 The European Television without Frontier Directive (“Directive”) requires members to reserve, “where practicable,” 60 percent of prime time for European programming. The “where practicable” clause is considered as a loophole which makes enforcement of the quotas optional in practice.

49
also hard to impose sanctions because domestic productions are not sufficient to meet
audience needs (Segrave, 1997).
Fourth, whether quotas help increase the value and quality of local productions is
not clear. Critics argue that quotas often lead to production of quota-quickies (low-quality,
low-cost films) with low cultural and external values (Hoskins, McFadyen, & Finn, 1997;
Wildman & Siwek, 1988). Archeson et al. (Acheson & Maule, 1990, 1992; Acheson, et
al., 1989) argued the costly Canadian content rules failed to bring in quality domestic
productions. A similar case occurred with film quotas in Europe in the 1920s, according
to the above authors. Further, the restricted audiences for foreign programs do not
necessarily transfer to domestic programs (Crane, 2002), because “even a single film may
have the ability to saturate the market” (Ulff-MØller, 2001, p. 138). Theater owners can
make extended use of limited titles, thus making import quotas not effective (Segrave,
1997).
Finally, quota enforcements become increasingly impractical with multiple
distribution technologies (Hoskins, McFadyen, & Finn, 1997). Quotas are more effective
when audiences have fewer choices (Acheson & Maule, 1992). New ways of distributing
and consuming media contents give viewers more power of control and selection, and
thus limit the effect of quotas (Middleton, 2003).
Instead, quotas are criticized for restricting domestic media development by
cutting financial support for media infrastructure (Wildman & Siwek, 1988). Long-term
use of quotas creates a downward development cycle within an industry and reduces
domestic productions (Waterman, 1993). Quotas are also blamed for decreasing

50
consumption diversity (Cowen, 1998) and leading to the rise of piracy (Wildman and
Siwek, 1988).
Empirically, the effectiveness of quota is not clear. General trade restrictions
seem lead to less program diversity. For instance, Richardson (2006), using a two-station
model, found quotas led to less diversity in radio stations programming. Similarly, on a
two-country analysis, Rauch & Trindade (2006) found restrictions in trade resulted in
products that imitated goods of dominant cultures, and therefore reduced product
diversity in the long-run. According to Seo (2005), the successful Korean films did not
lead to culturally diverse products, but led to Korean films that modeled after Hollywood
blockbusters.
Several studies found television quotas failed to increase domestic productions
(Peltier, 1999) or decrease imports from the U.S. (Dupagne & Waterman, 1998). For
example, Dupagne & Waterman (1998) examined 17 Western European countries and
found no link between the existence of television program quotas and television fiction
imports from the U.S. Peltier (1999) found French television quotas ineffective in
increasing production and consumption of French and European television programs.
Mixed results were found for radio quotas in the same study.
Two studies on the radio industry found quotas highly related to local productions.
For instance, Mason (2003) found the Australian radio quota has increased local
productions since 1942. On the other hand, liberalizing quota policy in New Zealand
reduced local music productions from 1996 to 2001.15
15 Also refer to Bernier (2003c) for the study of Peltier (1999) and Mason (2003).

51
Among the few studies on the impact of regulatory factors on the film industry,
Lee & Bae (2004) examined 20 sample countries and found screen quotas not related to
the domestic film’s SSR. S. Y. Lee, et al. (2008) found the effectively enforced screen
quota could not explain Korean films’ improved performance in the box office. Therefore,
the limited studies seem to indicate that screen quotas are not effective in protecting or
promoting domestic media industries.
Subsidy
As previously stated, according to the “Specificity Rule,” the policy tools that are
close to the source of distortions are usually considered more efficient (Pugel & Lindert,
2000). Many scholars (Collins, 1993; Noam, 1993; Rauch & Trindade, 2006; Renaud,
1993) favor subsidy as a more positive and direct method to spur productions. Renaud
(1993) also argued that quotas would only be efficient when accompanied by subsidies.
In practice, however, the effect of subsidies depends. The criteria for granting
subsidies are crucial. As with quotas, subsidies may not guarantee the production of
programs with quality and external benefits if awarded based on national origin.
Standards such as producers’ records or artistic merit also potentially discourage
competition, innovation, and reduce diversity (Cowen, 1998). The efficiency of subsides
also depends on government efficiencies in delivering the subsidies. Political corruption
and bureaucratic inefficiency can harm the mechanism (Crane, 2002). With increasing
Hollywood co-productions, subsidies may also end up benefiting foreign investors
(Cowen, 1998; Hoskins, McFadyen, & Finn, 1997).
Subsidies are also criticized for reducing producers’ motivation to work
efficiently (Crane, 2002). Subsidized films sometimes do not ensure exhibition

52
opportunities and box office success. One empirical study (Bagella & Becchetti, 1999)
examined the box office performance of Italian films produced between 1985 and 1996.
The study found subsidized films had a significantly lower number of admissions than
non-subsidized films.
Problems also exist with other protection methods. For instance, tax incentives do
not guarantee the production of programs with external benefits. Entry barriers and
licensing conditions do not stimulate productions (Hoskins, McFadyen, & Finn, 1997).
Investment/ownership restrictions also do not necessarily lead to productions with
national cultural value and external benefit.
Effects of Changing Policies
Despite the above empirical findings, several cases prove interesting. The first
case is Korea. Korea is one of the few countries that has successfully resisted Hollywood
dominance over the past decades (Jin, 2008). Many contribute Korea’s film success to
government support and the use of screen quotas (Bernier, 2003b; Thussu, 2007b),
although existing empirical tests (Lee & Bae, 2004; Lee, Kim, & Kim, 2008) fail to
establish the link between screen quotas, domestic film’s market share, and box office
performances, as indicated earlier. Others argue that Korea’s success is due to the free
market economy (Seo, 2005) and the open-up policy (Y. Kim, 2007) that allows complete
transformation of the industry, or to a combination of open market and protective trade
policies (H. Lee, 2008). Whatever the cause(s), the cut of screen quotas by half in 2007
seems related to a falling market share for Korean films a year later (Jin, 2008).
Similarly, liberal cultural policies seem harmful for several other countries,
including Mexico, New Zealand, and Canada. For instance, as mentioned in the previous

53
chapter, Mexico repealed screen quotas in 1994 in accordance with Mexico-U.S. BIT and
the following NAFTA. Even with screen quotas reintroduced in 1997 (drop from 50
percent to 10 percent), the policy change proved destructive for Mexican film industry
(Jin, 2008; Lee & Bae, 2004).16
Canada is another victim of NAFTA. Under the context of wider economic
integration within North America, the film market is quite open to foreign investments,
causing the theatrical exhibition business to actually be controlled by U.S. capital (Martin,
1996). In 2002, Canadian domestic films had a market share of 1.4 percent due to
Hollywood’s massive penetration (Oh, 2001).
During the Uruguay Round of trade negotiations, New Zealand committed to not
use QRs in its audiovisual sectors (Bernier, 2003c). This resulted in a great reduction in
market share for domestic broadcasting content, even with subsidies. New Zealand
attempted to reintroduce broadcasting quotas in 2001, but was unable to do so under the
WTO agreement.
Empirically, Huhmann & Saqib (2007) reported the result of ending protective
policies for Canadian magazines since 1999 when the government decided to open the
advertising market under pressure from the WTO and the U.S. The study found leading
domestic competitors lost market share, not to leading importers, but to the thriving
smaller magazines targeting niche audiences. This seemed to indicate an increase of
product diversity with easing of protections. However, it is not clear whether domestic
industries, large or small, can sustain the long-term competition from foreign imports.
Summary of Current Literature 16 Its annual production dropped from 100 in 1992 to 3 in 1998, and 14 in 2003, according to Jin (2008) and B.K. Lee (2004).

54
Overall, empirical studies on the impact and effectiveness of protectionism are
limited, especially on the theatrical film industry. Further, results from the studies are
inconsistent. Based on a small number of sample countries, these studies mostly do not
incorporate the time variance (Disdier, Tai, Fontagne, & Mayer, 2007). Existing studies
mostly concentrate in European countries (Dupagne & Waterman, 1998; Hanson &
Xiang, 2006; Lee & Bae, 2004; Oh, 2001) and on U.S. exports (Dupagne & Waterman,
1998; Hanson & Xiang, 2006). The small sample sizes (17 in Dupagne & Waterman,
1998; 20 in Lee & Bae, 2004, and 33 in Hanson & Xiang, 2006) violate the sample to
variable ratios of 15:1 normally recommended for regression analyses (Stevens, 1992),
which limits the reliability and generalizability of the studies.
The effects of trade protections also depend on how the protections are designed
and implemented. Studies using dummy variables as trade barrier indicators (Dupagne &
Waterman, 1998; Lee & Bae, 2004) did not take into consideration particular policy
specifications and implementations. This may also limit the explaining power of the
existing research.
Studies such as that of Lee and Bae (2004) were mainly concerned with how
cultural protections increase a country's domestic media production. The effects of
protections on a country's participation in international trade, and how barriers affect the
diversity of domestic media consumptions remain unexplored.
Chapter Summary
Review of existing literature indicated that market force and free trade will benefit
cultural productions with economy scale and scope. This would put countries without

55
competitive advantages in danger of their own productions. In this sense, trade
protections were desirable to protect cultural expressions and national cultural identities.
However, economists who advocate the free market paradigm normally wanted to
apply pure economic theories and free trade models to media trade. These scholars
emphasize the negative impact of trade protective methods in limiting the development of
media industries. However, media products produce symbolic meaning and cultural
values far beyond pure economic analysis and market standards. That means that cultural
policies have wider concerns that are beyond the economic analysis.
Despite the debates on cultural protectionism, the welfare implications of various
trade protection methods are not clear. Empirically, studies on the impact and
effectiveness of protectionism are extremely limited, especially on the theatrical film
industry. They are based on small sample countries, use methodologies that do not
consider the specification of trade protection techniques, and provide inconsistent results.
These studies also do not incorporate the time variance, and therefore cannot answer
whether trade protections are less effective over time. In addition, evaluation of the
impact of trade protections should also be multi-dimensional. Therefore, further study
exploring the function of cultural protections would have both practical and political
implications.
Based on the current literature, this study aimed to further explore the effect and
effectiveness of trade protection techniques. A detailed research questions and
methodology for carrying the research are reported in the next chapter.

56
CHAPTER 3 METHODOLOGY
Overview
A review of existing literature on the effect of trade protectionism was used to
inform the researcher of the research design for the current study. Based on previous
research, this study investigated the effect and effectiveness of various trade protection
technologies. The following chapter provides detailed research design, including research
questions, hypotheses, and methodologies used to conduct the research.
Research Questions
This study examines the impact of various trade protective policies on the
development and competitive status of national film industries. Questions based on
criticisms of trade barriers are:
RQ1: How do policy trade barriers affect the performance of a country's domestic
film industry?
Since the possible effect of trade barriers on a country's domestic film industry
may fall into several aspects, including both its effect on domestic film productions and
national and international competitiveness, the research question was further divided into
several subset questions:
RQ1a: Do trade barriers improve a country’s domestic film production volume?
RQ1b: Do trade barriers improve domestic film’s market share?
RQ1c: Does the use of trade barriers affect domestic film exports?

57
The second research question examines the possible link between trade barriers
and the operation and investment scale of national film industries:
RQ2: How do trade barriers affect film industry’s operation scale and financial
input?
RQ2a: Do trade barriers reduce the operation scale of domestic film industries?
RQ2b: Do trade barriers reduce countries’ investment on domestic film
production?
The third research question explores the possible effect of trade barriers on
audiences’ film consumption in a country. It asked:
RQ3: How do trade barriers affect a country's film consumption?
The research question was subdivided into three questions:
RQ3a: Does the use of trade barriers affect the overall volume of films that
audiences consume?
RQ3b: Does the use of trade barriers affect the variety of films supplied in the
market?
RQ3c: Are there any relationships between the use of trade barriers and a
country's motion picture piracy activities?
The fourth question examines the effects of different protective policy instruments
and asked:
RQ4: Do various trade protection techniques vary in their effects on the
development of national film industry? Which protection method(s) is (are) more
effective?
The final research question addresses the criticism that trade barriers are not

58
effective and are obsolete in the new technological environment. It mainly asked:
RQ5: Does the effectiveness of trade barriers in protecting domestic film
industries decrease with the development of multiple film distribution technologies?
Answers to these questions will shed light on the current debates over cultural
protectionism and trade liberalization under the changing media environment. The studies
also tried, hopefully, to offer constructive input for nations who are forming strategic
action plans relating to cultural development.
Hypotheses
Output performance
Hypothesis 1 examines the effects of trade barriers on the output performance of a
country’s film industry. Researchers (Collins, 1993; Noam, 1993; Waterman, 1993;
Wildman & Siwek, 1988; 1993) have expressed doubts that quotas would increase
domestic television productions and sales, arguing restricting television imports limits
financing for domestic television infrastructure. These arguments can be applied to films.
Wildman and Siwek (1988) argued that trade restrictions cause a “downward spiral” (p.
124) in film and television productions, revenues, and employment. Empirical studies
found that quotas did not increase the market share of domestic television productions
(Dupagne & Waterman, 1988) and market performances of films (Lee & Bae, 2004; Lee,
Kim, & Kim, 2008). Subsidies were also found not helpful in spurring domestic film
admissions in France (Bagella & Becchetti, 1999). Hypotheses 1a and 1b state:
H1a: The use of trade barriers is negatively related to a country’s domestic film
production volume.
H1b: The use of trade barriers is negatively related to the market share of a
59
country’s domestic films.
Trade restrictions may increase a country’s negotiation powers over international
transactions. However, these restrictions can also lead trade partners to take retaliation
measures, which will hurt both parties involved. One consequence of such retaliation
would be a reduction in export income (Appleyard, Field, & Cobb, 2006). Although
several previous empirical studies have directly (Marvasti 1994, 2000), or indirectly
(Hanson & Xiang, 2006), examined the relationship between trade protection and trade
surplus, 17 the impact of a country’s trade barriers on its film export, however, is not
tested. Hypothesis 1c tests the relationship between trade barriers and a country’s export
performance in films, which is not examined in previous literature:
H1c: The use of trade barriers is negatively related to a country’s film export.
Operation Scale
Trade barriers are criticized for reducing the financial input in film productions
and reducing the overall scale of operation of a country’s film industry (Wildman &
Siwek, 1988). Hypothesis 2 examines the relationship between trade barriers and their
links with a country’s film operating and financing scale.
H2a: The use of trade barriers is negatively related to the operation scale of a
country’s film industry.
H2b: The use of trade barriers is negatively related to a country’s financial input
in films.
17 An empirical study of Marvasti (1994) found TB effectively promoted exports for books and recorded music industry. The U.S. tariff protection was also found effectively improving the industry’s trade surplus (Marvasti, 2000). Hanson & Xiang (2006) tested the effects of trade barriers on resisting U.S. film export and found policy barriers from European countries helped reducing U.S. film export revenues.

60
Consumption
Hypothesis 3 explores the possible impact of trade barriers on film consumption.
Scholars (Collins, 1993; Wildman and Siwek, 1988) argue that trade protections hinder
cultural diversity and deprive people of the right to enjoy diverse cultural products.
Renaud (1993), however, argues that competition does not necessarily improve consumer
choices because unregulated markets tend to be dominated by a few companies producing
homogeneous programs. Moreau and Peltier (2004) found that countries with strong
public support for domestic film industry had higher diversity in film production and
consumption. Hypothesis 3a looks at the relationship between trade barriers and the
quantity and variety of programs audiences can enjoy.
H3a: The use of trade barriers is negatively related to the quantity of films people
consume in a country.
H3b: The use of trade barriers is negatively related to the variety of films people
consume in a country.
Wildman and Siwek (1988) argued that trade restrictions, especially quantitative
restrictions, in motion pictures and television programs restricted audience consumption
and led to high video piracy activities. Study of McCalman (2005) however, showed that
piracy enhanced the diffusion speed of new movies, and therefore indicated a link
between piracy and satisfied audience demand. Therefore, the links among trade
restrictions, consumption satisfaction, and piracy are not clear. The above two hypotheses
on consumption volume and variety may shed some light on audience satisfaction, the
actual measure of audience satisfaction and worldwide comparison is not currently

61
available. For that reason, hypothesis 3c tests only the relationship between protection
policies and piracy activities, and it states:
H3c: The use of trade barriers is positively related to piracy of films in a country.
Effectiveness of Different Protective Policies
The fourth question compares the effects of various protective policy instruments.
As previously illustrated, researchers (Collins, 1993; Noam, 1993; Rauch & Trindade,
2006; Renaud, 1993) mostly support subsidy as a more positive and effective approach
than quota in promoting film productions. Some (Syropoulos, 1992) consider subsidy
plus quota as a combined method more effective than quota alone. Empirical studies
comparing the effectiveness of different policy methods, however, do not currently exist.
The research question of this study is explorative in nature. Therefore, no hypotheses are
made.
Effect over Time
The development of new distribution technologies multiply the ways that media
content is distributed. Media consumption is more readily available using techniques such
as the Internet and satellite. Under this context, the effectiveness of using traditional trade
barriers to restrict media distribution and media access may seem impractical and
ineffective (Waterman, 1993). The final hypothesis tests the effectiveness of trade
barriers over time.
H4: The effectiveness of trade barriers in improving domestic productions
decreases with the development of new distribution technologies.

62
Defining Variables
The study examines impacts of policy trade barriers. It identified several trade
protectionism measures currently applied in motion pictures industries and investigated
the impacts of these measures on the development of the motion picture industry. The
unit of analysis is individual nations engaged in international trade. The independent
variables are the regulatory trade barriers being utilized across nations. The study also
involved various dependent and control variables. Details on these variables and data
sources were discussed as follows.
Independent variables
TB Indices
Previous studies (Dupagne & Waterman, 1998; Lee & Bae, 2004) used dummy
variables to indicate whether trade barriers exist in a certain country. The dummy-
variable-method simplified the analysis process, but excluded both the quantitative and
qualitative information of trade barriers. The current study included both the quantity and
quality information of trade barriers for each country. This allows for a measure that not
only reveals the existence of trade barriers, but also the degree of protections trade
barriers grant. Marvasti & Canterbery (2005) constructed trade barrier indices for 33
countries in the early 1990s. The current research followed the same method as used by
Marvasti & Canterbery in the above-mentioned study. It created two trade barrier indices,
TBN and TBI, for each country as indicators of the regulatory trade barriers. TBN is the
numerical index that shows the number of trade barriers to U.S. film exports in each
country. TBI is a qualitative index that specifies the degree of protections from U.S.

63
export through the trade barriers. The lower the number of the TB indices is in a country,
the more open is its film market.
Information on TB in various countries concerning the film industry was gathered
from the annual report of Motion Picture Association of America (MPAA). The report
contains descriptions of various trade restrictions on U.S. filmed entertainment industry
existing in various countries. The MPAA reports from 2004-2007, are the most recent
reports that are available for the study.
Method for Calculating TB Scores
Content analysis was conducted in order to calculate the trade barrier (TB) scores.
MPAA reports contain both quantitative and qualitative information on trade barriers
(TBs). Sorting through the information, however, can be very complex and time-
consuming, since the reports are mainly descriptive in nature. Data needs to be extracted
by careful reading of the text in each section of the reports. The reports also cover a wide
range of TBs, for which the details change from year to year. For instance, the screen
quota in Brazil was 28 days per year, per screen before 2003. The quota changed to 35
days in 2003 and an average of 63 days in 2004, but varying by the number of screens in
theater or theater complex (1-5 screens, 47.6 days; 6-7 screens, 63 days, 8-11 screens,
48.3 days). This makes quantification and qualification of the regulation tricky and risky.
Judgments on the qualitative nature of the information for each country are especially
difficult and run the risk of being subjective. Final evaluations were made based on
careful reading of the details of regulations. A scale was used to determine the degree of
the restriction. In most cases, several rounds of reading and scaling were conducted until

64
final agreements were reached. In cases where decisions were hard to make, the
researcher had several other readers to read the text and compromised their evaluations.
The MPAA reports group the regulatory trade barriers from various countries into
10 categories: import policies, standards-testing-labeling-certification, government
procurement, export subsidies, lack of intellectual property protections, service barriers,
investment barriers, anticompetitive practices, electronic commerce, and other barriers.
Detailed descriptions on these categories can be found in Figure 3-1.
1. Import Policies (e.g., tariffs and other import charges, quantitative restrictions, import licensing, customs barriers). 2. Standards, Testing, Labeling and Certification (including unnecessarily restrictive application of sanitary and phytosanitary standards, refusal to accept U.S. manufacturers’ self-certification of conformance to foreign product standards, and environmental restrictions). 3. Government Procurement (e.g., “buy national” policies and closed bidding). 4. Export Subsidies (e.g., export financing on preferential terms and agricultural export subsidies that displace U.S. exports in third country markets). 5. Lack of Intellectual Property Protection (e.g., inadequate patent, copyright and trademark regimes). 6. Services Barriers (e.g., limits on the range of financial services offered by foreign financial institutions, regulation of international data flows, restrictions on the use of data processing, quotas on imports of foreign films, and barriers to the provision of services by professionals such as lawyers, doctors, accountants, engineers, nurses, etc.). 7. Investment Barriers (e.g., limitations on foreign equity participation and on access to foreign government-funded R&D consortia, local content, technology transfer and export performance requirements, and restrictions on repatriation of earnings, capital, fees and royalties). 8. Anticompetitive Practices (with trade effects tolerated by foreign governments including anti-competitive activities of both state-owned and private firms that apply to services or to goods and that restrict the sale of U.S. products to any firm, not just to foreign firms, that perpetuate the practices). 9. Electronic Commerce (e.g., tariff and non-tariff measures, burdensome and discriminatory regulations and standards, and discriminatory taxation). 10. Other Barriers (i.e., barriers that encompass more than one category listed above, e.g. bribery and corruption, or that affect a single sector).
Figure 3-1: Trade Barrier Categories Reported by MPAA
Source: MPAA (2006). Trade barriers to exports of U.S filmed entertainment. Report to the United States Trade Representative. Washington, D.C.: Motion Picture Association.

65
This division of categories is, however, not clear-cut and mutually exclusive.
Information on a particular TB is not necessarily constrained within a specific category. It
can be found under several different categories, or sometimes spread across the text of
the report. Further, information under one particular TB category also contains
information for other TB categories. For instance, information on quotas can normally be
found under the “import policy-quantitative restrictions” category, but under the “Service
Barrier” category, one can also find lots of information on quotas. Similarly, taxation
information can be found under “Import Policies”, as well as “Other Barriers” and
“Service Barriers.” In other words, there is not a clear-cut division of information
categories. All the information is intertwined and needs to be sorted out through careful
readings. Determination on the nature of the information requires several rounds of
reading, comparison and judgment.
Marvasti (2005) calculated TBI and TBN scores based on six trade barrier
categories: tariffs, quantitative restrictions, lack of property rights, video levy, subsidies,
and service barriers. Based on reading of the MPAA reports, the author selected six of the
most widely utilized and most concerned TB categories as the focus for this study. They
are tariffs, quotas, investment/ownership restrictions, service barriers, tax/levies, and
subsidies. Information on these TBs was used as basis for calculating TB indices scores.
Specifically, tariffs include both tariff and other import charges or custom duties.
It can be a fixed money value which does not vary with the price of the good. Or it can be
an ad valorem tariff which is set as a percentage of the value of the imported good. In the
film industry, the value of film imports can be estimated based on the actual value of the
reel of film that crosses country borders. It can also be valued based on estimations of the

66
films’ potential royalties in importing countries. Since U.S. films normally generate high
royalties abroad, tariff based on potential royalties always charges a higher money
amount and, therefore, is scored higher in the current study. This tariff stipulation also is
challenged more by the MPAA members than other tariff methods.
Quotas take account of all quantitative restriction methods used in countries
included in this study. These include screen quotas, broadcast quotas, cable/pay television
quotas, import quotas, home video quotas, distribution quotas, production quotas, and
hiring quotas. Qualitative scores of quotas were determined by reading the specifications
of quota requirements and finding out their degree of restrictiveness. The scores also took
consideration of the combination of different quota policies in each country, i.e., if a
country has a mixture of different quota varieties, it is considered more restrictive than
others who have only one quota policy.
Investment/ownership restrictions refer to the limitations set by the hosting
countries on foreign capital participations in the filmed entertainment industry. These
limitations can be investment restrictions or/and foreign acquisition restrictions. They are
set for one or more of the following areas of businesses: theaters, film production and
distribution networks, broadcasting, and pay television business. In calculating the TBI
scores, the study considered both the degree of the limitations and spectrum of the
limitations these restrictions cover.
Service barriers refer to a wide range of barriers that industry professionals
encounter when providing film entertainment services within a foreign country. These
restrictions on service provisions cover areas from release window arrangements,
distribution and retailing limitation, to earning repatriation and remittance requirements.
67
Imported films are also subject to dubbing and local printing requirements, as well as
government censorship in some countries. To protect domestic industries, many countries
set out certain blackout periods for imported films. In addition, film rental terms,
investment requirements, and export performance requirements are examples of other
barriers service providers can come across in hosting countries.
Tax/Levies refer to various national taxation policies concerning the filmed
entertainment industry. Governments collect taxes from the film industry in a variety of
forms. Among them, entertainment tax on box office and cinema, income tax, tax on
television and video, value-added tax, and discriminatory tax are very common. Levies,
another form of tax, can also be imposed on advertising, blank video tape, video, or
appear as stamp/sticker requirement under different classification/laboring standards.
Qualitative evaluation of taxation policies is based upon the complexity of the taxation
policy in each country, as well as the scope and rate of taxation specified in these taxation
policies.
Finally, governments provide direct financial support to domestic film industries
in the form of subsidies. In many countries, subsidies come from government taxation
and levies. Although in most countries, subsidies come in various forms, the study only
concerns those listed in the MPAA reports as barriers for U.S. film exports.
As indicated previously, the study created two TB indices: a numerical index,
TBN, and a qualitative index, TBI. TBN was calculated based on the numerical count of
trade barriers existing in importing countries under each TB category, with 1 indicating
existence of TB for that category and 0 indicating non-existence. The final TBN score

68
was the added-up for the six TB categories included in the study. Therefore, the possible
range of scores for TBN is from 0 to 6.
The qualitative index, TBI, was created based on examinations of the TB
regulation, evaluations of the degree of complexity of the regulation, and estimations of
its implementation and degree of protections the TB can offer. Each TB category was
scored using a scale of 1-5. Therefore, if a country has highly protective TB in all of the
six categories, it can score as high as 30 for the TBI. The lowest possible value for TBI
would be 0, if no TB exists in the country. For the purpose of this study, a law that exists
but not implemented was considered as non-exist. 18 In the same sense, proposed law,
draft law, and laws under consideration were also not included in the calculation.
Dependent Variables
Output Variables
The first research question explores the relationship between regulatory factors
and output performance of national film industries. The output performance can be
measured both quantitatively and qualitatively. The quantitative measure of the output
performance was represented by the number of feature films produced annually in each
country. The data on annual national film productions was from Screen Digest, 2001-
2008.
18 This include the followings: Colombia: screen quota, passed in 2003, not implemented Brazil: video quota law passed in 1994, but never been implemented Indonesia: import quota of 160 (never implemented), Screen Quota (listed as not effective) Korean: screen quota, effectively enforced since 2000. In 2007, the quota was reduced by half to 73 days: extreme significant opening of quota restrictions Romania: broadcast quota was, before June 02, 40 percent, after June 02, quota of “a majority proportion” of EU works from the day Romania accedes to the EU

69
Numerical production numbers reveal only part of the story of national films.
They tell little about how those films perform in the market. Some productions may not
even be publicly shown. Or even if they are, their share of audiences may be very low.
Studies of Hanson & Xiang (2006) showed U.S. film dominance was led by only a small
number of high-budget films. Ulff-MØller (2001) also pointed out that “even a single film
may have the ability to saturate the market” (p. 138). To remedy this, the study also used a
qualitative method to show the competitiveness of national films in the market. Previous studies
(Lee & Bae, 2004; Oh, 2001) used the self-sufficiency ratio (SSR) as an index of the
strength of a country’s domestic film industry. SSR measures the proportion of the total
box office revenues that goes to domestic films. It indicates the competitiveness of
domestic films in terms of market share. The current study adopted the same
measurement as used in the above studies. Information on domestic film market share
was obtained from Screen Digest, 2001-2008.
In addition to competing with imported films in domestic market, national films
also compete on a global level when they are exported. Export performance of a
country’s national films reflects its global competitiveness when trading abroad.
Revenues from export are also important in supporting domestic film industries’
continued growth. The study used export revenues as indicators of export performances.
Data on film exports for each country was gathered from the International Trade Centre
(2000-2007) (http://www.intracen.org/) and UN Comtrade database (2000,2006, 2007
data) (http://comtrade.un.org/). The two databases report trade in motion pictures in the
value of cinematographic film exposed or developed, under Standard Industrial Trade
Classification (SITC) code 883 and commodity code HS 3706.

70
The data has several shortcomings, according to Hanson & Xiang (2006). First of
all, trade in motion pictures is measured as exchanges of merchandise. The value of trade
is counted by the physical prints of films that are shipped across borders. The potential
revenues films get in importing markets are not considered. Second, film trade through
other channels and trade in motion picture services are also excluded. Nurse, et al. (2006)
point out that cultural products have several “transaction networks” and multiple income
flows. These include revenues from the sale of both visible products (film prints, video
tapes, etc.) and invisible products such as services and intellectual property rights (as
royalties, license fees, etc.). Sales in services and IP rights are increasingly important in
motion picture trade. Furthermore, transaction of motion picture products and services
through digital networks are increasingly common. These transactions are not recorded
through the border. Therefore, actual value of motion picture trade would be greater than
the data provided from the above databases. However, these are the only official data on
motion picture trade that are available at the time of the study.
Operation Scale
The second research question examines the possible link between trade barriers
and domestic film industries’ operation scale. The operation scale of a country’s film
industry was measured by four variables: the total number of screens, total revenues from
theaters, the investment in film productions, and domestic movie spending. While the
screen numbers a country has reflects the actual operation size of the film market, the box
office revenues, domestic movie spending, and product investment measures the realized
value of the market. Oh (2001) used the box office revenues as the actual market size for
the film industry and found it a strong predictor of SSR. The result was confirmed by a

71
later study of Lee and Bae (2004). Lee and Bae (2004) further distinguished box office
revenues as potential film market size with direct production investment as realized
market size and found the latter also a significant predictor of SSR. The study of S. Y.
Lee, et al. (2008) confirmed increased production budget as a significant contributor to
Korea films’ box office success. Therefore, if there is a link between policy barriers,
production variables (domestic production and market share), and operation scales, the
links between TB and productions may function through TB’s effect on operation scales.
In other words, operation variables may function as intermediate variables between TB
and production variables. Data on film screens, box office revenues, and production
investment were from Screen Digest 2002-2008 issues.
Besides, the home market effect model implies domestic movie spending as a key
factor in maintaining a viable film industry and for the development of domestic film
infrastructure. For instance, Dupagne & Waterman (1998) found broadcast television
economic infrastructure (BTEI, or the available economic resources that go to television
broadcasters) are important in lowering U.S. program share in importing countries.
Therefore, the study also included consumer theatrical spending as an indicator of the
operation scale, which may have implications also for the production variables. Data on
average annual cinema spending per head of population was gathered from Screen Digest
2002-2008 issues. Total consumer spending was calculated according to the population
size of that country for each year.
In addition, increasing production budgets has proved to be an effective
competition and differentiation strategy. Film industries operating on a large scale have
the capability to compete using high-budget films. Therefore, how much financial input

72
was invested in film production also reflected the operation scale of a country’s film
industry. The scale of financing was measured by total investment in film productions.
All data on operation scales was gathered from The Screen Digest 2003-2008 issues.
Consumption
The third research question asks the impact of trade barriers on a country’s film
consumption. The film consumption was operationalized by three variables: audience
admissions, consumption diversity, and piracy rate in motion pictures. Audience
admissions reflect the audience size for particular films. They indicate the degree that
audience demand for certain films and the number of audiences that actually purchase
tickets and consume the films. The study used annual admissions as an indicator of the
audience size for theatrical films. The data was gathered from Screen Digest 2002 to
2004 issues.
Having access to a variety of choices directly relates to audience satisfaction in
film consumption and indicates a higher consumption quality. Moreau and Peltier (2004)
measured diversity of films in both genre and geographical origins. The study adopted the
second measurement and measured consumption diversity in terms of diverse sources for
a country’s film imports. The source diversity for import films was measured using
Herfindahl–Hirschman Index (HHI). HHI is widely used in measuring the
concentration ratio of a market. It is the sum of the squares of the market shares of
the largest firms in a market. Fu (2006) measured the concentration ratio of import
sources by considering the share of imports from different countries. The study
adopted the same measurement. Source of import was identified by the imported
film’s country of origin. The UNESCO Statistical Yearbook lists the total number of

73
long film imports, as well as imports from nine major countries, the U.S., Italy,
France, UK, India, Russia, Germany, Japan, HK, and others, and thus was used as the
major data source for this study. The share of imports from each country source was
calculated as a basis for calculating the HHI. The most recent data from UNESCO is
from 1995 to 1999. Since the import share for each country is relatively stable over
the year, the study used the most recent available year (1999) as an indicator of
consumption diversity for the sample countries, supplemented with earlier data if
the 1999 data was not available.
Having access to films through regular and normal channels is another
indicator of film consumption qualities. If normal channels fail to satisfy audience
demands, consumers might seek such satisfactions through piracy. The study
examines the link between piracy and trade restrictions. The level of video piracy
activities was measured by the piracy rate in each country. The data was from the U.S.
Trade Representative (USTR), IIPA, and MPAA reports. USTR identifies countries that
do not have sufficient protections of IPR or deny market access to the U.S. and reported
the piracy rates in various copyright-based industries for these countries in their annual
“Special 301” report. Those data are compiled and submitted by corresponding industries
within the International Intellectual Property Alliance (IIPA), a collusion of seven major
copyright industry associations. MPAA is responsible for submitting the video piracy rate.
Particularly, video piracy rate for year 2003-2004 was obtained from MPAA reports.
Data for the rest of the years for motion picture piracy rate are from the 2002-2004 and

74
the 2007 report that IIPA submitted to USTR for inclusion in the “Special 301” report.19
In this study, video piracy includes piracy of optical discs, videocassettes, and laser discs.
Effectiveness of Different Protective Policies
The fourth question asks the effects of different protective policies. Answers to
the question were based on the result of the previous three questions, using each of the
six TB categories (tariff, quotas, investment/ownership restrictions, service barriers,
tax/levies, and subsidies) as independent variables.
Effects over time
The final research question asks the effectiveness of trade barriers across time.
This was tested using time as a control variable in the regression analysis using the above
dependent and independent variables.
Control Variables
The impact of trade barriers must be evaluated within a broader social economic
context. Besides the cultural environment and national tradition, the development of the
motion picture industry was largely determined by the social economic structure of a
country. Therefore, the study also included several control variables.
Market Size Variables
The HME model indicates a link between a country’s market size and its
productions and exports. As illustrated in Chapter 2, the importance of market size as a
determinant of the pattern of trade and production is widely tested. In the film industry, 19 In 2006, MPAA changed its methodology in calculating the video piracy rate by including Internet piracy activities. This results in the inconsistence in the reported piracy rate with previous year, according to IIPA (2007).

75
countries with more developed economies and higher income have more capabilities to
finance their film productions. Wealthier countries also have larger market sizes that
attract more investments in film productions (Wildman & Siwek, 1988). Therefore,
Wildman and Siwek (1988) argued both quantity and quality of motion pictures improve
directly with a country’s market size. A study of Marvasti (2000) confirmed the
significance of the HME in the film industry due to strong economies of scale. Two
market size indicators are commonly used in existing research: GDP and population.
GDP is an important determinant in both film productions and trade. For instance,
Schulze (1999) found a higher GDP led to more arts trade and higher art trade ratio.
Empirical studies in the film industry (Oh, 2001; Lea & Bea, 2004) found domestically
produced movies account for larger shares of total box office revenues in countries with
higher levels of GDP. Hanson & Xiang (2006) confirmed that in European countries,
smaller GDP are related to increased U.S. dominance in films.
Population is another indicator of domestic market size. Marvasti (1994) found
countries with greater populations exported more films. A later study of U.S. trade in
motion pictures from 1961-1988 (Marvasti, 2000) found trade surplus was directly
enhanced by population size.
As previously indicated, researchers (Oh, 2001, Lee & Bea, 2004, S. Y. Lee, et al.,
2008) have distinguished potential market size (GDP, population) with realized market
size (operation scale). GDP and population are general market size indicators that reflect
the potential size of a market for the film industry to grow. Consumer spending and box
office revenues are the realized value of a market. Film production investment is the
actual financial input in film productions. These variables are all direct indicators of a
76
country’s actual film market size. The potential market size has a direct effect on film
production, operation, and export, and must be taken consideration when examining TBs’
effect on the actual operation of film market. Data on GDP and population were gathered
from the International Monetary Fund (IMF). The GDP data was adjusted by actual
purchasing power of a country.
Market Structure
Economic Freedom. Wildman and Siwek (1993) argued commercialization and
privatization helped increase financial investment in media infrastructure, and thus
enhanced media development. This created less need for trade protections. Following the
same rationale, countries with highly commercialized and privatized film industries are
expected to have more developed film industries. The study introduced the Economic
Freedom of the World Index (the EFW Index) as one control variable indicating the level
of commercialization and privatization. The EFW index measures the degree to which
government and regulations support the freedom of economic activities. A free market
will allow more room for the industry to grow. The data was gathered from Fraser Institute
2008 Report on Economic Freedom of the World.
Trade Relations. Disdier, Tai, Fontagne, and Mayer (2007) showed a link between
art trade and total trade. Quite possibly, the volume of film export is affected by the
overall trade relations a country has with other nations. Countries with more open
markets are expected to have more trade relations with other countries. More open
economies also allow more flows of international investment. Schulze (1999) found the
degree of openness not significant in determining art trade. The significance of openness
in film trade is not clear. The study used the Openness Index (OI) as one control variable

77
for the trade and production functions. OI is widely used in economic literature (eg.,
Kotcherlakota & Sack-Rittenhouse, 2000; Nourzad & Powell, 2003). It refers to the
degree an economy opens to trade and is normally calculated as the ratio of a country’s
trade (IM+EP) to GDP. The study used the same methods. It calculated the OI as total
trade volume/GDP. The total volume of export and import included trade in both
commodities and services and were from WTO.
International co-production treaties allow for international collaborations in the
production of media programs (Hoskins et al, 1997). Co-production is increasingly used
as an effective way not only to accumulate investment and other resources, but also to
overcome language and other cultural barriers and provide access to the partners’ markets
(Hoskins et al, 1997). Co-production also motivates partners to invest more in promotion
and distribution, which, as researchers indicate, play more important roles in global
markets than product attractiveness (Guback & Varis, 1986; Hoskins et al 1997;
Straubhaar, 1991). A previous study (Ren, 2006a) found co-production positively related
to a country’s film export into the European Union markets. The current study used a
country’s level of participation in co-productions as a control variable that has influence
on film productions and export. This is measured by the co-production ratios for each
country in the study. Co-production ratio was calculated by dividing total annual
production numbers by the number of co-productions. Data on co-productions was from
Screen Digest issues.
Regulatory Variables
The effect of TB depends on the effectiveness of implementation. The study
measured regulatory efficiency using the Government Effectiveness (GE) index. The GE

78
index is among one of the six dimensions of Kaufmann’s worldwide governance
indicators (WGI). It reflects the quality and efficiency of government regulation and
implementation. The index has been widely used by researchers (e.g., Andrés, 2006;
Shadlen, Schrank, & Kurtz, 2005). The study followed the same measurement and used
the GE index as a control variable to indirectly indicate the degree of enforcement of
trade barriers. The data is from Kaufmann, Kraay, & Mastruzzi (2008).
Culture Variables
Language and culture affect audience preferences and define the natural market
for media products (Hoskins & Mirus, 1988; Wildman & Siwek, 1988). They also
determine the scale and competitiveness of a country’s film industry. The existence of
cultural proximity (Antola & Rogers, 1984; Burch, 2002; Kim, 2004; Leung, 2004; Sora,
2004; Straubhaar, 1991; Straubhaar & Viscasillas, 1991; Straubhaar, Glorria, & Winter,
1991; Trepte, 2003; Yu & Lee, 2002) and cultural discount (Lee & Bae, 2004; F. Lee,
2006, 2008) in media consumption has been widely tested and supported empirically.
Culture’s role in determining trade volume and directions (Hester, 1973) has also been
well examined in international trade literature using such cultural distance proxies as
common language, religion, ethnicity (Boisso & Ferrantino, 1997; Frankel, Stein, & Wei,
1997), history similarities (Eichengreen & Irwin, 1998), immigration history (Hutchinson
& Dunlevy, 2001; Tadesse & White, 2008a, 2008b), geographical distance (Kogut &
Singh, 1988), and linguistic distance (Chiswick & Miller, 2005; Hutchinson, 2002;
Hutchinson, 2005). It is generally agreed that cultural dissimilarities between nations has
significant and consistent negative economic impact on trade flows (Tadesse & White,
2008b). Strong cultural ties lower trade cost and increase consumer taste similarities.

79
Culture’s impact is stronger for trade in differentiated goods (Felbermayr & Toubal, 2007)
such as cultural products (Disdier, et al., 2007; Tadesse & White, 2008a). This is
supported by the study of U.S. motion picture services (Hanson & Xiang, 2006) and the
study on international trade in art (Schulze, 1999).
Among the measurements of cultural distance, Hofstede’s cultural dimensions are
widely used in empirical studies. Hofstede et al. (Hofstede, 1980; Hofstede & Bond, 1988)
developed four dimensions (individualism, power distance, masculinity, and uncertainty
avoidance) of measuring national cultural differences.20 The dimensions were developed
based on attitude surveys of IBM employees around 1968 and 1972 for over 50 nations
(Evans & Mavondo, 2006). Hofstede’s dimensions are based on an organizational setting
and focus mainly on work-related values. Many researchers have questioned the
representativeness of the findings in reflecting the core aspect of cultures, as well as the
generalizability of the study. Despite these arguments, however, Hofstede’s dimensions
are widely used in broad areas representing national cultural values and proved highly
valid in different settings. They are also found highly stable over time (Evans &
Mavondo, 2006). Based on Hofstede’s framework, Kogut and Singh (1988) constructed a
composite cultural distance index.21 The composite index also becomes widely used in
20 Power Distance Index (PDI): the extent to which the less powerful members of organizations and institutions accept and expect that power is distributed unequally. Individualism (IDV): the degree to which individuals are integrated into groups. Masculinity (MAS) versus Femininity: assertiveness and competitiveness versus modesty and caring. Uncertainty Avoidance Index (UAI) deals with a society's tolerance for uncertainty and ambiguity. It indicates to what extent a culture programs its members to feel either uncomfortable or comfortable in unstructured situations Long-Term Orientation (LTO) versus short-term orientation: thrift and perseverance versus respect for tradition, fulfilling social obligations, and protecting one's 'face'. From http://www.geert-hofstede.com/, Full description and critique of Hofstede’s cultural dimension and later CD index also see (Evans & Mavondo, 2006).
21 The index is written as where CDj is the cultural differences of the jth country from the United States, Iij represents the index of the ith cultural dimension and the jth country, u stands for

80
subsequent empirical researches. For instance, Lea & Bea (2004), using the composite
CD index, found cultural variables not significant in determining a country’s domestic
market share. A study of Oh (2001) found cultural difference to the U.S. in power
distance affected a country’s domestic market share. Ren’s study (2007) found cultural
distance in individualism affected a country’s film export into the European Union
market.
Researchers also developed alternative measures of cultural distance. For instance,
Hoskins & Mirus (1988) measured CD by the price differences of programs sold abroad.
Tadesse & White (2008a, 2008b) calculated CD based on the World Values Surveys
(WVS) and the European Values Surveys (EVS). The surveys covered wide variety of
topics including politics, economics, religion, science/technologies, as well as family
values, gender roles, and ethnical concerns.22 The authors found cultural differences
reduced both cultural and non-cultural exports with cultural exports reduced at a greater
degree.
The current study used cultural distance as a control variable for film productions
and trade functions. It utilized both methods of calculating CD, the composite cultural
distance score as developed by Kogut & Singh (1988), as well as the CD scores
developed by Tadesse & White (2008a, 2008b).
Language is another culture factor that is broadly used in economic and media
research. Studies found common language raised cultural exchanges in books,
newspapers (Disdier, et al., 2007), and art products (Schulze, 1999). English language also
the United States and Vi is the variance of the index of the ith dimension, see Kogut and Singh (1988) and (Evans & Mavondo, 2006) for details. 22 For details of the surveys and calculations of CD see (Inglehart et al. 2004) and (Tadesse & White, 2008b).

81
showed to be positively related to film exports in general (Marvasti, 1994), U.S. film exports
(Hanson & Xiang, 2006; Marvasti & Canterbery, 2005), and television fiction exports
(Dupagne & Waterman, 1998) in particular. Other studies, (Lee & Bae, 2004; Oh, 2001)
however, found that the English language did not significantly relate to the SSR of a
county’s films. Measurement differences of language may in part cause the inconsistent
findings. Many studies use dummy variables indicating whether countries share a
common language, (Schulze, 1999) or whether English is the primary language for a
country (Lee & Bae, 2004; Marvasti, 1994; Oh, 2001). Dupagne and Waterman (1998)
used the survey data on English Fluency in European countries that measured the
percentage of people who reported to be fluent in English. Chiswick & Miller (2005)
develops a quantitative measure of linguistic distance between English and non-English
languages based on DOS Index that measures the difficulty Americans have learning
foreign languages.23 The Index was used by Hanson & Xiang (2006) in their study that
found language distance reduced U.S. movie exports. This study used the Language
Index developed by Chiswick and Miller to see whether measurement differences would
result in differences in findings. The Language Index reflects the distance between
English and other languages. The data was from Chiswick and Miller (2005).
Variables That Affect Piracy Rate
Studies on factors affecting piracy are abundant (Andrés, 2006; Banerjee, Khalid,
& Sturm, 2005; Chiou, Huang, & Lee, 2005; Ki, Chang, & Khang, 2006). Previous
23 The DOS Index is based on test scores of the Department of State employees in the earl 1990s. The employees took 24-weeks training before sent to foreign countries. Chiswick & Miller (2005) calculate language distance between English and 43 other languages using the average score of test takers. See Hanson & Xiang (2006) for details.

82
studies normally identify income (Banerjee, et al., 2005; Husted, 2000; Moores, 2003;
Shin, Gopal, Sanders, & Whinston, 2004), education (Shadlen, et al., 2005), age (Al-
Rafee & Cronan, 2006; Kwong, Yau, Lee, Sin, & Tse, 2003), IP protection (Banerjee, et
al., 2005; Chiou, et al., 2005; Peace, Galletta, & Thong, 2003), and cultural dimension of
individualism (Husted, 2000; Marron & Steel, 2000; Moores, 2003; Shin, et al., 2004)
related to piracy rate. Ren (2007) studied the determinants of motion picture piracy rates
across 57 countries and found income, education, strength of IP protection, and culture all
significant factors. Among them, income and culture as measured by power distance
played the most significant roles. These variables were also used in the function for
examining the effects of TB on piracy. The MPAA reports contain descriptive
information on IP regulations and enforcement. The information, however, is hard to
quantify. The study assessed the effectiveness of IP protections using the IP protection
index, a category of the Economic Freedom Index from the Fraser Institute as a control
variable for piracy activities. Age was measured by the median age of populations and
the data was from CIA World Factbook, 01-08. Education was measured using adult
literacy rate (the literacy rate of adults years 15 and over). The data was from United
Nations Development Program Human Development Report 2007/2008.
Because the ticket price also affect people’s willingness to pay for films, another
variable that reflects the price of ticket was also added to the piracy function--the cinema
index. It measures the time taken to earn money for a cinema ticket. The data was
obtained from Screen Digest.

83
Model Functions and Statistic Techniques
The study examined the impact of TBs on national film development across
country sectors and spanning various years. Because the research involved multiple
independent variables, dependent variables, and controlled variables, multiple regression
techniques were used as the main study analysis method. In addition, due to the cross-
sectional and cross-time nature of the study, different regression techniques were utilized
in order to investigate the change of the effect of TBs over time. Preliminary regression
was used mainly to investigate the TB effect across-sectional without considering the
time effect. In addition to preliminary regressions, time-series regressions were run to
investigate the changes of the TB variables’ effectiveness over time.
Chapter Summary
The study identified six trade barrier variables widely used in the motion picture
industry in various countries and investigated the effects of these trade barriers on the
development of national film industry. This included the question of the effectiveness of
protective trade policies in obtaining the stated goals. The study also addressed the
question concerning the effectiveness of different protective policies and changes of their
effects over time. To better answer the composite impact of trade barriers on film
industries, the study also created two composite indices, TBI and TBN, as indicators of
the quality and quantity aspects of trade protections.
To help answer the impact on national film industry, the study developed ten film
development measurements as indicators for the development of national film industry in
three aspects, the output level, operation level, and the consumption level. These include
film production, market share, film export, total film screens, annual box office revenues,

84
film production investment, annual consumer spending and admission, diversity of film
consumption, and level of film piracy. All of these indicators have special implications
for the development of film industries.
Because film industries operate in a complicated social environment, the study
also used several economic, market, regulation, and culture variables as control variables.
All of the variables were defined based on previous literature.
The study was primarily empirical. It examined the effect of trade barriers using a
larger number of countries to satisfy the case-to-variable ratio recommended for
regression analyses. In addition, the study included time variance to see how the effect of
trade protective measures changed over time. As a result, the study used both preliminary
regression method and time-series regression analysis. Time-series regression analysis
incorporates both cross-sectional and cross-time examinations. It provides a tool for
analyzing the effect of trade policies across time. Through the combination of both the
sectional and time variances, the study was able to explore whether the trade protective
policies were becoming obsolete in the current media environment or should trade
barriers continue to be used to protect media industries in the future. Results from the
analyses were detailed in the next chapter.

85
CHAPTER 4 RESULTS
Overview
Using multivariate regression techniques as major research tools, the study
investigated the use of six trade protection technologies and their impacts on ten national
film development measurements. It incorporated both cross-sectional and cross-time
variations to explore how trade protective measures functioned and changed over time.
In this chapter, the findings were organized mainly according to the results of the
regression analyses on the ten film performance indicators. Implications of these results
were also discussed.
Descriptive Statistics
The study used the MPAA report to obtain Trade barriers information. In 2007,
MPAA decided to focus on countries that were most concerning, especially in the areas
of electronic commerce and piracy. Countries with no dramatic changes in regulatory
policies over the years were excluded. This resulted in a great reduction in the number of
countries included in MPAA reports. As a result, only 30 countries were included in the
2007 report. So far, the MPAA 2006 report is the most comprehensive report among all
available reports and was therefore used as the basis for collecting sample countries. As a
result, 78 countries were included in the study. These countries were reported on for the
years 2004-2006.
86
Although detailed MPAA reports were available only for the years between 2004
and 2007, these reports actually provided information that can be traced back to several
years before. For instance, major policy changes concerning trade barriers information
before and after 2000 can be found in the MPAA 2004 reports. Therefore, the content
analysis of the MPAAA 04-07 reports yielded descriptive information of trade barriers
for each country from 2000 to 2007. As a result, the study employed data for 78 countries
that spanned an eight year period between 2000 and 2007. As a supplement, The USTR
National Trade Estimate Report on Foreign Trade Barriers was also used as an
alternative source for trade barrier information for the years 2000-2002. The USTR report
includes information submitted by MPAA concerning motion picture industry, although
in a much brief way.
As a result, the study yielded 624 observations from 78 countries over the time
span between 2000 and 2007. A list of the countries and their major parameters were
shown in the Appendix.
Table 4-1 shows the descriptive statistics of the major variables. As the table
shows, for the sampled 624 observations, the TB variables range from 0 to 5, with 0
indicating the largest openness in film trade, and 5 indicating the least openness in that
category. The numerical TB Index (TBN) shows a range of 0 to 6, with 6 indicating the
existence of all six studied trade barrier categories within one country, and 0 indicating
none of the six studied trade barrier categories existed in a country. The average of
quantitative trade barriers is 1.3. The TBI index shows the degree of trade restrictions in a
country. According to table 4-1, the value of the TBI index ranges from 0 to 17 in the

87
sampled countries, with lower numbers indicating less restriction in film trade and large
numbers indicating more trade restrictions in the film industry. The average TBI is 2.9.
For the output variables, the annual production of films for the sampled countries
range from 0 to 1200 a year, with an average of 60.3 films per year. The market share
varies from 0.3 percent to 94.1 percent and the average market share among the 78
countries is 16.6 percent. For the sampled countries, every million people owns about 1.2
to 477 screens, with an average screen per million of 43.5. The total revenue coming
from the box office ranges from 0.01 to 1950.2 million dollars for the countries. The
average box office revenue is 235.6 million dollars. Revenue that comes from exporting
films ranges from zero to 329, 370.7 thousand dollars per year, with an average of 7741.2
thousand dollars for the 78 countries. The total amount of money invested in films per
year ranges from zero to 2108.1 million dollars for the countries. The average investment
in films is 152.1 million dollars. According to the spending per head of population, and
admission her head of population numbers in Table 4-1, average people spend about 0.09
to 52.51 dollars a year in films and goes to the theater to watch films about 0.08 to 5.62
times a year. The average spending and admission is 10.9 dollars and 1.6 times,
respectively, per year.
As to the major control variables, the gross domestic product based on
purchasing-power-parity (PPP) valuation of country’s GDP is from 3.9 billion dollars to
4668.8 billion dollars, with an average of 353.6 billion dollars. The countries have an
average population of 60.3 million, ranging from 0.283 million people as the smallest
number to 1321.1 million people as the largest number.

88
Table 4-1: Descriptive Statistics
N Minimum Maximum Mean Std.
Deviation Tariff 624 0.00 5.00 0.31 0.93 Quota 624 0.00 5.00 0.61 1.19 Investment Restriction 624 0.00 5.00 0.57 1.24 Service 624 0.00 5.00 0.61 1.20 Taxation 624 0.00 5.00 0.56 1.17 Subsidy 624 0.00 5.00 0.24 0.80 TBI 624 0.00 17.00 2.90 3.84 TBN 623 0.00 6.00 1.27 1.37 Production 466 0.00 1200.00 60.31 142.07 Share (percent) 271 0.30 94.10 16.56 16.64 Export (in thousands) 555 0.00 329370.70 7741.68 34887.12 Screen per million 477 1.20 177.00 43.50 34.30 BO revenue (million) 451 0.01 1950.20 235.62 379.26 Invest (in million) 403 0.00 2108.10 152.08 345.85 Spending per head 349 0.09 52.51 10.91 10.05 Admission per head 460 0.08 5.62 1.61 1.29 HHI 360 2523.48 10000.00 5526.91 1719.14 Piracy 338 1.00 100.00 49.77 28.29 GDP (in billions) 624 3.85 4668.79 353.65 695.79 Population (millions) 624 0.28 1321.05 60.31 190.86 EFW Index 498 3.99 8.94 6.90 0.83 The Openess Index 542 0.00 6231.90 46.65 309.45 Co-production 309 0.00 1.00 0.34 0.26 Government 624 -1.10 2.41 0.61 0.90 Hcd 480 0.02 6.60 2.52 1.42 Language Score 584 1.00 5.00 2.35 0.96 Tcd 440 0.25 2.23 1.24 0.49 Valid N (listwise) 0
Data was transformed using square root transformation and log transformation in
order to better meet the normal distribution requirement for using multivariate statistic
techniques. Linearity and homoscadasity were also tested using Q-Q plot and scatterplots.
Correlation Analyses
Table 4-2 lists the correlations between the TB variables, control variables and
independent variables. The correlations were examined as follows.

89
Dependent Variables
Output variables
An examination of correlations found significant correlations between all major
TB variables and output variables. For instance, all TB variables showed significant
positive correlations with the film production. Among them, quota, investment
restrictions, and subsidy showed slightly higher correlations (all over 30 percent) with
film production than tariff, service restriction, and taxation (all over 25 percent). The
compose TB indices showed even higher positive relations with film production level
(TBI 52.3 percent, TBN 53.1 percent).
All of the TB variables also showed significant positive correlations with
domestic market share (TBI 46.1 percent, TBN 42.2 percent). Among the six TB
variables, quota showed the highest correlation with local film’s market share (63.1
percent). Tariff and investment restrictions also showed moderate positive correlations
with market share (30.4 percent and 30.7 percent, respectively). Both of the TB indices
showed higher correlations with market share than that of individual trade barrier variable,
46.1 percent for TBI and 42.2 percent for TBN.
As to the export variable, except for tariff and taxation, all other TB variables
showed significant positive correlations with film export. Among the four TB variables
that showed significant positive correlations with film export, quota and subsidy, again,
showed higher correlations with export (29.9 percent, and 25.8 percent, respectively) than
investment restriction (15.5 percent) and service restriction (17.4 percent). As to the
composite TB indices, they, again, showed higher positive relations with film export than
individual trade barriers, a pattern similar with the above two observations.

90
All in all, the correlations between trade barriers and output performance
variables were significantly positive. However, because the direction of impacts cannot
be identified in the correlations, the possible effects of TB variables on the output
performance variables would be discussed later, based on regression results.
Operation Scale
The operation scale reflects the market size for the film industry. It was measured
by using screen numbers as the actual market size, and box office revenue as the realized
market value. In addition, two other variables were used as indicators of financial input to
support the market operations--the total investment on films and consumer annual film
spending.
According to the correlation data in Table 4-2, except for quota and subsidy,
which showed no significant correlations with film screens, all other TB variables
showed significant negative correlations with the total number of film screens. Among
the TB variables that showed significant negative correlations with film screens,
investment restrictions and tariff showed the highest correlations (-37.1 percent, and -
36.5 percent, respectively), followed by taxation (-2.1 percent) and service restrictions (-
14.4 percent). The correlations of investment restrictions and tariff with screens were
even higher than that of the composite TB variables (TBI -32.6 percentt, and TBN -31.8
percent).
Except for tariff, all other TB variables showed significant positive relations with
box office revenue. Among them, service restrictions showed the highest correlation with
box office revenues (37.1 percent), followed by quota (39.6 percent), subsidy (29.2
percent), investment restrictions (20.9 percent), and taxation (13.0 percent). The

91
composite TB indices had even higher positive correlations with box office revenues
(TBI 42.6 percent, and TBN 42.5 percent).
With the total film investment, tariff, investment restrictions, and service
restrictions showed no significant relations. All other TB variables showed significant
positive correlations. Among them, subsidy showed higher positive relations with
investment (30.0 percent) than others, followed by quota (22.3 percent), TBI (20.6
percent), TBN (20.3 percent), and taxation (12.9 percent).
Although TB variables didn’t show negative correlations with the realized market
value (box office and total investment), all of the TB variables showed negative
correlations with audience spending, and except for service restrictions and subsidy, all of
the correlations were significant. Among them, tariff showed the highest negative
correlation (-37.9 percent), followed by investment restrictions (-36.0 percent), TBN (-
32.4 percent), TBI (-32.9 percent), taxation (-21.0 percent), and quota (-15.8 percent).
Consumption
Similar with the correlations with audience spending, all TB variables also
showed negative relations with audience admission, and except for service restriction,
taxation, and subsidy, all of the rest of the correlations were significant. Among them,
investment restrictions showed the highest correlations (-26.5 percent), followed by TBN
(23.6 percent), tariff (-22.0 percent), TBI (-20.7 percent), and quota (-12.8 percent).
HHI was used as an indicator of film diversity in a market. Most of the trade
barrier variables were positively correlated with HHI. As shown in Table 4-2, HHI was
significantly correlated to tariff (27.6 percent), investment restrictions (19.4 percent),
taxation (17.8 percent), and TBI (13.8 percent). Only service restrictions showed a

92
negative correlation with film diversity (-11.1 percent). Quota, subsidy, as well as TBI
and TBN showed no significant correlations with film import diversity.
Subsidy showed a significant negative correlation (-10.7 percent) with piracy.
Quotas also showed a negative correlation with piracy, but the correlation was not
significant. Other than these two variables, all other TB variables showed significant
positive correlations with piracy. Specifically, tariff showed the highest positive
correlation with film piracy (30.4 percent), followed by investment restrictions (25.9
percent), TBI (19.7 percent), TBN (17.9 percent), service restrictions (17.1 percent), and
taxation (14.1 percent).
Controlled Variables
Market Size Variables
All TB variables showed significant positive correlations with GDP and
population. The correlations were even stronger for the composite TB indices. As shown
in Table 4-2, the correlation between TBI and population was 71.5 percent, followed by
that of TBN (68.5 percent). And the correlation between TBN with GDP was 55.0
percent, followed by that of TBI (54.2 percent).
As to individual trade barrier categories, more developed countries showed higher
correlations with increased service restriction (39.0 percent), quota (36.9 percent),
subsidy (31.9 percent), investment restrictions (30.8 percent), and taxation (22.8 percent).
Tariff showed the least positive correlation with GDP among the six TB variables.
There were also strong correlations between most individual TBs and population
including investment restrictions (56.5 percent), service restrictions (45.6 percent), quota
(43.2 percent), tariff (41.0 percent), taxation (35.7 percent), and subsidy (24.8 percent).
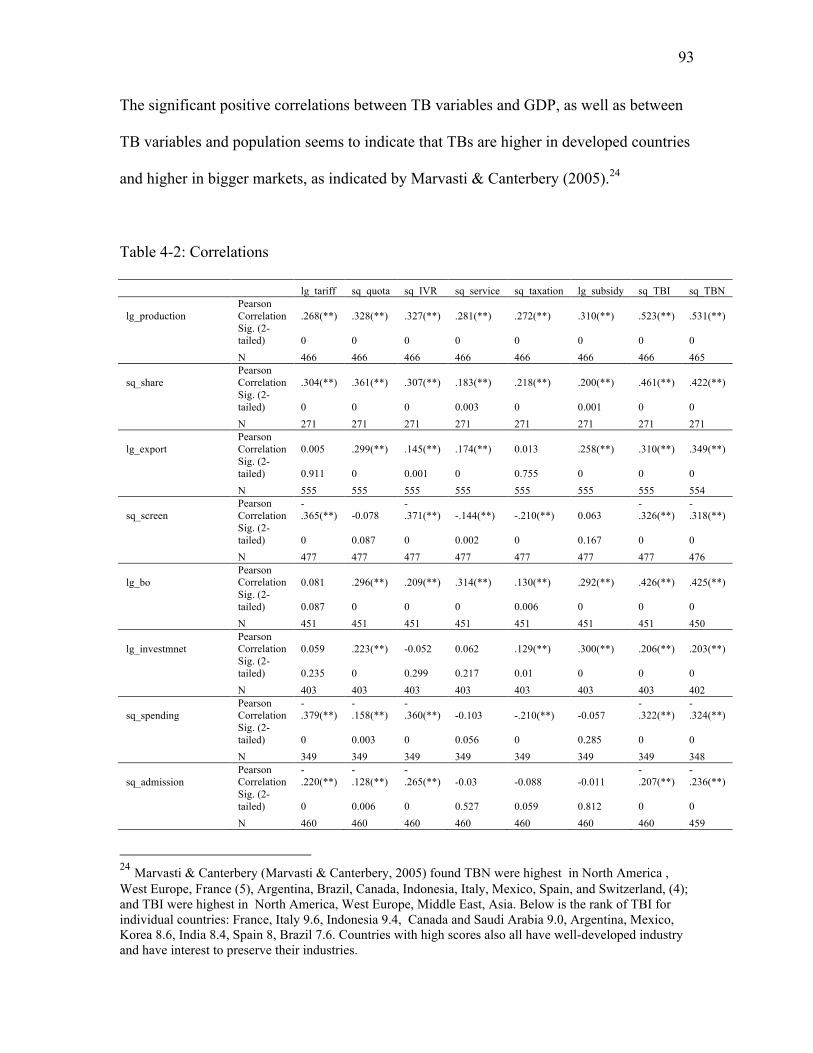
93
The significant positive correlations between TB variables and GDP, as well as between
TB variables and population seems to indicate that TBs are higher in developed countries
and higher in bigger markets, as indicated by Marvasti & Canterbery (2005).24
Table 4-2: Correlations
lg_tariff sq_quota sq_IVR sq_service sq_taxation lg_subsidy sq_TBI sq_TBN
lg_production Pearson Correlation .268(**) .328(**) .327(**) .281(**) .272(**) .310(**) .523(**) .531(**)
Sig. (2-tailed) 0 0 0 0 0 0 0 0
N 466 466 466 466 466 466 466 465
sq_share Pearson Correlation .304(**) .361(**) .307(**) .183(**) .218(**) .200(**) .461(**) .422(**)
Sig. (2-tailed) 0 0 0 0.003 0 0.001 0 0
N 271 271 271 271 271 271 271 271
lg_export Pearson Correlation 0.005 .299(**) .145(**) .174(**) 0.013 .258(**) .310(**) .349(**)
Sig. (2-tailed) 0.911 0 0.001 0 0.755 0 0 0
N 555 555 555 555 555 555 555 554
sq_screen Pearson Correlation
-.365(**) -0.078
-.371(**) -.144(**) -.210(**) 0.063
-.326(**)
-.318(**)
Sig. (2-tailed) 0 0.087 0 0.002 0 0.167 0 0
N 477 477 477 477 477 477 477 476
lg_bo Pearson Correlation 0.081 .296(**) .209(**) .314(**) .130(**) .292(**) .426(**) .425(**)
Sig. (2-tailed) 0.087 0 0 0 0.006 0 0 0
N 451 451 451 451 451 451 451 450
lg_investmnet Pearson Correlation 0.059 .223(**) -0.052 0.062 .129(**) .300(**) .206(**) .203(**)
Sig. (2-tailed) 0.235 0 0.299 0.217 0.01 0 0 0
N 403 403 403 403 403 403 403 402
sq_spending Pearson Correlation
-.379(**)
-.158(**)
-.360(**) -0.103 -.210(**) -0.057
-.322(**)
-.324(**)
Sig. (2-tailed) 0 0.003 0 0.056 0 0.285 0 0
N 349 349 349 349 349 349 349 348
sq_admission Pearson Correlation
-.220(**)
-.128(**)
-.265(**) -0.03 -0.088 -0.011
-.207(**)
-.236(**)
Sig. (2-tailed) 0 0.006 0 0.527 0.059 0.812 0 0
N 460 460 460 460 460 460 460 459
24 Marvasti & Canterbery (Marvasti & Canterbery, 2005) found TBN were highest in North America , West Europe, France (5), Argentina, Brazil, Canada, Indonesia, Italy, Mexico, Spain, and Switzerland, (4); and TBI were highest in North America, West Europe, Middle East, Asia. Below is the rank of TBI for individual countries: France, Italy 9.6, Indonesia 9.4, Canada and Saudi Arabia 9.0, Argentina, Mexico, Korea 8.6, India 8.4, Spain 8, Brazil 7.6. Countries with high scores also all have well-developed industry and have interest to preserve their industries.

94
HHI Pearson Correlation .276(**) 0.051 .194(**) -.111(*) .178(**) -0.095 .138(**) 0.101
Sig. (2-tailed) 0 0.338 0 0.035 0.001 0.072 0.009 0.056
N 360 360 360 360 360 360 360 359
sq_piracy Pearson Correlation .304(**) -0.055 .259(**) .171(**) .141(**) -.107(*) .197(**) .179(**)
Sig. (2-tailed) 0 0.309 0 0.002 0.01 0.049 0 0.001
N 338 338 338 338 338 338 338 338
lg_gdp Pearson Correlation .120(**) .369(**) .308(**) .390(**) .228(**) .319(**) .542(**) .550(**)
Sig. (2-tailed) 0.003 0 0 0 0 0 0 0
N 624 624 624 624 624 624 624 623
lg_populationulation Pearson Correlation .410(**) .432(**) .565(**) .456(**) .357(**) .248(**) .715(**) .685(**)
Sig. (2-tailed) 0 0 0 0 0 0 0 0
N 624 624 624 624 624 624 624 623
EFWidx Pearson Correlation
-.303(**)
-.185(**)
-.219(**) -.154(**) -.175(**) -0.07
-.323(**)
-.324(**)
Sig. (2-tailed) 0 0 0 0.001 0 0.12 0 0
N 498 498 498 498 498 498 498 498
lg_Openness Pearson Correlation
-.163(**) 0.055 0.014 0.023 -.156(**) 0.001 -0.012 0.001
Sig. (2-tailed) 0 0.2 0.748 0.591 0 0.983 0.787 0.99
N 542 542 542 542 542 542 542 541
sq_coproductionuction Pearson Correlation 0.009
-.255(**)
-.311(**) 0.05 0.05 0.003 -.118(*) -.115(*)
Sig. (2-tailed) 0.869 0 0 0.383 0.383 0.955 0.038 0.043
N 309 309 309 309 309 309 309 308
GE Pearson Correlation
-.355(**) -0.049
-.166(**) -.087(*) -.111(**) -0.027
-.176(**)
-.145(**)
Sig. (2-tailed) 0 0.226 0 0.031 0.005 0.502 0 0
N 624 624 624 624 624 624 624 623
sq_Hcd Pearson Correlation .103(*) -.110(*) 0.056 0.064 0.085 -.124(**) -0.005 -0.025
Sig. (2-tailed) 0.023 0.016 0.22 0.163 0.061 0.007 0.911 0.582
N 480 480 480 480 480 480 480 479
lg_Language Pearson Correlation 0.029 0.027 .129(**) 0.008 .240(**) 0.053 .137(**) .125(**)
Sig. (2-tailed) 0.477 0.518 0.002 0.841 0 0.199 0.001 0.002
N 584 584 584 584 584 584 584 583
sq_Tcd Pearson Correlation .140(**) 0.035 0.068 -.175(**) -0.037 -.130(**) -0.06 -0.037
Sig. (2-tailed) 0.003 0.461 0.157 0 0.441 0.006 0.211 0.435
N 440 440 440 440 440 440 440 439 ** Correlation is significant at the 0.01 level (2-tailed). * Correlation is significant at the 0.05 level (2-tailed).

95
Market Variables
Economic Freedom of the World (EFW) index is an indicator of the freedom of
economic activities in a country. The Openness Index (OI) reflects the degree an
economy opens to trade and a country’s overall trade relations with other countries.
Almost all TB variables showed negative correlations with the EFW index. But only
tariff and taxation showed significant negative correlations with the OI. Other that the
above two variables, none of the other TB variables showed significant correlations with
the Openess Index.
In addition, the composite TB variables (TBI and TBN) showed significant
negative correlations with co-production. Quota and investment restrictions showed even
higher negative correlations with co-production (-25.5 percent and -31.1 percent,
respectively). Tariff, subsidy, service and taxation restrictions showed no significant
correlations with co-production.
Regulation Variable
Interestingly, all restrictive TB variables showed significant negative correlations
with government effectiveness index, with tariff showing the strongest negative
correlations (-35.5 percent). Only quotas and subsidy, as supporting methods, showed no
significant correlations with the GE index.
Culture Variables
Significant positive correlations appeared between the composite TB indices and
language score. Significant negative correlations were also found between quota, subsidy,
96
and Hofstede cultural distance, as well as between service restrictions, subsidy, and
Tadesse & White’s cultural distance score.
Summary of Correlations
In summary, the composite TB indices (TBI and TBN) showed significant
positive correlations with all the output variables, and some of the operation and
consumption variables. Negative correlations were shown mostly on consumer behavior
variables including consumer admission and spending. Because consumer admission and
spending have great implication for the development of industry infrastructure, the
negative correlation was also shown on film screens. Similar patterns also appeared for
the correlations between most of the individual TB variables and the dependent variables.
Besides the negative correlations between individual TB variables and the dependent
variables on film screen, consumer spending and admission, only three other negative
correlations appeared between service restrictions and HHI, tariff and piracy, and subsidy
and piracy. And again, because the direction of the correlations cannot be identified in the
correlations, and because the film industry operates in a complicated social economic
environment, the TB variables and their effects on national film industry were further
tested in the regression analyses controlled for various social, economic, and cultural
variables.
Regression Analyses
Regression analyses were conducted to further explore the possible effects of TB
variables. The study utilized two multivariable regression techniques: the preliminary
cross-sectional regressions and cross-time regressions. In the preliminary regressions,

97
each TB variable was entered into a separate regression model with all social-economic,
regulatory and market variables used as control variables. The TB variables were also
entered into the same regression function, in order to see how different TB variables
interact with each other and what the combination effect of trade barriers was. In addition
to preliminary regressions, time-series auto-regressions were run to investigate the
changes of the TB variables’ effectiveness over time. The dependent variables were the
ten national film indicators that represent the development status of national film
industries in three aspects including film output, operation, and consumption. This
yielded ten film performance functions and twenty regression results.
Production function
Preliminary regressions
The preliminary regressions for the production function yielded nine regression
models as a result of using different TB variables in each different regression analysis.
The results are shown in Table 4-3.
The tariff-production function (model 1) explained 85.5 percent25 of the
production variations, and GDP alone explained 70.1 percent of the variation in film
productions. Next to GDP, cultural value from Tadesse & White (2008a, 2008b) were
also shown to be a strong factor in increasing film productions. This seemed to indicate
that cultural approximate countries with the U.S. might face more market erosions, and
had fewer productions as a result of the erosion. In addition, the openness of the trade
market (OI), at .001 level of significance) and government efficiency (the GE Index,
25 All of the percentage number reported here were unadjusted R2 that were not showed in the tables.

98
at .05 level of significance) were also significant contributing factors. Tariff was not a
significant contributor, as well as all other independent variables.
Table 4-3: Production Models
Preliminary Regressions Time-series Autoregressions
Models Variables B ß T-value Adjusted R2 F Variables Parameter
Estimates T-value
1 (Constant) -1.560 -4.955*** Rho (AR1) 0.674 13.605*** lg_tariff 0.004 0.001 0.020 lg_tariff 0.205 0.844 lg_gdp 0.701 0.837 10.99*** lg_gdp 0.713 7.572*** lg_population 0.072 0.072 1.021 lg_population 0.030 0.278 EFWidx 0.035 0.064 1.093 EFWidx -0.044 -1.102 lg_openness 0.217 0.223 7.352*** lg_openness 0.157 4.028*** sq_coproduction -0.034 -0.016 -0.562 sq_coproduction 0.035 0.679 goverment 0.081 0.144 1.982* goverment 0.098 1.887 sq_Hcd -0.060 -0.073 -1.635 sq_Hcd -0.102 -1.778 lg_Language 0.008 0.002 0.057 lg_Language -0.033 -0.154 sq_Tcd 0.640 0.305 7.346*** sq_Tcd 0.518 3.734***
0.848 116.396*** Constant -0.765 -1.774
2 (Constant) -1.621 -5.602*** Rho (AR1) 0.648 12.457*** sq_quota 0.112 0.167 4.955*** sq_quota 0.117 3.879*** lg_gdp 0.687 0.821 11.515*** lg_gdp 0.668 7.708*** lg_population 0.013 0.013 0.202 lg_population 0.019 0.191 EFWidx 0.051 0.093 1.819 EFWidx -0.036 -0.956 lg_openness 0.180 0.185 6.59*** lg_openness 0.117 3.174** sq_coproduction 0.004 0.002 0.078 sq_coproduction 0.040 0.810 goverment 0.095 0.170 2.569* goverment 0.138 2.761** sq_Hcd -0.012 -0.015 -0.340 sq_Hcd -0.057 -1.034 lg_Language 0.015 0.004 0.122 lg_Language -0.073 -0.361 sq_Tcd 0.576 0.275 6.938*** sq_Tcd 0.475 3.63***
0.865 133.359*** -0.758 -1.867
3 (Constant) -1.567 -5.116*** Rho (AR1) 0.669 13.282*** sq_IVR 0.024 0.024 0.742 sq_IVR 0.035 0.731 lg_gdp 0.717 0.856 10.741*** lg_gdp 0.716 7.495*** lg_pop 0.048 0.048 0.632 lg_population 0.025 0.222 EFWidx 0.035 0.063 1.162 EFWidx -0.037 -0.945 lg_openness 0.214 0.219 7.600*** lg_openness 0.148 3.971*** sq_coproduction -0.027 -0.013 -0.438 sq_coproduction 0.041 0.790 goverment 0.077 0.137 1.947 goverment 0.092 1.769 sq_Hcd -0.057 -0.069 -1.554 sq_Hcd -0.090 -1.542 lg_Language 0.000 0.000 0.001 lg_Language -0.030 -0.141 sq_Tcd 0.644 0.307 7.391*** sq_Tcd 0.525 3.804***
0.848 116.776*** Constant -0.827 -1.931
4 (Constant) -1.521 -4.934*** Rho (AR1) 0.671 13.330*** sq_service -0.024 -0.034 -1.026 sq_service 0.004 0.114

99
lg_gdp 0.696 0.832 11.009*** lg_gdp 0.697 7.567*** lg_population 0.085 0.085 1.213 lg_population 0.059 0.558 EFWidx 0.031 0.055 1.014 EFWidx -0.037 -0.937 lg_openness 0.226 0.232 7.72*** lg_openness 0.148 3.855*** sq_coproduction -0.028 -0.013 -0.457 sq_coproduction 0.036 0.697 goverment 0.086 0.155 2.19* goverment 0.094 1.821 sq_Hcd -0.051 -0.061 -1.343 sq_Hcd -0.101 -1.708 lg_Language 0.011 0.003 0.079 lg_Language -0.024 -0.112 sq_Tcd 0.607 0.290 6.579*** sq_Tcd 0.528 3.612***
0.849 117.123*** Constant -0.811 -1.885
5 (Constant) -1.537 -4.900*** Rho (AR1) 0.680 13.758*** sq_taxation 0.010 0.011 0.359 sq_taxation 0.049 1.279 lg_gdp 0.696 0.831 10.752*** lg_gdp 0.678 7.227*** lg_population 0.076 0.076 1.095 lg_population 0.069 0.667 EFWidx 0.034 0.062 1.150 EFWidx -0.041 -1.036 lg_openness 0.216 0.222 7.719*** lg_openness 0.147 3.935*** sq_coproduction -0.032 -0.015 -0.534 sq_coproduction 0.042 0.830 goverment 0.082 0.147 2.084* goverment 0.095 1.834 sq_Hcd -0.065 -0.079 -1.663 sq_Hcd -0.122 -2.021* lg_Language -0.006 -0.002 -0.041 lg_Language -0.070 -0.319 sq_Tcd 0.638 0.305 7.332*** sq_Tcd 0.514 3.684***
0.848 116.485*** Constant -0.709 -1.629
6 (Constant) -1.337 -4.487*** Rho (AR1) 0.643 12.264*** lg_subsidy 0.334 0.140 4.288*** lg_subsidy 0.244 2.262 lg_gdp 0.562 0.671 8.187*** lg_gdp 0.611 6.413*** lg_population 0.151 0.151 2.206* lg_population 0.114 1.137 EFWidx 0.037 0.067 1.303 EFWidx -0.034 -0.881 lg_openness 0.200 0.205 7.42*** lg_openness 0.138 3.713*** sq_coproduction -0.031 -0.014 -0.532 sq_coproduction 0.030 0.596 goverment 0.129 0.232 3.305** goverment 0.135 2.559* sq_Hcd -0.059 -0.072 -1.692 sq_Hcd -0.097 -1.777 lg_Language 0.002 0.000 0.013 lg_Language -0.067 -0.325 sq_Tcd 0.571 0.273 6.741*** sq_Tcd 0.512 3.861***
0.861 129.096*** Constant -0.720 -1.721
7 (Constant) -1.501 -4.975*** Rho (AR1) 0.689 13.872*** sq_TBI 0.057 0.113 2.728*** sq_TBI 0.091 3.164** lg_gdp 0.672 0.803 10.67*** lg_gdp 0.664 7.207*** lg_population 0.031 0.031 0.444 lg_population -0.026 -0.247 EFWidx 0.039 0.072 1.350 EFWidx -0.042 -1.080 lg_openness 0.180 0.185 5.919*** lg_openness 0.104 2.658** sq_coproduction -0.018 -0.008 -0.304 sq_coproduction 0.048 0.974 goverment 0.095 0.170 2.451* goverment 0.125 2.395** sq_Hcd -0.071 -0.086 -1.972 sq_Hcd -0.115 -2.006* lg_Language -0.039 -0.011 -0.292 lg_Language -0.125 -0.575 sq_Tcd 0.649 0.310 7.589*** sq_Tcd 0.532 3.845***
0.853 121.536*** Constant -0.643 -1.504
8 (Constant) -1.550 -5.089*** Rho (AR1) 0.670 13.331*** sq_TBN 0.052 0.065 1.665 sq_TBN 0.066 1.778 lg_gdp 0.676 0.808 10.483*** lg_gdp 0.674 7.329*** lg_population 0.062 0.062 0.894 lg_population 0.041 0.396

100
EFWidx 0.041 0.074 1.376 EFWidx -0.032 -0.822 lg_openness 0.198 0.203 6.606*** lg_openness 0.134 3.525*** sq_coproduction -0.020 -0.010 -0.338 sq_coproduction 0.048 0.942 goverment 0.090 0.161 2.29* goverment 0.109 2.102* sq_Hcd -0.066 -0.080 -1.801 sq_Hcd -0.101 -1.783 lg_Language -0.008 -0.002 -0.058 lg_Language -0.032 -0.150 sq_Tcd 0.631 0.301 7.283*** sq_Tcd 0.523 3.812***
0.850 118.311*** Constant -0.827 -1.945
9 (Constant) -1.323 -4.394*** Rho (AR1) 0.636 11.894*** lg_tariff 0.123 0.023 0.623 lg_tariff 0.269 1.062 sq_quota 0.104 0.155 3.956*** sq_quota 0.132 3.727*** sq_IVR 0.094 0.095 2.62** sq_IVR 0.079 1.493 sq_service -0.026 -0.037 -1.112 sq_service -0.016 -0.456 sq_taxation 0.022 0.024 0.687 sq_taxation 0.042 0.957 lg_subsidy 0.248 0.104 2.909** lg_subsidy 0.084 0.679 lg_gdp 0.637 0.761 8.66*** lg_gdp 0.683 6.821*** lg_population -0.009 -0.009 -0.103 lg_population -0.070 -0.582 EFWidx 0.030 0.054 0.964 EFWidx -0.048 -1.253 lg_openness 0.174 0.179 5.648*** lg_openness 0.124 3.197** sq_coproduction 0.039 0.018 0.675 sq_coproduction 0.054 1.082 goverment 0.133 0.239 3.364*** goverment 0.157 3.035** sq_Hcd -0.007 -0.009 -0.187 sq_Hcd -0.046 -0.745 lg_Language -0.051 -0.014 -0.394 lg_Language -0.159 -0.789 sq_Tcd 0.511 0.244 5.896*** sq_Tcd 0.440 3.223***
0.873 95.577*** Constant -0.624 -1.518
• p<.05. **p<.01. ***<.001
Similarly, across all the models, GDP, OI, and Tadesse’s cultural value (TCD)
appeared to be three strongest contributors to film production. Government efficiency
also appeared to be significant factors in improving film productions in most models,
except in model 3.
As to the TB variables, quota and subsidy were all significant predictors (at .001
level of significance) of the film production variation. Investment, service barriers, and
taxation were not significant predictors. TBI was also significant in predicting film
production and TBN was not significant.
In model 9, the six TB variables were entered into one regression function. It
turns out that, in addition to the significance of subsidy and quota, investment restriction

101
also turned to be statistically significant (at .01 level). This might indicate that the effect
of investment restrictions on film production might depend on the composite effect of
other policy variables, such as subsidy and quota.
Altogether, subsidy was the strongest contributor to domestic film productions
(β=33.4 percent in model 6), followed by quota (β=11.2 percent in model 2) and
investment restrictions (β=9.4 percent in model 9), a result that was consistent with the
correlation analysis.
Time-Series Regressions
Autoregression analyses were used for each of the above different nine models in
order to investigate the effects of the independent factors over the studied time period.
The results showed similar patterns as the preliminary regression analyses. Across all of
the nine models, gross domestic product, Tadesse’s cultural value measure, and the
Openness Index in trade remained three strongest contributors for domestic film
production. This indicates the effect of these three variables was long-lasting over the
studied period of time. Government Effectiveness index appeared significant in five of
the nine models, the subsidy model (model 6), both of the TBI and TBN model (model 7
and model 8), and model 9 with all the TB variables. This indicated the effect of GE
index was long-lasting, but the effect might reduce with time. As to the TB variables,
quota and TBI remained significant in model 2 (β= 11.7%) and model 7 (β=9.1%).
Quota was also statistically significant in model 9 (β=13.3%). Therefore, the function of
quota in facilitating local film production was fairly consistent during the studied time
period. However, in both the subsidy function (model 6) and the TB combination model

102
(model 9), subsidy seemed to lose its significance, indicating that the effectiveness of
subsidy might decrease over time.
Market Share Function
Preliminary Regressions
Interestingly, more factors were statistically significant in determining national
film’s market share. Also, cultural factors played more important roles in the market
share function. As a whole, the models explained less percentage of the variations in the
dependent variable (around 56 percent to 65 percent).
As shown in Table 4-4, across the nine models, GDP, the EFW index, co-
production, and the three culture variables were all strong predictors of market share.
Similar as to local production, GDP was also the strongest booster to increase market
share. Both the EFW Index and co-production, however, showed negative coefficients
with market share. This indicated that opening the domestic market and having
international cooperation with foreign partners might actually invite more cultural
erosions.
As to the cultural variables, the results were mixed. The cultural dimension, as
measured by Tadesse & White, showed a positive significant coefficient with market
share variable, indicating that the closeness in social-cultural value with the US would
negatively affect domestic film’s market share. The negative relations between language
score and market share also indicated increasing market erosions from language
approximate countries. The negative relations between cultural dimension in Hcd and
market share, however, indicated that closeness in Hofstede’s cultural dimension with the
U.S. would actually increase the market share of domestic films. This might indicate that
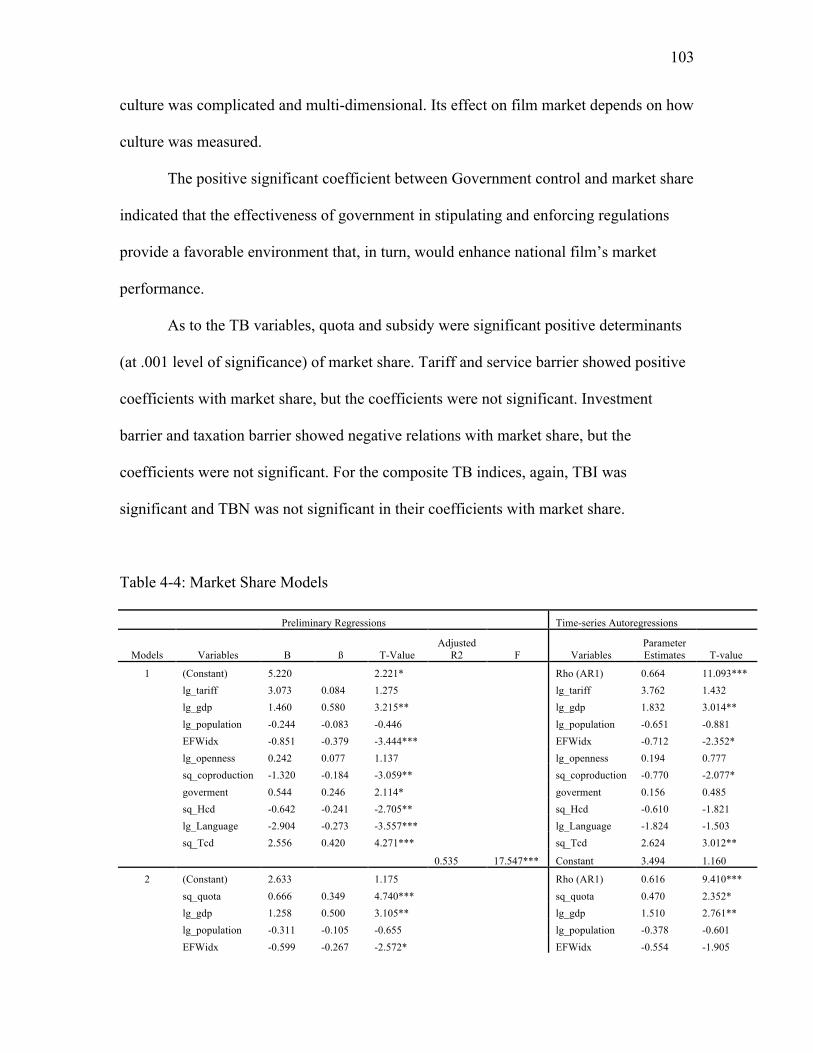
103
culture was complicated and multi-dimensional. Its effect on film market depends on how
culture was measured.
The positive significant coefficient between Government control and market share
indicated that the effectiveness of government in stipulating and enforcing regulations
provide a favorable environment that, in turn, would enhance national film’s market
performance.
As to the TB variables, quota and subsidy were significant positive determinants
(at .001 level of significance) of market share. Tariff and service barrier showed positive
coefficients with market share, but the coefficients were not significant. Investment
barrier and taxation barrier showed negative relations with market share, but the
coefficients were not significant. For the composite TB indices, again, TBI was
significant and TBN was not significant in their coefficients with market share.
Table 4-4: Market Share Models
Preliminary Regressions Time-series Autoregressions
Models Variables B ß T-Value Adjusted
R2 F Variables Parameter Estimates T-value
1 (Constant) 5.220 2.221* Rho (AR1) 0.664 11.093*** lg_tariff 3.073 0.084 1.275 lg_tariff 3.762 1.432 lg_gdp 1.460 0.580 3.215** lg_gdp 1.832 3.014** lg_population -0.244 -0.083 -0.446 lg_population -0.651 -0.881 EFWidx -0.851 -0.379 -3.444*** EFWidx -0.712 -2.352* lg_openness 0.242 0.077 1.137 lg_openness 0.194 0.777 sq_coproduction -1.320 -0.184 -3.059** sq_coproduction -0.770 -2.077* goverment 0.544 0.246 2.114* goverment 0.156 0.485 sq_Hcd -0.642 -0.241 -2.705** sq_Hcd -0.610 -1.821 lg_Language -2.904 -0.273 -3.557*** lg_Language -1.824 -1.503 sq_Tcd 2.556 0.420 4.271*** sq_Tcd 2.624 3.012**
0.535 17.547*** Constant 3.494 1.160
2 (Constant) 2.633 1.175 Rho (AR1) 0.616 9.410*** sq_quota 0.666 0.349 4.740*** sq_quota 0.470 2.352* lg_gdp 1.258 0.500 3.105** lg_gdp 1.510 2.761** lg_population -0.311 -0.105 -0.655 lg_population -0.378 -0.601 EFWidx -0.599 -0.267 -2.572* EFWidx -0.554 -1.905

104
lg_openness 0.032 0.010 0.162 lg_openness 0.047 0.199 sq_coproduction -1.168 -0.163 -2.899** sq_coproduction -0.875 -2.366* goverment 0.762 0.344 3.166** goverment 0.462 1.459 sq_Hcd -0.327 -0.123 -1.431 sq_Hcd -0.386 -1.179 lg_Language -2.433 -0.229 -3.176** lg_Language -1.932 -1.704 sq_Tcd 2.822 0.464 5.042*** sq_Tcd 2.871 3.536**
0.597 22.302*** Constant 1.928 0.667
3 (Constant) 5.020 2.128* Rho (AR1) 0.671 11.370*** sq_IVR -0.040 -0.012 -0.187 sq_IVR 0.203 0.636 lg_gdp 1.271 0.505 2.790** lg_gdp 1.662 2.761** lg_population 0.064 0.022 0.119 lg_population -0.320 -0.455 EFWidx -0.811 -0.361 -3.282** EFWidx -0.653 -2.155* lg_openness 0.191 0.061 0.896 lg_openness 0.103 0.413 sq_coproduction -1.359 -0.189 -3.123** sq_coproduction -0.767 -2.053* goverment 0.589 0.266 2.285* goverment 0.199 0.620 sq_Hcd -0.620 -0.233 -2.604* sq_Hcd -0.555 -1.615 lg_Language -2.882 -0.271 -3.493*** lg_Language -1.777 -1.439 sq_Tcd 2.565 0.422 4.257*** sq_Tcd 2.714 3.079**
0.529 17.184*** Constant 2.942 0.972
4 (Constant) 5.140 2.179* Rho (AR1) 0.665 11.162*** sq_service 0.130 0.056 0.803 sq_service 0.046 0.213 lg_gdp 1.322 0.525 3.017** lg_gdp 1.585 2.695** lg_population -0.038 -0.013 -0.074 lg_population -0.199 -0.291 EFWidx -0.806 -0.359 -3.274** EFWidx -0.652 -2.157* lg_openness 0.122 0.039 0.548 lg_openness 0.107 0.423 sq_coproduction -1.393 -0.194 -3.199** sq_coproduction -0.801 -2.142* goverment 0.533 0.241 2.017* goverment 0.205 0.634 sq_Hcd -0.672 -0.252 -2.726** sq_Hcd -0.609 -1.740 lg_Language -2.953 -0.278 -3.591*** lg_Language -1.746 -1.427 sq_Tcd 2.632 0.433 4.347*** sq_Tcd 2.787 3.113**
0.531 17.323*** Constant 2.984 0.989
5 (Constant) 4.741 1.987* Rho (AR1) 0.672 11.358*** sq_taxation -0.143 -0.051 -0.742 sq_taxation 0.103 0.390 lg_gdp 1.368 0.544 3.054** lg_gdp 1.533 2.554** lg_population -0.037 -0.012 -0.072 lg_population -0.148 -0.221 EFWidx -0.827 -0.369 -3.350** EFWidx -0.647 -2.131* lg_openness 0.240 0.076 1.078 lg_openness 0.101 0.402 sq_coproduction -1.412 -0.197 -3.208** sq_coproduction -0.763 -2.021* goverment 0.603 0.273 2.342* goverment 0.187 0.575 sq_Hcd -0.552 -0.207 -2.172* sq_Hcd -0.630 -1.752 lg_Language -2.672 -0.251 -3.057** lg_Language -1.821 -1.443 sq_Tcd 2.662 0.438 4.340*** sq_Tcd 2.671 2.966**
0.531 17.301*** Constant 3.178 1.027
6 (Constant) 5.331 2.368** Rho (AR1) 0.645 10.312*** lg_subsidy 1.721 0.269 3.659*** lg_subsidy 1.143 1.756 lg_gdp 0.470 0.187 0.992 lg_gdp 1.121 1.816 lg_population 0.551 0.187 1.094 lg_population 0.132 0.200 EFWidx -0.708 -0.316 -2.987** EFWidx -0.602 -2.031* lg_openness 0.084 0.026 0.416 lg_openness 0.037 0.149 sq_coproduction -1.385 -0.193 -3.352** sq_coproduction -0.827 -2.231*

105
goverment 0.926 0.419 3.534*** goverment 0.457 1.352 sq_Hcd -0.549 -0.206 -2.412* sq_Hcd -0.557 -1.703 lg_Language -2.888 -0.272 -3.689*** lg_Language -2.010 -1.693 sq_Tcd 2.301 0.378 3.976*** sq_Tcd 2.634 3.106**
0.572 20.230*** Constant 3.235 1.101
7 (Constant) 4.505 1.980* Rho (AR1) 0.644 10.424*** sq_TBI 0.461 0.312 3.299** sq_TBI 0.384 2.101* lg_gdp 0.939 0.373 2.161* lg_gdp 1.355 2.373* lg_population -0.093 -0.031 -0.189 lg_population -0.394 -0.608 EFWidx -0.582 -0.260 -2.353* EFWidx -0.533 -1.784 lg_openness -0.248 -0.078 -1.033 lg_openness -0.123 -0.463 sq_coproduction -1.181 -0.165 -2.813** sq_coproduction -0.785 -2.127* goverment 0.599 0.271 2.424* goverment 0.321 1.020 sq_Hcd -0.641 -0.241 -2.800** sq_Hcd -0.604 -1.865 lg_Language -3.272 -0.308 -4.101*** lg_Language -2.215 -1.861 sq_Tcd 2.458 0.404 4.238*** sq_Tcd 2.729 3.250**
0.564 19.659*** Constant 2.823 0.967
8 (Constant) 5.189 2.185* Rho (AR1) 0.667 11.213*** sq_TBN -0.120 -0.050 -0.558 sq_TBN -0.052 -0.234 lg_gdp 1.364 0.542 3.000** lg_gdp 1.598 2.687** lg_population 0.027 0.009 0.053 lg_population -0.160 -0.241 EFWidx -0.861 -0.384 -3.299** EFWidx -0.665 -2.147* lg_openness 0.248 0.078 1.037 lg_openness 0.136 0.533 sq_coproduction -1.388 -0.193 -3.171** sq_coproduction -0.803 -2.142* goverment 0.580 0.262 2.259* goverment 0.201 0.623 sq_Hcd -0.617 -0.231 -2.594* sq_Hcd -0.592 -1.745 lg_Language -2.841 -0.267 -3.438*** lg_Language -1.717 -1.399 sq_Tcd 2.622 0.431 4.309*** sq_Tcd 2.758 3.139**
0.530 17.247*** Constant 3.027 0.997
9 (Constant) 3.551 1.571 Rho (AR1) 0.612 8.995*** lg_tariff 2.428 0.066 0.923 lg_tariff 3.734 1.245 sq_quota 0.595 0.312 3.510*** sq_quota 0.364 1.484 sq_IVR 0.252 0.078 1.030 sq_IVR 0.335 0.945 sq_service -0.009 -0.004 -0.049 sq_service -0.139 -0.600 sq_taxation 0.133 0.048 0.606 sq_taxation 0.065 0.222 lg_subsidy 1.257 0.197 2.336* lg_subsidy 1.056 1.386 lg_gdp 0.869 0.345 1.685 lg_gdp 1.452 2.210* lg_population -0.252 -0.086 -0.435 lg_population -0.674 -0.883 EFWidx -0.577 -0.257 -2.416** EFWidx -0.594 -2.001* lg_openness -0.078 -0.025 -0.316 lg_openness 0.059 0.216 sq_coproduction -1.080 -0.150 -2.601* sq_coproduction -0.776 -2.044* goverment 0.919 0.416 3.493*** goverment 0.568 1.686 sq_Hcd -0.377 -0.141 -1.496 sq_Hcd -0.347 -0.939 lg_Language -2.783 -0.262 -3.436*** lg_Language -2.322 -1.980* sq_Tcd 2.529 0.416 4.298*** sq_Tcd 2.431 2.796**
0.608 15.875*** Constant 2.969 0.995
* p<.05. **p<.01. ***<.001

106
Time-Series Regressions
Controlled for time, GDP, co-production, and Tcd remained significant predictors
across the nine models. Among the six TB variables, however, only quota remained
significant (at .05 level) in model 2. The qualitative composite index TBI also remained
statistically significant (at .05 level) in model 7. Although subsidy was statistically
significant in increasing market share in the preliminary model, its influence seemed to
decrease over time. The EFW index was significant in all the models, except in model 2
which includes quota variable, and in model 7 which includes the TBI variable. This
might indicate that the negative effect of opening market was offset by a well-regulated
and protected market. Another interesting observation was that government control
appeared to be a great contributor to market share across the nine models in the
preliminary regressions. Controlled for time, however, the effectiveness of the GE factor
was significantly lost. In the long run, the effects of some cultural factors, such as
language factor and cultural factor in Hcd, were also becoming non-significant. However,
the cultural values in Tcd seemed have long-lasting effect.
Export Function
Preliminary Regressions
The regression results for export function were reported in Table 4-5. In the
preliminary functions, the export models explained around 87 percent to 89 percent of the
export variations. In the tariff-export model (model 1), GDP, the Openess Index, and
cultural value from Tadesse & White appeared to be three strongest predictors of film
export. The EFW index and GE index were not statistically significant in their

107
coefficients with film export. This might because that these two factors focus more on the
domestic market rather than on export relations. The cultural dimension in language
proximity also showed a positive impact on film export, implying the importance of
culture-language in foreign film consumptions. The cultural distance from Tadesse &
White and cultural distance from Hofstede, again, showed impacts on film export in
different directions. Tcd appeared to be a positive predictor of film export, but Hcd was a
negative predictor of film export. The negative impact of Hcd on film export was
consistent with its impact on production, and therefore, the negative impact on export
might be explained by reduced productions. The positive impact of Tcd on film export
was interesting, as it indicated that more films were imported from cultural different but
language approximate countries. If that is the case, it is the language, and not the cultural
values that limit consumptions of foreign films. Adding distance in social cultural values
might increase the attractiveness of foreign films.
As to the TB variables, tariff was not statistically significant, therefore not an
determinant of film export. Surprisingly, co-productions showed no significant impact on
film export, implying that having co-productions does not necessarily increase a
country’s film export, as commonly believed by scholars.
Similar patterns appeared across all of the rest seven models (model 2 – model 9)
in that GDP was the strongest predictor for film export. The market structure variable in
the OI index, as an indicator of trade relations, showed significance positive coefficient
with film export. The EFW index was, however, not statistically significant. This result
was understandable because exports rely more on trade relations. The cultural dimensions
in language and the cultural value from Tadesse & White were also strong positive

108
factors in film export in all of the nine models. In contrast, the Hofstede’s cultural
distance appeared an unstable predictor across the models.
As to the TB variables, in model 2 (the quota-export model), quota was not a
significant predictor of film export. This result was reasonable in that quota restrictions
deal more with domestic market that with foreign trade. In the investment-export function
(model 3), investment restrictions appeared to be a significant negative factor for film
export. Therefore, restricting foreign investment might deteriorate trade relations among
partners.
In the service-export function (model 4) and taxation-export function (model 5),
both service restrictions and taxation appeared to negatively affect film export. These two
variables remained significant in model 9. Subsidy (in model 6) and TBN (in model 8)
were not significant factors for film export. TBI (in model 7), however, showed to be a
negative indicator of film export, indicating that increased trade barriers in degree would
cause undesirable effect on film export.
Time-Series Regressions
Controlled for time, GDP, the Openness Index, and Tcd remained three strongest
predictors in film export across all the models. The impact of two other cultural
dimensions, the Hefstede’s cultural dimension and language factor seemed decreased and
became non-significant over time. For the three TB variables that showed significant
impacts on film export in the preliminary analyses, only service restrictions remained
significant when controlled for time. Therefore, the effect of investment and tax
restrictions decreased over time. The effect of composite TB factor, TBI, which was
significant factor in the preliminary analysis, also appeared non-significant over time.

109
Table 4-5: Export models
Preliminary Regressions Time-series Autoregressions
Models Variables B ß T-Value Adjusted
R2 F Variables Parameter Estimates T-value
1 (Constant) -4.541 -5.930*** Rho (AR1) 0.739 15.554*** lg_tariff -0.299 -0.022 -0.680 lg_tariff 0.245 0.404 lg_gdp 1.353 0.620 8.719*** lg_gdp 1.139 4.809*** lg_population -0.138 -0.053 -0.802 lg_population 0.025 0.089 EFWidx 0.145 0.101 1.842 EFWidx 0.137 1.404 lg_openness 1.691 0.666 23.554*** lg_openness 1.662 17.693*** sq_coproduction 0.052 0.009 0.351 sq_coproduction 0.089 0.767 goverment -0.014 -0.010 -0.143 goverment 0.141 1.120 sq_Hcd -0.249 -0.116 -2.787** sq_Hcd -0.221 -1.515 lg_Language 0.876 0.092 2.679** lg_Language 0.835 1.518 sq_Tcd 1.128 0.207 5.327*** sq_Tcd 0.952 2.712**
0.867 136.385*** Constant -4.198 -3.950***
2 (Constant) -4.458 -5.986*** Rho (AR1) 0.742 15.611*** sq_quota 0.067 0.038 1.154 sq_quota -0.053 -0.683 lg_gdp 1.358 0.623 8.839*** lg_gdp 1.129 4.845*** lg_population -0.201 -0.077 -1.178 lg_population 0.084 0.320 EFWidx 0.133 0.093 1.835 EFWidx 0.147 1.519 lg_openness 1.685 0.663 23.937*** lg_openness 1.666 17.883*** sq_coproduction 0.066 0.012 0.445 sq_coproduction 0.089 0.768 goverment 0.013 0.009 0.138 goverment 0.117 0.901 sq_Hcd -0.227 -0.106 -2.465* sq_Hcd -0.233 -1.575 lg_Language 0.870 0.092 2.670** lg_Language 0.881 1.589 sq_Tcd 1.095 0.201 5.119*** sq_Tcd 0.979 2.762**
0.868 137.073*** Constant -4.299 -4.026***
3 (Constant) -4.378 -5.962*** Rho (AR1) 0.725 14.608*** sq_IVR -0.203 -0.079 -2.608** sq_IVR -0.109 -0.906 lg_gdp 1.232 0.565 7.698*** lg_gdp 1.076 4.575*** lg_population 0.041 0.016 0.222 lg_population 0.158 0.561 EFWidx 0.133 0.093 1.868 EFWidx 0.140 1.470 lg_openness 1.731 0.682 25.647*** lg_openness 1.653 18.492*** sq_coproduction -0.018 -0.003 -0.124 sq_coproduction 0.076 0.649 goverment 0.036 0.025 0.379 goverment 0.143 1.144 sq_Hcd -0.281 -0.131 -3.187** sq_Hcd -0.251 -1.712 lg_Language 0.930 0.098 2.883** lg_Language 0.860 1.597 sq_Tcd 1.098 0.201 5.257*** sq_Tcd 0.962 2.795**
0.872 141.397*** Constant -4.174 -3.984***
4 (Constant) -3.931 -5.608*** Rho (AR1) 0.691 12.999*** sq_service -0.292 -0.161 -5.491*** sq_service -0.228 -2.761** lg_gdp 1.311 0.601 9.114*** lg_gdp 1.127 5.229*** lg_population -0.019 -0.007 -0.118 lg_population 0.164 0.664 EFWidx 0.061 0.043 0.897 EFWidx 0.124 1.346 lg_openness 1.820 0.717 27.327*** lg_openness 1.708 19.304***

110
sq_coproduction 0.120 0.022 0.871 sq_coproduction 0.101 0.869 goverment 0.077 0.053 0.860 goverment 0.147 1.227 sq_Hcd -0.140 -0.065 -1.639 sq_Hcd -0.129 -0.930 lg_Language 0.900 0.095 2.956** lg_Language 0.846 1.670 sq_Tcd 0.740 0.136 3.526*** sq_Tcd 0.687 2.000*
0.885 159.849*** Constant -4.067 -4.059***
5 (Constant) -5.024 -6.813*** Rho (AR1) 0.728 15.764*** sq_taxation -0.239 -0.103 -3.821*** sq_taxation -0.039 -0.420 lg_gdp 1.490 0.683 9.795*** lg_gdp 1.143 4.943*** lg_population -0.260 -0.100 -1.582 lg_population 0.047 0.180 EFWidx 0.155 0.108 2.200* EFWidx 0.143 1.493 lg_openness 1.725 0.679 26.227*** lg_openness 1.651 18.403*** sq_coproduction 0.002 0.000 0.011 sq_coproduction 0.085 0.732 goverment -0.037 -0.025 -0.400 goverment 0.135 1.081 sq_Hcd -0.131 -0.061 -1.425 sq_Hcd -0.202 -1.356 lg_Language 1.202 0.126 3.669*** lg_Language 0.879 1.606 sq_Tcd 1.161 0.213 5.674*** sq_Tcd 0.965 2.786**
0.876 147.561*** Constant -4.292 -4.053***
6 (Constant) -4.326 -5.711*** Rho (AR1) 0.737 15.213*** lg_subsidy 0.143 0.023 0.721 lg_subsidy -0.009 -0.033 lg_gdp 1.307 0.599 7.488*** lg_gdp 1.123 4.574*** lg_population -0.131 -0.050 -0.755 lg_population 0.059 0.224 EFWidx 0.125 0.087 1.721 EFWidx 0.143 1.481 lg_openness 1.700 0.669 24.770*** lg_openness 1.652 17.879*** sq_coproduction 0.044 0.008 0.300 sq_coproduction 0.090 0.778 goverment 0.025 0.017 0.254 goverment 0.137 1.029 sq_Hcd -0.256 -0.119 -2.873** sq_Hcd -0.219 -1.504 lg_Language 0.863 0.091 2.643** lg_Language 0.847 1.533 sq_Tcd 1.103 0.202 5.119*** sq_Tcd 0.957 2.727**
0.867 136.431*** Constant -4.236 -3.946***
7 (Constant) -4.706 -6.762*** Rho (AR1) 0.695 13.628*** sq_TBI -0.270 -0.204 -5.566*** sq_TBI -0.151 -2.196 lg_gdp 1.501 0.689 10.339*** lg_gdp 1.211 5.529*** lg_population 0.032 0.012 0.199 lg_population 0.166 0.657 EFWidx 0.106 0.074 1.572 EFWidx 0.142 1.528 lg_openness 1.878 0.740 26.715*** lg_openness 1.723 18.654*** sq_coproduction -0.032 -0.006 -0.234 sq_coproduction 0.071 0.608 goverment -0.065 -0.044 -0.723 goverment 0.070 0.571 sq_Hcd -0.203 -0.095 -2.437* sq_Hcd -0.199 -1.455 lg_Language 1.085 0.114 3.540*** lg_Language 1.015 1.960 sq_Tcd 1.088 0.199 5.518*** sq_Tcd 0.952 2.892***
0.885 160.510*** Constant -4.460 -4.399***
8 (Constant) -4.477 -6.156*** Rho (AR1) 0.731 15.066*** sq_TBN -0.247 -0.117 -3.282 sq_TBN -0.046 -0.524 lg_gdp 1.481 0.679 9.617*** lg_gdp 1.140 4.940*** lg_population -0.113 -0.043 -0.685 lg_population 0.071 0.274 EFWidx 0.099 0.069 1.402 EFWidx 0.139 1.445 lg_openness 1.796 0.707 25.099*** lg_openness 1.661 18.159*** sq_coproduction -0.021 -0.004 -0.146 sq_coproduction 0.081 0.694 goverment -0.041 -0.028 -0.432 goverment 0.126 0.992

111
sq_Hcd -0.229 -0.107 -2.634** sq_Hcd -0.219 -1.519 lg_Language 0.939 0.099 2.941** lg_Language 0.848 1.561 sq_Tcd 1.174 0.215 5.678*** sq_Tcd 0.960 2.763**
0.874 144.535*** Constant -4.216 -4.004***
9 (Constant) -4.177 -5.757*** Rho (AR1) 0.675 12.996*** lg_tariff 0.777 0.057 1.630 lg_tariff 0.412 0.653 sq_quota -0.083 -0.048 -1.319 sq_quota -0.079 -0.906 sq_IVR 0.053 0.021 0.618 sq_IVR -0.004 -0.032 sq_service -0.299 -0.164 -5.302*** sq_service -0.228 -2.634** sq_taxation -0.293 -0.126 -3.864*** sq_taxation -0.092 -0.848 lg_subsidy 0.211 0.034 1.028 lg_subsidy 0.205 0.658 lg_gdp 1.454 0.667 8.201*** lg_gdp 1.158 4.652*** lg_population -0.161 -0.062 -0.802 lg_population 0.146 0.481 EFWidx 0.030 0.021 0.398 EFWidx 0.113 1.209 lg_openness 1.897 0.747 25.504*** lg_openness 1.739 18.270*** sq_coproduction 0.037 0.007 0.268 sq_coproduction 0.080 0.673 goverment 0.088 0.060 0.916 goverment 0.150 1.172 sq_Hcd -0.030 -0.014 -0.315 sq_Hcd -0.121 -0.771 lg_Language 1.261 0.133 4.068*** lg_Language 0.919 1.801 sq_Tcd 0.790 0.145 3.787*** sq_Tcd 0.717 2.080*
0.891 113.847*** Constant -4.097 -4.003***
* p<.05. **p<.01. ***<.001
Screen Function
Preliminary Regressions
The screen models explained around 88 percent to 90 percent of the screen
variations (Table 4-6). Across the nine models, population and gross domestic product
appeared to be two of the strongest contributors for national film screens. This seemed to
support the market size effect in that, bigger markets with more developed economies and
large population have more developed film industries. The GE index was also significant
(at .001 level of confidence) in its coefficient with film screens, indicating that the strong
government control in reinforcing regulations would enhance the development of film
industry. As to the market structure variables, the EFW index was statistically significant
in determining the development scale of films. The coefficient was negative and the

112
results were consistent across all of the nine models. The negative coefficient between an
open market and the scale of film operations seemed to suggest that open countries may
encounter more market erosions from imported films. The OI index was significant in
most models (except in model 2, model 7, and model 9). The results suggested that trade
outflow might play a positive role in increasing domestic operations.
Among the six TB variables, tariff, quota, subsidy, and TBI were all positively
related to film screens. Investment restrictions, service restrictions, taxation, and TBN
were negatively related to film screens. The directions of these above relations were
understandable because tariff provides extra revenues for film development. Both quota
and subsidy provide direct support for domestic film development. Investment, service,
and tax restrictions affect domestic development. However, the coefficients were only
significant for quota (at .001 level of significance) and subsidy (at .05 level of
significance). The result seemed to support the claim that quota and subsidy are more
direct way of supporting local film development. Considering the composite effect of
various trade barriers as a whole, however, none of the TB Indices showed significant
coefficients with film screens. Therefore, increasing the number of TBs and increasing
the quality and degree of trade barriers would have no significant impact on national film
screens. In model 9, quota and investment restrictions appeared to have significant
positive coefficients with film screens. The significance of investment restrictions on film
screens might indicate that the interaction of different TB variables might provide a more
positive effect on national film development. The combination of investment restrictions
and quotas might actually help more with national film infrastructures in screens.

113
As to the three cultural variables, only the cultural dimension in Hcd was
significantly correlated with film screens, and the effect was negative. This, again,
suggested that the closeness of culture in Hcd dimensions would actually help with the
development of national infrastructure. While cultural proximity in social economic
values and language were positively associated to a larger screen numbers, their effects
were not significant (except in model 7 where Tcd was significant). Cultural effects on
screens became even less significant when considering all the regulatory variables in
model 9.
Table 4-6: Total Screen
Preliminary Regressions Time-Series Autoregressions
Models Variables B ß T-Value Adjusted
R2 F Variables Parameter Estimates T-value
1 (Constant) 0.781 5.259*** Rho (AR1) 0.976 103.328*** lg_tariff 0.033 0.012 0.374 lg_tariff 0.640 8.372*** lg_gdp 0.207 0.488 6.879*** lg_gdp 0.151 5.209*** lg_population 0.228 0.450 6.804*** lg_population 0.317 8.894*** EFWidx -0.038 -0.136 -2.482* EFWidx -0.030 -2.888** lg_openness 0.038 0.075 2.702** lg_openness 0.032 3.468*** sq_coproduction -0.008 -0.007 -0.265 sq_coproduction 0.000 -0.033 goverment 0.081 0.285 4.226*** goverment 0.065 4.786*** sq_Hcd -0.060 -0.143 -3.454*** sq_Hcd 0.002 0.098 lg_Language 0.029 0.015 0.450 lg_Language 0.454 6.428*** sq_Tcd 0.081 0.076 1.965 sq_Tcd -0.056 -1.345
0.868 136.813*** Constant 0.637 5.017***
2 (Constant) 0.737 5.517*** Rho (AR1) 0.948 61.052*** lg_gdp 0.199 0.468 7.205*** lg_gdp 0.109 3.275*** lg_population 0.197 0.390 6.451*** lg_population 0.395 10.080*** EFWidx -0.027 -0.098 -2.080* EFWidx -0.036 -2.884** lg_openness 0.016 0.032 1.266 lg_openness 0.010 0.880 sq_coproduction 0.014 0.013 0.541 sq_coproduction -0.002 -0.146 goverment 0.087 0.308 5.107*** goverment 0.081 4.822*** sq_Hcd -0.033 -0.079 -1.995* sq_Hcd -0.015 -0.730 lg_Language 0.034 0.018 0.583 lg_Language 0.370 4.464*** sq_Tcd 0.046 0.043 1.200 sq_Tcd -0.050 -1.012 sq_quota 0.062 0.182 5.926*** sq_quota 0.019 1.999*
0.888 164.7078*** Constant 0.749 5.257***
3 (Constant) 0.770 5.317*** Rho (AR1) 0.954 65.475***

114
lg_gdp 0.202 0.475 6.377*** lg_gdp 0.115 3.439*** lg_population 0.237 0.468 6.536*** lg_population 0.398 9.594*** EFWidx -0.036 -0.127 -2.497* EFWidx -0.031 -2.501* lg_openness 0.037 0.074 2.744** lg_openness 0.015 1.383 sq_coproduction -0.009 -0.008 -0.298 sq_coproduction -0.001 -0.049 goverment 0.080 0.282 4.294*** goverment 0.069 4.330*** sq_Hcd -0.060 -0.144 -3.459*** sq_Hcd -0.008 -0.342 lg_Language 0.032 0.017 0.499 lg_Language 0.412 4.997*** sq_Tcd 0.080 0.075 1.929 sq_Tcd -0.042 -0.839 sq_IVR -0.006 -0.013 -0.410 sq_IVR 0.012 0.626
0.868 136.8356*** Constant 0.675 4.683***
4 (Constant) 0.788 5.410*** Rho (AR1) 0.954 65.920*** lg_gdp 0.204 0.480 6.808*** lg_gdp 0.116 3.487*** lg_population 0.236 0.467 7.142*** lg_population 0.391 9.774*** EFWidx -0.038 -0.137 -2.666** EFWidx -0.033 -2.683** lg_openness 0.041 0.081 2.907** lg_openness 0.011 1.071 sq_coproduction -0.004 -0.003 -0.129 sq_coproduction -0.003 -0.213 goverment 0.082 0.289 4.392*** goverment 0.070 4.420*** sq_Hcd -0.055 -0.131 -3.081** sq_Hcd -0.018 -0.839 lg_Language 0.031 0.017 0.492 lg_Language 0.425 5.174*** sq_Tcd 0.065 0.062 1.495 sq_Tcd -0.012 -0.230 sq_service -0.011 -0.032 -1.037 sq_service 0.021 1.715
0.869 137.5595*** Constant 0.671 4.753***
5 (Constant) 0.713 4.853*** Rho (AR1) 0.956 67.552*** lg_gdp 0.218 0.515 7.171*** lg_gdp 0.109 3.247** lg_population 0.221 0.436 6.713*** lg_population 0.408 10.424*** EFWidx -0.033 -0.120 -2.367* EFWidx -0.033 -2.648** lg_openness 0.038 0.077 2.901** lg_openness 0.014 1.356 sq_coproduction -0.011 -0.010 -0.392 sq_coproduction 0.000 -0.010 goverment 0.076 0.266 4.098*** goverment 0.067 4.181*** sq_Hcd -0.047 -0.113 -2.588* sq_Hcd -0.016 -0.736 lg_Language 0.062 0.034 0.954 lg_Language 0.406 4.955*** sq_Tcd 0.084 0.079 2.061* sq_Tcd -0.045 -0.912 sq_taxation -0.023 -0.050 -1.825 sq_taxation 0.014 1.126
0.870 139.359*** Constant 0.704 4.960***
6 (Constant) 0.826 5.681*** Rho (AR1) 0.955 67.452*** lg_gdp 0.171 0.402 5.091*** lg_gdp 0.115 3.402*** lg_population 0.250 0.495 7.473*** lg_population 0.408 10.385*** EFWidx -0.035 -0.127 -2.525* EFWidx -0.032 -2.542* lg_openness 0.032 0.064 2.399* lg_openness 0.015 1.389 sq_coproduction -0.006 -0.005 -0.208 sq_coproduction -0.001 -0.105 goverment 0.092 0.322 4.787*** goverment 0.067 3.979*** sq_Hcd -0.059 -0.141 -3.463*** sq_Hcd -0.011 -0.526 lg_Language 0.028 0.015 0.450 lg_Language 0.415 4.937*** sq_Tcd 0.063 0.060 1.530 sq_Tcd -0.046 -0.935 lg_subsidy 0.085 0.070 2.227* lg_subsidy -0.013 -0.375
0.871 140.6584*** Constant 0.679 4.682***
7 (Constant) 0.781 5.398*** Rho (AR1) 0.952 63.111*** lg_gdp 0.199 0.469 6.578*** lg_gdp 0.109 3.312** lg_population 0.222 0.438 6.651*** lg_population 0.373 9.155***

115
EFWidx -0.035 -0.124 -2.444* EFWidx -0.035 -2.854** lg_openness 0.028 0.056 1.876 lg_openness 0.006 0.580 sq_coproduction -0.003 -0.003 -0.106 sq_coproduction 0.000 -0.003 goverment 0.082 0.289 4.412*** goverment 0.080 4.921*** sq_Hcd -0.062 -0.147 -3.561*** sq_Hcd -0.020 -0.940 lg_Language 0.019 0.011 0.306 lg_Language 0.373 4.555*** sq_Tcd 0.082 0.078 2.005* sq_Tcd -0.028 -0.578 sq_TBI 0.013 0.049 1.230 sq_TBI 0.023 2.533*
0.869 137.9091*** Constant 0.736 5.246***
8 (Constant) 0.769 5.305*** Rho (AR1) 0.953 65.340*** lg_gdp 0.207 0.487 6.708*** lg_gdp 0.112 3.360*** lg_population 0.231 0.456 7.031*** lg_population 0.404 10.169*** EFWidx -0.036 -0.129 -2.517* EFWidx -0.032 -2.605** lg_openness 0.037 0.074 2.537* lg_openness 0.014 1.263 sq_coproduction -0.007 -0.007 -0.249 sq_coproduction -0.001 -0.048 goverment 0.079 0.278 4.221*** goverment 0.071 4.383*** sq_Hcd -0.059 -0.141 -3.410*** sq_Hcd -0.012 -0.564 lg_Language 0.030 0.016 0.476 lg_Language 0.409 4.979*** sq_Tcd 0.081 0.076 1.962 sq_Tcd -0.043 -0.876 sq_TBN -0.002 -0.004 -0.110 sq_TBN 0.006 0.570
0.868 136.7115*** Constant 0.687 4.847***
9 (Constant) 0.758 5.311*** Rho (AR1) 0.976 103.451*** lg_gdp 0.234 0.552 6.702*** lg_gdp 0.146 5.010*** lg_population 0.143 0.283 3.617*** lg_population 0.301 7.824*** EFWidx -0.039 -0.140 -2.660** EFWidx -0.036 -3.419*** lg_openness 0.024 0.047 1.611 lg_openness 0.025 2.615** sq_coproduction 0.018 0.016 0.643 sq_coproduction -0.001 -0.144 goverment 0.092 0.325 4.910*** goverment 0.076 5.120*** sq_Hcd -0.018 -0.044 -0.979 sq_Hcd -0.016 -0.719 lg_Language 0.049 0.026 0.801 lg_Language 0.431 5.998*** sq_Tcd 0.046 0.044 1.127 sq_Tcd -0.038 -0.862 lg_tariff 0.178 0.063 1.866 lg_tariff 0.643 8.098*** sq_quota 0.064 0.188 5.144*** sq_quota 0.027 2.776** sq_IVR 0.034 0.067 1.975* sq_IVR -0.019 -0.885 sq_service -0.005 -0.014 -0.443 sq_service 0.020 1.795 sq_taxation -0.022 -0.048 -1.473 sq_taxation 0.009 0.691 lg_subsidy 0.011 0.009 0.278 lg_subsidy -0.032 -0.847
0.889 110.7961*** Constant 0.702 5.366***
* p<.05. **p<.01. ***<.001
Time-Series Regressions
In the long run, quota (in model 2 and model 9) remained statistically significant
in increasing national film screens, suggesting a long-lasting effect of quota in protecting

116
local film development. The coefficient between subsidy and film screen became non-
significant with the time effect, indicating that the positive effect of subsidy decreased
over the studied time period. The effect of investment restrictions also became non-
significant in model 9. Interestingly, controlled for time, tariff became a significant
(at .001 level of significance) contributor to local screen development (in model 1 and
model 9). Considering the insignificance of tariff in the preliminary regressions, it
indicated that the effect of tariff on the development of market scale was not an
immediate one. It might take time for the effect to be shown. Another TB variable that
increased its effect over time is TBI. Results showed that, during the studied time period,
increasing the quality of TB (TBI) but not the quantities of TB (TBN) would also
significantly increase film screens.
As to other social economic factors, GDP, population, and government
effectiveness index remained the strongest positive predictors of film screens and The
EFW Index remained negatively correlated with film screens. Notably, as shown by the
increased coefficients between population and the dependent variable, the impact of
population size on the development of film screens became stronger during the time
period. The OI index was significant only in model 1 and model 9, showing a limited
effect of trade factor on film screens in the long run.
Among the culture variables, only language variable was significant across the
nine models, indicating an increasing importance in language proximity on screen
development. This result coincided with the formation of worldwide cultural-language
market. The importance of Hcd on screen development became non-significant. This
might suggest that the negative effect of Hcd might be overcome in the long-run.

117
Box Office Function
Preliminary Regressions
The box office models explained around 95 percent of the box office variations.
Across all of the nine models, GDP was the most important contributing factor, with its
adjusted coefficient (β) ranging from 78 percent to 83 percent (Table 4-7). This result,
again, seemed to support the market size effect on film development.
The market structure variable in Economic Freedom (the EFW Index) had a small
positive effect on box office revenue, as shown by its significant positive coefficient with
the dependent variable. Because the EFW Index showed a negative effect on film screens
in the screen functions, it implied that those increased box office revenues may not have
come from domestic films, and the revenue was therefore not used to improve local film
screens. The OI index was not a significant factor in any of the nine models.
Another noticeable significant factor was the social cultural values from Tadesse
& White. Although the three cultural variables were all negatively correlated with box
office revenues, the effect of language factor was not significant. The cultural dimension
in Hefstede’s cultural distance was significantly correlated with box office revenues in
most models, but the coefficient was weak (at .05 level of significance). Further,
Hefstede’s cultural distance showed not significant in model 2 (with quota included) and
model 5 (with taxation included as one variable). The cultural values from Tadesse &
White (Tcd) was significant (at .001 level) in reducing box office revenues across all of
the nine models, indicating an erosion in box office performance from cultural-proximate
imports.

118
As to the six TB variables, tariff, investment restrictions, and taxation showed
negative coefficients with box office revenue, but the coefficient for tariff and taxation
were not statistically significant. Only investment restrictions (in model 3) showed a
significant impact (at .05 level) on the box office performance. Taxation barely missed
the level of significance (at .052) in model 5. Quota, subsidy, and service restrictions
showed positive correlations with box office revenue. However, the correlation between
service restriction and box office revenue was not significant in model 4, but was
significant in model 9. This indicated that service restrictions might function best when
working with other TB methods. Quota was significant (at .001 level) in contributing to
box office revenue in both model 2 and model 9. Subsidy by itself could contribute to
box office revenue (at .05 level of significance in model 6), but the effect was offset by
other negative TB factors listed above in model 9 (tariff, investment restrictions, taxation).
Therefore, subsidy becomes less effective in increasing box office revenues when all the
TB variables work together (in model 9). As to the composite TB indices, TBI showed a
positive coefficient with box office performance in model 7. TBN was also positively
correlated with box office revenue in model 8, but the coefficient was not significant.
Table 4-7: Box Office Models
Preliminary Regressions Time-Series Autoregressions
Models Variables B ß T-Value Adjusted
R2 F Variables Parameter Estimates T-value
1 (Constant) -0.174 -0.659 Rho (AR1) 0.849 27.747*** lg_tariff -0.081 -0.011 -0.530 lg_tariff -0.051 -0.268 lg_gdp 0.963 0.833 17.780*** lg_gdp 0.928 12.244*** lg_population -0.002 -0.001 -0.030 lg_population 0.024 0.264 EFWidx 0.060 0.078 2.217* EFWidx 0.052 1.794 lg_openness -0.002 -0.002 -0.085 lg_openness 0.012 0.432 sq_coproduction -0.055 -0.018 -1.070 sq_coproduction -0.041 -1.326 goverment 0.012 0.015 0.338 goverment 0.016 0.422

119
sq_Hcd -0.076 -0.066 -2.463* sq_Hcd -0.017 -0.360 lg_Language -0.036 -0.007 -0.321 lg_Language 0.200 1.120 sq_Tcd -0.375 -0.129 -5.131*** sq_Tcd -0.364 -3.272**
0.945 351.725*** Constant -0.292 -0.904
2 (Constant) -0.193 -0.789 Rho (AR1) 0.835 25.899*** sq_quota 0.087 0.093 4.517*** sq_quota 0.051 2.281 lg_gdp 0.960 0.830 18.794*** lg_gdp 0.921 12.734*** lg_population -0.059 -0.042 -1.033 lg_population -0.010 -0.121 EFWidx 0.067 0.087 2.793 EFWidx 0.046 1.610 lg_openness -0.026 -0.019 -1.118 lg_openness -0.001 -0.055 sq_coproduction -0.025 -0.008 -0.505 sq_coproduction -0.041 -1.333 goverment 0.027 0.034 0.854 goverment 0.042 1.080 sq_Hcd -0.041 -0.036 -1.353 sq_Hcd -0.015 -0.323 lg_Language -0.032 -0.006 -0.302 lg_Language 0.123 0.703 sq_Tcd -0.421 -0.145 -5.986*** sq_Tcd -0.391 -3.588***
0.950 389.797*** Constant -0.175 -0.547
3 (Constant) -0.137 -0.539 Rho (AR1) 0.848 27.725*** sq_IVR -0.056 -0.039 -2.028* sq_IVR -0.059 -1.497 lg_gdp 0.934 0.808 16.813*** lg_gdp 0.913 12.222*** lg_population 0.042 0.030 0.660 lg_population 0.066 0.720 EFWidx 0.057 0.074 2.313* EFWidx 0.048 1.679 lg_openness 0.009 0.007 0.392 lg_openness 0.012 0.457 sq_coproduction -0.070 -0.023 -1.381 sq_coproduction -0.046 -1.509 goverment 0.024 0.031 0.726 goverment 0.018 0.493 sq_Hcd -0.085 -0.074 -2.780 sq_Hcd -0.038 -0.788 lg_Language -0.020 -0.004 -0.184 lg_Language 0.191 1.076 sq_Tcd -0.381 -0.131 -5.263*** sq_Tcd -0.374 -3.377***
0.946 358.974*** Constant -0.229 -0.709
4 (Constant) -0.166 -0.640 Rho (AR1) 0.853 28.654*** sq_service 0.015 0.015 0.732 sq_service 0.024 0.858 lg_gdp 0.969 0.838 18.074*** lg_gdp 0.933 12.559*** lg_population -0.016 -0.011 -0.266 lg_population 0.002 0.023 EFWidx 0.057 0.075 2.280* EFWidx 0.052 1.784 lg_openness -0.003 -0.003 -0.142 lg_openness 0.010 0.371 sq_coproduction -0.061 -0.020 -1.193 sq_coproduction -0.042 -1.365 goverment 0.013 0.017 0.392 goverment 0.015 0.412 sq_Hcd -0.083 -0.073 -2.641** sq_Hcd -0.023 -0.490 lg_Language -0.041 -0.008 -0.362 lg_Language 0.216 1.202 sq_Tcd -0.354 -0.122 -4.577*** sq_Tcd -0.329 -2.773**
0.945 352.209*** Constant -0.316 -0.974
5 (Constant) -0.251 -0.962 Rho (AR1) 0.855 28.492*** sq_taxation -0.043 -0.035 -1.956 sq_taxation 0.016 0.572 lg_gdp 0.989 0.856 18.222*** lg_gdp 0.925 12.314*** lg_population -0.026 -0.019 -0.445 lg_population 0.020 0.229 EFWidx 0.060 0.078 2.416* EFWidx 0.051 1.759 lg_openness 0.006 0.004 0.239 lg_openness 0.014 0.545 sq_coproduction -0.065 -0.022 -1.271 sq_coproduction -0.039 -1.266 goverment 0.009 0.012 0.274 goverment 0.014 0.382 sq_Hcd -0.055 -0.048 -1.697 sq_Hcd -0.021 -0.431 lg_Language 0.022 0.004 0.189 lg_Language 0.199 1.106
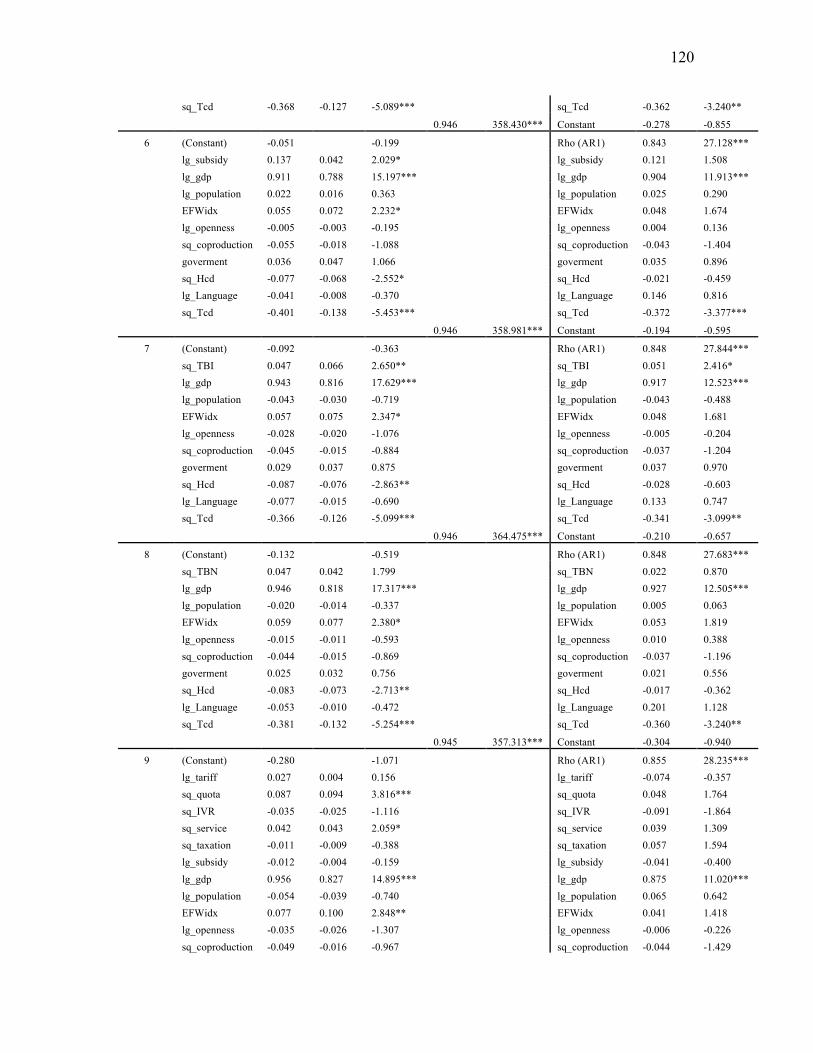
120
sq_Tcd -0.368 -0.127 -5.089*** sq_Tcd -0.362 -3.240**
0.946 358.430*** Constant -0.278 -0.855
6 (Constant) -0.051 -0.199 Rho (AR1) 0.843 27.128*** lg_subsidy 0.137 0.042 2.029* lg_subsidy 0.121 1.508 lg_gdp 0.911 0.788 15.197*** lg_gdp 0.904 11.913*** lg_population 0.022 0.016 0.363 lg_population 0.025 0.290 EFWidx 0.055 0.072 2.232* EFWidx 0.048 1.674 lg_openness -0.005 -0.003 -0.195 lg_openness 0.004 0.136 sq_coproduction -0.055 -0.018 -1.088 sq_coproduction -0.043 -1.404 goverment 0.036 0.047 1.066 goverment 0.035 0.896 sq_Hcd -0.077 -0.068 -2.552* sq_Hcd -0.021 -0.459 lg_Language -0.041 -0.008 -0.370 lg_Language 0.146 0.816 sq_Tcd -0.401 -0.138 -5.453*** sq_Tcd -0.372 -3.377***
0.946 358.981*** Constant -0.194 -0.595
7 (Constant) -0.092 -0.363 Rho (AR1) 0.848 27.844*** sq_TBI 0.047 0.066 2.650** sq_TBI 0.051 2.416* lg_gdp 0.943 0.816 17.629*** lg_gdp 0.917 12.523*** lg_population -0.043 -0.030 -0.719 lg_population -0.043 -0.488 EFWidx 0.057 0.075 2.347* EFWidx 0.048 1.681 lg_openness -0.028 -0.020 -1.076 lg_openness -0.005 -0.204 sq_coproduction -0.045 -0.015 -0.884 sq_coproduction -0.037 -1.204 goverment 0.029 0.037 0.875 goverment 0.037 0.970 sq_Hcd -0.087 -0.076 -2.863** sq_Hcd -0.028 -0.603 lg_Language -0.077 -0.015 -0.690 lg_Language 0.133 0.747 sq_Tcd -0.366 -0.126 -5.099*** sq_Tcd -0.341 -3.099**
0.946 364.475*** Constant -0.210 -0.657
8 (Constant) -0.132 -0.519 Rho (AR1) 0.848 27.683*** sq_TBN 0.047 0.042 1.799 sq_TBN 0.022 0.870 lg_gdp 0.946 0.818 17.317*** lg_gdp 0.927 12.505*** lg_population -0.020 -0.014 -0.337 lg_population 0.005 0.063 EFWidx 0.059 0.077 2.380* EFWidx 0.053 1.819 lg_openness -0.015 -0.011 -0.593 lg_openness 0.010 0.388 sq_coproduction -0.044 -0.015 -0.869 sq_coproduction -0.037 -1.196 goverment 0.025 0.032 0.756 goverment 0.021 0.556 sq_Hcd -0.083 -0.073 -2.713** sq_Hcd -0.017 -0.362 lg_Language -0.053 -0.010 -0.472 lg_Language 0.201 1.128 sq_Tcd -0.381 -0.132 -5.254*** sq_Tcd -0.360 -3.240**
0.945 357.313*** Constant -0.304 -0.940
9 (Constant) -0.280 -1.071 Rho (AR1) 0.855 28.235*** lg_tariff 0.027 0.004 0.156 lg_tariff -0.074 -0.357 sq_quota 0.087 0.094 3.816*** sq_quota 0.048 1.764 sq_IVR -0.035 -0.025 -1.116 sq_IVR -0.091 -1.864 sq_service 0.042 0.043 2.059* sq_service 0.039 1.309 sq_taxation -0.011 -0.009 -0.388 sq_taxation 0.057 1.594 lg_subsidy -0.012 -0.004 -0.159 lg_subsidy -0.041 -0.400 lg_gdp 0.956 0.827 14.895*** lg_gdp 0.875 11.020*** lg_population -0.054 -0.039 -0.740 lg_population 0.065 0.642 EFWidx 0.077 0.100 2.848** EFWidx 0.041 1.418 lg_openness -0.035 -0.026 -1.307 lg_openness -0.006 -0.226 sq_coproduction -0.049 -0.016 -0.967 sq_coproduction -0.044 -1.429

121
goverment 0.020 0.026 0.578 goverment 0.033 0.829 sq_Hcd -0.057 -0.050 -1.653 sq_Hcd -0.075 -1.356 lg_Language -0.012 -0.002 -0.105 lg_Language 0.144 0.791 sq_Tcd -0.367 -0.127 -4.863*** sq_Tcd -0.336 -2.831**
0.950 260.480*** Constant -0.104 -0.313
* p<.05. **p<.01. ***<.001
Time-Series Regressions
Auto-regression results showed that, in the long run, only GDP and cultural value
from Tadesse & White were significant in determining national box office revenue. GDP
was a positive contributor, confirming with the market size theory. Proximity in cultural
value decreased box office revenue, indicating an erosion of film market from cultural
proximate nations. In the previous regressions, quota, subsidy, and the quality composite
index of trade barriers (TBI) were all significant contributor to box office revenue.
Controlled for time, however, both quota and subsidy lost their level of significance.
Only TBI remained significant (at .05 level), indicating that increasing the overall quality
of TB still would increase box office performance. Therefore, strong enforcement of
trade barriers might lead to better domestic products, as well as better quality imports,
and, therefore, improved the financial performance of the films on screen.
Investment Function
Preliminary Regressions
The regression models (Table 4-8) explained around 88 percent to 90 percent of
the overall investment variations. Understandably, GDP was still the most remarkable
significant factor in contributing to film investment across all of the nine models. In all of
the models, the three market structure variables, the EFW Index, the OI Index, and co-

122
production rate, were all significant factors in the investment functions. Therefore, a
country with more economic freedom, international trade, as well as more international
cooperation, will introduce more investment. The GE index showed a negative
coefficient with film investment, but the coefficient was not significant.
As to the cultural variables, all of the three cultural variables showed statistically
significant effects on film investment. The cultural dimension in Hcd showed a negative
impact on investment. The cultural dimension in language closeness showed a positive
impact. The results of the two factors indicated that proximity in the Hofstede’s cultural
dimension and language seemed to attract more investment. The cultural dimensions in
Tcd, however, showed a positive coefficient with film investment. This implied that,
proximity in culture values with western countries would actually reduce the value of a
market, and therefore decrease total investment.
In the investment functions, more TB variables appeared to be significant factors.
Among the six TB variables, investment restriction (model 3), service restriction (model
4), and taxation (model 5) again showed negative coefficients with film investment, and
the correlations were all statistically significant. This was obvious, because all of the
three TB variables were restrictive in nature for local business operations, and therefore
tended to discourage film investment.
Tariff, quota, and subsidy, again, were all positively correlated with film
investment, but the coefficient for tariff was not significant. Instead, both quota and
subsidy were significant contributors (at .001 level) to film investment. The reason that
subsidy would enhance film investment was obvious. The fact that quota was also
contributing to film investment seemed to indicate that with quota restrictions in film

123
screenings and with stimulation in subsidizing local productions, foreign investors
seemed more likely to partner with local producers to produce films that qualify both for
quotas and film subsidies. However, when all the TB variables were considered in model
9, only subsidy was the significant contributor to film investment. The effect of quotas
might offset by other negative factors. The composite indices, both TBI and TBN, were
not significant in their functions.
Table 4-8: Investment Models
Preliminary Regressions Time-Series Autoregressions
Models Variables B ß T-Value Adjusted
R2 F Variables Parameter Estimates T-value
1 (Constant) -3.787 -8.148*** Rho (AR1) 0.737 16.912***
lg_tariff 0.056 0.002 0.090 lg_tariff 0.406 0.623
lg_gdp 1.199 0.881 12.695*** lg_gdp 1.270 9.269***
lg_population -0.142 -0.088 -1.344 lg_population -0.288 -1.768
EFWidx 0.217 0.243 4.384*** EFWidx 0.114 1.886
lg_openness 0.120 0.073 2.776** lg_openness 0.062 1.143
sq_coproduction 0.255 0.073 2.787** sq_coproduction 0.075 1.022
goverment -0.018 -0.019 -0.289 goverment -0.033 -0.436
sq_Hcd -0.227 -0.167 -4.183*** sq_Hcd -0.273 -3.230**
lg_Language 0.788 0.135 3.994*** lg_Language 0.638 2.029*
sq_Tcd 0.830 0.245 6.392*** sq_Tcd 0.639 3.106**
0.877 143.419*** Constant -2.546 -4.078***
2 (Constant) -3.817 -8.584*** Rho (AR1) 0.730 16.102***
sq_quota 0.142 0.131 4.128*** sq_quota 0.109 2.396*
lg_gdp 1.183 0.869 13.200*** lg_gdp 1.237 9.345***
lg_population -0.222 -0.137 -2.225* lg_population -0.306 -2.025*
EFWidx 0.230 0.257 4.844*** EFWidx 0.112 1.898
lg_openness 0.080 0.049 1.900 lg_openness 0.035 0.658
sq_coproduction 0.306 0.087 3.456*** sq_coproduction 0.081 1.119
goverment 0.010 0.010 0.164 goverment 0.025 0.335
sq_Hcd -0.169 -0.125 -3.158** sq_Hcd -0.239 -2.873**
lg_Language 0.782 0.134 4.137*** lg_Language 0.565 1.832
sq_Tcd 0.747 0.221 5.943*** sq_Tcd 0.612 3.067**
0.888 158.043*** Constant -2.512 -4.143***

124
3 (Constant) -3.799 -8.384*** Rho (AR1) 0.725 16.125***
sq_IVR -0.143 -0.090 -3.064** sq_IVR -0.120 -1.717
lg_gdp 1.099 0.807 11.346*** lg_gdp 1.188 8.633***
lg_population 0.009 0.006 0.083 lg_population -0.125 -0.759
EFWidx 0.234 0.261 4.809*** EFWidx 0.126 2.135*
lg_openness 0.133 0.081 3.162** lg_openness 0.059 1.122
sq_coproduction 0.215 0.061 2.380* sq_coproduction 0.061 0.828
goverment -0.004 -0.004 -0.068 goverment -0.018 -0.249
sq_Hcd -0.241 -0.178 -4.538*** sq_Hcd -0.300 -3.563***
lg_Language 0.829 0.142 4.292*** lg_Language 0.663 2.158*
sq_Tcd 0.795 0.235 6.267*** sq_Tcd 0.652 3.282*
0.883 151.475*** Constant -2.607 -4.298***
4 (Constant) -3.665 -7.964*** Rho (AR1) 0.727 16.287***
sq_service -0.081 -0.072 -2.387* sq_service -0.034 -0.669
lg_gdp 1.181 0.867 12.778*** lg_gdp 1.247 9.313***
lg_population -0.097 -0.060 -0.949 lg_population -0.224 -1.446
EFWidx 0.203 0.227 4.122*** EFWidx 0.120 2.009*
lg_openness 0.149 0.091 3.396*** lg_openness 0.065 1.209
sq_coproduction 0.277 0.079 3.053** sq_coproduction 0.080 1.085
goverment 0.000 0.000 0.004 goverment -0.022 -0.302
sq_Hcd -0.193 -0.143 -3.509*** sq_Hcd -0.256 -2.984**
lg_Language 0.799 0.137 4.109*** lg_Language 0.645 2.084*
sq_Tcd 0.721 0.213 5.318*** sq_Tcd 0.617 2.900**
0.881 148.306*** Constant -2.616 -4.272***
5 (Constant) -3.913 -8.502*** Rho (AR1) 0.729 16.400***
sq_taxation -0.103 -0.067 -2.390* sq_taxation -0.028 -0.483
lg_gdp 1.261 0.926 13.153*** lg_gdp 1.268 9.243***
lg_population -0.197 -0.122 -1.906 lg_population -0.258 -1.694
EFWidx 0.204 0.228 4.157*** EFWidx 0.118 1.977*
lg_openness 0.144 0.088 3.311*** lg_openness 0.061 1.133
sq_coproduction 0.222 0.063 2.428* sq_coproduction 0.073 0.978
goverment -0.008 -0.009 -0.134 goverment -0.022 -0.297
sq_Hcd -0.180 -0.133 -3.169** sq_Hcd -0.260 -3.009**
lg_Language 0.925 0.158 4.564*** lg_Language 0.667 2.125*
sq_Tcd 0.860 0.254 6.709*** sq_Tcd 0.668 3.321**
0.881 148.317*** Constant -2.668 -4.328***
6 (Constant) -3.469 -7.610*** Rho (AR1) 0.730 16.124***
lg_subsidy 0.434 0.114 3.751*** lg_subsidy 0.322 2.070*
lg_gdp 1.015 0.746 9.902*** lg_gdp 1.157 8.216***
lg_population -0.039 -0.024 -0.382 lg_population -0.199 -1.313

125
EFWidx 0.216 0.242 4.535*** EFWidx 0.117 1.975*
lg_openness 0.100 0.061 2.405* lg_openness 0.038 0.708
sq_coproduction 0.259 0.074 2.929** sq_coproduction 0.072 0.983
goverment 0.051 0.053 0.808 goverment 0.027 0.350
sq_Hcd -0.226 -0.167 -4.327*** sq_Hcd -0.270 -3.264**
lg_Language 0.770 0.132 4.045*** lg_Language 0.563 1.811
sq_Tcd 0.737 0.218 5.784*** sq_Tcd 0.632 3.163**
0.886 155.498*** Constant -2.435 -3.966***
7 (Constant) -3.786 -8.174*** Rho (AR1) 0.741 16.899***
sq_TBI -0.029 -0.035 -0.878 sq_TBI 0.025 0.592
lg_gdp 1.215 0.892 12.742*** lg_gdp 1.248 9.103***
lg_population -0.122 -0.076 -1.178 lg_population -0.277 -1.751
EFWidx 0.209 0.233 4.142*** EFWidx 0.117 1.940
lg_openness 0.142 0.087 2.861** lg_openness 0.046 0.815
sq_coproduction 0.242 0.069 2.611** sq_coproduction 0.078 1.054
goverment -0.018 -0.019 -0.294 goverment -0.020 -0.261
sq_Hcd -0.222 -0.164 -4.100*** sq_Hcd -0.276 -3.244**
lg_Language 0.811 0.139 4.083*** lg_Language 0.612 1.915
sq_Tcd 0.832 0.246 6.435*** sq_Tcd 0.662 3.240**
0.878 144.074*** Constant -2.562 -4.123***
8 (Constant) -3.731 -8.100*** Rho (AR1) 0.735 16.763***
sq_TBN -0.096 -0.072 -1.946 sq_TBN 0.006 0.117
lg_gdp 1.248 0.916 12.985*** lg_gdp 1.254 9.197***
lg_population -0.129 -0.080 -1.270 lg_population -0.253 -1.654
EFWidx 0.192 0.215 3.799*** EFWidx 0.118 1.969
lg_openness 0.163 0.099 3.405*** lg_openness 0.057 1.037
sq_coproduction 0.217 0.062 2.342* sq_coproduction 0.077 1.031
goverment -0.019 -0.020 -0.313 goverment -0.025 -0.335
sq_Hcd -0.220 -0.162 -4.086*** sq_Hcd -0.271 -3.224**
lg_Language 0.814 0.139 4.155*** lg_Language 0.643 2.049*
sq_Tcd 0.858 0.253 6.651*** sq_Tcd 0.660 3.256**
0.880 146.664*** Constant -2.616 -4.239***
9 (Constant) -3.515 -7.685*** Rho (AR1) 0.720 15.469***
lg_tariff 0.734 0.031 1.138 lg_tariff 0.575 0.793
sq_quota 0.063 0.058 1.533 sq_quota 0.059 1.054
sq_IVR -0.041 -0.026 -0.736 sq_IVR -0.072 -0.853
sq_service -0.058 -0.051 -1.571 sq_service -0.028 -0.512
sq_taxation -0.052 -0.034 -1.075 sq_taxation -0.004 -0.060
lg_subsidy 0.317 0.083 2.440* lg_subsidy 0.205 1.075
lg_gdp 1.065 0.782 9.429*** lg_gdp 1.156 7.640***

126
lg_population -0.092 -0.057 -0.723 lg_population -0.201 -1.086
EFWidx 0.207 0.231 4.201*** EFWidx 0.114 1.909
lg_openness 0.133 0.081 2.778** lg_openness 0.045 0.808
sq_coproduction 0.267 0.076 2.953** sq_coproduction 0.070 0.937
goverment 0.059 0.063 0.967 goverment 0.034 0.434
sq_Hcd -0.158 -0.117 -2.659** sq_Hcd -0.257 -2.685**
lg_Language 0.864 0.148 4.416*** lg_Language 0.562 1.806
sq_Tcd 0.639 0.189 4.735*** sq_Tcd 0.544 2.485*
0.891 109.810*** Constant -2.352 -3.762***
* p<.05. **p<.01. ***<.001
Time-Series Regressions
In the long-run and across the models, GDP remained the most important factor in
increasing production investment. The EFW index was significant (at .05 level) in some
models (model 3, 4, 5, 6), but not in all of the models. Both of the two other market
structure variables, the OI Index and the co-production rates, became non-significant in
their coefficients with film investment. These all indicated a decreased significance of
open market and trade relations in attracting investment during the eight year period. As
to the cultural variables, the cultural value factor from Tadesse & White and cultural
dimension in language remained strong predictors of film investment in all of the nine
models. The impact of culture in Hofstede’s cultural distance was also significant in most
of the models including models 1, 3, 4, 5, and model 8. Therefore, countries with culture
close to the U.S. in Hofstede’s dimension and language or with culture dissimilar with the
U.S. would attract more investment. The effects were all considerable during the studied
time period. For the TB variables, the effects of the three restrictive factors (investment
restriction, service restriction, and taxation) became non-significant. Quota and subsidy,
the two supportive TB factors that were both significant in the preliminary analyses,

127
remained significant determinants, although at a decreased level of significance (at .05
level). In model 9 where all TB variables were entered, only quota remained significant.
Spending Function
Preliminary Regressions
The models (Table 4-9) explained around 87 percent (model 1-model 8) to 91
percent (model 9) of the variations in consumer film spending. Understandably,
economic development as indicated by the gross domestic products was the most
important factor in examining consumer spending on films in all of the nine models.
People in wealthy countries have more to spend. The market structure variables in both
the Economic Freedom (the EFW Index) and trade relations (the OI Index) showed
significant positive coefficients with consumer spending in all of the nine models26,
indicating that an open market with more trade flows might enhance consumers’
willingness to pay for film entertainment. Population was positively correlated with
spending, but the correlation was only significant in models 3, 6, and model 9.
For the individual TB variables, tariff, investment restrictions, service restrictions,
and taxation all had negative coefficients with film spending, but the coefficients were
only significant for investment restrictions (at .001 level) and taxation (at .01 level). To
the contrary of common beliefs, quota and subsidy both showed strong (at .001 level
and .01 level respectively), positive and significant coefficients with film spending. The
results suggested that the restrictive method of TBs will decrease people’s willingness to
spend on films, but the supportive method of TBs might work to stimulate people’s
26 In model 9, the coefficient between the OI index and consumer spending was not significant due to some of the interactions between TB variables.

128
willingness to pay. This might also imply that people actually want to spend more when
the government provides more positive resolutions to protect local films. In model 9 with
all TB variables entered, only quota (positive) and investment restrictions (negative)
appeared to be significant factors. TBI showed a positive coefficient with consumer
spending and TBN showed negative coefficient, but none of the coefficients were
significant.
Co-production was commonly believed an efficient way to attract more audiences.
Interestingly, co-production appeared to have a significant impact in increasing film
spending only in models that had significant TB variables. For instance, in model 2 with
quota as an independent variable, in model 6 with subsidy as an independent variable,
and in model 9 with all of the six TB variables entered. This was understandable because,
in some countries, co-production was only used to overcome market restrictions with the
aim of qualifying for quota or subsidy. With the co-produced films promoted as local (for
quota and subsidy purposes), it might attract more audiences. Considering together with
the fact that co-productions showed non-significant negative relations with total box
office revenues, however, audiences might increase their spending on co-produced films,
but decrease even more their spending on local films. In either case, it does not contribute
to the overall box office revenue, confirming with the result in the Box office revenue
regressions.
As to the cultural variables, only Hcd showed a significant negative effect on film
spending. Tcd and language showed positive correlations with film spending, but the
correlations were not significant. Therefore, closeness in cultural dimensions as defined
by Hofstede might increase people’s willingness to pay for films.

129
Table 4-9: Consumer Spending
Preliminary Regressions Time-Series Autoregressions
Models Variables B ß T-Value Adjusted
R2 F Variables Parameter Estimates T-value
1 (Constant) -38.012 -5.482*** Rho (AR1) 0.913 39.420
lg_tariff -7.612 -0.064 -1.724 lg_tariff -14.539 -2.504* lg_gdp 14.068 0.775 9.243*** lg_gdp 13.262 7.499*** lg_population 2.372 0.115 1.431 lg_population 2.341 1.113 EFWidx 2.027 0.157 2.763** EFWidx 1.522 2.119* lg_openness 1.498 0.077 2.393* lg_openness 1.254 2.198* sq_coproduction 2.715 0.058 1.966 sq_coproduction 0.129 0.173 goverment -1.307 -0.106 -1.495 goverment -0.362 -0.450 sq_Hcd -2.511 -0.147 -2.970** sq_Hcd -0.174 -0.159 lg_Language 0.776 0.011 0.280 lg_Language 4.530 1.179 sq_Tcd 1.524 0.036 0.802 sq_Tcd 1.186 0.475
0.866 106.001*** Constant -36.230 -4.601***
2 (Constant) -37.728 -5.867*** Rho (AR1) 0.903 36.341*** lg_gdp 14.477 0.797 10.309*** lg_gdp 13.523 7.615*** lg_population 0.078 0.004 0.051 lg_population 0.416 0.209 EFWidx 1.935 0.150 2.998** EFWidx 1.146 1.610 lg_openness 1.208 0.062 2.109* lg_openness 1.171 1.963 sq_coproduction 3.442 0.074 2.630** sq_coproduction -0.099 -0.130 goverment -0.698 -0.057 -0.872 goverment 0.374 0.421 sq_Hcd -2.037 -0.119 -2.557* sq_Hcd -0.307 -0.280 lg_Language 0.570 0.008 0.219 lg_Language 1.990 0.504 sq_Tcd 1.059 0.025 0.596 sq_Tcd 0.255 0.101 sq_quota 2.293 0.170 4.831*** 0.882 121.9265*** sq_quota 1.054 1.817
Constant -31.103 -3.931***
3 (Constant) -35.667 -5.687*** Rho (AR1) 0.894 34.300*** lg_gdp 12.273 0.676 8.575*** lg_gdp 12.650 7.666*** lg_population 4.972 0.241 3.148** lg_population 4.448 2.216* EFWidx 1.739 0.135 2.776** EFWidx 0.981 1.477 lg_openness 2.450 0.126 4.414*** lg_openness 1.249 2.330* sq_coproduction 1.993 0.043 1.569 sq_coproduction -0.457 -0.634 goverment -0.505 -0.041 -0.643 goverment -0.055 -0.072 sq_Hcd -3.135 -0.183 -4.086*** sq_Hcd -1.909 -1.807 lg_Language 2.188 0.032 0.855 lg_Language 2.822 0.790 sq_Tcd 1.334 0.031 0.771 sq_Tcd 0.020 0.009 sq_IVR -3.686 -0.178 -5.632*** 0.887 128.4853*** sq_IVR -4.382 -5.052***
Constant -28.716 -3.916***
4 (Constant) -35.292 -5.022*** Rho (AR1) 0.915 41.123*** lg_gdp 14.529 0.800 9.623*** lg_gdp 14.223 8.033*** lg_population 1.654 0.080 1.023 lg_population -0.191 -0.091 EFWidx 1.469 0.114 2.060* EFWidx 1.193 1.666 lg_openness 1.941 0.100 3.071** lg_openness 1.351 2.349*
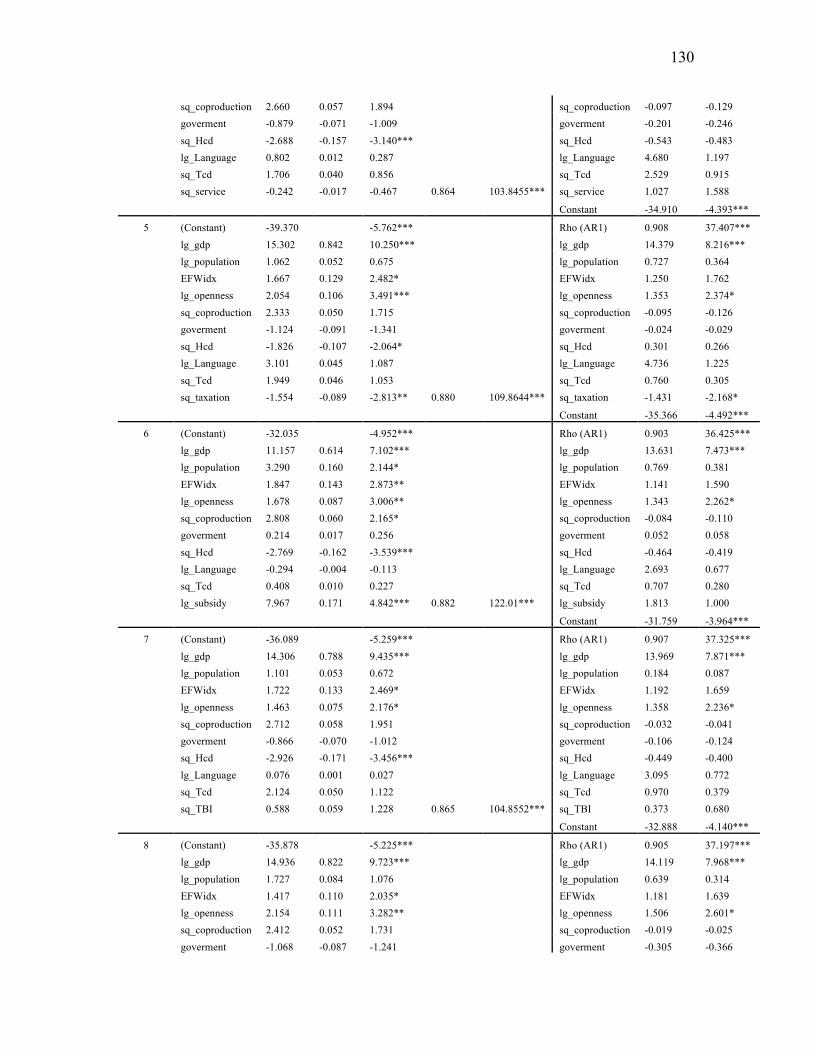
130
sq_coproduction 2.660 0.057 1.894 sq_coproduction -0.097 -0.129 goverment -0.879 -0.071 -1.009 goverment -0.201 -0.246 sq_Hcd -2.688 -0.157 -3.140*** sq_Hcd -0.543 -0.483 lg_Language 0.802 0.012 0.287 lg_Language 4.680 1.197 sq_Tcd 1.706 0.040 0.856 sq_Tcd 2.529 0.915 sq_service -0.242 -0.017 -0.467 0.864 103.8455*** sq_service 1.027 1.588
Constant -34.910 -4.393***
5 (Constant) -39.370 -5.762*** Rho (AR1) 0.908 37.407*** lg_gdp 15.302 0.842 10.250*** lg_gdp 14.379 8.216*** lg_population 1.062 0.052 0.675 lg_population 0.727 0.364 EFWidx 1.667 0.129 2.482* EFWidx 1.250 1.762 lg_openness 2.054 0.106 3.491*** lg_openness 1.353 2.374* sq_coproduction 2.333 0.050 1.715 sq_coproduction -0.095 -0.126 goverment -1.124 -0.091 -1.341 goverment -0.024 -0.029 sq_Hcd -1.826 -0.107 -2.064* sq_Hcd 0.301 0.266 lg_Language 3.101 0.045 1.087 lg_Language 4.736 1.225 sq_Tcd 1.949 0.046 1.053 sq_Tcd 0.760 0.305 sq_taxation -1.554 -0.089 -2.813** 0.880 109.8644*** sq_taxation -1.431 -2.168*
Constant -35.366 -4.492***
6 (Constant) -32.035 -4.952*** Rho (AR1) 0.903 36.425*** lg_gdp 11.157 0.614 7.102*** lg_gdp 13.631 7.473*** lg_population 3.290 0.160 2.144* lg_population 0.769 0.381 EFWidx 1.847 0.143 2.873** EFWidx 1.141 1.590 lg_openness 1.678 0.087 3.006** lg_openness 1.343 2.262* sq_coproduction 2.808 0.060 2.165* sq_coproduction -0.084 -0.110 goverment 0.214 0.017 0.256 goverment 0.052 0.058 sq_Hcd -2.769 -0.162 -3.539*** sq_Hcd -0.464 -0.419 lg_Language -0.294 -0.004 -0.113 lg_Language 2.693 0.677 sq_Tcd 0.408 0.010 0.227 sq_Tcd 0.707 0.280 lg_subsidy 7.967 0.171 4.842*** 0.882 122.01*** lg_subsidy 1.813 1.000
Constant -31.759 -3.964***
7 (Constant) -36.089 -5.259*** Rho (AR1) 0.907 37.325*** lg_gdp 14.306 0.788 9.435*** lg_gdp 13.969 7.871*** lg_population 1.101 0.053 0.672 lg_population 0.184 0.087 EFWidx 1.722 0.133 2.469* EFWidx 1.192 1.659 lg_openness 1.463 0.075 2.176* lg_openness 1.358 2.236* sq_coproduction 2.712 0.058 1.951 sq_coproduction -0.032 -0.041 goverment -0.866 -0.070 -1.012 goverment -0.106 -0.124 sq_Hcd -2.926 -0.171 -3.456*** sq_Hcd -0.449 -0.400 lg_Language 0.076 0.001 0.027 lg_Language 3.095 0.772 sq_Tcd 2.124 0.050 1.122 sq_Tcd 0.970 0.379 sq_TBI 0.588 0.059 1.228 0.865 104.8552*** sq_TBI 0.373 0.680
Constant -32.888 -4.140***
8 (Constant) -35.878 -5.225*** Rho (AR1) 0.905 37.197*** lg_gdp 14.936 0.822 9.723*** lg_gdp 14.119 7.968*** lg_population 1.727 0.084 1.076 lg_population 0.639 0.314 EFWidx 1.417 0.110 2.035* EFWidx 1.181 1.639 lg_openness 2.154 0.111 3.282** lg_openness 1.506 2.601* sq_coproduction 2.412 0.052 1.731 sq_coproduction -0.019 -0.025 goverment -1.068 -0.087 -1.241 goverment -0.305 -0.366

131
sq_Hcd -2.630 -0.154 -3.111*** sq_Hcd -0.343 -0.309 lg_Language 1.205 0.017 0.428 lg_Language 3.686 0.947 sq_Tcd 2.123 0.050 1.121 sq_Tcd 0.662 0.261 sq_TBN -0.792 -0.049 -1.124 0.865 104.6636*** sq_TBN -0.114 -0.206
Constant -33.148 -4.175***
9 (Constant) -38.759 -6.106*** Rho (AR1) 0.929 46.456*** lg_gdp 10.134 0.558 6.286*** lg_gdp 12.129 7.309*** lg_population 5.480 0.266 3.099** lg_population 5.279 2.487* EFWidx 2.940 0.228 4.244*** EFWidx 1.200 1.850 lg_openness 1.115 0.058 1.773 lg_openness 0.686 1.274 sq_coproduction 2.487 0.054 2.027* sq_coproduction -0.491 -0.730 goverment -0.512 -0.042 -0.623 goverment -0.306 -0.370 sq_Hcd -3.141 -0.183 -3.817*** sq_Hcd -3.041 -2.613*** lg_Language 0.480 0.007 0.189 lg_Language 6.101 1.679 sq_Tcd 0.851 0.020 0.488 sq_Tcd 4.535 1.826 lg_tariff -8.507 -0.071 -1.879 lg_tariff -18.632 -3.178** sq_quota 1.349 0.100 2.589* sq_quota 0.705 0.990 sq_IVR -3.646 -0.176 -4.703*** sq_IVR -5.995 -5.579*** sq_service 1.039 0.073 2.066* sq_service 2.594 4.183*** sq_taxation 0.645 0.037 1.032 sq_taxation 0.943 1.222 lg_subsidy 3.330 0.071 1.883 0.901 99.64125*** lg_subsidy -3.778 -1.627
Constant -34.298 -4.668***
* p<.05. **p<.01. ***<.001
Time-Series Regressions
Controlled for time, gross domestic products (GDP) was still the most significant
determinant for film spending. People are willing to spend on entertainment only when
they have enough to spare on necessity products. Another factor that showed consistent
significance was the market structure variable in trade relations (the OI Index). The OI
Index showed positive coefficient with consumer spending across the models. The market
variable in economic freedom (the EFW Index) showed positive coefficients only in
model 1 where tariff was included as an independent variable. Considering the significant
contribution of EFW Index in the preliminary regression, it indicated that
commercialization and privatization did have significant contribution to consumer
spending, however, the significance decreased greatly over the studied period of time.

132
The negative impact of cultural variable in Hcd was not significant except in model 9,
indicating a reduced significance of cultural distance.
As to the TB variables, the significant restrictive TB variables in the preliminary
analyses, investment restriction and taxation, remained significant. This indicated that the
negative impacts of the above two TB variables on consumer spending was long-lasting.
The supportive TB factors, quota and subsidy, however, became non-significant in their
positive contributions to film spending during the eight year period. Therefore, the
positive effects of quota and subsidy on film spending were only for short-term.
Interestingly, the negative coefficient between tariff and film spending that was
not significant in the preliminary regression (model 1), but became statistically
significant when controlled for time. This suggested that the negative impact of tariff on
consumers might not be felt in the beginning, but revealed in the long-run.
Admission Function
Preliminary Regressions
The admission models in Table 4-10 explained 82.7 percent to 84.3 percent of the
film admission variations. The strong coefficient between population and film admissions
was obvious and reasonable in the models. The positive contribution of gross domestic
product (GDP) in helping with film admission was consistent with its effect on film
spending. The significance of GDP and population again confirmed with the effect of
market size on the film industry. Another factor that was significant across the nine
models was the government efficiency index (the GE index). This suggested that
government played an important role in regulating the market. The overall effectiveness
of government in handling and reinforcing regulations provides a positive market image

133
for consumers, and therefore boosts consumer confidence in consumption. Also, people
in a well-regulated market might be more likely to consume films through regular
channels.
None of the three market structure variables showed significant coefficients with
film admission. As to the cultural variables, both language and the cultural dimension
from Tadesse & White were significant in examining film admissions. Language
proximity showed a consistent positive effect on film admission, indicating the popularity
of English language and the importance of cultural-language market. Cultural distance in
social economic values (Tcd) showed consistent negative effect on film admission. This
again indicated market erosion from cultural proximate countries.
Among the six TB variables, only quota (model 2 and 9) and investment
restrictions (model 3) showed significant coefficients with film admission. Quota was a
positive contributor (at .01 level), and investment restriction (at .05 level) was a negative
factor. None of the quality and quantity TB indices (TBI and TBN) showed significant
impacts on audience admission.
Table 4-10: Admission Models
Preliminary Regressions Time-Series Autoregressions
Models Variables B ß T-Value Adjusted
R2 F Variables Parameter Estimates T-value
1 (Constant) 0.234 0.746 Rho (AR1) 0.883 32.346*** lg_gdp 0.289 0.295 4.816*** lg_gdp 0.089 1.009 lg_population 0.713 0.602 10.370*** lg_population 0.856 7.976*** EFWidx -0.008 -0.011 -0.261 EFWidx -0.037 -1.029 lg_openness -0.013 -0.011 -0.492 lg_openness 0.035 1.189 sq_coproduction -0.019 -0.007 -0.331 sq_coproduction -0.003 -0.086 goverment 0.121 0.166 3.133** goverment 0.158 3.622*** sq_Hcd -0.060 -0.060 -1.774 sq_Hcd 0.010 0.181 lg_Language 0.260 0.061 2.143* lg_Language 0.428 2.080* sq_Tcd -0.504 -0.206 -6.086*** sq_Tcd -0.738 -5.754*** lg_tariff 0.111 0.017 0.645 lg_tariff 0.488 2.191*
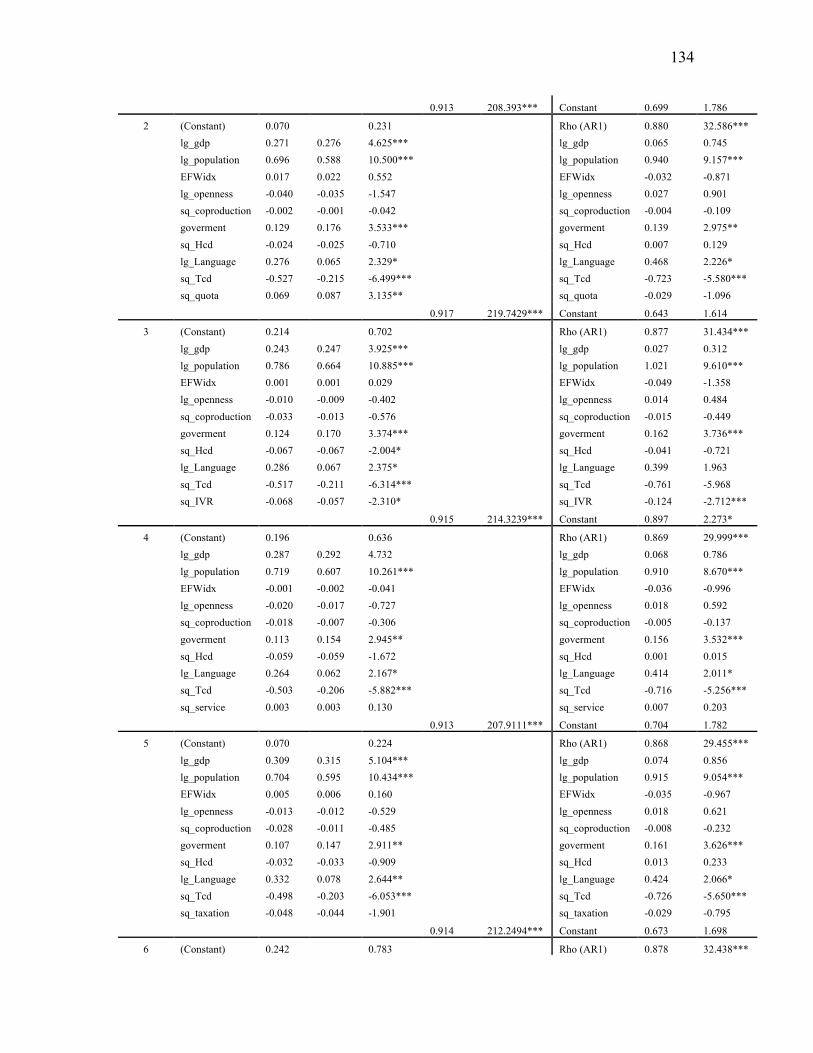
134
0.913 208.393*** Constant 0.699 1.786
2 (Constant) 0.070 0.231 Rho (AR1) 0.880 32.586*** lg_gdp 0.271 0.276 4.625*** lg_gdp 0.065 0.745 lg_population 0.696 0.588 10.500*** lg_population 0.940 9.157*** EFWidx 0.017 0.022 0.552 EFWidx -0.032 -0.871 lg_openness -0.040 -0.035 -1.547 lg_openness 0.027 0.901 sq_coproduction -0.002 -0.001 -0.042 sq_coproduction -0.004 -0.109 goverment 0.129 0.176 3.533*** goverment 0.139 2.975** sq_Hcd -0.024 -0.025 -0.710 sq_Hcd 0.007 0.129 lg_Language 0.276 0.065 2.329* lg_Language 0.468 2.226* sq_Tcd -0.527 -0.215 -6.499*** sq_Tcd -0.723 -5.580*** sq_quota 0.069 0.087 3.135** sq_quota -0.029 -1.096
0.917 219.7429*** Constant 0.643 1.614
3 (Constant) 0.214 0.702 Rho (AR1) 0.877 31.434*** lg_gdp 0.243 0.247 3.925*** lg_gdp 0.027 0.312 lg_population 0.786 0.664 10.885*** lg_population 1.021 9.610*** EFWidx 0.001 0.001 0.029 EFWidx -0.049 -1.358 lg_openness -0.010 -0.009 -0.402 lg_openness 0.014 0.484 sq_coproduction -0.033 -0.013 -0.576 sq_coproduction -0.015 -0.449 goverment 0.124 0.170 3.374*** goverment 0.162 3.736*** sq_Hcd -0.067 -0.067 -2.004* sq_Hcd -0.041 -0.721 lg_Language 0.286 0.067 2.375* lg_Language 0.399 1.963 sq_Tcd -0.517 -0.211 -6.314*** sq_Tcd -0.761 -5.968 sq_IVR -0.068 -0.057 -2.310* sq_IVR -0.124 -2.712***
0.915 214.3239*** Constant 0.897 2.273*
4 (Constant) 0.196 0.636 Rho (AR1) 0.869 29.999*** lg_gdp 0.287 0.292 4.732 lg_gdp 0.068 0.786 lg_population 0.719 0.607 10.261*** lg_population 0.910 8.670*** EFWidx -0.001 -0.002 -0.041 EFWidx -0.036 -0.996 lg_openness -0.020 -0.017 -0.727 lg_openness 0.018 0.592 sq_coproduction -0.018 -0.007 -0.306 sq_coproduction -0.005 -0.137 goverment 0.113 0.154 2.945** goverment 0.156 3.532*** sq_Hcd -0.059 -0.059 -1.672 sq_Hcd 0.001 0.015 lg_Language 0.264 0.062 2.167* lg_Language 0.414 2.011* sq_Tcd -0.503 -0.206 -5.882*** sq_Tcd -0.716 -5.256*** sq_service 0.003 0.003 0.130 sq_service 0.007 0.203
0.913 207.9111*** Constant 0.704 1.782
5 (Constant) 0.070 0.224 Rho (AR1) 0.868 29.455*** lg_gdp 0.309 0.315 5.104*** lg_gdp 0.074 0.856 lg_population 0.704 0.595 10.434*** lg_population 0.915 9.054*** EFWidx 0.005 0.006 0.160 EFWidx -0.035 -0.967 lg_openness -0.013 -0.012 -0.529 lg_openness 0.018 0.621 sq_coproduction -0.028 -0.011 -0.485 sq_coproduction -0.008 -0.232 goverment 0.107 0.147 2.911** goverment 0.161 3.626*** sq_Hcd -0.032 -0.033 -0.909 sq_Hcd 0.013 0.233 lg_Language 0.332 0.078 2.644** lg_Language 0.424 2.066* sq_Tcd -0.498 -0.203 -6.053*** sq_Tcd -0.726 -5.650*** sq_taxation -0.048 -0.044 -1.901 sq_taxation -0.029 -0.795
0.914 212.2494*** Constant 0.673 1.698
6 (Constant) 0.242 0.783 Rho (AR1) 0.878 32.438***

135
lg_gdp 0.242 0.246 3.561*** lg_gdp 0.080 0.893 lg_population 0.748 0.632 10.686*** lg_population 0.920 9.009*** EFWidx 0.001 0.002 0.038 EFWidx -0.032 -0.885 lg_openness -0.023 -0.020 -0.915 lg_openness 0.027 0.896 sq_coproduction -0.019 -0.007 -0.323 sq_coproduction -0.003 -0.081 goverment 0.130 0.178 3.354*** goverment 0.140 2.987*** sq_Hcd -0.056 -0.057 -1.684 sq_Hcd 0.010 0.180 lg_Language 0.264 0.062 2.185* lg_Language 0.466 2.212* sq_Tcd -0.522 -0.213 -6.265*** sq_Tcd -0.728 -5.637*** lg_subsidy 0.102 0.036 1.347 lg_subsidy -0.100 -1.005
0.913 210.0795*** Constant 0.629 1.566
7 (Constant) 0.224 0.728 Rho (AR1) 0.875 31.049*** lg_gdp 0.272 0.277 4.497*** lg_gdp 0.065 0.744 lg_population 0.702 0.593 10.224*** lg_population 0.949 8.885*** EFWidx 0.001 0.001 0.031 EFWidx -0.034 -0.926 lg_openness -0.037 -0.032 -1.284 lg_openness 0.027 0.866 sq_coproduction -0.010 -0.004 -0.165 sq_coproduction -0.006 -0.162 goverment 0.120 0.164 3.230** goverment 0.149 3.285** sq_Hcd -0.062 -0.063 -1.860 sq_Hcd 0.011 0.194 lg_Language 0.242 0.057 1.983* lg_Language 0.448 2.143* sq_Tcd -0.503 -0.206 -6.098*** sq_Tcd -0.740 -5.703*** sq_TBI 0.027 0.045 1.368 sq_TBI -0.021 -0.809
0.914 210.1456*** Constant 0.670 1.688
8 (Constant) 0.194 0.631 Rho (AR1) 0.878 31.758*** lg_gdp 0.273 0.278 4.434*** lg_gdp 0.066 0.754 lg_population 0.717 0.606 10.620*** lg_population 0.947 9.217*** EFWidx 0.002 0.003 0.073 EFWidx -0.038 -1.045 lg_openness -0.028 -0.025 -1.022 lg_openness 0.025 0.835 sq_coproduction -0.010 -0.004 -0.179 sq_coproduction -0.011 -0.302 goverment 0.119 0.162 3.172** goverment 0.147 3.316** sq_Hcd -0.060 -0.060 -1.782 sq_Hcd 0.006 0.114 lg_Language 0.257 0.060 2.113* lg_Language 0.417 2.021* sq_Tcd -0.510 -0.208 -6.158*** sq_Tcd -0.743 -5.757*** sq_TBN 0.026 0.027 0.886 sq_TBN -0.041 -1.418
0.913 208.8363*** Constant 0.741 1.877
9 (Constant) 0.122 0.385 Rho (AR1) 0.936 52.754*** lg_tariff 0.277 0.042 1.385 lg_gdp 0.048 0.540 sq_quota 0.059 0.074 2.265* lg_population 1.048 8.984*** sq_IVR -0.041 -0.034 -1.140 EFWidx -0.055 -1.544 sq_service 0.023 0.026 0.946 lg_openness 0.042 1.409 sq_taxation -0.031 -0.029 -0.959 sq_coproduction -0.021 -0.658 lg_subsidy -0.001 0.000 -0.011 goverment 0.105 2.254* lg_gdp 0.282 0.288 3.851*** sq_Hcd -0.073 -1.073 lg_population 0.686 0.580 8.307*** lg_Language 0.655 2.997** EFWidx 0.002 0.003 0.065 sq_Tcd -0.741 -5.496*** lg_openness -0.025 -0.022 -0.800 lg_tariff 0.621 2.599* sq_coproduction -0.029 -0.011 -0.505 sq_quota -0.052 -1.689 goverment 0.137 0.187 3.276** sq_IVR -0.252 -3.935*** sq_Hcd -0.035 -0.035 -0.876 sq_service 0.061 1.728 lg_Language 0.316 0.074 2.532* sq_taxation 0.021 0.430

136
sq_Tcd -0.498 -0.204 -5.883*** lg_subsidy -0.126 -1.084
0.917 147.277*** Constant 0.833 2.050*
* p<.05. **p<.01. ***<.001
Time-Series Regressions
Controlled for time, population became the most important factor in determining
audience admission. GDP, however, lost its significant impact. Considering the previous
finding that GDP was strongly associated with consumer spending, it suggested audience
admission might be affected by factors other than economic consideration.
Government Effectiveness (GE) Index remained a strong predictor of film
admission, indicating a long-lasting effect of overall regulatory environment on film
consumptions. Language and cultural proximity in Tadesse remained positive
contributors to film admission.
Interestingly, over the time, tariff became a significant positive contributor of film
admission (at .05 level of significance in both model 1 and model 9). This might occur
because tariff acts as a screening window that only allow films that promise to attract
more audience or films that showed box office successes to enter. Or, considering the
negative effect of tariff on spending, with less foreign films entered that are often more
expensive, it seems that audiences tend to spend more on less-expensive local films.
During the studied time period, the significant effect of quota in increasing film
admissions was lost. Within the time period, investment restrictions remained significant
negative factors of film admissions (model 3 and model 9). Again, none of the TBI and
TBN showed significant impacts on film admission controlled for time, the direction of
the coefficients with film admission, however, changed from positive to be negative.

137
Therefore, the long-term effect on increasing TB quality or quantity might have the
potential of decreasing audience admission, but the impact was not significant for the
studied time period.
HHI Function
Preliminary Regressions
The models explained around 61 percent (model 1 to model 8) to 78 percent of
the HHI variations. The results were presented in Table4-11.
Surprisingly, gross domestic product (GDP) appeared a negative determinant of
film diversity across all the HHI models. It meant that economically developed countries
actually have less film diversity. This confirmed that economic developed markets tend
to have more commercialized but homogeneous products. The market structure variable
in both economic freedom (the EFW index) and trade relations (the OI index) showed
significant positive coefficients with film diversity. It implied that more open markets
turned out to be more diverse in film imports. But only the EFW index appeared to be
significant determinant of HHI. The OI index was only significant in model 3 with the
investment restriction as an independent variable, and in model 9 with all of the TB
variables entered as independent variables. Market structure variable in co-production
was negatively correlated with film diversity and, except for model 3 and model 9, the
correlation was significant. It was reasonable that countries that have co-production
treaties have favorable policies toward each other on film imports. That, in turn,
decreases the diversity of films that are entered into the partners’ market.
Government Efficiency Index was another strong significant determinant across
all models, next to gross domestic product. Interestingly, the GE index also showed a

138
negative coefficient with HHI. It meant that countries with a more efficient government
also turned out to have less film diversity. This might because of strong government
control on film imports.
As to the TB variables, all of the six TB variables showed positive coefficients
with film diversity, except for taxation and subsidy. Higher taxation might discourage
imports from certain sources. Subsidy encouraged local production and might
discouraged imports also. However, the coefficients for tariff (model 1), and service
restrictions (model 4) were not significant. Therefore, their impacts on films were
considerably small. Only the coefficients for quota (model 2 and model 9) and investment
restriction (model 3 and model 9) were significant. The coefficient between TBI and film
diversity was also significant and the direction was positive (model 7). Therefore, the
overall effect of improving the quality of trade barriers was positive in enhancing the
diversity of film consumption.
None of the three cultural variables showed serious impacts on film diversity. The
cultural variable in language showed a positive significant impact in model 3 with
investment restriction as one independent variable, and in model 9 with all TB variables
entered, but the effect was mostly non-significant in all of the other models. Cultural
distance in Hofstede’s dimension showed a positive coefficient with film diversity, and
the cultural dimension from Tadesse & White showed negative coefficient with HHI.
This again reflected the different functions of the business aspect of culture and social
value aspect of culture in affecting import diversity. However, none of the coefficients
was significant.

139
Table 4-11: HHI Models
Preliminary Regressions Time-Series Autoregressions
Models Variables B ß T-Value Adjusted
R2 F Variables Parameter Estimates T-value
1 (Constant) 2754.250 1.521 Rho (AR1) 0.989 147.570*** lg_tariff 500.785 0.041 0.572 lg_tariff -1253.517 -2.336* lg_gdp -1339.226 -0.664 -3.588*** lg_gdp -295.498 -1.416 lg_population 784.962 0.319 1.688 lg_population -43.188 -0.168 EFWidx 787.780 0.456 4.161*** EFWidx 144.211 1.724 lg_openness 208.291 0.082 1.335 lg_openness 79.247 1.168 sq_coproduction -758.267 -0.148 -2.498* sq_coproduction -1.441 -0.022 goverment -936.059 -0.615 -4.427*** goverment -654.072 -6.428*** sq_Hcd 37.581 0.016 0.193 sq_Hcd 698.914 4.063*** lg_Language 992.090 0.103 1.410 lg_Language 3528.263 5.364*** sq_Tcd -693.530 -0.130 -1.578 sq_Tcd 467.491 1.210
0.579 21.634*** Constant 2698.378 2.287*
2 (Constant) 1950.809 1.114 Rho (AR1) 0.991 153.376*** sq_quota 415.162 0.251 3.058** sq_quota 291.458 4.138*** lg_gdp -1472.445 -0.730 -4.069** lg_gdp -396.846 -1.959 lg_population 725.257 0.295 1.621 lg_population -236.677 -0.977 EFWidx 888.027 0.513 5.057*** EFWidx 164.894 2.066* lg_openness -117.002 -0.046 -0.692 lg_openness 71.416 1.123 sq_coproduction -709.503 -0.139 -2.418* sq_coproduction -18.072 -0.285 goverment -859.665 -0.565 -4.320*** goverment -480.818 -4.568*** sq_Hcd 272.168 0.119 1.368 sq_Hcd 691.796 4.187*** lg_Language 1229.986 0.128 1.791 lg_Language 2913.171 4.490*** sq_Tcd -591.164 -0.111 -1.390 sq_Tcd 749.824 2.001*
0.604 23.925*** Constant 2681.227 2.293*
3 (Constant) 871.144 0.556 Rho (AR1) 0.988 134.107*** sq_IVR 1220.863 0.412 6.960*** sq_IVR 495.022 2.492* lg_gdp -806.624 -0.400 -2.443* lg_gdp -128.674 -0.611 lg_population 12.148 0.005 0.029 lg_population -434.326 -1.581 EFWidx 875.306 0.506 5.635*** EFWidx 185.405 2.218* lg_openness 363.230 0.143 2.854** lg_openness 131.324 2.026* sq_coproduction -136.763 -0.027 -0.497 sq_coproduction 34.689 0.517 goverment -1095.616 -0.720 -6.261*** goverment -618.612 -6.054*** sq_Hcd 131.403 0.057 0.792 sq_Hcd 827.664 4.591*** lg_Language 1655.926 0.173 2.694** lg_Language 4071.978 5.864*** sq_Tcd -645.036 -0.121 -1.712 sq_Tcd 250.456 0.626
0.687 33.853*** Constant 2041.493 1.776
4 (Constant) 2443.482 1.368 Rho (AR1) 0.990 150.162*** sq_service 215.001 0.090 1.441 sq_service -69.177 -0.549 lg_gdp -1373.277 -0.681 -3.719*** lg_gdp -215.379 -1.016 lg_population 759.642 0.309 1.653 lg_population -142.032 -0.548 EFWidx 856.621 0.495 4.751*** EFWidx 164.201 1.940 lg_openness 154.052 0.060 1.071 lg_openness 132.013 1.978* sq_coproduction -763.764 -0.149 -2.538* sq_coproduction 5.585 0.083 goverment -1010.438 -0.664 -4.997*** goverment -674.952 -5.738*** sq_Hcd -11.159 -0.005 -0.057 sq_Hcd 748.107 3.748***
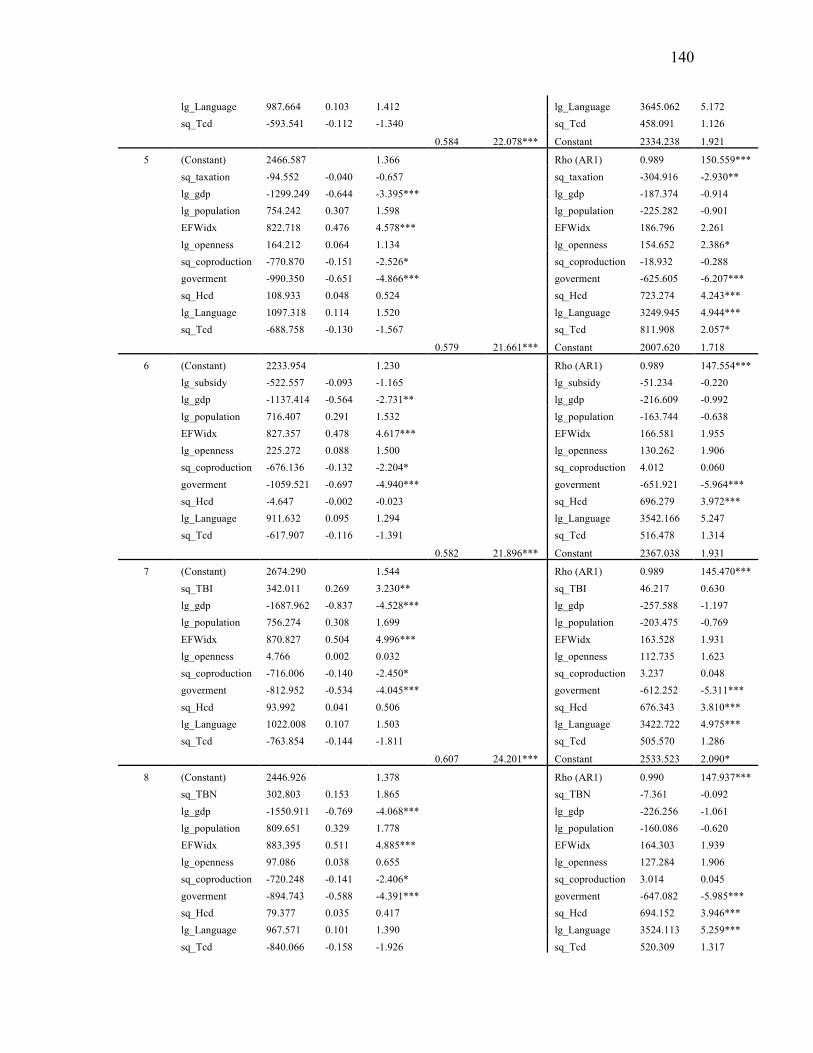
140
lg_Language 987.664 0.103 1.412 lg_Language 3645.062 5.172 sq_Tcd -593.541 -0.112 -1.340 sq_Tcd 458.091 1.126
0.584 22.078*** Constant 2334.238 1.921
5 (Constant) 2466.587 1.366 Rho (AR1) 0.989 150.559*** sq_taxation -94.552 -0.040 -0.657 sq_taxation -304.916 -2.930** lg_gdp -1299.249 -0.644 -3.395*** lg_gdp -187.374 -0.914 lg_population 754.242 0.307 1.598 lg_population -225.282 -0.901 EFWidx 822.718 0.476 4.578*** EFWidx 186.796 2.261 lg_openness 164.212 0.064 1.134 lg_openness 154.652 2.386* sq_coproduction -770.870 -0.151 -2.526* sq_coproduction -18.932 -0.288 goverment -990.350 -0.651 -4.866*** goverment -625.605 -6.207*** sq_Hcd 108.933 0.048 0.524 sq_Hcd 723.274 4.243*** lg_Language 1097.318 0.114 1.520 lg_Language 3249.945 4.944*** sq_Tcd -688.758 -0.130 -1.567 sq_Tcd 811.908 2.057*
0.579 21.661*** Constant 2007.620 1.718
6 (Constant) 2233.954 1.230 Rho (AR1) 0.989 147.554*** lg_subsidy -522.557 -0.093 -1.165 lg_subsidy -51.234 -0.220 lg_gdp -1137.414 -0.564 -2.731** lg_gdp -216.609 -0.992 lg_population 716.407 0.291 1.532 lg_population -163.744 -0.638 EFWidx 827.357 0.478 4.617*** EFWidx 166.581 1.955 lg_openness 225.272 0.088 1.500 lg_openness 130.262 1.906 sq_coproduction -676.136 -0.132 -2.204* sq_coproduction 4.012 0.060 goverment -1059.521 -0.697 -4.940*** goverment -651.921 -5.964*** sq_Hcd -4.647 -0.002 -0.023 sq_Hcd 696.279 3.972*** lg_Language 911.632 0.095 1.294 lg_Language 3542.166 5.247 sq_Tcd -617.907 -0.116 -1.391 sq_Tcd 516.478 1.314
0.582 21.896*** Constant 2367.038 1.931
7 (Constant) 2674.290 1.544 Rho (AR1) 0.989 145.470*** sq_TBI 342.011 0.269 3.230** sq_TBI 46.217 0.630 lg_gdp -1687.962 -0.837 -4.528*** lg_gdp -257.588 -1.197 lg_population 756.274 0.308 1.699 lg_population -203.475 -0.769 EFWidx 870.827 0.504 4.996*** EFWidx 163.528 1.931 lg_openness 4.766 0.002 0.032 lg_openness 112.735 1.623 sq_coproduction -716.006 -0.140 -2.450* sq_coproduction 3.237 0.048 goverment -812.952 -0.534 -4.045*** goverment -612.252 -5.311*** sq_Hcd 93.992 0.041 0.506 sq_Hcd 676.343 3.810*** lg_Language 1022.008 0.107 1.503 lg_Language 3422.722 4.975*** sq_Tcd -763.854 -0.144 -1.811 sq_Tcd 505.570 1.286
0.607 24.201*** Constant 2533.523 2.090*
8 (Constant) 2446.926 1.378 Rho (AR1) 0.990 147.937*** sq_TBN 302.803 0.153 1.865 sq_TBN -7.361 -0.092 lg_gdp -1550.911 -0.769 -4.068*** lg_gdp -226.256 -1.061 lg_population 809.651 0.329 1.778 lg_population -160.086 -0.620 EFWidx 883.395 0.511 4.885*** EFWidx 164.303 1.939 lg_openness 97.086 0.038 0.655 lg_openness 127.284 1.906 sq_coproduction -720.248 -0.141 -2.406* sq_coproduction 3.014 0.045 goverment -894.743 -0.588 -4.391*** goverment -647.082 -5.985*** sq_Hcd 79.377 0.035 0.417 sq_Hcd 694.152 3.946*** lg_Language 967.571 0.101 1.390 lg_Language 3524.113 5.259*** sq_Tcd -840.066 -0.158 -1.926 sq_Tcd 520.309 1.317

141
0.588 22.434*** Constant 2412.019 1.996*
9 (Constant) -85.544 -0.059 Rho (AR1) 0.989 141.930*** lg_tariff 4153.873 0.342 4.581*** lg_tariff -616.314 -1.108 sq_quota 493.750 0.299 4.180*** sq_quota 372.849 3.578*** sq_IVR 1488.132 0.502 8.420*** sq_IVR 620.114 3.244** sq_service -18.968 -0.008 -0.153 sq_service -217.747 -1.593 sq_taxation -393.262 -0.167 -2.706** sq_taxation -111.034 -0.890 lg_subsidy -568.708 -0.102 -1.488 lg_subsidy -461.338 -1.318 lg_gdp -147.029 -0.073 -0.412 lg_gdp -175.730 -0.890 lg_population -995.202 -0.405 -2.357* lg_population -503.768 -1.946 EFWidx 690.631 0.399 4.529*** EFWidx 206.557 2.684** lg_openness 360.144 0.141 2.392* lg_openness 102.105 1.611 sq_coproduction -125.789 -0.025 -0.495 sq_coproduction 16.400 0.268 goverment -854.590 -0.562 -4.832*** goverment -567.083 -5.084*** sq_Hcd 412.901 0.180 2.328* sq_Hcd 1043.763 5.162*** lg_Language 2457.349 0.256 4.211*** lg_Language 3883.478 5.605*** sq_Tcd 26.421 0.005 0.071 sq_Tcd 377.056 0.944
0.750 31.034*** Constant 1602.006 1.476
* p<.05. **p<.01. ***<.001
Time-Series Regressions
Over the studied time period, the negative effect of an efficient government (the
GE Index) on HHI remained significant across the 9 models. However, the effects of both
gross domestic product (GDP) and co-production became non-significant. The
significance of market structure variables in EFW index was also reduced. The
coefficient between the EFW index and film diversity was only significant in models 2, 3,
4, 5, and model 9, at a reduced level (.05 level of significance). To the contrary, the
significance of market structure variable in trade relation (the OI index) became a little
stronger. Its impact was significant in model 3, model 4, and model 5. The negative
impact of co-production on film diversity also became non-significant when considering
the time effect. As to the TB variables, quota and investment restrictions remained
significant and positive on their coefficients with the dependent variables (in model 2,
model 3 and model 9), implying positive effects of these two variables in maintaining
142
local productions. Interestingly, tariff and taxation, which all showed no significant
coefficients with film diversity, showed significant negative impacts on HHI (in model 1
at .001 level of significance and in model 5 at .01 level of significance, respectively).
The effect of cultural variables became more significant with time, especially for
Hefstede’s cultural dimension. Hefstede’s cultural dimension showed positive
coefficients with film diversity and its impact was significant (at .001 level of
significance) in all of the nine models. This implied that cultural closeness in Hofstede’s
dimension might result in more culture erosion and a decrease in diversity. Language,
however, showed positive impact on diversity and the impact was significant in most
models (at .001 level of significance), except in model 4 (with service restriction) and
model 6 (with subsidy).
In addition, the effect of cultural dimension in Tadesse & White on film diversity
was significant in the quota model (model 2), and the taxation model (model 5). This
seemed to indicate that the impact of Tadesse’s cultural dimension was only serious when
certain trade barriers were applied, such as quota and taxation. That is, when quota and
taxation were applied, importers tended to import films from more diverse sources in
order to satisfy the TB criteria. Overall, cultural variables and GE index became strong
indicators on film import diversity.
Piracy Function
Preliminary Regressions
The piracy models added more independent variables (Table 4-12). Among them
were education, population median age, cinema index, and degree in IP protection. These
were all believed to have significant impacts on film piracy. The models explained

143
around 75 percent to 77 percent of the piracy variations. Across the nine models, the
regulation variable in government efficiency (the GE index) appeared to be a strong
negative predictor of film piracy (at .001 level of significance). This indicated that the
efficiency of government in reinforcing regulations actually work to decrease piracy
activities. The effect of IP protection (the EFWip index) was significant (at .05 level)
except for the tariff model and the quota model (model 1 and model 2), but the
coefficients were positive. This implied that the government efficiency in providing an
overall regulatory environment might help to reduce piracies.
Another strong predictor of film piracy was the median age of population
(significant at .001 level of significance). The result showed that countries with younger
populations tended to have more piracy activities in film. This was reasonable, because
movie-going was more of an activity for younger people. And younger people also
tended to have less income and more information and technological sources for piracy
compared with people of older age.
The market variable in Economic Freedom was a moderate positive predictor
(at .01 level of significance) of film piracy. An open economy had more information flow,
which might increase the chances for exchange of information and pirated products
publicly.
Culture showed relative weak impacts on film piracy (at .05 level of significance).
Among the three cultural variables, the most significant one was the cultural dimension in
langue. Language showed negative impact on piracy in all of the nine models
The cultural dimension from Tadesse & White showed a positive impact on film
piracy, except in the tariff model (model 1), TBN model (model 8), and model 9. This
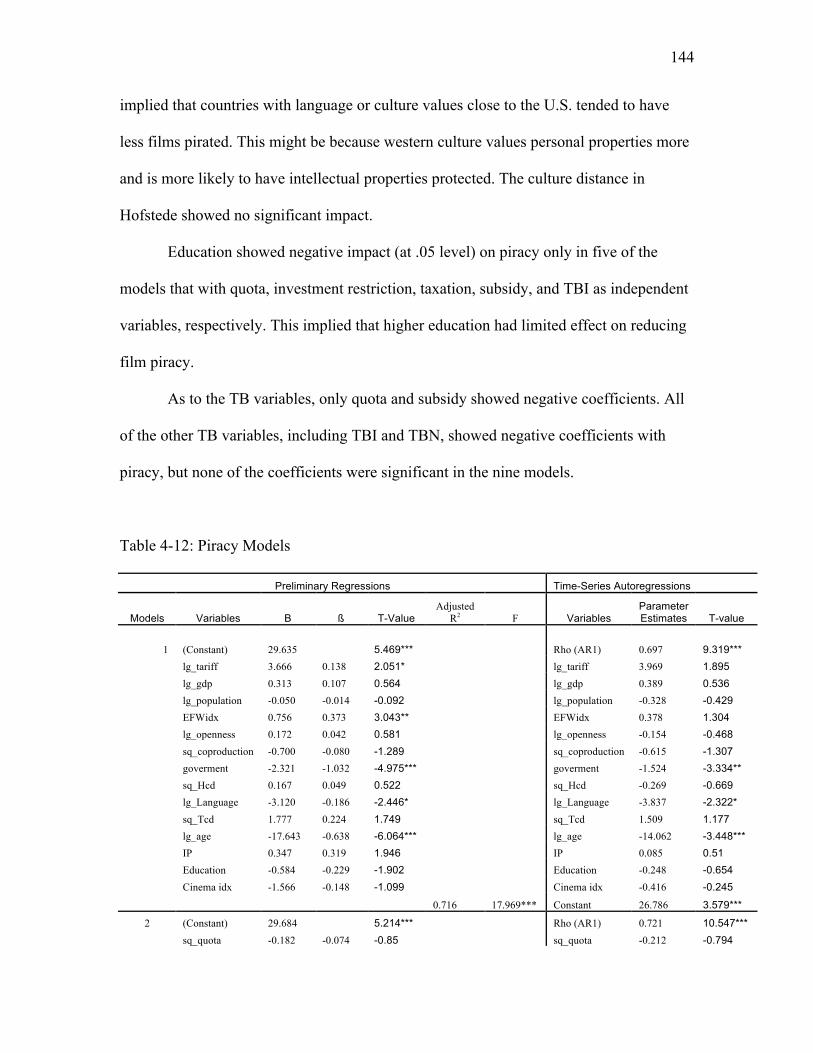
144
implied that countries with language or culture values close to the U.S. tended to have
less films pirated. This might be because western culture values personal properties more
and is more likely to have intellectual properties protected. The culture distance in
Hofstede showed no significant impact.
Education showed negative impact (at .05 level) on piracy only in five of the
models that with quota, investment restriction, taxation, subsidy, and TBI as independent
variables, respectively. This implied that higher education had limited effect on reducing
film piracy.
As to the TB variables, only quota and subsidy showed negative coefficients. All
of the other TB variables, including TBI and TBN, showed negative coefficients with
piracy, but none of the coefficients were significant in the nine models.
Table 4-12: Piracy Models
Preliminary Regressions Time-Series Autoregressions
Models Variables B ß T-Value Adjusted
R2 F Variables Parameter Estimates T-value
1 (Constant) 29.635 5.469*** Rho (AR1) 0.697 9.319*** lg_tariff 3.666 0.138 2.051* lg_tariff 3.969 1.895 lg_gdp 0.313 0.107 0.564 lg_gdp 0.389 0.536 lg_population -0.050 -0.014 -0.092 lg_population -0.328 -0.429 EFWidx 0.756 0.373 3.043** EFWidx 0.378 1.304 lg_openness 0.172 0.042 0.581 lg_openness -0.154 -0.468 sq_coproduction -0.700 -0.080 -1.289 sq_coproduction -0.615 -1.307 goverment -2.321 -1.032 -4.975*** goverment -1.524 -3.334** sq_Hcd 0.167 0.049 0.522 sq_Hcd -0.269 -0.669 lg_Language -3.120 -0.186 -2.446* lg_Language -3.837 -2.322* sq_Tcd 1.777 0.224 1.749 sq_Tcd 1.509 1.177 lg_age -17.643 -0.638 -6.064*** lg_age -14.062 -3.448*** IP 0.347 0.319 1.946 IP 0.085 0.51 Education -0.584 -0.229 -1.902 Education -0.248 -0.654 Cinema idx -1.566 -0.148 -1.099 Cinema idx -0.416 -0.245
0.716 17.969*** Constant 26.786 3.579***
2 (Constant) 29.684 5.214*** Rho (AR1) 0.721 10.547*** sq_quota -0.182 -0.074 -0.85 sq_quota -0.212 -0.794

145
lg_gdp 0.275 0.094 0.486 lg_gdp 0.289 0.384 lg_population 0.300 0.085 0.542 lg_population 0.231 0.295 EFWidx 0.727 0.359 2.865** EFWidx 0.324 1.091 lg_openness 0.153 0.037 0.506 lg_openness -0.289 -0.872 sq_coproduction -0.797 -0.091 -1.43 sq_coproduction -0.660 -1.39 goverment -2.337 -1.039 -4.902*** goverment -1.528 -3.257** sq_Hcd 0.082 0.024 0.234 sq_Hcd -0.366 -0.842 lg_Language -3.347 -0.200 -2.558* lg_Language -4.017 -2.322* sq_Tcd 2.142 0.270 2.098* sq_Tcd 1.976 1.516 lg_age -17.177 -0.621 -5.436*** lg_age -13.335 -3.037** IP 0.330 0.303 1.761 IP 0.068 0.402 Education -0.643 -0.252 -2.057* Education -0.324 -0.836 Cinema idx -1.940 -0.183 -1.345 Cinema idx -0.802 -0.462
0.704 17.989*** Constant 26.564 3.333***
3 (Constant) 29.088 5.269*** Rho (AR1) 0.722 10.789*** sq_IVR 0.457 0.143 1.751 sq_IVR 0.560 1.614 lg_gdp 0.591 0.202 1.002 lg_gdp 0.674 0.869 lg_population -0.324 -0.092 -0.533 lg_population -0.536 -0.642 EFWidx 0.666 0.329 2.632* EFWidx 0.283 0.958 lg_openness 0.143 0.035 0.481 lg_openness -0.303 -0.925 sq_coproduction -0.369 -0.042 -0.627 sq_coproduction -0.453 -0.933 goverment -2.371 -1.054 -5.050*** goverment -1.530 -3.309** sq_Hcd 0.307 0.090 0.937 sq_Hcd -0.077 -0.178 lg_Language -3.186 -0.190 -2.483* lg_Language -4.062 -2.379* sq_Tcd 2.132 0.269 2.119* sq_Tcd 1.934 1.501 lg_age -17.321 -0.626 -5.862*** lg_age -13.902 -3.313** IP 0.380 0.349 2.119* IP 0.091 0.549 Education -0.628 -0.246 -2.045* Education -0.368 -0.967 Cinema idx -1.845 -0.175 -1.3 Cinema idx -0.741 -0.433
0.713 17.648*** Constant 26.902 3.485***
4 (Constant) 26.253 3.714*** Rho (AR1) 0.758 12.516*** sq_service 0.261 0.108 1.053 sq_service 0.571 1.919 lg_gdp 0.197 0.067 0.347 lg_gdp 0.200 0.258 lg_population 0.185 0.052 0.343 lg_population -0.043 -0.056 EFWidx 0.704 0.347 2.759** EFWidx 0.275 0.929 lg_openness -0.042 -0.010 -0.122 lg_openness -0.531 -1.556 sq_coproduction -0.678 -0.078 -1.216 sq_coproduction -0.624 -1.354 goverment -2.383 -1.059 -5.009*** goverment -1.402 -3.025** sq_Hcd 0.079 0.023 0.23 sq_Hcd -0.567 -1.282 lg_Language -3.105 -0.186 -2.381* lg_Language -3.893 -2.208* sq_Tcd 2.048 0.259 2.002* sq_Tcd 2.115 1.605 lg_age -15.636 -0.566 -4.140*** lg_age -9.946 -2.063* IP 0.406 0.372 2.195* IP 0.092 0.56 Education -0.584 -0.229 -1.818 Education -0.176 -0.447 Cinema idx -1.407 -0.133 -0.901 Cinema idx 0.188 0.103
0.706 17.098*** Constant 19.902 2.228*
5 (Constant) 30.700 5.535*** Rho (AR1) 0.735 11.366*** sq_taxation 0.105 0.028 0.417 sq_taxation 0.208 0.699 lg_gdp 0.211 0.072 0.364 lg_gdp 0.213 0.27 lg_population 0.244 0.069 0.44 lg_population 0.135 0.171

146
EFWidx 0.749 0.370 2.925** EFWidx 0.329 1.095 lg_openness 0.115 0.028 0.376 lg_openness -0.345 -1.029 sq_coproduction -0.703 -0.080 -1.238 sq_coproduction -0.582 -1.206 goverment -2.335 -1.038 -4.853*** goverment -1.430 -3.022** sq_Hcd 0.150 0.044 0.44 sq_Hcd -0.368 -0.843 lg_Language -3.346 -0.200 -2.510* lg_Language -4.204 -2.349* sq_Tcd 2.114 0.267 2.052* sq_Tcd 1.932 1.449 lg_age -18.109 -0.655 -6.093*** lg_age -14.161 -3.296** IP 0.368 0.338 2.018* IP 0.064 0.381 Education -0.659 -0.258 -2.100* Education -0.325 -0.835 Cinema idx -1.907 -0.180 -1.282 Cinema idx -0.693 -0.391
0.702 16.835*** Constant 27.810 3.520***
6 (Constant) 28.435 4.968*** Rho (AR1) 0.719 10.961*** lg_subsidy -1.062 -0.124 -1.438 lg_subsidy -0.359 -0.396 lg_gdp 0.704 0.241 1.097 lg_gdp 0.437 0.534 lg_population -0.068 -0.019 -0.121 lg_population -0.008 -0.01 EFWidx 0.789 0.389 3.104** EFWidx 0.335 1.121 lg_openness 0.191 0.047 0.632 lg_openness -0.281 -0.842 sq_coproduction -0.748 -0.086 -1.361 sq_coproduction -0.661 -1.386 goverment -2.625 -1.166 -5.173*** goverment -1.575 -3.102** sq_Hcd 0.237 0.069 0.729 sq_Hcd -0.264 -0.629 lg_Language -3.373 -0.202 -2.606* lg_Language -3.923 -2.269* sq_Tcd 2.080 0.263 2.052* sq_Tcd 2.023 1.551 lg_age -17.146 -0.620 -5.690*** lg_age -13.885 -3.193** IP 0.379 0.348 2.100* IP 0.083 0.488 Education -0.675 -0.264 -2.195* Education -0.348 -0.9 Cinema idx -1.927 -0.182 -1.351 Cinema idx -0.901 -0.519
0.709 17.368*** Constant 27.123 3.358***
7 (Constant) 30.566 5.309*** Rho (AR1) 0.741 11.627*** sq_TBI 0.049 0.025 0.234 sq_TBI 0.163 0.644 lg_gdp 0.223 0.076 0.379 lg_gdp 0.263 0.335 lg_population 0.172 0.049 0.314 lg_population -0.089 -0.113 EFWidx 0.734 0.362 2.877** EFWidx 0.312 1.037 lg_openness 0.091 0.022 0.258 lg_openness -0.393 -1.116 sq_coproduction -0.700 -0.080 -1.175 sq_coproduction -0.586 -1.218 goverment -2.349 -1.044 -4.898*** goverment -1.402 -2.921** sq_Hcd 0.188 0.055 0.576 sq_Hcd -0.314 -0.734 lg_Language -3.214 -0.192 -2.454* lg_Language -3.940 -2.235* sq_Tcd 2.131 0.269 2.064* sq_Tcd 2.051 1.547 lg_age -17.983 -0.650 -5.945*** lg_age -13.918 -3.207** IP 0.380 0.349 2.005* IP 0.073 0.433 Education -0.663 -0.260 -2.094* Education -0.306 -0.78 Cinema idx -1.958 -0.185 -1.297 Cinema idx -0.690 -0.388
0.702 16.801*** Constant 27.187 3.390***
8 (Constant) 28.861 5.081*** Rho (AR1) 0.754 12.109*** sq_TBN 0.413 0.124 1.331 sq_TBN 0.565 1.546 lg_gdp 0.103 0.035 0.179 lg_gdp 0.104 0.131 lg_population 0.092 0.026 0.17 lg_population -0.111 -0.142 EFWidx 0.784 0.387 3.080** EFWidx 0.352 1.171 lg_openness -0.020 -0.005 -0.064 lg_openness -0.430 -1.286
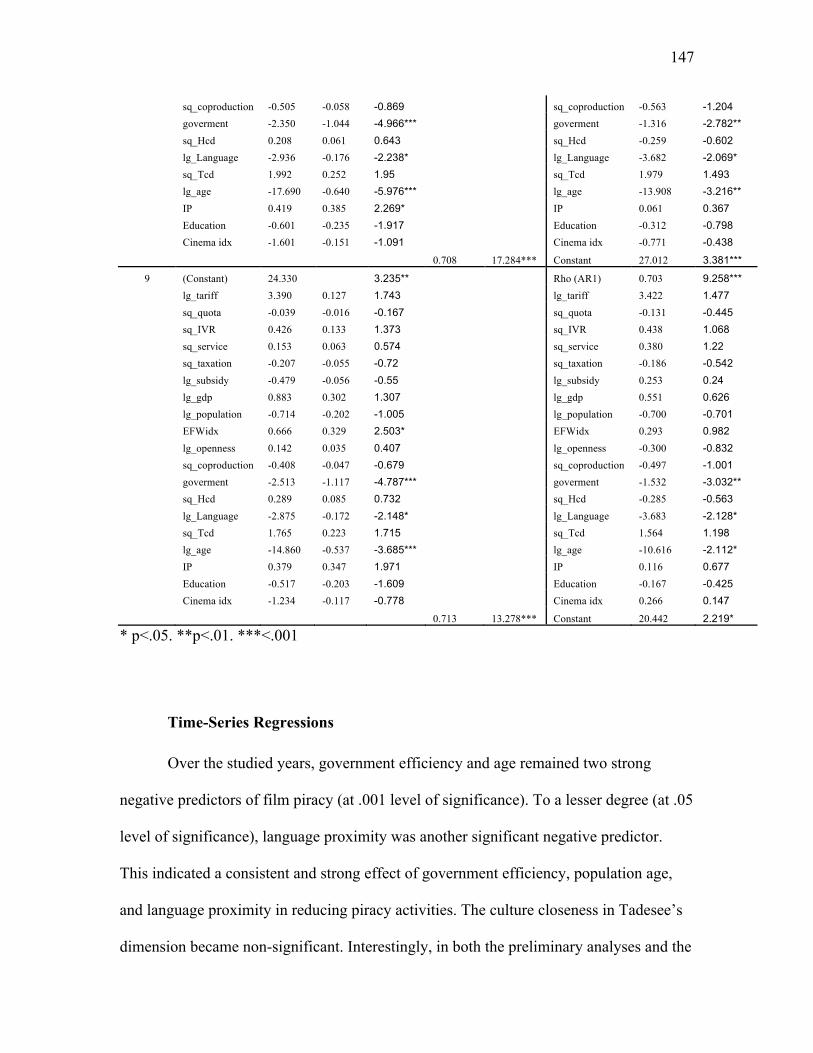
147
sq_coproduction -0.505 -0.058 -0.869 sq_coproduction -0.563 -1.204 goverment -2.350 -1.044 -4.966*** goverment -1.316 -2.782** sq_Hcd 0.208 0.061 0.643 sq_Hcd -0.259 -0.602 lg_Language -2.936 -0.176 -2.238* lg_Language -3.682 -2.069* sq_Tcd 1.992 0.252 1.95 sq_Tcd 1.979 1.493 lg_age -17.690 -0.640 -5.976*** lg_age -13.908 -3.216** IP 0.419 0.385 2.269* IP 0.061 0.367 Education -0.601 -0.235 -1.917 Education -0.312 -0.798 Cinema idx -1.601 -0.151 -1.091 Cinema idx -0.771 -0.438
0.708 17.284*** Constant 27.012 3.381***
9 (Constant) 24.330 3.235** Rho (AR1) 0.703 9.258*** lg_tariff 3.390 0.127 1.743 lg_tariff 3.422 1.477 sq_quota -0.039 -0.016 -0.167 sq_quota -0.131 -0.445 sq_IVR 0.426 0.133 1.373 sq_IVR 0.438 1.068 sq_service 0.153 0.063 0.574 sq_service 0.380 1.22 sq_taxation -0.207 -0.055 -0.72 sq_taxation -0.186 -0.542 lg_subsidy -0.479 -0.056 -0.55 lg_subsidy 0.253 0.24 lg_gdp 0.883 0.302 1.307 lg_gdp 0.551 0.626 lg_population -0.714 -0.202 -1.005 lg_population -0.700 -0.701 EFWidx 0.666 0.329 2.503* EFWidx 0.293 0.982 lg_openness 0.142 0.035 0.407 lg_openness -0.300 -0.832 sq_coproduction -0.408 -0.047 -0.679 sq_coproduction -0.497 -1.001 goverment -2.513 -1.117 -4.787*** goverment -1.532 -3.032** sq_Hcd 0.289 0.085 0.732 sq_Hcd -0.285 -0.563 lg_Language -2.875 -0.172 -2.148* lg_Language -3.683 -2.128* sq_Tcd 1.765 0.223 1.715 sq_Tcd 1.564 1.198 lg_age -14.860 -0.537 -3.685*** lg_age -10.616 -2.112* IP 0.379 0.347 1.971 IP 0.116 0.677 Education -0.517 -0.203 -1.609 Education -0.167 -0.425 Cinema idx -1.234 -0.117 -0.778 Cinema idx 0.266 0.147
0.713 13.278*** Constant 20.442 2.219*
* p<.05. **p<.01. ***<.001
Time-Series Regressions
Over the studied years, government efficiency and age remained two strong
negative predictors of film piracy (at .001 level of significance). To a lesser degree (at .05
level of significance), language proximity was another significant negative predictor.
This indicated a consistent and strong effect of government efficiency, population age,
and language proximity in reducing piracy activities. The culture closeness in Tadesee’s
dimension became non-significant. Interestingly, in both the preliminary analyses and the

148
time-series regressions, neither the economic variables, gross domestic products and
cinema index, showed significant impacts on film piracies. And the impact of education
on reducing piracies was also limited.
Summary of Results
This study asked how regulatory trade barriers affect film performance. The
research was conducted based on the following four research questions:
RQ1: How do policy trade barriers affect the performance of a country's domestic
film industry?
RQ2: How do trade barriers affect film industry’s operation scale and financial
input?
RQ3: How do trade barriers affect a country's film consumptions?
RQ4: Do various trade protection techniques vary in their effects on the
development of national film industry? Which protection method(s) is (are) more
effective?
RQ5: Does the effectiveness of trade barriers in protecting domestic film
industries decrease with the development of multiple film distribution technologies?
To answer the above five questions, the research developed ten film development
indicators and explored the effect of eight trade barriers variables on the ten film
development functions, including six individual trade barrier variables and two composite
TB indices. The regressions yielded ten different film performance functions, both cross-
section and cross-time. The research questions were answered and hypotheses were tested
based on these regression results. Model 9 of each regression function represented the
combination effect of using the six TB variables. It revealed how different TB variables

149
worked together and what the effects the interactions of these TB variables brought to the
local film industry. The model also provided information on the effectiveness of each TB
variables. The composite indices, TBI and TBN, took into consideration of the quality
aspect and quantity aspect of the overall TB protections. Therefore, the overall effect of
TB variables was tested based on the results of both model 9 and the regression results of
the TB indices.
RQ1 asked the effect of trade barriers on the performance of a country's domestic
film industry. Hypothesis 1 was used to examine the effects of trade barriers on the
output performance of a country’s film industry. Three parameters were used as
indicators of a country’s output performances, film production, domestic market share,
and film export to other countries.
Hypothesis 1a predicted a negative relationship between the use of trade barriers
and a country’s domestic film production volume. Hypothesis 1b predicted that the use of
trade barriers was negatively related to local films’ domestic market share. According to
the correlation data from Table 4-2, all TB variables were significantly and positively
related with film productions and domestic market share. Further, neither of the
regression analyses showed any significant negative impacts of TB variables on film
productions and market share. Using the TB indices as indicators of the composite trade
barrier effect, the results showed that the quality TB index (TBI) had positive impacts on
both film production and market share. The impacts were also long-lasting over the
studied time period (2000-2007). Therefore, depending on the combination of different
trade protection techniques, reinforcing trade protections would have an overall positive
influence on increasing local production and the market share of domestic films. As to

150
the individual trade barriers variables, quota and subsidy especially showed positive
contributions to increase film production and market share. The impact of quota was also
long-lasting.
Overall, TB variables showed a positive effect on increasing national film
productions and market share. No negative effect was identified for individual trade
barrier variables, either. Therefore, neither hypothesis 1a nor hypothesis 1b was
supported.
Hypothesis 1c predicted a negative relationship between trade barriers and a
country’s export performance in films. The correlation data showed significant positive
correlations between most TB variables and film export. The regression result showed,
however, increasing the quality of trade barriers (TBI) did have negative impact on film
export. But, the significance of the impact decreased over the studied time period.
Increasing the quantity of trade protections had no significant impact on film export.
Individually speaking, three TB variables appeared to be most harmful for reducing film
export. They were investment barrier, service barrier, and taxation barrier. But only the
negative impact of service restrictions sustained over the studied years. The impact of
service restrictions and taxation was not significant controlled for time.
Therefore, the positive correlations between TB variables and film export might
indicate that countries with more export were more likely to establish various trade
protection methods to protect their industries. However, with three of the trade barrier
variables being negative predictors of film export and the rest of the TB variables
showing no significant impact on film export, the use of these trade barriers appeared to
have an overall negative effect on film export. In the long-run, however, increasing the

151
quality and quantity of trade protections showed no impact on film export. Therefore,
hypothesis 1c was only partially supported in this study.
RQ2 asked the impact of TBs on national film industry’s operation scale and
financial input. Hypothesis 2 examined the relationship between trade barriers and their
links with a country’s film operating and financing scale in four aspects, the total number
of film screens, the box office revenues, annual investment on films, and consumer
annual spending on films.
H2a predicted that the use of trade barriers was negatively related to the operation
scale of a country’s film industry. The correlation result showed that most of the TB
variables showed negative correlations with total film screens, but positive correlations
with total box office revenues. The regression result showed that, overall, the quality
indicator of TB variables, the TBI, showed positive impact on screen development over
the studied period of time. TBI also showed significant contribution to box office
revenues in both cross-sectional and cross-time analyses, indicating the positive impact
lasted throughout the studied period of time. Compare with TBI, the quantitative
indicator of trade variables, TBN, showed no significant impact on both film screens and
box office revenue. Therefore, the negative correlation between film screens and the TB
variables must be explained by countries with less screen scales in film operations having
more motives to use various TBs to protect their industries.
As to the individual variables, quota especially had sustaining contributions to
increase film screens and box office revenues over the eight-year period. Subsidy also
showed significant contribution to the above two film operation variables, although the
impact was not lasting through the years. Only investment restrictions showed negative

152
impact on box office revenue, but the impact was for the short-term only. Further, when
working with other TB variables in model 9, the impact of investment restrictions was
not significant. In the long-run, the impact of TB variables on film screens and box office
revenues was positive. Therefore, hypothesis 2a was not supported.
H2b predicted that the use of trade barriers was negatively related to a country’s
financial input in films. The correlation data revealed that most TB variables had negative
correlations with consumer spending on films and positive correlations with total film
investment. In the regression analyses, mixed results were found for individual TB
variables. Specifically, quota and subsidy showed long-term positive impact on film
investment and short-term impact in increasing consumer spending. Investment
restriction, service restriction, and taxation appeared to have negative impacts on film
investment, although the impacts were for the short-term only. Investment restriction and
taxation also appeared to have negative impact on consumer spending and the impact was
sustained over the years. And because the different directions that individual trade barrier
variables pulled, the overall effect of trade protections, both quality aspect (TBI) and the
quantity aspect (TBN), showed no significant impact on either consumer spending or on
film investment. In the long-run, however, only the positive impact of quota and subsidy
in the individual models and subsidy in model 9 appeared significant on film investment.
As to consumer spending, the negative impacts of investment restrictions and taxation
were all significant. In addition, tariff has increased the effect on total screens over the
studied period of time as shown by its significant coefficients in the time-series
regression analysis. When controlled for all TB variables, the negative impact of tariff
and investment restrictions remained over the years. Therefore, mixed results were found
153
considering TBs’ impact on the financial input of national films. The composite impact of
trade barriers was not significant. Hypothesis 2b that predicted a negative impact of TBs
on a nation’s film production investment was not supported.
RQ3 asked the impact of TBs on film consumptions. Hypothesis 3 explored the
possible effect of trade barriers on film consumptions in three areas including the effect
on film admissions, film diversity, and film piracy activities.
Hypothesis 3a predicted a negative connection between trade barriers and
audience film consumption quantity. The total quantity of films that were consumed was
operationalized by the total number of admissions. The correlations data showed negative
results between most TB variables and audience admissions. In the regressions, however,
only investment restrictions appeared to have sustaining negative impact on film
admissions. Two variables showed positive impacts on admissions, including quota that
showed a positive short-term impact and tariff that showed a long-term positive impact.
And again, because of the different directions in the function of individual trade barrier
variables, the overall impact of both the quality and quantity aspect of TB protections
was not significant. Therefore, hypothesis 3a was not supported.
Hypothesis 3b predicted a negative link between TBs and film diversity. The
diversity of films was reported as the diverse source of film imports.
The results showed that, quota and investment restrictions could significantly
increase import diversities of films, and the impact was long-lasting during the years.
Therefore, the composite index of TBI appeared to contribute to an increased level of
film diversity. Controlled for all TB variables in model 9, quota and investment
restrictions still appeared to be positive predictors of film diversity. However, the

154
negative impacts of tariff and taxation on film diversity were not shown immediately. In
the long-run, their negative impacts might counter-balance the positive effect of quota
and investment restrictions. Therefore, in the long-run, the composite impact of TBs on
film diversity was also not significant. Hypothesis 3b that predicted a negative relation
between TBs and film diversity was not supported.
Hypothesis 3c stated that the use of trade barriers was positively related to piracy
of films in a country. The correlation data showed mostly positive links between TBs and
piracy, except for quota and subsidy. Regression results showed, however, that no TB
variables had any significant impact on film piracy. Further, increasing either the quality
or quantity of TB protections also had no significant impacts on piracy. Therefore,
hypothesis 3c was not supported.
RQ4 investigated the variations in the effects of different protective policy
instruments. It tried to find the protective method(s) that appear more effective in the
development of national film industry.
As the tables show, tariff showed no significant impact on the dependent variables
on any particular year, however, its impacts showed up through the years. Over the years,
tariff showed positive impacts on film admissions and film screens, and negative impacts
on film diversity and audience spending.
Quota turned out to be the TB variable that had the most significant effect on
almost all the dependent variables (except export and piracy). In addition, all of the
effects were positive and most of the effects remained significant across the time period
(except for its effect on spending and admission).

155
Among all the TB variables, investment barrier showed the most negative
significant effect on the dependent variables. It could significantly reduce film export,
box office revenues, national film investment, total film spending, and film admission,
and the negative effects were long-lasting over the time period in this study for both
audience admission and film spending. It could also significantly increase film piracy
levels, although the negative impact might not be significant over the studied period of
time. However, investment restriction did contribute to the diversity of film imports of a
country and the effect was enduring over the studied time period, although this diversity
of available films might not turn into more audiences and revenues.
Service barriers showed negative and long-lasting significant impact on film
export. It also significantly reduced film investment, but the impact was not significant
over the time period of the study.
Taxation also showed a negative significant impact on film spending, and the
impact remained over the years. Taxation also significantly reduced film investment and
export, but the negative impact was not significant over the years.
Subsidy was another TB variable that showed most significant impact on the
dependent variables, second only to quotas among the six TB variables. It could
significantly increase film production and investment, and the positive effect remained
significant over the studied period. Subsidy also had significant positive impact on film
market share, film spending, and box office revenues, but those effects were not
significant over the time period of the study. Interestingly, the productions, investment,
and audience spending in subsidized films didn’t seem to contribute to national film

156
screens, which might explain why the positive effects of subsidies on film investment and
production were not long-lasting over time.
RQ5 addressed the question of the effect of trade protective techniques over time.
Hypothesis 4 predicted a decreased effectiveness of TBs with the development of new
distribution technologies.
As the regression results showed, for the positive contributors, such as quota and
subsidy, quota lost its impact on increasing film spending and film admission. Subsidy’s
contribution in increasing film market share, box office revenues and consumer spending
was also lost. As a whole, while the effect of trade barriers on the dependent variables did
change over time, the change was not dramatic, at least for the studied period (2000-
2007). In addition, the change was not even one-directional. For some TBs, for instance,
tariff, the effect increased over the studied years. Therefore, hypothesis 4 was not
supported.
Overall, the quality aspect of trade barriers (TBI) matters more than the quantity
aspect. As the tables show, if trade barriers were well-regulated and effectively reinforced,
they could contribute to the development of national films and increase production, box
office revenues, as well as market share and the effects were long-lasting over the years.
As a result of the above positive effects on film production, market share, and box
revenue, increasing quality trade protections also showed positive effect on increasing
film screens. TBI also showed positive effects on film diversity, but the effect became
less significant over the years. However, TBs did show a short-term negative impact on
film export. The reduction of film export might occur due to retaliations from export
partners.

157
In comparison, the effect of TBN was generally not significant except for its
negative impact on film export. Over the studied time period, increasing the numerical
aspect of trade barriers had almost no impact on the dependent variables.

158
CHAPTER 5 CONCLUSION AND DISCUSSION
Overview
This chapter discusses the major findings of the study based on the research
questions and in relation to previous research literature. It started with a discussion of the
overall impacts of trade protections on ten national film indicators. Then, it talked about
the welfare effects of individual and composite trade barrier variables developed in this
study. It also acknowledged the impacts of some important control variables. The chapter
ended with a discussion of its limitations, recommendations for potential future studies,
and followed by closing remarks.
Effect of Trade Protections on National Film Performances
Based on the common criticisms in previous literature on trade barriers and their
negative impacts on national film development, the study predicted negative relations
between all TB variables and dependent variables in production, market competitiveness,
operation scale, and consumer consumption. Contrary to common criticisms toward trade
restrictive policies and trade barriers, however, this study failed to find the all-negative
relations between most of the TB variables and the dependent variables. Mixed results
were found instead. The function of individual trade barrier variables differed and the
directions of their impact on national films also varied. Some of them were more positive,
and others were more negative. However, trade protective policies as a whole showed
mostly positive long-term impacts on increasing productions, market share, box office

159
revenues, and national film screens over the studied years. They also had short-term
contributions to increased film diversity in a market. The only negative impact was on
export. The impact, however, was for a short-term only. Therefore, criticisms on trade
protective policies and their negative impacts were mainly exaggerated.
The study developed ten measurement dimensions as indicators of the
development of national film industries. Trade protections played different roles on these
different measurement dimensions. Countries seeking to promote their domestic
industries not only need to carefully evaluate their markets based on different
measurement dimensions, but also need to look at how different policy measures interact
with the different film indicators, in order to come up with the policies that best suit their
market conditions, needs, and national interests.
Domestic Production
Film represents a unique form of cultural expression. Preservation of domestic
film productions concerns national sovereignty and cultural identity. Countries differ in
their production capabilities due to economic factors such as financial capability and
production scale, different levels in production technologies, and historical and cultural
reasons, such as fewer creative talents. In the context of rising production cost and
increased competition from the U.S., maintaining a viable local film industry becomes a
focal concern for cultural policy makers.
Media economists such as Wildman and Siwek (1988) showed strong objections
to trade protective policies and argued that they resulted in reduced film productions,
revenues, and employment. This study, however, found no evidence to support such an
announcement. In the correlation analyses, all of the trade barrier variables, including

160
tariff, quota, investment restrictions, service barriers, taxation, and subsidy, showed
significant positive correlations with the film production quantity. Further, in the
regression analyses, none of the above TB variables showed significant negative impacts
on film production. To the contrary, both quota and subsidy showed significant
contribution to increase film productions. The contribution of subsidy might decrease
over the studied time. Overall, quality trade protection policies, as shown in the
significant contribution of TBI to production, seemed to have a significant positive
impact on increasing film productions.
Market Share
Market share measures the portion of the total box office revenues obtained by
domestic films. It indicates the strength of domestic films in market competition in terms
of capturing audiences and turning the audience spending into monetary value. Earlier
studies (Lee & Bae, 2004; Oh, 2001) used market share as an indicator of self-sufficiency
ratio (SSR), i.e., to what degree domestic industry can satisfy market need. Countries
with strong market share will also have more potential in increasing financial inputs to
local film infrastructure and local productions.
Although in reality, examples of losing market share as a result of easing trade
barriers were abundant, as mentioned earlier in the case of Koran, Canada, New Zealand,
and Mexico, existing studies (Lee & Bae, 2004; Lee, et al., 2008) did not find a
connection between trade protective policies and domestic market shares in the film
industry. Studies of Huhmann & Saqib (2007) also reported no significant change in
domestic market share in the Canadian magazine industry following the end of protective
policies.

161
The current study found that, over all, increasing the quality aspect of trade
protections significantly increased the market share of domestic films, and the impact
remained significant over the studied time period. Further, none of the TB variables
showed significant negative impact on film market share. Contrarily, quota and subsidy
showed significant contributions to increase domestic film market share. The claim that
trade protective policies would harm film’s market performance was not supported in this
study.
Export
Export extends film market to overseas and adds film consumers from abroad.
Export market not only provides additional revenue sources for films, but also helps
producers to reach largest possible audiences, and therefore lower unit production cost
through external economies of scale (Hoskins, et al., 1997; Marvasti & Canterbery, 2005).
In export market, domestic films compete at a global level with not only the films of the
importing country, but also with the films from other exporting countries. Therefore,
export performance of a country’s national films reflects these films’ global
competitiveness when trading abroad. Export revenues are also important in supporting
domestic film industries’ continued growth.
The effect of trade protections on a country's participation in international trade is
relatively less explored in the media industry. Theoretically, if export is merely driven by
audience demand and the competitiveness of films, trade protective methods should
increase the export potential and international competitive status for local films also,
given the fact that these protective methods increased domestic productions and market
share as discussed earlier. In reality, however, researchers (Appleyard, Field, & Cobb,

162
2006) believe that trade restrictions may result in trade retaliations, which in turn,
resulted in a reduction in export revenues. Empirically, previous studies by Marvasti
(Marvasti 1994, 2000) found that trade barriers actually contribute to the exports of books
and recorded music.
This study addressed the impact of trade protections on a country’s film exports.
It did found that, when considering only the correlations between each individual TB
variables and export, the correlations were all positive. But, with all the control variables
entered, none of the positive correlations were significant. Therefore, factors other than
the TB variables played much larger roles than the TB variables. The regression results
did show that increasing the quality of trade protections (TBI) had a negative impact on
film export. The composite negative effect was mainly due to the significant negative
impact of three restrictive TB variables, the investment restrictions, service restrictions,
and taxation.
Screens
The total number of screens a country has reflects the actual operation size of the
film market. The quantity of screens also reflects audience demand and the degree to
which film revenues are used to support industry development. A flourishing film market
would have more theaters and screens to satisfy consumer needs. Although the world as a
whole witnesses a shrinking in the operation scale of theaters and screens due to the
emerging new consumption channels for films, exploring the possible relationship
between trade protective methods and the screen size might provide interesting
implications for policy makers in terms of promoting local film market.

163
In response to media economics’ criticism that trade protections as a whole would
decrease a country’s overall scale of operation (Wildman & Siwek, 1988), this study did
found negative correlations between most TB variables. Controlled for other variables,
however, none of those negative correlations were significant. To the contrary, quota and
subsidy showed significant contributions to increase national film screens. Tariff was not
a significant factor in the preliminary analysis, but showed positive impact on increasing
film screen over the studied period of time. And considering the negative coefficients
between the restrictive TB variables, investment restrictions, service restrictions, and
taxation, the overall effect of trade barrier indices (both TBI and TBN) showed no
significant impact on national film screens. Therefore, the positive impacts of supportive
trade barrier techniques might be countered by the possible negative effect of the
restrictive trade protection method, resulting in an overall non-significant effect of trade
barriers on screen development. The other control variables might also show much larger
impacts on film screens that the small possible effects of TB variables became not
significant. Therefore, the criticism on trade protections in reducing film operation scale
in screens was not supported.
Box Office Revenue
Oh (2001) used the box office revenues as the actual market size for the film
industry. While screen numbers indicate the actual operation size of a country’s film
industry, the total box office revenues showed the realized monetary value of a country’s
film market. Normally, countries with more screens might have more audiences coming
to the theaters, and therefore spend more on films which turns into more box office
revenue. But, the link between film screens and total box office revenue may not always

164
be linear. How the theater market operates and what film contents go onto screens may
also count for how much revenues the theatrical market can obtain.
Because box office revenue can be translated partly to future development of film
infrastructure and product investment, exploring the link between trade protective method
and box office revenues was also meaningful for policy making purposes. The
correlations showed mostly positive relations between TB variables and box office
revenues. Controlled for other variables in the regressions, however, quota and subsidy
showed to be the positive predictor of box office revenue and both of these two TB
variables became non-significant controlled for time. The only variable that did show
negative impact on box office revenue was the investment restriction variable, and the
impact was non-significant controlled for time. And overall, increasing the quality of
trade protections (TBI) showed positive impact on increasing box office revenues.
Therefore, no evidence was found for the negative composite effect of trade barriers on
theatrical film revenues.
Product Investment
Not all the money from box office revenues goes to reinvestment on local
productions. Therefore, box office revenue only offers potential financial source for film
productions. Lee and Bae (2004) considered box office revenue as potential film market
size and direct production investment as realized market size.
The soaring cost for film production and the widespread use of high-budget films
as an effective differentiation strategy to drive consumer demand and enhance box office
performance has made increased product investment vital in both national and
international competition. However, countries differ in their capabilities to finance local

165
films. If the positive impact of TB variables in increasing production, market share, and
box office revenues translates into product investment, developing economies might find
a potential solution to finance its own film productions.
Wildman and Siwek (1988) criticized that trade protection reduced the financial
investment in domestic film productions. The study investigated the effect of trade
barriers on product investment. Mixed results were found. According to the regression
results, the supporting TB variables, namely, subsidy and quota, showed significant
positive contributions to increase product investment, but the restrictive TB variables, i.e.,
investment restrictions, service restrictions, and taxations showed negative impact on
decreasing film financial input. Further, the contribution of the supporting TB variables
sustained during the studied years, but the negative impacts of the three restrictive TB
variables became non-significant through the years. Overall, due to the different
directions various trade barrier variables had on film investment, the overall effect of the
composite TB indices showed no significant impact on the financial input in film
productions.
Consumer Spending and Admission
Audience admission reflects the actual audience size for theatrical films.
Consumer spending is the total amount of money that consumers spend on theatrical
films. Consumer admission and spending are the direct supports for the development of
the film industry. Scholars (Waterman, 1988; Wildman & Siwek, 1988) emphasized
consumer spending as a driving force for media development. Producers estimate
consumer demand based on audience admission and spending. Large consumer spending
will create a virtuous circle that leads to better media infrastructure, more product

166
investment, higher quality films, and more export. Empirical studies seemed to support
the relationship between consumer spending and media development (Dupagne &
Waterman, 1998; Jayakar & Waterman, 2000; Waterman, 1988, 1993, 2005; Waterman
& Jayakar, 2000; Waterman & Lee, 2007; Waterman & Rogers, 1994).
Because of the importance of audience demand and audience spending in driving
the development of the film industry, exploring their links with trade protections should
bring insight on how trade protections affect the development of film industry. The study
of Bagella & Becchetti (1999) found subsidized films have lower admissions than non-
subsidized films. The study, however, does not explore the relations between subsidy and
the total film admission, i.e., do people in general watch more films as a result of subsidy?
The correlation analyses of the current study showed that all TB variables had
negative correlations with audience admissions and spending. Controlled for other
variables, however, only investment restrictions and taxation showed significant negative
impact on audience consumption and spending. Quota and subsidy worked in improving
consumer film consumption and spending. Tariff and service restrictions showed
negative coefficients with audience consumption, but the impact was not significant.
Therefore, the TB variables function within a large social economic environment. The
actual effects of the TB variables depend on how they worked with other social
economical variables, which have even larger influences on the film industry. Overall,
none of the composite TB indices showed significant impact when considering the
controlled variables. Therefore, no evidence was found to support the claim that trade
protective methods actually discourage audience consumption.

167
Diversity
Trade protections often encounter criticism for reducing the variety of films that
audiences can choose from. Having choices to diverse films represents consumer rights
and consumption quality, even though the films might not be competitive in the market
and not demanded by many audiences. In addition, it is the cultural value itself, not the
market value, that determines the meaning for the existence of film diversity. This in
itself indicated that advocating the diversity of films may counter the market rationale. If
there is a value for supporting film diversity, government might need to intervene.
Scholars (Renaud, 1993; Seo, 2005) did point out that an unregulated market tended to
encourage domination, production concentration, and homogenous products, however,
trade protections also encounter criticism for reducing cultural diversities, restrict
audience consumptions, and deprive people of the rights to enjoy cultural products from
other countries (Collins, 1993; Cowen, 1998; Noam, 1993; Wildman & Siwek, 1988).
Some empirical research (Francois & Ypersele, 2002; Moreau and Peltier, 2004; Rauch
& Trindade, 2006) found that trade restrictions could support diverse productions. Others
(Richardson, 2006), however, found trade restrictions resulted in less program diversity.
Therefore, mixed results were also found in empirical research.
This study explores the diversity of films that enters into a market. The results
indicated that most of the TB variables had a positive correlation with import diversity.
Further, both quota and investment restrictions appeared to be positive factors in
increasing diverse sources of film import. The result was reasonable, because quota
restricts the number of films from specific countries to enter into a market. Less
homogenous products resulting from investment restrictions lead to import from various
168
sources. As to the overall effect of trade protections, as indicated by the composite TB
indices, increasing the quality of trade protections effectively increases film import
diversity, although the impact reduced over the studied period of time. Increasing the
number of trade barriers would have no significant impact on diverse film import.
Therefore, the study provided no evidence that trade protective policies would decrease
the diversity of films that people can consume. Therefore, trade protections are used
mainly to encourage the development of domestic industry rather than to encourage
domination. Instead, they are also used to protect domestic market from being dominated
by films from small number of countries, or by homogenous film. They are not only
negative approaches to counter foreign domination, but also might be positive approaches
to encourage diverse of films in the consumption market.
Piracy
The above criticism that trade restrictions restrict audience consumption and
choices lead to the next claim that trade protective methods also lead to higher video
piracies. The rationale is that if consumers can not satisfy their consumption needs
through regular and legal channels, they will seek illegal sources, such as piracy, to
satisfy their demands.
In this study, although most TB variables showed positive correlations with film
piracy, controlled for other variables in the regressions, however, none of the TB
variables showed any impact on film piracies. Further, increasing either trade protection
qualities or quantities had no impact on film piracy.
169
Summary of TB Effect on Films
Criticisms state trade protections would create a vicious circle that not only
reduce the chance for the healthy development of domestic industries and their market
performance, but also lead to less consumer choices and more piracy activities. The result
of this study indicated that criticisms on trade protections were exaggerated. Trade
protections only showed negative impact on film exports. This seemed to confirm that
trade retaliation might occur due to the protections. Although some of the trade protective
method might have some negative impact on certain film performance indicators, due to
the nature of the specific restrictive policies, overall, trade protections showed no
negative impact on any of the other nine performance indicators. Further, quality trade
protections as a whole appeared to significantly contribute to domestic production,
financial performance in the market, total box office revenues and the diversity of films
that people consume.
The Effectiveness of Trade Protection Methods
Due to the nature and function of different trade protection methods, individual
trade protection techniques had different impacts on the film development indicators.
Some of them are more positive, and some of them are more negative, and the weights of
their effects also differ. This study identified six individual TB variables—tariff, quota,
subsidy, investment restrictions, service restrictions and taxation. Based on the functions
and impacts they had on the film performance indicators, the study further grouped the
six TB variables into two categories: the supportive TB variables and the restrictive TB
variables.

170
The Supportive TB Variables
Supportive TB variables are mainly used to support the development of domestic
industries. They are adopted based on the concern of increasing foreign competition and
the need to nurture their domestic industries. The effects of these TB policies are mainly
positive on the performance indicators. Two TB variables fell into this category; quota
and subsidy.
Quota
Quota encounters the most criticism in the film industry. According to these
criticisms, quotas mainly have three shortcomings: they are not practical, not beneficial,
and not effective. Further, quota was also criticized for bringing a series of negative
impacts on the media industry: they reduce domestic production, cut financial input used
to develop infrastructure, cut industry revenues and market performance, decrease
consumer diversity, negatively affect term-of-trade, and lead to the rise of piracy (Cowen,
1998; Waterman 1993; Wildman & Siwek, 1988; Winkelmann & Winkelmann, 1998).
Previous studies also showed no evidence that quotas was an effective policy in
promoting the market performance of television (Dupagne & Waterman, 1988) and films
(Lee & Bae, 2004; Lee, Kim, & Kim, 2008), or increased productions (Peltier, 1999).
Therefore, quota is considered a damaging and costly form of government intervention
(Bernier, 2003b).
This study, however, failed to find evidence for all of the above claims. To the
contrary, it found quota to be the most effective and supportive factor for the film
industry. It showed significant influence on eight (except for export and piracy) film
performance indicators and no negative impact on any of the film performance variables.

171
To be specific, quotas appeared to promote domestic production, market share, film
screens, box office revenues, product investment, consumer spending and admission, and
import diversity. Except for box office, consumer spending and admission, all of the
other positive impacts remained for the studied years.
Further, considering the negative correlations of quota with consumer spending
and admission and the positive impacts of quota on increasing consumer spending and
admission, it indicated that countries with less consumer spending and admissions are
more likely to use quotas to encourage consumption, and the method did work in the
short-term to boost theatrical consumption. Although in the long-run, the effect was not
significant, it did not void the positive impact of quotas on consumers. Other factors
related to the decline of theatrical consumptions need to be considered to further establish
such relationship.
Therefore, instead of being a damaging form of trade protection, quota seemed to
serve for its own purposes. It benefits the film industry in creating a beneficial cycle from
production to operation, and to consumption.
Subsidy
Subsidy supports domestic productions and services through direct funding. This
method is considered more positive and direct in helping local industry. The method also
fits the rule of specificity, which states that policies that are closest to the source of
problems are the most efficient. Further, because the main impact of subsidies are on
producers and not on import competitors or consumers, the method was also considered
more moderate than other methods and face less resistance from consumer rights
advocates. Therefore, subsidies are preferred in both the scholastic community and in the

172
international community. Some researchers (Collins, 1993; Noam, 1993; Rauch &
Trindade, 2006; Renaud, 1993) support using subsidy as more effective way of
promoting film productions than using quota.
However, subsidies are also criticized for being not effective. They are often
related with productions of lower quality and less cultural values. Subsidized films are
also associated with less admission numbers and poor box office and market share
performances. Empirical studies (Bagella & Becchetti, 1999; Marvasti, 1994) pointed to
different directions concerning subsidies’ impact on the media industry.
This study investigated the effect of subsidy on ten film performance indicators
and confirmed subsidy to be a positive factor in promoting local films in six aspects. As
the result showed, subsidy significantly contributed to local productions and improved
the market share of domestic films. It also showed significant impact in increasing the
operation scales of films by boosting production investment, consumer spending, as well
as total screen numbers. Subsidy showed neither impact on film export, nor impact on
any of the consumption variables. Theoretically, however, if subsidy promotes domestic
production, it should add diversity in the consumer market. In this study, subsidy showed
no impact on HHI. This is mainly because this study defined consumption diversity as the
diverse source of film import. Therefore, further studies that explore the diversity of
products in a film market would be helpful in determining the connections between
subsidy and consumption diversity in a market.
However, although subsidy showed positive impacts on six of the film
performance variables, only the impact on film investment appeared to last over the
studied period of time. The impacts on production, market share, consumer spending, box

173
office, and screens seemed reduced over the years and became non-significant. Therefore,
the direct funding from subsidy did provide more financial investment in the industry,
and the increased investment did turn into more productions and more revenues. But the
boosting effect decreased over the year. This result might support the infant industry
argument in that subsidies give immature industry a boost, and the protection should be
short-term until the protected industry reached a certain scale of operations. Also, the
impact of subsidy depends on the financial capability of a country, considering the
soaring cost of film production and huge investment of Hollywood films, subsidies from
other countries might be incomparable, and therefore increasingly lost its effect.
Therefore, subsidy was another contributing factor to domestic film productions
on various performance indicators. However, subsidy also appeared to be the factor that
was mostly affected by the time variables. Nevertheless, the change of effectiveness of
subsidy in helping local film industry may not totally be explained by technological
development. The cost factor in affecting film productions, production differentiation,
marketing, and competition might better explain the variations in the effect of subsidy.
The Restrictive TB Variables
The restrictive TB variables are mainly variables used to constrain the
development of foreign competitors. These are more aggressive methods of protections
that normally provide differentiated treatment for foreign and domestic business and
services. The impacts of these TB variables were mainly negative. Three TB variables
fell into this category—investment restrictions, service restrictions, and taxation.

174
Investment restrictions
Investment restrictions restrict the total amount of money from foreign investors,
or set ownership bars for foreign media investment. The main concern is to limit foreign-
oriented media content, and the purpose is more political than economical. Therefore, it
was not surprising to find negative impact of investment restrictions on both film output
variables and operation scales, due to the limited funding from foreign investors.
To be specific, investment restrictions showed positive correlations with
production and market share. Its impact on production and market share, however, was
not significant. This implied that countries with sufficient domestic output seemed more
likely to restrict foreign investment as a protective method, but the protection seemed to
have little effect on encouraging more output. Further, it showed significant negative
impact on reducing total film investment, box office revenue, and export, although only
for a short-term. The most significant negative impact of investment was on consumer
spending and total admission, and the effect was sustained during the years. It implied
that the long-term impact of investment restrictions might lie more on the production
content rather than on total financial input. This argument was further supported by the
fact that, these constraints for foreign investment did not translate into fewer domestic
productions and market share. This implied that the political concern using investment
restrictions to control for production content might be right, because foreign investment
may be less likely to be used in productions with local-orientation. If investment
restrictions are used together with the above two supportive TB factors, it might further
contribute to local productions.

175
On the other hand, investment restrictions did show welfare gain in increasing
import diversity of films. Due to the limitations in producing global-oriented products in
local markets, foreign films must be imported across the border. Therefore, investment
restrictions not only fulfill their stipulated goal in limiting foreign productions/ownership
in local markets, but also have welfare implication in promoting consumption diversity in
a market.
However, the increased diversity of film imports seemed not to turn into more
audiences and purchases. To the contrary, the film industry suffered from a loss of
audiences and revenues due to the restrictions. This might reflect consumer taste in
favoring foreign-invested productions, a more localized version of foreign productions, to
foreign imports. This was further implied by the short-term positive effect of investment
restrictions on increasing film piracies. Because of this, the industry also suffered shortly
from loss of revenues from both domestic box office and export, as shown by the
significant impact of investment restrictions on export and box office revenues, although
the box office revenue loss was for the short-term only. Considering the positive
correlations of investment restriction with export and box office revenue, it indicated that
countries with more film export and box office revenues were likely to use investment
restrictions to protect its industry, but the method seemed to work toward the opposite.
Together with the non-significant impact of investment restriction local production and
market share, the overall economic effect of using investment restrictions seemed to be
non-beneficial.

176
Service Restrictions
Service barriers set requirements and restrictions in dubbing, printing, and
distribution services of foreign media contents. They put burdens on service providers
when doing businesses in a foreign country. Because of the nature of this trade barrier
variable, it is more concerned with foreign businesses, and has less impact on domestic
industries, compared with investment restrictions.
The main sustaining negative impact of service restrictions was on film export.
The restrictions might negatively affect the countries’ terms of trade, and therefore,
reduce their total export revenues. It also had a negative impact on investment, but the
impact was for a short-term only.
The positive correlation of service restrictions with production, market share, box
office revenues, and export indicated that countries with more developed film industries
were likely to use service restrictions to further protect its industry. The protection,
however, had no effect on increasing its further productions. It also had no effect on
increasing the market share and box office revenues of domestic films.
Countries with fewer film screens also associated highly with service restrictions,
as shown in the correlation analysis. But, because the overall effect of trade restrictions
on total revenues from films, trade restrictions also showed no impact on increasing film
screens. Therefore, the use of service restrictions to help local industries has mostly not
been effective. The overall effect of using service restrictions was negative.
Taxation
Taxation barriers refer to various national tax policies concerning the media
industry. Tax barriers included in this study include entertainment tax, income tax, and
177
various types of levies on media products. They also include discriminatory tax that put a
differentiated tax rate on foreign and domestic business. Normally, countries with
taxation barriers usually charge a higher tax rate for foreign business. Taxation put a
burden on business professionals, and governments collect revenues from taxes on the
film industry.
In this study, the positive correlations of taxation policies with film production,
market share, box office revenues, and total film investment, again, indicated the
increased likelihood of countries with more advanced film industries in using taxation
policies to protect their domestic industries. This protection method, however, showed no
significant impact on increasing further productions, market share, and box office
revenue. To the contrary, it appeared to cut total film investment for the short-term and
reduced audience spending in the long-run. Because of taxation policies, producers and
service providers need to increase the charge for their service and products. Consumers
ended up paying more for consumption due to the increased prices. If the price is higher
than what consumers expected to pay, these consumers would be forced away from
consumptions. This indicated a welfare loss in consumption.
Taxation barrier also had a negative short-term impact on film export. Tax
policies, especially those discriminatory in nature, might adversely affect the term of
trade or tax policies of import countries, and therefore resulted in reduced export. In
addition, taxation did show a long-term effect on reducing film import diversity when
considering the time effect. Exporting countries export their films only when they expect
some profit from the importing market. If the tax policies are not favorable, some imports
might be cut.

178
Taken as a whole, the use of taxation was not effective in protecting local film
industries, and its overall effect was negative. However, the impact of film taxation
policies on domestic film industry may depend on how government uses the collected tax
revenues. Mostly, these revenues are not used for reinvestment in the film industry, but in
other industries that government considers more important. The study did show that
taxation barriers had negative impact on film investment, although the effect was not
significant considering the time effect. This might relate to the increased government
effort in promoting domestic cultural industry.
A Variable That Lies In Between: Tariff
Tariff policies play a double role. On one hand, it imposes charges on foreign
import, and therefore is restrictive for foreign competitors. On the other hand, they
benefit import competitors, not only by reduce import competitions, but also by providing
tariff revenues for the development of domestic industry.
The study showed that the effect of tariff was not an immediate one. Tariff
showed no significant impact on any of the film performance indicators in the
preliminary regressions. However, it showed significant impacts on four performance
variables in two different directions. It showed positive impact in increasing film
admission and film screens. The increased film screens might come from the tariff
revenue, and this, in turn, resulted in increased admissions. However, tariff also had
negative impacts on consumer spending and import diversity. Some imports might be
excluded because tariff rates reduce their expected revenues, and because of tariff
expenses, the price for consuming import films also increases. As a result, only a smaller

179
number of people get to consume the imported films. Some consumers would turn to less
expensive films to consume, and therefore result in the reduced overall spending on films.
Overall, by restricting film imports, tariff seemed successful in using the revenues
it earned to increase film infrastructure such as increase of screen numbers, and therefore
accommodating and attracting more audiences into theaters. However, this did not
translate into more audience spending, which in turn, had a negative impact on film
production and market share. It also cut the diversity of film imports. Therefore, although
tariff has a double effect, the overall economic effect of using tariff might be negative.
Effect of TB Combinations
Researchers (Syropoulos, 1992) consider a combined method of using trade
barriers to be more effective. The study found that some combination of TB variables
brought better effect in promoting local industry. Further, restrictive TB variables seemed
to work best with the supportive TB variables. For instance, investment restrictions plus
quota appeared to provide support for film productions. The combination of investment
restrictions and quotas helped more with national film infrastructure in screens. Service
restriction was not significant in the individual service-box office model, but showed a
significant effect when all TB variables were considered, indicating that the restrictive
variables function better when working with supportive TB variables, such as quota.
The Composite TB Indices: TBI and TBN
The TB indices combine six TB variables and showed a composite effect of trade
barriers disregarding the different directions the effect of each TB variable on national
film industry. TBI indicated the quality or degree of trade protections, i.e., how serious

180
the protections are. TBN indicates the amount of trade protection policies that exist in
countries, with no consideration of how severe the protections are. The correlation
analysis showed that both TBI and TBN had higher correlations with film performance
indicators than that of individual TB variables. The regression results indicated that the
qualitative TB index, TBI, seemed to be a better TB index than TBN. TBI showed
significant impact on five film performance variables in the short-term and four in the
long-run. TBN variables showed no significant impact of any of the ten film performance
indicators. Therefore, compared with TBI, the numerical indicator of trade protections
appeared to be a much weaker factor in affecting local film industry.
In particular, high degree trade protection appeared to be a significant positive
factor in promoting domestic film productions, market share, and box office revenues,
and the impacts were all long-lasting. The negative correlations of TBI with film screens,
consumer spending and admission indicated that countries were more likely to use trade
protection techniques to boost the operation scale of domestic film industry, and therefore
increased total audiences and spending. The result showed that improving the quality of
trade protections did help in increasing total film screens in the long-run, possibly due to
the increasing film productions and rising revenues earned from the theaters. However,
the increase in film production, operation, and revenues did not turn into more audiences
and consumer spending. This again, might due to the global trend of declining audiences
and theatrical consumptions. Technical advancements that provide more channels for
film consumption and more sources of entertainment other than films might account for
the decline of film audiences.
181
The positive correlation between TBI and export indicated that countries with
more export might want to use strict trade protection to protect not only their productions,
but also their exports. However, TBI showed negative impact on film export. Trade
retaliations might occur due to the trade protective barriers, and therefore negatively
affect export volume. However, the impact was for the short-term only. TBI also
positively contributed to film import diversity, although the impact was only significant
for the short-term.
Overall, increasing the quality of trade protections appeared to be a positive factor
in increasing national film industry in production, market share, financial output, and
operation scale, and the positive effect was significant over the studied period of time.
Despite the different effects and directions each individual TB variables had on local film
industry, the overall effect of trade protective policies was beneficial.
Effect of TB Protections over Time
The research did show that the impact of some TB variables became non-
significant during the studied period of time. However, the change was not dramatic.
More variables showed sustaining impacts during the years. Further, the impact of some
TB variables, such as that of tariff, became even stronger over time. Therefore, the
impact of technological development on the effectiveness of trade protection policies is
mainly overstated. Besides, even when the impact of some TB variables reduced over
time, technology is not the only possible explanation for that. Further research needs to
be conducted in order to exclude other social economical changes and their effects on
trade protective policies.

182
Factors That Contribute To National Film Development
The study identified several control variables that showed significant impacts on
national film development indices. The major impacts of these variables are discussed as
follows.
The Market Size Effect
The home market effect (HME) model established a link between market size,
industry development, and trade directions. It believed that wealthier countries with
larger populations tend to develop scale economy which gives the countries cost
advantages to export their goods. Empirical studies seemed to confirm the effect of
market size on consumer movie spending, market share of domestic films, and film
export (Lee & Bae, 2004; Jayakar & Waterman, 2000; Marvasti, 1994, 2000; Oh, 2001;
Waterman, 2005; Waterman & Jayakar, 2000; Waterman & Lee, 2007).
In this study, gross domestic product (GDP) appeared to be the single most
important economic factor in contributing to national film industry. It showed impacts on
nine of the film performance indicators. Seven of those impacts were long-lasting effect
and eight of those impacts were positive. Specifically, gross domestic product showed to
be a positive determinant for all of the three output variables and four operation variables.
In addition, it also showed short-term impact on increasing film admissions. The impact
of GDP on admission became non-significant during the studied period of time. This was
understandable because during this time period, technological advancement has changed
the way that people can access films. People have more channels to consume films other
than going to the theaters. Therefore, the link between GDP and film admission becomes
less significant.

183
The only negative impact of national GDP on film performance was on import
diversity. This further confirmed with the HME argument. Wealthier countries have
developed film industries that satisfy consumer need. They also tend to be net exporters
and have less demand from import. As a result, consumers may have welfare loss due to
consumption of more homogenous products.
The impact of another market size variable, population, was much weaker
compared with GDP. It only showed positive contribution to film screens and admission.
However, whether those increased screens and admission would increase local film
output and financial performance would also depend on the financial capability, i.e., the
economic development of the country. Therefore, for the development of film industry, a
country’s level of economic development plays the most important role.
As to the piracy rate, the study failed to find any link between GDP and piracy
level. Other variables, such as regulation variables and demographic variables, played
much more important roles.
Market Openness and National Film Development
As elaborated in previous chapters, the free market paradigm based on pure
economic analysis and argued that free trade with no government constrains benefit both
trade partners. Media industry should be regulated by the same market forces and free
trade rules just as any industry. In reality, however, the increased liberalization in the film
industry seemed to correspond with increased Hollywood dominance and declining
performance of films from other countries. Existing literature finds no agreement on the
effect of trade liberalization on the film industry.

184
This study used three market structure variables to indicate the degree of market
openness, the EFW Index, the Openness Index, and the co-production rate in films. These
three variables each measure different aspects of the market structures.
The EFW Index measures the degree that government supports economic freedom.
Countries with more economic freedoms are supposed to have more developed industries
and have less need for trade protections. The result of this study showed that, the EFW
index showed positive impacts on box office revenue, film investment, and consumer
spending, however, the impact was short-term. Further, the EFW index showed negative
impacts on domestic films’ market share and the total number of screens and both of the
effects were long-lasting over the years. It seemed to say that having a more
commercialized and privatized industry did contribute to the total revenues of the film
industry. However, these revenues may not come from domestic industry, and therefore
were not used in the development of domestic industry. More foreign films come into
domestic market, and therefore reduced the share of domestic films and further cut
domestic productions. Further, because the increased box office revenue and investment
are not used on domestic productions, they might be used in productions that compete
with domestic films. Therefore, increased economic freedom may increase market
erosion from import competitors and reduce the film performance for domestic industry.
One positive effect of market openness in the EFW index was the increased
diversity of film imports. Because of the overall freedom of economic activities and trade,
more films are entered into the market, and therefore, the overall diversity of film imports
improves.

185
The Openness Index reflects the overall trade relations of a country. It was
measured as the rate of total trade flows (import and export) to total GDP. A country with
more trade flows indicates a good trade relation with partners. Compared with the EFW
index, the Openness Index showed more positive impacts on domestic films. It was a
positive factor in increasing domestic productions and film exports and both of the
impacts were long-lasting during the studied years. The OI also showed positive
contributions to two of the four film operation variables. It was a positive factor in
increasing both film investment and consumer spending, although only the impact on
consumer spending was long-lasting for the studied years. These increased financial
inputs, however, may not be turned into more admissions and more revenues from the
theater, as revealed by the OI’s non-significant coefficients with audience admission and
box office revenue.
Co-production rate measures the percentage of films that are produced through
international cooperation, including direct foreign investment in local productions,
forming alliances with local partners through joint ventures, and cooperative arrangement
in productions. Co-production is believed to be a good method of increasing product
investment, improving product attractiveness, and opening more markets overseas.
Empirically, one study (Ren, 2006a) found co-production contributes to film export into
the European Union markets. The current study failed to find the impact of co-production
on film export. It did find, however, that co-production decreased the market share of
domestic industry during the studied years. Therefore, co-production might fail to
increase the attractiveness and competitive advantage of films in a market. However,
because of the complexity in operation, some co-productions might not be categorized as

186
domestic films, and therefore not accounted for the domestic market share. Further
examination of the details might better explain this result.
In addition, many believe that co-productions are effective ways of attracting
product investment. This study did show co-production have a positive contribution to
film investment. But this investment did not turn into increased film performances either
on production, operation, or consumption. Therefore, the overall benefit of using co-
productions to improve domestic film industry might be very limited. Further, the study
also showed a negative impact of co-production on import diversity. Countries with co-
production treaties may favor each other in film imports, and therefore exclude countries
that are outside of the treaty, and therefore reduce the overall diversity of total film
imports.
Regulatory Factors
Government Effectiveness (GE) index reflects the effectiveness of government
regulations and efficiencies of government in reinforcing the regulations. Countries with
a more efficient government are also expected to be more efficient in helping their
industries to grow. The study found that, government effectiveness played important
roles in increasing film production, market share, and operation scale in screens. These,
in turn, help to increase overall consumer admissions in films. Except for market share,
all of the other three impacts were long-lasting. Although the market performance cannot
be determined administratively by the government, the impact of an efficient government
was mostly positive in helping with the development of domestic film industry. An
efficient government also helped reduce film piracy and the effect was long-lasting. The

187
reduced loss from piracy activities might further help to improve screen scale and
increase local productions.
On the other hand, the GE index had negative impact on the diversity of film
import, therefore implying some welfare lost for consumers. Given strong regulation and
control, imports are most likely to depend on government selection and favor instead of
on market demand.
Contribution of Cultures
The success of films in a market is partly determined by audiences, and audiences
are people whose preferences and tastes are shaped by the culture they live in. Many
factors help form the audience consumption decisions. Among them, culture is an
important one. In film consumption, audiences tend to prefer products that have less
culture or language barriers. Therefore, films trade more to culture or language proximate
countries. In the same sense, cultural proximate countries to the U.S. may encounter more
penetration from Hollywood films, and therefore have more need for trade protections.
This implied that the distance of cultures from the U.S. has some implications for the
development of domestic film industry.
The study used three culture variables and each of the three variables measured
one different aspect of cultural distance to the U.S. Hofstede’s cultural dimensions are
most widely used in empirical research. Because these dimensions are based mainly on
the attitude survey of company employees, they mostly reflect the accepted
organizational structures and work-related values in a society. Tadesse & White (2008a,
2008b) calculated cultural distance based on worldwide surveys on much wider social,
economic, and political topics. Therefore, Tadesse’s cultural distance (TCD) reflects

188
more general social cultural values. Language is an indivisible part of social culture.
Language proximity also has a great impact on film export and consumptions. This study
used the language Index developed by Chiswick and Miller to measure the language
distance to English language with a higher score indicate language proximity to English
language.
The study found that, due to the different measurements of these three cultural
variables, they also showed different impacts on domestic film development. Hofstede’s
cultural distance (HCD) showed mostly negative impacts on the development of national
film industry. That is, closeness in business and work value to the U.S. developed more
advanced domestic film industries. Specifically, in the short-run, cultural closeness in
Hofstede’s cultural dimension positively increased domestic film’s market share, export,
total screen, box office revenues, investment, and consumer spending. It showed no
significant impact on consumer admission. This result was interesting and seemed to
indicate that the Hofstede’s cultural dimension affect more on the operation of businesses
than on consumers. It also implied the advantages of U.S. companies in their ways of
doing business. However, most of the impact of HCD was short-termed, except for its
impact on investment. Therefore, as the U.S. business model was adopted worldwide, the
impact of the cultural differences in that measure became less significant.
In contrast, Tadesse’s cultural distance pointed to a different direction. TCD
measures the distance of social cultural values on much wider topics and therefore,
reflects more on audience taste and preference than HCD. The result showed that TCD
have consistent and positive impacts on all of the three film output variables, production,
market share, and export. Cultural distance from the U.S., therefore, might reduce the

189
degree of market erosion from Hollywood films, and played a positive role in facilitating
the national film development. TCD also had a long-term contribution to film production
investment. However, these increased production and investment seemed not to turn into
more audiences and revenues. To the contrary, TCD showed negative impact on box
office revenues and total admissions. Because cultural values that are reflected in TCD
are implanted in people’s everyday life, they are much harder to change. Therefore, most
of the impact of TCD was long-lasting.
Finally, previous studies established a positive link between language closeness
and cultural exports in art, film, and television programs (Dupagne & Waterman, 1998;
Hanson & Xiang, 2006; Marvasti, 1994; Marvasti & Canterbery, 2005; Schulze, 1999).
This study confirmed with the previous research. It found that closeness in language with
the U.S. would significantly increase a country’s film export, but the effect was not long-
lasting. Language closeness also helped increase film investment and total consumer
admissions. Because of the emerging importance of cultural-language market, investors
that expect a large cultural market would respond with more investment and better
quality of films, which in turn would draw more audiences to the theaters. Similarly,
increased audiences would turn into increased film screens. This was indicated by the
long-term effect of language closeness in increasing film screens. However, language
proximity also showed a short-term negative impact on domestic market share. This was
due, possibly, to the market erosion of Hollywood films.

190
Limitation and Recommendations for Future Research
The study investigated the effect and effectiveness of trade protection policies on
the development of national film industry across an eight-year period from 2000 to 2007.
Several limitations exist in the current research.
First, the research was mainly constrained by the availability of data. The study
was mainly empirical in nature. It was based on quantitative research methodologies and
relied on large quantities of fact-based statistics to explore the practical functions of trade
barriers. The statistics covered wide areas of social, economic, regulatory, and cultural
parameters that play important roles in the function of trade barriers. The availability of
data affected not only what variables that can be included in the study, but also how the
variables can possibly be defined. For instance, as discussed earlier, the volume of film
trade could be best represented by the actual revenues films receive from importing
markets, plus the sale of visible products (prints, video tapes) and invisible products
(services and IP rights). However, because of the unavailability of data, this study only
included the revenues received from the physical prints of films that are shipped across
borders.
Similarly, the study used import diversity as an indicator of film consumptions. A
better method of defining consumption diversity would include not only import diversity,
but also production diversity and actual consumption diversity. Evaluation of total films
screened in current markets would better reveal diversity of films supplied in a market.
However, collecting those data in different markets were beyond the scope of the current
study.

191
Second, the study incorporated a cross-time effect of trade protective methods. It
spanned eight years period of time from 2000 to 2007. Dramatic change in the film
industries occurred since the last ten years of the last century, and the change is still an
ongoing process. To better answer the change of effectiveness of trade protections in
relation to technological advancement, further studies need to extend to more years and
examine a longer period of time. Further, the study did show that some of the TB
variables changed their direction of impacts over the studied period of time. Although the
impacts were not significant, the significance of their impacts over longer periods of time
might appear. In this sense, studies that cover longer periods of time would further
validate the results of the study.
Third, the study use time-series auto-regression techniques to explore the effect of
trade protection methods across time. Given the availability of more data on trade barriers
and industry variables, further studies that extend to longer periods of time would allow
the use of more sophisticated time-series analysis techniques and offer more insights.
Concluding Remarks
Film products play too much of an important role to allow for foreign market
domination. However, the huge production scales and scopes of the U.S., together with
the cultural, economic, and technical advantages of the Hollywood industry make the
industries of most other countries incomparable. For most countries, maintaining a viable
domestic film industry is beyond any economic means. Government interventions are
needed for these countries to preserve their own film productions and to promote
diversities to the global film market.

192
Criticisms toward cultural protective policies and their negative impacts on
national film development are mainly over-stated and not supported by the study. Trade
protections, overall, have positive impact on preserving both domestic productions and
market share. It also helps to increase the operation scales and financial output of the
industry. Trade protections also proved to have positive contribution to the diversity of
films consumed in a market, therefore, also have welfare implications.
Further, protective trade regulations are combinations of various different trade
protective policies. These policies differ in their functions. The directions of their impacts
on the film performance indicators also differ. Therefore, policy makers need to take
careful consideration on the specific conditions of their markets and the particular
political/economic goals of the government in order to come up with policy combinations
that best suit their needs.
The claim that trade protection policies are ineffective and obsolete with the
development of new technologies is also exaggerated, at least during the time period of
this study. Although technological advancements create new problems for the traditional
trade protection techniques, they did not outdate the overall protections. The significance
of the impact of some trade protections methods became even stronger, considering the
time effect.
The study showed that the economic variables play a single most important role in
determining national film production and performance. Cultural factors also affect
national films in various ways. However, those two factors are relatively stable. For
countries with less developed national economies and cultures unfavorable for
competition in current market environment, they can still boost their domestic industries

193
in two ways. One way is to extend their markets overseas. Larger markets will attract
more production investment, which, in turn, results in high quality films and more
audiences. One possible result of opening the trade market, however, would be inviting
more competition from imports. Therefore, the impact on domestic market is unclear.
The other option is to improve government regulations and reinforce efficiencies. In this
study, government efficiencies played positive roles in improving domestic productions
and market share, as well as increasing film screens and total admissions. Qualitative
trade protections also helped promote domestic production and market share. Depending
on the combination of different trade protective methods, protective trade policies can
play an overall positive role toward benefiting domestic industry.
Under the current conditions when cultural industries were under immense
pressure from global trade regimes and regional trade agreements, the fight between trade
liberation and cultural protections is further intensified. Politicians, policy makers, and
industry professionals need to look empirically at the functional part of trade policies, in
addition to the symbolic meanings some trade protectionism instruments may have, in
order to come up with policies that best suit the need of their countries.
194
REFERENCES
Acheson, K., & Maule, C. (1990). Canadian Content Rules: A Time for Reconsideration.
Canadia Public Policy, 16(3), 284-297.
Acheson, K., & Maule, C. (1992). Canadian content rules for television: Misleading
lessons for Europe. Journal of Cultural Economics, 16(1), 13-23.
Acheson, K., Maule, C., & Filled, E. (1989). Folly of Quotas on Films and Television
Programmes. World Economy, 12(4), 515-524.
Al-Rafee, S., & Cronan, T. (2006). Digital Piracy: Factors that Influence Attitude toward
Behavior. Journal of Business Ethics, 63(3), 237-259.
Andrés, A. R. (2006). Software Piracy and Income Inequality. Applied Economics Letters,
13(2), 101-105.
Antola, L., & Rogers, E. M. (1984). Television Flows in Latin America, Communication
Research (Vol. 11, pp. 183).
Appleyard, D. R., Field, A. J., & Cobb, S. L. (2006). International economics (5th ed.).
Boston: McGraw-Hill/Irwin.
Bagella, M., & Becchetti, L. (1999). The Determinants of Motion Picture Box Office
Performance: Evidence from Movies Produced in Italy. Journal of Cultural
Economics, 23(4), 237-256.
Banerjee, D., Khalid, A. M., & Sturm, J.-E. (2005). Socio-economic development and
software piracy: An empirical assessment. Applied Economics, 37(18), 2091-2097.

195
Bernier, I. (2003a). Audiovisual Services Subsidies Within The Framework Of The
GATs: The Current Situation And Impact Of Negotiations Retrieved December 3,
2006, from Cultural Diversity http://www.diversite-
culturelle.qc.ca/fileadmin/documents/pdf/update0308.pdf
Bernier, I. (2003b). Developing Countries and the Plan for an International Convention
on Cultural Diversity Retrieved December 3, 2006, from Cultural Diversity
http://www.diversite-culturelle.qc.ca/fileadmin/documents/pdf/update0306.pdf
Bernier, I. (2003c). Local Content Requirements for Film, Radio, and Television as a
Means of Protecting Cultural Diversity: Theory and Reality. Retrieved January 15,
2007, from Cultual Diversity http://www.mcc.gouv.qc.ca/diversite-
culturelle/eng/pdf/update031112section1.pdf
Biltereyst, D. (1996). The cultural imperialism thesis and qualitative audience research--
more than revisionism and cultural populism? COMMUNICATIO: South African
Journal for Communication Theory and Research 22(2), 2-13.
Boisso, D., & Ferrantino, M. (1997). Economic Distance, Cultural Distance, and
Openness in International Trade: Empirical Puzzles. Journal of Economic
Integration 12(4), 456-484.
Boyd, R., Doroodian, K., & Abdullatif, S. (1993). The Effects Of Tariff Removals On
The North-American Lumber Trade. Canadian Journal Of Agricultural
Economics, 41(3), 311-328.
Bureau, J. C., Chau, N. H., Fare, R., & Grosskopf, S. (2003). Economic Performance,
Trade Restrictiveness and Efficiency. Review of Development.

196
Chang, B. H., & Ki, E. J. (2005). Devising a practical model for predicting theatrical
movie success: Focusing on the experience good property. Journal of Media
Economics, 18(4), 247-269.
Chau, N. H., Färe, R., & Grosskopf, S. (2003). Trade restrictiveness and efficiency.
International Economic Review, 44(3), 1079-1095.
Chiang, E. H. (2007). The UNESCO Convention on the Protection and Promotion of the
Diversity of Cultural Expressions: A Look at the Convention and Its Potential
Impact on the American Movie Industry. Washington University Global Studies
Law Review, 6(2), 379-403.
Chiou, J.-S., Huang, C.-y., & Lee, H.-h. (2005). The Antecedents of Music Piracy
Attitudes and Intentions. Journal of Business Ethics, 57(2), 161-174.
Chiswick, B. R., & Miller, P. W. (2005). Linguistic Distance: A Quantitative Measure of
the Distance Between English and Other Languages. Journal of Multilingual &
Multicultural Development, 26(1), 1-11.
Collins, R. (1993). The Internationalization of the Television Program Market: Media
Imperialism or International Division of Labor? The Case of the United Kingdom.
In E. M. Noam & J. C. Millonzi (Eds.), The International market in film and
television programs (pp. 125-146). Norwood, N.J.: Ablex Pub. Corp.
Cowen, T. (1998). French Kiss-Off: How protectionism has hurt French films Retrieved
August 20, 2008, from http://www.reason.com/news/show/30691.html
Coy, P. ( 2000, August 28). The Creative Economy. BusinessWeek magazine.

197
Crane, D. (2002). Culture and Globalization: Theoretical Models and Emerging Trends.
In D. Crane, N. Kawashima & K. Kawasaki (Eds.), Global culture: media, arts,
policy, and globalization. New York: Routledge.
Crane, D., Kawashima, N., & Kawasaki, K. (2002). Global culture: media, arts, policy,
and globalization. New York: Routledge.
Dardana, R. (2004). Decoding the Effects of Trade Volume and Trade Policies on
Economic Growth: A Cross-Country Investigation. Economics Working Paper
Archive at WUSTL / International Trade.
Dardis, R. (1986). Government intervention and consumer welfare: The impact of
international trade restrictions. Journal of Consumer Policy, 9(3), 243-260.
Dardis, R., & Cooke, K. (1984). The impact of trade restrictions on U.S. apparel
consumers. Journal of Consumer Policy, 7(1), 1-12.
De Vany, A. S., & Walls, W. D. (1999). Uncertainty in the Movie Industry: Does Star
Power Reduce the Terror of the Box Office? Journal of Cultural Economics,
23(4), 285-318.
Disdier, A.-C., Tai, S. H. T., Fontagne, L., & Mayer, T. (2007). Bilateral Trade of
Cultural Goods. CEPII Research Center Working Papers 2007-20,
Diversity, T. A. C. f. C. (2004). Australia and US FTA briefing on Cultural Services and
Trade Retrieved January, 1, 2006, from
http://www.screenquota.com/home2/down.asp?filename=Australia-
US%20FTA%20Briefing.doc

198
Duarte, L. G., & Cavusgil, S. T. (1996). Internationalization of the video industry:
Unresolved policy and regulatory issues. Columbia Journal of World Business,
31(3), 88-99.
Dupagne, M., & Waterman, D. (1998). Determinants of U.S. television fiction imports in
Western Europe. Journal of Broadcasting & Electronic Media, 42(2), 208.
Eichengreen, B., & Irwin, D. A. (1998). The Role of History in Bilateral Trade Flows. In
J. A. Frankel (Ed.), The Regionalization of the World Economy (Vol. 2008, pp.
33-62). Chicago: University of Chicago Press.
Evans, J., & Mavondo, F. (2006). An Alternative Operationalisation Of Cultural Distance
Retrieved November 24, 2008, from http://www.onepine.info/Evans3.pdf
Felbermayr, G. J., & Toubal, F. (2007). Cultural Proximity and Trade Retrieved
November 20, 2008, from SSRN: http://ssrn.com/abstract=1133987
Francois, P., & Ypersele, T. v. (2002). On the Protection of Cultural Goods. Journal of
International Economics, 56, 359–369.
Frankel, J. A., Stein, E., & Wei, S.-J. (1997). Regional trading blocs in the world
economic system. Washington, DC: Institute for International Economics.
Fu, W. W. (2006). Concentration and Homogenization of International Movie Sources:
Examining Foreign Film Import Profiles. Journal of Communication, 56(4), 813-
823.
Guback, T. H. (1969). The international film industry; Western Europe and America
since 1945. Bloomington,: Indiana University Press.
Guback, T. H. (1974). Film as International Business. Journal of Communication, Winter,
90-101.

199
Guetzkow, J. (2002). How the Arts Impact Communities: An introduction to the literature
on arts impact studies. Center for Art and Cultural Policy Studies at Princeton
University.
Hanson, G. H., & Xiang, C. (2004). The Home-Market Effect and Bilateral Trade
Patterns. American Economic Review, 94(4), 1108-1129.
Hanson, G. H., & Xiang, C. (2006). International Trade in Motion Picture Services.
Retrieved August, 2006 from:
http://www.nber.org/books/criws06/criws06/hanson.pdf.
Helpman, E., & Krugman, P. R. (1985). Market structure and foreign trade : increasing
returns, imperfect competition, and the international economy. Cambridge, Mass.:
MIT Press.
Hesmondhalgh, D. (2002). The cultural industries. London: SAGE.
Hester (1973). Theoretical consideration in predicting volume and direction of internal
information flow. Gazette, 19, 238-247.
Hofstede, G. H. (1980). Culture's consequences, international differences in work-related
values. Beverly Hills, Calif.: Sage Publications.
Hofstede, G. H., & Bond, M. H. (1988). The Confucius connection: From cultural roots
to economic growth. Organizational Dynamics, 16(4), 5-21.
Hollifield, A. C. (2004). The Economics of International Media. In Alexander (Ed.),
Media Economics: Theory and Practice (3rd ed., pp. 85-106). Mahwah, N.J.:
Lawrence Erlbaum.

200
Hoskins, C., & McFadyen, S. (1991). The U.S. Competitive Advantage in the Global
Television Market: Is it Sustainable in the New Broadcasting Environment?
Canadian Journal of Communication, 16(2).
Hoskins, C., & Mirus, R. (1988). Reasons for the U.S. dominance of the international
trade in television programs. Media, Culture & Society, 10(4), 499-504.
Hoskins, C., McFadyen, S., & Finn, A. (1997). Global television and film : an
introduction to the economics of the business. Oxford: Oxford University Press.
Hoskins, C., Mirus, R., & Rozeboom, W. (1989). U.S. television programs in the
international market: Unfair pricing? Journal of Communication, pp. 55-75. .
Hufbauer, G., & Warren, T. (1999). The Globalization of Services: What Has Happened?
What Are the Implications? Retrieved April 5, 2007, from Institute for
International Economics http://www.petersoninstitute.org/publications/wp/99-
12.pdf
Huhmann, B. A., & Saqib, N. U. (2007). Effects of Changing Public Policies of Cultural
Protectionism on Sources of Cultural Identity and Consumer Information. Journal
of Public Policy & Marketing, 26(1), 75-88.
Husted, B. W. (2000). The Impact of National Culture on Software Piracy. Journal of
Business Ethics, 26(3), 197-211.
IIPA (2007). IIPA's Special 301 Report: Submitted to the U.S. Trade Representative by
the International Intellectual Property Alliance available at
http://www.iipa.com/special301.html.
INCP (2003). Draft International Convention On Cultural Diversity. By The Working
Group On Cultural Diversity And Globalization. To Be Presented To Ministers At

201
The 6th Annual Ministerial Meeting Of The International Network On Cultural
Policy In Opatije, Croatia, October 16-18, 2003.
Iwabuchi, K. (2007). Contra-flows or the cultural logic of uneven globalization? Japanese
media in the global agora. In D. K. Thussu (Ed.), Media on the move: global flow
and contra-flow (pp. 67-83). London ; New York: Routledge.
Jayakar, K. P., & Waterman, D. (2000). The Economics of American Theatrical Movie
Exports: An Empirical Analysis. Journal of Media Economics, 13(3), 153-169.
Jensen, J., & Tarr, D. (2008). Impact of Local Content Restrictions and Barriers Against
Foreign Direct Investment In Services The Case Of Kazakhstan's Accession To
The World Trade Organization. Eastern European Economics, 46(5), 5-26.
Jin, D. Y. (2004). Is Cultural Imperialism Over: Growing U.S. Dominance vs. Emerging
Domestic Cultural Market. Accessed from
www.aejmc.org/convention/03Abstracts/03ccsabs.html May, 2006
Jin, D. Y. (2008). Cultural coup d’etat: The Changing Roles Of Unesco And Local
Government On Cultural Sovereignty. Javnost - The Public, 15(1), 5-22.
Kalirajan, K. (2001). Restrictions on Trade in Distribution Services. Labor and
Demography 0105008, EconWPA.
Kaufmann, D., Kraay, A., & Mastruzzi, M. (2008). Governance Matters VII: Governance
Indicators for 1996-2007. World Bank Policy Research Working Paper No. 4654
June 2008.
Ki, E.-J., Chang, B.-H., & Khang, H. (2006). Exploring Influential Factors on Music
Piracy Across Countries. Journal of Communication, 56(2), 406-426.

202
Kim, J. (2000). The Cultural Exception under the International Trade Regime Retrieved
November 24, 2008, from
http://www.screenquota.org/english/meu/library/libraryjoongikim1.htm
Kim, y. (2007). The Rising East Asian ‘Wave’: Korean Media Go Global In D. K.
Thussu (Ed.), Media on the move: global flow and contra-flow (pp. 135-152).
London ; New York: Routledge.
Kogut, B., & Singh, H. (1988). The Effect of National Culture on the Choice of Entry
Mode. Journal of International Business Studies, 19(3), 411-432.
Krugman, P. R. (1980). Scale Economies, Product Differentiation, and the Pattern of
Trade. American Economic Review, 70, 950-959.
Krugman, P. R. (1991). Increasing Returns and Economic Geography. Journal of
Political Economy, 99(3), 483-499.
Krugman, P. R. (2000). Is Free Trade Passe? In P. King (Ed.), International economics
and international economic policy : a reader (3rd ed., pp. 19-29). Boston: Irwin
McGraw-Hill.
Kwok, K.-W., & Low, K.-H. (2002). Cultural policy and the city-state: Singapore and the
“New Asian Renaissance”. In D. Crane, N. Kawashima & K. Kawasaki (Eds.),
Global culture: media, arts, policy, and globalization. New York: Routledge.
Kwong, K. K., Yau, O. H. M., Lee, J. S. Y., Sin, L. Y. M., & Tse, A. C. B. (2003). The
Effects of Attitudinal and Demographic Factors on Intention to Buy Pirated CDs:
The Case of Chinese Consumers. Journal of Business Ethics, 47(3), 223-235.

203
Lee, B. K., & Bae, H. S. (2004). The Effect of Screen Quotas on the Self-sufficiency
Ratio in Recent Domestic Film Markets. Journal Of Media Economics, 17(3),
163-176.
Lee, H. (2008). An Economic Analysis of Protective Film Policies: A Case Study of the
Korean Screen Quota System. Paper presented at the annual meeting of the
International Communication Association. from
http://www.allacademic.com/meta/p14967_index.html
Lee, J.-W., & Swagel, P. (1997). Trade Barriers And Trade Flows Across Countries And
Industries. Review of Economics and Statistics, 79(3), 372-382.
Lee, P. S.-n. (1994). Mass Communication and National Development in China: Media
Roles Reconsidered. Journal of Communication, 44(3), 22-37.
Lee, S. Y., Kim, E.-m., & Kim, Y. I. (2008). The Effect of the Korean Screen Quota
System on Box Office Performance. Journal of World Trade, 42(2), 335-346.
Liebes, T., & katz, E. (1990). The export of meaning: Cross-cultural readings of Dallas.
New York: Oxford University Press.
Lozano, J. C. (1996). Media Reception on the Mexican Border with the United States. In
E. G. McAnany & K. T. Wilkinson (Eds.), Mass media and free trade: NAFTA
and the cultural industries (1st ed., pp. 157-186). Austin: University of Texas
Press.
Marron, D. B., & Steel, D. G. (2000). Which Countries Protect Intellectual Property? The
Case of Software Piracy. Economic Inquiry, 38(2), 159-174.
204
Martin, C. (1996). Walking on a Tightrope: The Markets of Cultural Products in Québec.
In E. G. McAnany & K. T. Wilkinson (Eds.), Mass media and free trade: NAFTA
and the cultural industries (1st ed.). Austin: University of Texas Press.
Martin, C. (2004). Cultural Industry Economics. Paper presented at the 6th World Media
Economics Conference, at Montréal, Canada. from
http://www.cem.ulaval.ca/pdf/martin.pdf
Marvasti, A. (1994). International Trade in Cultural Goods: A Cross-Sectional Analysis.
Journal of Cultural Economics, 18, 135-148.
Marvasti, A. (2000). Motion Pictures Industry: Economies of Scale and Trade.
International Journal of Economics of Business, 7(1), 99-114.
Marvasti, A., & Canterbery, E. R. (2005). Cultural and other barriers to motion pictures
trade. Economic Inquiry, 43(1), 39-55.
Mason, P. (2003). Assessing the impact of Australian music requirements for radio. Paper
prepared for the Music Council of Australia Retrieved December 30, 2008, from
http://www.mca.org.au/web/content/view/104/6
Maswood, J. (2000). International political economy and globalization. Singapore River
Edge, NJ: World Scientific.
McCalman, P. (2005). International diffusion and intellectual property rights: An
empirical analysis. Journal of International Economics, 67(2), 353-372.
Mehta, R. (2000). Removal Of Qrs And Impact On India's Import. Economic And
Political Weekly, 35(19), 1667-1671.
Middleton, J. (2003). The effectiveness of audiovisual regulation inside the European
Union: the television without frontiers directive and cultural protectionism.
205
Denver Journal of International Law and Policy, Fall, 2003 by Joe Middleton,
31(4), 607-627.
Moo-hyun, R. (2003). International Forum of Directors Organizations. Montreal
Declaration. Retrieved January 1, 2006, from
http://www.screenquota.org/epage/upload/IFDO.pdf
Moores, T. T. (2003). The Effect of National Culture and Economic Wealth on Global
Software Piracy Rates. Communications of the Acm, 46(9), 207-215.
Moreau, F., & Peltier, S. (2004). Cultural Diversity in the Movie Industry: A Cross-
National Study. Journal Of Media Economics, 17(2), 123-143.
Mosco, V. (1996). The political economy of communication: rethinking and renewal.
London, [Eng.] ; Thousand Oaks, Calif.: SAGE Publications.
MPAA (2006). Trade barriers to exports of U.S filmed entertainment. Report to the
United States Trade Representative. Washington, D.C.: Motion Picture
Association.
Noam, E. M. (1993). Media Americanization, National Culture, and Forces of Integration.
In E. M. Noam & J. C. Millonzi (Eds.), The International market in film and
television programs (pp. 41-58). Norwood, N.J.: Ablex Pub. Corp.
Nurse, K., Demas, A., Tull, J.-a., Paddington, B., O’Young, W., Gray, M., et al. (2006).
The Cultural Industries in Caricom: Trade and Development Challenges. Report
prepared for the Caribbean Regional Negotiating Machinery.
Nwaokoro, A. N. (2008). Trade-restriction policies ineffectiveness in the US steel
industry. Applied Economics Letters, 15(10), 771-776.

206
Oatley, T. (2006). International political economy : interests and institutions in the
global economy (2nd ed.). New York: Pearson/Longman.
Oh, J. (2001). International trade in film and the self-sufficiency ratio. Journal Of Media
Economics, 14(1), 31-44.
Papandrea, F. (1998). Protection of domestic TV programming. Journal Of Media
Economics, 11(4), 3-15.
Peace, A. G., Galletta, D. F., & Thong, J. Y. L. (2003). Software Piracy in the Workplace:
A Model and Empirical Test. Journal of Management Information Systems, 20(1),
153-177.
Peltier, S. (1999). The Question of the Inefficiency of Quantitative Restrictions: the case
of television quotas Communications & Strategies, 35(3), 111-159.
Peltzman, S. (1976). Toward a More General Theory of Regulation. Journal of Law &
Economics, 19(2), 211-240.
Pool, I. (1977). The Changing Flow of Television, Journal of Communication (Vol. 27,
pp. 139).
Pool, J. C., & Stamos, S. (1990). International economics : theory, policy, and practice.
Lexington, Mass.: Lexington Books.
Porter, M. E. (1986). Competition in global industries: A Conceptual Framework. In M.
E. Porter (Ed.), Competition in global industries (pp. 15-60). Boston, Mass.:
Harvard Business School Press.
Porter, M. E. (1990). The Competitive Advantage Of Nations. Harvard Business Review,
68(2), 73-93.

207
Pugel, T. A., & Lindert, P. H. (2000). International economics (11th ed.). Boston:
McGraw-Hill.
Raboy, M., Bernier, I., Sauvageau, F., & Atkinson, D. (1994). Cultural Development and
the Open Economy: A Democratic Issue and a Challenge to Public Policy.
Canadia Journal of Communications, 19(3).
Rattso, J., & Torvik, R. (1998). Economic Openness, Trade Restrictions and External
Shocks: Modeling Short Run Effects in Sub-Saharan Africa. Economic Modeling
15(2), 257-286
Rauch, J. E., & Trindade, V. (2006). Neckties In The Tropics: A Model Of International
Trade And Cultural Diversity Retrieved November 20, 2008, from
http://web.missouri.edu/~trindadev/research/cultural%20goods%20December%20
2006.pdf
Rego, C. M., & Pastina, A. C. L. (2007). Brazil and the globalization of telenovelas. In D.
K. Thussu (Ed.), Media on the move: global flow and contra-flow (pp. 99-115).
London ; New York: Routledge.
Ren, C. (2007). Determinants of Motion Picture Piracy: A Cross-Country Examination.
Paper presented at the AEJMC Conference Media Management and Economics
Division.
Renaud, J.-L. (1993). International Trade in Television Programs: Quota Policies and
Consumer Choice Revisited. In E. M. Noam & J. C. Millonzi (Eds.), The
International market in film and television programs (pp. 151-161). Norwood,
N.J.: Ablex Pub. Corp.

208
Richardson, M. (2006). Commercial Broadcasting And Local Content: The Negative
Impact Of ‘Cultural’ Quotas, Advertising Limits And Public Stations. The
Economic Journal, 116(April), 605-625.
Sanghera, B. (2000). Cultural Industry Retrieved January 15, 2006, from
http://uk.geocities.com/balihar_sanghera/cmeanastasiaculturalindustry.html
Santos-Paulino, A. (2002). Trade Liberalisation And Export Performance In Selected
Developing Countries. Journal Of Development Studies, 39(1), 140-164
Schiller, H. I. (1969). Mass communications and American empire. New York,: A. M.
Kelley.
Schiller, H. I. (1976). Communication and cultural domination. White Plains, N.Y.:
International Arts and Sciences Press.
Schiller, H. I. (1991). Not Yet the Post-imperialist Era. Critical Studies in Mass
Communication, 8(1), 13-28.
Schiller, H. I. (1996). Information inequality : the deepening social crisis in America.
New York: Routledge.
Schulze, G. G. (1999). International Trade in Art. Journal of Cultural Economics, 23,
109–136.
Schulze, G. G. (2003). International Trade. In R. Towse (Ed.), A Handbook of Cultural
Economics (pp. 269-275): Edward Elgar Publishing.
Segrave, K. (1997). American films abroad: Hollywood's domination of the world's
movie screens from the 1890s to the present. Jefferson, N.C.: McFarland.
Seo, Y. (2005). The Politics of the 'Screen Quota System' in Korea: Art, Culture, and
Film in the Age of Global Capitalism. Paper presented at the annual meeting of

209
the American Political Science Association. from
http://www.allacademic.com/meta/p42481_index.html
Shadlen, K. C., Schrank, A., & Kurtz, M. J. (2005). The Political Economy of Intellectual
Property Protection: The Case of Software. International Studies Quarterly, 49(1),
45-71.
Shin, S. K., Gopal, R. D., Sanders, G. L., & Whinston, A. B. (2004). Global Software
Piracy Revisited. Communications of the ACM, 47(1), 103-107.
Siwek, S. E. (2006). Copyright Industries in the U.S. Economy: The 2006 Report
prepared for the International Intellectual Property Alliance (IIPA), available at
http://www.iipa.com.
Sreberny-Mohammadi, A. (1997a). The Many Cultural Faces of Imperialism. In P.
Golding & P. Harris (Eds.), Beyond Cultural Imperialism (pp. 49--68). London:
Sage.
Sreberny-Mohammadi, A. (1997b). Media in global context : a reader. London; New
York, NY: Arnold.
Straubhaar, J. D. (1991). Beyond Media Imperialism: Asymmetrical Interdependence and
Cultural Proximity. Critical Studies in Mass Communication, 8(1), 39.
Straubhaar, J. D. (1996). Distinguishing the global, regional and national levels of world
television. In D. W. S.-M. Annabelle, J. McKenna & O. Boyd-Barrett (Ed.),
Media in Global Context: A Reader (pp. 195-206). New York, NY: St. Martin's
Press Inc.
210
Straubhaar, J. D., & Viscasillas, G. (1991). The reception of telenovelas and other Latin
American genres in the regional market: The case of Studies in Latin American
Popular Culture. Studies in Latin American Popular Culture, 10, 191.
Straubhaar, J. D., Campbell, & Cahoon (1994). From National to Regional Cultures: The
Five Cultures and Television Markets of NAFTA. The International Network of
UNESCO Chairs in Communications. . [On-line]. Available:
http://www.orbicom.uqam.ca/in_focus/publications/archives/straubhaar.html.
Straubhaar, J. D., Fuentes, Giraud, & Campbell (2002). Refocusing from Global to
Regional Homogenization of Television: Production and Programming in the
Latino US Market, Mexico and Venezuela. Paper presented at ALAIC conference,
Santa Cruz De La Sierra, Bolivia.
Syropoulos, C. (1992). Quantitative Restrictions And Tariffs With Endogenous Firm
Behavior. European Economic Review, 36(8), 1627-1646.
Tadesse, B., & White, R. (2008a). Cultural distance as a determinant of bilateral trade
flows: Do immigrants counter the effect of cultural differences? Applied
Economics Letters, 1-6.
Tadesse, B., & White, R. (2008b). Does Cultural Distance Hinder Trade in Goods? A
Comparative Study of Nine OECD Member Nations. Open Economies Review, 1-
25.
Thussu, D. K. (2007). Mapping global media flow and contra-flow In D. K. Thussu (Ed.),
Media on the move: global flow and contra-flow (pp. 11-32). London ; New York:
Routledge.

211
Toepler, S., & Zimmer, A. (2002). Subsidizing the Art: Government and the Arts in
Western Europe and the United States. In D. Crane, N. Kawashima & K.
Kawasaki (Eds.), Global culture: media, arts, policy, and globalization (pp. 29-
48). New York: Routledge.
Tomooka, K., Kanno, S., & Kobayashi, M. (2002). Building National Prestige: Japanese
cultural policy and the influence of western institutions. In D. Crane, N.
Kawashima & K. Kawasaki (Eds.), Global culture: media, arts, policy, and
globalization (pp. 49-62). New York: Routledge.
Tyers, R. (1985). International Impacts Of Protection - Model Structure And Results For
FC Agricultural Policy. Journal Of Policy Modeling, 7(2), 219-251.
Ulff-MØller, J. (2001). Hollywood's film wars with France: film-trade diplomacy and the
emergence of the French film quota policy. Rochester, NY: University of
Rochester Press.
UNESCO (1998). World Culture Report: Culture, Creativity and Markets. Paris: United
Nations Educations, Scientific and Cultural Organization.
UNESCO (2005). Cultural Industries, from UNESCO Bureau of Public Information
http://www.unesco.org/bpi/pdf/memobpi25_culturalindustries_en.pdf
UNESCO (2006). 25 questions and answers to explore key concepts and ideas related to
culture and trade in the context of development. Retrieved October 29, 2006, from
UNESCO Bureau of Public Information www.unesco.org/culture/industries
Waterman, D. (1988). World Television Trade - the Economic-Effects of Privatization
and New Technology. Telecommunications Policy, 12(2), 141-151.
212
Waterman, D. (1993). World Television Trade: The Economic Effects of Privatization
and New Technology. In E. M. Noam & J. C. Millonzi (Eds.), The International
market in film and television programs (pp. 59-81). Norwood, N.J.: Ablex Pub.
Corp.
Waterman, D. (2005). Hollywood's road to riches. Cambridge, Mass.: Cambridge, Mass. :
Harvard University Press.
Waterman, D., & Jayakar, K. P. (2000). The competitive balance of the Italian and
American film industries. European Journal of Communication, 15(4), 501-528.
Waterman, D., & Lee, S.-W. (2007). Theatrical Feature Film Trade in the United States,
Europe, and Japan since the 1950s: An Empirical Study of the Home Market
Effect. Journal of Media Economics, 20(3), 167-188.
Waterman, D., & Rogers, E. M. (1994). The Economics of Television Program
Production and Trade in Far-East Asia. Journal of Communication, 44(3), 89-111.
Wildman, S. S. (1995). Trade Liberalization and Policy for Media Industries: A
Theoretical Examination of Media Flows. Canadia Journal of Communications,
20(3).
Wildman, S. S., & Siwek, S. E. (1988). International trade in films and television
programs. Cambridge, MA: Ballinger Pub. Co.
Wildman, S. S., & Siwek, S. E. (1993). The Economics of Trade in Recorded Media
Products in a Multilingual World: Implications for National Media Policies. In E.
M. Noam & J. C. Millonzi (Eds.), The International market in film and television
programs (pp. xv, 202). Norwood, N.J.: Ablex Pub. Corp.

213
Winkelmann, L., & Winkelmann, R. (1998). Tariffs, Quotas And Terms-Of-Trade: The
Case Of New Zealand. Journal Of International Economics 46 (2 ), 313-332.
Zhua, S., Buongiorno, J., & Brooks, D. J. (2001). Effects of accelerated tariff
liberalization on the forest products sector: a global modeling approach Forest
Policy and Economics, 2(1), 57-78.

214
APPENDIX: LIST OF COUNTRIES AND THEIR MAJOR PARAMETERS IN YEAR 2000 AND 2007
ID country GDP a Population b EFW
Index c Openness
Index GE Index Film Export d Film Production Market Share e
2000 2007 2000 2007 2000 2006 2000 2007 2000 2007 2000 2007 2000 2007 2000 2007
1 Argentina 284.20 260.12 36.78 39.36 7.19 5.85 44.27 28.57 0.10 -
0.14 12131.99 6903.14 40.00 80.00 9.00 2 Australia 390.04 908.99 19.19 21.06 8.02 8.04 63.78 22.71 1.81 1.96 16077.28 11897.30 32.00 24.00 7.90 4.00 3 Austria 191.76 371.22 8.01 8.28 7.76 7.66 20.61 22.72 1.94 1.73 429.04 276.17 24.00 32.00 6.00 1.90 4 Bahrain 7.97 17.40 0.67 0.76 7.24 7.32 23.57 0.71 0.41 0.00 5 Belgium 232.65 454.28 10.26 10.66 7.68 7.20 16.70 12.02 1.73 1.59 1724.51 2638.87 6.00 37.00 1.00 6.50
6 Bosnia and Herzegovina 5.71 15.17 3.78 3.98 5.99 8.12
-0.83
-0.80 32.86 3.00
7 Brazil 644.28 1313.59 171.28 189.34 0.04 0.04 0.03 -
0.12 5.29 49.40 35.00 117.00 12.00 8 Brunei 6.00 12.28 0.33 0.39 5.99 6.16 0.91 0.84 9 Bulgaria 12.64 39.61 8.00 7.64 5.06 6.82 286.23 262.90 0.05 0.10 3418.43 10091.65 13.00 13.00
10 Canada 725.16 1436.09 30.65 32.88 8.12 8.05 151.97 233.72 1.92 1.92 100218.55 329370.67 72.00 111.00 3.20 11 Chile 75.20 163.91 15.21 16.58 7.28 8.06 26.78 1.15 1.22 30.39 7.00 10.00
12 China 1198.48 3280.22 1267.43 1321.05 5.73 6.29 3.89 8.30 -
0.06 0.15 2398.21 156.78 91.00 402.00 54.50
13 Colombia 94.08 202.63 42.32 47.52 5.28 5.78 4.27 3.35 -
0.32 0.03 4.40 26.29 3.00 14.00 12.00 14 Costa Rica 15.95 26.23 3.81 4.44 7.35 7.58 15.76 0.00 0.49 0.39 0.00 0.00 15 Croatia 18.40 51.26 4.38 4.44 6.10 6.35 38.72 24.05 0.36 0.54 323.86 521.63 0.00 9.00 16 Cyprus 9.32 21.30 0.69 0.79 6.22 7.35 42.96 16.89 1.16 1.37 9.89 30.69 2.00 1.00 17 Czech Republic 56.72 175.00 10.22 10.32 6.69 6.95 16.99 7.32 0.76 0.99 539.35 286.07 16.00 18.00 20.00 34.50
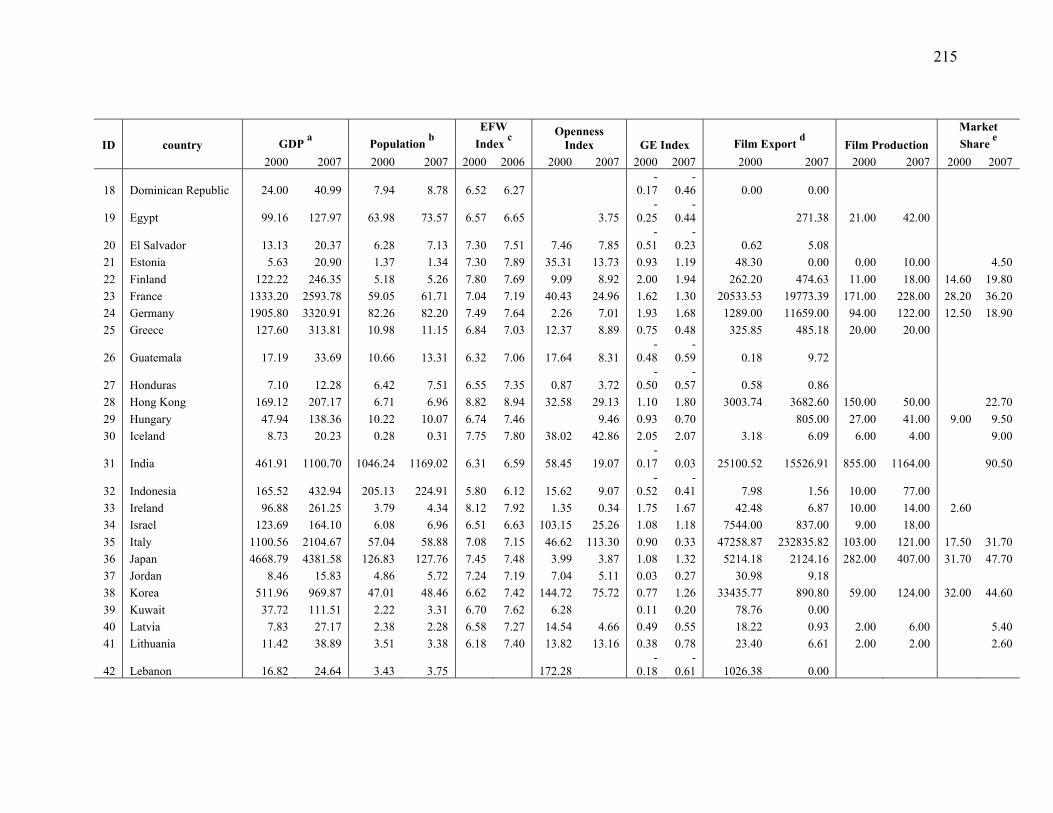
215
ID country GDP a Population b EFW
Index c Openness
Index GE Index Film Export d Film Production Market Share e
2000 2007 2000 2007 2000 2006 2000 2007 2000 2007 2000 2007 2000 2007 2000 2007
18 Dominican Republic 24.00 40.99 7.94 8.78 6.52 6.27 -
0.17 -
0.46 0.00 0.00
19 Egypt 99.16 127.97 63.98 73.57 6.57 6.65 3.75 -
0.25 -
0.44 271.38 21.00 42.00
20 El Salvador 13.13 20.37 6.28 7.13 7.30 7.51 7.46 7.85 -
0.51 -
0.23 0.62 5.08 21 Estonia 5.63 20.90 1.37 1.34 7.30 7.89 35.31 13.73 0.93 1.19 48.30 0.00 0.00 10.00 4.50 22 Finland 122.22 246.35 5.18 5.26 7.80 7.69 9.09 8.92 2.00 1.94 262.20 474.63 11.00 18.00 14.60 19.80 23 France 1333.20 2593.78 59.05 61.71 7.04 7.19 40.43 24.96 1.62 1.30 20533.53 19773.39 171.00 228.00 28.20 36.20 24 Germany 1905.80 3320.91 82.26 82.20 7.49 7.64 2.26 7.01 1.93 1.68 1289.00 11659.00 94.00 122.00 12.50 18.90 25 Greece 127.60 313.81 10.98 11.15 6.84 7.03 12.37 8.89 0.75 0.48 325.85 485.18 20.00 20.00
26 Guatemala 17.19 33.69 10.66 13.31 6.32 7.06 17.64 8.31 -
0.48 -
0.59 0.18 9.72
27 Honduras 7.10 12.28 6.42 7.51 6.55 7.35 0.87 3.72 -
0.50 -
0.57 0.58 0.86 28 Hong Kong 169.12 207.17 6.71 6.96 8.82 8.94 32.58 29.13 1.10 1.80 3003.74 3682.60 150.00 50.00 22.70 29 Hungary 47.94 138.36 10.22 10.07 6.74 7.46 9.46 0.93 0.70 805.00 27.00 41.00 9.00 9.50 30 Iceland 8.73 20.23 0.28 0.31 7.75 7.80 38.02 42.86 2.05 2.07 3.18 6.09 6.00 4.00 9.00
31 India 461.91 1100.70 1046.24 1169.02 6.31 6.59 58.45 19.07 -
0.17 0.03 25100.52 15526.91 855.00 1164.00 90.50
32 Indonesia 165.52 432.94 205.13 224.91 5.80 6.12 15.62 9.07 -
0.52 -
0.41 7.98 1.56 10.00 77.00 33 Ireland 96.88 261.25 3.79 4.34 8.12 7.92 1.35 0.34 1.75 1.67 42.48 6.87 10.00 14.00 2.60 34 Israel 123.69 164.10 6.08 6.96 6.51 6.63 103.15 25.26 1.08 1.18 7544.00 837.00 9.00 18.00 35 Italy 1100.56 2104.67 57.04 58.88 7.08 7.15 46.62 113.30 0.90 0.33 47258.87 232835.82 103.00 121.00 17.50 31.70 36 Japan 4668.79 4381.58 126.83 127.76 7.45 7.48 3.99 3.87 1.08 1.32 5214.18 2124.16 282.00 407.00 31.70 47.70 37 Jordan 8.46 15.83 4.86 5.72 7.24 7.19 7.04 5.11 0.03 0.27 30.98 9.18 38 Korea 511.96 969.87 47.01 48.46 6.62 7.42 144.72 75.72 0.77 1.26 33435.77 890.80 59.00 124.00 32.00 44.60 39 Kuwait 37.72 111.51 2.22 3.31 6.70 7.62 6.28 0.11 0.20 78.76 0.00 40 Latvia 7.83 27.17 2.38 2.28 6.58 7.27 14.54 4.66 0.49 0.55 18.22 0.93 2.00 6.00 5.40 41 Lithuania 11.42 38.89 3.51 3.38 6.18 7.40 13.82 13.16 0.38 0.78 23.40 6.61 2.00 2.00 2.60
42 Lebanon 16.82 24.64 3.43 3.75 172.28 -
0.18 -
0.61 1026.38 0.00

216
ID country GDP a Population b EFW
Index c Openness
Index GE Index Film Export d Film Production Market Share e
2000 2007 2000 2007 2000 2006 2000 2007 2000 2007 2000 2007 2000 2007 2000 2007 43 Malaysia 93.79 186.72 23.50 26.84 6.63 6.72 10.18 5.41 0.82 1.07 197.99 100.69 15.00 28.00 10.40 44 Malta 3.90 7.47 0.39 0.41 23.47 11.00 1.12 1.30 33.96 0.93 0.00 45 Mexico 628.85 1022.82 97.97 105.26 6.28 6.98 23.47 14.52 0.30 0.13 7091.25 10266.69 29.00 70.00 13.20 46 Netherlands 386.20 777.24 15.93 16.62 8.03 7.65 3.37 5.75 2.09 1.80 264.04 1077.67 25.00 30.00 5.90 13.50 47 New Zealand 52.37 128.71 3.86 4.24 8.35 8.28 21.43 3.52 1.64 1.90 1018.47 437.61 8.00 12.00 1.90
48 Nicaragua 3.94 5.72 5.05 6.05 6.59 6.99 8.61 -
0.62 -
0.91 2.02 49 Norway 168.67 389.46 4.50 4.67 7.37 7.54 13.87 11.94 1.94 2.12 99.85 109.65 10.00 22.00 16.40 50 Oman 19.87 40.39 2.40 2.57 7.04 7.32 13.14 8.77 0.54 0.38 43.33 3.25
51 Pakistan 74.08 143.77 137.53 158.17 5.45 6.05 1.08 -
0.66 -
0.62 2.23 66.00 16.00 52 Panama 11.62 19.74 2.95 3.34 7.24 7.41 22.82 0.21 0.25 0.00
53 Paraguay 7.09 11.95 5.31 6.03 6.27 6.40 1.89 -
1.10 -
0.85 0.00
54 Peru 53.32 107.40 25.21 28.07 7.06 7.16 2.69 2.40 -
0.16 -
0.44 8.51 12.30 2.00 3.00
55 Philippines 75.91 144.06 76.35 88.57 6.96 6.72 16.20 16.67 -
0.19 -
0.01 49.68 33.46 103.00 30.00 56 Poland 171.26 422.09 38.45 38.12 6.19 6.78 15.75 10.81 0.62 0.38 1067.00 1023.38 18.00 31.00 15.60 23.90 57 Portugal 112.98 223.45 10.20 10.60 7.33 7.16 20.66 21.53 1.14 0.88 113.89 2094.17 12.00 15.00 2.00 2.70 58 Qatar 17.76 73.26 0.61 0.93 2.38 0.60 0.06 18.68 0.00
59 Romania 37.06 165.98 22.12 21.56 4.95 6.66 3.29 61.70 -
0.38 -
0.09 1.00 9575.19 10.00 10.00 5.10
60 Russia 259.70 1289.54 146.90 142.10 4.93 6.12 3.21 15.03 -
0.60 -
0.40 529.04 17584.31 48.00 200.00 26.30
61 Saudi Arabia 188.69 381.94 20.47 24.29 4.20 0.96 -
0.13 -
0.18 164.29 137.72
62 Serbia & Montenegro 8.72 39.85 7.52 7.40 6.15 13.07 27.29 -
0.85 -
0.34 8.00 33.71 17.00 63 Singapore 92.72 161.35 4.03 4.59 8.51 8.57 18.81 18.94 2.21 2.41 145.51 151.72 8.00 11.00 6.10 64 Slovakia 20.30 74.99 5.39 5.41 6.16 7.61 7.50 2.05 0.45 0.76 12.66 34.51 3.00 10.00 1.10 65 Slovenia 23.03 46.08 1.99 2.01 5.82 6.38 35.20 12.63 0.81 1.08 140.27 47.71 5.00 8.00 5.40 66 South Africa 132.96 283.07 44.52 47.85 6.97 7.03 26.03 22.50 0.66 0.72 1029.23 3681.70 13.00 15.00 67 Spain 582.38 1439.98 40.26 44.87 7.29 7.38 25.81 14.85 1.72 1.00 2380.68 8744.81 98.00 172.00 9.50 13.50

217
ID country GDP a Population b EFW
Index c Openness
Index GE Index Film Export d Film Production Market Share e
2000 2007 2000 2007 2000 2006 2000 2007 2000 2007 2000 2007 2000 2007 2000 2007 68 Sweden 246.37 454.84 8.88 9.17 7.43 7.35 9.82 3.58 2.01 2.08 1435.22 99.43 38.00 28.00 24.72 21.50 69 Switzerland 250.20 427.07 7.19 7.30 8.43 8.20 61.87 26.24 2.16 2.24 1492.42 1036.62 35.00 76.00 4.70 5.30 70 Taiwan 321.37 383.35 22.28 22.96 7.28 7.63 0.89 1.05 0.00 35.00 30.00 2.10 71 Thailand 122.73 245.35 62.40 65.74 6.66 7.00 44.03 80.47 0.06 0.16 854.05 12745.83 9.00 55.00 45.00
72 Turkey 265.18 659.28 62.76 68.90 5.77 6.35 8.35 12.12 -
0.06 0.24 49.56 137.12 32.00 43.00 38.10
73 Ukraine 31.26 141.64 48.66 46.19 4.70 5.64 0.97 38.17 -
0.65 -
0.60 16.63 38.36 10.00 74 United Arab Emirates 70.22 190.74 3.00 4.49 7.01 7.49 0.81 0.86 0.00 75 United Kingdom 1480.53 2804.44 58.89 60.84 8.35 8.07 30.64 24.84 1.90 1.77 37468.48 44839.92 90.00 117.00 20.00 28.00 76 Uruguay 20.09 23.26 3.32 3.20 6.77 6.93 30.24 30.89 0.58 0.57 5.20 17.93
77 Venezuela 117.15 227.75 24.18 27.50 5.51 4.76 14.89 -
0.68 -
0.87 8.01 0.00 2.00 8.00
78 Vietnam 31.16 70.94 77.64 85.59 5.94 -
0.46 -
0.41 10.00 12.00 Note: a: GDP billion dollars b: Population in millions. c: The 2006 data was used for the EFW Index instead of 2007. d: Film export was reported in thousand dollars. e: Market share in percentage (%).