Embed Size (px)
Citation preview

INOM EXAMENSARBETE BIOTEKNIK,AVANCERAD NIVÅ, 30 HP
, STOCKHOLM SVERIGE 2017
Protein biomarkers analysis within muscular dystrophies
SANDRA MENA
KTHSKOLAN FÖR BIOTEKNOLOGI

PROTEIN BIOMARKERS ANALYSIS WITHIN
MUSCULAR DYSTROPHIES Master thesis
Author: Sandra Carolina Mena Pérez
Supervisor: Cristina Al-Khalili Szigyarto Stockholm 2017 Master’s program: Medical Biotechnology
Kungliga Tekniska Högskolan

Content
Abstract .........................................................................................................................................................1
Abstrakt .........................................................................................................................................................1
Introduction .................................................................................................................................................1
Materials and Methods ............................................................................................................................ 3
Results and Discussion ............................................................................................................................ 4
Conclusion .................................................................................................................................................. 11
Future Perspectives ................................................................................................................................. 11
Aknowledgments ..................................................................................................................................... 12
References ................................................................................................................................................. 13
Appendix .....................................................................................................................................................15
1
Abstract
Muscular dystrophies represent a group of disorders sharing common symptoms of progressive skeletal muscle
degeneration and loss of motor function. This project aimed to investigate if biomarkers from one muscular
dystrophy can be translated to other ones. An affinity-based proteomics strategy was carried out to identify
significantly elevated levels of biomarkers between samples and controls, as well as to identify distinct protein
abundance profiles between samples of different types of muscular dystrophies. Plasma and serum samples from
different cohorts were analyzed with a selected panel of biomarkers using a multiplex suspension bead array
platform. Proteins as Cadherin-5 (CDH5), Mitogen-activated protein kinase 12 (MAPK12), Fibrinogen (FGB),
Malate dehydrogenase (MDH1), Homeobox protein Nkx-6.1 (NKX6-1), Fibrinogen (FGA) and LIM/homeobox
protein Lhx5 (LHX5) showed higher signals in DMD, LGMD, GNE and Myotonic dystrophy samples of distinct
cohorts, and could be selected for possible further experimentation in a larger set of samples.
Abstrakt
Muskeldystrofi representerar en grupp av sällsynta genetiska sjukdomar som gemensamt karakteriseras av
progressiv muskel degenerering och förlust av muskel funktion. Projektet har som mål att undersöka om
biomarkörer associerade med muskelfunktion kan överföras från en muskeldystrofi till en annan. En affinitets-
baserad proteomik metod har använts för att detektera förekomst av signifikant förhöjda proteinnivåer i blodet
hos patienter i jämförelse med friska individer och identifiera distinkta protein profiler i patienter med olika
typer av muskeldystrofi. En noggrant utvald set av biomarkörkandidater har analyserats i plasma och
serumprover med hjälp av en antikropp array som möjligtgör analys av 96 proteiner i 96 prover simultant.
Proteiner som kadherin-5 (CDH5), mitogenaktiverat proteinkinas 12 (MAPK12), fibrinogen B(FGB), Malat
dehydrogenas 1 (MDH1), Homeobox-protein Nkx-6.1 (NKX6-1), Fibrinogen A (FGA) och LIM homeobox
protein 5 (LHX5) visade högre signaler i Duchenne muskel dystrophy, LGMD-, GNE- och myotoniska dystrofi-
prover från olika kohorter. Dessa proteiner utgör lovande biomarkör kandidater som kan vidare studeras i större
prov kollektioner.
Introduction
Muscular dystrophies represent a group of pathologies caused by different genetic mutations which lead to similar
symptoms of progressive skeletal muscle degeneration; affecting mainly limb, axial, and fascial muscles (Mercuri,
2013). Within each of the diseases different times of onset, progression, severity and phenotypes may be found.
The wide occurrence of phenotypes differs also depending on the gene affected.
Within the most common muscular dystrophies we may find: Duchenne muscular dystrophy, Limb-girdle
muscular dystrophy, Becker muscular dystrophy, Fascioscapulohumeral muscular dystrophy and GNE myopathy.
These muscular dystrophies have been characterized, with respect to the age of onset, genetic mutation, severity
and associated symptoms etc. (Leoyklang, 2014). For instance, Limb-girdle muscular dystrophy has been
characterized in 25 different subtypes, each one affecting a different primary protein and showing different main
symptoms, differing in autosomal or recessive inheritance, onset and severity of disease’s progression (See Table
1). Other example is Fascioscapulohumeral muscular dystrophy which is classified into two subgroups, differing
on the mutated gene, on the genetic and/or epigenetic origin of the disease as well as the symptoms and course of
the disease.
Duchenne muscular dystrophy (DMD) has a prevalence of about 1 in 3,600 to 9,337 boys worldwide (Bushby,
2010). It is caused by a frame shift mutation in the dystrophin gene which leads to the loss of its expression. This
disorder is the most common inherited muscular dystrophy and has an onset during early childhood leading to loss
of ambulance at the age of 10-14, followed by cardiac and respiratory failure at an early age (Mercuri, 2013).
Becker muscular dystrophy is a mild form of muscular dystrophy with an incidence of 1 in 20,000. This disease is
also caused by mutations in the dystrophin gene but with a conserved open-reading frame, resulting therefore in
the expression of dystrophin at a reduced level (Mercuri, 2013). As the symptoms are present in a milder form, its
onset is delayed until adult age.
Limb-girdle muscular dystrophy includes a wider group of subtypes and it is present both in childhood and
adulthood. Mutations in more than 50 loci have been reported for Limb-gridle muscular dystrophy, making its
correct diagnosis a challenge (Thompson, 2016). The disease is caused by mutations in different genes and its
clinical manifestations lead to muscle degeneration and loss of limb musculature (Pegoraro, 2000). The recessive
forms of this dystrophy are more common than the dominant variants; and depending on the type and severity, it
might lead to cardiac failure. (Mercuri, 2013)
2
Fascioscapulohumeral muscular dystrophy has an incidence of 3 per 100,000 births worldwide (Mercuri, 2013).
Onset occurs in adult life and it is a disorder of dominant inheritance and slow progression. Symptoms include
facial muscle weakness, foot drop and scapular winging. The causes are both of genetic and epigenetic nature. In
the case of FSHD1 there is a de-repression of a macrosatellite array of D4Z4 repeats on chromosome 4 which
leads to the expression of a toxic transcription factor (DUX4) (Petek, 2016). While in FSHD2; which affects fewer
individuals, the disease is caused by mutations in the gene SMCHD1; which is a member of condensin/cohesin
family of chromatin compaction complexes, and binds to the D4ZU4 repeat. (Daxinger, 2015)
GNE myopathy has also its onset at adulthood, and it is a progressive myopathy caused by a biallelic mutation in
the gene GNE, which expression permits the sialic acid synthesis pathway. This autosomal recessive rare
neuromuscular disorder leads to complete loss of ambulance after 10-20 years from onset. (Leoyklang, 2014).
Currently, its diagnosis relies on sequencing of the GNE gene and clinical trials for its treatment based on the use
of sialic acid are currently under study (Nishino, 2015).
The correct diagnose of these dystrophies require diagnostic tests that usually involve invasive methods such as
muscle biopsies, genetic tests and physical tests. Creatinine kinase (CK) levels are used to confirm the disorders;
however, CK levels may be affected by other factors and therefore does not offer a reliable diagnostic test. CK
serum levels can be easily influenced by trauma or physical exercise, and therefore does not represent a sensitive
proof to disease progression either. However, once the diagnosis is performed, the progression of the disease
involves unspecific and inconclusive tests; as well as some being unsuitable for young patient groups, such as MRI
analysis. Physical stress tests are also commonly used to monitor disease progression, but these are subjective and
unable to deliver conclusive results (Baird, 2012). All these dystrophies share characteristics of muscle
degeneration symptoms (Appendix- Table 1) and have in common that their diagnosis and prognosis represent a
challenge. The lack of specific and sensitive methods for diagnosis may delay proper diagnosis and therefore
initiation of treatment regimes.
These dystrophies greatly differ in their clinical manifestations, being characterized by progressive muscle
degeneration. Several pathophysiological pathways are involved resulting in a complex panel of symptoms
affecting, cardiac function, respiratory functions, ambulation and many other different symptoms (Bakay, 2002)
(Table 1-Appendix). Therefore, biomarkers associated with different clinical parameters are needed in order to
assess an accurate frame of the pathologies progression.
Biomarker discovery has failed to prove clinical utility of single biomarkers; therefore several efforts have emerged
in the past few years shifting towards identifying several biomarker candidates that together, can prove to be
clinically useful. A panel with different biomarkers is considered to provide a wider perspective of the muscle
tissue state during disease progression and response to therapies. The use of several biomarkers provides more
robust and conclusive results regarding diagnosis or prognosis (Hathrout 2014). The study of the transcriptome,
proteome for identification of biomarkers, is a research focus that promises clinical utility for the development of
diagnostic methods that can aid clinical management of muscular dystrophies.
DMD and BMD are the dystrophies that have been most studied. Several blood biomarker candidates have been
identified with differential abundance between healthy and diseased individuals, and a strong correlation to clinical
parameters e.g. (1) glycolytic enzymes such as Glycogen phosphorylase (PYGM), lactate dehydrogenase (LDHB),
Fructose-bisphosphate aldolase A (ALDOA), Beta-enolase (ENOB); muscle specific proteins such as titin
(TITIN), myosin light chain 1 (MYL1), Filamin C (FLNC), Myomesin 3 (MIOM3), (2) muscle-derived proteins,
Cytochrome C (CYC), (Thrombospodin 4) TSP4, Matrix metalloproteinase 9 (MMP9), myosin light chain 3
(MYL3), calsequestrin-2 (CASQ2), microtubule-associated protein 4 (MAP4), and (3) proteins involved in
metabolism and energy production carbonic anhydrase 3 (CA3) and malate dehydrogenase 2 (MDH2), electron
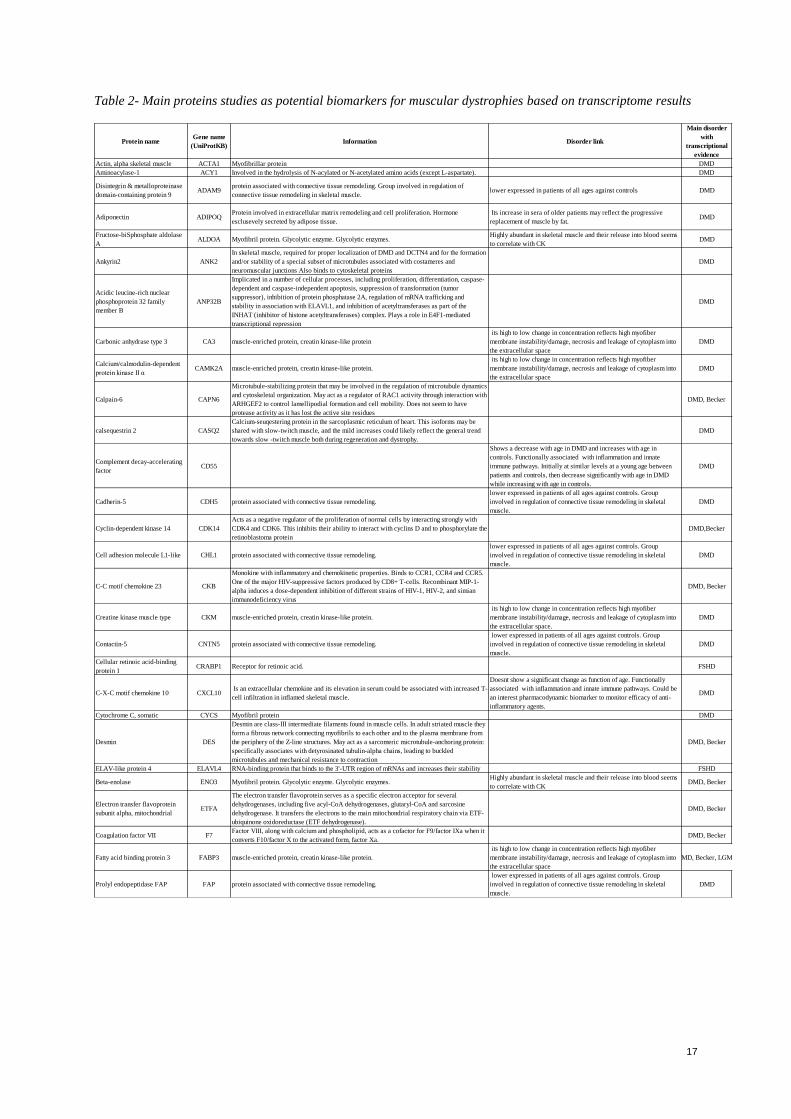
transfer flavoprotein A and B and fatty acid binding protein (FABP) (Ayoglu, 2015; Hathout, 2014).
Biomarker studies in FSHD have also shown promising results. Many of the biomarker candidates present in blood
are involved in metabolism and energy production and muscle-derived proteins e.g carbonic anhydrase (CA3),
troponin I (TNN1), fatty acid binding protein (FAPB), and matrix metallo proteinase 9 (MMP9) (also abundant in
DMD and BMD patients). Other group of proteins identified are involved in protein synthesis, folding and
degradation such as the ubiquitin-fold modifier 1 (UFM1), eukaryotic translation initiation factor 4 gamma 2
(IF4G2), vacuolar protein sorting-associated protein VTA1 homolog (DRG-1), ribosome maturation protein
(SBDS), and heat shock 70 (HSP70) all of which except for HSP70 appear to be specific of FSHD pathology
(Petek 2016). Other proteins involved in cell adhesion and fusion include 2-phosphoinositide-dependent protein
kinase 1 (PDPK1), tyrosine-protein kinase (FER), and NSFL1 cofactor p47 (NSFL1C). Finally, proteins involved
in the inflammatory response as complement 3b (C3b), B-cell tyrosine-protein kinase (BTK), killer cell
immunoglobulin-like receptor 2DL4 (KIR2DL4), tumor necrosis factor receptor superfamily member
11A(TNFRSF11A) and catalase (CAT) have been reported as potential biomarkers for FSHD (Petek, 2016).
In the case of GNE myopathy; no robust biomarkers have been identified, the current proposed ones are not very
specific and include the analysis of glycolysation/sialylation of muscle alpha-dystroglycan, neural crest cell
adhesion molecule, neprilysin and other O-glycans (Leoyklang, 2014). A table referring to the main biomarkers
reported in the literature may be found at the Appendix (Table 2).
3
Different proteomics methods are being used to identify and validate protein biomarkers. Mass-spectrometry based
proteomic for example has been used for biomarkers discovery (Hathout, 2015). However, the analysis of large
number of samples remains challenging. Within affinity-based proteomics the suspension bead array technology
(LUMINEX Corp) offers the possibility of analyzing several samples at once providing a valid rapid tool for
screening and validation of candidate biomarkers. This technology offers up to 500 parallel measurements per run
(Fredolini, 2016). Besides the previously mentioned advantages of high throughput and sensitivity, this platform
offers automated washing steps, improved kinetics and higher flexibility (Fredolini, 2016). Modified aptamer-
based technology; also known as SOMAmer, provides as well as a high specificity and sensitivity (Hathout, 2015).
The aptamer-based technology provides the possibility of a higher throughput and better sensitivity but at a larger
cost. A high demand of sensitive biomarkers has arisen in order to provide less invasive, more sensitive and accurate
diagnosis and possible tools to monitor prognosis. The purpose of this thesis is to evaluate if candidate biomarkers
for one muscular dystrophy are translatable to other muscular dystrophies. The goal of this project is to broaden
the use of biomarker from one dystrophy to the others.
Methods and materials
Antibody coupling to the beads
The selection of targets was based in choosing top candidates reported in the literature by transcriptomic data that
could be translated between the diseases. After the selection of the targets; corresponding antibodies were selected
from the Human Protein Atlas Project repository, based on their quality and previous validation.
The volume of each antibody used, was calculated according to manufacturers instructions using the following
formula: 𝑉𝑜𝑙𝑢𝑚𝑒 𝑜𝑓 𝐴𝑏[𝜇𝐿] = (500,000 𝑏𝑒𝑎𝑑𝑠)𝑥1.75𝜇𝑔 ⁄ (1 000,000 𝑏𝑒𝑎𝑑𝑠))/(𝑎𝑛𝑡𝑖𝑏𝑜𝑑𝑦 𝑐𝑜𝑛𝑐𝑒𝑛𝑡𝑟𝑎𝑡𝑖𝑜𝑛 𝑚𝑔/𝑚𝑙)
MES buffer was used to dilute the antibodies. Negative controls were also prepared with only buffer (bare beads)
and -albumin. Beads with different color IDs were selected for every antibody and control. Vials were vortexed
and 40 l of each was transferred to different wells in an U-shape bottom Greiner plate. The supernatant was
removed while the plate was placed on a magnet in order for the beads to form a pellet on the well’s bottom. Two
consecutive washes with activation buffer were performed. For each wash the plate was sealed, vortex and
centrifuged to minimize spilling. Activation buffer was added to get a final concentration of 0.5 mg/well of EDC
and NHS. The beads were incubated at room temperature at 630 rpm for 20 min followed by two consecutive
washes using the magnet with MES buffer. Diluted antibodies were added to the beads and the plate was incubated
for 2 hours at dark, room temperature at 650 rpm. After the incubation 2 washes were performed as previously
described with PBS-T (10mM Na2HPO4, 2mM KH2PO4, 137 mM NaCl, 2.7 mM KCl, 0.05 % Tween20), and final
volume of 50 l of storage buffer (Blocking reagent for ELISA (Roche) 1:9 in miliQ water, 1:1000 ProClin) was
added to quench any remaining activity. Incubation for 2 hours at room temperature at 650 rpm was performed
and the stock was storage at 4°C at dark. During coupling of antibodies to the beads in all steps performed, the
plates were protected by light, sealed, vortexed and centrifuged.
Coupling Efficiency Testing
After coupling of the beads, a coupling efficiency test was performed to evaluate the success of the coupling by
checking MFI values on the LUMINEX platform. This test would allow to calculate the number of beads required
for each well, and obtain a final count of around 100 beads per antibody for each measurement. The sample tests
were also used to assess the background signals.
Detection antibodies were prepared by mixing anti-rabbit IgG and PBS-T 0.05 %. 3 replicates
designed by adding 5 l of each bead stock into 3 different wells in a U-shape bottom Greinder plate. Detection
antibody solution prepared by a solution of anti-rabbit IgG coupled to R-PE (Sigma Aldrich) 1:2000 (1ml + 2ml
PBS-T 0.05%) was added to each of the wells. Plate was incubated for 20 min at room temperature at 650 rpm
followed by 3 washes with PBS-T 0.05 % on magnet. Final volume of 100 l PBS-T 0.05% was added to the wells
before detection using the LUMINEX platform assay. The median fluorescent intensity and the total bead count
in each well for each target analyzed; were read for every well and every analyte, which corresponded to each
initial bead stock.
Biotin-labelling of samples
Serum and plasma samples from patients affected by different muscular dystrophie,s and healthy donors were
thawed and 3 l were transferred into different wells on a microtiter plate, containing sterile and filtered PBS.
Biotin solution was prepared by solubilizing the Biotin in DMSO at a concentration of 0.01 mg/l biotin, and then
diluted to a concentration of 4 g/l biotin with filtered PBS. Biotin solution was added to each well containing
the diluted samples, plate was sealed, vortexed and centrifuged before incubation for 3 hours at 4° C with vortexing
4
every 30 min. The reaction was stopped by adding 0.5 M Tris-HCL, pH 8.0 and further incubation at room
temperature at 650 rpm for 20 min. Labelled samples were then stored at -20°C.
Incubation of samples with bead stock
1l of labelled samples was diluted on 50l of assay buffer consisting in PBS-T 0.05%, 10% v/v rabbit IgG and
1:1000 ProClin (Sigma Aldrich). Diluted samples were heat treated at 56°C for 30 min, and cooled at 23°C for
10min. Vortex and centrifuge of the heated samples followed to then, be incubated with 5l of the bead stock.
Incubation was performed overnight both at room temperature and at 4°C, at dark for 650rpm.
Analysis of samples
Incubated samples were washed 3 times with 60l of PBS-T 0.05% per well. Then 50l of PBS-T 0.05% + SAPE
at 1:750 concentration was added to each well and samples were incubated for 20min, at room temperature, dark,
650rpm. After the incubation, the plate was washed again 3 times with 60l of PBS-T 0.05% per well. Final
volume 60l of PBS-T 0.05% per well was added and assay run in the LUMINEX platform was analyzed. Initial
full clean-up of the equipment was performed. Clogs were liberated from the needle, machine was run with
sanitizing protocols and all required solutions were freshly made. Calibration and Verification kits were used to
test performance of the instrument. Luminex equipment usage
Luminex® Xponent® Software was used to run the assays.
Results and Discussion
Target and antibodies selection
In order to select candidate muscular dystrophies and candidate protein biomarkers for various muscular
dystrophies that could be assessed and analyzed, targets were selected after an extensive literature search on the
most common muscular dystrophies: Duchenne muscular dystrophy, Limb-girdle muscular dystrophy, Becker
muscular dystrophy, Fascioscapulohumeral muscular dystrophy and GNE myopathy (Burch, 2015; Daxinger,
2015: Hathout, 2016; Leoyklang , 2014; Petek, 2016).
Transcriptome analysis of each disease were used from the literature if available; in order to evaluate expression
patterns, that may have been reported as different between normal state and diseased state. 92 biomarkers were
found and selected as candidates for this study (See Table 2). The biomarkers selected were considered to be able
to provide information for at least, one of the diseases. The antibodies were obtained from the Human Protein
Atlas database repertoire. For the 92 selected proteins, validated antibodies were selected against 77 of them by a
careful selection criteria. Each antibody was reviewed, analyzed and compared with the other antibodies that were
available for the same target. Selection criteria was a balance between value scores on protein array; only
antibodies recognizing the antigen on protein arrays were considered; also, only antibodies with results of
performed western blots recognizing a protein of correct molecular weight, were accepted in the selection decision.
Antibody concentration was taken into account in order to reduce possible impediments in the experiment
performance, IH validation score was considered, giving attention to these antibodies stated to be supportive or
uncertain and not unreliable; finally, extra information of the antibody state was considered. All antibodies were
reviewed and compared one by one to select the top candidates (Appendix.Table 3- Selected biomarkers).
Experimental setup
An approach based on affinity proteomics, using the LUMINEX platform for analysis of multiplex antibody arrays
on beads in suspension, was used for the experiments. The main principle of the approach relies in the covalent
coupling of selected antibodies to color-coded magnetic beads, each of them having a unique fluorescent ID. These
beads create when mixed in a suspension, a multiplex antibody array, that when incubated with biotin-labeled
plasma and serum samples, make possible the detection of captured proteins through binding events, using a
fluorescent reporter functionalized with streptavidin (streptavidin-phycoerythrin SAPE). The LUMINEX platform
provides a capillary system similar to a flow cytometer, that has a dual laser system capable of detecting the
bead/antibody ID, as well as the SAPE intensity. Being then a powerful array for rapid screening of candidate
biomarkers and offering the advantages of a high sample throughput, flexibility and few quantities of sample
needed (Fredolini, 2016).
Samples used in these experiments provided from different cohorts of different clinical sites. The UNIFE cohort
provided by the University of Ferrara contained at total of 52 samples of which 30 were obtained from DMD
patients, 6 belonged to controls and 16 belonged to different disorders as: Limb-Girdle Muscular Dystrophy,
Spastic Ataxia, Facioscapulohumeral muscular dystrophy, Myotonic dystrophy, Episodic ataxia, Spastic parapesis,
myofibrillar myopathy, Glycogenosis, Filaminopathy and Collagen VI myopathies. UCL cohort was provided by
samples obtained from the University College of London, and included 18 plasma samples (9 controls and 9
5
samples of Limb-Girdle Muscular dystrophy patients) and 17 serum samples (9 controls and 8 samples of Limb-
Girdle Muscular dystrophy patients). LUMC cohort was obtained from the Leiden University Medical Center in
the Netherlands and contained 33 serum samples and 34 plasma samples of patients with Becker Muscular
Dystrophy however no samples of any control. NEWC cohort was obtained from the Newcastle University and
included 33 serum samples of GNE Myopathy patients and 25 serum samples of controls. A selection of samples
from the UNIFE cohort was selected in order to optimize the methods as a test sample collection. Replicates of
the methodology were performed going from low scale to big scale of number of antibodies coupled. First the
coupling was performed with a selection of 9 antibodies and 6 controls in 21 different beads IDs of different
concentrations to its assess the effect on the results. In a further experiment, a set of 77 antibodies plus two negative
controls and one positive control were then performed on 80 bead IDs divided in two batches of 35 and 44 beads
respectively. In every experiment two negative controls were used, one containing bared beads and another
containing a-albumin. rIgG was also coupled to a bead ID as a positive control.
The coupling efficiency was tested and confirmed with R-Phycoerythrin conjugated antirabbit IgG antibody before
incubation with the samples. Median Fluorescent intensity values on this coupling efficiency test were obtained as
expected to be around 1,000-5,000, considering 50 to 200 as a normal background (bead without antibodies
coupled). For all the coupled beads a MFI value was confirmed of being above 1000 for a total 100-150 beads
measured, while the negative controls showed significantly lower MFI values between 20-200,
A small set of samples from one cohort was first biotinylated and analyzed by incubation with a bead stock
prepared; which contained antibodies against CA3, MDH2, Fibrinogen and a nuclear Factor- erythroid like 2.
Changes in the protocol were performed including the usage of a different blocking buffer, and elimination of
casein in the assay buffer. This test set was used to optimize assay conditions. Several experiments were performed
to test the correct biotinylation of the samples, and the antibody coupling to the beads by changing buffers and
incubation conditions. Different concentration of antibodies for successful couplings were tested as well.
The cohort analyzed included samples from UNIFE with samples from patients affected by DMD patients, and
other disorders as Filaminopathy, Limb-Girdle Muscular Dystrophy, Spastic Ataxia, Facioscapulohumeral
muscular dystrophy, Myotonic dystrophy, Episodic ataxia, Spastic parapesis, myofibrillar myopathy,
Glycogenosis and Collagen VI myopathies as well as controls. The samples were incubated with 2 bead stocks
containing beads coupled to antibodies at different concentrations.
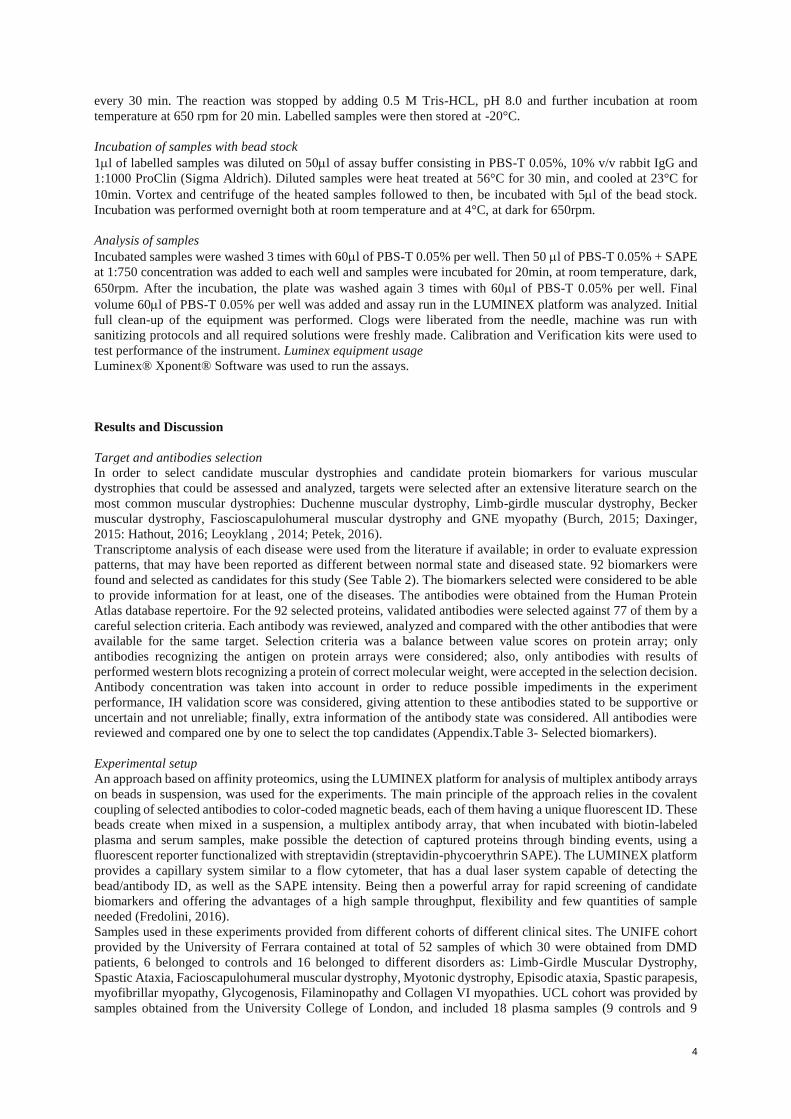
The first bead stock was performed using 1.75g of antibody solution for coupling to 500, 000 beads, whereas
during the second batch 3 g of antibody solution was used. The entire UNIFE cohort was then biotinylated and
analyzed with a set of 9 antibodies and 2 negative controls to test the blocking and the negative controls (the bare
beads and -albumin). In the bead stock coupled with 1.75g antibodies a mildly decreased signal was detected
(Entire graphics, figure 1 Appendix).
a)
6
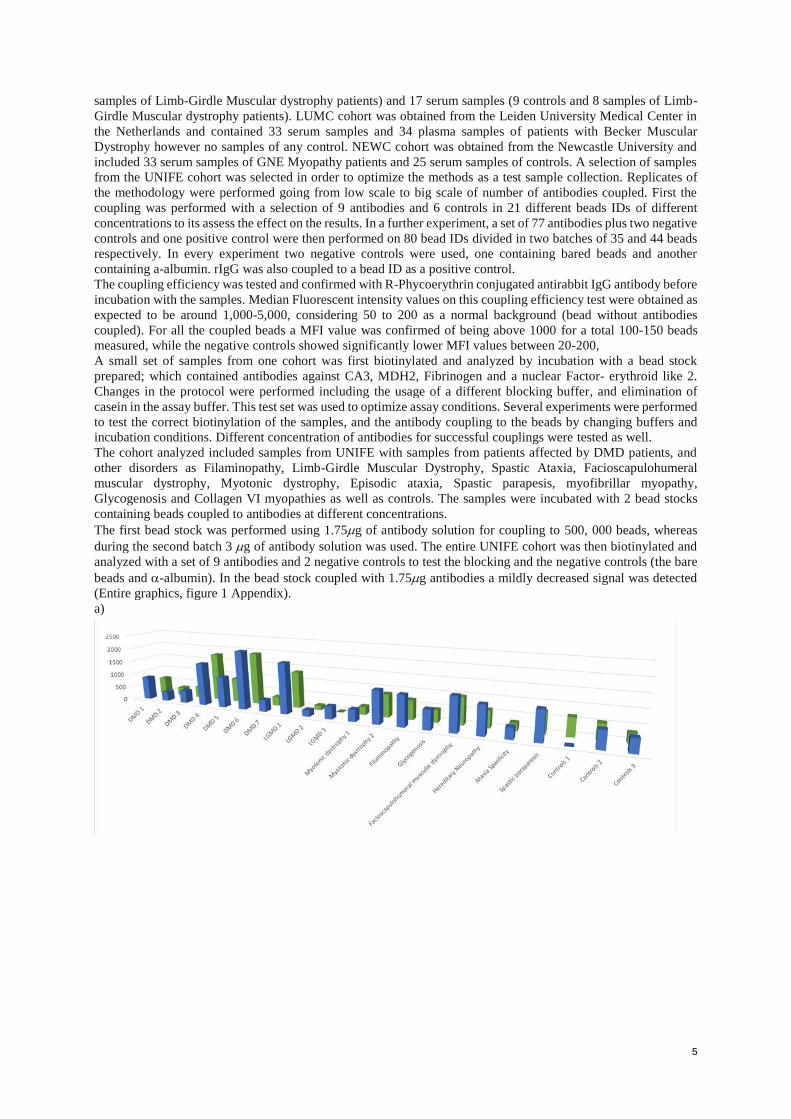
b)
Figure 1. Protein abundance measurements variation with beads coupled at two different concentrations of
antibodies. Blue bars represent measurements performed with beads labeled with antibodies in the presence of
1.75 g whereas green bars represent measurements performed with antibodies in the presence of 3.5 g. a)
MDH2 0507; b) HPA002990-Nuclear factor. MFI values in Y axis
The protocol recommended by the manufacturer was modified also with respect to the assay buffer. Experiments
were performed with an assay buffer containing PBS-7 0.05% (9:10), a freshly made rabbit IgG solution at 5mg/ml
(1:10), and Proclin (1:1000) with and without casein. When both buffers were used on a small set of beads
analyzing the entire cohort, significant changes of high signals were observed, for which it was able to conclude
that the presence of casein in the buffer assay, was interfering with the detected signal. The blocking of the beads
in the presence of casein resulted in low signals for all targets, including the positive (CA3) and the negative
control (Bare bead and a-albumin). This could be due to the possible presence of proteases or interfering proteins,
resulting therefore in a lower signal. However, the differences between the signals varied (See Appendix, Figure
1 for detailed graphics). In the case of -albumin, rabbit IgG, MDH2 0507 targeting malate dehydrogenase, HPA
001275 targeting for a transcription factor and CA3 0121 targeting for Carbonic Anhydrase, no significant
difference on the signals was observed even though it was evident a slight higher signal. However, in the case of
antibodies CA3 0122 targeting for Carbonic Anhydrase 3, HPA002990 targeting for a Nuclear Factor- erythroid
like 2 and HPA007370, a higher contrast was observed in the detected signals. Based on these results performed
on a small set of antibodies, it was concluded that a higher concentration of antibody would be more suitable when
designing a large-scale experiment, as the optimization for each antibody would be time consuming and almost
impossible. Although the protein concentration was provided and confirmed; the discrepancy observed could also
be due to the antibody purity level, or an inactivity event due to reagent handling.
The results obtained from the analysis of the UNIFE cohort confirmed what was expected; as antibodies targeting
for carbonic anhydrase 3 (CA3) and malate dehydrogenase 2 (MDH2), were found to have a higher abundance in
patients than controls; although signals were obtained in the control samples as well; this probably due to unknown
underlying condition in the controls, or engagement in physical exercise before the collection of samples (Gianola
S, 2013).
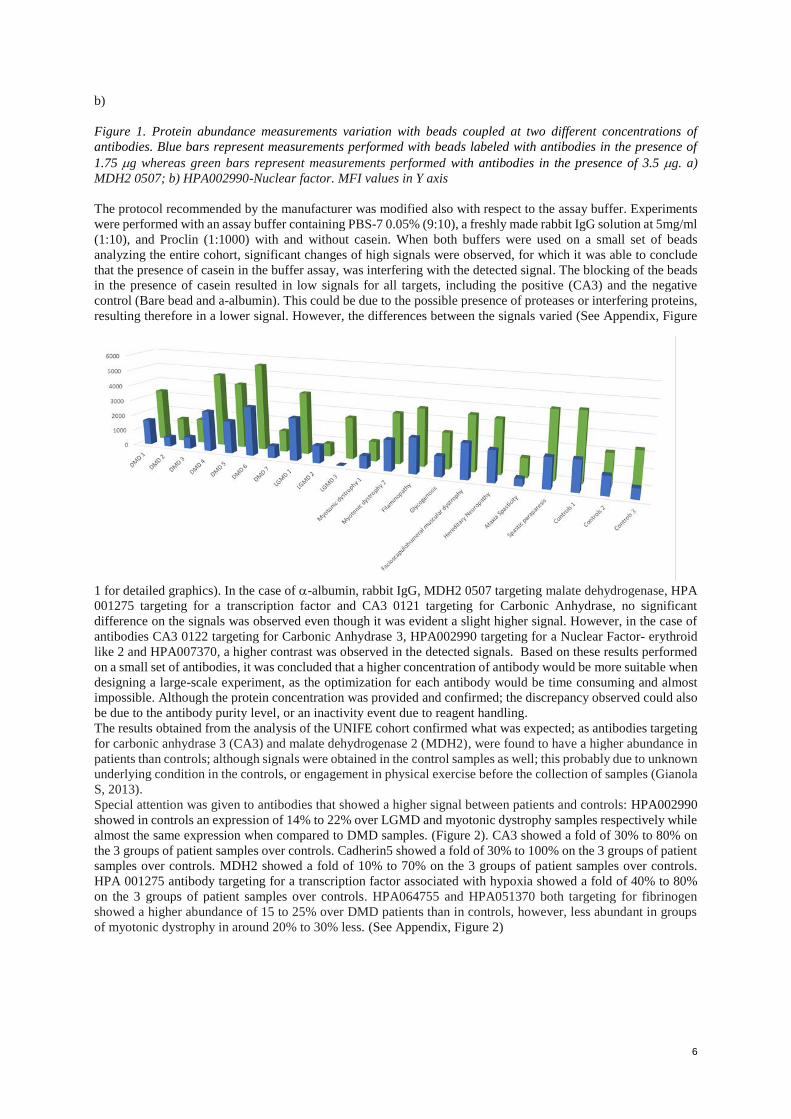
Special attention was given to antibodies that showed a higher signal between patients and controls: HPA002990
showed in controls an expression of 14% to 22% over LGMD and myotonic dystrophy samples respectively while
almost the same expression when compared to DMD samples. (Figure 2). CA3 showed a fold of 30% to 80% on
the 3 groups of patient samples over controls. Cadherin5 showed a fold of 30% to 100% on the 3 groups of patient
samples over controls. MDH2 showed a fold of 10% to 70% on the 3 groups of patient samples over controls.
HPA 001275 antibody targeting for a transcription factor associated with hypoxia showed a fold of 40% to 80%
on the 3 groups of patient samples over controls. HPA064755 and HPA051370 both targeting for fibrinogen
showed a higher abundance of 15 to 25% over DMD patients than in controls, however, less abundant in groups
of myotonic dystrophy in around 20% to 30% less. (See Appendix, Figure 2)
7
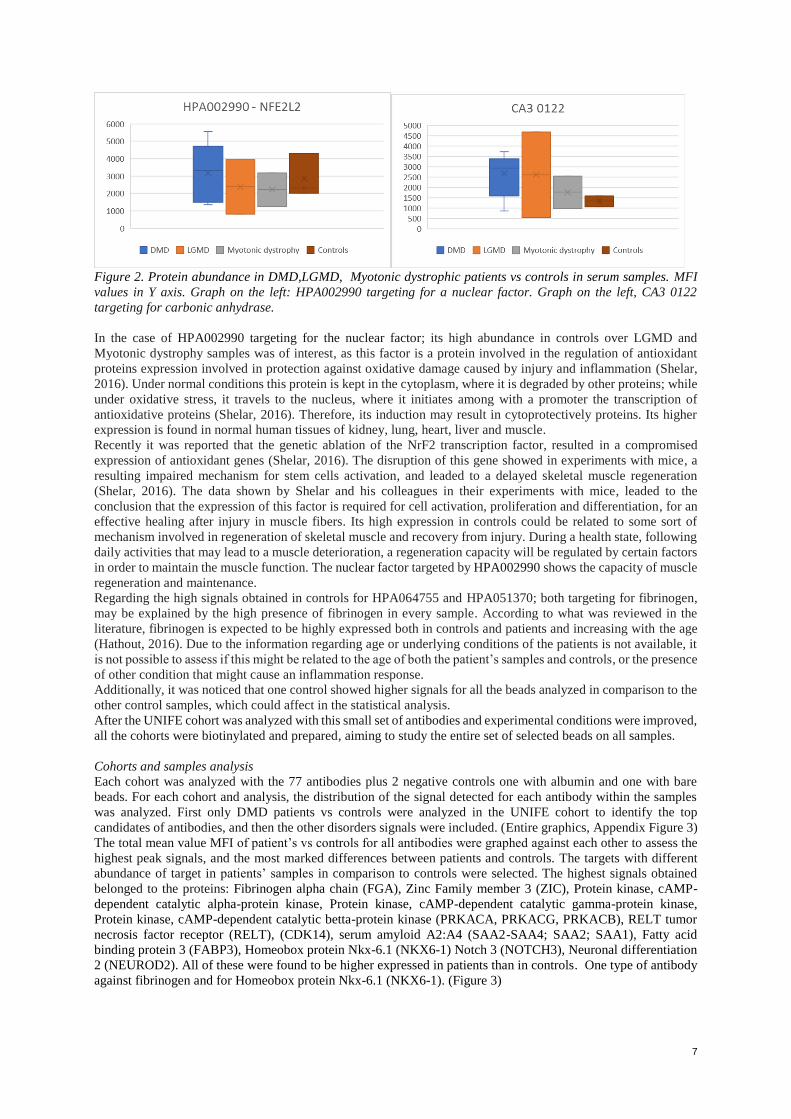
Figure 2. Protein abundance in DMD,LGMD, Myotonic dystrophic patients vs controls in serum samples. MFI
values in Y axis. Graph on the left: HPA002990 targeting for a nuclear factor. Graph on the left, CA3 0122
targeting for carbonic anhydrase.
In the case of HPA002990 targeting for the nuclear factor; its high abundance in controls over LGMD and
Myotonic dystrophy samples was of interest, as this factor is a protein involved in the regulation of antioxidant
proteins expression involved in protection against oxidative damage caused by injury and inflammation (Shelar,
2016). Under normal conditions this protein is kept in the cytoplasm, where it is degraded by other proteins; while
under oxidative stress, it travels to the nucleus, where it initiates among with a promoter the transcription of
antioxidative proteins (Shelar, 2016). Therefore, its induction may result in cytoprotectively proteins. Its higher
expression is found in normal human tissues of kidney, lung, heart, liver and muscle.
Recently it was reported that the genetic ablation of the NrF2 transcription factor, resulted in a compromised
expression of antioxidant genes (Shelar, 2016). The disruption of this gene showed in experiments with mice, a
resulting impaired mechanism for stem cells activation, and leaded to a delayed skeletal muscle regeneration
(Shelar, 2016). The data shown by Shelar and his colleagues in their experiments with mice, leaded to the
conclusion that the expression of this factor is required for cell activation, proliferation and differentiation, for an
effective healing after injury in muscle fibers. Its high expression in controls could be related to some sort of
mechanism involved in regeneration of skeletal muscle and recovery from injury. During a health state, following
daily activities that may lead to a muscle deterioration, a regeneration capacity will be regulated by certain factors
in order to maintain the muscle function. The nuclear factor targeted by HPA002990 shows the capacity of muscle
regeneration and maintenance.
Regarding the high signals obtained in controls for HPA064755 and HPA051370; both targeting for fibrinogen,
may be explained by the high presence of fibrinogen in every sample. According to what was reviewed in the
literature, fibrinogen is expected to be highly expressed both in controls and patients and increasing with the age
(Hathout, 2016). Due to the information regarding age or underlying conditions of the patients is not available, it
is not possible to assess if this might be related to the age of both the patient’s samples and controls, or the presence
of other condition that might cause an inflammation response.
Additionally, it was noticed that one control showed higher signals for all the beads analyzed in comparison to the
other control samples, which could affect in the statistical analysis.
After the UNIFE cohort was analyzed with this small set of antibodies and experimental conditions were improved,
all the cohorts were biotinylated and prepared, aiming to study the entire set of selected beads on all samples.
Cohorts and samples analysis
Each cohort was analyzed with the 77 antibodies plus 2 negative controls one with albumin and one with bare
beads. For each cohort and analysis, the distribution of the signal detected for each antibody within the samples
was analyzed. First only DMD patients vs controls were analyzed in the UNIFE cohort to identify the top
candidates of antibodies, and then the other disorders signals were included. (Entire graphics, Appendix Figure 3)
The total mean value MFI of patient’s vs controls for all antibodies were graphed against each other to assess the
highest peak signals, and the most marked differences between patients and controls. The targets with different
abundance of target in patients’ samples in comparison to controls were selected. The highest signals obtained
belonged to the proteins: Fibrinogen alpha chain (FGA), Zinc Family member 3 (ZIC), Protein kinase, cAMP-
dependent catalytic alpha-protein kinase, Protein kinase, cAMP-dependent catalytic gamma-protein kinase,
Protein kinase, cAMP-dependent catalytic betta-protein kinase (PRKACA, PRKACG, PRKACB), RELT tumor
necrosis factor receptor (RELT), (CDK14), serum amyloid A2:A4 (SAA2-SAA4; SAA2; SAA1), Fatty acid
binding protein 3 (FABP3), Homeobox protein Nkx-6.1 (NKX6-1) Notch 3 (NOTCH3), Neuronal differentiation
2 (NEUROD2). All of these were found to be higher expressed in patients than in controls. One type of antibody
against fibrinogen and for Homeobox protein Nkx-6.1 (NKX6-1). (Figure 3)
8
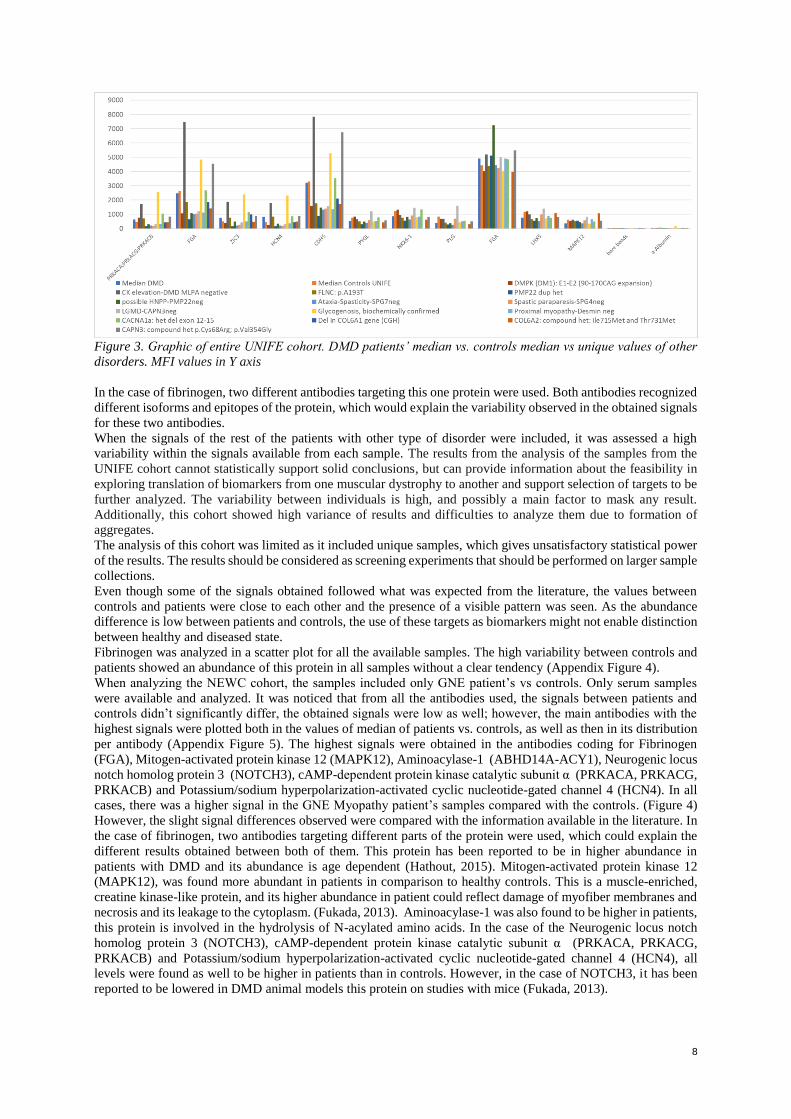
Figure 3. Graphic of entire UNIFE cohort. DMD patients’ median vs. controls median vs unique values of other
disorders. MFI values in Y axis
In the case of fibrinogen, two different antibodies targeting this one protein were used. Both antibodies recognized
different isoforms and epitopes of the protein, which would explain the variability observed in the obtained signals
for these two antibodies.
When the signals of the rest of the patients with other type of disorder were included, it was assessed a high
variability within the signals available from each sample. The results from the analysis of the samples from the
UNIFE cohort cannot statistically support solid conclusions, but can provide information about the feasibility in
exploring translation of biomarkers from one muscular dystrophy to another and support selection of targets to be
further analyzed. The variability between individuals is high, and possibly a main factor to mask any result.
Additionally, this cohort showed high variance of results and difficulties to analyze them due to formation of
aggregates.
The analysis of this cohort was limited as it included unique samples, which gives unsatisfactory statistical power
of the results. The results should be considered as screening experiments that should be performed on larger sample
collections.
Even though some of the signals obtained followed what was expected from the literature, the values between
controls and patients were close to each other and the presence of a visible pattern was seen. As the abundance
difference is low between patients and controls, the use of these targets as biomarkers might not enable distinction
between healthy and diseased state.
Fibrinogen was analyzed in a scatter plot for all the available samples. The high variability between controls and
patients showed an abundance of this protein in all samples without a clear tendency (Appendix Figure 4).
When analyzing the NEWC cohort, the samples included only GNE patient’s vs controls. Only serum samples
were available and analyzed. It was noticed that from all the antibodies used, the signals between patients and
controls didn’t significantly differ, the obtained signals were low as well; however, the main antibodies with the
highest signals were plotted both in the values of median of patients vs. controls, as well as then in its distribution
per antibody (Appendix Figure 5). The highest signals were obtained in the antibodies coding for Fibrinogen
(FGA), Mitogen-activated protein kinase 12 (MAPK12), Aminoacylase-1 (ABHD14A-ACY1), Neurogenic locus
notch homolog protein 3 (NOTCH3), cAMP-dependent protein kinase catalytic subunit α (PRKACA, PRKACG,
PRKACB) and Potassium/sodium hyperpolarization-activated cyclic nucleotide-gated channel 4 (HCN4). In all
cases, there was a higher signal in the GNE Myopathy patient’s samples compared with the controls. (Figure 4)
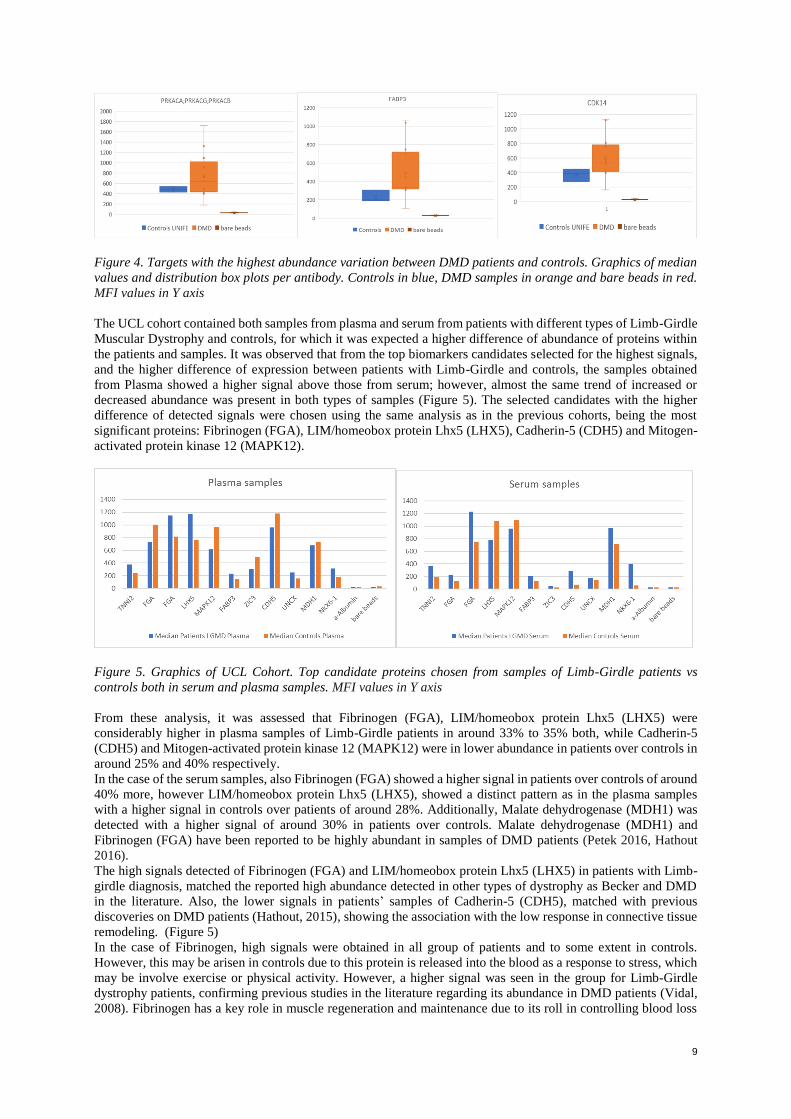
However, the slight signal differences observed were compared with the information available in the literature. In
the case of fibrinogen, two antibodies targeting different parts of the protein were used, which could explain the
different results obtained between both of them. This protein has been reported to be in higher abundance in
patients with DMD and its abundance is age dependent (Hathout, 2015). Mitogen-activated protein kinase 12
(MAPK12), was found more abundant in patients in comparison to healthy controls. This is a muscle-enriched,
creatine kinase-like protein, and its higher abundance in patient could reflect damage of myofiber membranes and
necrosis and its leakage to the cytoplasm. (Fukada, 2013). Aminoacylase-1 was also found to be higher in patients,
this protein is involved in the hydrolysis of N-acylated amino acids. In the case of the Neurogenic locus notch
homolog protein 3 (NOTCH3), cAMP-dependent protein kinase catalytic subunit α (PRKACA, PRKACG,
PRKACB) and Potassium/sodium hyperpolarization-activated cyclic nucleotide-gated channel 4 (HCN4), all
levels were found as well to be higher in patients than in controls. However, in the case of NOTCH3, it has been
reported to be lowered in DMD animal models this protein on studies with mice (Fukada, 2013).
9
Figure 4. Targets with the highest abundance variation between DMD patients and controls. Graphics of median
values and distribution box plots per antibody. Controls in blue, DMD samples in orange and bare beads in red.
MFI values in Y axis
The UCL cohort contained both samples from plasma and serum from patients with different types of Limb-Girdle
Muscular Dystrophy and controls, for which it was expected a higher difference of abundance of proteins within
the patients and samples. It was observed that from the top biomarkers candidates selected for the highest signals,
and the higher difference of expression between patients with Limb-Girdle and controls, the samples obtained
from Plasma showed a higher signal above those from serum; however, almost the same trend of increased or
decreased abundance was present in both types of samples (Figure 5). The selected candidates with the higher
difference of detected signals were chosen using the same analysis as in the previous cohorts, being the most
significant proteins: Fibrinogen (FGA), LIM/homeobox protein Lhx5 (LHX5), Cadherin-5 (CDH5) and Mitogen-
activated protein kinase 12 (MAPK12).
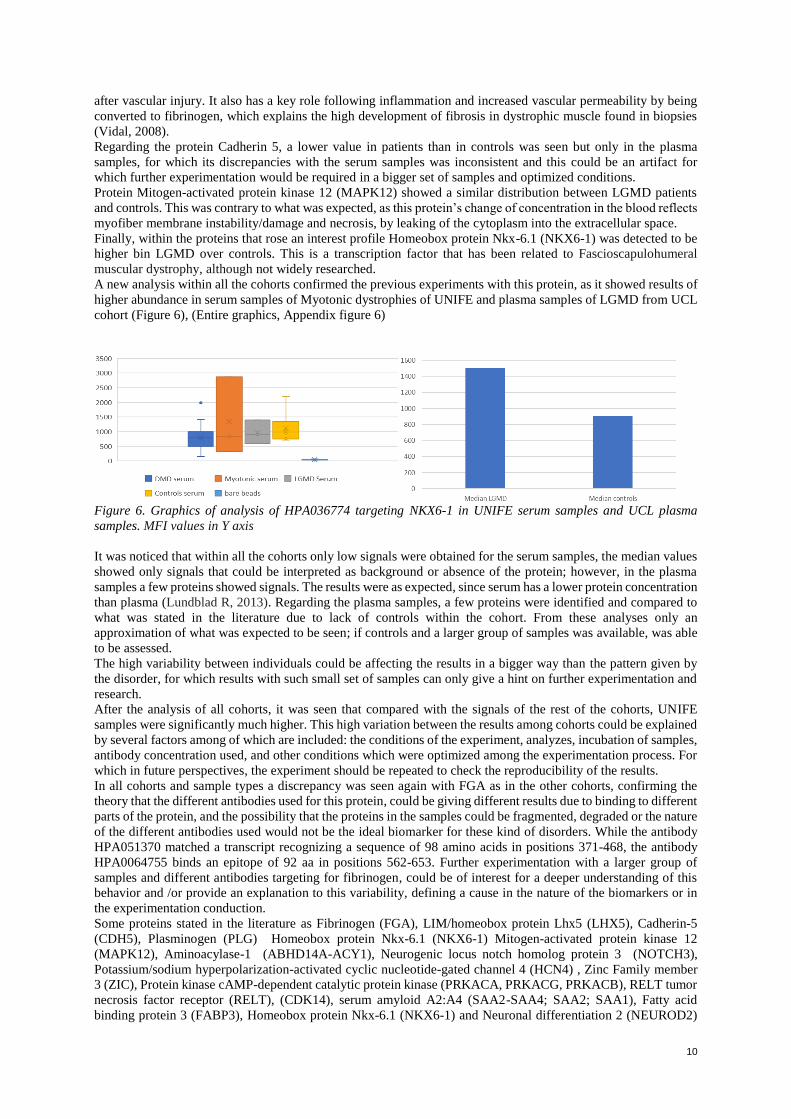
Figure 5. Graphics of UCL Cohort. Top candidate proteins chosen from samples of Limb-Girdle patients vs
controls both in serum and plasma samples. MFI values in Y axis
From these analysis, it was assessed that Fibrinogen (FGA), LIM/homeobox protein Lhx5 (LHX5) were
considerably higher in plasma samples of Limb-Girdle patients in around 33% to 35% both, while Cadherin-5
(CDH5) and Mitogen-activated protein kinase 12 (MAPK12) were in lower abundance in patients over controls in
around 25% and 40% respectively.
In the case of the serum samples, also Fibrinogen (FGA) showed a higher signal in patients over controls of around
40% more, however LIM/homeobox protein Lhx5 (LHX5), showed a distinct pattern as in the plasma samples
with a higher signal in controls over patients of around 28%. Additionally, Malate dehydrogenase (MDH1) was
detected with a higher signal of around 30% in patients over controls. Malate dehydrogenase (MDH1) and
Fibrinogen (FGA) have been reported to be highly abundant in samples of DMD patients (Petek 2016, Hathout
2016).
The high signals detected of Fibrinogen (FGA) and LIM/homeobox protein Lhx5 (LHX5) in patients with Limb-
girdle diagnosis, matched the reported high abundance detected in other types of dystrophy as Becker and DMD
in the literature. Also, the lower signals in patients’ samples of Cadherin-5 (CDH5), matched with previous
discoveries on DMD patients (Hathout, 2015), showing the association with the low response in connective tissue
remodeling. (Figure 5)
In the case of Fibrinogen, high signals were obtained in all group of patients and to some extent in controls.
However, this may be arisen in controls due to this protein is released into the blood as a response to stress, which
may be involve exercise or physical activity. However, a higher signal was seen in the group for Limb-Girdle
dystrophy patients, confirming previous studies in the literature regarding its abundance in DMD patients (Vidal,
2008). Fibrinogen has a key role in muscle regeneration and maintenance due to its roll in controlling blood loss
10
after vascular injury. It also has a key role following inflammation and increased vascular permeability by being
converted to fibrinogen, which explains the high development of fibrosis in dystrophic muscle found in biopsies
(Vidal, 2008).
Regarding the protein Cadherin 5, a lower value in patients than in controls was seen but only in the plasma
samples, for which its discrepancies with the serum samples was inconsistent and this could be an artifact for
which further experimentation would be required in a bigger set of samples and optimized conditions.
Protein Mitogen-activated protein kinase 12 (MAPK12) showed a similar distribution between LGMD patients
and controls. This was contrary to what was expected, as this protein’s change of concentration in the blood reflects
myofiber membrane instability/damage and necrosis, by leaking of the cytoplasm into the extracellular space.
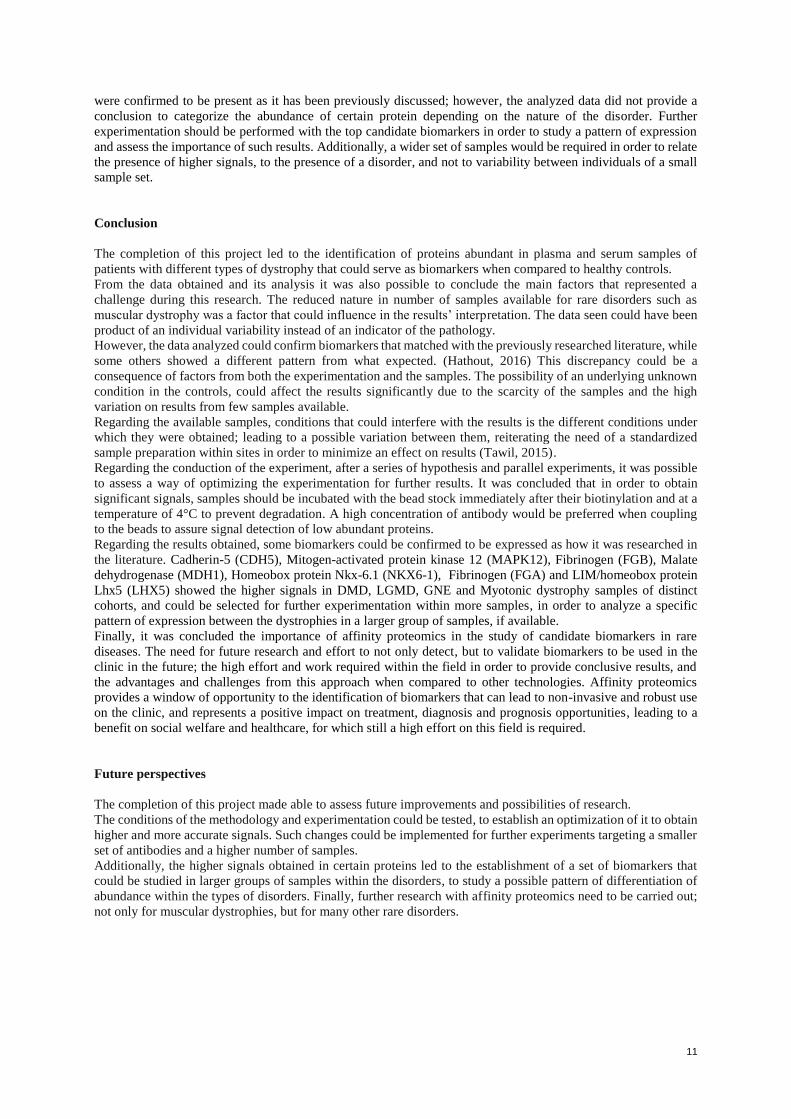
Finally, within the proteins that rose an interest profile Homeobox protein Nkx-6.1 (NKX6-1) was detected to be
higher bin LGMD over controls. This is a transcription factor that has been related to Fascioscapulohumeral
muscular dystrophy, although not widely researched.
A new analysis within all the cohorts confirmed the previous experiments with this protein, as it showed results of
higher abundance in serum samples of Myotonic dystrophies of UNIFE and plasma samples of LGMD from UCL
cohort (Figure 6), (Entire graphics, Appendix figure 6)
Figure 6. Graphics of analysis of HPA036774 targeting NKX6-1 in UNIFE serum samples and UCL plasma
samples. MFI values in Y axis
It was noticed that within all the cohorts only low signals were obtained for the serum samples, the median values
showed only signals that could be interpreted as background or absence of the protein; however, in the plasma
samples a few proteins showed signals. The results were as expected, since serum has a lower protein concentration
than plasma (Lundblad R, 2013). Regarding the plasma samples, a few proteins were identified and compared to
what was stated in the literature due to lack of controls within the cohort. From these analyses only an
approximation of what was expected to be seen; if controls and a larger group of samples was available, was able
to be assessed.
The high variability between individuals could be affecting the results in a bigger way than the pattern given by
the disorder, for which results with such small set of samples can only give a hint on further experimentation and
research.
After the analysis of all cohorts, it was seen that compared with the signals of the rest of the cohorts, UNIFE
samples were significantly much higher. This high variation between the results among cohorts could be explained
by several factors among of which are included: the conditions of the experiment, analyzes, incubation of samples,
antibody concentration used, and other conditions which were optimized among the experimentation process. For
which in future perspectives, the experiment should be repeated to check the reproducibility of the results.
In all cohorts and sample types a discrepancy was seen again with FGA as in the other cohorts, confirming the
theory that the different antibodies used for this protein, could be giving different results due to binding to different
parts of the protein, and the possibility that the proteins in the samples could be fragmented, degraded or the nature
of the different antibodies used would not be the ideal biomarker for these kind of disorders. While the antibody
HPA051370 matched a transcript recognizing a sequence of 98 amino acids in positions 371-468, the antibody
HPA0064755 binds an epitope of 92 aa in positions 562-653. Further experimentation with a larger group of
samples and different antibodies targeting for fibrinogen, could be of interest for a deeper understanding of this
behavior and /or provide an explanation to this variability, defining a cause in the nature of the biomarkers or in
the experimentation conduction.
Some proteins stated in the literature as Fibrinogen (FGA), LIM/homeobox protein Lhx5 (LHX5), Cadherin-5
(CDH5), Plasminogen (PLG) Homeobox protein Nkx-6.1 (NKX6-1) Mitogen-activated protein kinase 12
(MAPK12), Aminoacylase-1 (ABHD14A-ACY1), Neurogenic locus notch homolog protein 3 (NOTCH3),
Potassium/sodium hyperpolarization-activated cyclic nucleotide-gated channel 4 (HCN4) , Zinc Family member
3 (ZIC), Protein kinase cAMP-dependent catalytic protein kinase (PRKACA, PRKACG, PRKACB), RELT tumor
necrosis factor receptor (RELT), (CDK14), serum amyloid A2:A4 (SAA2-SAA4; SAA2; SAA1), Fatty acid
binding protein 3 (FABP3), Homeobox protein Nkx-6.1 (NKX6-1) and Neuronal differentiation 2 (NEUROD2)
11
were confirmed to be present as it has been previously discussed; however, the analyzed data did not provide a
conclusion to categorize the abundance of certain protein depending on the nature of the disorder. Further
experimentation should be performed with the top candidate biomarkers in order to study a pattern of expression
and assess the importance of such results. Additionally, a wider set of samples would be required in order to relate
the presence of higher signals, to the presence of a disorder, and not to variability between individuals of a small
sample set.
Conclusion
The completion of this project led to the identification of proteins abundant in plasma and serum samples of
patients with different types of dystrophy that could serve as biomarkers when compared to healthy controls.
From the data obtained and its analysis it was also possible to conclude the main factors that represented a
challenge during this research. The reduced nature in number of samples available for rare disorders such as
muscular dystrophy was a factor that could influence in the results’ interpretation. The data seen could have been
product of an individual variability instead of an indicator of the pathology.
However, the data analyzed could confirm biomarkers that matched with the previously researched literature, while
some others showed a different pattern from what expected. (Hathout, 2016) This discrepancy could be a
consequence of factors from both the experimentation and the samples. The possibility of an underlying unknown
condition in the controls, could affect the results significantly due to the scarcity of the samples and the high
variation on results from few samples available.
Regarding the available samples, conditions that could interfere with the results is the different conditions under
which they were obtained; leading to a possible variation between them, reiterating the need of a standardized
sample preparation within sites in order to minimize an effect on results (Tawil, 2015).
Regarding the conduction of the experiment, after a series of hypothesis and parallel experiments, it was possible
to assess a way of optimizing the experimentation for further results. It was concluded that in order to obtain
significant signals, samples should be incubated with the bead stock immediately after their biotinylation and at a
temperature of 4°C to prevent degradation. A high concentration of antibody would be preferred when coupling
to the beads to assure signal detection of low abundant proteins.
Regarding the results obtained, some biomarkers could be confirmed to be expressed as how it was researched in
the literature. Cadherin-5 (CDH5), Mitogen-activated protein kinase 12 (MAPK12), Fibrinogen (FGB), Malate
dehydrogenase (MDH1), Homeobox protein Nkx-6.1 (NKX6-1), Fibrinogen (FGA) and LIM/homeobox protein
Lhx5 (LHX5) showed the higher signals in DMD, LGMD, GNE and Myotonic dystrophy samples of distinct
cohorts, and could be selected for further experimentation within more samples, in order to analyze a specific
pattern of expression between the dystrophies in a larger group of samples, if available.
Finally, it was concluded the importance of affinity proteomics in the study of candidate biomarkers in rare
diseases. The need for future research and effort to not only detect, but to validate biomarkers to be used in the
clinic in the future; the high effort and work required within the field in order to provide conclusive results, and
the advantages and challenges from this approach when compared to other technologies. Affinity proteomics
provides a window of opportunity to the identification of biomarkers that can lead to non-invasive and robust use
on the clinic, and represents a positive impact on treatment, diagnosis and prognosis opportunities, leading to a
benefit on social welfare and healthcare, for which still a high effort on this field is required.
Future perspectives
The completion of this project made able to assess future improvements and possibilities of research.
The conditions of the methodology and experimentation could be tested, to establish an optimization of it to obtain
higher and more accurate signals. Such changes could be implemented for further experiments targeting a smaller
set of antibodies and a higher number of samples.
Additionally, the higher signals obtained in certain proteins led to the establishment of a set of biomarkers that
could be studied in larger groups of samples within the disorders, to study a possible pattern of differentiation of
abundance within the types of disorders. Finally, further research with affinity proteomics need to be carried out;
not only for muscular dystrophies, but for many other rare disorders.

12
Acknowledgments
I would like to thank my supervisor Dr. Cristina Al-Khalili Szigyarto who mentored me and advised me during
the entire planning and conduction of this project. I am thankful for all her support and teachings, her feedback,
her corrections, understanding and even moral support. She let this to be my own work while guiding me in the
right direction when needed, and inspiring me since the beginning to continue the hard work.
I would like to thank as well to the Biotechnology school of KTH, for giving me an opportunity of carrying this
project in their premises and supporting me with everything I needed to complete it.
Finally, I would like to thank all the people involved in the collection of the samples I was granted to work with.
To the patients, their families and the staff involved in their care, as their commitment to research made me possible
to complete this project.
13
References
Arvanitidis A, Henriksen K, Karsdal MA, Nedergaard A. (2016). “Neo-epitope Peptides as Biomarkers of Disease
Progression for Muscular Dystrophies and Other Myopathies”. Journal of Neuromuscular
Disorders. Vol 3, No. 3. Pp 333-346.
Baird M, Graham S, Baker J, Bickerstaff G. (2012). “Creatine-kinase- and Exercise-Related Muscle Damage
Implication for Muscle Performance Recovery”. Journal of Nutrition and Metabolism
Bakay M, Zhao P, Chen J, Hoffman EP. (2002). “A web-accessible complete transcriptome of normal human and
DMD muscle”. Journal of Neuromuscular Disorders. Vol 12. Pp 125-142.
Burch P, Pogoryelova O, Goldstein R, Bennett D, Guglieri M, Straub V, Bushby K, Lochmüller H, Morris C.
(2015). “Muscle-derived proteins as serum biomarkers for monitoring disease progression in three
forms of muscular dystrophy”. Journal of Neuromuscular Disorders. Vol 2, No. 3. Pp 241-255. Ayoglu B, Chaouch A, Lochmüller H, Politano L, Bertini E, Spitali P, Hiller M, Niks EH, Gualandi F, Pontén F,
Bushby f, Aartsma-Rus A, Schwartz E, Le Priol Y, Straub V, Uhlén M, Cirak S, 't Hoen PA,
Muntoni F, Ferlini A, Schwenk JM, Nilsson P, Al-Khalili Szigyarto C.. (2015). “Affinity
proteomics within rare diseases: a BIO-NMD study for blood biomarkers of muscular
dystrophies”. EMBO MolecularMedicine. Vol 6, No. 7. Pp 918-936.
Bushby K, Finkel R, Birnkrant DJ, Case LE, Clemens PR, Cripe L, Kaul A, Kinnett K, McDonald C, Pandya S,
Poysky J, Shapiro F, Tomezsko J, Constantin C; DMD Care Considerations Working Group. .
(2010). “DMD Care Considerations Working Group Diagnosis and management of Duchenne
muscular dystrophy, part 1. Diagnosis, and pharmacological and psychosocial management“.
Lancet Neurol. Vol. 9. No 1. Pp 77–93 Daxinger L, Tapscott SJ, van der Maarel SM.(2015). “Genetic and epigenetic contributors to FSHD”. Current
Opinion in Genetics and Development. Vol 33. Pp 56-61.
Fukada S, Ma Y, Ohtani T, Watanabe Y, Murakami S, Yamaguchi M. (2013). “Isolation, Characterization and
Molecular Regulation of Muscular Stem cells”. Frontier in Physiology. Volume 4. No 317.
Fuller H, Graham L, Hurtado M, Wishart T. (2016). “Understanding the molecular consequences of inherited
muscular dystrophies: advancements through proteomics experimentation”. Journal of Expert
Review of Proteomics. Vol 13. No 7. Pp 659-671. Fredolini C, Byström S, Pin E, Edfors F, Tamburro D, Iglesias M, Häggmark A, Hong MG, Uhlen M, Nilsson P,
Schwenk J. (2016). “Immunocapture strategies in translational proteomics” Expert review of
proteomics. Vol 13. pp 83-98.
Gianola S, Pecoraro V, Lambiase S,Gatti R, Banfi G, Moja L.(2013). “Efficacy of Muscle Exercise in Patients
with Muscular Dystrophy: A Systematic Review Showing a Missed Opportunity to Improve
Outcomes”. Plos One. Vol 8 No 6.
Hathout Y, Marathi RL, Rayavarapu S, Zhang A, Brown KJ, Seol H, Gordish-Dressman H, Cirak S, Bello L,
Nagaraju K, Partridge T, Hoffman EP, Takeda S, Mah JK, Henricson E, McDonald C. (2014).
“Discovery of serum protein biomarkers in the mdx mouse model and cross-species comparison
to Duchenne muscular dystrophy patients”. Human Molecular Genetics. Vol. 23. No. 24. Pp 6458-
6469. Hathout Y. et.al. (2015). “Large-scale serum protein biomarker discovery in Duchenne muscular dystrophy”.
Proceedings of the National Academy of Sciences of the United States of America. Vol. 112. No.
23. Pp 7153-7158. Available at < https://www.ncbi.nlm.nih.gov/pubmed/26039989> Hathout Y, Brody E, Clemens PR, Cripe L, DeLisle RK, Furlong P, Gordish-Dressman H, Hache L, Henricson E,
Hoffman EP, Kobayashi YM, Lorts A, Mah JK, McDonald C, Mehler B, Nelson S, Nikrad M,
Singer B, Steele F, Sterling D, Sweeney HL, Williams S, Gold L.(2016). “Clinical Utility of serum
biomarkers in Duchenne muscular dystrophy”. Clinical Proteomics. Vol. 13. No. 9. Leoyklang P, Malicdan MC,Yardeni T, Celeste F, Ciccone C, Li X, Jiang R, Gahl W, Carrillo-Carrasco N, He M,
Huizing M. (2014). “Sialylation of Thomsen-Friedenreich antigen is a noninvasive blood-based
biomarker for GNE myopathy”. Biomark Med. Vol 8. No 5. Pp 641-652.
Lopez-Alemany, Suelves M, Diaz-Ramos A, Vidal B, Munoz-Canoves P. (2005). “Alpha-enolase plasminogen
receptor in myogenesis”. Frontiers in biosciences. Vol 10. No. 30-6.
Lundblad. R. (2013). “Considerations for the Use of Blood Plasma and Serum for Proteomic Analysis”. The
Internet Journal of Genomics and Proteomics. Volume 1 Number 2.
McAdam L. Vajsar J, Biggar WD. (2012). “S.P.52 Troponin T adventures in Duchenne muscular dystrophy”.
Neuromuscular disorders. Vol 22. No 9-10. Pp 884-885.
Mercuri, E., Muntoni F. (2013).”Muscular dystrophies”. The Lancet. Vol 381. No 9869. Pp 9-15. Available at
<http://www.sciencedirect.com/science/article/pii/S0140673612618972>
14
Mokuno K, Riku S, Matsuoka Y, Sobue I, Kato K.(1985). “Serum Carbonic Anhydrase III in Progressive Muscular
Dystrophy”.Journal of Neuromuscular Disorders. Vol 67 pp 223-228. Nishino I, Carrillo-Carrasco N, Argov Z. (2015). “GNE Myopathy current update and future therapy”. Journal of
Neurosurgical Psychiatry. Vol. 86. No 4. Pp 385-392. Ohta M, Itagaki Y, Itoh N, Hayashi K, Nishitani H, Ohta K. (1991). “Carbonic Anhydrase III in Serum in Muscular
Dystrophy and Other Neurological Disorders: Relationship with Creatine Kinase”. Clinical
Chemistry. Vol 37. No 1. Pp 36-39. Pegoraro E, Hoffman E. (2000). “Limb-Girdle Muscular Dystrophy Overview”. Gene Reviews. Petek L, Rickard A, Budech C, Poliachik S, Shaw D, Ferguson M, Tawil R, Friedman S, Miller D. (2016). ”A
cross sectional study of two independent cohorts identifies serum biomarkers for
fascioscapulohumeral muscular dystrophy (FSHD)”. Journal of Neuromuscular Disorders. Vol
26, No. 7. Pp 405-413.
Shelar SB, Narasimhan M, Shanmugam G, Litovsky SH, Gounder SS, Karan G, Arulvasu C, Kensler TW, Hoidal
JR, Darley-Usmar VM, Rajasekaran NS.(2016). “Disruption of nuclear factor (erythroid-derived-
2)-like 2 antioxidant signaling: a mechanism for impaired activation of stem cells and delayed
regeneration of skeletal muscle. Federation of American Societies for Experimental Biology
Journal. Vol 5. p1865-1879.
Stapleton D, Lau X, Flores M, Trieu J, Gehrig SM, Chee A, Naim T, Lynch GS, Koopman R. (2014).
“Dysfunctional muscle and liver glycogen metabolism in mdx dystrophic mice.” Plos One. Vol 9.
No 3.
Tawil R, Padbergb G, Shawc D, Van der Maareld S, Tapscotte S. (2015). “Clinical trial preparedness in
facioscapulohumeral muscular dystrophy: Clinical, tissue, and imaging outcome measures 29–30
May 2015, Rochester, New York”. Neuromuscular Disorders. Vol 26. Pp 181–186.
Thompson T, Chan Y, Hack A, Brosius M, Rajala M, Lidov H, McNally E, Watkins S, Kunkela L.(2000). “Filamin
2 : A Muscle-Specific Sarcoglycan Interacting Protein”. Cell Biology. Vol 148. No 1.
Thompson R., Straub V. (2016). “Limb-girdle muscular dystrophies-international collaborations for translational
research”. Nature Reviews Neurology. Vol. 12. Pp 294-309.
Vidal B, Serrano A, Tjwa M, Suelves M, Ardite E, De Mori R, Baeza-Raja B, Martínez de Lagrán M, Lafuste P,
Ruiz-Bonilla V, Jardí M, Gherardi R, Christov C, Dierssen M, Carmeliet P, Degen J, Dewerchin
M, Muñoz-Cánoves P. (2008). “Fibrinogen drives dystrophic muscle fibrosis via a
TGFβ/alternative macrophage activation pathway”. Genes and Development. Vol 22. No 13.
1747-1752.
Wen HL, Lin YT, Ting CH, Lin-Chao S, Li H, Hsieh-Li HM. (2010). “Stathmin, a microtubule-destabilizing
protein, is dysregulated in spinal muscular atrophy”. Human Molecular Genetics. Vol 2. No 9. Pp
1766-1778.
15
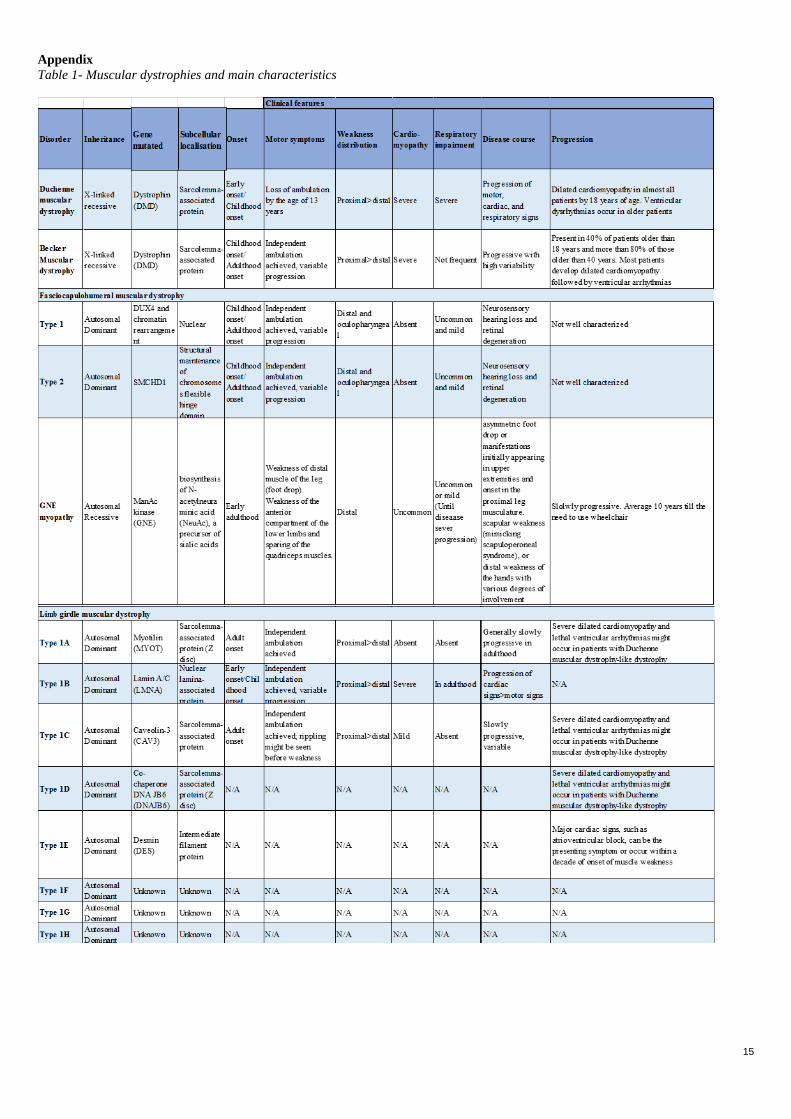
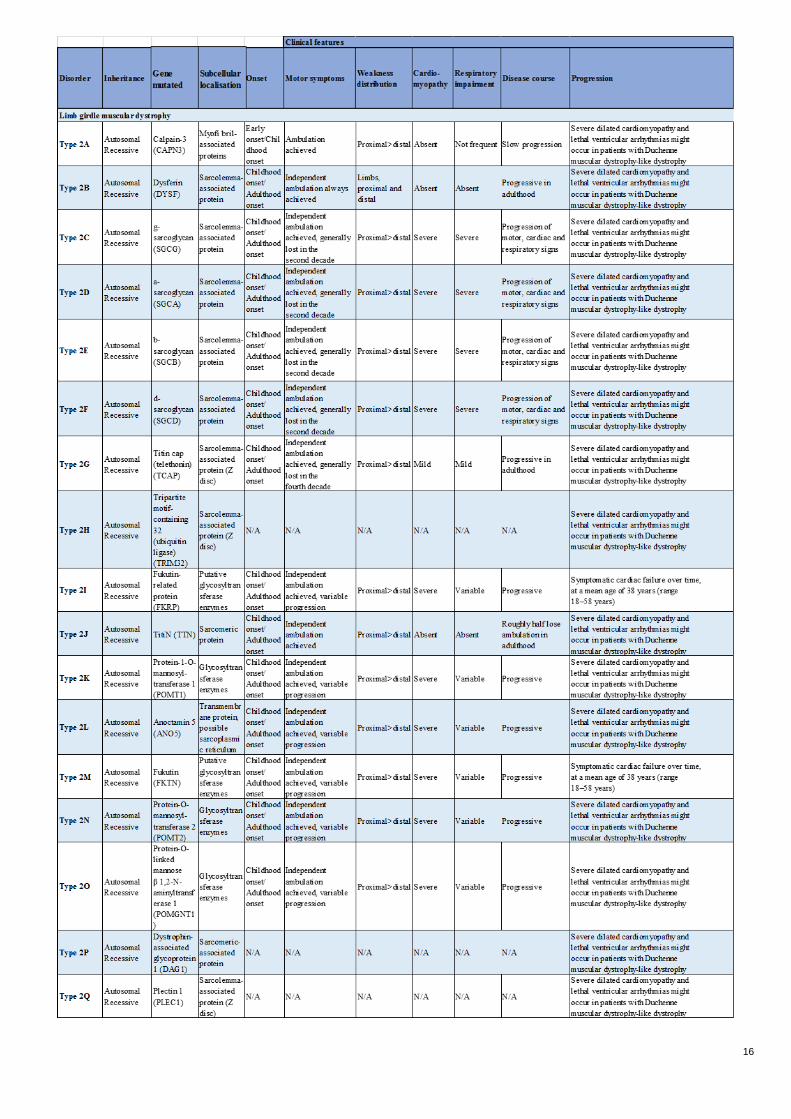
Appendix
Table 1- Muscular dystrophies and main characteristics
16
17
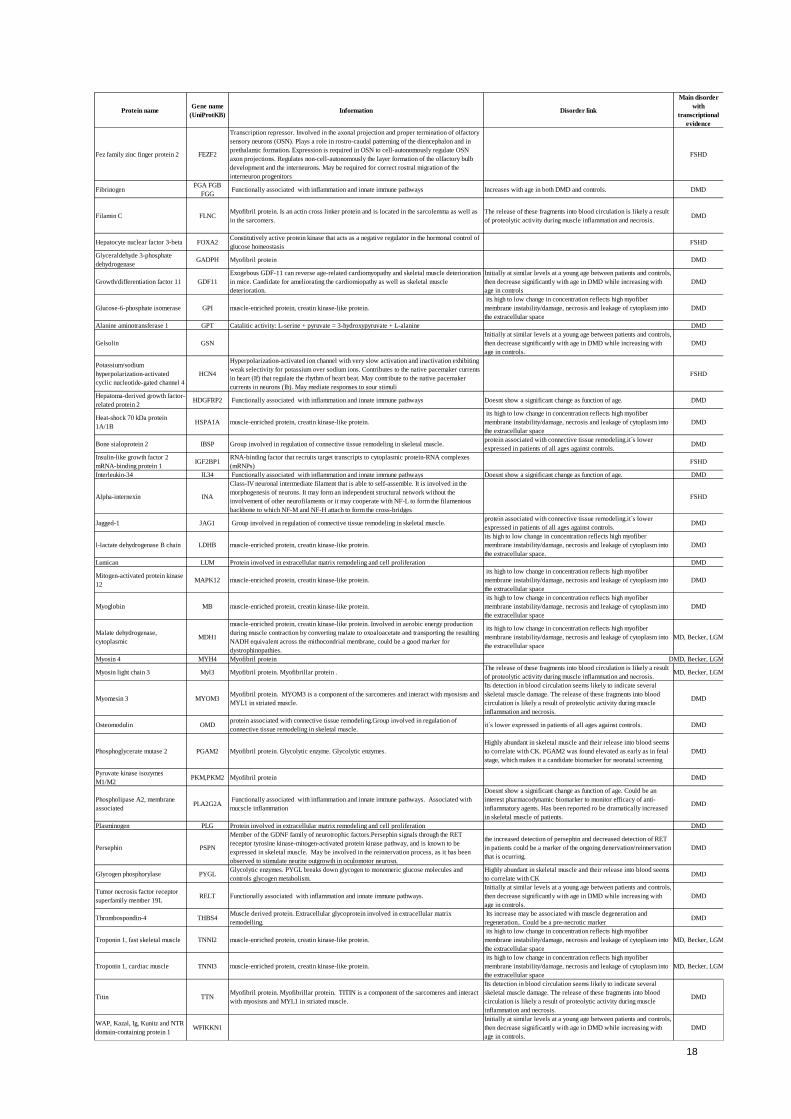
Table 2- Main proteins studies as potential biomarkers for muscular dystrophies based on transcriptome results
Protein nameGene name
(UniProtKB)Information Disorder link
Main disorder
with
transcriptional
evidence
Actin, alpha skeletal muscle ACTA1 Myofibrillar protein DMD
Aminoacylase-1 ACY1 Involved in the hydrolysis of N-acylated or N-acetylated amino acids (except L-aspartate). DMD
Disintegrin & metalloproteinase
domain-containing protein 9ADAM9
protein associated with connective tissue remodeling. Group involved in regulation of
connective tissue remodeling in skeletal muscle.lower expressed in patients of all ages against controls DMD
Adiponectin ADIPOQProtein involved in extracellular matrix remodeling and cell proliferation. Hormone
esclusevely secreted by adipose tissue.
Its increase in sera of older patients may reflect the progressive
replacement of muscle by fat.DMD
Fructose-biSphosphate aldolase
AALDOA Myofibril protein. Glycolytic enzyme. Glycolytic enzymes.
Highly abundant in skeletal muscle and their release into blood seems
to correlate with CKDMD
Ankyrin2 ANK2
In skeletal muscle, required for proper localization of DMD and DCTN4 and for the formation
and/or stability of a special subset of microtubules associated with costameres and
neuromuscular junctions Also binds to cytoskeletal proteins
DMD
Acidic leucine-rich nuclear
phosphoprotein 32 family
member B
ANP32B
Implicated in a number of cellular processes, including proliferation, differentiation, caspase-
dependent and caspase-independent apoptosis, suppression of transformation (tumor
suppressor), inhibition of protein phosphatase 2A, regulation of mRNA trafficking and
stability in association with ELAVL1, and inhibition of acetyltransferases as part of the
INHAT (inhibitor of histone acetyltransferases) complex. Plays a role in E4F1-mediated
transcriptional repression
DMD
Carbonic anhydrase type 3 CA3 muscle-enriched protein, creatin kinase-like protein
its high to low change in concentration reflects high myofiber
membrane instability/damage, necrosis and leakage of cytoplasm into
the extracellular space
DMD
Calcium/calmodulin-dependent
protein kinase II αCAMK2A muscle-enriched protein, creatin kinase-like protein.
its high to low change in concentration reflects high myofiber
membrane instability/damage, necrosis and leakage of cytoplasm into
the extracellular space
DMD
Calpain-6 CAPN6
Microtubule-stabilizing protein that may be involved in the regulation of microtubule dynamics
and cytoskeletal organization. May act as a regulator of RAC1 activity through interaction with
ARHGEF2 to control lamellipodial formation and cell mobility. Does not seem to have
protease activity as it has lost the active site residues
DMD, Becker
calsequestrin 2 CASQ2
Calcium-seuqestering protein in the sarcoplasmic reticulum of heart. This isoforms may be
shared with slow-twitch muscle, and the mild increases could likely reflect the general trend
towards slow -twitch muscle both during regeneration and dystrophy.
DMD
Complement decay-accelerating
factorCD55
Shows a decrease with age in DMD and increases with age in
controls. Functionally associated with inflammation and innate
immune pathways. Initially at similar levels at a young age between
patients and controls, then decrease significantly with age in DMD
while increasing with age in controls.
DMD
Cadherin-5 CDH5 protein associated with connective tissue remodeling.
lower expressed in patients of all ages against controls. Group
involved in regulation of connective tissue remodeling in skeletal
muscle.
DMD
Cyclin-dependent kinase 14 CDK14
Acts as a negative regulator of the proliferation of normal cells by interacting strongly with
CDK4 and CDK6. This inhibits their ability to interact with cyclins D and to phosphorylate the
retinoblastoma protein
DMD,Becker
Cell adhesion molecule L1-like CHL1 protein associated with connective tissue remodeling.
lower expressed in patients of all ages against controls. Group
involved in regulation of connective tissue remodeling in skeletal
muscle.
DMD
C-C motif chemokine 23 CKB
Monokine with inflammatory and chemokinetic properties. Binds to CCR1, CCR4 and CCR5.
One of the major HIV-suppressive factors produced by CD8+ T-cells. Recombinant MIP-1-
alpha induces a dose-dependent inhibition of different strains of HIV-1, HIV-2, and simian
immunodeficiency virus
DMD, Becker
Creatine kinase muscle type CKM muscle-enriched protein, creatin kinase-like protein.
its high to low change in concentration reflects high myofiber
membrane instability/damage, necrosis and leakage of cytoplasm into
the extracellular space.
DMD
Contactin-5 CNTN5 protein associated with connective tissue remodeling.
lower expressed in patients of all ages against controls. Group
involved in regulation of connective tissue remodeling in skeletal
muscle.
DMD
Cellular retinoic acid-binding
protein 1CRABP1 Receptor for retinoic acid. FSHD
C-X-C motif chemokine 10 CXCL10 Is an extracellular chemokine and its elevation in serum could be associated with increased T-
cell infiltration in inflamed skeletal muscle.
Doesnt show a significant change as function of age. Functionally
associated with inflammation and innate immune pathways. Could be
an interest pharmacodynamic biomarker to monitor efficacy of anti-
inflammatory agents.
DMD
Cytochrome C, somatic CYCS Myofibril protein DMD
Desmin DES
Desmin are class-III intermediate filaments found in muscle cells. In adult striated muscle they
form a fibrous network connecting myofibrils to each other and to the plasma membrane from
the periphery of the Z-line structures. May act as a sarcomeric microtubule-anchoring protein:
specifically associates with detyrosinated tubulin-alpha chains, leading to buckled
microtubules and mechanical resistance to contraction
DMD, Becker
ELAV-like protein 4 ELAVL4 RNA-binding protein that binds to the 3'-UTR region of mRNAs and increases their stability FSHD
Beta-enolase ENO3 Myofibril protein. Glycolytic enzyme. Glycolytic enzymes. Highly abundant in skeletal muscle and their release into blood seems
to correlate with CKDMD, Becker
Electron transfer flavoprotein
subunit alpha, mitochondrialETFA
The electron transfer flavoprotein serves as a specific electron acceptor for several
dehydrogenases, including five acyl-CoA dehydrogenases, glutaryl-CoA and sarcosine
dehydrogenase. It transfers the electrons to the main mitochondrial respiratory chain via ETF-
ubiquinone oxidoreductase (ETF dehydrogenase).
DMD, Becker
Coagulation factor VII F7Factor VIII, along with calcium and phospholipid, acts as a cofactor for F9/factor IXa when it
converts F10/factor X to the activated form, factor Xa.DMD, Becker
Fatty acid binding protein 3 FABP3 muscle-enriched protein, creatin kinase-like protein.
its high to low change in concentration reflects high myofiber
membrane instability/damage, necrosis and leakage of cytoplasm into
the extracellular space
DMD, Becker, LGMD
Prolyl endopeptidase FAP FAP protein associated with connective tissue remodeling.
lower expressed in patients of all ages against controls. Group
involved in regulation of connective tissue remodeling in skeletal
muscle.
DMD
18
Protein nameGene name
(UniProtKB)Information Disorder link
Main disorder
with
transcriptional
evidence
Fez family zinc finger protein 2 FEZF2
Transcription repressor. Involved in the axonal projection and proper termination of olfactory
sensory neurons (OSN). Plays a role in rostro-caudal patterning of the diencephalon and in
prethalamic formation. Expression is required in OSN to cell-autonomously regulate OSN
axon projections. Regulates non-cell-autonomously the layer formation of the olfactory bulb
development and the interneurons. May be required for correct rostral migration of the
interneuron progenitors
FSHD
FibrinogenFGA FGB
FGG Functionally associated with inflammation and innate immune pathways Increases with age in both DMD and controls. DMD
Filamin C FLNCMyofibril protein. Is an actin cross linker protein and is located in the sarcolemma as well as
in the sarcomers.
The release of these fragments into blood circulation is likely a result
of proteolytic activity during muscle inflammation and necrosis. DMD
Hepatocyte nuclear factor 3-beta FOXA2Constitutively active protein kinase that acts as a negative regulator in the hormonal control of
glucose homeostasisFSHD
Glyceraldehyde 3-phosphate
dehydrogenaseGADPH Myofibril protein DMD
Growth/differentiation factor 11 GDF11
Exogebous GDF-11 can reverse age-related cardiomyopathy and skeletal muscle deterioration
in mice. Candidate for ameliorating the cardiomiopathy as well as skeletal muscle
deterioration.
Initially at similar levels at a young age between patients and controls,
then decrease significantly with age in DMD while increasing with
age in controls
DMD
Glucose-6-phosphate isomerase GPI muscle-enriched protein, creatin kinase-like protein.
its high to low change in concentration reflects high myofiber
membrane instability/damage, necrosis and leakage of cytoplasm into
the extracellular space
DMD
Alanine aminotransferase 1 GPT Catalitic activity: L-serine + pyruvate = 3-hydroxypyruvate + L-alanine DMD
Gelsolin GSN
Initially at similar levels at a young age between patients and controls,
then decrease significantly with age in DMD while increasing with
age in controls.
DMD
Potassium/sodium
hyperpolarization-activated
cyclic nucleotide-gated channel 4
HCN4
Hyperpolarization-activated ion channel with very slow activation and inactivation exhibiting
weak selectivity for potassium over sodium ions. Contributes to the native pacemaker currents
in heart (If) that regulate the rhythm of heart beat. May contribute to the native pacemaker
currents in neurons (Ih). May mediate responses to sour stimuli
FSHD
Hepatoma-derived growth factor-
related protein 2HDGFRP2 Functionally associated with inflammation and innate immune pathways Doesnt show a significant change as function of age. DMD
Heat-shock 70 kDa protein
1A/1BHSPA1A muscle-enriched protein, creatin kinase-like protein.
its high to low change in concentration reflects high myofiber
membrane instability/damage, necrosis and leakage of cytoplasm into
the extracellular space
DMD
Bone sialoprotein 2 IBSP Group involved in regulation of connective tissue remodeling in skeletal muscle.protein associated with connective tissue remodeling.it´s lower
expressed in patients of all ages against controls. DMD
Insulin-like growth factor 2
mRNA-binding protein 1IGF2BP1
RNA-binding factor that recruits target transcripts to cytoplasmic protein-RNA complexes
(mRNPs)FSHD
Interleukin-34 IL34 Functionally associated with inflammation and innate immune pathways Doesnt show a significant change as function of age. DMD
Alpha-internexin INA
Class-IV neuronal intermediate filament that is able to self-assemble. It is involved in the
morphogenesis of neurons. It may form an independent structural network without the
involvement of other neurofilaments or it may cooperate with NF-L to form the filamentous
backbone to which NF-M and NF-H attach to form the cross-bridges
FSHD
Jagged-1 JAG1 Group involved in regulation of connective tissue remodeling in skeletal muscle.protein associated with connective tissue remodeling.it´s lower
expressed in patients of all ages against controls.DMD
l-lactate dehydrogenase B chain LDHB muscle-enriched protein, creatin kinase-like protein.
its high to low change in concentration reflects high myofiber
membrane instability/damage, necrosis and leakage of cytoplasm into
the extracellular space.
DMD
Lumican LUM Protein involved in extracellular matrix remodeling and cell proliferation DMD
Mitogen-activated protein kinase
12MAPK12 muscle-enriched protein, creatin kinase-like protein.
its high to low change in concentration reflects high myofiber
membrane instability/damage, necrosis and leakage of cytoplasm into
the extracellular space
DMD
Myoglobin MB muscle-enriched protein, creatin kinase-like protein.
its high to low change in concentration reflects high myofiber
membrane instability/damage, necrosis and leakage of cytoplasm into
the extracellular space
DMD
Malate dehydrogenase,
cytoplasmicMDH1
muscle-enriched protein, creatin kinase-like protein. Involved in aerobic energy production
during muscle contraction by converting malate to oxoaloacetate and transporting the resulting
NADH equivalent across the mithocondrial membrane, could be a good marker for
dystrophinopathies.
its high to low change in concentration reflects high myofiber
membrane instability/damage, necrosis and leakage of cytoplasm into
the extracellular space
DMD, Becker, LGMD
Myosin 4 MYH4 Myofibril protein DMD, Becker, LGMD
Myosin light chain 3 Myl3 Myofibril protein. Myofibrillar protein . The release of these fragments into blood circulation is likely a result
of proteolytic activity during muscle inflammation and necrosis. DMD, Becker, LGMD
Myomesin 3 MYOM3Myofibril protein. MYOM3 is a component of the sarcomeres and interact with myosisns and
MYL1 in striated muscle.
Its detection in blood circulation seems likely to indicate several
skeletal muscle damage. The release of these fragments into blood
circulation is likely a result of proteolytic activity during muscle
inflammation and necrosis.
DMD
Osteomodulin OMDprotein associated with connective tissue remodeling.Group involved in regulation of
connective tissue remodeling in skeletal muscle.it´s lower expressed in patients of all ages against controls. DMD
Phosphoglycerate mutase 2 PGAM2 Myofibril protein. Glycolytic enzyme. Glycolytic enzymes.
Highly abundant in skeletal muscle and their release into blood seems
to correlate with CK. PGAM2 was found elevated as early as in fetal
stage, which makes it a candidate biomarker for neonatal screening
DMD
Pyruvate kinase isozymes
M1/M2PKM,PKM2 Myofibril protein DMD
Phospholipase A2, membrane
associatedPLA2G2A
Functionally associated with inflammation and innate immune pathways. Associated with
mucscle inflammation
Doesnt show a significant change as function of age. Could be an
interest pharmacodynamic biomarker to monitor efficacy of anti-
inflammatory agents. Has been reported ro be dramatically increased
in skeletal muscle of patients.
DMD
Plasminogen PLG Protein involved in extracellular matrix remodeling and cell proliferation DMD
Persephin PSPN
Member of the GDNF family of neurotrophic factors.Persephin signals through the RET
receptor tyrosine kinase-mitogen-activated protein kinase pathway, and is known to be
expressed in skeletal muscle. May be involved in the reinnervation process, as it has been
observed to stimulate neurite outgrowth in oculomotor neurosn.
the increased detection of persephin and decreased detection of RET
in patients could be a marker of the ongoing denervation/reinnervation
that is ocurring.
DMD
Glycogen phosphorylase PYGLGlycolytic enzymes. PYGL breaks down glycogen to monomeric glucose molecules and
controls glycogen metabolism.
Highly abundant in skeletal muscle and their release into blood seems
to correlate with CKDMD
Tumor necrosis factor receptor
superfamily member 19LRELT Functionally associated with inflammation and innate immune pathways.
Initially at similar levels at a young age between patients and controls,
then decrease significantly with age in DMD while increasing with
age in controls.
DMD
Thrombospondin-4 THBS4Muscle derived protein. Extracellular glycoprotein involved in extracellular matrix
remodelling.
Its increase may be associated with muscle degeneration and
regeneration.. Could be a pre-necrotic markerDMD
Troponin 1, fast skeletal muscle TNNI2 muscle-enriched protein, creatin kinase-like protein.
its high to low change in concentration reflects high myofiber
membrane instability/damage, necrosis and leakage of cytoplasm into
the extracellular space
DMD, Becker, LGMD
Troponin 1, cardiac muscle TNNI3 muscle-enriched protein, creatin kinase-like protein.
its high to low change in concentration reflects high myofiber
membrane instability/damage, necrosis and leakage of cytoplasm into
the extracellular space
DMD, Becker, LGMD
Titin TTNMyofibril protein. Myofibrillar protein. TITIN is a component of the sarcomeres and interact
with myosisns and MYL1 in striated muscle.
Its detection in blood circulation seems likely to indicate several
skeletal muscle damage. The release of these fragments into blood
circulation is likely a result of proteolytic activity during muscle
inflammation and necrosis.
DMD
WAP, Kazal, Ig, Kunitz and NTR
domain-containing protein 1WFIKKN1
Initially at similar levels at a young age between patients and controls,
then decrease significantly with age in DMD while increasing with
age in controls.
DMD
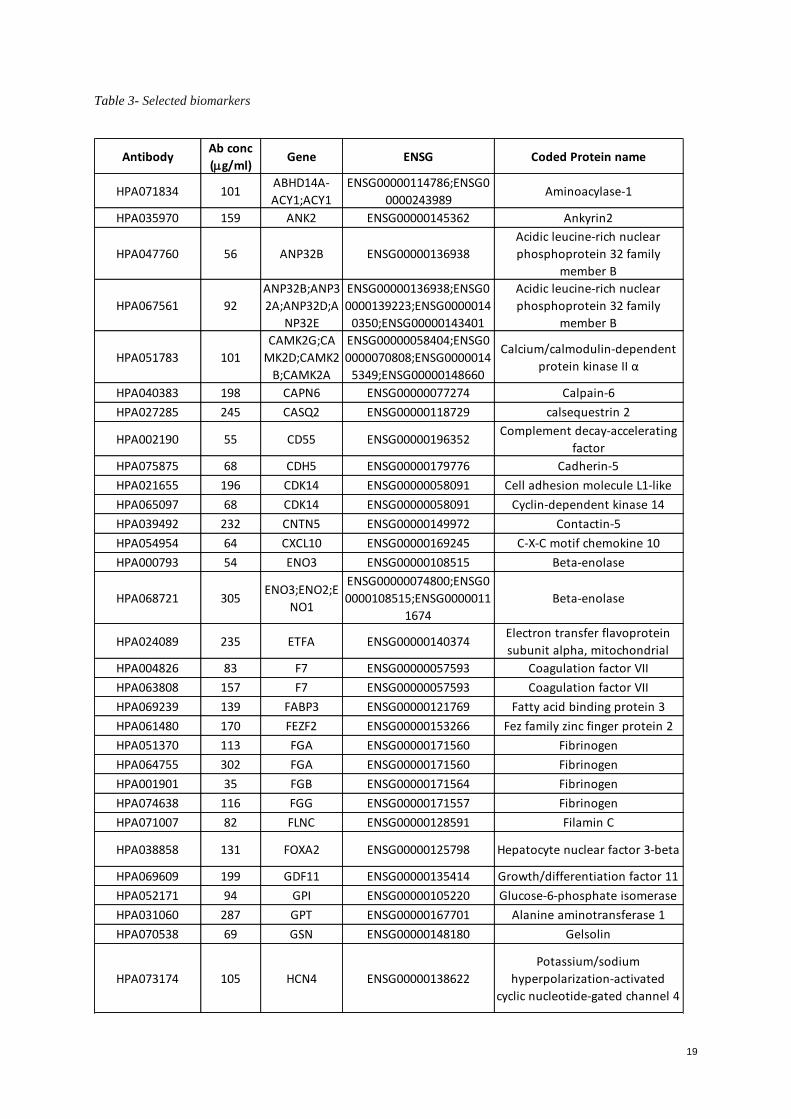
19
Table 3- Selected biomarkers
AntibodyAb conc
(g/ml)Gene ENSG Coded Protein name
HPA071834 101ABHD14A-
ACY1;ACY1
ENSG00000114786;ENSG0
0000243989Aminoacylase-1
HPA035970 159 ANK2 ENSG00000145362 Ankyrin2
HPA047760 56 ANP32B ENSG00000136938
Acidic leucine-rich nuclear
phosphoprotein 32 family
member B
HPA067561 92
ANP32B;ANP3
2A;ANP32D;A
NP32E
ENSG00000136938;ENSG0
0000139223;ENSG0000014
0350;ENSG00000143401
Acidic leucine-rich nuclear
phosphoprotein 32 family
member B
HPA051783 101
CAMK2G;CA
MK2D;CAMK2
B;CAMK2A
ENSG00000058404;ENSG0
0000070808;ENSG0000014
5349;ENSG00000148660
Calcium/calmodulin-dependent
protein kinase II α
HPA040383 198 CAPN6 ENSG00000077274 Calpain-6
HPA027285 245 CASQ2 ENSG00000118729 calsequestrin 2
HPA002190 55 CD55 ENSG00000196352Complement decay-accelerating
factor
HPA075875 68 CDH5 ENSG00000179776 Cadherin-5
HPA021655 196 CDK14 ENSG00000058091 Cell adhesion molecule L1-like
HPA065097 68 CDK14 ENSG00000058091 Cyclin-dependent kinase 14
HPA039492 232 CNTN5 ENSG00000149972 Contactin-5
HPA054954 64 CXCL10 ENSG00000169245 C-X-C motif chemokine 10
HPA000793 54 ENO3 ENSG00000108515 Beta-enolase
HPA068721 305ENO3;ENO2;E
NO1
ENSG00000074800;ENSG0
0000108515;ENSG0000011
1674
Beta-enolase
HPA024089 235 ETFA ENSG00000140374Electron transfer flavoprotein
subunit alpha, mitochondrial
HPA004826 83 F7 ENSG00000057593 Coagulation factor VII
HPA063808 157 F7 ENSG00000057593 Coagulation factor VII
HPA069239 139 FABP3 ENSG00000121769 Fatty acid binding protein 3
HPA061480 170 FEZF2 ENSG00000153266 Fez family zinc finger protein 2
HPA051370 113 FGA ENSG00000171560 Fibrinogen
HPA064755 302 FGA ENSG00000171560 Fibrinogen
HPA001901 35 FGB ENSG00000171564 Fibrinogen
HPA074638 116 FGG ENSG00000171557 Fibrinogen
HPA071007 82 FLNC ENSG00000128591 Filamin C
HPA038858 131 FOXA2 ENSG00000125798 Hepatocyte nuclear factor 3-beta
HPA069609 199 GDF11 ENSG00000135414 Growth/differentiation factor 11
HPA052171 94 GPI ENSG00000105220 Glucose-6-phosphate isomerase
HPA031060 287 GPT ENSG00000167701 Alanine aminotransferase 1
HPA070538 69 GSN ENSG00000148180 Gelsolin
HPA073174 105 HCN4 ENSG00000138622
Potassium/sodium
hyperpolarization-activated
cyclic nucleotide-gated channel 4
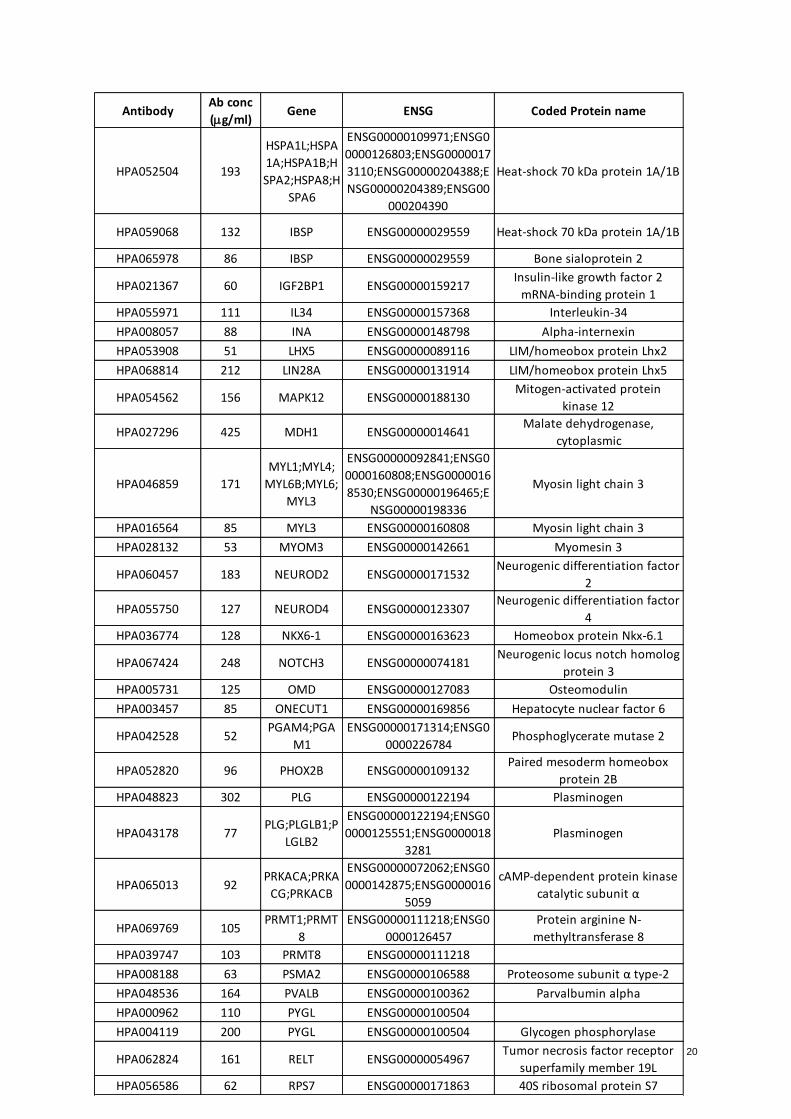
20
AntibodyAb conc
(g/ml)Gene ENSG Coded Protein name
HPA052504 193
HSPA1L;HSPA
1A;HSPA1B;H
SPA2;HSPA8;H
SPA6
ENSG00000109971;ENSG0
0000126803;ENSG0000017
3110;ENSG00000204388;E
NSG00000204389;ENSG00
000204390
Heat-shock 70 kDa protein 1A/1B
HPA059068 132 IBSP ENSG00000029559 Heat-shock 70 kDa protein 1A/1B
HPA065978 86 IBSP ENSG00000029559 Bone sialoprotein 2
HPA021367 60 IGF2BP1 ENSG00000159217Insulin-like growth factor 2
mRNA-binding protein 1
HPA055971 111 IL34 ENSG00000157368 Interleukin-34
HPA008057 88 INA ENSG00000148798 Alpha-internexin
HPA053908 51 LHX5 ENSG00000089116 LIM/homeobox protein Lhx2
HPA068814 212 LIN28A ENSG00000131914 LIM/homeobox protein Lhx5
HPA054562 156 MAPK12 ENSG00000188130Mitogen-activated protein
kinase 12
HPA027296 425 MDH1 ENSG00000014641Malate dehydrogenase,
cytoplasmic
HPA046859 171
MYL1;MYL4;
MYL6B;MYL6;
MYL3
ENSG00000092841;ENSG0
0000160808;ENSG0000016
8530;ENSG00000196465;E
NSG00000198336
Myosin light chain 3
HPA016564 85 MYL3 ENSG00000160808 Myosin light chain 3
HPA028132 53 MYOM3 ENSG00000142661 Myomesin 3
HPA060457 183 NEUROD2 ENSG00000171532Neurogenic differentiation factor
2
HPA055750 127 NEUROD4 ENSG00000123307Neurogenic differentiation factor
4
HPA036774 128 NKX6-1 ENSG00000163623 Homeobox protein Nkx-6.1
HPA067424 248 NOTCH3 ENSG00000074181Neurogenic locus notch homolog
protein 3
HPA005731 125 OMD ENSG00000127083 Osteomodulin
HPA003457 85 ONECUT1 ENSG00000169856 Hepatocyte nuclear factor 6
HPA042528 52PGAM4;PGA
M1
ENSG00000171314;ENSG0
0000226784Phosphoglycerate mutase 2
HPA052820 96 PHOX2B ENSG00000109132Paired mesoderm homeobox
protein 2B
HPA048823 302 PLG ENSG00000122194 Plasminogen
HPA043178 77PLG;PLGLB1;P
LGLB2
ENSG00000122194;ENSG0
0000125551;ENSG0000018
3281
Plasminogen
HPA065013 92PRKACA;PRKA
CG;PRKACB
ENSG00000072062;ENSG0
0000142875;ENSG0000016
5059
cAMP-dependent protein kinase
catalytic subunit α
HPA069769 105PRMT1;PRMT
8
ENSG00000111218;ENSG0
0000126457
Protein arginine N-
methyltransferase 8
HPA039747 103 PRMT8 ENSG00000111218
HPA008188 63 PSMA2 ENSG00000106588 Proteosome subunit α type-2
HPA048536 164 PVALB ENSG00000100362 Parvalbumin alpha
HPA000962 110 PYGL ENSG00000100504
HPA004119 200 PYGL ENSG00000100504 Glycogen phosphorylase
HPA062824 161 RELT ENSG00000054967Tumor necrosis factor receptor
superfamily member 19L
HPA056586 62 RPS7 ENSG00000171863 40S ribosomal protein S7
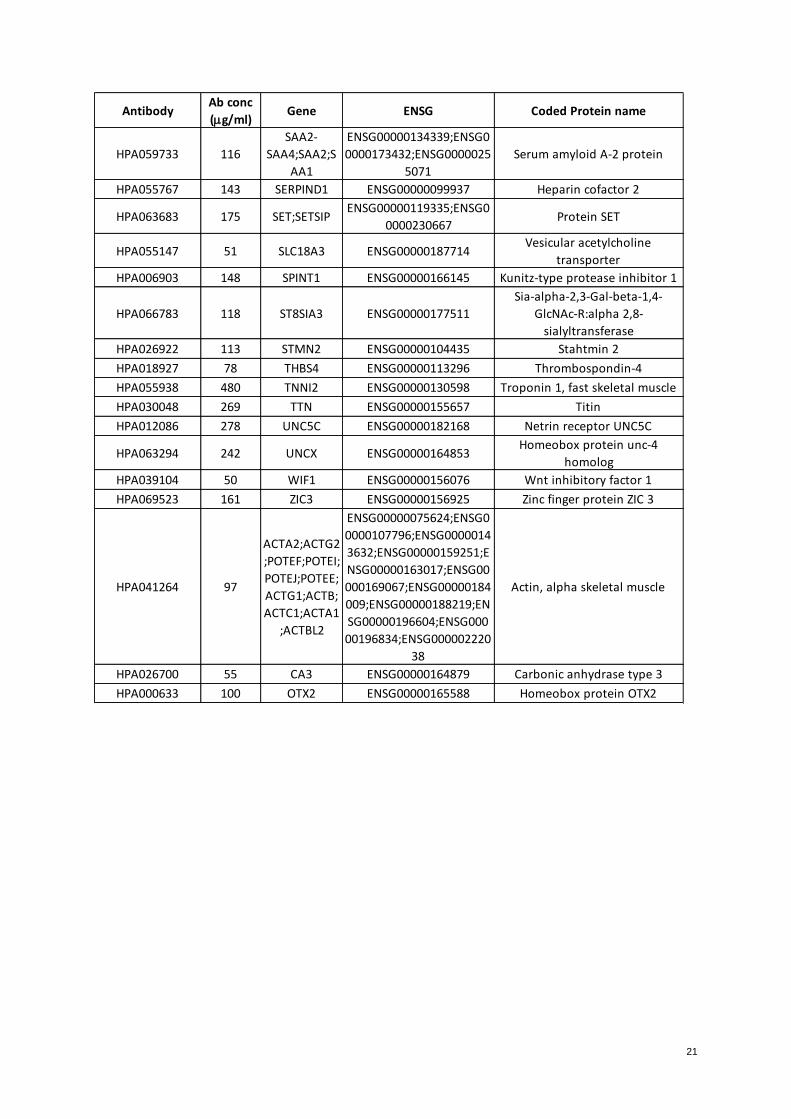
21
AntibodyAb conc
(g/ml)Gene ENSG Coded Protein name
HPA059733 116
SAA2-
SAA4;SAA2;S
AA1
ENSG00000134339;ENSG0
0000173432;ENSG0000025
5071
Serum amyloid A-2 protein
HPA055767 143 SERPIND1 ENSG00000099937 Heparin cofactor 2
HPA063683 175 SET;SETSIPENSG00000119335;ENSG0
0000230667Protein SET
HPA055147 51 SLC18A3 ENSG00000187714Vesicular acetylcholine
transporter
HPA006903 148 SPINT1 ENSG00000166145 Kunitz-type protease inhibitor 1
HPA066783 118 ST8SIA3 ENSG00000177511
Sia-alpha-2,3-Gal-beta-1,4-
GlcNAc-R:alpha 2,8-
sialyltransferase
HPA026922 113 STMN2 ENSG00000104435 Stahtmin 2
HPA018927 78 THBS4 ENSG00000113296 Thrombospondin-4
HPA055938 480 TNNI2 ENSG00000130598 Troponin 1, fast skeletal muscle
HPA030048 269 TTN ENSG00000155657 Titin
HPA012086 278 UNC5C ENSG00000182168 Netrin receptor UNC5C
HPA063294 242 UNCX ENSG00000164853Homeobox protein unc-4
homolog
HPA039104 50 WIF1 ENSG00000156076 Wnt inhibitory factor 1
HPA069523 161 ZIC3 ENSG00000156925 Zinc finger protein ZIC 3
HPA041264 97
ACTA2;ACTG2
;POTEF;POTEI;
POTEJ;POTEE;
ACTG1;ACTB;
ACTC1;ACTA1
;ACTBL2
ENSG00000075624;ENSG0
0000107796;ENSG0000014
3632;ENSG00000159251;E
NSG00000163017;ENSG00
000169067;ENSG00000184
009;ENSG00000188219;EN
SG00000196604;ENSG000
00196834;ENSG000002220
38
Actin, alpha skeletal muscle
HPA026700 55 CA3 ENSG00000164879 Carbonic anhydrase type 3
HPA000633 100 OTX2 ENSG00000165588 Homeobox protein OTX2
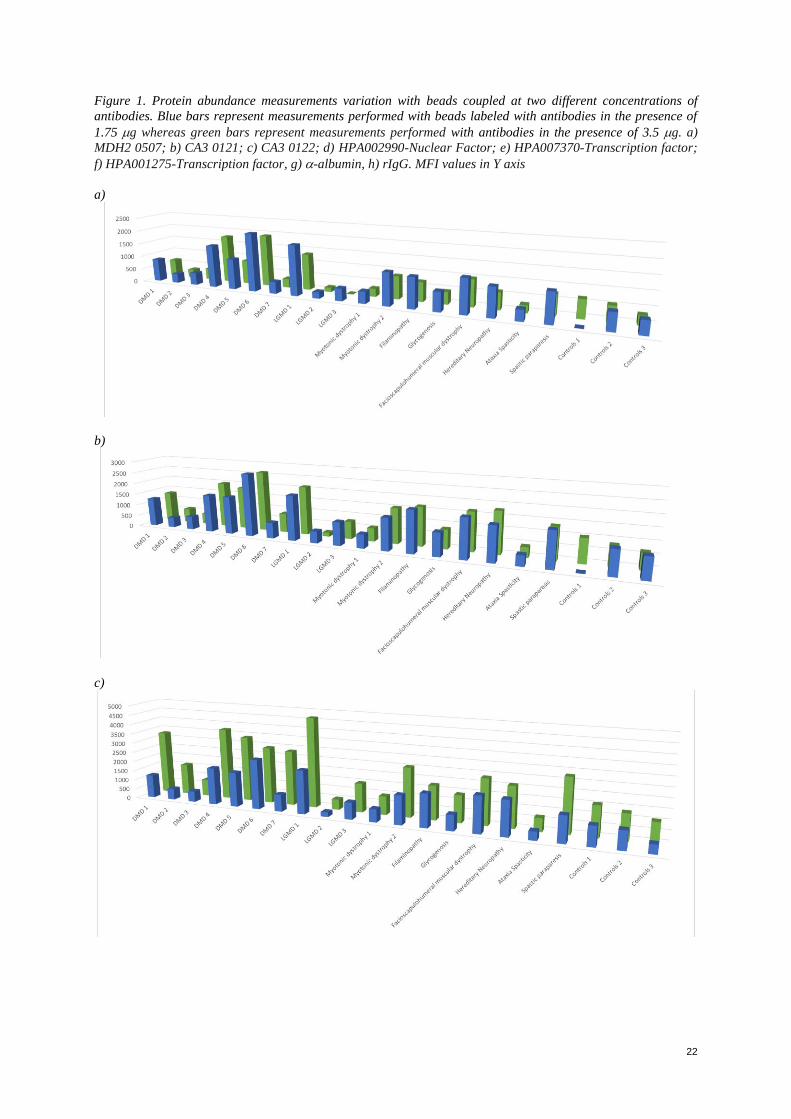
22
Figure 1. Protein abundance measurements variation with beads coupled at two different concentrations of
antibodies. Blue bars represent measurements performed with beads labeled with antibodies in the presence of
1.75 g whereas green bars represent measurements performed with antibodies in the presence of 3.5 g. a)
MDH2 0507; b) CA3 0121; c) CA3 0122; d) HPA002990-Nuclear Factor; e) HPA007370-Transcription factor;
f) HPA001275-Transcription factor, g) -albumin, h) rIgG. MFI values in Y axis
a)
b)
c)
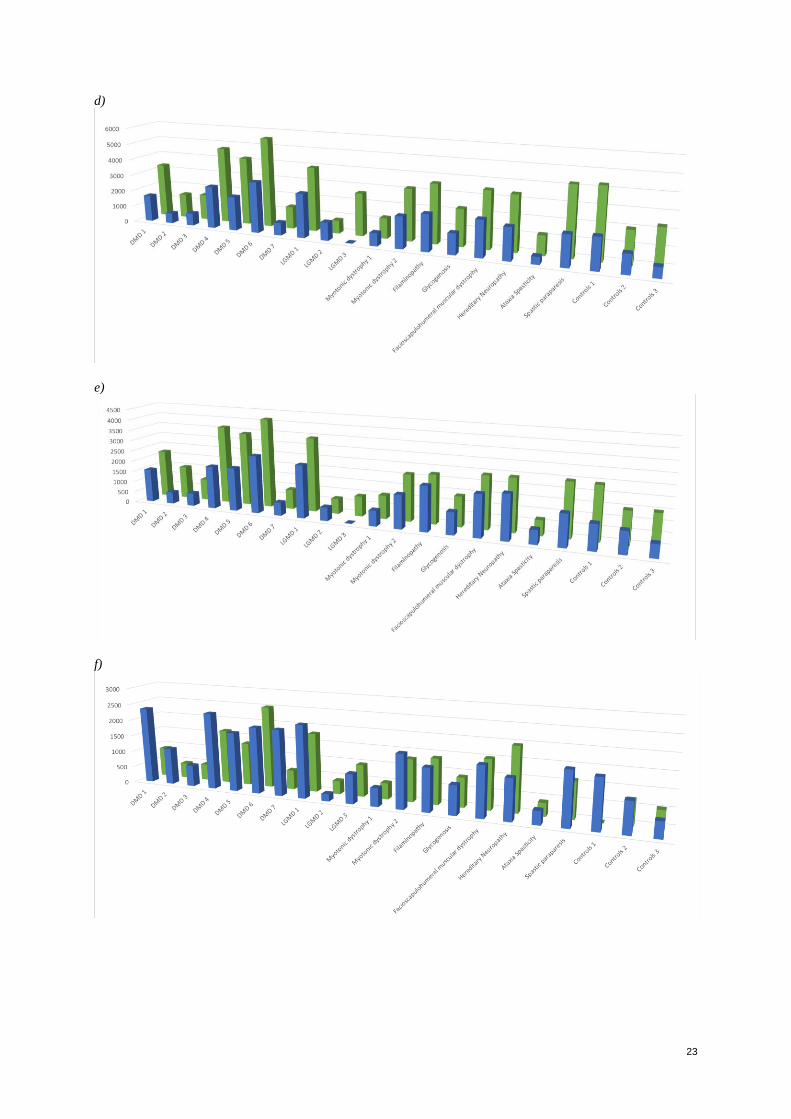
23
d)
e)
f)
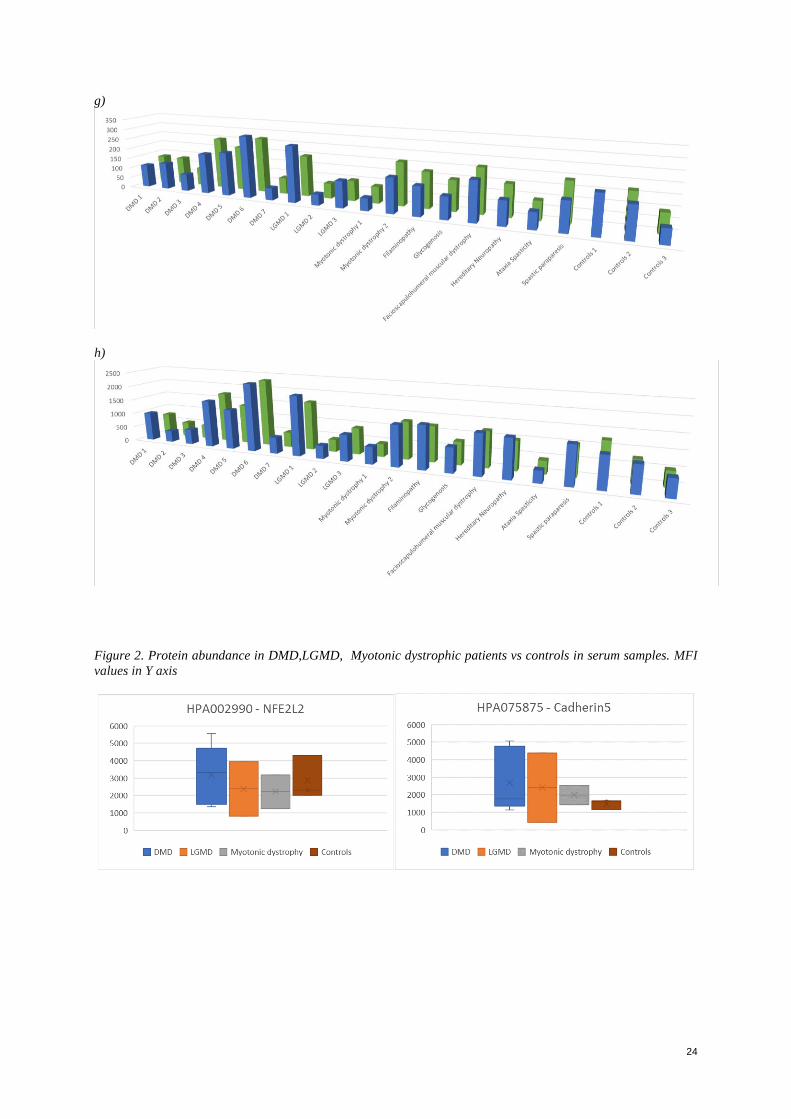
24
g)
h)
Figure 2. Protein abundance in DMD,LGMD, Myotonic dystrophic patients vs controls in serum samples. MFI
values in Y axis
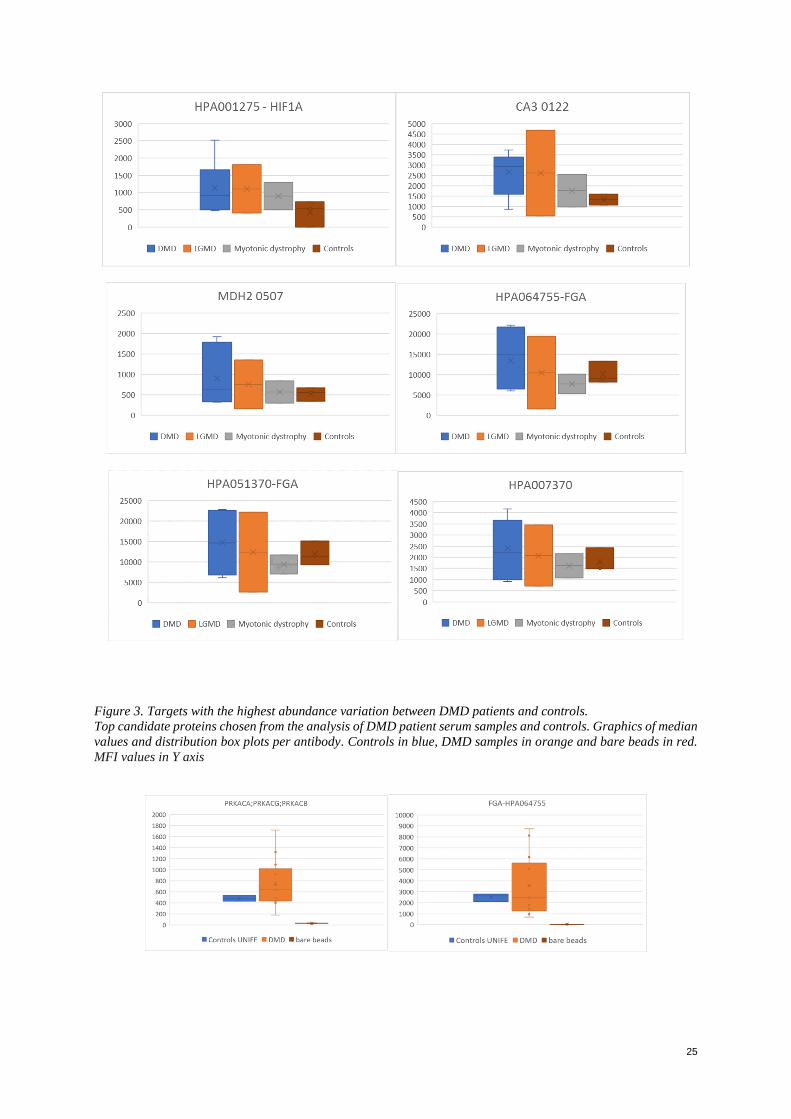
25
Figure 3. Targets with the highest abundance variation between DMD patients and controls.
Top candidate proteins chosen from the analysis of DMD patient serum samples and controls. Graphics of median
values and distribution box plots per antibody. Controls in blue, DMD samples in orange and bare beads in red.
MFI values in Y axis
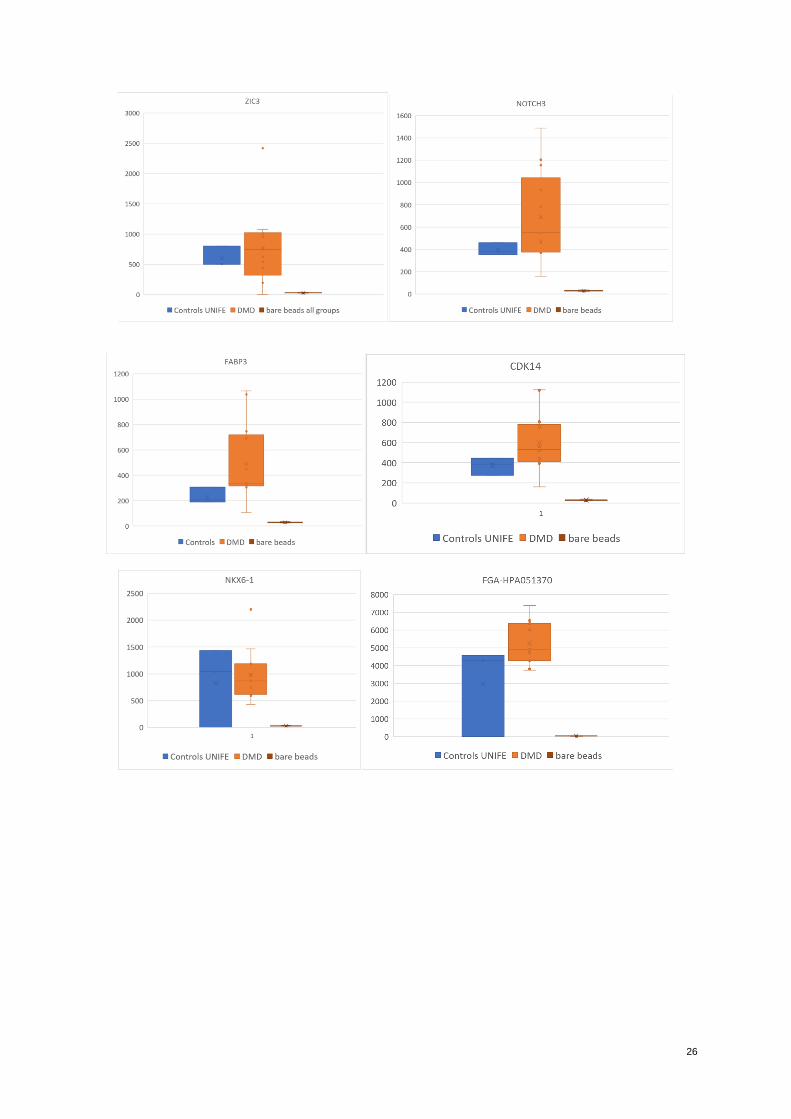
26
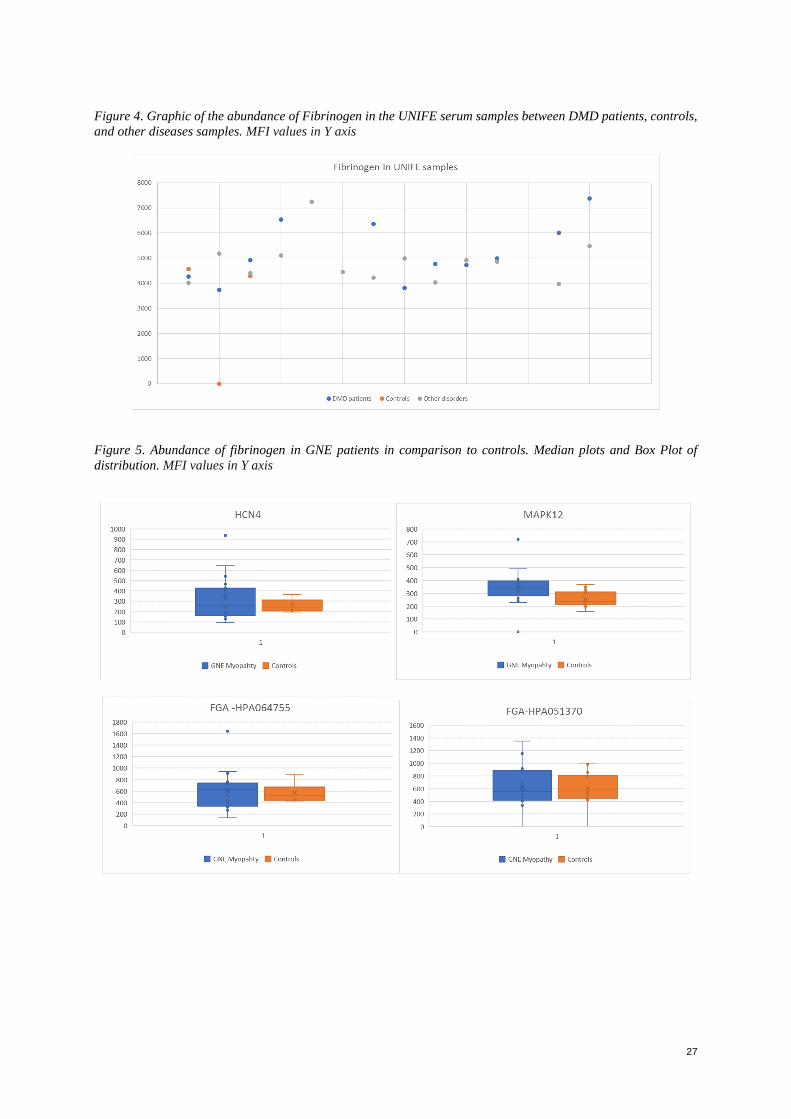
27
Figure 4. Graphic of the abundance of Fibrinogen in the UNIFE serum samples between DMD patients, controls,
and other diseases samples. MFI values in Y axis
Figure 5. Abundance of fibrinogen in GNE patients in comparison to controls. Median plots and Box Plot of
distribution. MFI values in Y axis
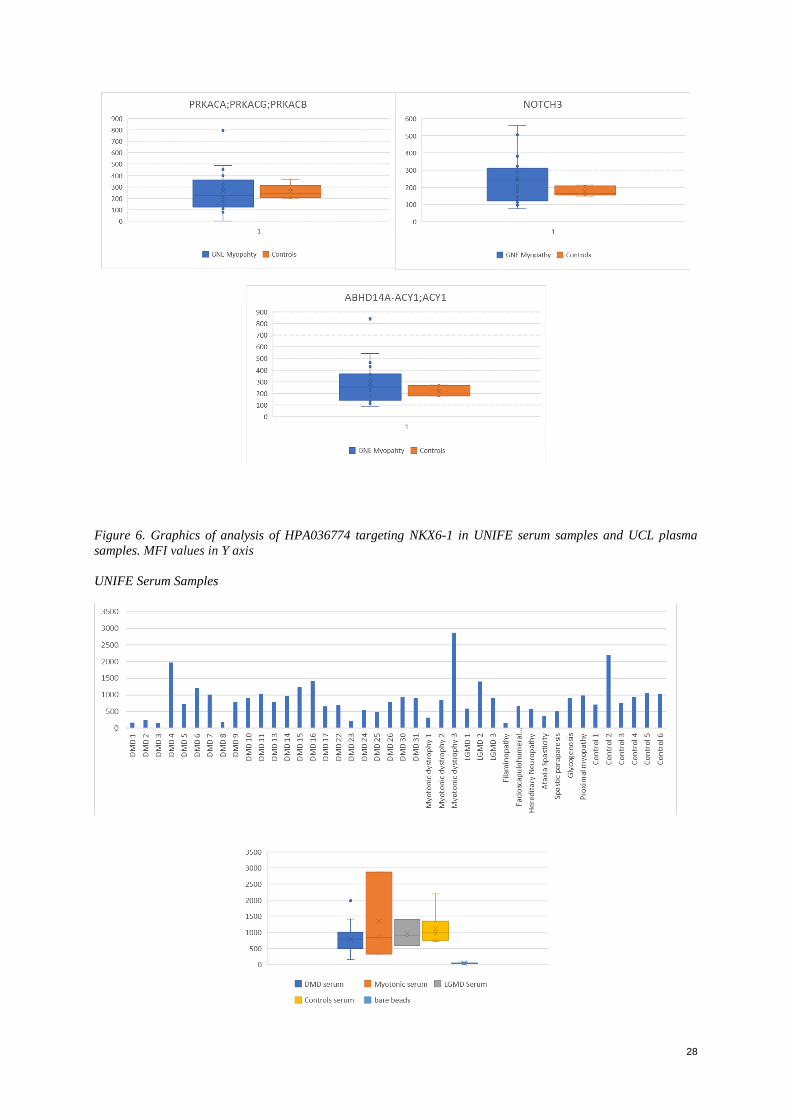
28
Figure 6. Graphics of analysis of HPA036774 targeting NKX6-1 in UNIFE serum samples and UCL plasma
samples. MFI values in Y axis
UNIFE Serum Samples
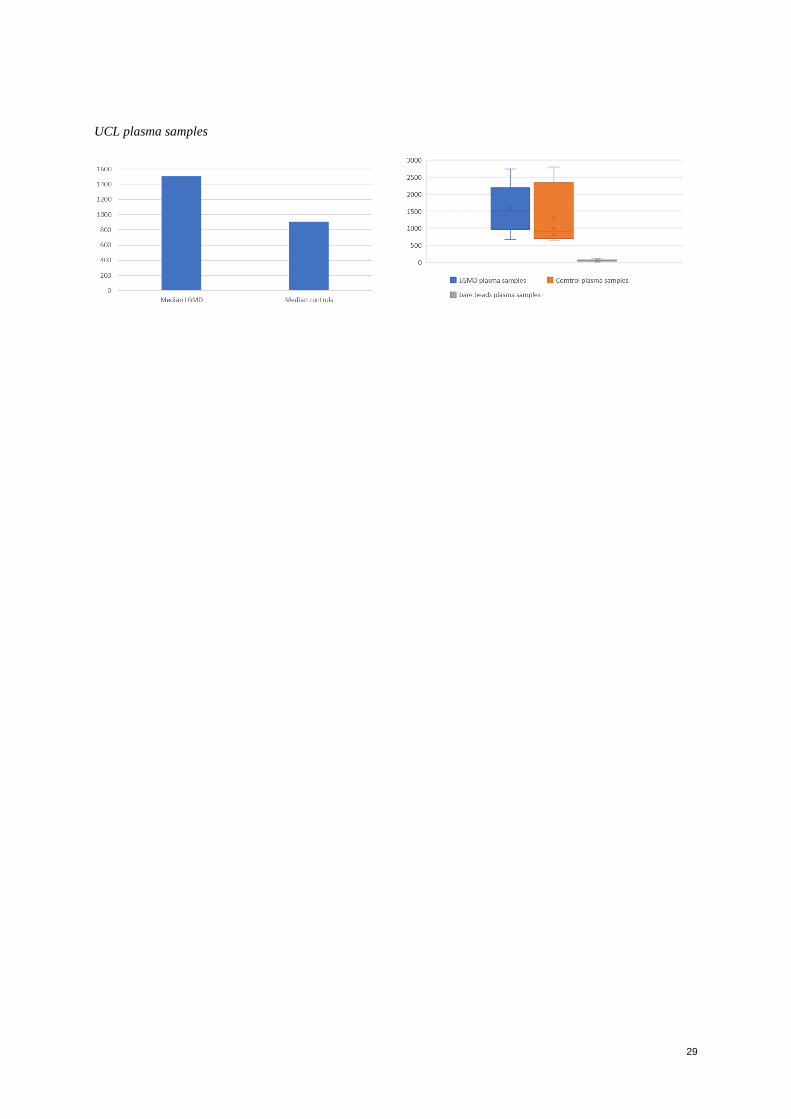
29
UCL plasma samples

www.kth.se