Embed Size (px)
Citation preview
7/27/2019 Protein isolation chromatography.pdf
http://slidepdf.com/reader/full/protein-isolation-chromatographypdf 1/15
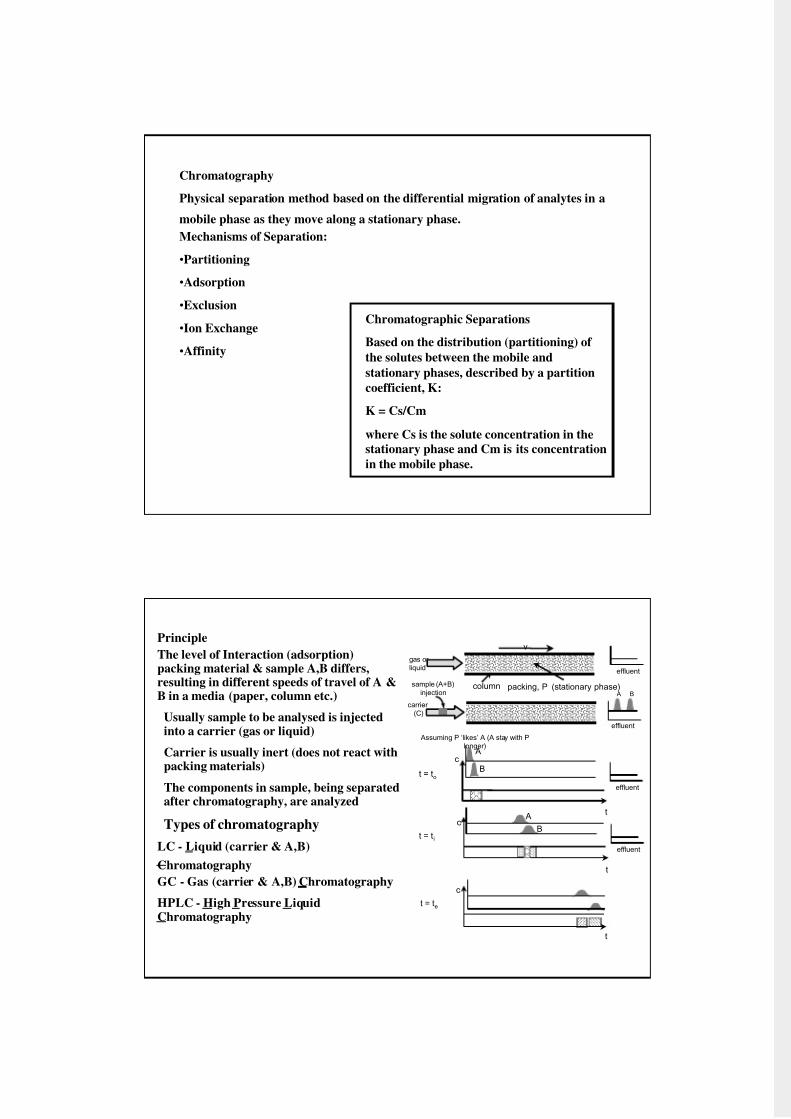
Chromatography
Physical separation method based on the differential migration of analytes in a
mobile phase as they move along a stationary phase.
Mechanisms of Separation:
•Partitioning
•Adsorption
•Exclusion
•Ion Exchange
•Affinity
Chromatographic Separations
Based on the distribution (partitioning) of
the solutes between the mobile and
stationary phases, described by a partition
coefficient, K:
K = Cs/Cm
where Cs is the solute concentration in the
stationary phase and Cm is its concentration
in the mobile phase.
Principle
The level of Interaction (adsorption)packing material & sample A,B differs,resulting in different speeds of travel of A &B in a media (paper, column etc.)
Usually sample to be analysed is injectedinto a carrier (gas or liquid)
Carrier is usually inert (does not react withpacking materials)
The components in sample, being separatedafter chromatography, are analyzed
Types of chromatography
LC - Liquid (carrier & A,B)
Chromatography
GC - Gas (carrier & A,B) Chromatography
HPLC - High Pressure LiquidChromatography
t
gas or
liquid
sample (A+B)
injection A B
effluent
column packing, P (stationary phase)
t
c
t
c
c
A
B
A
B
t = to
t = ti
t = te
effluent
Assuming P ‘likes’ A (A stay with P
longer)
carrier
(C)
effluent
effluent
v
7/27/2019 Protein isolation chromatography.pdf
http://slidepdf.com/reader/full/protein-isolation-chromatographypdf 2/15
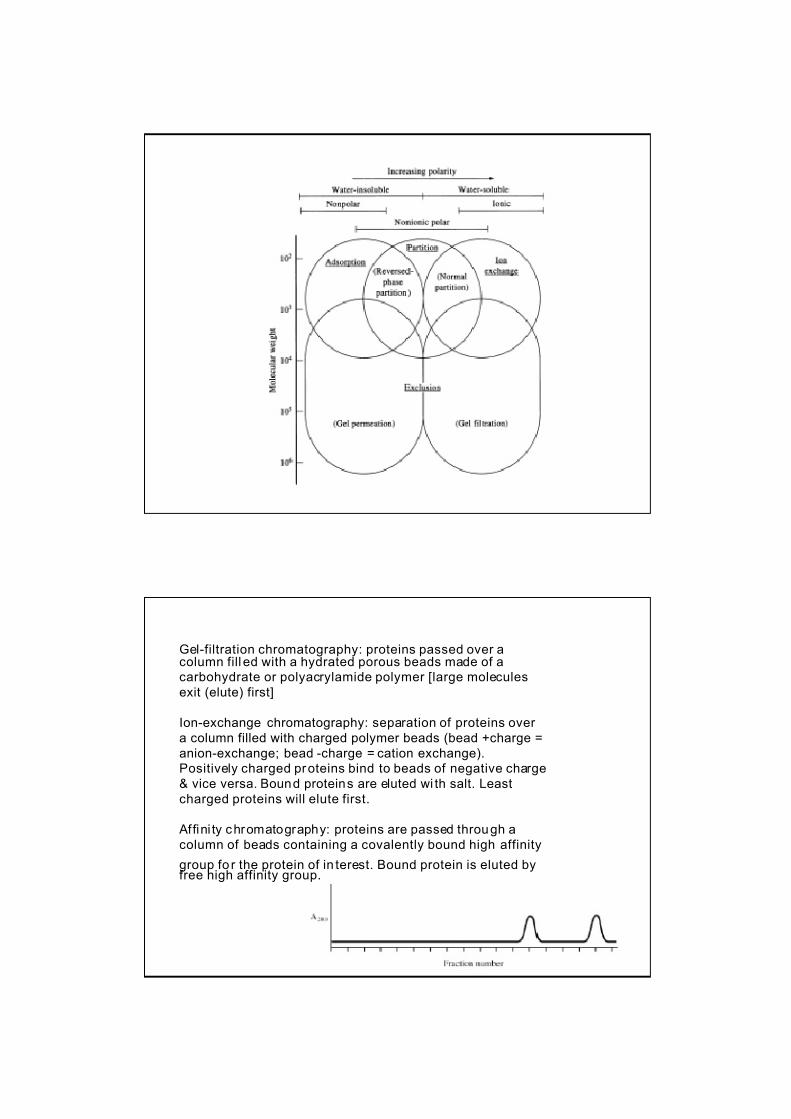
Gel-filtration chromatography: proteins passed over acolumn fill ed with a hydrated porous beads made of a
carbohydrate or polyacrylamide polymer [large molecules
exit (elute) first]
Ion-exchange chromatography: separation of proteins over
a column filled with charged polymer beads (bead +charge =
anion-exchange; bead -charge = cation exchange).
Positively charged proteins bind to beads of negative charge
& vice versa. Bound proteins are eluted wi th salt. Least
charged proteins will elute first.
Affini ty chromatography: proteins are passed through a
column of beads containing a covalently bound high affinity
group fo r the protein of in terest. Bound protein is eluted byfree high affinity group.
7/27/2019 Protein isolation chromatography.pdf
http://slidepdf.com/reader/full/protein-isolation-chromatographypdf 3/15
Sephadex G-50 1-30 kD
Sephadex G-100 4-150 kD
Sephadex G-200 5-600 kD
Bio-Gel P-10 1.5-20 kD
Bio-Gel P-30 2.4-40 kD
Bio-Gel P-100 5-100 kDBio-Gel P-300 60-400 kD
Sephadex is a trademark of Pharmacia.
Bio-Gel is a trademark of Bio-Rad.
Biochemists refer to a protein's size interms of its molecular weight, in kDa(a kilodalton, kD or kDa, is 1000 times themolecular mass of hydrogen)Each amino acid residue counts for about 110
daltons, that is, about 0.11 kDa.
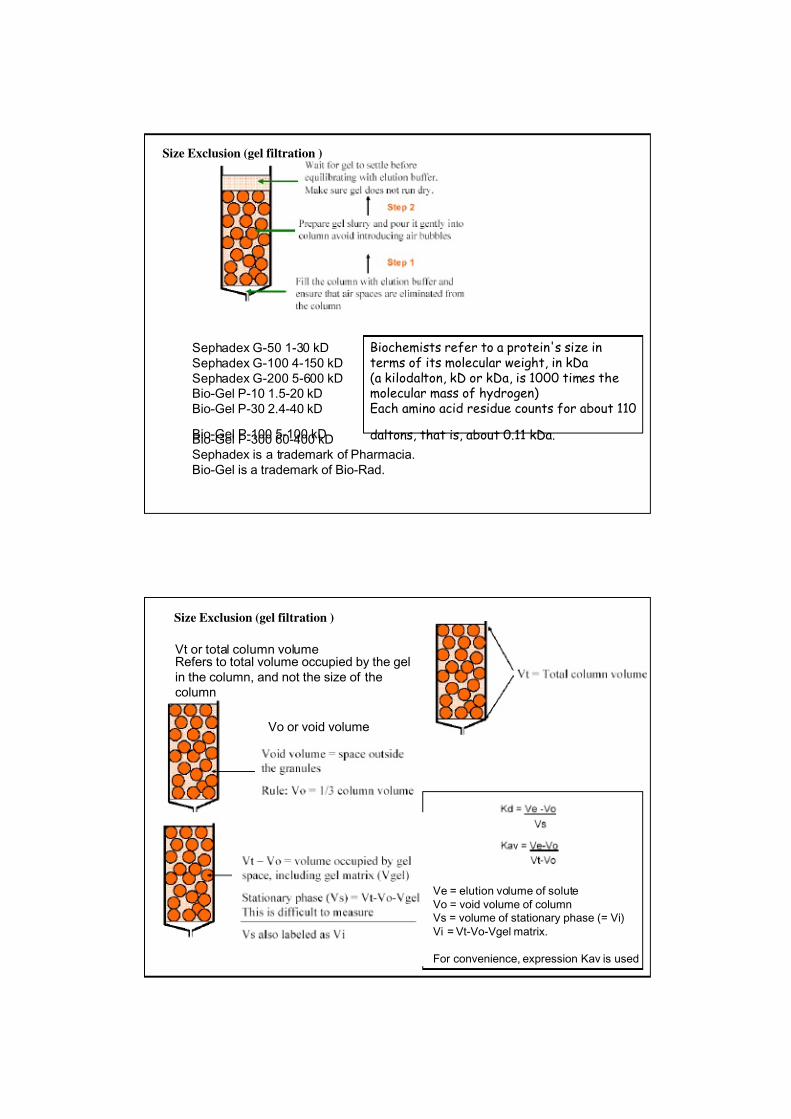
Size Exclusion (gel filtration )
Vt or total column volumeRefers to total volume occupied by the gel
in the column, and not the size of the
column
Vo or void volume
Size Exclusion (gel filtration )
Ve = elution volume of solute
Vo = void volume of column
Vs = volume of stationary phase (= Vi)
Vi = Vt-Vo-Vgel matrix.
For convenience, expression Kav is used
7/27/2019 Protein isolation chromatography.pdf
http://slidepdf.com/reader/full/protein-isolation-chromatographypdf 4/15
Size Exclusion (gel filtration )
• Column matrix and solvent are selected to minimize adsorption
• Isocratic elution (same buffer throughout)• Particle size determines determines the void volume- Vo
• Pore size determines the resolving range
– Molecules larger than the largest pore are excluded, elute at Vo
– Molecules that are smaller than the smallest pore are included
they sample both Vi and Vo elute at Vt=Vi + Vo
– Molecules that can occupy some but not all of the pores elute at
an intermediate volume Ve
• Partition coefficient Kav = (Ve-Vo)/(Vt-Vo)
• Kav is proportional to ln (MW) in the resolving range
large
medium
small
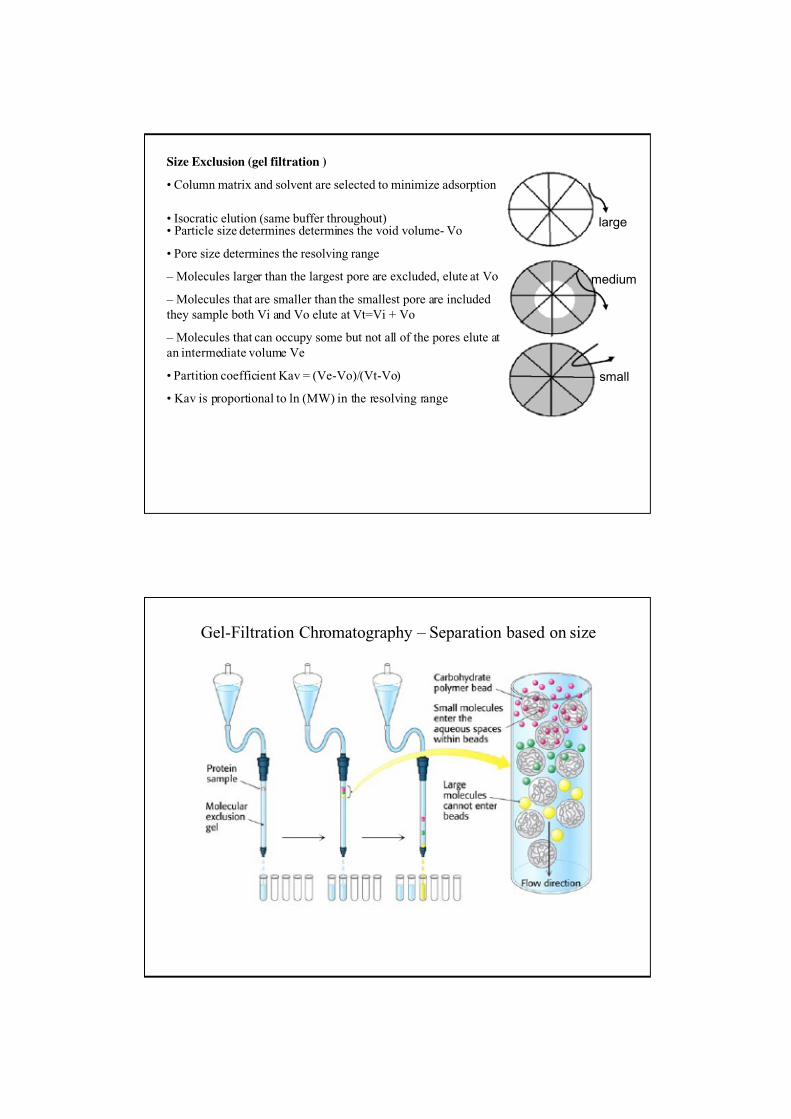
Gel-Filtration Chromatography – Separation based on size
7/27/2019 Protein isolation chromatography.pdf
http://slidepdf.com/reader/full/protein-isolation-chromatographypdf 5/15
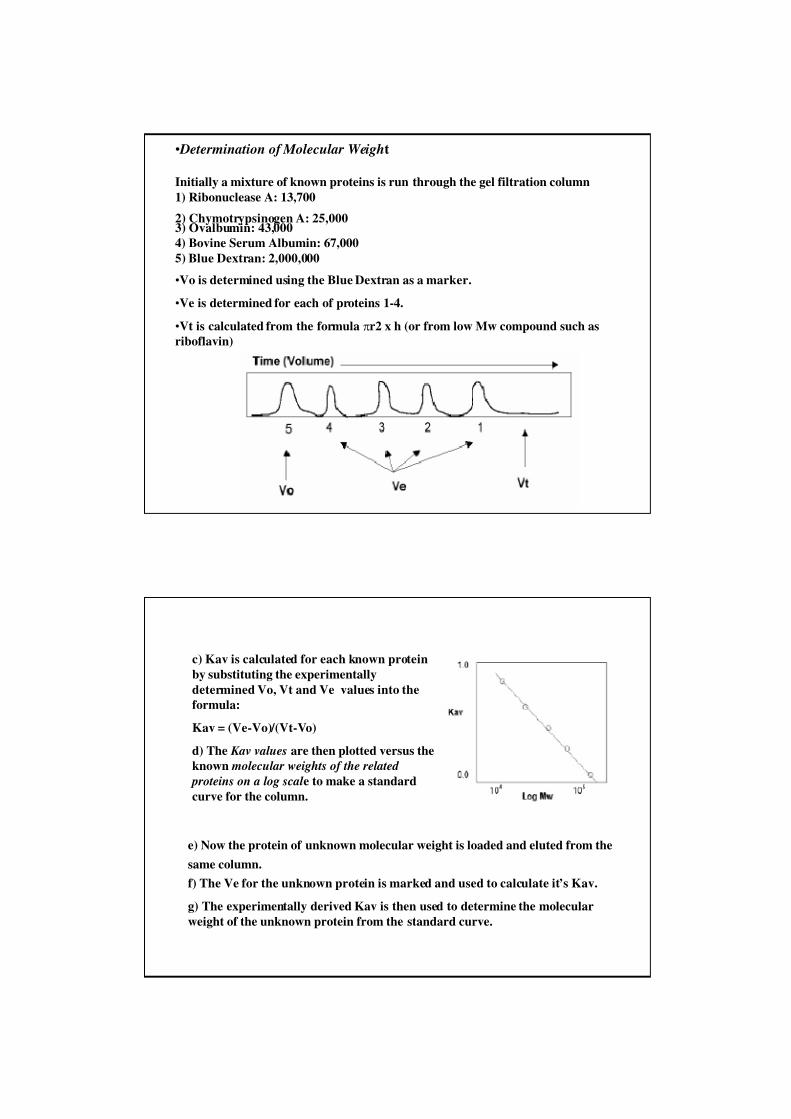
• Determination of Molecular Weight
Initially a mixture of known proteins is run through the gel filtration column
1) Ribonuclease A: 13,700
2) Chymotrypsinogen A: 25,0003) Ovalbumin: 43,000
4) Bovine Serum Albumin: 67,000
5) Blue Dextran: 2,000,000
•Vo is determined using the Blue Dextran as a marker.
•Ve is determined for each of proteins 1-4.
•Vt is calculated from the formula πr2 x h (or from low Mw compound such as
riboflavin)
e) Now the protein of unknown molecular weight is loaded and eluted from the
same column.
f) The Ve for the unknown protein is marked and used to calculate it’s Kav.
g) The experimentally derived Kav is then used to determine the molecular
weight of the unknown protein from the standard curve.
c) Kav is calculated for each known protein
by substituting the experimentally
determined Vo, Vt and Ve values into the
formula:
Kav = (Ve-Vo)/(Vt-Vo)
d) The Kav values are then plotted versus the
known molecular weights of the related
proteins on a log scal e to make a standard
curve for the column.
7/27/2019 Protein isolation chromatography.pdf
http://slidepdf.com/reader/full/protein-isolation-chromatographypdf 6/15
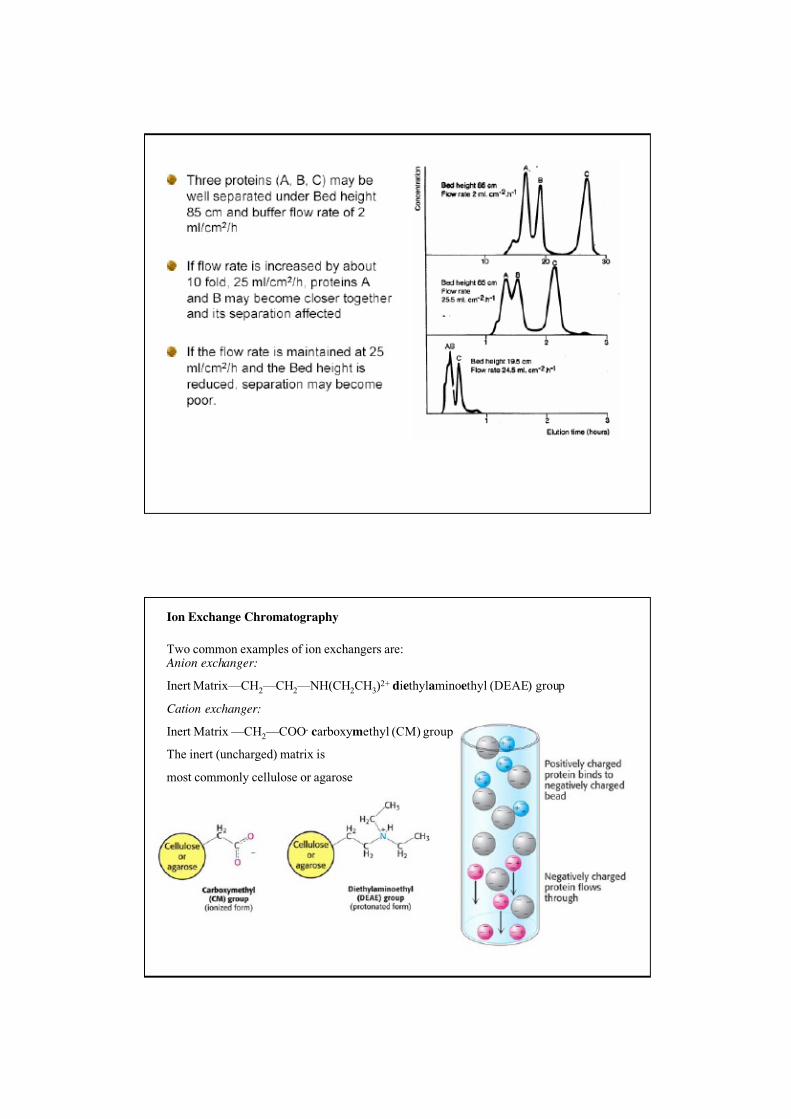
Ion Exchange Chromatography
Two common examples of ion exchangers are: Anion exchanger:
Inert Matrix—CH2 —CH2 —NH(CH2CH3)2+ diethylaminoethyl (DEAE) group
Cation exchanger:
Inert Matrix —CH2 —COO- carboxymethyl (CM) group
The inert (uncharged) matrix is
most commonly cellulose or agarose
7/27/2019 Protein isolation chromatography.pdf
http://slidepdf.com/reader/full/protein-isolation-chromatographypdf 7/15
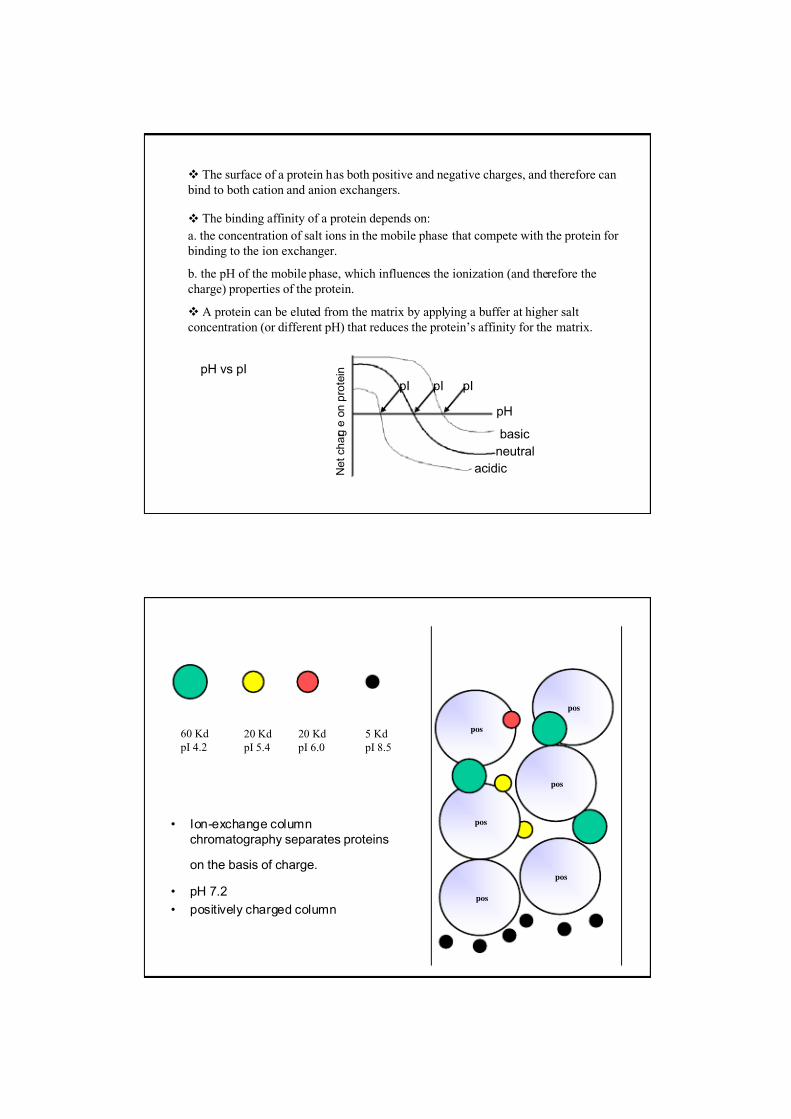
The surface of a protein has both positive and negative charges, and therefore can
bind to both cation and anion exchangers.
The binding affinity of a protein depends on:
a. the concentration of salt ions in the mobile phase that compete with the protein for
binding to the ion exchanger.
b. the pH of the mobile phase, which influences the ionization (and therefore the
charge) properties of the protein.
A protein can be eluted from the matrix by applying a buffer at higher salt
concentration (or different pH) that reduces the protein’s affinity for the matrix.
pH
pIpIpI
basic
neutral
acidic N e t c h a r g
e
o n
p r o t e i npH vs pI
60 Kd
pI 4.2
20 Kd
pI 5.4
20 Kd
pI 6.0
5 Kd
pI 8.5
• Ion-exchange column
chromatography separates proteins
on the basis of charge.
• pH 7.2
• positively charged column
pos
pos
pos
pos
pos
pos
7/27/2019 Protein isolation chromatography.pdf
http://slidepdf.com/reader/full/protein-isolation-chromatographypdf 8/15
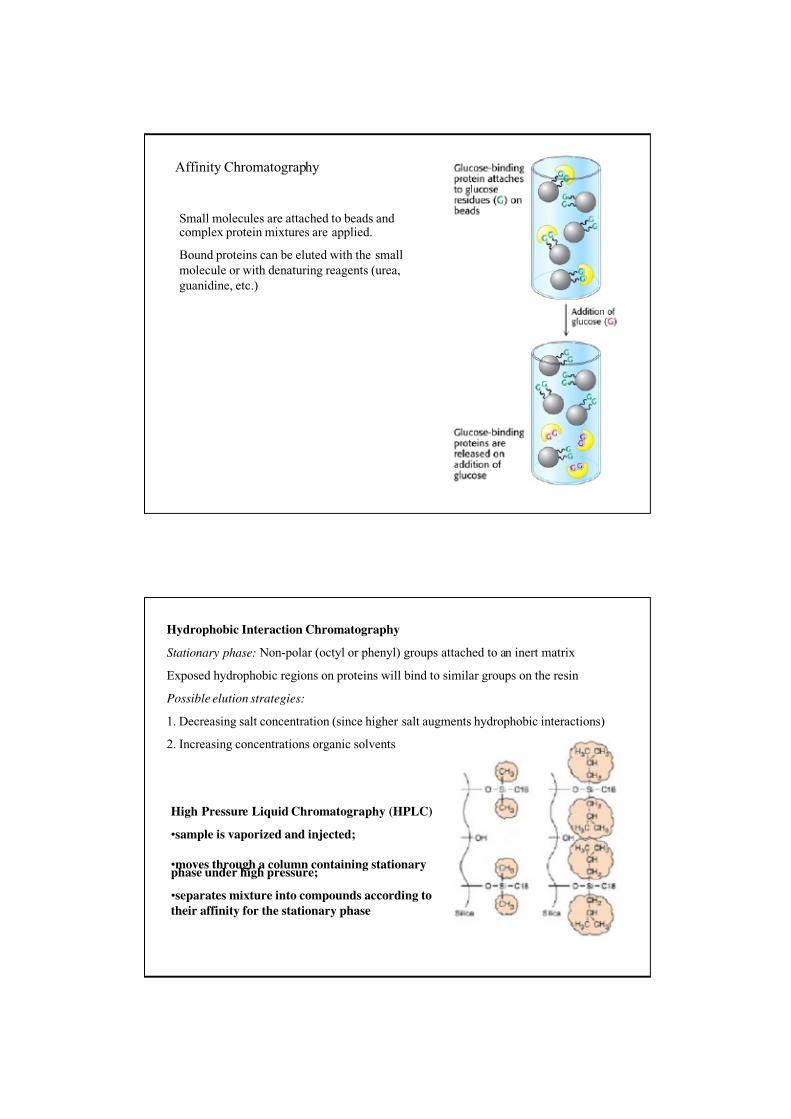
Affinity Chromatography
Small molecules are attached to beads and complex protein mixtures are applied.
Bound proteins can be eluted with the small
molecule or with denaturing reagents (urea,
guanidine, etc.)
Hydrophobic Interaction Chromatography
Stationary phase: Non-polar (octyl or phenyl) groups attached to an inert matrix
Exposed hydrophobic regions on proteins will bind to similar groups on the resin
Possible elution strategies:
1. Decreasing salt concentration (since higher salt augments hydrophobic interactions)
2. Increasing concentrations organic solvents
High Pressure Liquid Chromatography (HPLC)
•sample is vaporized and injected;
•moves through a column containing stationaryphase under high pressure;
•separates mixture into compounds according to
their affinity for the stationary phase
7/27/2019 Protein isolation chromatography.pdf
http://slidepdf.com/reader/full/protein-isolation-chromatographypdf 9/15
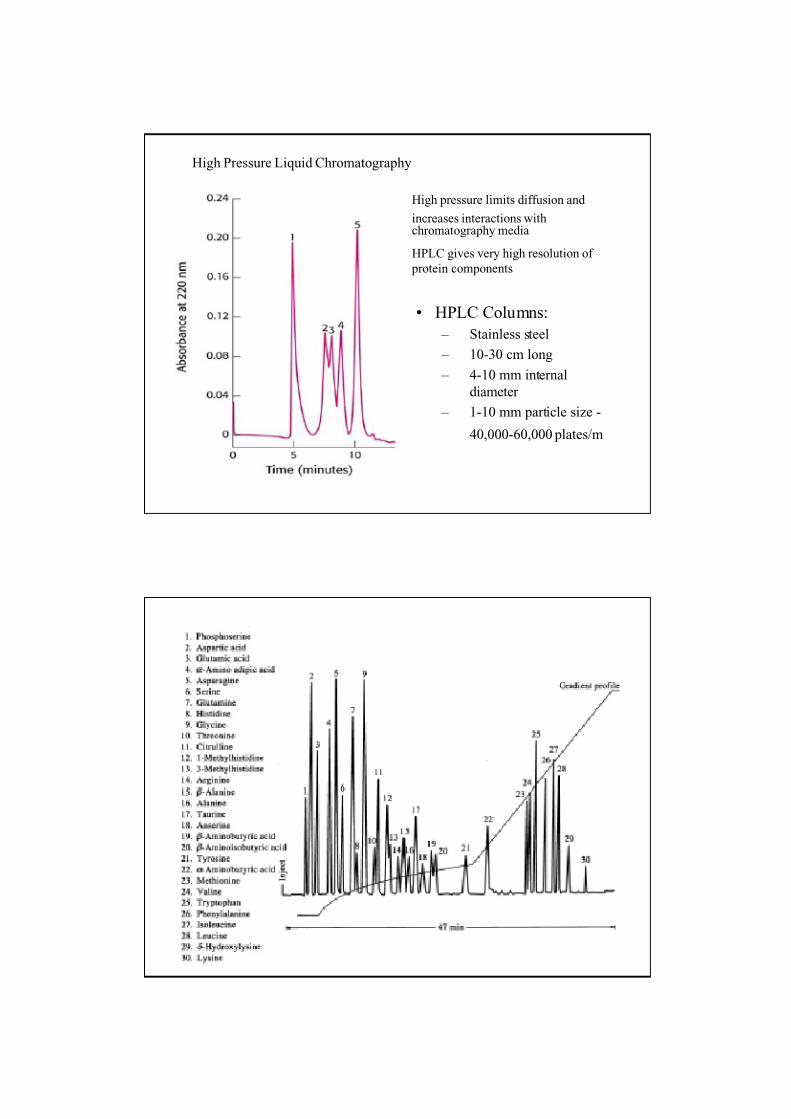
High Pressure Liquid Chromatography
High pressure limits diffusion and
increases interactions withchromatography media
HPLC gives very high resolution of
protein components
• HPLC Columns:
– Stainless steel
– 10-30 cm long
– 4-10 mm internal
diameter
– 1-10 mm particle size -
40,000-60,000 plates/m
7/27/2019 Protein isolation chromatography.pdf
http://slidepdf.com/reader/full/protein-isolation-chromatographypdf 10/15
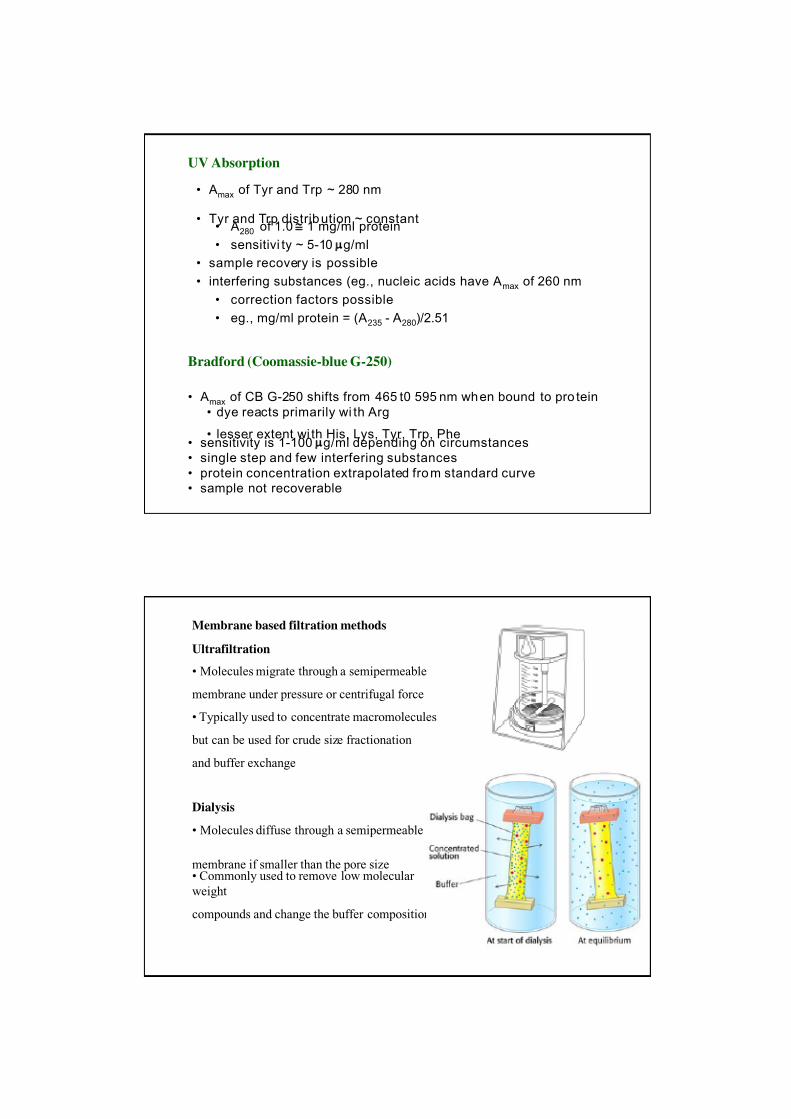
UV Absorption
• Amax of Tyr and Trp ~ 280 nm
• Tyr and Trp distribution ~ constant• A280 of 1.0 ≅ 1 mg/ml protein
• sensitivi ty ~ 5-10 µg/ml
• sample recovery is possible
• interfering substances (eg., nucleic acids have Amax of 260 nm
• correction factors possible
• eg., mg/ml protein = (A235 - A280)/2.51
Bradford (Coomassie-blue G-250)
• Amax of CB G-250 shifts from 465 t0 595 nm when bound to pro tein
• dye reacts primarily wi th Arg
• lesser extent wi th His, Lys, Tyr, Trp, Phe• sensitivity is 1-100 µg/ml depending on circumstances
• single step and few interfering substances
• protein concentration extrapolated from standard curve
• sample not recoverable
Membrane based filtration methods
Ultrafiltration
• Molecules migrate through a semipermeable
membrane under pressure or centrifugal force
• Typically used to concentrate macromolecules
but can be used for crude size fractionation
and buffer exchange
Dialysis
• Molecules diffuse through a semipermeable
membrane if smaller than the pore size• Commonly used to remove low molecular
weight
compounds and change the buffer composition
7/27/2019 Protein isolation chromatography.pdf
http://slidepdf.com/reader/full/protein-isolation-chromatographypdf 11/15
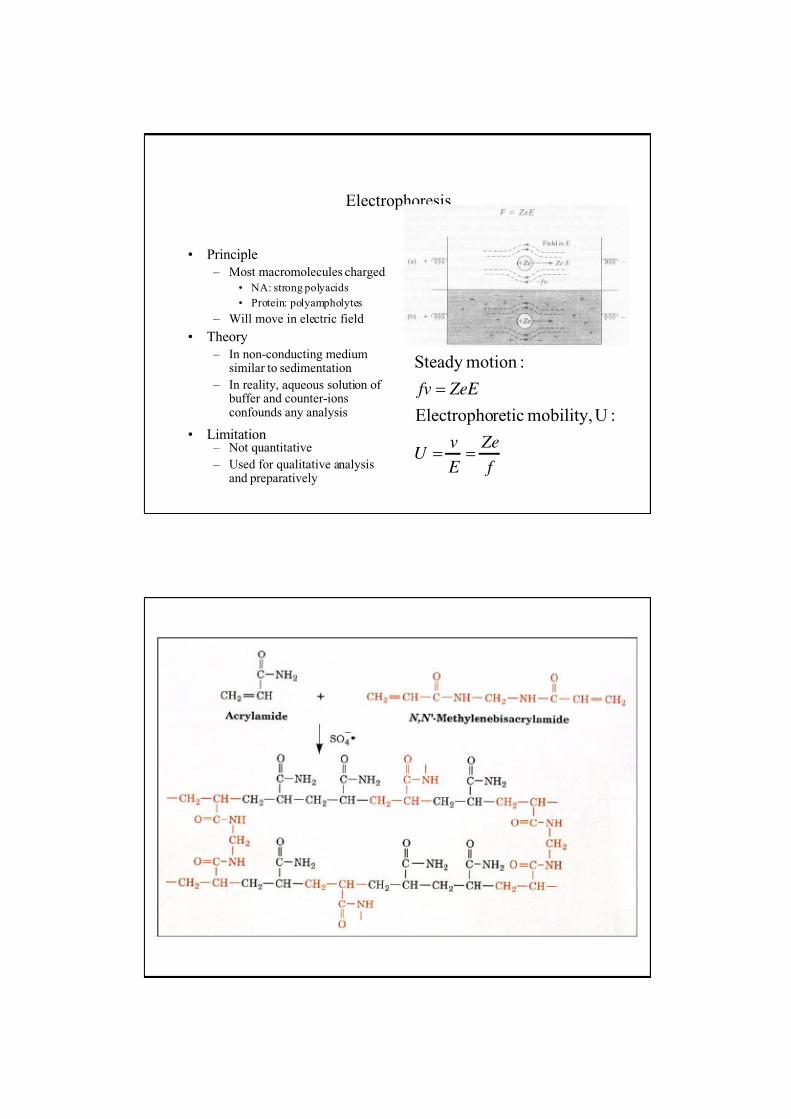
Electrophoresis
• Principle
– Most macromolecules charged
• NA: strong polyacids
• Protein: polyampholytes
– Will move in electric field
• Theory
– In non-conducting mediumsimilar to sedimentation
– In reality, aqueous solution of buffer and counter-ionsconfounds any analysis
• Limitation – Not quantitative
– Used for qualitative analysisand preparatively
f
Ze
E
vU
ZeE fv
==
=
:Umobility,reticElectropho
:motionSteady
7/27/2019 Protein isolation chromatography.pdf
http://slidepdf.com/reader/full/protein-isolation-chromatographypdf 12/15
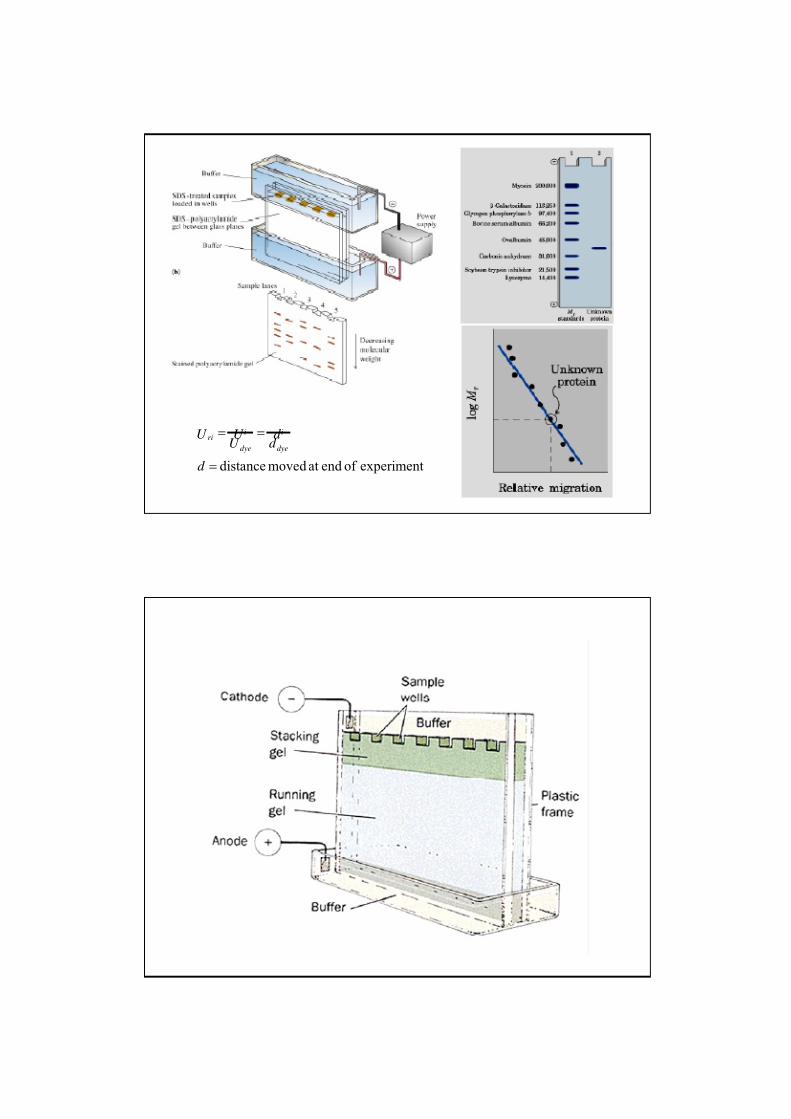
experimentof end atmoved distance=
==
d
d d
U U U
dye
i
dye
iri
7/27/2019 Protein isolation chromatography.pdf
http://slidepdf.com/reader/full/protein-isolation-chromatographypdf 13/15
Size separation gels
• DNA gels
– Charge ~ length or Mw
– f ~ length or Mw
• Extended coil
• “freely draining” coil
– Uri0 independent of Mw
• SDS-PAGE
– SDS binds in w/w ratio to protein
• Charge ~ length or Mw
– SDS uncoils protein
• f ~ length or Mw
– Uri0 independent of Mw
Mobility
DNA
Protein
log M = a – b Uri
Isoelectric focussing - pI• Electrophoresis occurs through a stable pH
gradient
• Proteins move through the gel until they
reach the point in the pH gradient where the
pH = pI
–molecules have zero net charge and don’t
move
• The isoelectric point of a protein depends
critically on the presence of amino acid side
chains that can be
protonated/deprotonated – Asp, Glu, Lys,
Arg etc
7/27/2019 Protein isolation chromatography.pdf
http://slidepdf.com/reader/full/protein-isolation-chromatographypdf 14/15
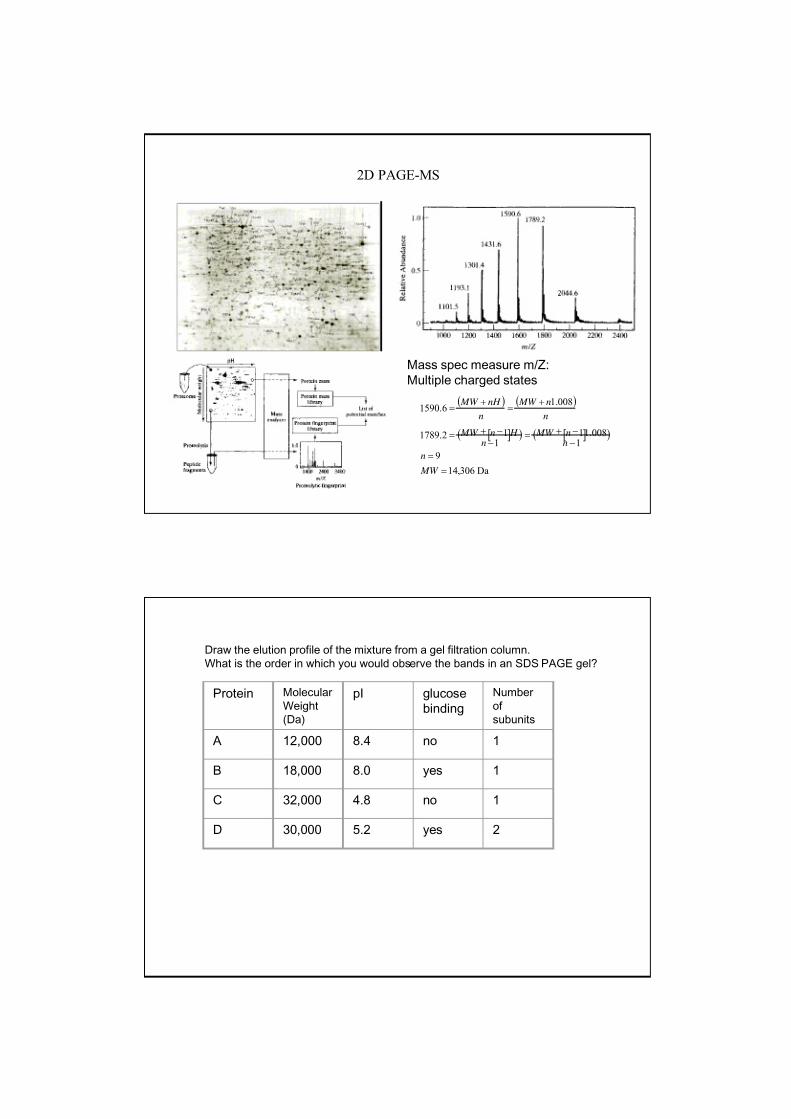
2D PAGE-MS
Mass spec measure m/Z:
Multiple charged states
( ) ( )
[ ]( ) [ ]( )
Da306,14
9
1008.11
112.1789
008.16.1590
=
=
−
−+=
−
−+=
+=
+=
MW
n
nn MW
n H n MW
n
n MW
n
nH MW
Draw the elution profile of the mixture from a gel filtration column.
What is the order in which you would observe the bands in an SDS PAGE gel?
Protein Molecular
Weight
(Da)
pI glucose
binding
Number
of
subunits
A 12,000 8.4 no 1
B 18,000 8.0 yes 1
C 32,000 4.8 no 1
D 30,000 5.2 yes 2
7/27/2019 Protein isolation chromatography.pdf
http://slidepdf.com/reader/full/protein-isolation-chromatographypdf 15/15
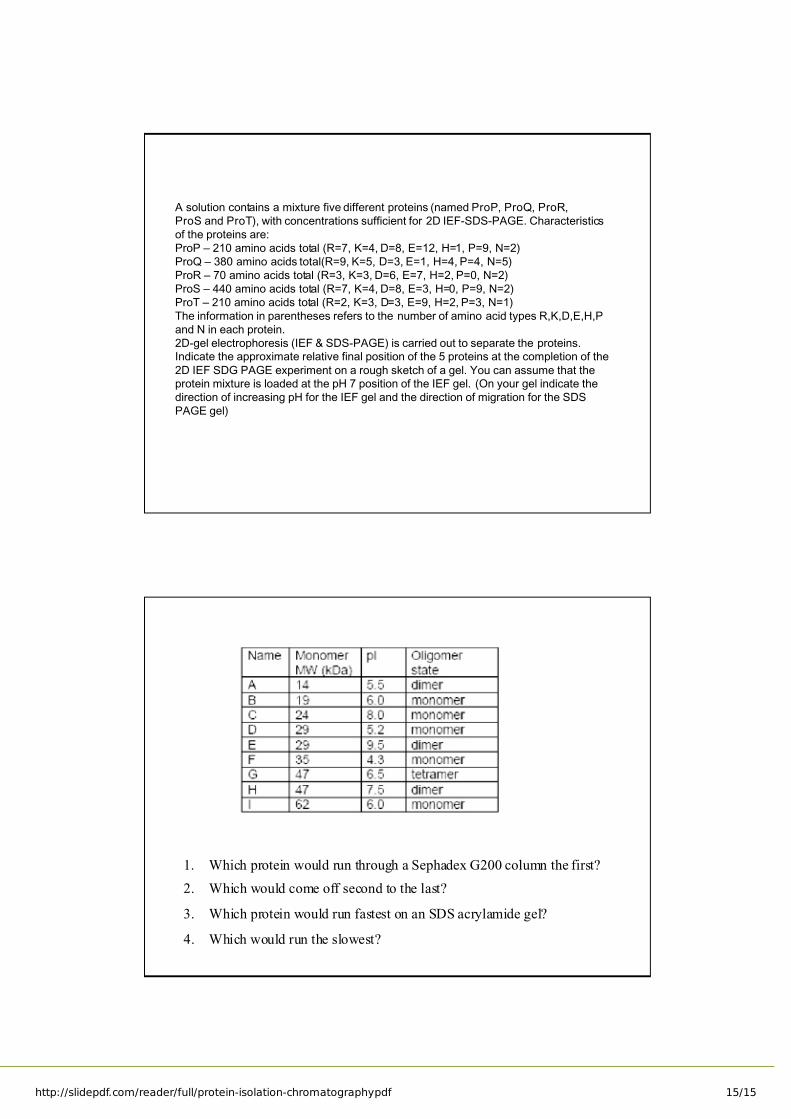
A solution contains a mixture five different proteins (named ProP, ProQ, ProR,
ProS and ProT), with concentrations sufficient for 2D IEF-SDS-PAGE. Characteristics
of the proteins are:
ProP – 210 amino acids total (R=7, K=4, D=8, E=12, H=1, P=9, N=2)
ProQ – 380 amino acids total(R=9, K=5, D=3, E=1, H=4, P=4, N=5)
ProR – 70 amino acids total (R=3, K=3, D=6, E=7, H=2, P=0, N=2)
ProS – 440 amino acids total (R=7, K=4, D=8, E=3, H=0, P=9, N=2)
ProT – 210 amino acids total (R=2, K=3, D=3, E=9, H=2, P=3, N=1)
The information in parentheses refers to the number of amino acid types R,K,D,E,H,P
and N in each protein.
2D-gel electrophoresis (IEF & SDS-PAGE) is carried out to separate the proteins.
Indicate the approximate relative final position of the 5 proteins at the completion of the
2D IEF SDG PAGE experiment on a rough sketch of a gel. You can assume that the
protein mixture is loaded at the pH 7 position of the IEF gel. (On your gel indicate the
direction of increasing pH for the IEF gel and the direction of migration for the SDS
PAGE gel)
1. Which protein would run through a Sephadex G200 column the first?
2. Which would come off second to the last?
3. Which protein would run fastest on an SDS acrylamide gel?
4. Which would run the slowest?