Embed Size (px)
DESCRIPTION
Protein Quantification Experiment
Citation preview
1
Isolation, Quantification, Protein Gel Electrophoresis, & Enzyme Kinetics of
Alkaline Phosphatase
Melvin Onyia, Maria Hernandez, Eric Ovalle, TK Lee, & Daniella Jayanty
Dr. Neha Parikh
CHEM 4140: CRN 11053
December 12, 2014
Words: 1640
Onyia

2
Abstract
The purpose of the experiment was to observe different qualities of Alkaline
Phosphatase using biochemistry laboratory techniques such as chromatographic isolation,
spectrophotometric quantification, electrophoresis, and enzyme kinetics analysis. These
principal techniques demonstrate the procedures required to remove AP from the E.coli
bacterium and isolate it for analyze its activity. The resulting data indicates there is
greater enzymatic activity and grater affinity at pH 7.0. Alkaline Phosphatase can be used
for various scientific endeavors that play key roles in groundbreaking scientific research
due to its stability.
Introduction
The initial step is to isolate E. coli Alkaline Phosphatase (AP) using dialysis and
column chromatography. E. coli Alkaline Phosphatase is located in the periplasm, it is a
heat-stable homodimeric enzyme with a molecular weight of 86,000 and contains two
Zn2+ per dimer with a pI of 4.5 and a maximal activity at pH 8.0. An E. coli K-12 mutant
bacterium was prepared for the experiment.
Spectrophotometry serves to quantify an estimate of the compounds based on
color intensities. The use of colorimetric procedures is useful to measure the
concentration of proteins, determination of enzymatic kinetic constants, and measuring
ligand-binding reactions. This experiment quantified the protein concentration of alkaline
phosphatase using the Bradford protein assay procedurefor absorbance at 595 nm.
Electrophoresis is a versatile tool in analytical biochemistry; it allows the
separation of proteins and other molecules based on a varying number of
Onyia
3
properties. The mobility of ions is determined by the charge (q) of the molecule, the
voltage gradient of the electric field (E), and the fractional resistance of the
supporting medium (f). The ratio of the distance a protein migrates and a small
anionic dye is referred to as the relative motilities of said proteins (Rf). Ammonium
persulfate and TEMED are used to form free radicals which in turn react with
acrylamide and induce polymerization.
The use of steady state kinetics to determine the mechanism of an enzyme
can be quite useful. Characteristics of kinetic properties include determining the Km,
Vmax, and inhibition constant of various substances. The velocity of catalyzed
reaction can be determine by the rate limiting step k2. Michaelis constant Km
represents the concentration of substrate that produces half of the maximum
velocity of the catalyzed reaction. Km allows for the determination of the amount of
substrate needed to reach the maximum velocity and indirectly signifies enzyme
affinity.
Materials
E. coli K-12 was suspended at 25 mg/ml in 10 ml of 30 mM Tris-HCl (pH 8.0),
0.5 M Sucrose. 5 g of E. coli was washed with 10 mM Tris-HCl and centrifuged and re-
suspended in 10 ml of 30 mM Tris-HCl (pH 8.0),0.5 M Sucrose. Lysozyme, DNAse, and
MgSO4, EDTA, and Tris-HCl were used to isolate the enzyme. High-speed centrifuge
was used initially at 12,000g at 4 °C (rpm = 91Ö(g): 9969 rpm); N606. Ammonium
sulfate, (DEAE), and Sigma-Fast BCIP/Nitro-blue Terazonium Tablets were used to test
the final concentration of AP
Onyia
4
A spectrophotometer was set to 595nm. The required amount of BSA standard
(0.2 mg/mL) with Column buffer A (Dilutant): 5 mM Tris-HCL, 5 mM MgCl2, pH 7.4
and samples (S1, S2, S3, S4) were pipetted into the appropriate test tubes of the 96 well
plate. 0.2 mL of working Bradford reagent was added to each test tube and mixed. The
total volume of protein sample in each tube was 50 µL, absorbance was measured via the
plate reader.
A stacking gel was prepared with 50 µL of 25% ammonium persulfate, 10µL
of TEMED, and 7 mL of 10% acrylamide gel mix. 20 µL of each stage (1-4) were
mixed with 20 µL of 2X SDS-PAGE and boiled to denature proteins, used as sample
buffer, stored at 4 C. A protein standard ladder, AP stages 1-4 and pure alkaline
phosphatase were pipetted into separate wells. The gel was placed into a Bio-Rad
Mini-PROTEAN 3 Cell gel kit with 1 liter of 1X SDS-PAGE and went through
electrophoresis at 200 volts. 1 liter of coomassie blue stain was used, after which 2
rounds of 1 liter of destain solution was used.
3 mL of 0.2 M Tris_HCl and 3 mL 50 µM p-nitrophenol (PNPMW=139.1 g/mole) were
placed into a reference cuvette. 1.5 mL of 1 mM p-nitrophenyl phosphate
(PNPPMW=457.4 g/mole) and 1.5 ml of Tris-HCl (pH 8.0) were pipetted into a secondary
reference cuvette; to be used to zero the spectrometer. 2.5 mL of 0.2 M Tris-HCl (pH
8.0) and 0.45 ml of 1 mM PNPP were placed into a cuvette. 50 µL of enzyme was
added and mixed quickly. The absorbance was measured in 20 sec. increments for
180sec. The change in absorbance was measures every 20 seconds with 0.25, 0.5, 1,
10, 25, 50, 100 and 150, 200, 300, 400, 500 and 600 µM PNPP in the presence of 50
µl enzyme. All absorbance were measured at 410 nm.
Onyia
5
Results
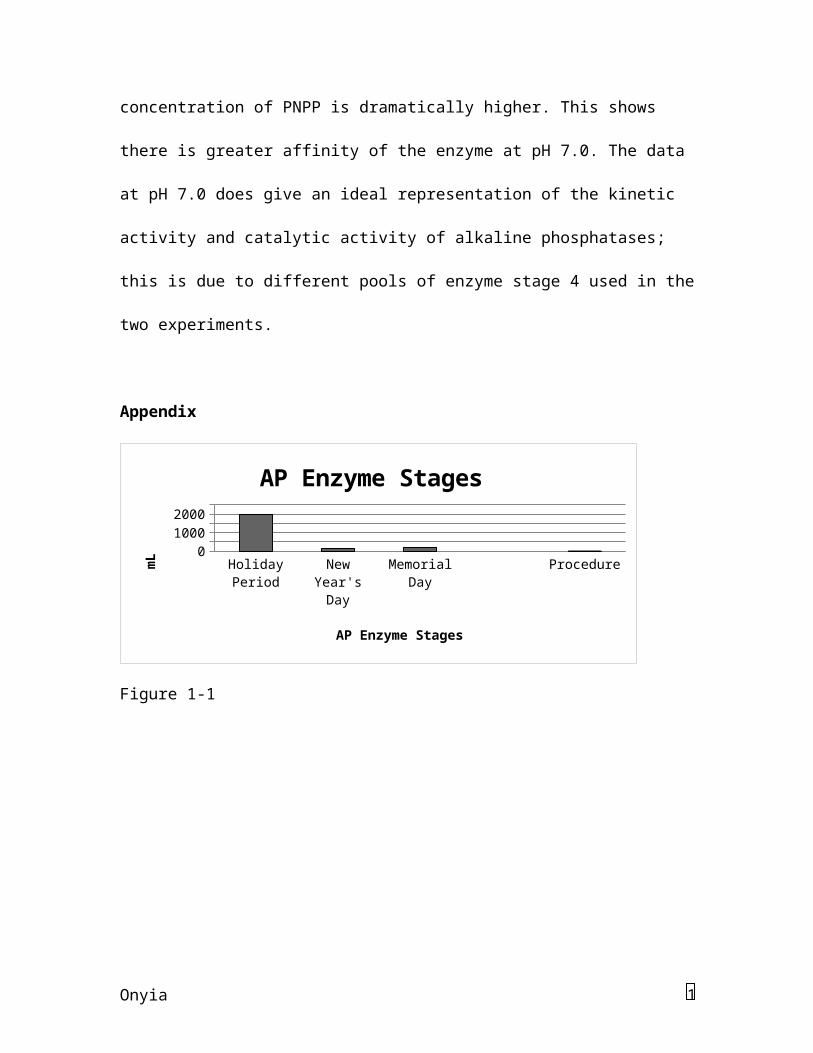
1. Initially 19 mL of the solution was collected, after several days in the dialysis
buffer, the solution expanded to 43 mL. Volume after centrifuge was 41 mL. The final
dialysis and centrifuge resulted in a volume of 13 mL. Figure 1-1 & 1-2 show the results
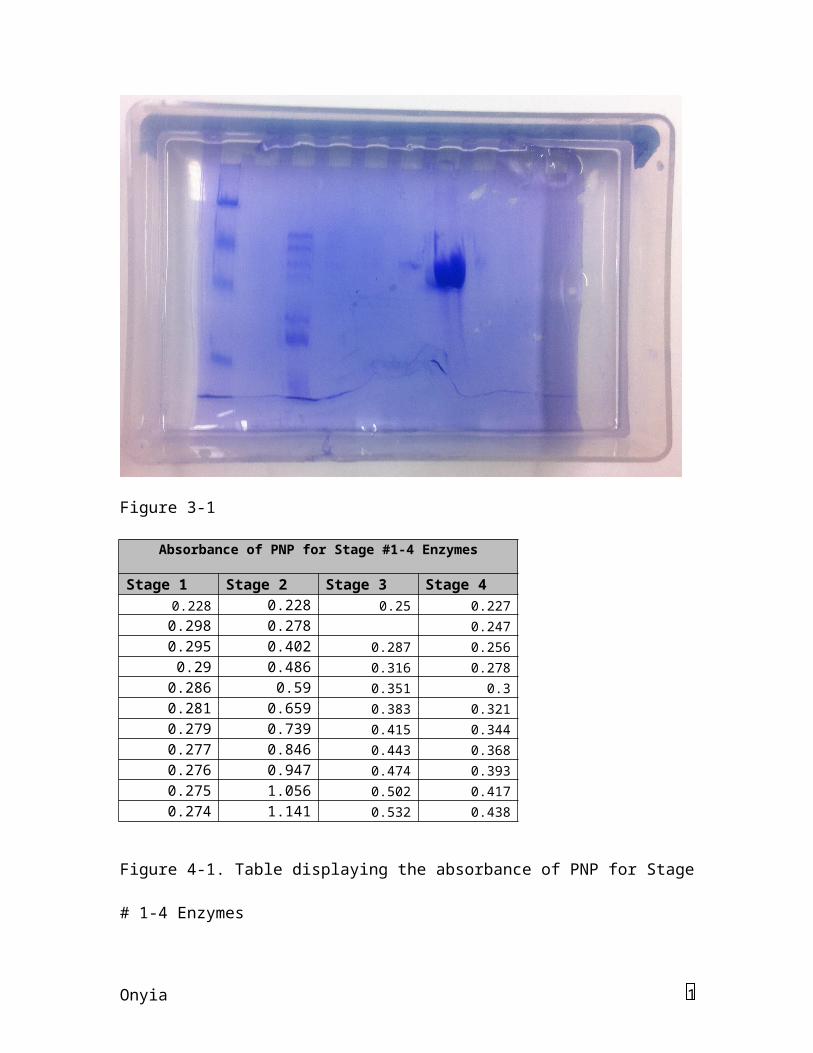
of the test and the efficiency of separating AP for other proteins. The violet color in
Figure 1-3 indicates the concentration alkaline phosphatase. The volume of the collected
portion of the mixture was 9.5 mL.
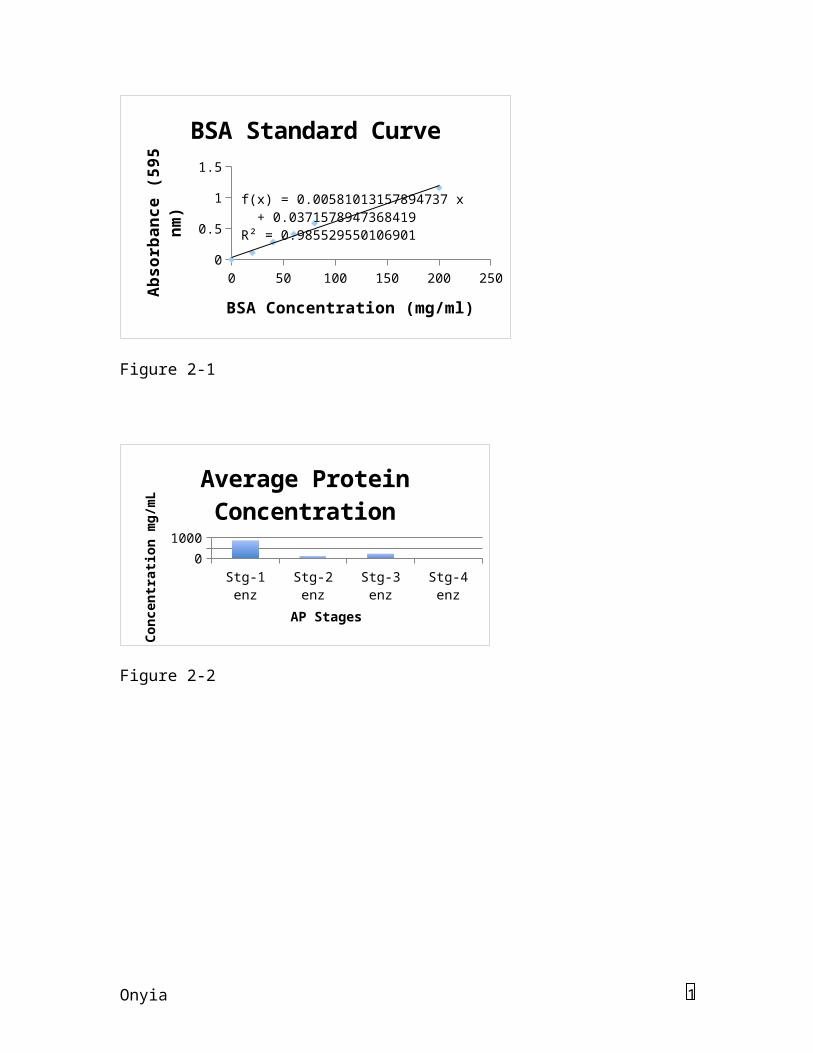
2. Figure 2-1 graphs the standard BSA curve. The correlation value of 0.985
showed that the absorption to concentration ratio was within range of 100%. The final
concentration of AP is displayed in the Figure 2-2. The measured total of the Stage 1
enzyme was 876.12 mg/ml. The results of each of theses stages were 118.79 mg/ml and
228.42 mg/ml respectively. The measured total of the Stage 4 enzyme was 9.77 mg/ml.
3. Figure 3-1 displays the destained electrophoresis gel. Stage 1 displays 8
bands in the third well. The Stage 2 enzyme displays 3 bands in the fourth well. The
stage 3 enzyme displays 2 bands in the fifth well, and the stage 4 enzyme displays 2
bands in the sixth well. The commercial AP is blown out at 86 kDa in the seventh
well.
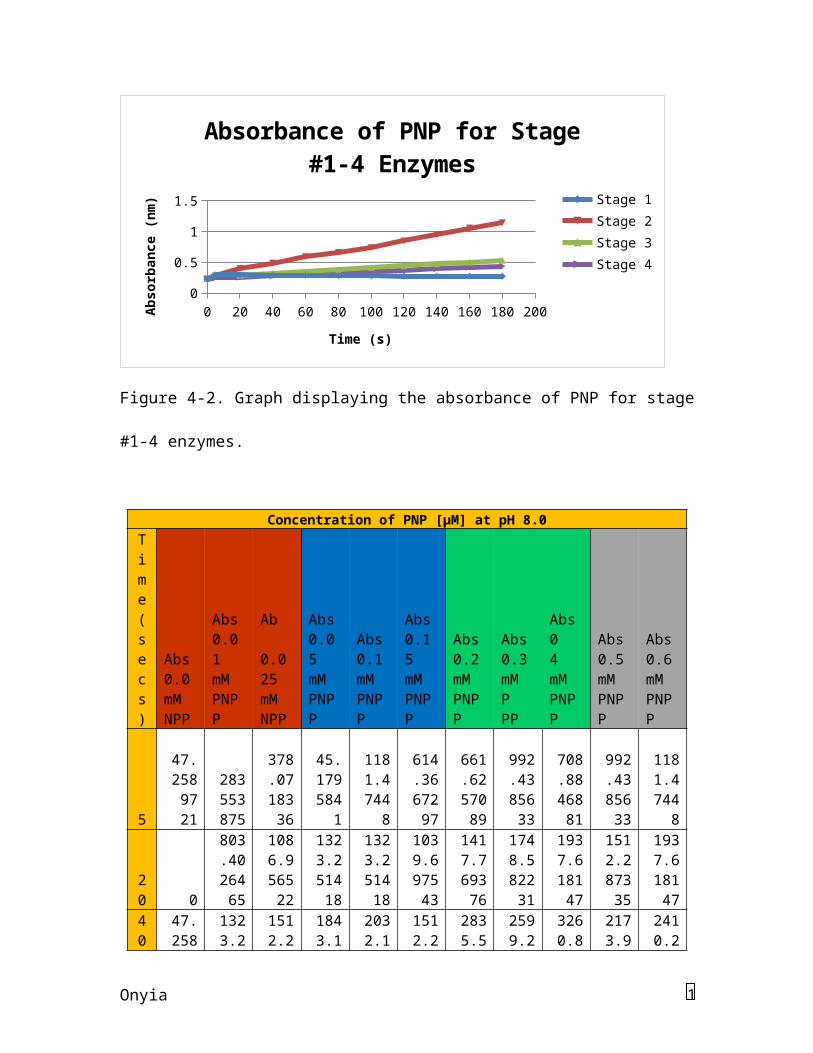
4. Figures 4-1 and 4-2 display the data and corresponding graph of the
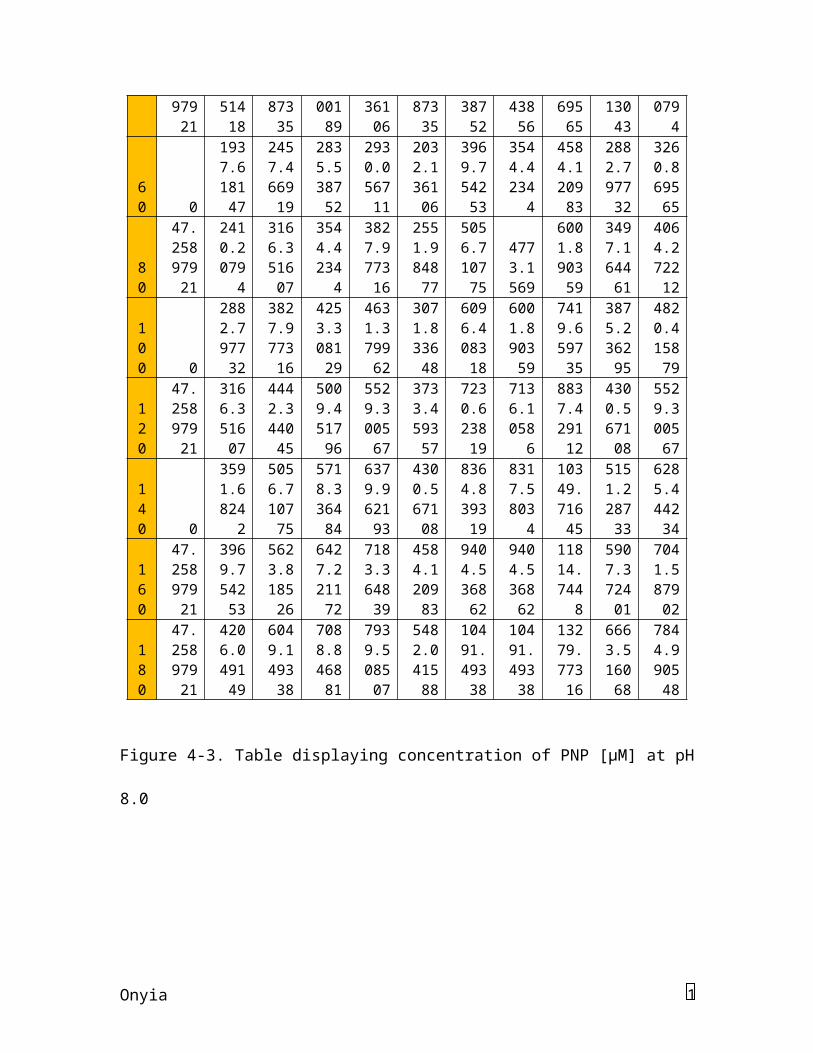
absorbance of AP. Figures 4-3, 4-4, 4-9, & 4-10 display the data regarding the
pooled samples of AP and their concentrations at pH 8.0 and 7.0. Figures 4-5, 4-6, 4-
11, & 4-12 display the data comparing Vo to substrate concentration at pH 8.0 and
7.0. Figures 4-7, 4-8, 4-13, & 4-14 display data comparing 1/Vo and 1/[S] at pH 8.0
Onyia
6
and 7.0. The Vmax and Km at pH 8.0 are 44.44 and 8.88. The Vmax and Km at pH 7.0
are 103.09 and 3.44.
Discussion
The resulting concentration of AP did not follow the ideal curve due to some level
of impurity. Inconsistency could be due to left over ammonium phosphate from previous
steps. The assay BSA value “G” had the most negative effect on the R2 value and was
omitted. The fourth stage alkaline phosphatase resulted at 9.7 mg/mL. This amount is
small compared to the starting amount of protein analyzed in the initial stages.
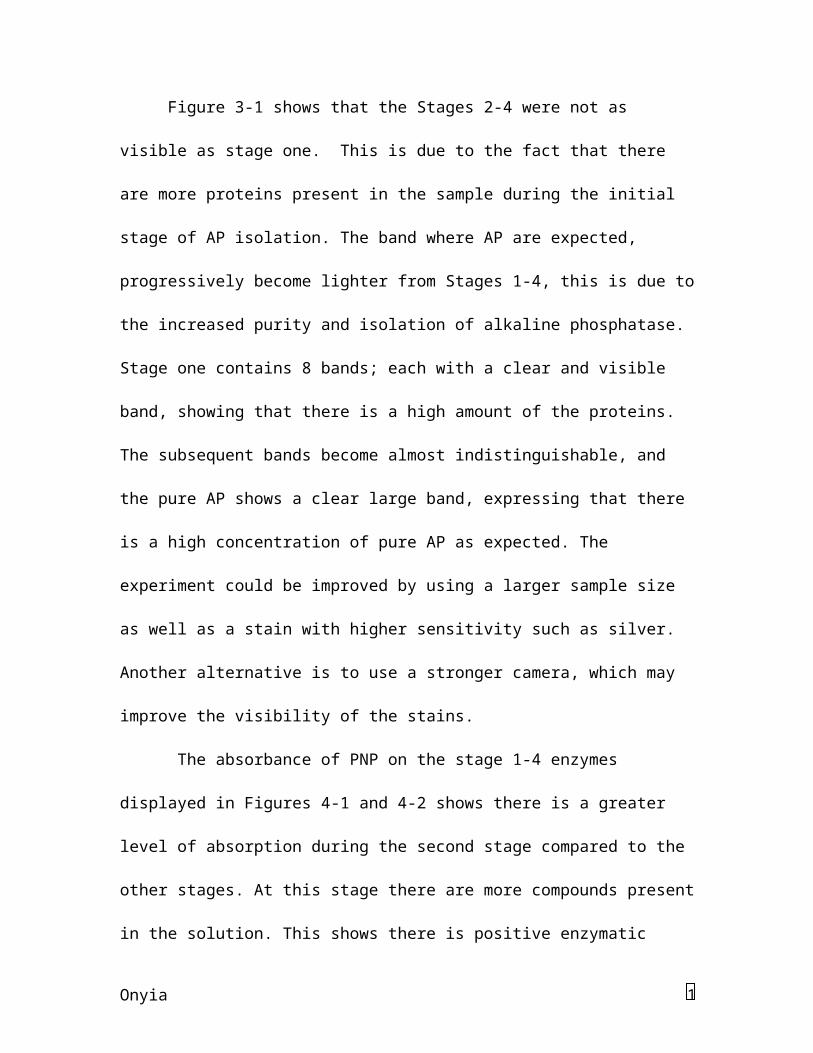
Figure 3-1 shows that the Stages 2-4 were not as visible as stage one. This is
due to the fact that there are more proteins present in the sample during the initial
stage of AP isolation. The band where AP are expected, progressively become lighter
from Stages 1-4, this is due to the increased purity and isolation of alkaline
phosphatase. Stage one contains 8 bands; each with a clear and visible band,
showing that there is a high amount of the proteins. The subsequent bands become
almost indistinguishable, and the pure AP shows a clear large band, expressing that
there is a high concentration of pure AP as expected. The experiment could be
improved by using a larger sample size as well as a stain with higher sensitivity such
as silver. Another alternative is to use a stronger camera, which may improve the
visibility of the stains.
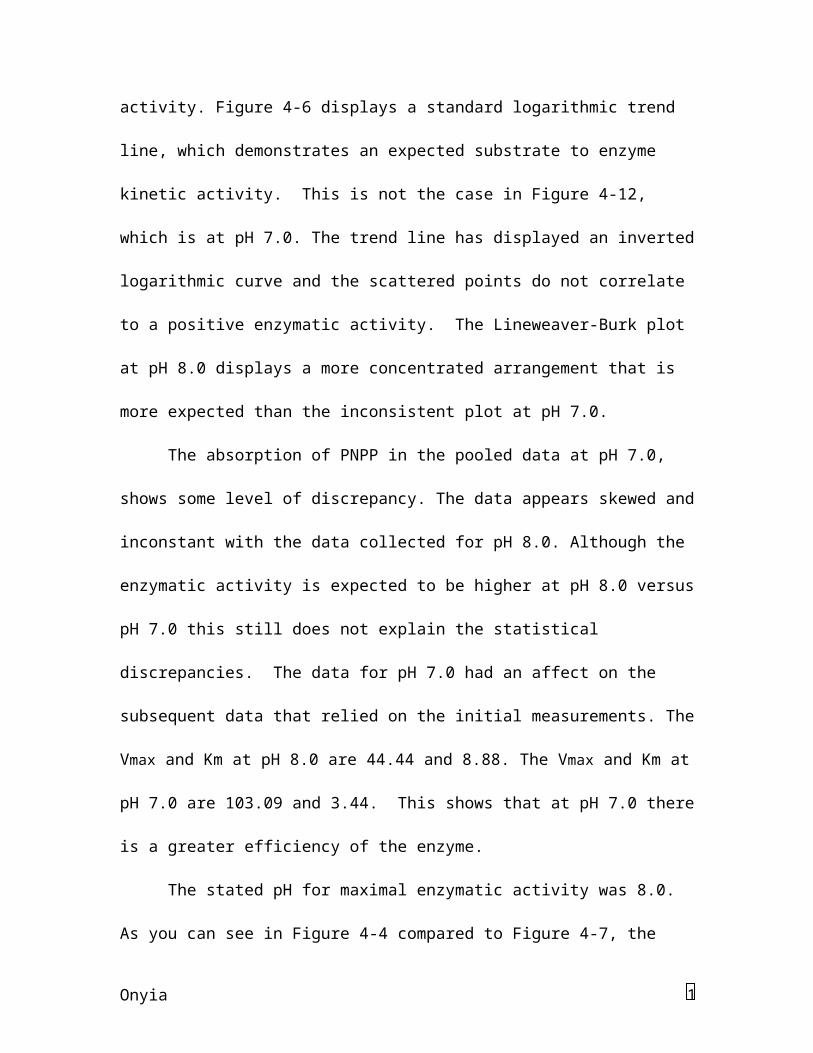
The absorbance of PNP on the stage 1-4 enzymes displayed in Figures 4-1
and 4-2 shows there is a greater level of absorption during the second stage
compared to the other stages. At this stage there are more compounds present in
Onyia
7
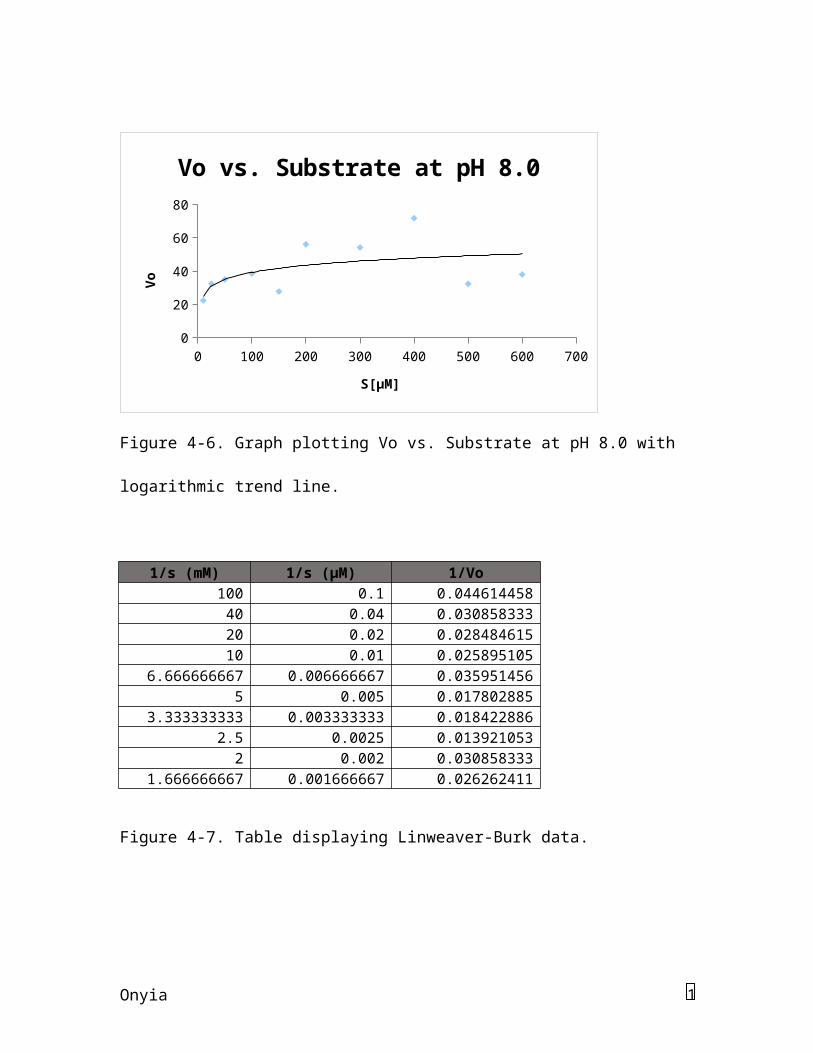
the solution. This shows there is positive enzymatic activity. Figure 4-6 displays a
standard logarithmic trend line, which demonstrates an expected substrate to
enzyme kinetic activity. This is not the case in Figure 4-12, which is at pH 7.0. The
trend line has displayed an inverted logarithmic curve and the scattered points do
not correlate to a positive enzymatic activity. The Lineweaver-Burk plot at pH 8.0
displays a more concentrated arrangement that is more expected than the
inconsistent plot at pH 7.0.
The absorption of PNPP in the pooled data at pH 7.0, shows some level of
discrepancy. The data appears skewed and inconstant with the data collected for pH
8.0. Although the enzymatic activity is expected to be higher at pH 8.0 versus pH 7.0
this still does not explain the statistical discrepancies. The data for pH 7.0 had an
affect on the subsequent data that relied on the initial measurements. The Vmax and
Km at pH 8.0 are 44.44 and 8.88. The Vmax and Km at pH 7.0 are 103.09 and 3.44.
This shows that at pH 7.0 there is a greater efficiency of the enzyme.
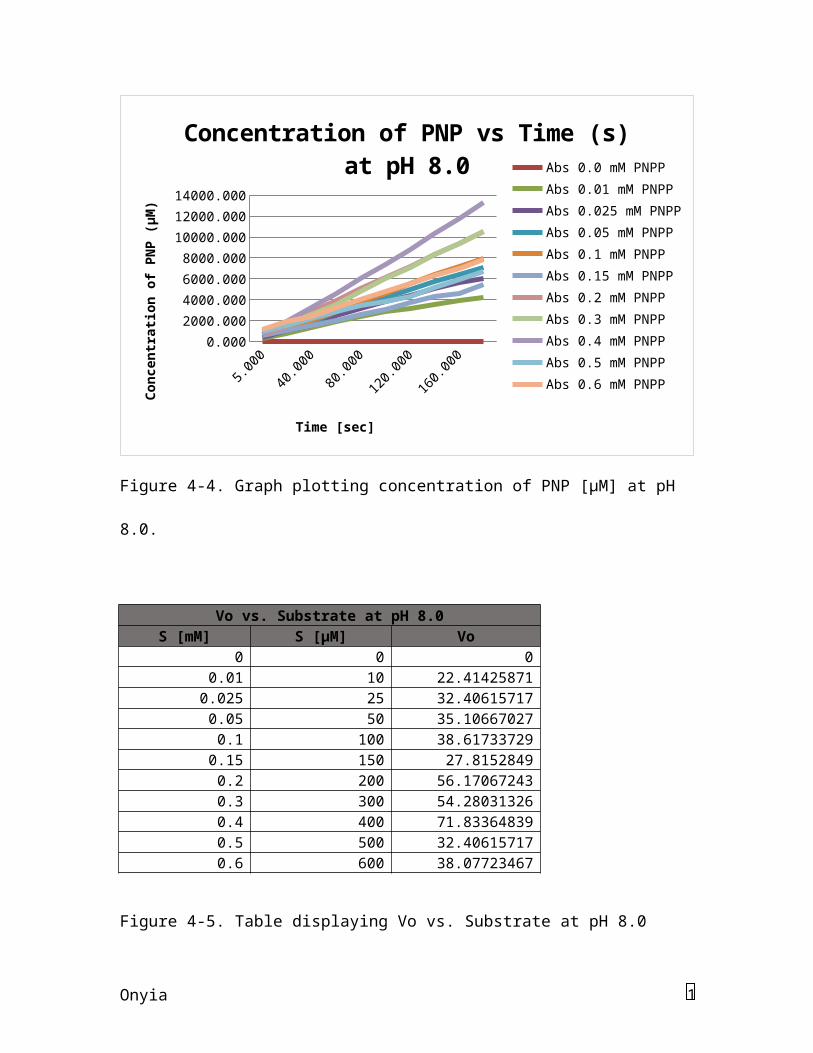
The stated pH for maximal enzymatic activity was 8.0. As you can see in
Figure 4-4 compared to Figure 4-7, the concentration of PNPP is dramatically
higher. This shows there is greater affinity of the enzyme at pH 7.0. The data at pH
7.0 does give an ideal representation of the kinetic activity and catalytic activity of
alkaline phosphatases; this is due to different pools of enzyme stage 4 used in the two
experiments.
Appendix
Onyia
8
Holiday Period
New Year's Day
Memorial Day Procedure0
5001000150020002500
AP Enzyme Stages
AP Enzyme Stages
mL
Figure 1-1
1 3 5 7 9 11 13 15 17 19 21 23 25 27 290
0.2
0.4
0.6
0.8
1
Alkaline Phoshatase Concentration
Test Tube Fractions
Con
cen
trat
ion
Figure 1-2
Onyia
9
Figure 1-3
0 50 100 150 200 2500
0.5
1
1.5
f(x) = 0.00581013157894737 x + 0.0371578947368419R² = 0.985529550106901
BSA Standard Curve
BSA Concentration (mg/ml)
Abs
orba
nce
(59
5 n
m)
Figure 2-1
Onyia
1
Stg-1 enz Stg-2 enz Stg-3 enz Stg-4 enz0
500
1000
Average Protein Con-centration
AP Stages
Con
cen
trat
ion
mg/
mL
Figure 2-2
Figure 3-1
Absorbance of PNP for Stage #1-4 Enzymes
Stage 1 Stage 2 Stage 3 Stage 40.228 0.228 0.25 0.227
0.298 0.278 0.247
0.295 0.402 0.287 0.256
0.29 0.486 0.316 0.278
Onyia
1
0.286 0.59 0.351 0.3
0.281 0.659 0.383 0.321
0.279 0.739 0.415 0.344
0.277 0.846 0.443 0.368
0.276 0.947 0.474 0.393
0.275 1.056 0.502 0.417
0.274 1.141 0.532 0.438
Figure 4-1. Table displaying the absorbance of PNP for Stage # 1-4 Enzymes
0 20 40 60 80 100 120 140 160 180 2000
0.20.40.60.8
11.2
Absorbance of PNP for Stage #1-4 Enzymes
Stage 1Stage 2Stage 3Stage 4
Time (s)
Ab
sorb
ance
(n
m)
Figure 4-2. Graph displaying the absorbance of PNP for stage #1-4 enzymes.
Concentration of PNP [ M] at pH 8.0μTime (secs)
Abs 0.0 mM NPP
Abs 0.01 mM PNPP
Ab 0.025 mM NPP
Abs 0.05mM PNPP
Abs0.1 mM PNPP
Abs0.15 mM PNPP
Abs 0.2 mM PNPP
Abs 0.3 mM PPP
Abs 04 mM PNPP
Abs 0.5 mM PNPP
Abs 0.6 mM PNPP
5
47.25897
21
2835538
75
378.0718
336
45.17958
41
1181.474
48
614.3667
297
661.6257
089
992.4385
633
708.8846
881
992.4385
633
1181.474
48
20 0
803.4026
465
1086.956522
1323.251418
1323.251418
1039.697543
1417.769376
1748.582231
1937.618147
1512.287335
1937.618147
40
47.25897
921
1323.251418
1512.287335
1843.100189
2032.136106
1512.287335
2835.538752
2599.243856
3260.869565
2173.913043
2410.207
94
Onyia
1
60 0
1937.618147
2457.466919
2835.538752
2930.056711
2032.136106
3969.754253
3544.423
44
4584.120983
2882.797732
3260.869565
80
47.25897
921
2410.207
94
3166.351607
3544.423
44
3827.977316
2551.984877
5056.710775
4773.156
9
6001.890359
3497.164461
4064.272212
100 0
2882.797732
3827.977316
4253.308129
4631.379962
3071.833648
6096.408318
6001.890359
7419.659735
3875.236295
4820.415879
120
47.25897
921
3166.351607
4442.344045
5009.451796
5529.300567
3733.459357
7230.623819
7136.105
86
8837.429112
4300.567108
5529.300567
140 0
3591.682
42
5056.710775
5718.336484
6379.962193
4300.567108
8364.839319
8317.580
34
10349.71645
5151.228733
6285.444234
160
47.25897
921
3969.754253
5623.818526
6427.221172
7183.364839
4584.120983
9404.536862
9404.536862
11814.74
48
5907.372401
7041.587902
180
47.25897
921
4206.049149
6049.149338
7088.846881
7939.508507
5482.041588
10491.49338
10491.49338
13279.77316
6663.516068
7844.990548
Figure 4-3. Table displaying concentration of PNP [ M] at pH 8.0μ
5.000
20.000
40.000
60.000
80.000
100.000
120.000
140.000
160.000
180.0000.000
2000.000
4000.000
6000.000
8000.000
10000.000
12000.000
14000.000
Concentration of PNP vs Time (s) at pH 8.0
Abs 0.0 mM PNPPAbs 0.01 mM PNPPAbs 0.025 mM PNPPAbs 0.05 mM PNPPAbs 0.1 mM PNPPAbs 0.15 mM PNPPAbs 0.2 mM PNPPAbs 0.3 mM PNPPAbs 0.4 mM PNPPAbs 0.5 mM PNPPAbs 0.6 mM PNPP
Time [sec]
Con
cen
trat
ion
of P
NP
(M
)μ
Onyia
1
Figure 4-4. Graph plotting concentration of PNP [ M] at pH 8.0.μ
Vo vs. Substrate at pH 8.0S [mM] S [µM] Vo
0 0 00.01 10 22.41425871
0.025 25 32.406157170.05 50 35.10667027
0.1 100 38.617337290.15 150 27.8152849
0.2 200 56.170672430.3 300 54.280313260.4 400 71.833648390.5 500 32.406157170.6 600 38.07723467
Figure 4-5. Table displaying Vo vs. Substrate at pH 8.0
0 100 200 300 400 500 600 7000
1020304050607080
Vo vs. Substrate at pH 8.0
S[µM]
Vo
Figure 4-6. Graph plotting Vo vs. Substrate at pH 8.0 with logarithmic trend line.
1/s (mM) 1/s (µM) 1/Vo100 0.1 0.044614458
40 0.04 0.030858333
Onyia
1
20 0.02 0.02848461510 0.01 0.025895105
6.666666667 0.006666667 0.0359514565 0.005 0.017802885
3.333333333 0.003333333 0.0184228862.5 0.0025 0.013921053
2 0.002 0.0308583331.666666667 0.001666667 0.026262411
Figure 4-7. Table displaying Linweaver-Burk data.
-0.2 -0.15 -0.1 -0.05 0 0.05 0.1 0.15
-0.02
-0.01
0
0.01
0.02
0.03
0.04
0.05
Lineweaver-Burk Plot at pH 8.0
1/s[µM]
1/V
o
Figure 4-8. Graph of Linweaver-Burk plot at pH 8.0 with trend line.
Concentration of PNP [ M] at pH 7.0μ
Time
(secs)
0.0 mM PNPP
0.01 mM PNPP
0.025 mM PNPP
0.05 mM PNPP
0.1 mM
P
0.15 mM PNPP
0.2 mMPNPP
0.3 mM PNPP
0.4 M PNPP
0.5 mM PNPP
0.6 mM PNPP
5.000
0.000
785.340
523.560
8115.183
7329.843
8115.183
1047.120
785.340
785.340
1832.461
1308.901
20.000
0.000
1832.461
1570.681
13350.78
5
15183.24
6
17801.04
72356.021
1570.681
1570.681
2879.581
2094.241
Onyia
1
40.000
261.78
03141.361
2879.581
21204.18
8
29057.59
2
29319.37
23664.921
2879.581
3141.361
4188.482
4188.482
60.000
0.000
4188.482
3926.702
28272.25
1
40575.91
6
40314.13
64188.482
4188.482
4712.042
6020.942
5497.382
80.000
0.000
5497.382
5235.602
35078.53
4
51570.68
1
50785.34
05235.602
5759.162
6020.942
7853.403
6806.283
100.000
0.000
7591.623
7329.843
41361.25
7
61780.10
5
62041.88
56544.503
7329.843
7329.843
8900.524
8376.963
120.000
0.000
8900.524
8638.743
47120.41
9
71204.18
8
69371.72
87591.623
8900.524
8900.524
10471.20
49947.644
140.000
0.000
10209.42
49947.644
52879.58
1
79842.93
2
78795.81
28900.524
10732.98
4
10471.20
4
12041.88
5
11518.32
5160.000
0.000
11518.32
5
11256.54
5
57853.40
3
88481.67
5
87696.33
5
10209.42
4
12303.66
5
11518.32
5
13612.56
5
13089.00
5180.000
0.000
11780.10
5
12565.44
5
62827.22
5
96858.63
9
96073.29
8
11256.54
5
13612.56
5
12827.22
5
15183.24
6
14921.46
6
Figure 4-9. Table displaying concentration of PNP [ M] at pH 7.0.μ
Time
(secs)
5 20 40 60 80 100 120 140 160 1800
20000400006000080000
100000120000
Concentration of PNP vs Time (s) at pH 7.0 Abs 0.0 mM PNPP
Abs 0.01 mM PNPPAbs 0.025 mM PNPPAbs 0.05 mM PNPPAbs 0.1 mM PNPPAbs 0.15 mM PNPPAbs 0.2 mM PNPPAbs 0.3 mM PNPPAbs 0.4 mM PNPPAbs 0.5 mM PNPPAbs 0.6 mM PNPP
Time [sec]
Con
cen
trat
ion
of P
NP
(M
)μ
Onyia
1
Figure 4-10. Graph plotting concentration of PNP [ M] at pH 7.0.μ
Vo vs. Substrate at pH 8.0S [mM] S [µM] Vo
0 0 00.01 10 62.82722513
0.025 25 68.810770380.05 50 312.6402393
0.1 100 511.59311890.15 150 502.617801
0.2 200 58.339566190.3 300 73.298429320.4 400 68.810770380.5 500 76.290201940.6 600 77.78608826
Figure 4-11. Table displaying Vo vs. Substrate at pH 7.0
0 100 200 300 400 500 600 7000
100
200
300
400
500
600
Vo vs. Substrate at pH 7.0
S[µM]
Vo
Figure 4-12. Graph plotting Vo vs. Substrate at pH 8.0 with logarithmic trend line.
1/s (mM) 1/s (µM) 1/Vo100 0.1 0.015916667
Onyia
1
40 0.04 0.01453260920 0.02 0.00319856510 0.01 0.001954678
6.666666667 0.006666667 0.0019895835 0.005 0.017141026
3.333333333 0.003333333 0.0136428572.5 0.0025 0.014532609
2 0.002 0.0131078431.666666667 0.001666667 0.012855769
Figure 4-13. Table displaying Linweaver-Burk data.
-0.2 -0.15 -0.1 -0.05 0 0.05 0.1 0.15
-0.02
-0.015
-0.01
-0.005
0
0.005
0.01
0.015
0.02
Lineweaver-Burk Plot at pH 7.0
1/s[µM]
1/V
o
Figure 4-14. Graph of Linweaver-Burk plot at pH 8.0 with trend line.
Reference
1. Braga M, Gianotti L, Gentilini O, Parisi V, Salis C, DiCarlo V. Early postopera-
tive enteral nutrition improves gut oxygenation and reduces costs compared with
total parenteral nutrition. Crit Care Med 29: 242–248, 2001.
Onyia
1
2. Bates J, Akerlund J, Mittge E, Guillemin K. Intestinal alkaline phosphatase detox-
ifies lipopolysaccharide and prevents inflammation in zebrafish in response to gut
microbiota. Cell Host Microbe 2: 371–382, 2007.
3. Ninfa, Alexander J., David P. Ballou, and Marilee Benore. Parsons. Fundamental
Laboratory Approaches for Biochemistry and Biotechnology: Alexander J. Ninfa,
David P. Ballou, Marilee Benore. Hoboken, NJ: Wiley, 2010. Print.
4. Cantor, C. R., & P. R. Schimmel. (1980). Biophysical Chemistry, Part 2:
Techniques for the study of biological structure and function. W. H. Freeman
(San Francisco).
5. Domon, B, & Aebersold R. (2006). Mass Spectrometry and Protein Analysis.
Science 312:212-7
6. Skoog, D.A., West D. M., & Holler F. J. (1996). Fundamentals of Analytical
Chemistry, 7th edition, Saunders College Publishing, NY.
7. Hemes, B.D., & Rickwood, D. (1990). Gel electrophoresis of proteins. Second
Edition. IRL Press, Oxford, UK.
8. Osborn, M., Weber, K. (1969). The Reliability of Molecular Weight
Determinations by Dodecyl Sulfate-Polyacrylamide Gel Electrophoresis.
Journal of Biological Chemistry. 244:4406-4412.
Onyia
1
9. Shapiro, A.L., Vineula, E., & Maizel, J.V. (1967). Molecular weight estimation of
polypeptide chains by electrophoresis in SDS-polyacrylamide gels. Biochem.
Biophys. Res. Commun. 28:815-20
10. Cook, P.F., & Cleland, W. W. (2007). Enzyme Kinetics and Mechanism, Garland
Science, New York.
11. Cornish-Bowden, A. (1995a). Fundamentals of Enzyme Kinetics, Portland
Press, Ltd. London.
12. Cornish-Bowden, A. (1995b). Analysis of Enzyme Kinetic Data, Oxford
University Press. Oxford.
13. Segel, I. H. (1975). Enzyme Kinetics, Behavior and Analysis of Rapid
Euilibrium and Stead-State Enzyme Systems. John Wiley & Sons, Inc. New
York.
Onyia