Embed Size (px)
Citation preview
ProteinChip® SELDI SystemApplications GuideVolume 1
Page i
Bio-Rad Laboratories, Inc. Notice to Purchaser: Limited License
Surface Enhanced Laser Desorption/Ionization (“SELDI”) is a patented process. To use the SELDIprocess an end user must obtain a two-part license, including an up-front fee component and arunning-royalty component, under U.S. Patent 5,719,060 or its foreign counterparts, from Bio-RadLaboratories, Inc. (“Bio-Rad”). The purchase price of this ProteinChip® SELDI product includeslimited, nontransferable rights under the running-royalty component to use the specific amount ofproduct contained herein only to practice SELDI and related processes described in said patents forthe research and development activities of the purchaser when this product is used in conjunctionwith a Bio-Rad ProteinChip
®
SELDI system (the “Reader”) whose use is covered by the up-front feecomponent. The rights under the up-front fee component may be purchased only from Bio-Rad orone of its authorized distributors as part of the purchase of a Reader. No rights of use are grantedherein in the field of clinical diagnostics. Further information on licenses to practice the SELDI processmay be obtained by contacting the Legal Department at Bio-Rad Laboratories, Inc., 1000 Alfred NobelDrive, Hercules, California 94547.
Adobe, Adobe Illustrator, and PostScript are trademarks of Adobe Systems, Inc. Biomek is a trademarkof Beckman Coulter, Inc. Excel and Windows are trademarks of Microsoft Corporation. MicroMix is atrademark of Diagnostic Products Corporation. Triton is a trademark of Union Carbide. Tween is atrademark of ICI Americas, Inc.
Bio-Rad Laboratories, Inc.1000 Alfred Nobel DriveHercules, CA 94547Toll-free in USA: +1 800-4-BIORADe-mail: [email protected] web: www.bio-rad.com

Page ii
ProteinChip Applications Guide, Volume 1: Introductory Guide
Page iii
Table of Contents
Chapter 1: About This Guide 1
Introduction 3
Chapter 2: Principles of SELDI 5
Introduction to SELDI Technology 7
The Four Basic Steps to SELDI 7
Chapter 3: ProteinChip SELDI Systems 13
ProteinChip SELDI SystemComponents 15
Chapter 4: ProteinChip Arrays 17
Introduction 19
General Notes on Using Arrays 19
Chemicals That Can Interfere With Protein Detection 20
Choosing Arrays 22
Strong Anion ExchangeProteinChip
®
Array 24
Weak Cation ExchangeProteinChip Array 26
Immobilized Metal Affinity Capture (IMAC) ProteinChip Array 27
Reversed- Phase or Hydrophobic ProteinChip Arrays 29
Surface-Enhanced Neat Desorption (SEND) ProteinChip Array 31
Normal-Phase ProteinChip Array 33
Reactive Surface ProteinChip Arrays 34
Chapter 5: ProteinChip SELDI System Reagents and Accessories 39
Energy Absorbing Molecules (EAMs) 41
Protein and Peptide Standards 45
The ProteinChip Bioprocessor 47
Chapter 6: Software Used with the ProteinChip SELDI System 53
Introduction 55
ProteinChip Data ManagerSoftware 55
ProteinChip Pattern AnalysisSoftware 57
Chapter 7: Introduction to Protein Biochemistry 59
Protein Structure and Function 61
Methods for Studying Proteins 63
Proteins That Fly or Don’t Fly 66
Page iv
ProteinChip Applications Guide, Volume 1: Introductory Guide
Chapter 8: Getting Started 67
Calibration 69
Normalization 70
Quantitation of Peaks in SELDI 70
Calculating the Coefficient of Variance (CV) 71
Producing High-Resolution Spectral Images 73
Transferring ProteinChip SELDI Data to Excel 74
Appendix A: References and Additional Resources 75
Appendix B: Amino Acid Table 77
Index 79

Page 1
Chapter 1: About This Guide
Introduction 3

Page 2
About This Guide
ProteinChip Applications Guide, Volume 1: Introductory Guide
Page 3
Introduction
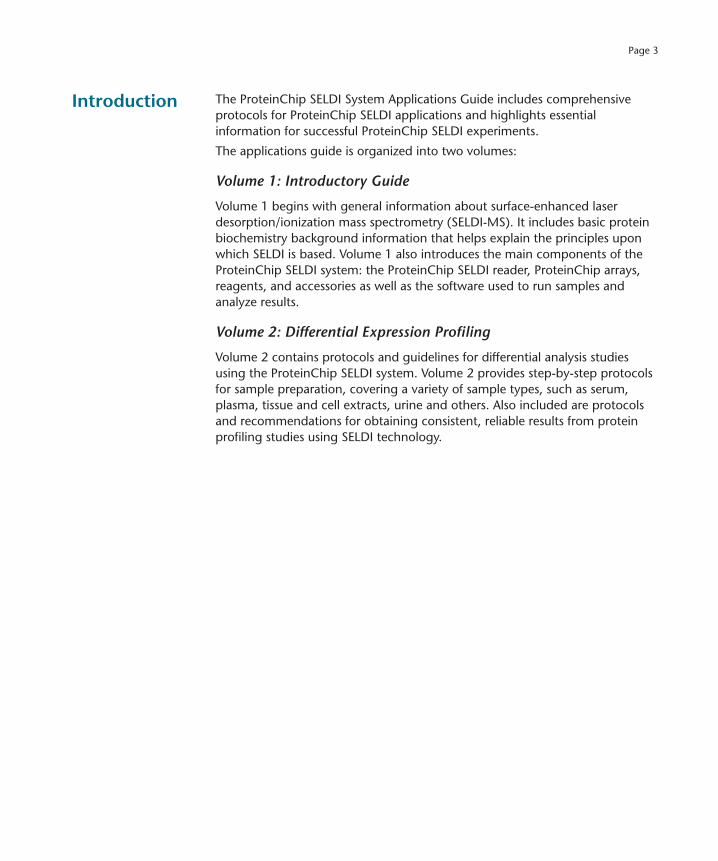
The ProteinChip SELDI System Applications Guide includes comprehensive protocols for ProteinChip SELDI applications and highlights essential information for successful ProteinChip SELDI experiments.
The applications guide is organized into two volumes:
Volume 1: Introductory Guide
Volume 1 begins with general information about surface-enhanced laser desorption/ionization mass spectrometry (SELDI-MS). It includes basic protein biochemistry background information that helps explain the principles upon which SELDI is based. Volume 1 also introduces the main components of the ProteinChip SELDI system: the ProteinChip SELDI reader, ProteinChip arrays, reagents, and accessories as well as the software used to run samples and analyze results.
Volume 2: Differential Expression Profiling
Volume 2 contains protocols and guidelines for differential analysis studies using the ProteinChip SELDI system. Volume 2 provides step-by-step protocols for sample preparation, covering a variety of sample types, such as serum, plasma, tissue and cell extracts, urine and others. Also included are protocols and recommendations for obtaining consistent, reliable results from protein profiling studies using SELDI technology.

Page 4
About This Guide
ProteinChip Applications Guide, Volume 1: Introductory Guide

Page 5
Chapter 2: Principles of SELDI
Introduction to SELDI Technology 7
The Four Basic Steps to SELDI 7
1. Choosing ProteinChip® Arrays 9
2. Sample Application to ProteinChip Arrays 10
3. Washing ProteinChip Arrays and Applying Energy Absorbing Molecules (EAMs) 10
4. Desorption, Ionization, and Analysis in the ProteinChip SELDI Reader 10

Page 6
Principles of SELDI
ProteinChip Applications Guide, Volume 1: Introductory Guide
Page 7
Introduction to SELDI Technology
Surface-enhanced laser desorption/ionization (SELDI) is a proprietary technique patented by Bio-Rad Laboratories, Inc.
*
The process is a rapid technique for the analysis of peptides, proteins, and other molecules. The technique relies on time-of-flight mass spectrometry (TDF-MS) for the accurate measurement of the mass-to-charge ratio (m/z) of peptides and proteins. Originally described in 1993 (Hutchens and Yip 1993), SELDI is a technique for the analysis of proteins in very small sample volumes, and its methodology has been refined and developed for nearly 15 years.
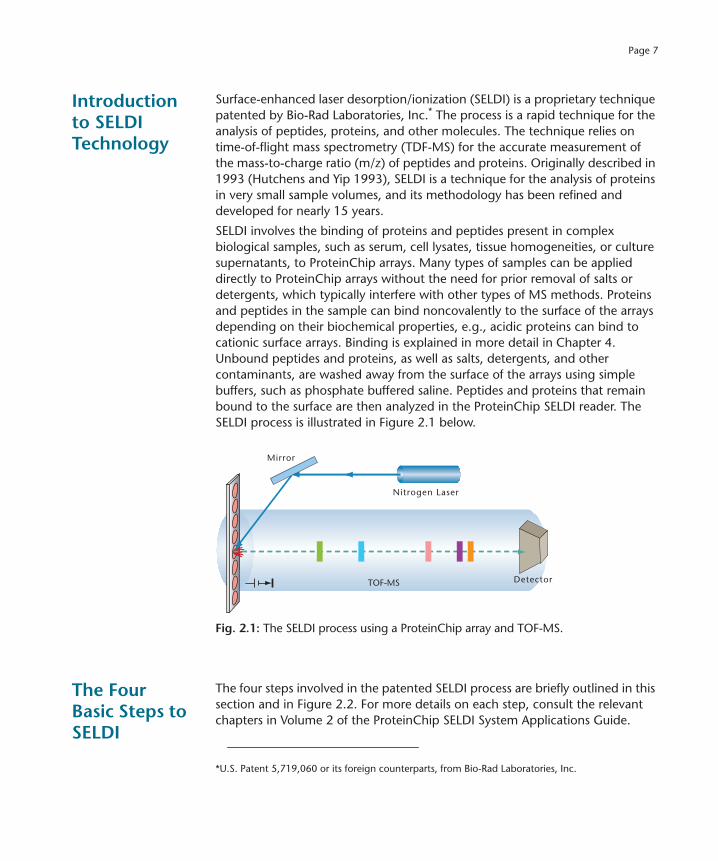
SELDI involves the binding of proteins and peptides present in complex biological samples, such as serum, cell lysates, tissue homogeneities, or culture supernatants, to ProteinChip arrays. Many types of samples can be applied directly to ProteinChip arrays without the need for prior removal of salts or detergents, which typically interfere with other types of MS methods. Proteins and peptides in the sample can bind noncovalently to the surface of the arrays depending on their biochemical properties, e.g., acidic proteins can bind to cationic surface arrays. Binding is explained in more detail in Chapter 4. Unbound peptides and proteins, as well as salts, detergents, and other contaminants, are washed away from the surface of the arrays using simple buffers, such as phosphate buffered saline. Peptides and proteins that remain bound to the surface are then analyzed in the ProteinChip SELDI reader. The SELDI process is illustrated in Figure 2.1 below.
Fig. 2.1:
The SELDI process using a ProteinChip array and TOF-MS.
The Four Basic Steps to SELDI
The four steps involved in the patented SELDI process are briefly outlined in this section and in Figure 2.2. For more details on each step, consult the relevant chapters in Volume 2 of the ProteinChip SELDI System Applications Guide.
*U.S. Patent 5,719,060 or its foreign counterparts, from Bio-Rad Laboratories, Inc.
Nitrogen Laser
Mirror
DetectorTOF-MS
Page 8
Principles of SELDI
ProteinChip Applications Guide, Volume 1: Introductory Guide
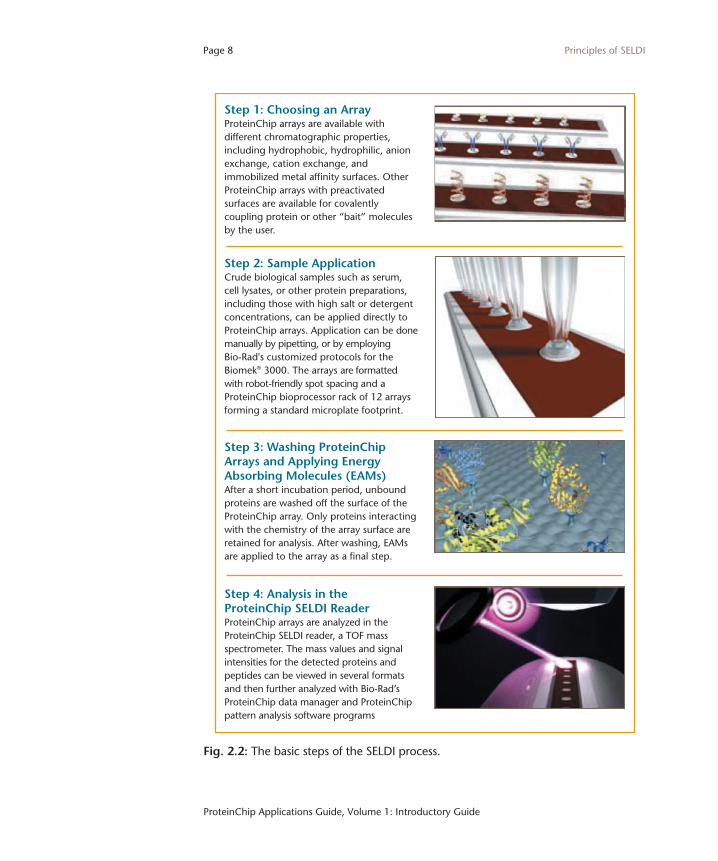
Fig. 2.2:
The basic steps of the SELDI process.
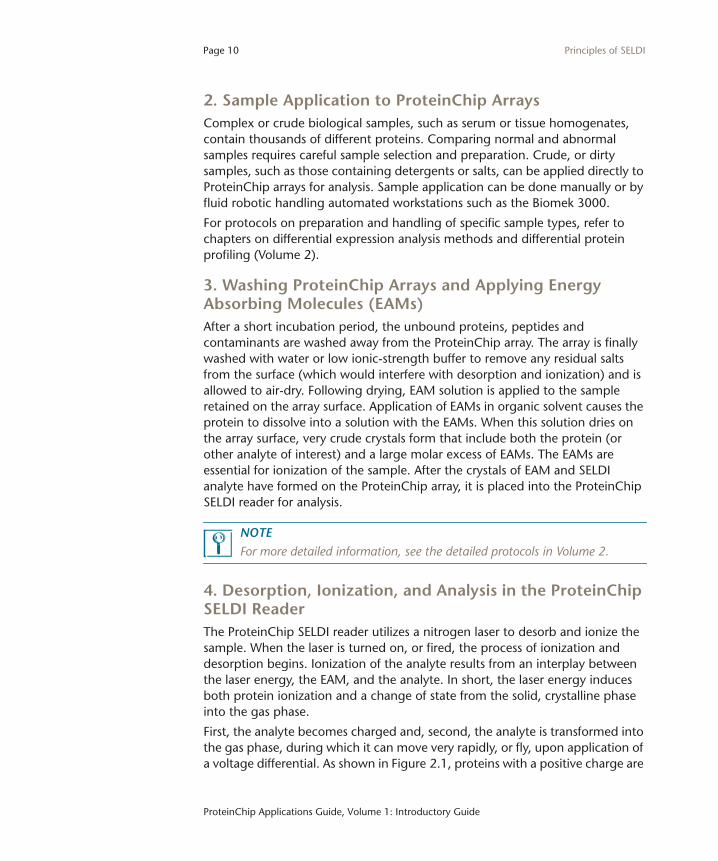
Step 1: Choosing an ArrayProteinChip arrays are available with different chromatographic properties, including hydrophobic, hydrophilic, anion exchange, cation exchange, and immobilized metal affinity surfaces. Other ProteinChip arrays with preactivated surfaces are available for covalently coupling protein or other “bait” molecules by the user.
Step 2: Sample ApplicationCrude biological samples such as serum, cell lysates, or other protein preparations, including those with high salt or detergent concentrations, can be applied directly to ProteinChip arrays. Application can be done manually by pipetting, or by employing Bio-Rad's customized protocols for the Biomek® 3000. The arrays are formatted with robot-friendly spot spacing and a ProteinChip bioprocessor rack of 12 arrays forming a standard microplate footprint.
Step 3: Washing ProteinChip Arrays and Applying EnergyAbsorbing Molecules (EAMs)After a short incubation period, unbound proteins are washed off the surface of the ProteinChip array. Only proteins interacting with the chemistry of the array surface are retained for analysis. After washing, EAMs are applied to the array as a final step.
Step 4: Analysis in the ProteinChip SELDI ReaderProteinChip arrays are analyzed in the ProteinChip SELDI reader, a TOF mass spectrometer. The mass values and signal intensities for the detected proteins and peptides can be viewed in several formats and then further analyzed with Bio-Rad’s ProteinChip data manager and ProteinChip pattern analysis software programs
Page 9
1. Choosing ProteinChip® Arrays
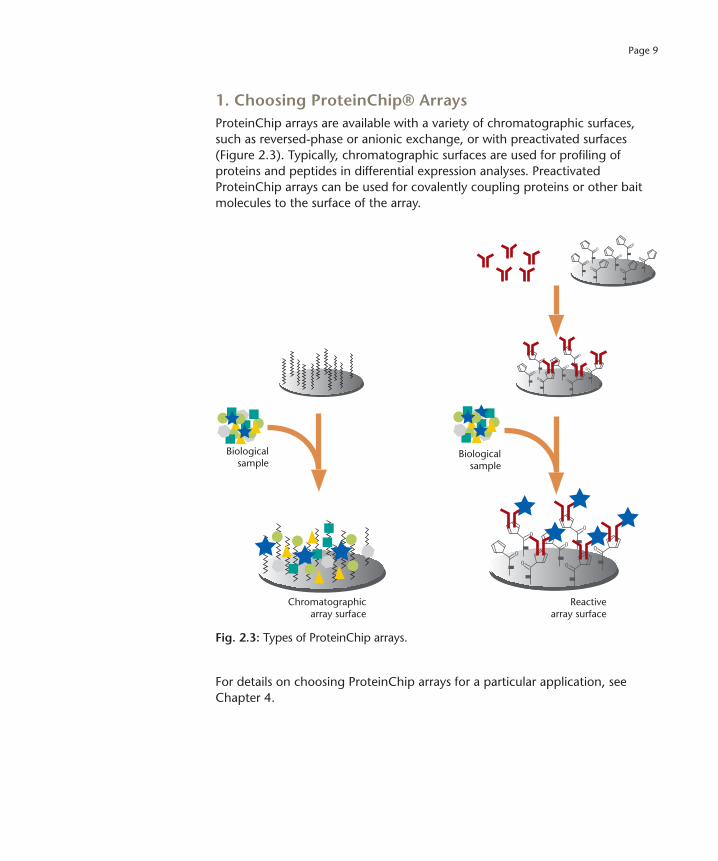
ProteinChip arrays are available with a variety of chromatographic surfaces, such as reversed-phase or anionic exchange, or with preactivated surfaces (Figure 2.3). Typically, chromatographic surfaces are used for profiling of proteins and peptides in differential expression analyses. Preactivated ProteinChip arrays can be used for covalently coupling proteins or other bait molecules to the surface of the array.
Fig. 2.3:
Types of ProteinChip arrays.
For details on choosing ProteinChip arrays for a particular application, see Chapter 4.
Biologicalsample
Biologicalsample
Chromatographicarray surface
Reactivearray surface
Page 10
Principles of SELDI
ProteinChip Applications Guide, Volume 1: Introductory Guide
2. Sample Application to ProteinChip Arrays
Complex or crude biological samples, such as serum or tissue homogenates, contain thousands of different proteins. Comparing normal and abnormal samples requires careful sample selection and preparation. Crude, or dirty samples, such as those containing detergents or salts, can be applied directly to ProteinChip arrays for analysis. Sample application can be done manually or by fluid robotic handling automated workstations such as the Biomek 3000.
For protocols on preparation and handling of specific sample types, refer to chapters on differential expression analysis methods and differential protein profiling (Volume 2).
3. Washing ProteinChip Arrays and Applying Energy Absorbing Molecules (EAMs)
After a short incubation period, the unbound proteins, peptides and contaminants are washed away from the ProteinChip array. The array is finally washed with water or low ionic-strength buffer to remove any residual salts from the surface (which would interfere with desorption and ionization) and is allowed to air-dry. Following drying, EAM solution is applied to the sample retained on the array surface. Application of EAMs in organic solvent causes the protein to dissolve into a solution with the EAMs. When this solution dries on the array surface, very crude crystals form that include both the protein (or other analyte of interest) and a large molar excess of EAMs. The EAMs are essential for ionization of the sample. After the crystals of EAM and SELDI analyte have formed on the ProteinChip array, it is placed into the ProteinChip SELDI reader for analysis.
NOTE
For more detailed information, see the detailed protocols in Volume 2.
4. Desorption, Ionization, and Analysis in the ProteinChip SELDI Reader
The ProteinChip SELDI reader utilizes a nitrogen laser to desorb and ionize the sample. When the laser is turned on, or fired, the process of ionization and desorption begins. Ionization of the analyte results from an interplay between the laser energy, the EAM, and the analyte. In short, the laser energy induces both protein ionization and a change of state from the solid, crystalline phase into the gas phase.
First, the analyte becomes charged and, second, the analyte is transformed into the gas phase, during which it can move very rapidly, or fly, upon application of a voltage differential. As shown in Figure 2.1, proteins with a positive charge are
Page 11
induced to fly away from a metal array that also has a positive charge. The voltage differential applies the same kinetic energy to all of the analytes in the sample, thus resulting in flight times that depend upon the mass (KE = 1/2 mv
2
; where KE = kinetic energy, m = mass, v = velocity). The ProteinChip SELDI reader records the TOF of the analyte; from this measurement, a highly accurate and precise mass is derived. As the analyte-EAM mixture is equally distributed across the spot area, signal intensities correspond to the concentration of peptides and proteins, enabling the user to quantify the amount of the single components in the sample.
For more information on ProteinChip array preparation, please refer to Chapter 4, ProteinChip Arrays, in this volume.

Page 12
Principles of SELDI
ProteinChip Applications Guide, Volume 1: Introductory Guide

Page 13
Chapter 3: ProteinChip SELDI Systems
ProteinChip SELDI System Components 15
The ProteinChip SELDI Reader, Enterprise and Personal Models 15
ProteinChip Data Manager 15
ProteinChip Arrays 15

Page 14
ProteinChip SELDI Systems
ProteinChip Applications Guide, Volume 1: Introductory Guide
Page 15
ProteinChip SELDI SystemComponents
The ProteinChip SELDI system, has three components, comprising a ProteinChip SELDI reader, ProteinChip data manager, and ProteinChip arrays and consumables. The ProteinChip SELDI reader detects and accurately calculates the mass of small molecules or peptides from 500 Da up to proteins of more than 150 kD, based on measured TOF. The reader is compact enough to fit onto almost any lab bench, allowing researchers direct access to precision mass analysis of important peptides and proteins from complex biological samples.
The ProteinChip SELDI Reader, Enterprise and Personal Models
The ProteinChip SELDI reader is a laser desorption/ionization TOF mass spectrometer that uses state-of-the-art ion optic and laser optic technology. The raster scanning laser and optics maximize ion extraction efficiency over the greatest possible sample area on the ProteinChip array spot, and thus increases analytical sensitivity and reproducibility. The reader's ion optics provide precise and accurate molecular weight (MW) determination with excellent mass sensitivity. For more information about the ProteinChip SELDI reader, see the ProteinChip SELDI System: Reader Guide.
ProteinChip Data Manager
The ProteinChip SELDI system, incorporates ProteinChip data manager software, which controls all aspects of the ProteinChip SELDI system, data collection and analysis from ProteinChip Arrays. The program uses a Windows interface and contains numerous features, including:
• Automated reading of ProteinChip arrays
• Multiple spectrum comparison for differential protein display and biomarker discovery
• Multiple formats for viewing data
Rapid comparison between data sets is also readily achieved — a feature particularly useful for differential expression profiling. In addition, the original raw data remains part of the data file independent of any analytical and visual changes, allowing retrieval of the original data at your convenience. For more information see the ProteinChip data manager software manual.
ProteinChip Arrays
Bio-Rad’s ProteinChip arrays distinguish SELDI technology from other mass spectrometry-based analytical systems. For more information about ProteinChip arrays, see Chapter 4, ProteinChip Arrays.

Page 16
ProteinChip SELDI Systems
ProteinChip Applications Guide, Volume 1: Introductory Guide
Page 17
Chapter 4: ProteinChip Arrays
Introduction 19
General Notes on Using Arrays 19
Chemicals That Can Interfere With Protein Detection 20
Ionic Detergents 20
High Salt Concentrations 21
Polyethelene Glycol (PEG) 21
Diethyl Pyrocarbonate (DEPC) 21
Dithiothreitol (DTT) 21
Choosing Arrays 22
Strong Anion Exchange ProteinChip
®
Array 24
Notes for Using Strong Anion Exchange Arrays 25
Recommended Binding and/or Wash Buffers 25
Weak Cation Exchange ProteinChip Array 26
Notes for Using Weak Cation Exchange Arrays 26
Recommended Binding and/or Wash Buffers 27
Immobilized Metal Affinity Capture (IMAC) ProteinChip Array 27
Notes for Using the Immobilized Metal Affinity Array 28
Recommended Binding and/or Wash Buffers 28
Reversed- Phase or Hydrophobic ProteinChip Arrays 29
Notes for Using Reversed-Phase Arrays 30
Recommended Binding and/or Wash Buffers 31
Page 18
ProteinChip Arrays
ProteinChip Applications Guide, Volume 1: Introductory Guide
Surface-Enhanced Neat Desorption (SEND) ProteinChip Array 31
Notes for Using the ProteinChip SEND ID Array 32
Normal-Phase ProteinChip Array 33
Notes for Using a Normal-Phase Array 33
Recommended Binding Buffers 33
Reactive Surface ProteinChip Arrays 34
Binding Capacity of Reactive Surface ProteinChip Arrays 34
Notes for Using Reactive Surface Arrays 35
Recommended Buffers 36

Page 19
Introduction
ProteinChip arrays have surface chemistries ranging from classic chromatographic moieties to protein and ligand-based affinity capture surfaces. Descriptions of the specific array types and their uses are included in this chapter to help you understand the principles behind the various types of capture. Protocols for use of these arrays are included with each array shipment, and details for their use in specific applications, such as differential expression profiling.
The ProteinChip array consists of a metal base with 8 chemically active sites, or spots, where the actual sample binding occurs. Due to the fact that molecules bind via specific chemical interactions with the surface, it is often possible to learn about a protein's chemical properties by using ProteinChip arrays. For well-studied molecules whose chemical nature is known, the appropriate ProteinChip array, as well as binding and wash buffers, can be chosen quite readily for optimal capture.
ProteinChip arrays are labeled A–H. The A–H format is designed to meet Society for Biomolecular Sciences (SBS) standard 96-well plate formats. Twelve ProteinChip arrays can be aligned, closely packed in a ProteinChip bioprocessor so that the active chemistry spots conform to the SBS standard plate footprint, thus making them amenable to use with robotics systems and multichannel pipetting devices.
General Notes on Using Arrays
• Avoid touching the spot surface and surrounding coating of the ProteinChip array
• Always use powder-free gloves for handling. Nitrile gloves are recommended because latex can cause contamination on the spot that can mask detection of sample proteins
• The active spots of most types of ProteinChip arrays should be kept moist during the entire binding and capture procedure. With the exception of H4 and NP20 ProteinChip arrays (and only in the case of analysis of pure protein fractions), the spots should be allowed to dry only after addition of energy absorbing molecule (EAM), when the array is ready to be analyzed in the ProteinChip SELDI reader
• Suggested assay conditions are provided with each array, but some changes may be necessary to get the best performance with your samples and your specific application
• Additional information on ProteinChip arrays can be found in the individual product inserts

Page 20
ProteinChip Arrays
ProteinChip Applications Guide, Volume 1: Introductory Guide
As with any technique, no single protocol can be optimized for every biological sample. The ProteinChip SELDI reader can be used to analyze a diverse range of sample types, including tissue homogenates, cultured cell lysates, membrane fractions, serum, cerebrospinal fluid, urine, and extracted proteins and peptides. Therefore, experiments will have to be optimized in order to generate the best data. More detailed protocols for specific applications can be found in the subsequent volume of this applications guide.
Chemicals That Can Interfere With Protein Detection
One of the great advantages of ProteinChip SELDI technology is that samples can be washed quite extensively after application on the array surface. Some chemicals that are commonly used in biological assays may nonetheless interfere with a typical ProteinChip array experiment if they are not washed off the array surface prior to adding EAM. For instance, the chemicals listed below may interfere with cocrystallization of the retained proteins with the EAM or suppress sample ionization during mass analysis in the ProteinChip SELDI reader.
Other chemicals may interfere with binding to the surface of the ProteinChip array, depending on the specific surface chemistry being used. For example, salts may reduce binding to ionic surfaces but can increase binding through hydrophobic interactions. Therefore, it is very important to read the guidelines for each specific array type to aid in choosing buffers and wash conditions. Furthermore, a short water (or 5 mM HEPES) wash must be performed in most ProteinChip array experiments prior to EAM addition.
Ionic Detergents
In many cases, ionic detergents will suppress ionization of a protein sample, thus preventing their analysis by mass spectrometry. In particular, proteins that have been boiled in sodium dodecyl sulfate (SDS) may not be easily detected. If detergents are necessary for sample extraction or sample solubilization, nonionic detergents, such as Triton X-100, NP40, n-Octyl-D-glucopyranoside (OGP), Tween 20, or dodecyl maltoside may be present in final concentrations up to 1%.
NOTE
SDS can sometimes be removed very effectively from samples boiled in SDS by drying the sample onto the surface of the ProteinChip array and washing with cold 80% acetone. Dilution of samples into 1% Triton X-100 or another nonionic detergent has also been effective in
some cases.
Page 21
High Salt Concentrations
Various salts, including buffers, may interfere with applications on certain arrays, as high concentrations of salts may alter binding properties. In particular, salts may interfere with binding to ionic surface ProteinChip arrays, including ProteinChip Q10 and CM10 arrays. Because the ProteinChip CM10 array is a weak cation exchanger, it is more sensitive to high salt concentrations than ProteinChip Q10 array. By contrast, salts can actually increase binding to hydrophobic-surface arrays, such as ProteinChip H4 and H50 arrays.
Polyethelene Glycol (PEG)
PEG is difficult to wash off and gives a strong, very broad peak. Glycerol also interferes with detection of analytes. Both should be highly diluted in binding buffer before application to an array to allow their removal in the washing step.
Diethyl Pyrocarbonate (DEPC)
DEPC is often used for RNA preparation and analysis, but should be avoided for ProteinChip SELDI experiments. If DEPC has been added to a solution that must be used, be sure that it has been autoclaved to remove residual DEPC.
Dithiothreitol (DTT)
DTT is commonly used to reduce disulfide bonds in proteins, but residual DTT interferes with analysis when using ProteinChip SELDI technology. Weak (millimolar) solutions of
β
-mercaptoethanol may often be used in place of DTT for disulfide bond reduction.

Page 22
ProteinChip Arrays
ProteinChip Applications Guide, Volume 1: Introductory Guide
Choosing Arrays
Table 4.1: Properties and uses of ProteinChip arrays.
General Description
ProteinChip Array
Chemistry Application
Strong Anion Exchange
Used to analyze molecules that have negative charges on the surface
Q10 Active spots contain cationic, quaternary ammonium groups that interact with the negative charges on the surface of target proteins, e.g., aspartic acid or glutamic acid
• Selective analysis of proteins with low isoelectric points (pIs)
• Biomarker discov-ery
Weak Cation Exchange
Used to analyze molecules that have a positive charge on the surface
CM10 Active spots contain weak anionic carboxylate groups that interact with the positive charges on the surface of the analyte, e.g., lysine, arginine, or histidine.
• Selective analysis of proteins with high pIs
• Biomarker discov-ery
Immobilized Metal Affinity Capture
Used to capture molecules that bind polyvalent metal ions such as nickel, copper, zinc, iron and gallium
IMAC30 Active spots contain nitrilotriacetic acid (NTA) groups on the surface that chelate metal ions. Proteins applied to the array surface may bind to the chelated metal ion through histidine, tryptophan, cysteine, and phosphorylated amino acids.
• Analysis of metal-binding proteins
• Analysis of phos-phorylated proteins
• Analysis of histi-dine (His)-tagged proteins
• Biomarker discovery
Page 23
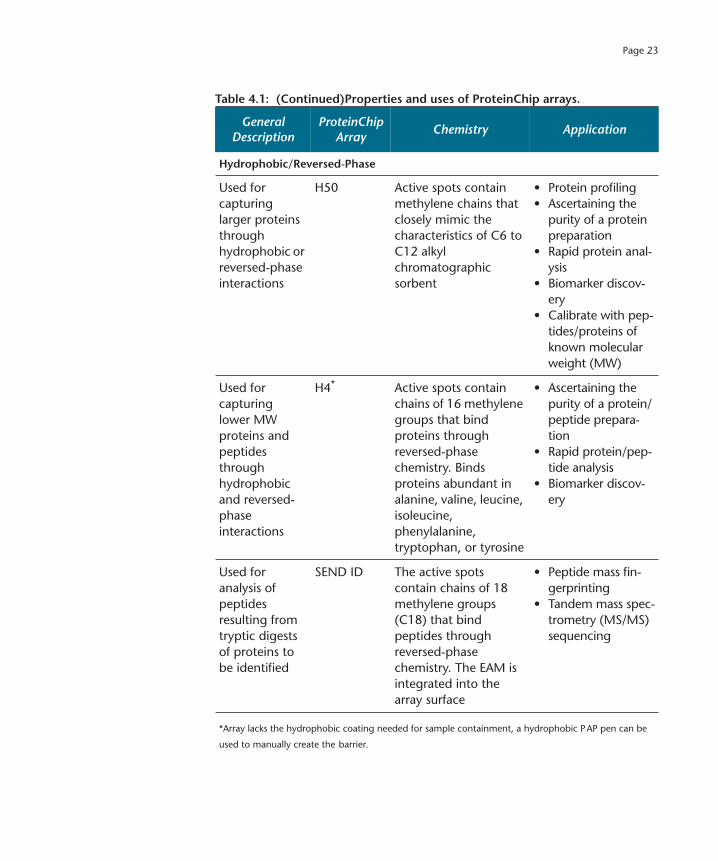
Hydrophobic/Reversed-Phase
Used for capturing larger proteins through hydrophobic or reversed-phase interactions
H50 Active spots contain methylene chains that closely mimic the characteristics of C6 to C12 alkyl chromatographic sorbent
• Protein profiling• Ascertaining the
purity of a protein preparation
• Rapid protein anal-ysis
• Biomarker discov-ery
• Calibrate with pep-tides/proteins of known molecular weight (MW)
Used for capturing lower MW proteins and peptides through hydrophobic and reversed-phase interactions
H4
*
Active spots contain chains of 16 methylene groups that bind proteins through reversed-phase chemistry. Binds proteins abundant in alanine, valine, leucine, isoleucine, phenylalanine, tryptophan, or tyrosine
• Ascertaining the purity of a protein/peptide prepara-tion
• Rapid protein/pep-tide analysis
• Biomarker discov-ery
Used for analysis of peptides resulting from tryptic digests of proteins to be identified
SEND ID The active spots contain chains of 18 methylene groups (C18) that bind peptides through reversed-phase chemistry. The EAM is integrated into the array surface
• Peptide mass fin-gerprinting
• Tandem mass spec-trometry (MS/MS) sequencing
*Array lacks the hydrophobic coating needed for sample containment, a hydrophobic PAP pen can be
used to manually create the barrier.
Table 4.1: (Continued)Properties and uses of ProteinChip arrays.
General Description
ProteinChip Array
Chemistry Application
Page 24
ProteinChip Arrays
ProteinChip Applications Guide, Volume 1: Introductory Guide
Strong Anion ExchangeProteinChip
®
Array
The strong anion exchange ProteinChip Q10 arrays can be used to analyze molecules with a negative charge on the surface. The active spots contain cationic, quaternary ammonium groups that interact with the negative charges on the surface of target proteins, e.g., aspartic acid or glutamic acid. The surface binds peptides and proteins that are negatively charged at a given pH. By maintaining the pH of the binding/wash buffer at alkaline conditions (e.g., pH 8.0), an overall net negative charge is imparted on a greater number of proteins within the sample, and the result is more binding. By decreasing the pH of the binding/wash buffer, an overall net positive charge is imparted on the proteins, resulting in less binding (i.e., more specificity).
The ProteinChip Q10 array has a hydrophobic barrier for sample containment and is the array of choice for strong anion exchange applications (Figure 4.1).
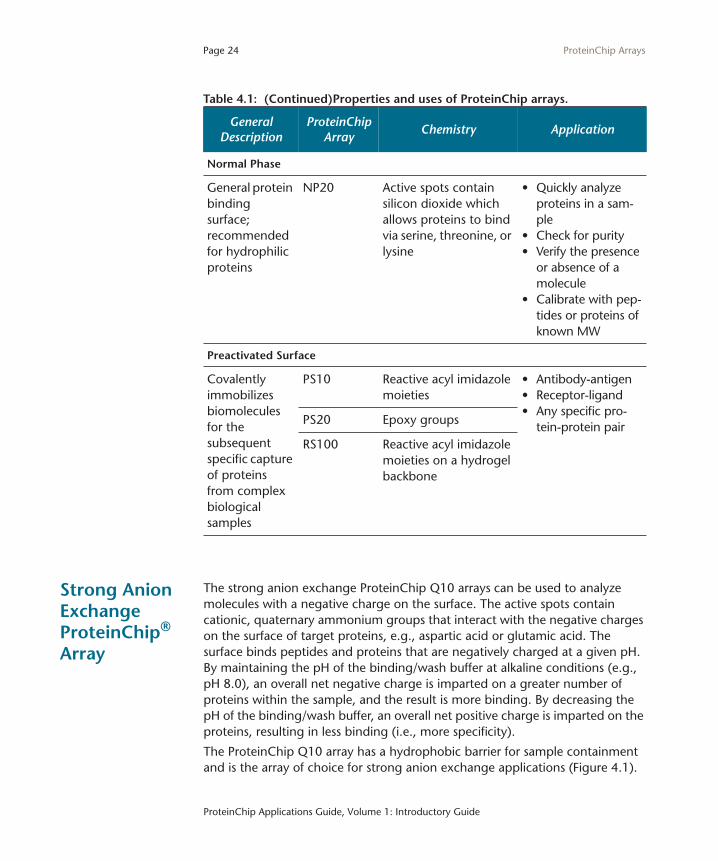
Normal Phase
General protein binding surface; recommended for hydrophilic proteins
NP20 Active spots contain silicon dioxide which allows proteins to bind via serine, threonine, or lysine
• Quickly analyze proteins in a sam-ple
• Check for purity• Verify the presence
or absence of a molecule
• Calibrate with pep-tides or proteins of known MW
Preactivated Surface
Covalently immobilizes biomolecules for the subsequent specific capture of proteins from complex biological samples
PS10 Reactive acyl imidazole moieties
• Antibody-antigen• Receptor-ligand• Any specific pro-
tein-protein pairPS20 Epoxy groups
RS100 Reactive acyl imidazole moieties on a hydrogel backbone
Table 4.1: (Continued)Properties and uses of ProteinChip arrays.
General Description
ProteinChip Array
Chemistry Application
Page 25
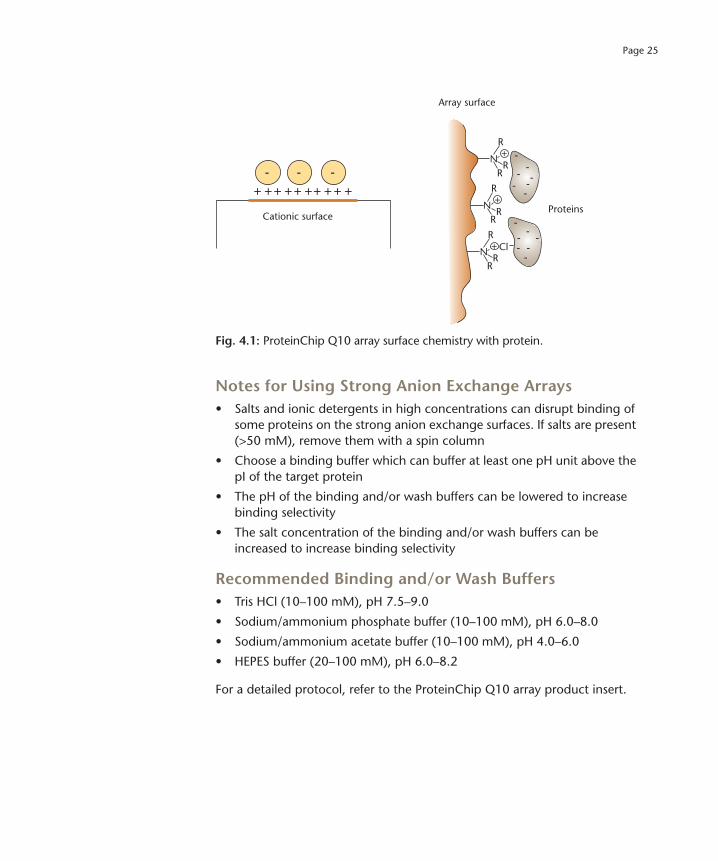
Fig. 4.1: ProteinChip Q10 array surface chemistry with protein.
Notes for Using Strong Anion Exchange Arrays• Salts and ionic detergents in high concentrations can disrupt binding of
some proteins on the strong anion exchange surfaces. If salts are present (>50 mM), remove them with a spin column
• Choose a binding buffer which can buffer at least one pH unit above the pI of the target protein
• The pH of the binding and/or wash buffers can be lowered to increase binding selectivity
• The salt concentration of the binding and/or wash buffers can be increased to increase binding selectivity
Recommended Binding and/or Wash Buffers • Tris HCl (10–100 mM), pH 7.5–9.0
• Sodium/ammonium phosphate buffer (10–100 mM), pH 6.0–8.0
• Sodium/ammonium acetate buffer (10–100 mM), pH 4.0–6.0
• HEPES buffer (20–100 mM), pH 6.0–8.2
For a detailed protocol, refer to the ProteinChip Q10 array product insert.
Cationic surface
Array surface
Proteins
- - -+ ++ ++ ++ + + +
Cl
N
R
RR
+
N
R
RR
+
N
R
RR
+
-
-
-- ---
-
-
-- -
--
Page 26 ProteinChip Arrays
ProteinChip Applications Guide, Volume 1: Introductory Guide
Weak Cation ExchangeProteinChip Array
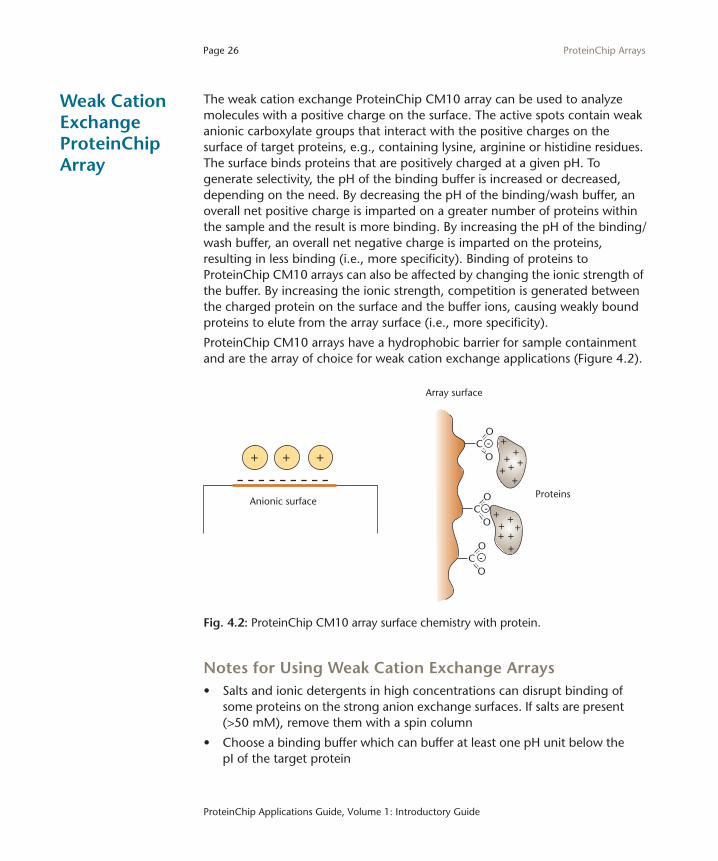
The weak cation exchange ProteinChip CM10 array can be used to analyze molecules with a positive charge on the surface. The active spots contain weak anionic carboxylate groups that interact with the positive charges on the surface of target proteins, e.g., containing lysine, arginine or histidine residues. The surface binds proteins that are positively charged at a given pH. To generate selectivity, the pH of the binding buffer is increased or decreased, depending on the need. By decreasing the pH of the binding/wash buffer, an overall net positive charge is imparted on a greater number of proteins within the sample and the result is more binding. By increasing the pH of the binding/wash buffer, an overall net negative charge is imparted on the proteins, resulting in less binding (i.e., more specificity). Binding of proteins to ProteinChip CM10 arrays can also be affected by changing the ionic strength of the buffer. By increasing the ionic strength, competition is generated between the charged protein on the surface and the buffer ions, causing weakly bound proteins to elute from the array surface (i.e., more specificity).
ProteinChip CM10 arrays have a hydrophobic barrier for sample containment and are the array of choice for weak cation exchange applications (Figure 4.2).
Fig. 4.2: ProteinChip CM10 array surface chemistry with protein.
Notes for Using Weak Cation Exchange Arrays• Salts and ionic detergents in high concentrations can disrupt binding of
some proteins on the strong anion exchange surfaces. If salts are present (>50 mM), remove them with a spin column
• Choose a binding buffer which can buffer at least one pH unit below the pI of the target protein
Anionic surface
Array surface
Proteins
+ + ++
+
++ +++
+
+
++ +
++
-O
CO
-O
CO
-O
CO
Page 27
• The pH of the binding and/or wash buffers can be increased to increase binding selectivity
• The salt concentration of the binding and/or wash buffers can be increased to increase binding selectivity
Recommended Binding and/or Wash Buffers• ProteinChip CM low stringency buffer 0.1 M sodium acetate, pH 4.0
• ProteinChip CM high stringency buffer 50 mM HEPES, pH 7.0
• Sodium/ammonium acetate buffer (10–100 mM), pH 4.0–6.0
• Sodium/ammonium phosphate buffer (10–100 mM), pH 6.0–8.0
• Tris-HCl buffer (10–100 mM), pH 7.5–9.0
For a detailed protocol, refer to the ProteinChip CM10 array product insert.
Immobilized Metal Affinity Capture (IMAC) ProteinChip Array
The ProteinChip IMAC30 array can be used to capture molecules that bind polyvalent cationic metals such as nickel, gallium, copper, iron, and zinc. The active spots contain NTA groups on the surface that chelate the metal ions. Proteins applied to the array surface may bind to the chelated metal ion through histidine, tryptophan, cysteine, and phosphorylated amino acids. To generate selectivity, the binding and/or wash buffers may contain increasing concentrations of competitors (e.g., imidazole), which compete with the metal on the NTA group for binding to the protein or peptide.
Common applications include profiling of biological samples (when loaded with Cu2+), the capture of 6x histidine-tagged recombinant proteins (when loaded with Ni2+), and capture of phosphorylated proteins and peptides (when loaded with Ga3+or Fe3+).
The ProteinChip IMAC30 array has a hydrophobic barrier for sample containment and is the array of choice for metal affinity applications (Figure 4.3).

Page 28 ProteinChip Arrays
ProteinChip Applications Guide, Volume 1: Introductory Guide
Fig. 4.3: ProteinChip IMAC30 array metal-binding surface with metal and protein.
Notes for Using the Immobilized Metal Affinity Array• ProteinChip IMAC30 arrays are manufactured in a metal-free form and
must be loaded with the metal prior to use. Recommendations are to use Cu2+ metal for general protein profiling, Ni2+ for capture of histidine-tagged proteins, and Ga3+ for phosphorylated peptide and protein capture.
• A sodium acetate pH 4.0 wash is necessary to neutralize the surface when charging arrays with copper. This step is not needed when charging with nickel or gallium
• Increasing the concentration of imidazole in binding and/or wash buffer will increase the selectivity of the surface
• EDTA and DTT should be avoided in the sample buffer
• Growth media containing histidine may weakly compete for binding to the ProteinChip IMAC30 array surface
Recommended Binding and/or Wash Buffers• ProteinChip IMAC binding buffer — 0.1 M sodium phosphate, 0.5 M
NaCl, pH 7.0
• Phosphate-buffered saline (PBS) (10–100 mM), pH 7.2, or choose alternative binding buffer of desired pH
NCOO-
COO-
COO-
NCOO-
COO-
COO-
NCOO-
COO-
COO-Protein binding to chelated metal
Metal chelate and metal
Affinity moiety on protein surface
MM M M M M M M M M M M M
M
Array surface
NM+
NH
NM+
NH
N
M+
NH
Proteins
Page 29
• Include salt (0.5–1.0 M) in binding and/or wash buffer
• If needed, include imidazole (5–10 mM) in binding buffer to increase selectivity. Increasing the concentration of imidazole beyond 10 mM may, however, disrupt low affinity metal interactions
For a detailed protocol, refer to the ProteinChip IMAC30 array product insert.
Reversed- Phase or Hydrophobic ProteinChip Arrays
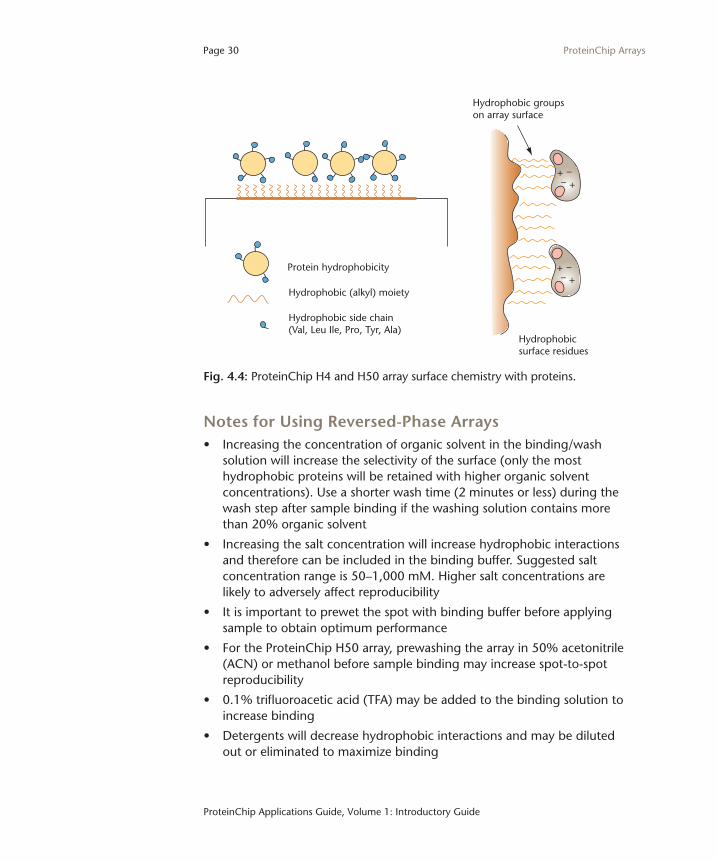
Reversed-phase or hydrophobic surface ProteinChip H50 and H4 arrays, are used for capturing proteins and peptides through reversed-phase or hydrophobic interactions. The binding characteristics of the ProteinChip H50 array surface are similar to C6 to C12 alkyl chromatographic sorbents. For the ProteinChip H4 array, the active spots contain chains of 16 methylene groups that can bind proteins through reversed-phase chemistry via alanine, valine, leucine, isoleucine, phenylalanine, tryptophan, or tyrosine.
In reversed-phase interactions, proteins within the sample partition themselves between the lipophilic phase of the array surface and the sample buffer. Proteins less hydrophobic relative to the binding buffer will not bind to the array surface, while proteins more hydrophobic will bind to the array surface.
By increasing the organic content of the wash buffer, the hydrophobic nature of the buffer increases. Proteins that had previously bound to the array will repartition into the wash buffer and be washed away if their hydrophobicity is less than that of the wash buffer. Only the most hydrophobic proteins will be retained with wash buffers containing a high concentration of organic solvent.
Hydrophobic interaction chromatography is characterized by binding of proteins to a hydrophobic surface at high salt concentrations. Typically conditions are nondenaturing, and since no organic solvent is used, biological activity has a much higher probability of being retained. Proteins are sequentially washed from the array surface by decreasing the salt concentration of the wash buffers (Figure 4.4).
Page 30 ProteinChip Arrays
ProteinChip Applications Guide, Volume 1: Introductory Guide
Fig. 4.4: ProteinChip H4 and H50 array surface chemistry with proteins.
Notes for Using Reversed-Phase Arrays• Increasing the concentration of organic solvent in the binding/wash
solution will increase the selectivity of the surface (only the most hydrophobic proteins will be retained with higher organic solvent concentrations). Use a shorter wash time (2 minutes or less) during the wash step after sample binding if the washing solution contains more than 20% organic solvent
• Increasing the salt concentration will increase hydrophobic interactions and therefore can be included in the binding buffer. Suggested salt concentration range is 50–1,000 mM. Higher salt concentrations are likely to adversely affect reproducibility
• It is important to prewet the spot with binding buffer before applying sample to obtain optimum performance
• For the ProteinChip H50 array, prewashing the array in 50% acetonitrile (ACN) or methanol before sample binding may increase spot-to-spot reproducibility
• 0.1% trifluoroacetic acid (TFA) may be added to the binding solution to increase binding
• Detergents will decrease hydrophobic interactions and may be diluted out or eliminated to maximize binding
–– +
+
–– +
+
Protein hydrophobicity
Hydrophobic (alkyl) moiety
Hydrophobic groupson array surface
Hydrophobicsurface residues
Hydrophobic side chain(Val, Leu Ile, Pro, Tyr, Ala)
Page 31
Recommended Binding and/or Wash Buffers• ProteinChip H50 buffer 10% ACN, 0.1% TFA
• 0–50% methanol or ACN ±0.1–1% TFA
For detailed protocols, refer to the ProteinChip H50 and H4 arrays product inserts.
Surface-Enhanced Neat Desorption (SEND) ProteinChip Array
SEND technology is unique in that the EAM is integral to the ProteinChip SEND ID array surface. The chemical noise (i.e., the signal arising from the EAM molecule itself or its conjugates) is significantly reduced when compared to addition of EAM on-spot, particularly in the range from 600–1,500 Da. This allows the use of SELDI for lower MW species analysis with a reduced number of interfering peaks in the spectrum. The ProteinChip SEND ID array has C18 as a functional group, allowing the use of the array for cleanup on-spot for desalting and denaturant (such as urea) removal prior to analysis by SELDI.
The primary application of the ProteinChip SEND ID array is protein identification by either peptide mass fingerprinting or MS/MS sequencing using SELDI-MS. A secondary application is small molecule analysis. Successful identification of molecules lower than 600 Da will be determined by how well these molecules are ionized, desorbed, and detected by the mass spectrometer. If laser intensity has to be increased above a certain level to detect the molecule, the background peaks below the 600 Da range may interfere with the detection of analyte peaks (Figure 4.5).

Page 32 ProteinChip Arrays
ProteinChip Applications Guide, Volume 1: Introductory Guide
Fig. 4.5: ProteinChip SEND ID array surface chemistry with protein.
Notes for Using the ProteinChip SEND ID Array• It is essential to mix the sample with 50% ACN and 0.2% TFA at 1:1 (v/
v) ratio before adding to the spot
• After mixing with ACN and TFA, the sample should be below pH 2.0. For samples with a pH greater than this, incubation times should be kept to a maximum of 10 minutes at room temperature
• Ideally, the final concentration of ACN after dilution is 25%. A final concentration of greater than 40% ACN is not compatible with the ProteinChip SEND ID array
• It is not recommended to wash on-spot (by pipetting the sample up and down) as this can reduce signal
• Weak signal can be improved by adding ACN to the sample as described in the product insert
• A prominent peak at m/z 211 indicates sodium contamination, and perform sample cleanup as described in the product insert. Contamination can suppress sample peaks and result in weak signal
• ProteinChip CHCA EAMs are integral to the array surface; therefore chemical noise from EAM peaks is significantly reduced compared to standard matrix-assisted laser desorption/ionization (MALDI) or SELDI analysis. Some chemical noise will be seen, and the amount seen will be
–– +
+
–– +
+
Protein hydrophobicity
Hydrophobic (alkyl/aryl) moiety
Hydrophobic groupson array surface
Hydrophobicsurface residues
EAMHydrophobic side chain(Val, Leu Ile, Pro, Tyr, Ala)
Page 33
affected by two main factors: increased laser intensity will increase chemical noise, and higher sample concentrations will lower the intensity of chemical noise peaks
For a detailed protocol, refer to the ProteinChip SEND ID array product insert.
Normal-Phase ProteinChip Array
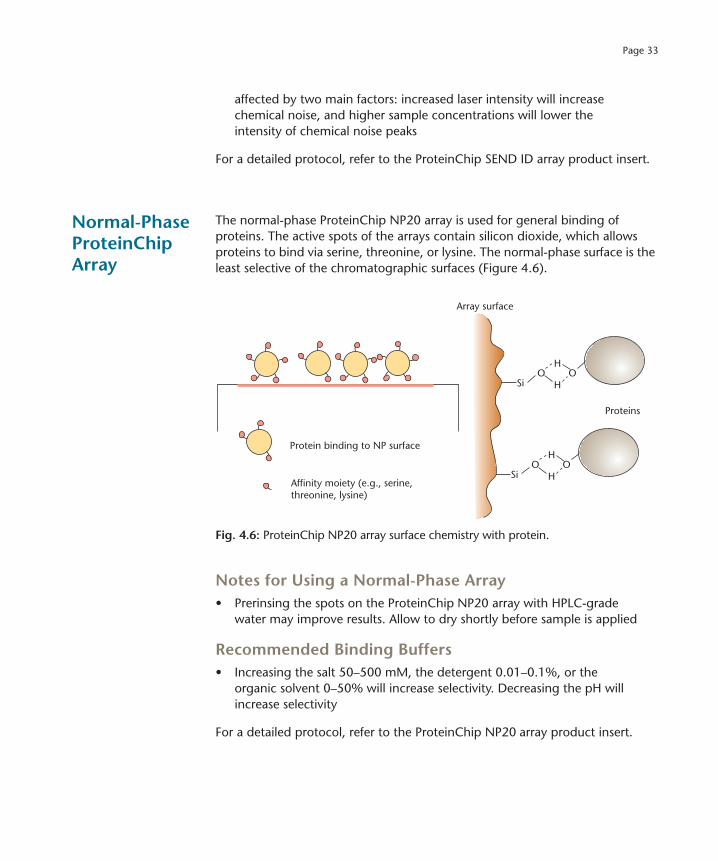
The normal-phase ProteinChip NP20 array is used for general binding of proteins. The active spots of the arrays contain silicon dioxide, which allows proteins to bind via serine, threonine, or lysine. The normal-phase surface is the least selective of the chromatographic surfaces (Figure 4.6).
Fig. 4.6: ProteinChip NP20 array surface chemistry with protein.
Notes for Using a Normal-Phase Array• Prerinsing the spots on the ProteinChip NP20 array with HPLC-grade
water may improve results. Allow to dry shortly before sample is applied
Recommended Binding Buffers• Increasing the salt 50–500 mM, the detergent 0.01–0.1%, or the
organic solvent 0–50% will increase selectivity. Decreasing the pH will increase selectivity
For a detailed protocol, refer to the ProteinChip NP20 array product insert.
Protein binding to NP surface
Affinity moiety (e.g., serine,threonine, lysine)
Array surface
Proteins
SiO O
H
H
SiO O
H
H
Page 34 ProteinChip Arrays
ProteinChip Applications Guide, Volume 1: Introductory Guide
Reactive Surface ProteinChip Arrays
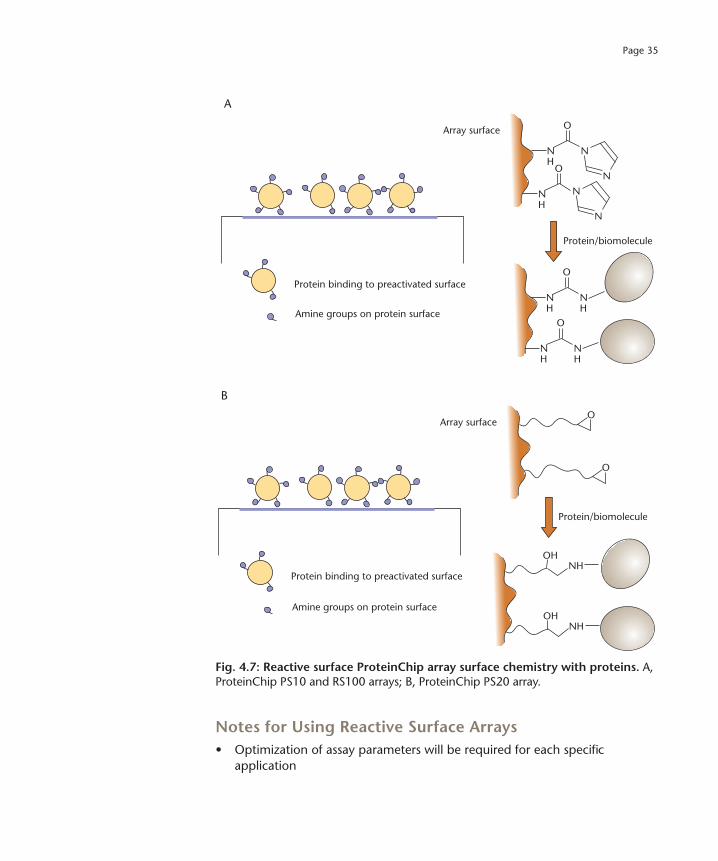
Preactivated surface ProteinChip arrays (PS10, PS20 and RS100), are used to covalently immobilize biomolecules for the subsequent capture of proteins from complex biological samples. The surface chemistries of the arrays differ, with carbonyl diimidazole moieties on the ProteinChip PS10 and RS100 arrays and epoxy groups on the ProteinChip PS20 array. Due to differences in surface properties, the ProteinChip RS100 array surface is especially recommended for sensitive detection and low nonspecific binding. Often more than one type of array must be tested to determine which is optimal for a particular experimental system (Figure 4.7).
Binding Capacity of Reactive Surface ProteinChip ArraysTo define theoretical binding capacity of a molecule to a surface, several considerations need to be taken into account, e.g., the shape of the molecule, the packing arrangement, and whether you have a monolayer or stacked layer. All these factors (and more) will influence the calculated binding capacity.
A simple way to estimate the theoretical binding capacity to a preactivated array is to assume that the binding molecule is spherical and the packing on the surface is a densely packed monolayer. With that in mind, and assuming that the spot size is 2 mm in diameter, the binding capacity can be described as:
Binding capacity (in moles) = [10^(-6) ]/[ N*(r^2) ]*[ 2/(3^(1/2)) ]
N = Avogadro’s number
r = Stokes radius, or hydrodynamic radius, of the molecule of interest (in meters)
The [2/(3^(1/2))] factor (roughly = 1.15) is for the dense packing arrangement. IgG, for example, has a Stokes radius of around 5–6 nm in typical solutions. Using this in the equation above gives a theoretical binding capacity of about 50 fmol. You can substitute the Stokes radius of any other molecule into this equation to get a ballpark estimate for the theoretical binding capacity. However, despite these considerations, it is also suggested that to determine the effective binding capacity, construction of dose-response curves for a given protein would also be instructive.
Page 35
Fig. 4.7: Reactive surface ProteinChip array surface chemistry with proteins. A, ProteinChip PS10 and RS100 arrays; B, ProteinChip PS20 array.
Notes for Using Reactive Surface Arrays• Optimization of assay parameters will be required for each specific
application
Protein binding to preactivated surface
Amine groups on protein surface
A
Array surface
Protein/biomolecule
NH
N
O
N
N
N
NH
O
NH
NH
O
NH
NH
O
Protein binding to preactivated surface
Amine groups on protein surface
B
Array surface
Protein/biomolecule
O
O
OHNH
OHNH
Page 36 ProteinChip Arrays
ProteinChip Applications Guide, Volume 1: Introductory Guide
• Proteins primarily couple through amine groups and may also couple through surface-exposed sulfhydryl groups ProteinChip PS20 array
• For coupling, use pure biomolecules without carrier proteins whenever possible
• Generally, couple biomolecules at pH 7.5–9.0, using PBS or sodium bicarbonate buffers
• During coupling, avoid buffers containing free amines (i.e., glycine, Tris), free sulfhydryls (i.e., dithiothreitol, β-mercaptoethanol), and azide
• Avoid physical contact with the spot surface and the surrounding coating
• The array design allows sample containment of up to 5 µl per spot. For greater volumes use the ProteinChip bioprocessor (see The ProteinChip Bioprocessor on page 47)
• Include denaturants, salts, and/or chaotropic agents in binding and wash buffers, as required to modify binding stringency and reduce nonspecific binding
Recommended Buffers
Coupling Buffers
• PBS or sodium bicarbonate, pH 7.5–9.2
• Avoid buffers containing free amines, free sulfhydryls, or azide
Blocking Buffers
• Ethanolamine (0.5 M), pH 8.0
• Tris-HCl or glycine (0.1–0.5 M), pH 8.0
• Bovine Serum Albumin (BSA) (100 µM in 1x PBS), pH 7.2
Binding Buffers
• PBS, pH 7–7.5 or buffer of choice.
• Include nonionic detergent (e.g., 0.1–0.5% Triton X-100) as needed.
• Include salt (0.15–1.0 M), other modifiers (e.g., ethylene glycol) and/or carrier protein (e.g., 1% BSA), if necessary
Wash Buffers
• Post-blocking, use buffers and additives more stringent than binding conditions. Repeated washing and pH cycling may be necessary
• Post-binding, use buffers and additives used in binding conditions
Page 37
• Include nonionic detergent, salts, and/or chaotropic agents as required.
• A final water wash is often required
For detailed protocols, refer to the product inserts for the ProteinChip RS100, PS10, and PS20 arrays.

Page 38 ProteinChip Arrays
ProteinChip Applications Guide, Volume 1: Introductory Guide

Page 39
Chapter 5: ProteinChip SELDI System Reagents and Accessories
Energy Absorbing Molecules (EAMs) 41Introduction 41
Selecting ProteinChip EAMs for Proteins and Peptides 41
Selecting EAMs for Nonprotein Molecules 42
EAM Solvent Choices for Protein and Peptide Analysis 43
Preparing EAM solutions 44
Applying EAMs to ProteinChip arrays 45
Protein and Peptide Standards 47Introduction 45
ProteinChip All-in-One Protein and Peptide Standards 46
The ProteinChip Bioprocessor 47Introduction 47
ProteinChip Bioprocessor Components 47
Assembling ProteinChip arrays in the Bioprocessor 48
Using the ProteinChip Bioprocessor 51
Disassembling the ProteinChip Bioprocessor 52
Compatible Solvents 52

Page 40 ProteinChip SELDI System Reagents and Accessories
ProteinChip Applications Guide, Volume 1: Introductory Guide

Page 41
Energy Absorbing Molecules (EAMs)
IntroductionThe EAM is an essential component to a successful ProteinChip SELDI experiment. The term EAM is a generic name for molecules that assist in desorption and ionization of the analyte. Known as “matrix” in traditional matrix-assisted laser desorption/ionization (MALDI) mass spectrometry (MS), the EAM is applied in organic solvent, solubilizing many proteins on the array surface. As the EAM solution dries, the proteins cocrystallize with the EAM. These crystals absorb the laser energy and generate the ionized proteins detected by the ProteinChip SELDI reader. The quality and chemical nature of the EAM used has a dramatic effect on the data, as does the method of EAM application.
Selecting ProteinChip EAMs for Proteins and PeptidesBio-Rad offers three different EAM compounds for the detection of proteins and peptides. The general guidelines for choosing an EAM are based on the molecular weight (MW) and chemical nature of the analyte, but there are no absolute rules.
ProteinChip CHCA EAM
Alpha-cyano-4-hydroxycinnamic acid (CHCA, MW = 189.2) is especially good for small molecules, 1 – 15 kD. A 20–50% saturated CHCA EAM solution in 50% acetonitrile (ACN) and 0.25% trifluoroacetic acid (TFA) is generally used. Two additions of 0.3–1 µl per spot are recommended. Let the CHCA air-dry between additions.
ProteinChip SPA EAM
Sinapinic acid (SPA, MW = 224.2) is recommended for all larger proteins, but also works reasonably well for peptides. A 50% or saturated solution of ProteinChip SPA EAM is generally used; the vial is reconstituted in 50% ACN and 0.5% TFA. Two additions of 0.5–1 µl per spot are recommended. Let the SPA air-dry between additions. In general, SPA gives better resolution and less multiply charged ions than EAM-1. For protein profiling using only a single EAM, SPA is the molecule of choice.
ProteinChip EAM-1 EAM
EAM-1 is a proprietary molecule (MW = 231.21) and works very well for proteins >15 kD. Use a saturated solution or a 2-fold dilution (in solvent). EAM-1 tends to generate multiply charged species, and peaks tend to be broader due to more adduct formation. It does, however, often allow desorption/ionization of proteins that are difficult to detect such as glycosylated proteins.
Page 42 ProteinChip SELDI System Reagents and Accessories
ProteinChip Applications Guide, Volume 1: Introductory Guide
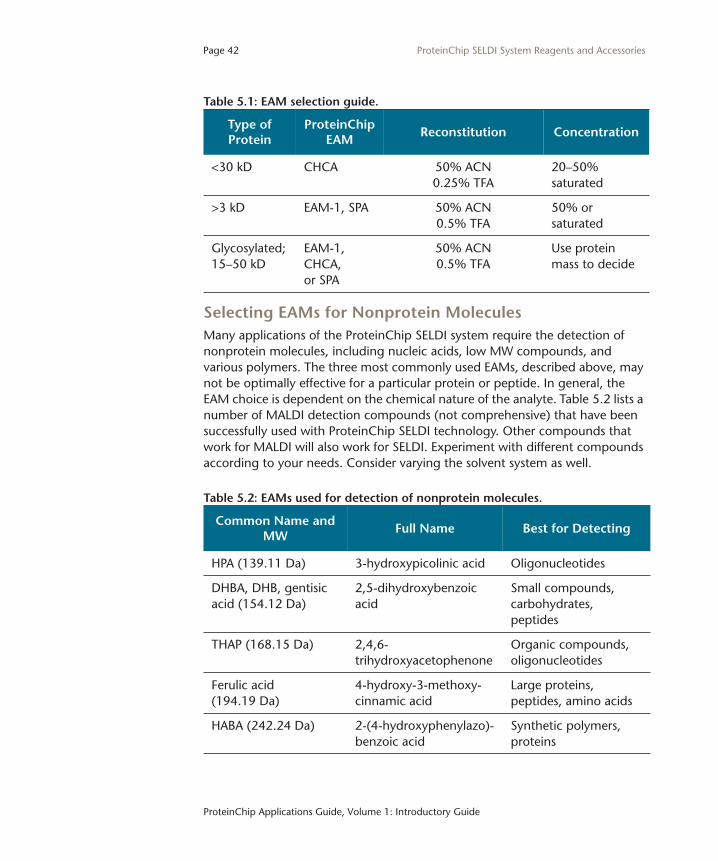
Selecting EAMs for Nonprotein MoleculesMany applications of the ProteinChip SELDI system require the detection of nonprotein molecules, including nucleic acids, low MW compounds, and various polymers. The three most commonly used EAMs, described above, may not be optimally effective for a particular protein or peptide. In general, the EAM choice is dependent on the chemical nature of the analyte. Table 5.2 lists a number of MALDI detection compounds (not comprehensive) that have been successfully used with ProteinChip SELDI technology. Other compounds that work for MALDI will also work for SELDI. Experiment with different compounds according to your needs. Consider varying the solvent system as well.
Table 5.1: EAM selection guide.
Type of Protein
ProteinChip EAM
Reconstitution Concentration
<30 kD CHCA 50% ACN0.25% TFA
20–50% saturated
>3 kD EAM-1, SPA 50% ACN0.5% TFA
50% or saturated
Glycosylated; 15–50 kD
EAM-1, CHCA,or SPA
50% ACN0.5% TFA
Use protein mass to decide
Table 5.2: EAMs used for detection of nonprotein molecules.
Common Name and MW
Full Name Best for Detecting
HPA (139.11 Da) 3-hydroxypicolinic acid Oligonucleotides
DHBA, DHB, gentisic acid (154.12 Da)
2,5-dihydroxybenzoic acid
Small compounds,carbohydrates, peptides
THAP (168.15 Da) 2,4,6-trihydroxyacetophenone
Organic compounds, oligonucleotides
Ferulic acid(194.19 Da)
4-hydroxy-3-methoxy-cinnamic acid
Large proteins, peptides, amino acids
HABA (242.24 Da) 2-(4-hydroxyphenylazo)-benzoic acid
Synthetic polymers,proteins
Page 43
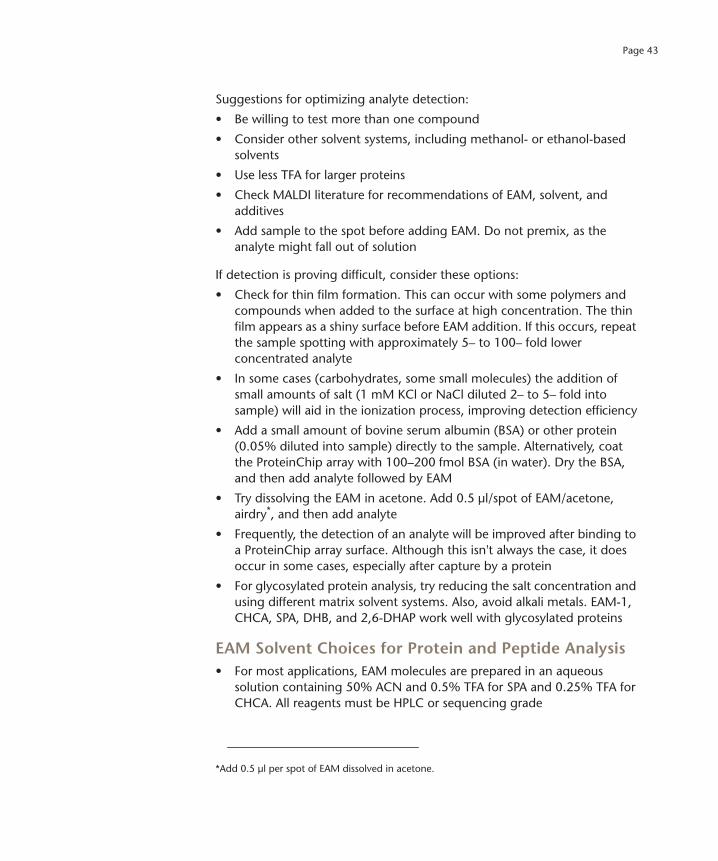
Suggestions for optimizing analyte detection:
• Be willing to test more than one compound
• Consider other solvent systems, including methanol- or ethanol-based solvents
• Use less TFA for larger proteins
• Check MALDI literature for recommendations of EAM, solvent, and additives
• Add sample to the spot before adding EAM. Do not premix, as the analyte might fall out of solution
If detection is proving difficult, consider these options:
• Check for thin film formation. This can occur with some polymers and compounds when added to the surface at high concentration. The thin film appears as a shiny surface before EAM addition. If this occurs, repeat the sample spotting with approximately 5– to 100– fold lower concentrated analyte
• In some cases (carbohydrates, some small molecules) the addition of small amounts of salt (1 mM KCl or NaCl diluted 2– to 5– fold into sample) will aid in the ionization process, improving detection efficiency
• Add a small amount of bovine serum albumin (BSA) or other protein (0.05% diluted into sample) directly to the sample. Alternatively, coat the ProteinChip array with 100–200 fmol BSA (in water). Dry the BSA, and then add analyte followed by EAM
• Try dissolving the EAM in acetone. Add 0.5 µl/spot of EAM/acetone, airdry*, and then add analyte
• Frequently, the detection of an analyte will be improved after binding to a ProteinChip array surface. Although this isn't always the case, it does occur in some cases, especially after capture by a protein
• For glycosylated protein analysis, try reducing the salt concentration and using different matrix solvent systems. Also, avoid alkali metals. EAM-1, CHCA, SPA, DHB, and 2,6-DHAP work well with glycosylated proteins
EAM Solvent Choices for Protein and Peptide Analysis• For most applications, EAM molecules are prepared in an aqueous
solution containing 50% ACN and 0.5% TFA for SPA and 0.25% TFA for CHCA. All reagents must be HPLC or sequencing grade
*Add 0.5 µl per spot of EAM dissolved in acetone.
Page 44 ProteinChip SELDI System Reagents and Accessories
ProteinChip Applications Guide, Volume 1: Introductory Guide
• As an alternative, a solvent containing 30% ACN, 15% isopropanol, 0.5% TFA, and 0.05% NP-40 (or Triton X-100) works well
• For difficult proteins and peptides, especially the hydrophobic variety, try adding formic acid to the mix. Dissolve 5 mg EAM in 150 µl 50% ethanol (100 proof), microcentrifuge, and transfer 90 µl of the supernatant to a fresh tube. Then add 10 µl formic acid (10% final)
• For glycoproteins, the addition of a small amount of detergent (0.02–0.1% NP-40) to the 50% ACN and 0.5% TFA solvent may be helpful. Changing the TFA concentration may also be helpful
• Solubility of the analyte in the solvent system is one of the most important parameters to be considered during solvent selection. It is important to keep your analyte solubilized before the binding on array. The surface tension of the solvent system must also be considered during the selection process. In general, water-rich solvents exhibit adequate surface tension and allow the formation of reproducible round-shaped deposits with high crystal density. Low surface tension solvents, such as alcohols and acetone, provide widespread and irregularly shaped crystal beds. The volatility of the solvent must also be considered. Fast solvent evaporation results in smaller crystals with more homogeneous analyte distributions. However, rapid crystallization also shows increased cationization. The composition of the solvent is an important parameter that can influence the results
Preparing EAM solutionsThe solvent system for EAMs and the EAM solution itself ideally should be prepared fresh every day. ACN volatilizes rapidly and EAMs break down significantly within 24 hours in solution at room temperature. Freezing EAMs after dissolving them in solvent may preserve them for about a week; however, preparing fresh solvent and EAM solution each day is recommended.
1. EAMs are supplied as 5 mg dried powder in a vial. Add 50–200 µl of the appropriate solvent depending on your needs. Vortex well, then sit at room temperature for about 5 minutes. There should be undissolved EAMs remaining in the vial.
2. Microcentrifuge for 10 minutes at maximum speed at room temperature to pellet any particulates. The EAM solution is now ready to use. Keep at room temperature — the solubility drops significantly when kept on ice.

Page 45
NOTEWhen preparing ProteinChip CHCA EAM, occasionally CHCA particulate will float on top of the solution. To minimize deposition of solid CHCA onto the spot, take the supernatant off the top of the CHCA and transfer it to another tube.
3. Add 0.3–1 µl per spot air-dry for 5 minutes, and apply another 0.3–1 µl of EAM solution. Allow to air-dry before analyzing the array in the ProteinChip SELDI reader.
Applying EAMs to ProteinChip arraysThe method of EAM application to the array surface requires some practice as it can significantly influence the quality of the data. A minute volume (0.3–1 µl) of EAM in organic solvent must be applied to each sample prior to analysis. It is recommended that EAM solution be applied to the spots after they have completely dried for the greatest spot-to-spot consistency.
If you are seeing variable signal across the spot when reading the arrays, it may be useful to observe the sample in good light, or under a dissecting microscope. The sample should be distributed fairly uniformly across the spot surface. Sometimes application of EAM leads to a ring of sample around the periphery of the spot. In such cases, analysis of the middle of the spot yields low signal, while analysis of the periphery of the spot yields high signal.
Notes for Applying EAMs to Arrays
• When pipetting EAM solution onto samples, be careful to avoid the undissolved EAM at the bottom of the tube
• Always use new, packaged pipet tips; never use tips that have been autoclaved or reused.
• EAMs are light-sensitive and should be stored away from the light.
Protein and Peptide Standards
IntroductionThere are many protein and peptide standards commercially available as single molecules and standard mixtures, however the requirements for a protein used in MS are often different from many of these commercially available mixes which have been primarily designed for electrophoresis. For instance the protein itself must fly well in the mass spectrometer so that the peak can be clearly seen in the spectra. When using protein mixes, it is important to not use
Page 46 ProteinChip SELDI System Reagents and Accessories
ProteinChip Applications Guide, Volume 1: Introductory Guide
a protein that is close to half (or a third) the size of another protein in the mix, so that it is clear that the peak is from the protein rather than a doubly charged peak of the larger protein. Glycosylated proteins do not make good standards as their heterogeneity tends to produce broad peaks.
ProteinChip All-in-One Protein and Peptide StandardsTwo standard mixtures are available from Bio-Rad for calibration of the ProteinChip SELDI reader.
The ProteinChip All-in-One peptide standard is used to calibrate the ProteinChip SELDI reader in the low mass range with seven peptides ranging in MW from 1,084 to 7,033 D. The ProteinChip All-in-One protein standard II covers the low to high mass range with seven proteins ranging in MW from 6,964 to 147,300 D. Recombinant hirudin is provided in both mixes to ensure the entire range from 1 kD to 147 kD is covered.
Both of these standard mixtures are provided lyophilized. After reconstitution, they should be aliquoted into small tubes and stored frozen at –20˚C.
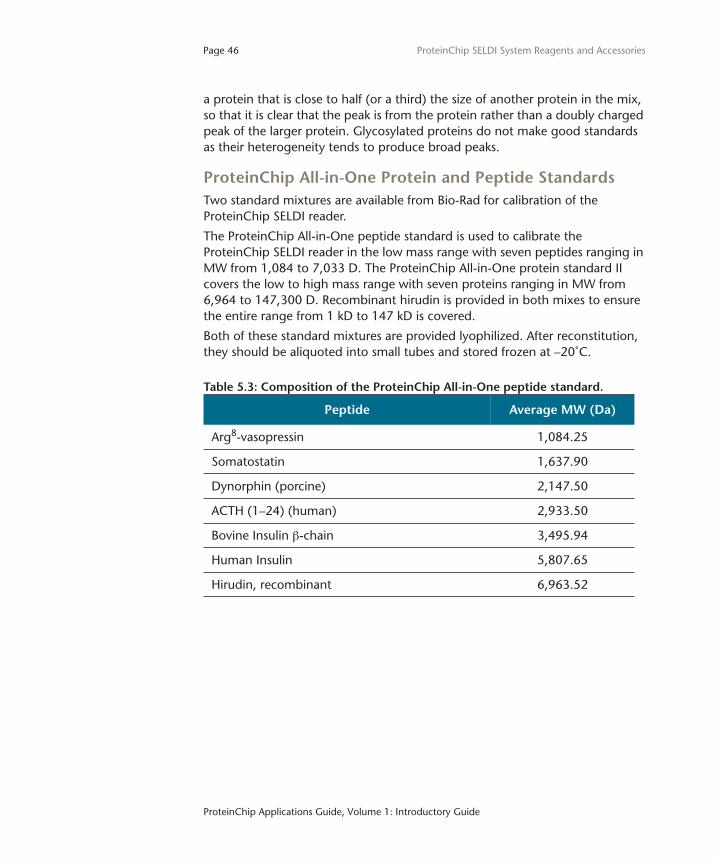
Table 5.3: Composition of the ProteinChip All-in-One peptide standard.
Peptide Average MW (Da)
Arg8-vasopressin 1,084.25
Somatostatin 1,637.90
Dynorphin (porcine) 2,147.50
ACTH (1–24) (human) 2,933.50
Bovine Insulin β-chain 3,495.94
Human Insulin 5,807.65
Hirudin, recombinant 6,963.52
Page 47
The ProteinChip Bioprocessor
IntroductionThe ProteinChip bioprocessor was developed to increase the detection limit sensitivity of the ProteinChip SELDI system, and to improve reproducibility and assay throughput. Using the ProteinChip Bioprocessor, larger sample volumes (up to 250 µl) can be applied to a ProteinChip array surface. Increasing the sample volume applied to the array improves the detection limit by exposing the active surface of the array to a higher quantity of protein. The ProteinChip cassette compatible bioprocessor enables simultaneous processing of up to twelve ProteinChip arrays and is compatible with robotic or liquid-handling systems used for 96-well format assays.
ProteinChip Bioprocessor ComponentsFigure 5.1 shows the parts of the ProteinChip cassette compatible bioprocessor assembly. ProteinChip arrays are supplied in cassettes with a disposable bioprocessor reservoir. There is no need to remove the arrays from the cassette to use them in the bioprocessor assembly. If you do want to take them out of the cassette, remove them using the forceps provided to avoid touching the array surfaces. Remove the bioprocessor reservoir from the top of the cassette before you remove any arrays.
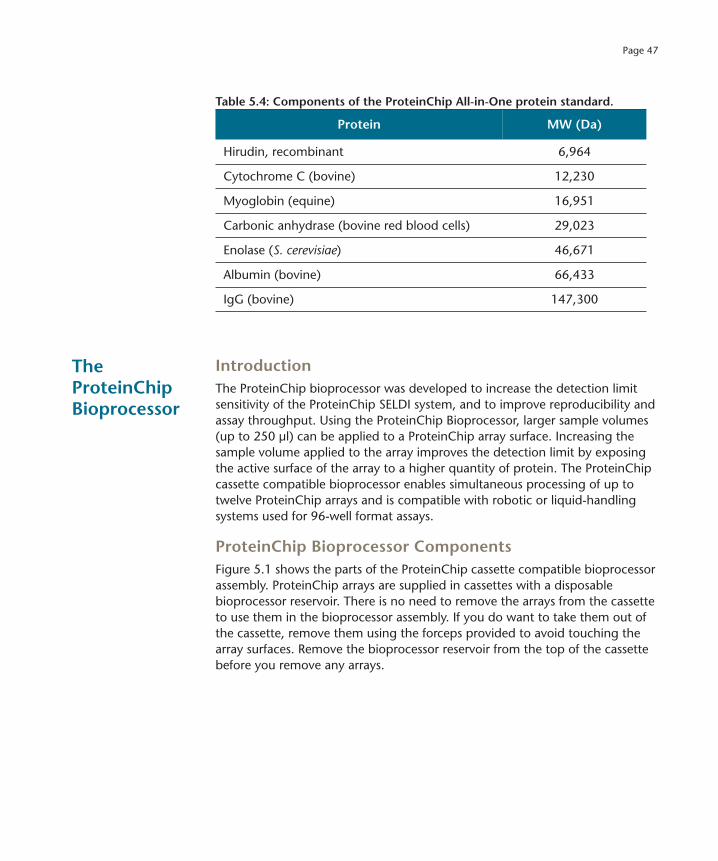
Table 5.4: Components of the ProteinChip All-in-One protein standard.
Protein MW (Da)
Hirudin, recombinant 6,964
Cytochrome C (bovine) 12,230
Myoglobin (equine) 16,951
Carbonic anhydrase (bovine red blood cells) 29,023
Enolase (S. cerevisiae) 46,671
Albumin (bovine) 66,433
IgG (bovine) 147,300
Page 48 ProteinChip SELDI System Reagents and Accessories
ProteinChip Applications Guide, Volume 1: Introductory Guide
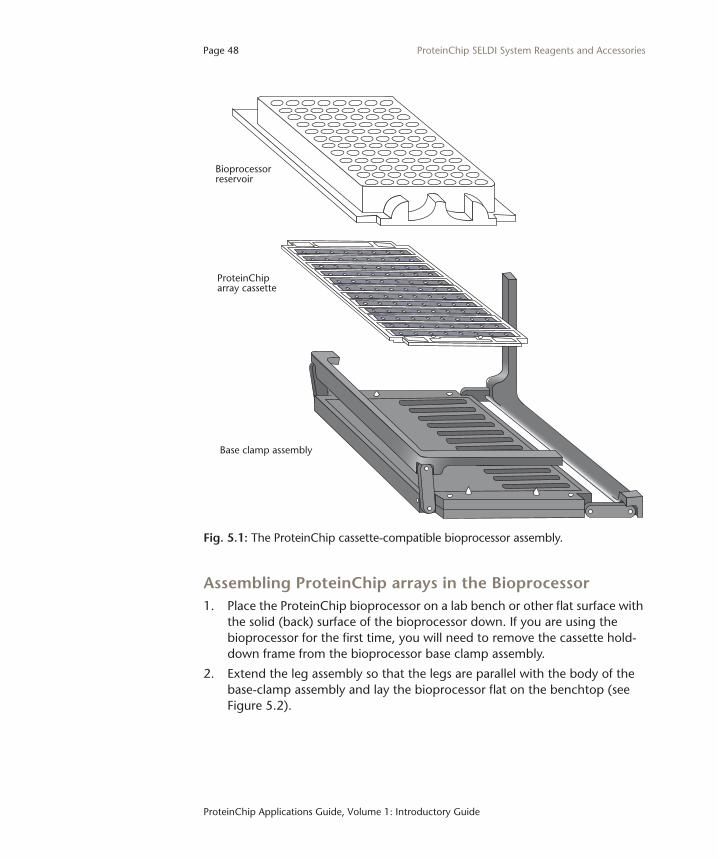
Fig. 5.1: The ProteinChip cassette-compatible bioprocessor assembly.
Assembling ProteinChip arrays in the Bioprocessor1. Place the ProteinChip bioprocessor on a lab bench or other flat surface with
the solid (back) surface of the bioprocessor down. If you are using the bioprocessor for the first time, you will need to remove the cassette hold-down frame from the bioprocessor base clamp assembly.
2. Extend the leg assembly so that the legs are parallel with the body of the base-clamp assembly and lay the bioprocessor flat on the benchtop (see Figure 5.2).
Bioprocessorreservoir
ProteinChiparray cassette
Base clamp assembly

Page 49
Fig. 5.2: The ProteinChip cassette-compatible bioprocessor with its legs extended on the benchtop.
3. Place the ProteinChip array cassette and bioprocessor reservoir on the bioprocessor. The cassette can only fit in the assembly in one orientation because of the asymmetric locator pins on the cassette, reservoir and clamp assembly. This asymmetry ensures that the column numbers and row letters are properly oriented when the bioprocessor is being used.
4. Stabilize the bioprocessor against the bench with one hand to prevent it from tipping. Lift the hinged leg assembly and place it over the reservoir (which has been assembled into the base clamp assembly). Ensure that both of the leg assemblies sit over the edge of the reservoir before attempting to close the assembly as shown in Figure 5.3.

Page 50 ProteinChip SELDI System Reagents and Accessories
ProteinChip Applications Guide, Volume 1: Introductory Guide
Fig. 5.3: Securing the leg assemblies over the reservoir.
5. Snap the leg assemblies closed over the bioprocessor reservoir as shown in Figure 5.4.
Fig. 5.4: Closing the ProteinChip bioprocessor assembly.

Page 51
6. When assembled correctly, the ProteinChip bioprocessor should look identical to the one shown in Figure 5.5
Fig. 5.5: The ProteinChip cassette-compatible bioprocessor, fully assembled.
Using the ProteinChip Bioprocessor1. Add samples to the bioprocessor reservoir using a multichannel pipet or
laboratory automation workstation. Be extremely careful not to form bubbles at the bottom of the wells*.
2. Use a DPC MicroMix 5 or other suitable shaker to mix the sample and ensure adequate sample exposure to the active surface of the ProteinChip array. When using the MicroMix 5, we recommend using form 20, amplitude 5.
3. Liquid can be removed from the reservoir using a multi-channel pipet or any vacuum aspirator. In either case, as much of the liquid as possible should be removed by placing the tip of the removal device as far down in to the well as possible without touching the active chemistry spots.
*To avoid forming bubbles in at the bottom of the V-shaped well, place the pipet tip as far down in the well as possible without touching the active chemistry spot of the ProteinChip array. For convenience, the tip of the pipet can be placed lightly against the side of the well near the bottom (not on the spot) when dispensing the sample.
Page 52 ProteinChip SELDI System Reagents and Accessories
ProteinChip Applications Guide, Volume 1: Introductory Guide
4. Addition of EAMs is performed after removal of the bioprocessor reservoir. Use the cassette hold-down frame provided with the bioprocessor assembly in place of the reservoir to ensure the arrays cassette remains flat in the bioprocessor assembly.
Disassembling the ProteinChip Bioprocessor1. Place the bioprocessor on a lab bench or other flat surface with the solid
(back) surface of the bioprocessor down.
2. Unlatch the hinged leg assemblies and remove the reservoir from the base clamp assembly by holding the base clamp assembly down with one hand while lifting the reservoir straight up from the base with the other hand.
3. Remove any excess water from the arrays by blotting the arrays at the edges of the spots with a lint-free lab wipe.
4. Allow the arrays to air-dry for approximately 10 minutes prior to adding EAMs according to your protocol. To keep the cassette flat in the bioprocessor, use the cassette hold-down frame provided with this assembly.
Compatible SolventsThe ProteinChip bioprocessor is compatible with most buffers recommended in this applications guide. However, some strong, nonpolar solvents will cause cracking of the bioprocessor reservoir and leaching of polymers from the substrate. Therefore, solvents such as the following should be avoided:
• Acetone
• Chloroform
• DMF
Page 53
Chapter 6: Software Used with the ProteinChip SELDI System
Introduction 55
ProteinChip Data Manager Software 55Peak Clustering 56
ProteinChip Pattern Analysis Software 57

Page 54 Software Used with the ProteinChip SELDI System
ProteinChip Applications Guide, Volume 1: Introductory Guide
Page 55
Introduction The intrinsic strengths of the SELDI process include the ability to profile proteins by analyzing the sample with a variety of surface chemistries and sample preparation steps. High-throughput collection and analysis of such multidimensional SELDI data requires managing data related to samples, ProteinChip arrays, reagents, and spectra, as well as powerful analytical tools to discover single and multiple marker patterns in sample sets.
Bio-Rad provides two software solutions to meet these needs. This chapter provides a brief overview of each software package. For more detailed information, see the operation manual for each program.
ProteinChip Data ManagerSoftware
ProteinChip data manager software provides a robust, client-server, relational database system for managing and tracking ProteinChip SELDI system data. It organizes raw spectra data gathered from external sources, tracks samples, arrays and reagents, refines results and generates reports. with generate reports. It provides advanced data handling and includes powerful data mining and differential expression analysis capabilities to allow rapid, automated analysis of multiple experiments over multiple conditions to identify potential biomarkers.
ProteinChip data manager software has been designed to improve the efficiency of the ProteinChip SELDI system. Thorough annotation of sample information and experimental conditions is necessary for downstream data analysis. The Virtual Notebook feature lets you enter information about sample processing conditions and apply these properties to the spot results.
ProteinChip data manager software not only provide simple and intuitive data management but also provide a foundation for exploratory data analysis. Differential expression applications include algorithms to group peaks of similar molecular weight across sample groups of spectra, then statistically and visually display the differences in expression levels. The differential expression applications include algorithms such as principal components analysis (PCA), receiver operator characteristics (ROC) plots, and hierarchical clustering with visualization via a heat map view. It also enables exporting to other tools, such as ProteinChip pattern analysis software.

Page 56 Software Used with the ProteinChip SELDI System
ProteinChip Applications Guide, Volume 1: Introductory Guide
Fig. 6.1: Workflow using ProteinChip data manager software.
Peak ClusteringProteinChip data manager software offers peak clustering functionality, which groups peaks of similar molecular weight across sample groups of spectra. After the clustering operation is complete, the software provides statistical and visual displays of the differences in expression levels between sample groups.
ProteinChip data manager software allows the clusters to be saved in an output file for analysis in ProteinChip pattern analysis software.

Page 57
ProteinChip data manager software generates consistent peak sets across multiple spectra. When comparing a given protein peak across various sample conditions, it is important to obtain an intensity value for that peak in each individual spectrum, even though they may not have been found with a given set of automatic peak detection settings.
The clustering operates in two passes. The first pass uses low sensitivity to detect obvious and well-defined peaks, as determined in the Automatic Peak Detection dialog box. The second pass uses higher sensitivity settings to search for smaller peaks, with the mass values found in the first pass.
ProteinChip Pattern AnalysisSoftware
ProteinChip pattern analysis software is multivariate classification software that provides rapid, simplified pattern analysis for discovery of multiple biomarkers. The program is a powerful tool that builds and tests models for classification using ProteinChip SELDI system data.
ProteinChip pattern analysis software is a unique, Windows-based package for supervised classification of SELDI mass spectral data sets derived from the ProteinChip SELDI system. ProteinChip pattern analysis software uses a decision tree to display how data may be classified or predicted. Through a series of yes and no questions concerning database fields, it automatically searches for important relationships and uncovers hidden structure even in highly complex data. The program is often used to select a manageable number of core measures from databases with hundreds of variables.
When compared to a single biomarker, multiple biomarkers offer increased statistical power for superior predictive value and greater utility in diagnosis, toxicology, patient stratification, and patient monitoring. Moreover, the ability to detect the patterns formed by multiple biomarkers greatly improves the sensitivity and specificity of clinical proteomics for predictive medicine.

Page 58 Software Used with the ProteinChip SELDI System
ProteinChip Applications Guide, Volume 1: Introductory Guide

Page 59
Chapter 7: Introduction to Protein Biochemistry
Protein Structure and Function 61Native vs. Denatured Proteins 61
Posttranslational Modifications (PTMs) 62
Methods for Studying Proteins 63Ion Exchange Chromatography 64
Net Charge of Protein and Ion Exchange Chromatography 64
Consideration of Isoelectric Point (pI) of Proteins 65
Other Techniques for Studying Proteins 66
Proteins That Fly or Don’t Fly 66

Page 60 Introduction to Protein Biochemistry
ProteinChip Applications Guide, Volume 1: Introductory Guide
Page 61
Protein Structure and Function
Proteins are linear polymers of amino acids linked by amide bonds, the sequences of which are dictated by the specific gene sequence, mRNA-processing, and posttranslation proteolytic cleavages. The number and type of amino acids give each protein its distinctive biochemical nature. In addition to amino acids, many proteins also have other types of structures attached to them, either covalently or noncovalently. These structures may include prosthetic groups, such as lipids (lipoproteins), sugars (glycoproteins), metals (metalloproteins), heme groups, and vitamins (which may act as coenzymes). Amino acids may also be directly modified by the addition of phosphate to serine, tyrosine, or threonine, or by other modifications such as oxidations or acetylations. See http://www.abrf.org/index.cfm/dm.home for a tabular survey.
Covalently attached prosthetic groups (lipids, sugars, phosphates) will increase the mass of a protein, and therefore can be detected by SELDI. Noncovalently attached prosthetic groups (metals, heme groups, vitamins) may dissociate from the protein either during sample preparation or during the process of energy absorbing molecule (EAM) addition and crystallization, when organic solvent is typically added to the sample. Prosthetic groups also affect the chemical nature of the protein and thus may affect the protein's binding activity to particular ProteinChip array chemical surfaces.
Native vs. Denatured ProteinsThe polypeptide chain of a protein can fold into a number of stable or metastable three-dimensional structures. These conformers [conformational isomers] are stabilized by a number of noncovalent interactions between different parts of the polypeptide chain. All conformers of a protein have an identical mass. The manner in which an individual polypeptide chain folds is called its tertiary structure. When it is folded into its biologically active structure, it is said to be in its native state. A denatured protein is functionally a protein which no longer exhibits biological activity, although it may retain considerable ordered structure. Many proteins are complexes of several folded polypeptide chains, which are held together by noncovalent, and sometimes covalent, interactions (a disulfide bond is an example of a covalent interaction). Each polypeptide in such a complex is called a subunit, and the structure formed when the subunits associate with each other is called a protein’s quaternary structure.
ProteinChip array analysis can investigate the behavior of either native or denatured proteins. Protein-protein interaction studies, using a binding protein covalently attached to a preactivated surface array, are often used to capture a protein in its native state. For example, an antibody or receptor that recognizes a ligand in its native conformation may be used to capture that protein onto the ProteinChip array.
Page 62 Introduction to Protein Biochemistry
ProteinChip Applications Guide, Volume 1: Introductory Guide
When an EAM is added to a ProteinChip array spot, virtually all of a protein’s tertiary structure is disrupted due to the low pH and high concentration of organic solvent. Because the laser desorption/ionization process used in SELDI does not break covalent bonds, the mass detected for a single subunit protein is the same regardless of whether it is native or denatured. However, the noncovalent interactions which hold multisubunit proteins together will be disrupted, so that the predominant species observed in the mass spectrum will be the individual subunits, although residual complexes (dimers, trimers, etc.) may be observed as well.
Posttranslational Modifications (PTMs)Protein synthesis typically follows transcription of the specific gene encoding the protein into mRNA, and translation of the mRNA at the ribosome into a polypeptide in a eukaryotic cell. Nearly every protein is altered after ribosomal synthesis — this is called posttranslational modification. PTMs alter the life span, the cellular location, and the function or activity of the protein. PTMs can involve further processing of the protein by clipping peptides to reduce the size, or adding chemical groups to the full-length protein. Many types of PTMs can be detected using SELDI. Brief descriptions of several types of modifications are included below.
Phosphorylation
Phosphorylation of proteins involves the substitution of a phosphate group for a hydroxyl group in serine, threonine, and tyrosine amino acid residues. Phosphorylation involves a pair of enzymes — one to add the phosphate group (kinase) and another to remove the phosphate group (dephosphorylase).
Cellular signal transduction occurs via a cascading sequence involving multiple kinases. To understand the effect of compounds that disrupt such pathways, it is essential to develop assays that can monitor the activity of many kinases in a single reaction. Traditionally, kinase activity is monitored by measuring incorporation of either radioactive 32P or 33P or fluorescent tags into the kinase-specific substrates. IMAC chemistry can be used to enrich phosphorylated proteins and peptides in complex samples prior to detection by SELDI.
Acetylation and Fatty Acid Acylation
Acetylation and acylation affect the terminal residues of proteins, which typically involves the addition of an acetyl group (CH3CO) to the amino group of the N-terminal residue. This may play an important role in the half-life of proteins, since nonacetylated proteins are rapidly degraded by intracellular
Page 63
proteases. A more complex modification is fatty acid acylation, which is the covalent attachment of a lipid fatty acid group to the N-terminus. This lipid addition anchors the protein to the lipid bilayer of cellular membranes.
Proteolytic Cleavage
Processing can alter the activity of a protein. In the most common form of processing, residues are removed from the C- or N-terminus of a polypeptide by cleavage of the peptide bond in a reaction catalyzed by proteases. Proteolytic cleavage is a common mechanism of activation or inactivation, for example in enzymes involved in blood coagulation digestion. Proteolysis also generates active peptide hormones from larger precursor polypeptides.
Glycosylation
Most glycoproteins contain several different oligosaccharide chains in one molecule. Oligosaccharides are commonly attached to proteins through N- glycosidic linkages to asparagine residues or through O- glycosidic linkages to serine or threonine residues. The isolation and purification of an oligosaccharide bound to a protein can be tedious task because more than one oligosaccharide may be linked to different amino acid sites. In addition, each glycosylation site will normally contain a group of related but structurally different oligosaccharides (known as microheterogeneity). In contrast to protein biosynthesis, no template is used in the synthesis of oligosaccharides. Therefore, microheterogeneity is an inherent characteristic of the sugar chains in glycoproteins.
SELDI can be used for analysis of glycoproteins in several ways:
• Analysis of structural motifs of glycans
• Analysis of the site of attachment of the glycan chain
• Deglycosylation using enzymes
Methods for Studying Proteins
ProteinChip arrays offer the opportunity for rapidly studying proteins using basic principles of ion exchange chromatography. Instead of columns, the chromatographic properties are present on specific ProteinChip arrays. The ProteinChip arrays can typically be used at room temperature, or at a temperature range of 4–37˚C. Some basic principles of ion exchange chromatography are outlined in this section. For more details on using ProteinChip arrays, please refer to Chapter 4 of this volume.
Page 64 Introduction to Protein Biochemistry
ProteinChip Applications Guide, Volume 1: Introductory Guide
Ion Exchange ChromatographyThe amino acids that make up peptides and proteins can be ionized in aqueous solution. The carboxyl and amino groups, as well as any acidic and basic side chains, will become ionized as a function of pH. As a simple guide, both the acidic (i.e., carboxyl) groups and basic (i.e., amino) groups tend to be protonated (COOH, NH3+) at low pH (e.g., pH 2.0). As the pH is raised the carboxyl groups become deprotonated (COO–, NH3+). Further increases in the pH eventually result in deprotonation of the basic groups (COO–, NH2). Thus, the net charge on a protein will vary with pH.
Every protein at a particular pH, called its isoelectric pH or isoelectric point (pI), will contain an equal number of positive and negative charges such that the protein is electrically neutral (i.e., net charge = 0). The pI of a protein depends on the number of acidic and basic functional groups in the protein. The pI decreases with increasing quantity of acidic groups (aspartate, glutamate). By contrast, the pI increases with increasing quantity of basic groups (lysine, arginine, histidine). For example, human serum albumin is a fairly acidic protein with a pI of 4.9; this protein would have a net negative charge in a solution at pH 7.0. By contrast, bovine histone is a fairly basic protein with a pI of 10.8; this protein would have a net positive charge on it in a solution at pH 7.0.
When the pH of a buffer solution is equal to the pI of a protein the net charge on that protein is zero ([COO–] = [NH3+]). At pH values below the pI proteins are positively charged ([COO–] < [NH3+]). By contrast, at pH values above the pI proteins are negatively charged ([COO–] > [NH3+]). These pH-dependent variations in net charge form the basis of ion exchange chromatography. There are two types of ion exchange chromatography:
• Anion exchange chromatography — negatively charged peptides or proteins bind to positive groups coupled to the column matrix
• Cation exchange chromatography — positively charged peptides or proteins bind to negative groups coupled to the column matrix
Net Charge of Protein and Ion Exchange ChromatographyVarious proteins in a mixture will bind an ion exchange column with different affinities, depending on their relative abundance and net charge. Alterations in pH are used to change the net charge on the protein, thus altering its binding affinity. Due to their ionic properties, salts can effectively disrupt the electrostatic interaction between the column and the protein, thus displacing the protein from the column. The proteins are therefore eluted from the column by washing with buffers of altered pH and/or increasing salt concentration. Proteins with lower binding affinity will elute from the column
Page 65
during lower stringency washes. Proteins with higher binding affinity will require more stringent wash conditions (e.g., increasing salt and radically changing pH) to elute.
Consideration of Isoelectric Point (pI) of ProteinsUsing chromatographic ProteinChip arrays can yield information regarding the pI of proteins.
The pI of a protein is simply the pH value at which the protein has no net charge. The pI of a protein will strongly influence how well it binds to ionic ProteinChip arrays. Proteins with a low pI bind strongly to an anion exchange surface (ProteinChip Q10 array). If the pH of the buffer solution is lowered below the pI of the protein, the protein will begin to bear a net positive charge and will bind more weakly to the surface of the array. Proteins with a high pI bind strongly to a cation exchange surface (ProteinChip CM10 array). If the pH of the buffer solution is increased above the pI of the protein, the protein will begin to bear a net negative charge and will bind more weakly to the surface of the array. Proteins with extremely high or extremely low pIs may be purified away from the majority of other proteins by binding to an ionic ProteinChip array in a very high or very low pH buffer.
NOTEBear in mind that other properties of the protein influence binding to ProteinChip array surfaces.
If the pI of the target protein is known, the appropriate anion exchange or cation exchange chemistry is easily chosen. Anion exchange chemistries are typically used for acidic proteins (pI <6). Cation exchange chemistries are typically used for basic proteins (pI >8). For proteins having a near-neutral pI, either type of chemistry may be used, in conjunction with the appropriate pH solution.
Example: Given a mixture of human serum albumin (pI = 4.9) and bovine histone (pI = 10.8) in 20 mM sodium phosphate, pH 7.0, how could the albumin be purified? We know that pH 7.0 is well above the pI for albumin; therefore, the protein will carry a net negative charge. By contrast, pH 7.0 is well below the pI for histone, so this protein will carry a net positive charge.
If the sample were applied to an anion exchange chemistry, the negatively charged albumin would interact with the positively charged functional groups on the surface. In addition, charge repulsion should preclude bovine histone from binding. The albumin could be eluted from the surface by washing with a buffer of pH <4.9, in which the albumin will have a net positive charge.
Page 66 Introduction to Protein Biochemistry
ProteinChip Applications Guide, Volume 1: Introductory Guide
Other Techniques for Studying ProteinsA wide range of methodologies are available for studying proteins, including 2-D gel electrophoresis, sodium dodecyl sulfate – polyacrylamide gel electrophoresis (SDS-PAGE), surface plasmon resonance, and other mass spectrometry techniques. These methods are complementary to SELDI, and a review of these methods is outside the scope of this guide. Please see Bulletins 5459 and 5460 for a convenient listing of products arranged in a work-flow format for Protein Purification and Biomarker Discovery. For a basic introduction to these technologies, refer to Berg et al. (2002).
Proteins That Fly or Don’t Fly
In SELDI, ionization of proteins is a complex process. For ionization to occur, it is important that the analyte actually cocrystallize with the small molecule that serves as the EAM. All EAMs are acidic, i.e., strong proton donors with low pKs. Ionization may occur either during crystal formation and/or upon irradiation with the laser and is influenced by the exact chemical nature of the protein. Some proteins easily accept an added charge while other proteins resist accepting the extra charge.
SELDI analysis requires that ionized proteins “fly” through a vacuum tube in order to obtain time-of-flight (TOF) data. Technically, this flying refers to the fact that the protein must be able to become ionized and undergo a transition from the solid, crystalline phase on the array surface into the gas phase following irradiation with the laser. Certain proteins, especially large proteins with extensive posttranslational modifications, do not ionize or fly well, and are therefore difficult to detect. Improvements in detection for these proteins can involve use of alternative EAMs (see Chapter 5), alternative preparation methods including proteolytic digestions, and negative-ion mode operation of the ProteinChip SELDI reader.

Page 67
Chapter 8: Getting StartedCalibration 69
Normalization 70Normalizing by Total Ion Current (TIC) 70
Quantitation of Peaks in SELDI 70
Calculating the Coefficient of Variance (CV) 71Definitions 71
Collection and Processing of Data 71
Peaks to Use in CV Calculation 72
Calculating CVs using ProteinChip Data Manager Software 72
Reporting CVs 73
Producing High-Resolution Spectral Images 73
Transferring ProteinChip SELDI Data to Excel 74

Page 68 Getting Started
ProteinChip Applications Guide, Volume 1: Introductory Guide
Page 69
Calibration The ProteinChip SELDI reader measures the time-of-flight (TOF) of ions. In order to convert the time measurement to molecular weight (MW) (actually mass to change ratio), it is necessary to calibrate the reader by measuring the flight times of proteins or peptides whose MW are precisely known (calibrants), and creating a best-fit equation (calibration equation) to the standards data. The calibration equation is then used to calculate the MW of unknown species. Because the relationship of TOF and m/z is not linear, it is important that the reader be calibrated with standards in the same mass range as the unknowns to be measured. Also, as in any standard curve, extrapolation (where the unknowns are outside of the range of the standards) will give inherently less accurate results than interpolation.
• Internal calibration refers to a calibration in which the calibrants are added directly to the sample or are spotted on the same array spot as the sample to be analyzed
• External calibration refers to a calibration in which the calibrants are on a different spot or different array than the samples to be analyzed
Internal calibration gives the highest mass accuracy and precision. However, because the MW standards may suppress the signal from proteins in the sample, protein signals may not be quantitative in an internally calibrated sample. Additionally, internally calibrating a large number of spots is very laborious; the standards must be added to each spot and a fresh calibration equation generated for every spot. Typically, internal calibration is used only during peptide mapping for identification of the protein(s) of interest, in which case the highest mass accuracy is required and quantitation is not necessary. External calibration is used for more routine protein profiling applications.
Internal calibration gives the highest mass accuracy and precision. However, because the MW standards may suppress the signal from proteins in the sample, protein signals may not be quantitative in an internally calibrated sample. Additionally, internally calibrating a large number of spots is very laborious; the standards must be added to each spot and a fresh calibration equation generated for every spot. Typically, internal calibration is used only during peptide mapping for identification of the protein(s) of interest, in which case the highest mass accuracy is required and quantitation is not necessary. External calibration is used for more routine protein profiling applications.
More information on calibrating the ProteinChip SELDI reader is found in the ProteinChip data manager software manual. For information on the ProteinChip all-in-one MW standard mixtures sold by Bio-Rad, see the information on ProteinChip all-in-one protein and peptide standards page 46 of this volume.
Page 70 Getting Started
ProteinChip Applications Guide, Volume 1: Introductory Guide
Normalization Normalization is the process of linearly scaling the intensities of a set of spectra to account for spectrum-to-spectrum variations due to differing amounts of overall protein sample, differing amounts of energy absorbing molecules (EAMs) added, degradation over time, or instrument variation.
Normalizing by Total Ion Current (TIC)When an ion strikes the detector in the ProteinChip SELDI reader, it generates an electric current. The sum of the current generated by the detector when a spot is read is the TIC.
The normalization process takes the TIC used for all the spots, averages its intensity, and adjusts the intensity scales for all the spectra. Once a spectrum is normalized, the resulting normalization factor is used in downstream analysis such as biomarker analysis.
Normalizing by TIC works best on samples that produce very similar protein profiles, such as would be expected from multiple samples in a differential expression study. The EAM region of the spectrum is excluded from TIC normalization because the ion current generated by the EAM is in vast excess over that produced by the higher MW peptides.
For information on how to normalize data, see the ProteinChip data manager software manual.
Quantitation of Peaks in SELDI
The amount of protein or peptide captured on a ProteinChip array spot can be quantitated by measuring the peak intensity. Because mass spectral data is inherently noisy, peak intensity (rather than peak area) normally gives the most reproducible quantitation. For absolute quantitation, a standard dose response curve must be made with the protein or peptide to be quantitated in the same sample background (to keep any ion suppression effects constant). For relative quantitation, i.e., looking for up-or-down regulation in sets of samples, a standard curve is not necessary.
All peaks in a quantitative analysis (both standards and unknowns) must be in the linear portion of a dose-response curve, i.e., increasing the amount of peptide or protein on the spot yields an increase in signal. In general, this requires that, before normalization, a peak have a signal-to-noise ratio (S/N) of at least 5, and an intensity value between 100 to 1000 µA. For peaks of higher intensity, some of the individual transients (which are summed up to make the spectrum) may be off-scale, and therefore the total peak intensity will no longer accurately reflect the amount of protein on the surface.
Page 71
Calculating the Coefficient of Variance (CV)
The standard range of error for data acquired using SELDI compares very favorably with 2-D gels and other types of mass spectrometry-based methods. The range is typically 5–25%. For best results, it is recommended that replicates are included and that the samples are applied to the ProteinChip arrays in a ProteinChip bioprocessor. Improvements in reproducibility can be achieved by making batch dilutions of the sample and by washing consistently. Significant improvements can be achieved by using fluid-handling robotics systems, such as the Beckman Coulter Biomek 3000.
DefinitionsThe CV of a series of data points is defined as the standard deviation of the series divided by the mean of the series.
Degrees of freedom (df) for the CV associated with each peak are calculated as the number of replicates –1.
Instead of calculating an average CV across multiple peaks, a better estimate is the pooled CV (CVp), which is defined as:
where CV is the CV for each peak used and k is the number of peaks. This formula is valid as long as each CV is based on the same number of replicates.
Total df for CVp equals the sum of the df for all peaks used in the CV calculation.
Collection and Processing of DataFor the inclusion of a data point into the calculation of CV, the data point must be generated using the same experimental conditions, and ideally, data collected using similar instrumentation settings.
• Automatic baseline correction should be used as a first choice. However, if it is apparent that automatic baseline correction does not represent a true estimate of the baseline, use a manual setting of between 5 and 10
• Data filtering should be set as the default (0.2 times expected peak width)
• Set the start for calculating local Noise to the mass (in D) where matrix attenuation stops
• The Signal Enhance feature should not be used
• Data should be normalized using Total Ion Current. TIC calculation should be done using a start setting (in D) not less than the EAM saturation point of any one of the spectra. As a general guideline,
CVp
CV12 CV2
2 CVk2+ +( )
k
--------------------------------------------------------=
Page 72 Getting Started
ProteinChip Applications Guide, Volume 1: Introductory Guide
identify the spectra within the series that has the greatest range of EAM saturation. Using this spectrum, determine the mass at which the detector represents an intensity value of 50. Use this mass as the start setting (in D) for TIC normalization across the series
• For simple mixtures (e.g., one or two peaks present in the sample), the sum of the ion currents of the peaks to be included in CV calculation should not contribute to more than 5% of the TIC
Peaks to Use in CV Calculation• Detection of peaks within spectra can be done either automatically or
manually. If automatic detection is used, all peaks used in the calculation of the CV must be manually inspected to ensure that the peak-picking algorithm has calculated the centroid of the peak correctly
• Peaks used for the calculation of CV should have a S/N of 5 or greater and a maximum intensity value of 50 before background subtraction and normalization
• For the calculation of CVs across the mass ranges, there is no maximum number of peaks that should be used. It is better to use more peaks in the calculation, but avoid using peaks that are not well resolved
Calculating CVs using ProteinChip Data Manager Software ProteinChip data manager software has the ability to automatically calculate CVs for specific peaks using the clustering feature.
• To detect peaks manually — use the centroid all cursor to select the target peaks in the folder. Generate clusters using the Cluster only user-detected peaks mode in the Cluster wizard.
• To detect peaks automatically — generate clusters on spectra that do not contain detected peaks. Set the Cluster wizard to Automatically detect peaks to cluster. You may want to adjust the signal-to-noise ratios, as well as the mass range.
Once the clusters are generated for each peak, the CVs are displayed (in addition to other statistics) in the cluster table.
To calculate pooled CVs, the CV column can be copied and pasted into Excel. After collection, processing and labeling of all peaks to be used in the CV calculation, the relevant data should be exported into Excel. Data to be exported should include peak number, mass and intensity.
Page 73
Reporting CVs• CV of a single peak — To report the CV of a single peak, calculate the
CV as a percent (%CV) and also report the df for that peak. For multiple peaks, a CV table can be generated showing each individual CV and corresponding df. For an example see Figure 8.1.
• Combining the CVs of several peaks to determine a CVp across a mass range — Calculate and report separate CVp values for the low (less than 20 kD) and high (greater than 20 kD) mass ranges.
NOTECalculating a single CVp value across low and high mass ranges is not appropriate.
• Reporting pooled CV value for either the low or high mass range —Calculate the CVp as a percent and also report the total df.
Producing High-Resolution Spectral Images
Cutting and pasting spectra into other programs are appropriate for electronic presentation of data, but for printed publications, higher resolution images are needed. The following is a procedure for saving data that produces high resolution output. Following these steps will create an encapsulated PostScript (EPS) file that can be used in PostScript-based programs such as Adobe® Illustrator.
1. Install a PostScript printer driver on the PC you are using. You can download one from Adobe at: www.adobe.com/products/printerdrivers/windows.html/
2. Install it as a local printer. Connect the printer to the port named FILE.
3. In the program you are using to create the graphics, select Printer Setup from the File menu, and then select Generic PostScript Printer.
4. Click on the Properties tab and then select the Advanced Options tab.
5. Press the plus sign (+) next to PostScript Options, located under Document Options. On the PostScript Output Option, select Encapsulated PostScript (EPS).
6. Now select Print and in the print dialog box check Print to File. Change the extension of the file from .prn to .eps.
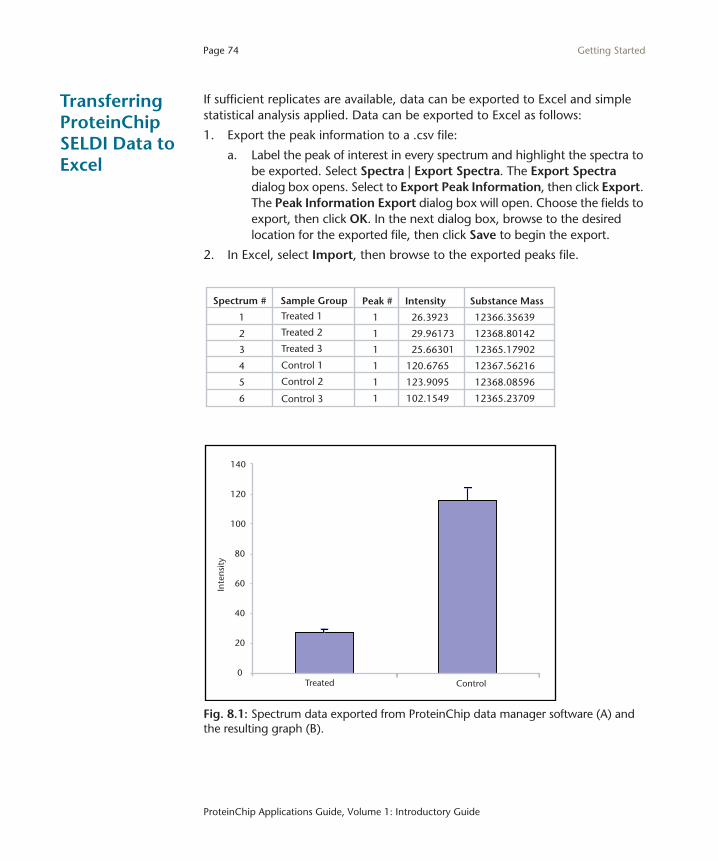
Page 74 Getting Started
ProteinChip Applications Guide, Volume 1: Introductory Guide
Transferring ProteinChip SELDI Data to Excel
If sufficient replicates are available, data can be exported to Excel and simple statistical analysis applied. Data can be exported to Excel as follows:
1. Export the peak information to a .csv file:
a. Label the peak of interest in every spectrum and highlight the spectra to be exported. Select Spectra | Export Spectra. The Export Spectra dialog box opens. Select to Export Peak Information, then click Export. The Peak Information Export dialog box will open. Choose the fields to export, then click OK. In the next dialog box, browse to the desired location for the exported file, then click Save to begin the export.
2. In Excel, select Import, then browse to the exported peaks file.
Fig. 8.1: Spectrum data exported from ProteinChip data manager software (A) and the resulting graph (B).
Sample GroupSpectrum # Peak # Intensity Substance Mass
Control 1
1 1 26.3923 12366.35639
Control 2
2 1 29.96173 12368.80142
Control 3
3 1 25.66301 12365.17902
Treated 1
4 1 120.6765 12367.56216
Treated 2
5 1 123.9095 12368.08596
Treated 3
6 1 102.1549
ControlTreated
Inte
nsity
12365.23709
140
120
100
80
60
40
20
0
Page 75
Appendix A: References and Additional Resources
ResourcesFor more detailed information on hardware and software components of the ProteinChip SELDI system, please refer to the following manuals
• ProteinChip SELDI System: Reader Guide
• ProteinChip Data Manager 3.0 Software Manual
• ProteinChip Pattern Analysis Software 5.0 User Guide
Further Reading1. Merchant, M. and Weinberger, S.R., Recent advancements in surface-
enhanced laser desorption/ionization-time of flight-mass spectrometry. Electrophoresis, 21:1164–1177, citation 18 (2000)
2. Weinberger, S.R., Dalmasso, E.A. and Fung, E.T. Current achievements using ProteinChip array Technology, Curr Opin Chem Biol, 6: 86–91 (2001)
3. Weinberger, S.R., Boschetti, E., Santambien, P.,and Brenac, V.J., Surface-enhanced laser desorption-ionization retentate chromatography™ mass spectrometry (SELDI-RC-MS): a new method for rapid development of process chromatography conditions, Chromatog, 782: 307–316 (2002)
4. Tang, N., Tornatore, P., and Weinberger, S.R., Current Developments In SELDI Affinity Technology, Mass Spec Rev, 23: 34–44 (2004)
5. Wiesner, A., Detection of Tumor Markers with ProteinChip Technology, Curr Pharma Biotechnol, 5: 45–67 (2004)
6. Bruenner, B.A. et al., Quantitative analysis of oligonucleotides by matrix-assisted laser desorption/ionization mass spectrometry, Rapid Common Mass Spectrom 10, 1797-801 (1996)
7. Berg, et al., Biochemistry, 5th edn, WH Freeman and Co (2002)

Page 76
ProteinChip Applications Guide, Volume 1: Introductory Guide
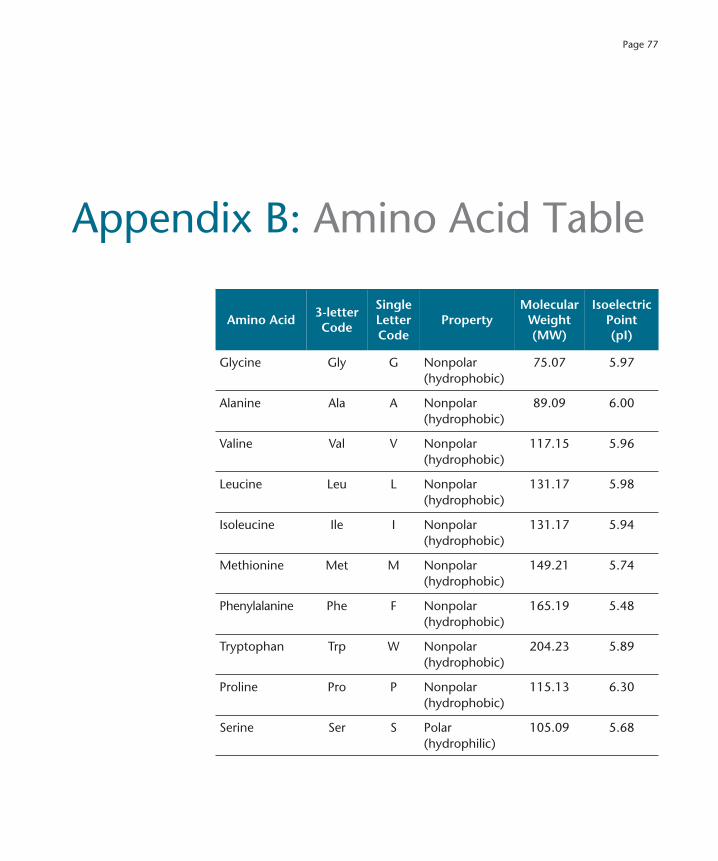
Page 77
Appendix B: Amino acid table
Appendix B: Amino Acid Table
Amino Acid3-letterCode
SingleLetterCode
PropertyMolecular
Weight (MW)
IsoelectricPoint(pI)
Glycine Gly G Nonpolar(hydrophobic)
75.07 5.97
Alanine Ala A Nonpolar(hydrophobic)
89.09 6.00
Valine Val V Nonpolar (hydrophobic)
117.15 5.96
Leucine Leu L Nonpolar (hydrophobic)
131.17 5.98
Isoleucine Ile I Nonpolar (hydrophobic)
131.17 5.94
Methionine Met M Nonpolar (hydrophobic)
149.21 5.74
Phenylalanine Phe F Nonpolar (hydrophobic)
165.19 5.48
Tryptophan Trp W Nonpolar (hydrophobic)
204.23 5.89
Proline Pro P Nonpolar (hydrophobic)
115.13 6.30
Serine Ser S Polar(hydrophilic)
105.09 5.68
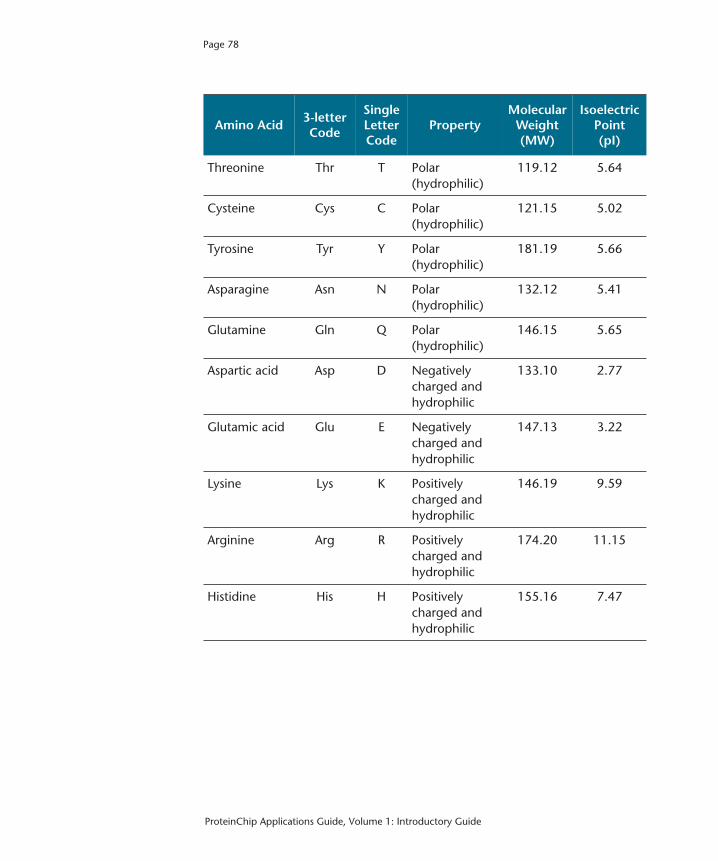
Page 78
ProteinChip Applications Guide, Volume 1: Introductory Guide
Threonine Thr T Polar(hydrophilic)
119.12 5.64
Cysteine Cys C Polar(hydrophilic)
121.15 5.02
Tyrosine Tyr Y Polar(hydrophilic)
181.19 5.66
Asparagine Asn N Polar(hydrophilic)
132.12 5.41
Glutamine Gln Q Polar(hydrophilic)
146.15 5.65
Aspartic acid Asp D Negatively charged and hydrophilic
133.10 2.77
Glutamic acid Glu E Negatively charged and hydrophilic
147.13 3.22
Lysine Lys K Positively charged and hydrophilic
146.19 9.59
Arginine Arg R Positively charged and hydrophilic
174.20 11.15
Histidine His H Positively charged and hydrophilic
155.16 7.47
Amino Acid3-letterCode
SingleLetterCode
PropertyMolecular
Weight (MW)
IsoelectricPoint(pI)
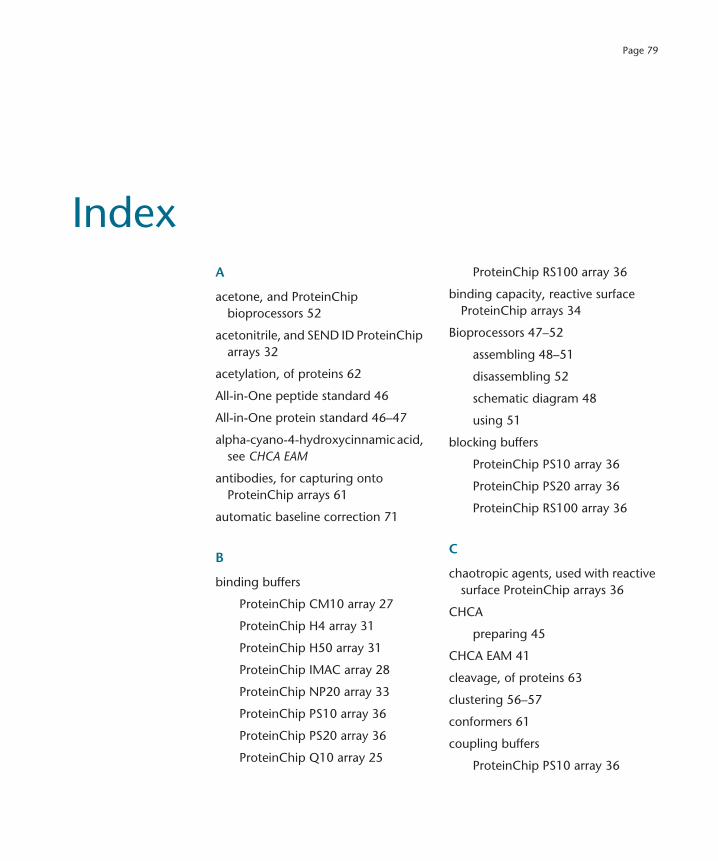
Page 79
IndexA
acetone, and ProteinChip bioprocessors 52
acetonitrile, and SEND ID ProteinChip arrays 32
acetylation, of proteins 62
All-in-One peptide standard 46
All-in-One protein standard 46–47
alpha-cyano-4-hydroxycinnamic acid, see CHCA EAM
antibodies, for capturing onto ProteinChip arrays 61
automatic baseline correction 71
B
binding buffers
ProteinChip CM10 array 27
ProteinChip H4 array 31
ProteinChip H50 array 31
ProteinChip IMAC array 28
ProteinChip NP20 array 33
ProteinChip PS10 array 36
ProteinChip PS20 array 36
ProteinChip Q10 array 25
ProteinChip RS100 array 36
binding capacity, reactive surface ProteinChip arrays 34
Bioprocessors 47–52
assembling 48–51
disassembling 52
schematic diagram 48
using 51
blocking buffers
ProteinChip PS10 array 36
ProteinChip PS20 array 36
ProteinChip RS100 array 36
C
chaotropic agents, used with reactive surface ProteinChip arrays 36
CHCA
preparing 45
CHCA EAM 41
cleavage, of proteins 63
clustering 56–57
conformers 61
coupling buffers
ProteinChip PS10 array 36
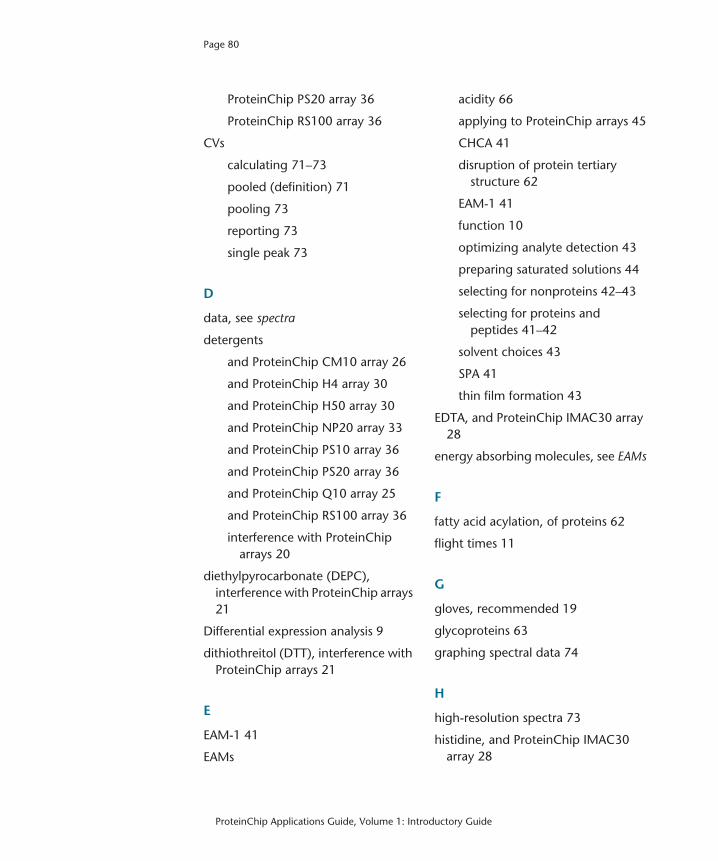
Page 80
ProteinChip Applications Guide, Volume 1: Introductory Guide
ProteinChip PS20 array 36
ProteinChip RS100 array 36
CVs
calculating 71–73
pooled (definition) 71
pooling 73
reporting 73
single peak 73
D
data, see spectra
detergents
and ProteinChip CM10 array 26
and ProteinChip H4 array 30
and ProteinChip H50 array 30
and ProteinChip NP20 array 33
and ProteinChip PS10 array 36
and ProteinChip PS20 array 36
and ProteinChip Q10 array 25
and ProteinChip RS100 array 36
interference with ProteinChip arrays 20
diethylpyrocarbonate (DEPC), interference with ProteinChip arrays 21
Differential expression analysis 9
dithiothreitol (DTT), interference with ProteinChip arrays 21
E
EAM-1 41
EAMs
acidity 66
applying to ProteinChip arrays 45
CHCA 41
disruption of protein tertiary structure 62
EAM-1 41
function 10
optimizing analyte detection 43
preparing saturated solutions 44
selecting for nonproteins 42–43
selecting for proteins and peptides 41–42
solvent choices 43
SPA 41
thin film formation 43
EDTA, and ProteinChip IMAC30 array 28
energy absorbing molecules, see EAMs
F
fatty acid acylation, of proteins 62
flight times 11
G
gloves, recommended 19
glycoproteins 63
graphing spectral data 74
H
high-resolution spectra 73
histidine, and ProteinChip IMAC30 array 28

Page 81
hydrophobic surface ProteinChip array, see ProteinChip H4 array
I
imidazole, and IMAC surface selectivity 28
immobilized metal affinity capture (IMAC) ProteinChip arrays, see ProteinChip IMAC30 array
ion - exchange chromatography 64
isoelectric points (pI) 65
L
laser, function in ProteinChip SELDI reader 10
M
multichannel pipettors, use with ProteinChip array 19
N
normal phase ProteinChip arrays, see ProteinChip NP20 array
normalization, of spectra 70
O
organic solvents
and ProteinChip H4 array 30
and ProteinChip H50 array 30
increasing surface selectivity of ProteinChip arrays 30
P
peak intensity, of spectra 70
peaks, clustering 56–57
phosphorylation, of proteins 62
pI (isoelectric point) 65
polyethelene glycol (PEG), interference with ProteinChip arrays 21
polypeptides 61
pooled CV 71
preactivated surface ProteinChip arrays, see ProteinChip PS10 array, ProteinChip PS20 array and ProteinChip RS100 array
ProteinChip array
salt interference 21
ProteinChip arrays
applying EAMs 45
assembling into bioprocessors 48–51
detergent interference 20
diethyl pyrocarbonate (DEPC) interference 21
dithiothreitol (DTT) interference 21
effects of SDS 20
general notes on use 19–20
polyethelene glycol (PEG) interference 21
spot configurations 19
spot moisture 19
table of functionalities and uses 22–23
Page 82
ProteinChip Applications Guide, Volume 1: Introductory Guide
ProteinChip bioprocessors
solvents 52
ProteinChip CM10 array 26–27
and detergents 26
and salts 27
applications 22
binding and wash buffers 27
for proteins with high pI 65
hydrophobic barrier 26
increasing binding selectivity 27
surface chemistry 22
ProteinChip data manager software 15, 55–56
ProteinChip H4 array 29–31
and detergents 30
and organic solvents 30
and salts 30
applications 23, 29
binding and wash buffers 31
increasing surface selectivity 30
prewetting 30
surface chemistry 23, 29
surface chemistry diagram 30
ProteinChip H50 array 29–31
and detergents 30
and organic solvents 30
and salts 30
applications 23, 29
binding and wash buffers 31
increasing surface selectivity 30
prewashing to increase reproducibility 30
prewetting 30
surface chemistry 23, 29
surface chemistry diagram 30
ProteinChip IMAC array
binding and wash buffers 28
ProteinChip IMAC30 array 27–29
applications 22
binding and wash buffers 28
increasing surface selectivity 28
metal loading before use 28
surface chemistry 22
surface chemistry diagram 28
ProteinChip NP20 array 33
and detergents 33
and salts 33
applications 24
binding buffers 33
prerinsing 33
surface chemistry 24
surface chemistry diagram 33
ProteinChip pattern analysis software 57
ProteinChip PS10 array 34–37
and detergents 36
and salts 36
applications 24
binding buffers 36
binding capacity 34
blocking buffers 36
coupling buffers 36
increasing surface selectivity 36
Page 83
surface chemistry 24
surface chemistry diagram 35
wash buffers 36
ProteinChip PS20 array 34–37
and detergents 36
and salts 36
applications 24
binding buffers 36
binding capacity 34
blocking buffers 36
coupling buffers 36
increasing surface selectivity 36
surface chemistry 24
surface chemistry diagram 35
wash buffers 36
ProteinChip Q10 array 24–25
and detergents 25
and salts 25
applications 22
binding and wash buffers 25
for proteins with low pI 65
increasing binding selectivity 25
surface chemistry 22
surface chemistry diagram 25
ProteinChip RS100 array 34–37
and detergents 36
and salts 36
applications 24
binding buffers 36
binding capacity 34
blocking buffers 36
coupling buffers 36
increasing surface selectivity 36
surface chemistry 24
surface chemistry diagram 35
wash buffers 36
ProteinChip SELDI reader, laser function 10
ProteinChip SELDI system
components 15
software 15
ProteinChip SEND ID array 31–33
applications 23
reduced chemical noise 32
sample preparation 32
sodium contamination 32
surface chemistry 23
surface chemistry diagram 32
proteins
acetylation 62
cleavage 63
conformers 61
factors affecting tertiary structure 61
fatty acid acylation 62
flying 66
general biochemistry 61–63
glycosylation 63
ion - exchange chromatography 64
isoelectric points (pI) 65
native vs. denatured 61–62
phosphorylation 62
Page 84
ProteinChip Applications Guide, Volume 1: Introductory Guide
polypeptides 61
posttranslational modification 62–63
prosthetic groups 61
quantitating 70
quaternary structure 61
selecting appropriate EAMs 41–42
subunits 61
tertiary structure disruption by EAMs 62
R
reversed-phase ProteinChip arrays, see ProteinChip H50 array
robotics systems, use with ProteinChip arrays 19
S
salts
and EAMs 43
and ProteinChip CM10 array 27
and ProteinChip H4 array 30
and ProteinChip H50 array 30
and ProteinChip NP20 array 33
and ProteinChip PS10 array 36
and ProteinChip PS20 array 36
and ProteinChip Q10 array 25
and ProteinChip RS100 array 36
interference with ProteinChip array 21
SDS, interference with ProteinChip arrays 20
SELDI
calculating CVs 71–73
detecting covalently - attached protein prosthetic groups 61
detecting protein posttranslational modifications 62–63
flight times of proteins 11
flying proteins 66
four basic steps 7
overview 7–11
primer diagram 8
quantitating proteins 70
spectra normalization 70
time-of-flight (TOF) 11
time-of-flight mass spectrometry (diagram) 7
sinapinic acid (SPA) EAM 41
sodium, and ProteinChip SEND ID array 32
spectra
automatic baseline correction 71
calculating CVs 71–73
CV of single peak 73
detecting peaks 72
exporting as encapsulated PostScript (EPS) files 73
graphing 74
high-resolution 73
normalization 70
peak intensity 70
strong anion exchange ProteinChip arrays, see ProteinChip Q10 array
Page 85
subunits, protein 61
surface enhanced neat desorption ProteinChip arrays, see ProteinChip SEND ID array
T
time-of-flight (TOF) 11
time-of-flight mass spectrometry (diagram) 7
W
wash buffers
ProteinChip CM10 array 27
ProteinChip H4 array 31
ProteinChip H50 array 31
ProteinChip IMAC array 28
ProteinChip PS10 array 36
ProteinChip PS20 array 36
ProteinChip Q10 array 25
ProteinChip RS100 array 36
weak anion exchange ProteinChip arrays, see ProteinChip CM10 array

Page 86
ProteinChip Applications Guide, Volume 1: Introductory Guide

Life ScienceGroup
06-0054 0207 Sig 1106Bulletin 10008221 US/EG Rev B
Bio-Rad Laboratories, Inc.
Web site www.bio-rad.com USA 800 4BIORAD Australia 61 02 9914 2800 Austria 01 877 89 01 Belgium 09 385 55 11 Brazil 55 21 3237 9400 Canada 905 712 2771 China 86 21 6426 0808 Czech Republic 420 241 430 532 Denmark 44 52 10 00 Finland 09 804 22 00 France 01 47 95 69 65 Germany 089 318 84 0 Greece 30 210 777 4396 Hong Kong 852 2789 3300 Hungary 36 1 455 8800 India 91 124 4029300 Israel 03 963 6050 Italy 39 02 216091 Japan 03 5811 6270 Korea 82 2 3473 4460 Mexico 52 555 488 7670 The Netherlands 0318 540666 New Zealand 0508 805 500 Norway 23 38 41 30 Poland 48 22 331 99 99 Portugal 351 21 472 7700 Russia 7 495 721 14 04 Singapore 65 6415 3188 South Africa 27 861 246 723 Spain 34 91 590 5200 Sweden 08 555 12700 Switzerland 061 717 95 55 Taiwan 886 2 2578 7189 United Kingdom 020 8328 2000