Embed Size (px)
Citation preview
V1
Protein Energy Malnutrition
Facilitator:
Dr. NAVPREET Assistant Professor of Community Medicine Govt. Medical College & Hospital, Chandigarh.
Specific Learning Objectives
• At the end of session, the learner shall be able to:
Understand the concept of PEM.
Describe factors associated with PEM.
Classify PEM.
Take preventive measures for PEM.
Introduction
• Malnutrition is a range of conditions occurring when intake of one or more nutrients doesn’t meet the requirements.
• PEM is an important nutritional problem among preschool age children.
• The main cause of PEM is food inadequacy.
• PEM was earlier attributed to the concept of ‘protein gap’ (deficiency of proteins in diet).
• ‘Food gap’ is the chief cause of PEM
it is not only the deficiency of proteins but inappropriate food (low in energy density, protein and micronutrients ‐ Vitamin A, Iron, Zinc)
poor both quantitatively and qualitatively.
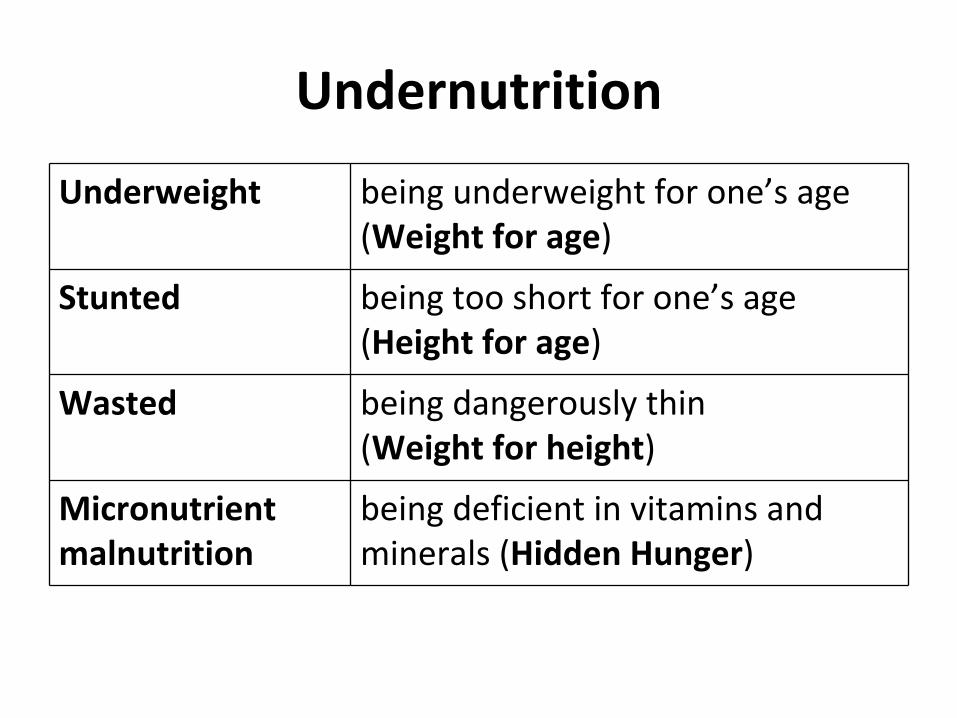
Undernutrition
Underweight being underweight for one’s age (Weight for age)
Stunted being too short for one’s age (Height for age)
Wasted being dangerously thin (Weight for height)
Micronutrient being deficient in vitamins and malnutrition minerals (Hidden Hunger)
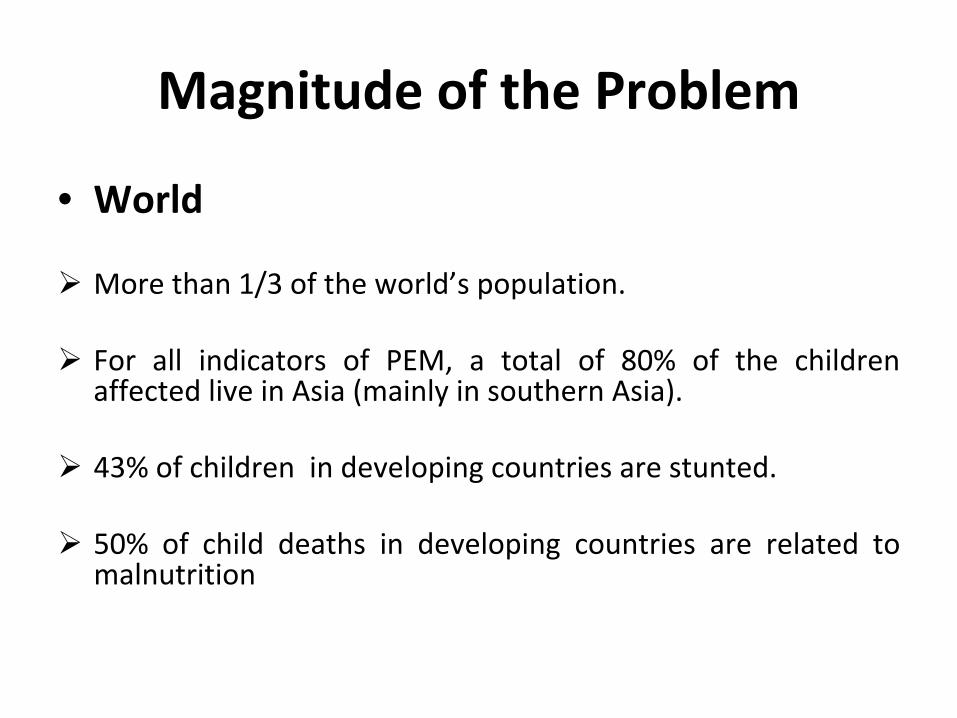
Magnitude of the Problem
• World
More than 1/3 of the world’s population.
For all indicators of PEM, a total of 80% of the children affected live in Asia (mainly in southern Asia).
43% of children in developing countries are stunted.
50% of child deaths in developing countries are related to malnutrition
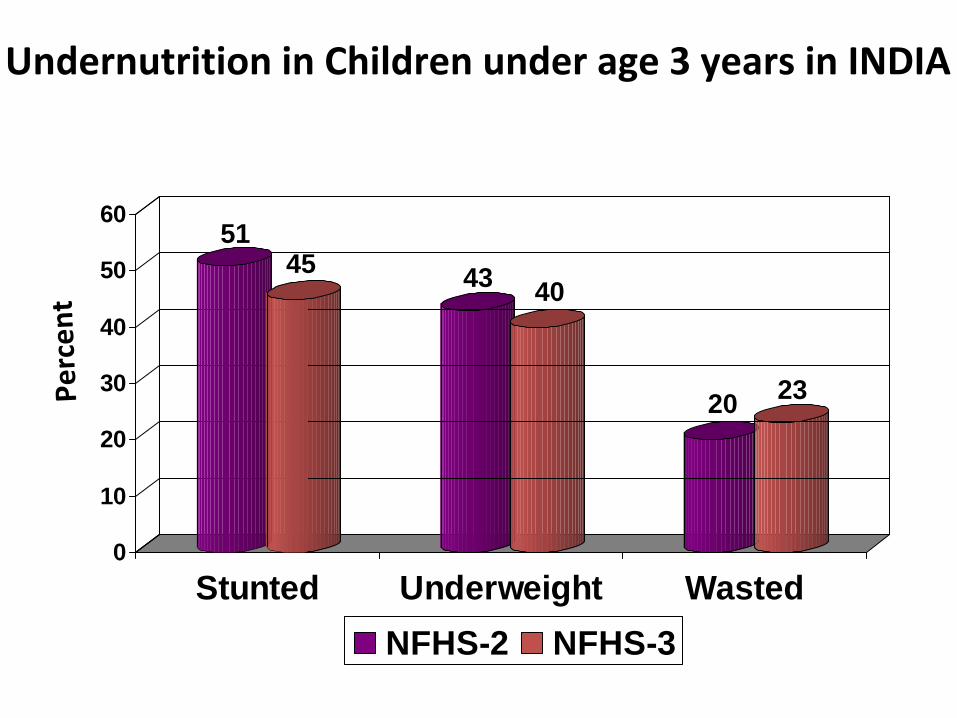
Undernutrition in Children under age 3 years in INDIA
51 45 43 40
20 23
0
10
20
30
40
50
60
Percen
t
Stunted Underweight Wasted NFHS-2 NFHS-3
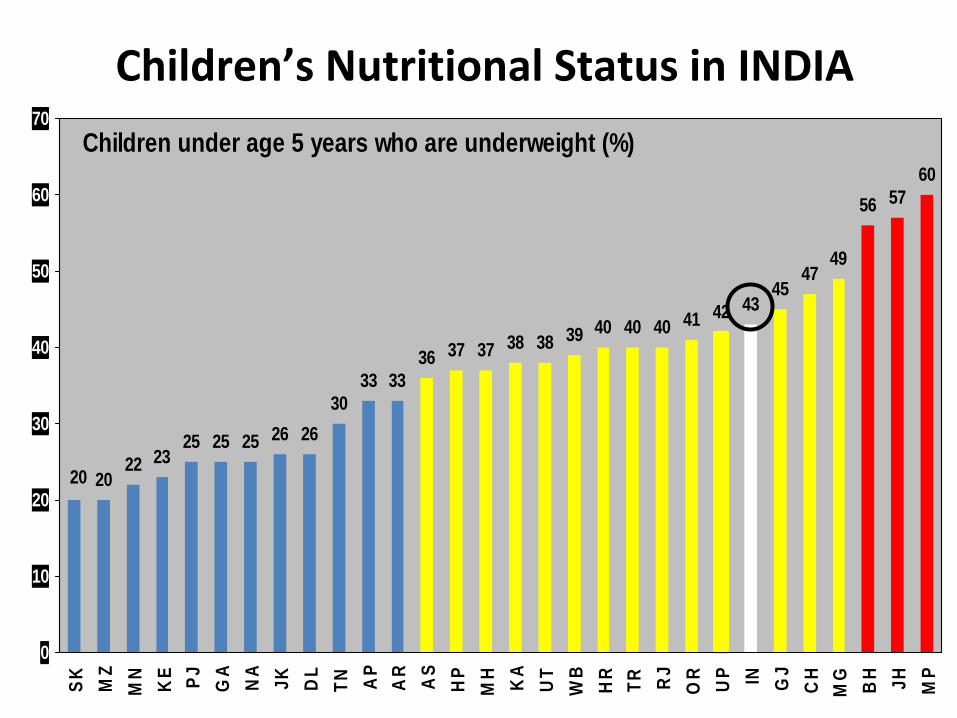
Children’s Nutritional Status in INDIA
10
20
30
40
50
60
70 Children under age 5 years who are underweight (%)
20 22 23
25 25 25 26 26 30
33 33 36 37 37 38 38 39 40 40 40 41 42 43
45 47
49
56 57 60
20
SK MZ
MN KE PJ GA
NA JK DL
TN AP
AR AS
HP
MH KA
UT
WB
HR TR RJ
OR UP IN GJ
CH
MG BH JH MP
0
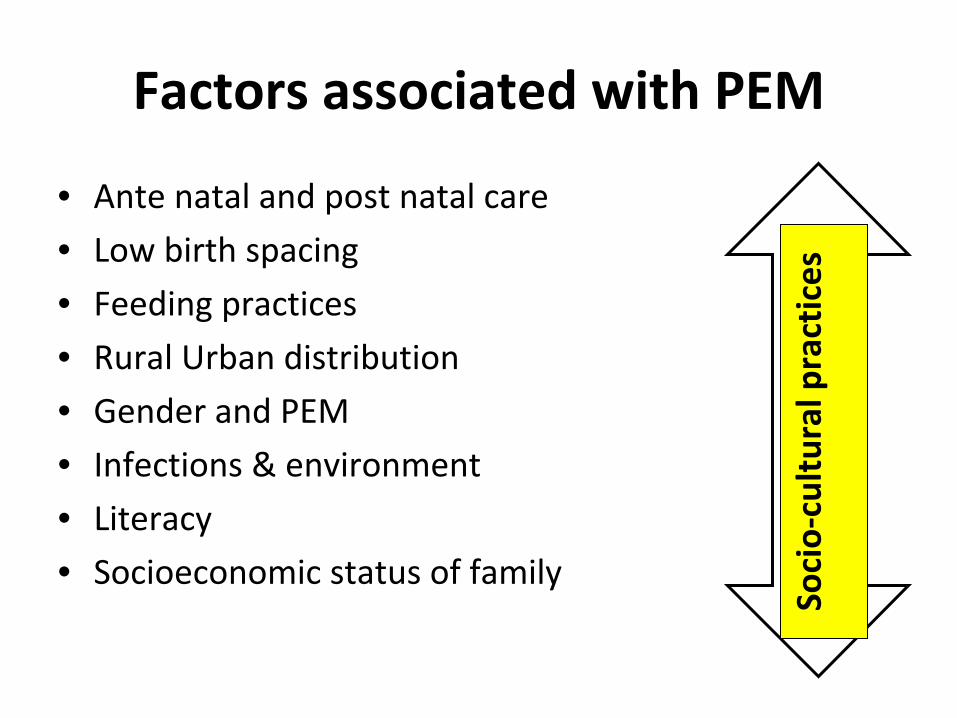
Factors associated with PEM
• Ante natal and post natal care
• Low birth spacing
• Feeding practices
• Rural Urban distribution
• Gender and PEM
• Infections & environment
• Literacy
• Socioeconomic status of family
Socio‐cultural
practices
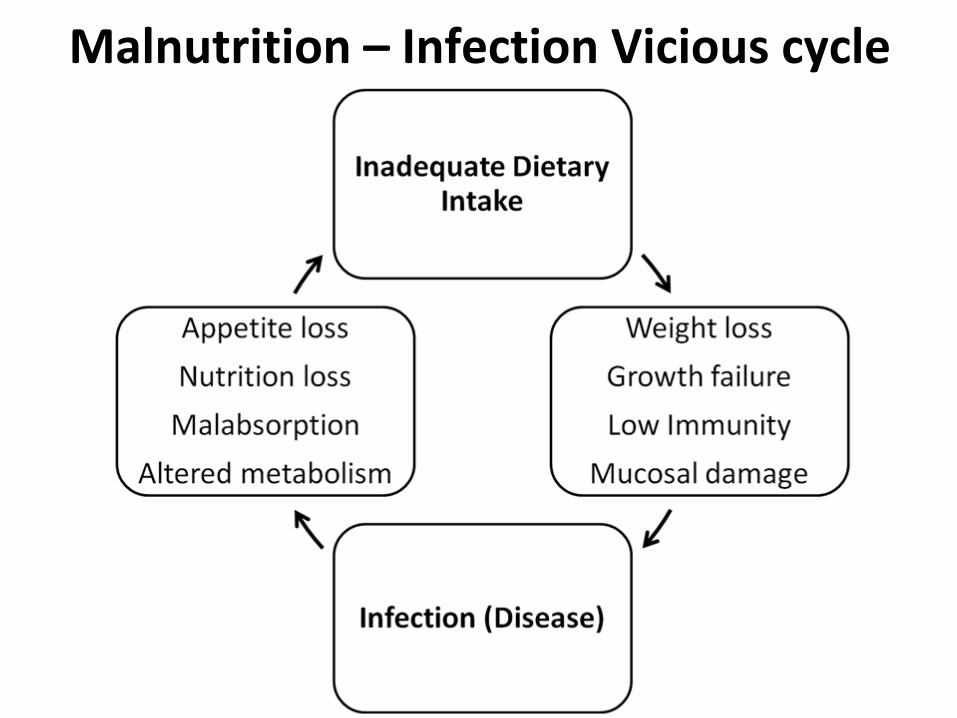
Malnutrition – Infection Vicious cycle
Classification of PEM
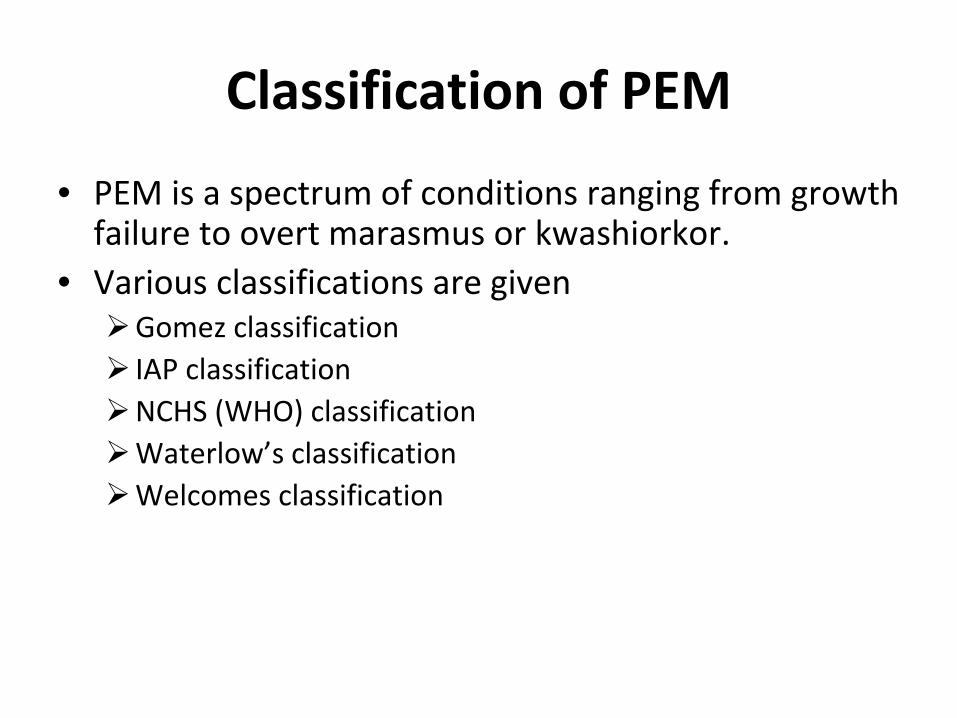
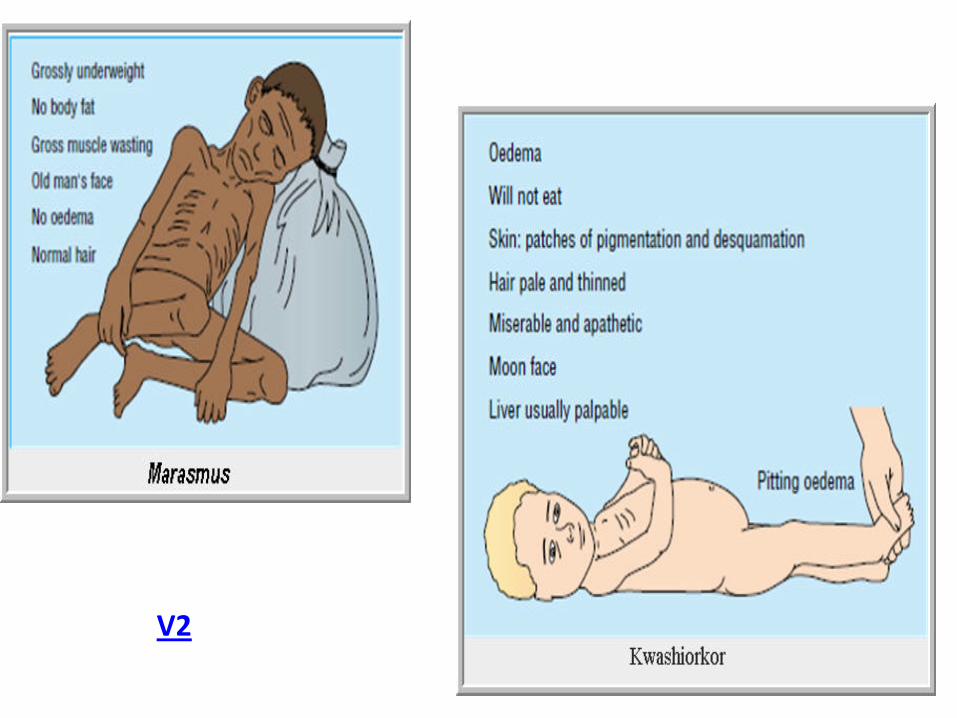
• PEM is a spectrum of conditions ranging from growth failure to overt marasmus or kwashiorkor.
• Various classifications are given Gomez classification IAP classification NCHS (WHO) classification Waterlow’s classification Welcomes classification
Gomez classification
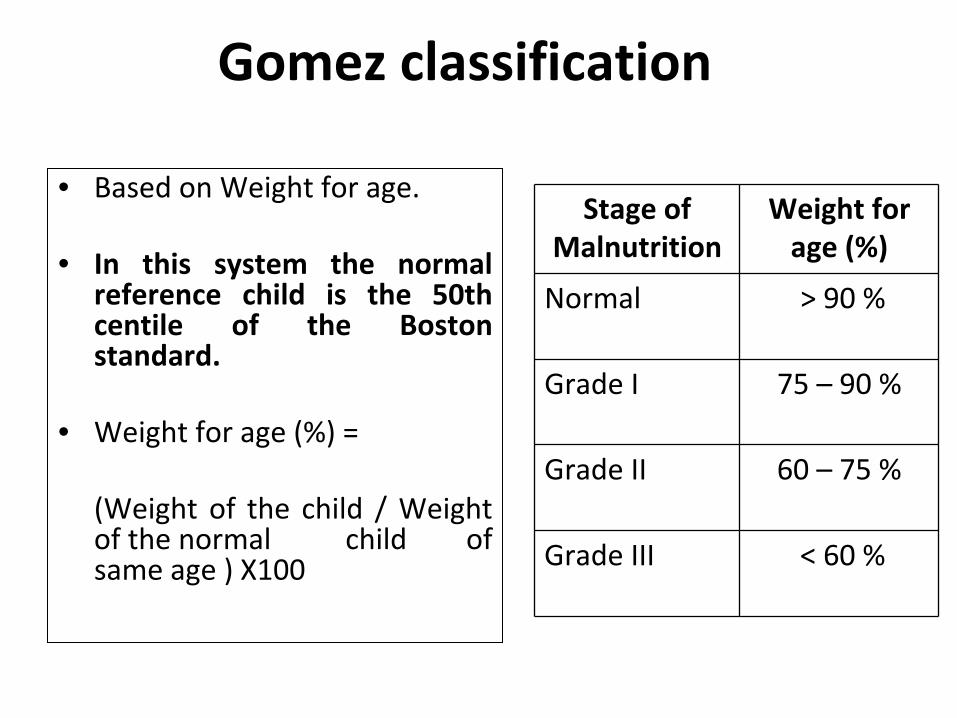
• Based on Weight for age.
• In this system the normal reference child is the 50th centile of the Boston standard.
• Weight for age (%) =
(Weight of the child / Weight of the normal child of same age ) X100
Stage of Malnutrition
Weight for age (%)
Normal > 90 %
Grade I 75 – 90 %
Grade II 60 – 75 %
Grade III < 60 %
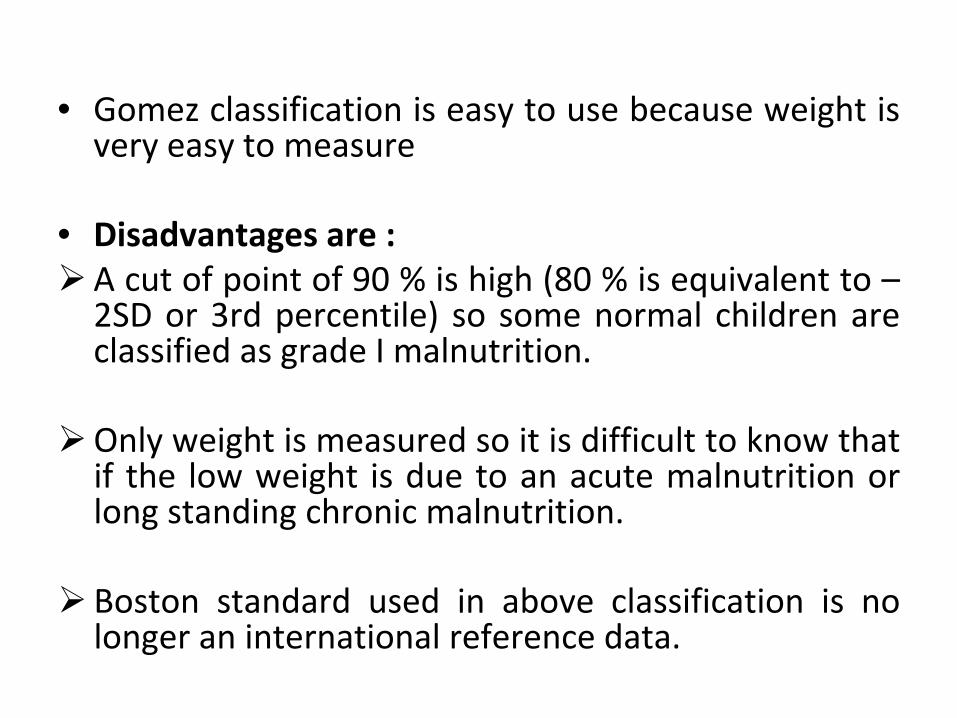
• Gomez classification is easy to use because weight is very easy to measure
• Disadvantages are : A cut of point of 90 % is high (80 % is equivalent to – 2SD or 3rd percentile) so some normal children are classified as grade I malnutrition.
Only weight is measured so it is difficult to know that if the low weight is due to an acute malnutrition or long standing chronic malnutrition.
Boston standard used in above classification is no longer an international reference data.
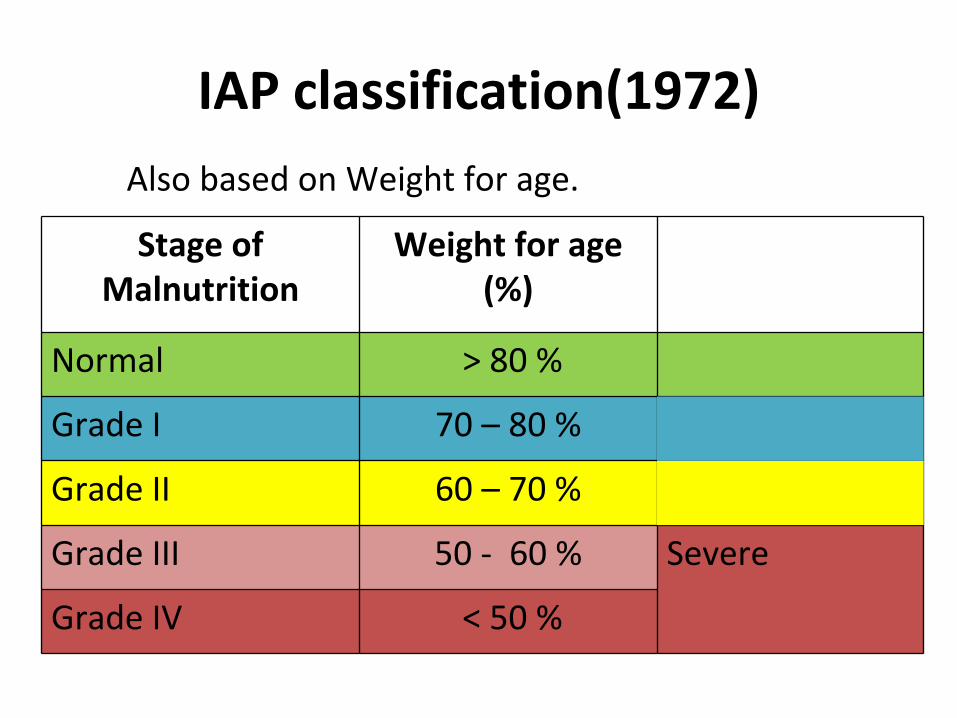
IAP classification(1972) Also based on Weight for age.
Stage of Weight for age Malnutrition (%)
Normal > 80 %
Grade I 70 – 80 % Mild
Grade II 60 – 70 %
Grade III 50 ‐ 60 % Severe
Grade IV < 50 %
Moderate
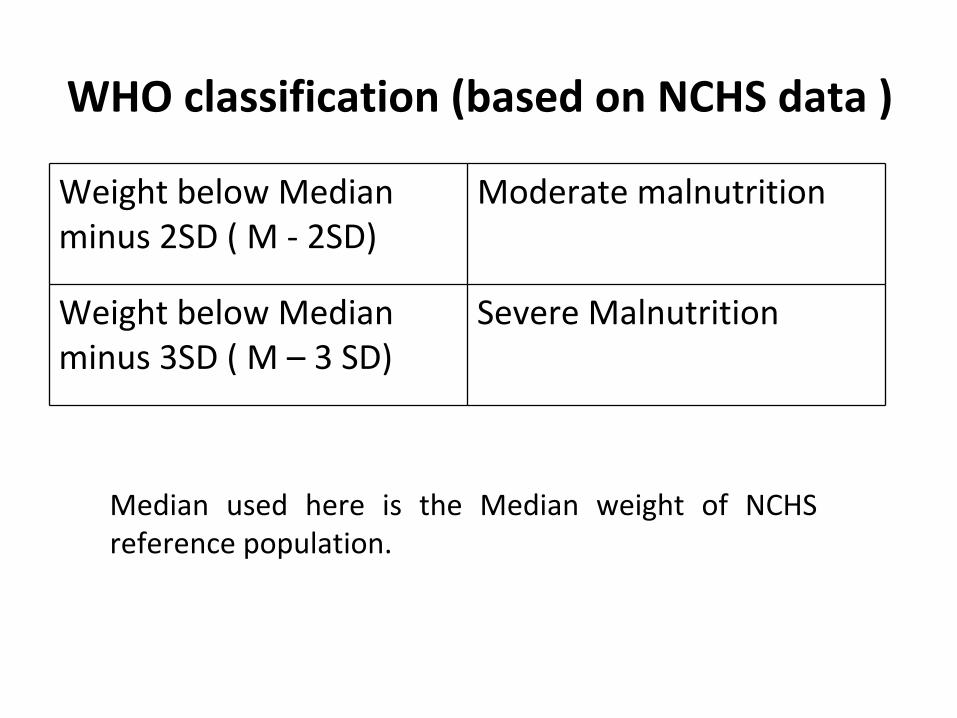
WHO classification (based on NCHS data )
Weight below Median minus 2SD ( M ‐ 2SD)
Moderate malnutrition
Weight below Median minus 3SD ( M – 3 SD)
Severe Malnutrition
Median used here is the Median weight of NCHS reference population.
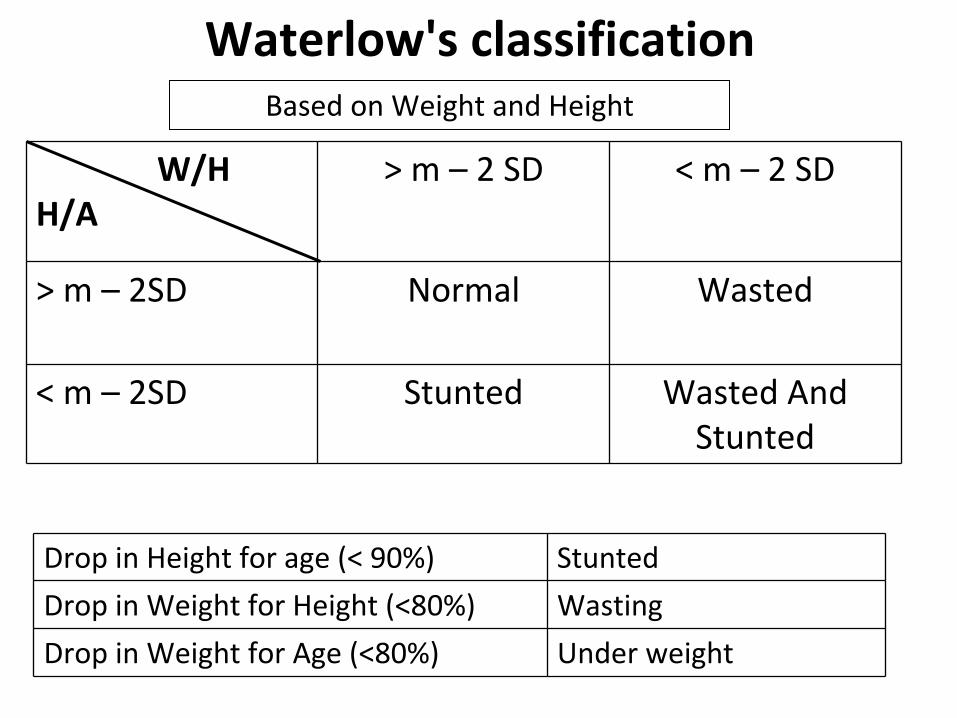
Waterlow's classification Based on Weight and Height
W/H H/A
> m – 2 SD < m – 2 SD
> m – 2SD Normal Wasted
< m – 2SD Stunted Wasted And Stunted
Drop in Height for age (< 90%) Stunted
Drop in Weight for Height (<80%) Wasting
Drop in Weight for Age (<80%) Under weight
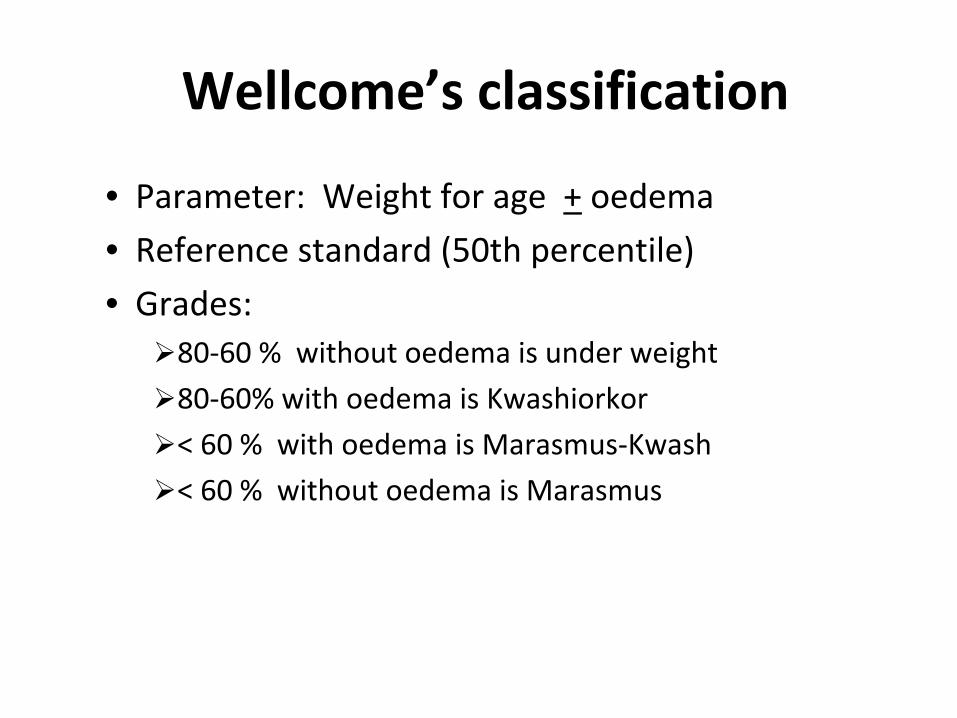
Wellcome’s classification
• Parameter: Weight for age + oedema
• Reference standard (50th percentile)
• Grades: 80‐60 % without oedema is under weight
80‐60% with oedema is Kwashiorkor
< 60 % with oedema is Marasmus‐Kwash
< 60 % without oedema is Marasmus
Mild to moderate malnutrition
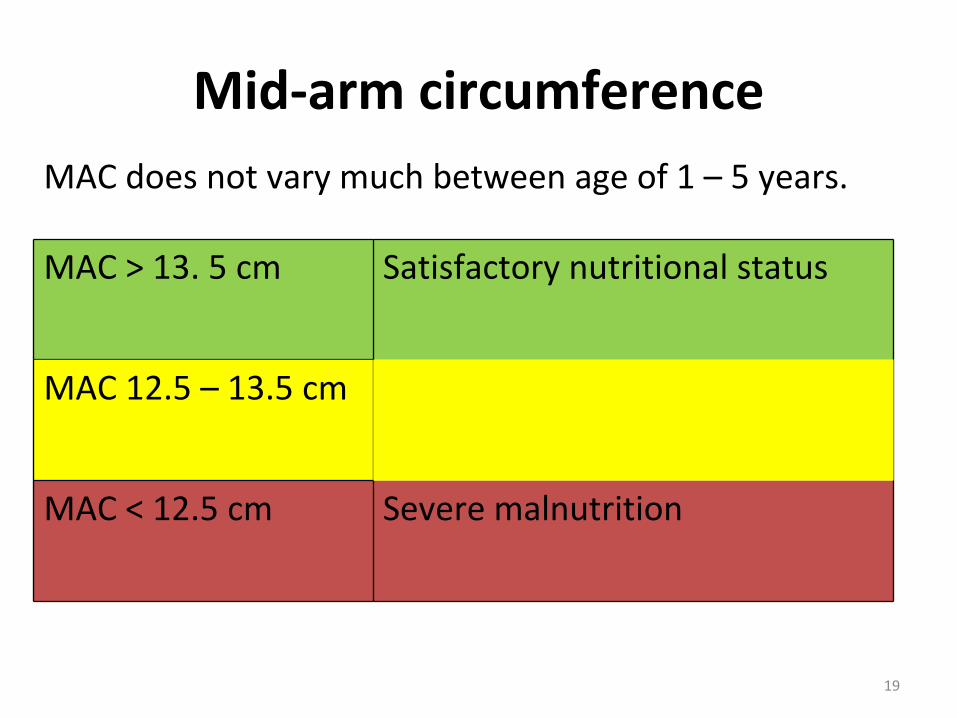
Mid‐arm circumference MAC does not vary much between age of 1 – 5 years.
MAC > 13. 5 cm Satisfactory nutritional status
MAC 12.5 – 13.5 cm
MAC < 12.5 cm Severe malnutrition
19
V2
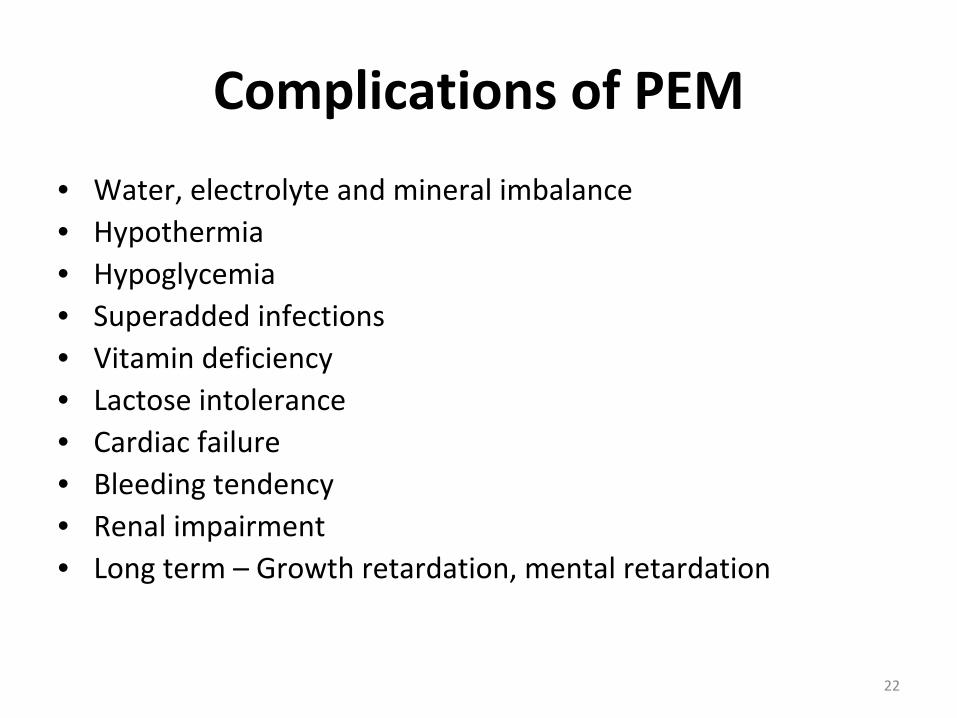
Complications of PEM
• Water, electrolyte and mineral imbalance • Hypothermia • Hypoglycemia • Superadded infections • Vitamin deficiency • Lactose intolerance • Cardiac failure • Bleeding tendency • Renal impairment • Long term – Growth retardation, mental retardation
22
Preventive measures
Think – Pair – Share
23
A) Health Promotion: • Measure direct to pregnant and lactating women
(education, supplements)
• Promotion of breastfeeding
• Development of low cost weaning food
• Family planning
• Home economics
• Family environment
B) Specific protection: 1. Protein energy rich food (e.g. milk, egg, fresh fruits) 2. Immunization 3. Food fortification
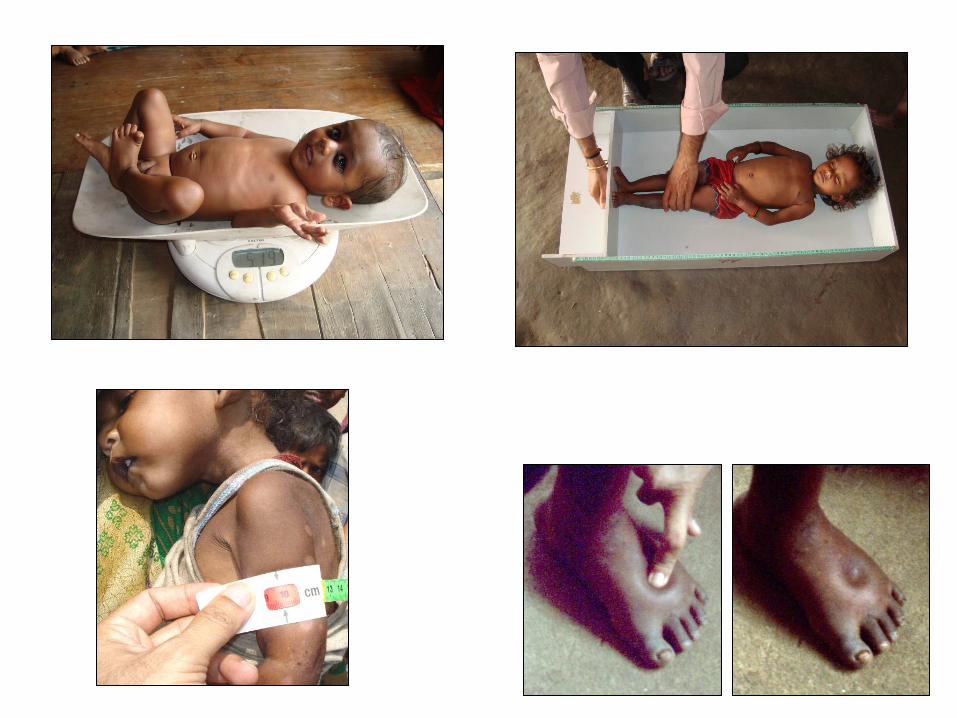
C) Early diagnosis and treatment: 1. History taking 2. Clinical features 3. Anthropometry 4. Biochemical and laboratory investigations. 5. Proper and effective management.
25
D) Rehabilitation: 1. Hospital treatment
2. Nutritional rehabilitation services (NRC i.e. Nutritional Rehabilitation Centres)
3. Follow‐up care
26
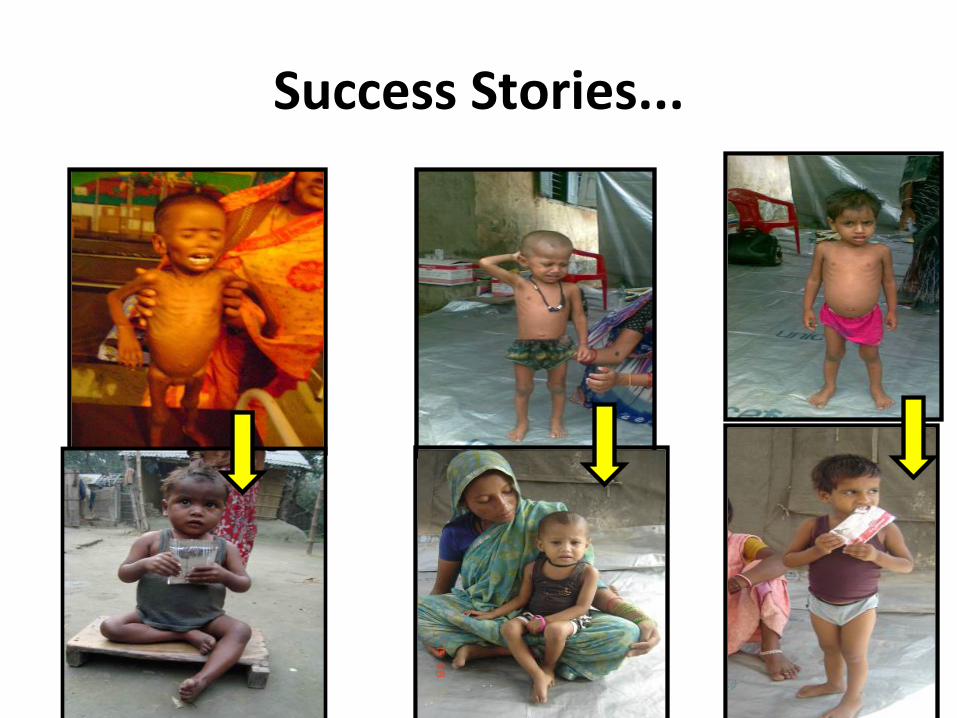
27
Success Stories...
Take Home Message!
• Malnutrition does not mean undernutrition.
• There are various classifications for PEM.
• PEM is preventable and curable.


![Malnutrition [Autosaved]](https://img.pdfslide.net/doc/110x75/577cd2051a28ab9e7895192c/malnutrition-autosaved.jpg)