Embed Size (px)
Citation preview
BLOODAMMONIALEVELS FOLLOWINGTHE INGESTIONOF CASEIN ANDWHOLEBLOOD1
By ALICE N. BESSMANAND GEORGES. MIRICK WITH THE TECHNICAL ASSISTANCE OF
ROBERTHAWKINS
(From the Department of Medicine, Johns Hopkins University and Baltimore City Hospitals,Baltimore, Md.)
(Submitted for publication February 6, 1958; accepted March 27, 1958)
In the recent past, much attention has been fo-cused on the role of ammonia in hepatic coma.A relation between gastrointestinal bleeding andthe precipitation of hepatic coma has been noted(1, 2). Various substances have been adminis-tered into the gastrointestinal tract, such as urea,ammonium chloride, exchange resins of the am-monia cycle, high protein feedings, and blood(3-7), all of which can produce elevated blood am-monia levels and precipitate hepatic coma in sus-ceptible individuals. The implicit assumption, ifnot explicit expression, in these various studies,has been that all of these substances are more orless equally noxious agents in regard to ele-vating blood ammonia and causing the concomitantneurological changes. The problem of irreversiblecoma in patients with liver disease following gas-trointestinal bleeding is frequently found; yet highprotein diets are standard fare in the treatment ofcirrhosis, and relatively infrequent catastrophiesresult. Wehave compared the relative effect ofthe ingestion of protein derived from blood ascompared to protein derived from casein andmilk solids (Protenum®) on the blood ammoniaand nonprotein nitrogen (NPN).
METHODS
Observations were made on a control group and a groupof patients with liver disease. The control group con-sisted of three patients with cerebrovascular accidentsand generalized arteriosclerosis but no demonstrable liverdisease, and one patient with anxiety neurosis and nodemonstrable liver disease. Of the patients with liverdisease, six had Laennec's cirrhosis and one had dif-fuse carcinomatosis with hepatic involvement.
In the control group two patients were given bothblood and Protenum® at different times. In these pa-tients the total amount of protein nitrogen administeredin 'the blood and Protenum® was the same. A thirdcontrol patient received only blood and the fourth con-
1 Supported by a grant from the United States PublicHealth Service, National Heart Institute.
trol patient received only Protenum®. All patients withliver disease received both blood and Protenum®, at suit-able intervals, at times when they were considered to berelatively stable in regard to their liver disease. Fourpatients received Protenum® first and three patients re-ceived the blood first. F. G., R. V., E. B. and C. D. in-gested Protenum® first.
The blood used for intragastric administration wasblood collected under standard blood bank conditions andkept refrigerated until used. Prior to administrationaliquot specimens of the bottles of blood from the bloodbank were assayed in duplicate for total nitrogen bythe macro-Kjeldahl method (8). Total nitrogen inweighed samples of Protenum® was similarly measured.Cn the basis of these determinations suspensions ofweighed amounts of Protenum® could be made equivalentin volume and nitrogen content to any given quantity ofthe bank blood. Protenum® is made from nonfat milksolids, calcium caseinate, dextrose, cocoa, vitamins andminerals [by analysis, the protein content (N X 6.38) is42 per cent by weight, according to the manufacturer].
All patients were in a fasting state. After initial bloodspecimens were taken, they received the blood or Pro-tenum® in approximately the same amount of total fluidcontaining the same quanitity of total nitrogen, over a20 to 30 minute period of time, via nasal tube or by in-gestion. Arterial and venous blood samples were drawnsimultaneously whenever feasible at 0, 1, 2.5, 4 and 5hours after administration of the test substance. Thepatients were observed for any development of nervous-ness, tremors, and so forth. The blood samples wereanalyzed for ammonia and NPNcontent. A modificationof the method of Seligson and Seligson (9) was usedfor ammonia determinations. Normal values for bloodammonia levels in our laboratory range from 0.60 to1.10 1gg. per ml. The values are expressed as gg. ofammonia nitrogen per ml. NPN's were determined by themethod of Folin and Wu (10).
RESULTS
Table I presents the results of the protein analy-sis of the various blood specimens which are ad-ministered to the patients. As can be seen fromthe data there is a wide variation in the proteinconcentration of the various blood specimens, allof which were drawn in the usual fashion at a
990

BLOODAMMONIALEVELS AFTER INGESTING CASEIN AND BLOOD
blood bank. The highest protein content is foundin the blood given Patient F. S., 20.60 Gm. per
cent (Table I) ; the lowest is seen in that givenPatient L. V., 12.31 Gm. per cent. The othervalues are fairly equally distributed between thetwo extremes. Thus it can be seen that 500 ml.of the 20.60 Gm. per cent blood would contain 103Gm. of protein, while an equivalent quantity of theblood given Patient L. V. would contain only ap-
proximately 62 Gm.-a 40 per cent difference.In Table II are presented the clinical diagnoses
on the various patients and some of the criteria em-
ployed to evaluate the presence and extent of liverdisease. The patients with cirrhosis were studiedat a time during which it was felt that their liverdisease was quiescent and stable. R. S., the pa-
tient with carcinomatosis, showed a slow butsteady downhill course during the study. In thiscase the blood was given first. Therefore, if therewere any difference in liver function between thetwo studies it would have been slightly betterwhen the blood was given than when the Prote-num® was given. Patients with viral hepatitis or
other acute liver disease were excluded from thisstudy since it was felt that their liver disease wouldbe in such 'a labile state that two studies, even onlya few days apart, would not be comparable.
TABLE I
Protein content of blood administered to patients
Patient Protein
Gm. %
A. Patients with no liver diseaseA. R. 12.50M. K. 19.20W. L. 18.50
B. Patients with liver diseaseF. S. 20.60*F. G. 19.00L. V. 12.31tR. S. 16.10R. V. 16.56E. B. 13.75C. D. 17.50
* Highest protein content.t Lowest protein content.
Table III presents the levels of arterial and ve-nous blood ammonia over a five hour period fol-lowing the intragastric administration of approxi-mately 500 ml. of whole bank blood, given in a pe-riod of 15 to 20 minutes. It can be seen (III, A)that the fasting blood ammonia of control patientsranged very closely around 1 ,ug. per ml. The ar-teriovenous differences were very close to zero.The maximum rise of the blood ammonia level was
TABLE II
Liver function studies
Cephalin Brom-Hepato- floccu- Bili- sulph- Total Albumin,/ Hema-
Patient Diagnosis Ascites megaly lation Thymol rubin alein protein globulin tocrit Biopsy
A. R. Cerebral 0 0 1+ 0.25 <1.0 5.8 3.6/2.2 36vascularaccident
M. K. Cerebral 0 0 2+ 0.80 6.6 3.9/2.7 47vascularaccident
W. L. Cerebral 0 0 1+ 0.50 <1.0 41vascularaccident
R. Mc. Anxiety 0 0 1 + 1.0 <5 43neurosis
Liver diseaseF. S. Cirrhosis ++± 3+ 3+ 4.0 2.7 7.9 3.5/4.4 +F. G. Cirrhosis; 0 4+ 2+ 1.0 3.4 6.9 2.6/4.3 30 +
pul. tbc.L. V. Cirrhosis 0 2+ 4+ 7.3 7.4 1.9/5.5 42R. S. Carcinomatosis 0 4+ 4+ 1.0 2.5 5.9 3.2/2.7 26 +
with liverinvolve.
R. V. Cirrhosis + 3+ 4+ 3.7 4.3 7.1 3.3/3.8 31 +E. B. Cirrhosis 0 2+ 1+ 2.3 3.0 12.5 6.4 3.9/2.5 42C. D. Cirrhosis 0 2+ 1+ 2.0 1.5 10.0 6.1 3.6/2.5 43 +
991

992 ALICE N. BESSMANAND GEORGES. MIRICK
TABLE III
Ammonia levels following whole blood administration (,.g. per ml.)
Fasting 1 hour 2.5 hours 4 hours 5 hoursProtein - -
Patient received A V A-V A V A-V A V A-V A V A-V A V A-V
Gm.A. Patients with no liver disease
A. R. 63 1.03 1.03 0.00 1.28 1.06 +0.22 1.07 1.00 +0.07 1.10 1.30 -0.20 1.10 0.89 +0.21M. K. 86 0.85 0.79 +0.06 0.92 1.10 -0.18 0.96 1.06 -0.10 0.82 1.10 -0.28 1.16 1.04 +0.12W. L. 91 0.76 0.69 +0.07 0.86 1.34 -0.48 1.20 1.38 -0.18 0.75 0.95 -0.20 0.88 1.00 -0.12
Average 80 0.88 0.83 +0.04 1.02 1.17 -0.15 1.08 1.15 -0.07 0.89 1.12 -0.23 1.05 0.98 +0.07
B. Patients with liver diseaseF. S. 103 2.00 1.54 +0.46 2.52 1.80 +0.72 3.01 2.20 +0.81 3.00 2.48 +0.52 1.65F. G. 104 2.09 1.74 +0.35 3.52 2.46 +1.06 4.60 4.12 +0.48 4.48 4.28 +0.20 4.72 4.43 +0.29L. V. 74 1.38 1.33 +0.05 2.30 1.76 +0.54 4.00 3.36 +0.64 3.95 2.77 +1.8 3.00 2.85 +0.15R. S. 80 2.00 1.56 +0.44 2.32 1.98 +0.34 2.83 2.93 -0.10 3.54 3.62 -0.08 3.34 3.22 +0.12R. V. 75 1.94 2.60 2.30 +0.30 4.06 3.38 +0.68 3.92 3.76 +0.16 3.35 3.25 +0.10E. B. 80 1.48 1.36 +0.12 2.00 1.60 +0.40 2.68 1.90 +0.78C. D. 70 1.16 1.22 -0.06 1.93 1.46 +0.47 2.36 1.65 +0.71 1.84 1.69 +0.15
Average 84 1.72 1.46 +0.23 2.45 1.92 +0.53 3.36 2.79 +-0.57 3.78 3.38 +0.40 3.25 2.85 +0.16
seen in Patient W. L. who showed an increase of higher than the fasting level, and he exhibitedapproximately 0.6 ug. per ml. in both arterial and symptoms of nausea, tremulousness and nervous-venous values. In contrast (Table III, B), the ness. Patient L. V., who showed an equivalentammonia levels of the patients with liver disease rise in blood ammonia, also manifested nervous-rose significantly in all instances and rather ness and irritability during the period of peakabruptly in several cases. Furthermore there was elevation. An interesting finding in Patient R. S.a marked delay in some patients before the levels was the lack of a positive arteriovenous differencereturned toward normal. In none of the patients despite distinct elevation in ammonia levels. Thiswith liver disease had the blood ammonia levels phenomenon will be discussed later. Patientsreturned to normal by five hours. The most pro- R. V. and E. B. showed more or less the samenounced elevation of blood ammonia was seen in pattern as the first three patients. C. D. receivedPatient F. G. after 104 Gm. of protein in the form the lowest total protein dose and clinically hadof blood was administered. At 2.5, 4 and 5 hours, rather mild cirrhosis. Nevertheless, his peak am-his ammonia levels were about 2.5 ug. per ml. monia level was 1.2 jug. higher than the fasting
TABLE IV
Ammonia levels following Protenum ® administration (lAg. per ml.)
Fasting 1 hour 2.5 hours 4 hours 5 hoursProtein
Patient received A V A-V A V A-V A V A-V A V A-V A V A-V
Gm.A. Patients with no liver disease
A. R. 70 1.33 1.11 +0.22 1.30 1.04 +0.26 1.08 1.26 -0.18 1.47 1.50 -0.03 1.14 1.21 -0.07M. K. 86 0.69 0.72 -0.03 0.85 0.91 --0.06 0.76 0.70 +0.06 0.73 1.02 -0.29 0.94 1.00 -0.06R. Mc. 120 0.94 0.79 +0.15 0.90 0.82 +0.08 1.04 1.01 +0.03 1.04 0.93 +0.11
Average 90 0.98 0.87 +0.11 1.01 0.92 +0.09 0.96 0.99 -0.03 1.08 1.15 -0.07 1.04 1.10 -0.06
B. Patients with liver diseaseF. S. 91 1.42 2.34 1.94 +0.62 2.43 1.94 +0.49 1.61 1.58F. G. 120 1.78 1.40 +0.38 3.35 2.13 +1.22 2.49 2.33 +0.16 1.92 1.71 +0.21 2.00 1.58 +0.42L. V. 74 1.82 1.75 +0.07 1.82 1.64 +0.18 2.09 1.90 +0.19 1.81 1.65 40.16 1.69R. S. 80 1.22 1.10 +0.12 1.20 1.16 +0.04 1.50 1.18 +0.32 1.33 1.09 +0.24 1.49 1.21 +0.28R. V. 75 1.53 1.13 +0.40 2.14 1.23 +0.91 1.69 1.33 +0.36 1.60 1.13 +0.47E. B. 80 1.12 0.92 40.20 1.24 1.26 -0.02 1.21 1.24 -0.03C. D. 70 1.20 1.00 +0.20 1.36 1.26 +0.10 1.34 1.06 +0.28 1.53 1.26 +0.27
Average 84 1.44 1.24 +0.23 1.92 1.48 +0.44 1.82 1.57 +0.25 1.66 1.44 +0.27 1.67 1.41 +0.32
BLOODAMMONIALEVELS AFTER INGESTING CASEIN AND BLOOD
4.0° AVERAGE VALUES
4'0
TIME (HOURS)
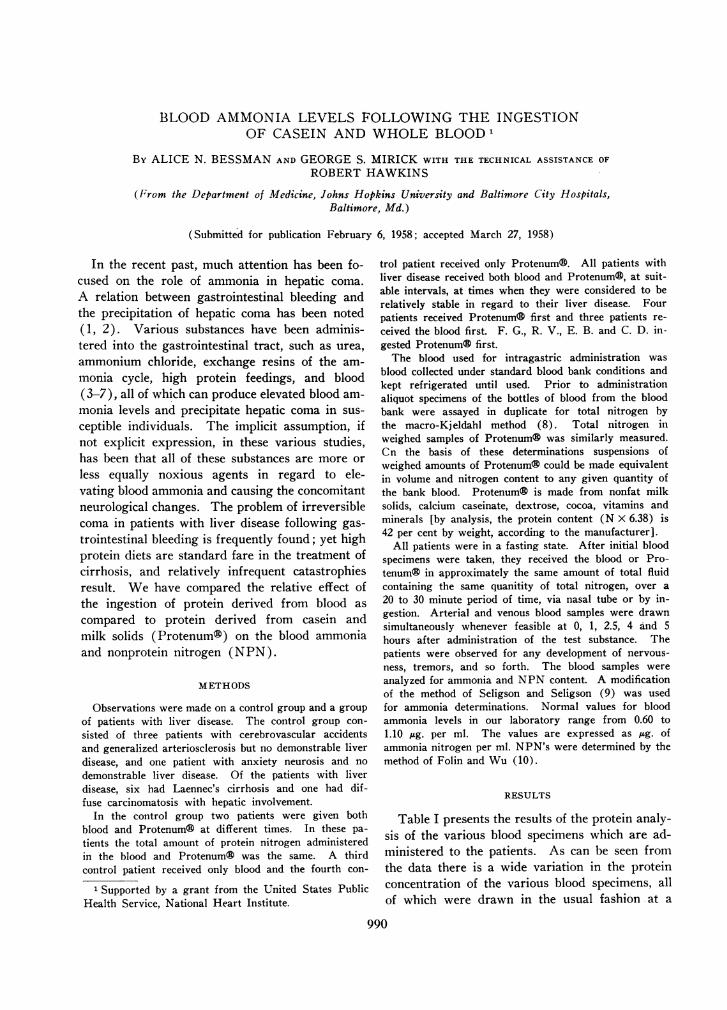
FIG. 1. AVERAGEBLOOD AMMONIALEVELS (SEVEN PATIENTS) FOLLOWING ADMINISTRATIONOF BLOODAND PROTENUM®
Shaded area represents maximum and minimum arterial and venous blood ammonia levels ofcontrol patients similarly treated.
Stippled and open circles-maximum arterial and venous levels after blood administration;stippled and open squares-minimum arterial and venous levels after blood administration;stippled and open diamonds-maximum arterial and venous levels after Protenums administra-tion; stippled and open triangles-minimum arterial and venous levels after Protenum®administration.
level, an increment twice as great as the highestseen in the control group. None of the patientsexcept F. G. and L. V. showed central nervous
system symptoms during the test. It can be notedthat all patients with liver disease, with the ex-
ception of R. S., showed a positive arteriovenousdifference of ammonia, and this difference usuallyincreased parallel with the elevation of the arterialammonia level.
Table IV gives the levels of blood ammonia inpatients without liver disease (A) and with liverdisease (B) following the intragastric administra-tion of Protenum®. A. R. was given slightly more
protein in the Protenum® administration than inthe blood administration; M. K. was given thesame amount. Two other patients without liverdisease were studied. W. L. was given bloodcontaining 91 Gm. of protein (see Table III), and
R. Mc. was given 120 Gm. of protein in the formof Protenum®. There were no marked changesin the blood ammonia levels in any of the normalsubjects. All of the patients with liver diseasereceived the same total amount of protein as theyhad received from the blood, with the exception ofthe first two patients. The first patient, F. S.,received 12 Gm. more protein from the bloodsource, and F. G. received 16 Gm. more proteinas Protenum®. It is of interest to note that inthis latter patient (F. G.), despite the greateramount of protein received from Protenum®, theelevation of blood ammonia levels was far less andof shorter duration than when the blood was given.This same pattern is repeated in all of the patients;that is, for an equivalent amount of protein ad-ministered the increase in the levels of blood am-monia was much less marked when Protenum®
993

ALICE N. BESSMANAND GEORGES. MIRICK
L.V. 57 yr. 9 CirrhosisO-OArterial c Whole Blood-----oVenous c Whole Blood0--OArterial c Protenumn4 /W--*Venous d Protenu774 GM. PROTEIN ADMIMSTER
TIME (HOURS)
FIG. 2. BLOODAMMONIALEVELS OF TYPICAL PATIENT WITH CIRRHOSIS AFTER ADMINISTRATIONOF BLOODAND PROTENUM®
Shaded area represents maximum and minimum arterial and venous blood ammonia levels
was given than when blood was given. None ofthe patients demonstrated any signs or symptomsof disturbance of central nervous system follow-ing Protenum® administration. In some patientsthe changes in the levels of blood ammonia were
minimal.
Figure 1 illustrates in graphic form the average
arterial and venous levels of ammonia over thefive hour test period for the patients with liverdisease following both Protenum® and blood ad-ministration. The shaded area across the bottomrepresents maximum and minimum levels of the
TABLE V
Nonprotein nitrogen (NPN) levels following blood and Protenum® administration (mg. per cent)
Protein received(CGm.) Fasting 1 hour 2.5 hours 4 hours 5 hours
Patient Blood Protenum® Blood Protenum ® Blood Protenum ® Blood Protenum ® Blood Protenum® Blood Protenum®
A. Patients with no liver diseaseA. R. 63 70 18.52 22.72 23.10 20.05 18.97M. K. 86 86 58.50 33.22 49.50 29.77 52.50 34.05 54.00 33.22 54.00R. Mc. 120 28.20 33.27 29.85 34.42
B. Patients with liver diseaseF. S. 103 91 19.72 20.02 23.47 22.57 32.10 20.02 26.40 17.02 23.47 36.15F. G. 104 120 12.45 13.37 19.95 17.65 22.05 18.75 22.87 17.65 10.35 18.30L. V. 74 74 20.77 21.22 24.52 19.95 32.85 21.22 44.47 9.50 29.55 23.32R. S. 80 80 20.77 33.30 38.70 33.75 39.52 33.30 47.47 35.40 52.05 41.25R. V. 75 75 15.00 21.22 19.72 25.35 22.50 24.15 27.60 24.15 25.20E. B. 80 80 17.20 17.90 25.80 19.51 29.70 20.83C. D. 70 70 21.60 25.45 36.22 28.28 35.40 25.04 34.60 32.38
Average 84 84 18.21 21.78 26.91 23.86 30.58 23.33 33.16 20.74 29.20 25.23
4.0
'I,<
0
lzr_I
£~
- - - - -o
994

BLOOD AMMONIALEVELS AFTER INGESTING CASEIN AND BLOOD
normals. Figure 2 shows the results of one typi-cal patient, L. V., with the normal range againshaded in.
Table V gives the levels of NPN-on the samepatients. The rise in NPN's tended to parallelthe changes in blood ammonia.
DISCUSSION
The patients chosen for evaluation in the studywere known cirrhotics (six out of seven) of fairlylong standing, neither convalescing from an acuteepisode nor noticeably deteriorating. In a groupof patients who are thought to have clinicallyequivalent liver disease the liver function test maydiffer markedly from patient to patient. Con-versely, although biochemically the same, twocirrhotic patients may appear very different clini-cally. Therefore it was felt that comparison ofone group of patients with another group of pa-tients would not yield as valid or worthwhile in-formation as would the comparison of each pa-tient with himself at relatively short intervals.
The total amount of protein administered inthe form of blood and Protenum® was the samefor both test substances (with the exceptions notedabove) for a given subject. However, all sub-jects did not receive the same total amount of pro-tein. An attempt was made to vary the dose oftotal protein from patient to patient according toan estimate of the severity of each individual's liverdisease in order to avoid precipitating hepaticcoma. Despite this variation in dosage, all patientsshowed the same pattern of response, i.e., all hada greater rise in blood ammonia after ingestion ofblood than after Protenum® ingestion.
The average ammonia level of the bank bloodadministered was 10 jug. per ml. If a total of 500ml. of blood was given (and this was the averageamount administered), the total ammonia givenwould be 5 mg., roughly equivalent to 20 mg. ofammonium chloride. This amount of ammoniadistributed unaltered throughout the body fluidswould cause an increase of 0.125 Mug. per ml. in a70 kilogram individual. This is an insignificantamount even though it has been remarked uponby Spear, Sass, and Cincotti (11). Wethereforefeel that the free ammonia in the bank blood didnot contribute to the marked elevations of the
blood ammonia levels noted following ingestionof blood. The average level of ammonia in Pro-tenum® was 6 Mug. per ml. Further evidence thatthe ammonia in transfused blood is negligible ineffect can be obtained from the data of Gorten,Shear, Hodson, and Bessman (12) concerning theuse of fresh blood for exchange transfusion. Hereit is shown that blood with an ammonia content ofup to 3 ug. per ml. had no effect in the blood am-monia level of the recipient, even though morethan ninety per cent of the patient's blood wasexchanged.
An uptake of ammonia both by cerebral andperipheral tissues has been demonstrated by Bess-man, Fazekas, and Bessman (13, 14). In thisstudy a correlation between arteriovenous differ-ences (i.e., uptake of ammonia by the tissues) andthe degree of elevation of the arterial ammonia wasobserved. In general, the greater the elevationof arterial blood ammonia, the greater the arterio-venous difference. These observations have beenconfirmed by some (15) and disputed by others(16). Even in this latter report, however, thedata in Figure 6 appear to show a similar corre-lation. Six of the seven patients with liver diseasein the present study showed correlation of arterio-venous difference of ammonia with a rise in thearterial levels. One patient (R. S.) showed nodifference whatsoever, even on pronounced eleva-tion of the arterial level. This patient was ex-tremely thin and his muscle mass greatly reduced.It may be that in certain conditions such as ex-treme debility or cachexia, capacity of muscle forremoving ammonia has already been reached andno increased activity is possible. Terminal comapatients have been observed to have a similar re-versal of arteriovenous differences (17). Thisphenomenon is not consistent, nor is it explicableat the present time.
The deleterious effects of gastrointestinal bleed-ing in patients with cirrhosis have long beenknown. Welch, Kiley, Reeve, Goodrich, andWelch (1) reported a 76 per cent mortality in pa-tients with cirrhosis during their first hemorrhage.Over 90 per cent of these patients had provenvarices. The presence of cirrhosis in a patientwith a bleeding duodenal ulcer makes for a moreguarded prognosis (2). Some of these deaths areattributable, of course, to uncontrollable hemor-
995
ALICE N. BESSMANAND GEORGES. MIRICK
rhage. However, patients with severe liver dis-ease can be precipitated into hepatic coma by gas-trointestinal bleeding. In a series recently re-ported by Summerskill, Wolfe, and Davidson (5),gastrointestinal hemorrhage precipitated or com-plicated hepatic coma in 12 of 34 patients.
Young, Burnside, Knowles, and Schiff (7)have shown that patients with liver disease given500 ml. of bank blood show a far greater rise inblood ammonia levels than do normal controls.In this study, one pint of blood was administeredwithout the amount of total nitrogen in that speci-men having been determined. Our measurementshave shown that one pint of blood may containfrom 62 to 136 Gm. of protein. Other investiga-tors have shown elevations in blood ammonialevels following administration of ammonium chlo-ride, urea and high protein feedings (3-6, 18).These changes would seem to be of the same orderof magnitude as those shown by Young and co-workers following blood administration. Further-more, it has been reported that diets of 120 Gm.of protein may precipitate coma in patients withcirrhosis and that occasionally patients have beensensitive to as little as 20 Gm. of protein (5).Patients so sensitive to dietary protein (if it canbe likened to Protenum®) would probably be in-ordinately sensitive to blood in the gastrointestinaltract.
The present study has shown that per Gm. ofnitrogen administered, ingested blood causes ahigher level of blood ammonia than protein froma casein and milk solids source. Certain aminoacids such as methionine (19) have been shownto be particularly toxic in patients with liver dis-ease, probably through their effect on bloodammonia. Others, such as glutamic acid and ar-ginine, have been shown to have protective proper-ties in preventing ammoniagenic coma or in ameli-orating its symptoms when such symptoms areprecipitated by a sudden ingestion of substancespreviously mentioned (blood, ammonium chloride,urea, and so forth). One of the problems nowunder study is whether blood contains more ofthe toxic amino acids or whether Protenum® con-tains more of the protective ones.
Certain practical therapeutic considerations fol-low from the above study. In the treatment ofgastrointestinal hemorrhage in patients with liver
disease several procedures would seem advisablein addition to the usual ones of blood replacement,treatment of shock, and so on. These studieswould support the views of those who advocateremoval of the blood from the gastrointestinaltract by aspiration and the use of enemas (5).The rationale of the use of antibiotics such aschlortetracycline (19) and neomycin (20) restson the inhibition of enteric bacterial flora whichincrease proteolysis. Certainly the administrationof one of these drugs would be advisable in thetreatment of gastrointestinal hemorrhage in pa-tients with liver disease.
The adjuvant use of sodium glutamate and/orarginine is also indicated in the treatment of am-moniagenic coma precipitated by gastrointestinalbleeding in patients with liver diseases. Variousinvestigators have used glutamate in the therapyof hepatic coma with varying reports as to itssuccess or failure (21-24). However, even inthose instances in which the patient did not re-spond clinically, the blood ammonia levels usuallyfell during or shortly after glutamate administra-tion. Other workers have used arginine (25, 26)to lower blood ammonia levels. In a recent studyit was shown that in cirrhotic patients glutamatewas more effective than arginine, mole for mole.in preventing the elevation of blood ammonia pro-duced by administration of ammonium chloride(27).
The observation has been made that in condi-tions such as gastrointestinal hemorrhage, shock,and so forth, there exists a state known as pre-renal azotemia, characterized, among other things,by an oliguria and an elevated NPN. These ab-normal findings usually return to normal with thecorrection of the primary lesion. In the presentstudy, as well as in the observations of Young andassociates (7), the rise of the NPNparalleled therise of the blood ammonia. In no case in whichthe blood ammonia levels remained stationary didthe NPN levels increase; and conversely, in nocases in which the ammonia levels rose did theNPN levels fail to rise. Nelson and Seligson(28) have shown blood ammonia levels to be ele-vated in shock, and this study as well as othershas shown the blood ammonia levels to be ele-vated by the presence of blood in the gut. Thusit may be that a part of the elevated NPNwhich
996
BLOOD AMMONIALEVELS AFTER INGESTING CASEIN AND BLOOD
characterizes prerenal azotemia may be due to thepresence of elevated blood ammonia, which fur-nishes a source for the rapid synthesis of urea,glutamine and other components of the nonpro-tein nitrogen.
CONCLUSIONS
1. Blood and a casein-milk solids preparation(Protenum®) were administered intragastricallyto control patients and patients with liver disease.Each patient received both test substances and fora given patient the total nitrogen content of thetwo test substances was the same.
2. None of the control subjects showed signifi-cant elevations in either blood ammonia or the non-protein nitrogen (NPN) over a period of three tofive hours.
3. All seven of the patients with liver diseaseshowed a significant rise in blood ammonia andNPN following administration of blood; six ofthese patients showed a significant rise in thesedeterminations following the administration ofProtenum®. In the patients with liver disease,ammonia and NPN levels following administra-tion of blood were uniformly higher than follow-ing Protenum®.
4. Several patients developed central nervoussystem symptoms during the period of elevationof blood ammonia levels.
5. The arteriovenous difference of ammonia in-creased in six of the seven patients with liver dis-ease as the arterial levels increased.
6. The practical significance of these findingsin relation to the treatment of gastrointestinalhemorrhage is discussed.
REFERENCES
1. Welch, C. S., Kiley, J. E., Reeve, T. S., Goodrich,E. O., and Welch, H. F. Treatment of bleedingfrom portal hypertension in patients with cirrhosisof the liver. New Engl. J. Med. 1956, 254, 493.
2. Smythe, C. McC., Osborne, M. P., Zamcheck, N.,Richards, W. A., and Madison, W. M., Jr. Bleed-ing from the upper gastrointestinal tract. Ananalysis of 111 cases. New Engl. J. Med. 1957,256, 441.
3. Phillips, G. B., Schwartz, R., Gabuzda, G. J., Jr.,and Davidson, C. S. The syndrome of impendinghepatic coma in patients with cirrhosis of the livergiven certain nitrogenous substances. New Engl.J. Med. 1952, 247, 239.
4. McDermott, W. V., Jr., and Adams, R. D. Episodicstupor associated with an Eck fistula in the humanwith particular reference to the metabolism ofammonia. J. clin. Invest. 1954, 33, 1.
5. Summerskill, W. H. J., Wolfe, S. J., and Davidson,C. S. The management of hepatic coma in rela-tion to protein withdrawal and certain specificmeasures. Amer. J. Med. 1957, 23, 59.
6. Webster, L. T., Jr. Ammonium metabolism. Amer.J. Med. 1956, 21, 130.
7. Young, P. C., Burnside, C. R., Knowles, H. C., Jr.,and Schiff, L. The effects of intragastric adminis-tration of whole blood on the concentration ofblood ammonia in patients with liver disease. J.Lab. clin. Med. 1957, 50, 11.
8. Hiller, A., Plazin, J., and Van Slyke, D. D. A studyof conditions for Kjeldahl determination of ni-trogen in proteins. Description of methods withmercury as catalyst, and titrimetric and gasometricmeasurements of the ammonia found. J. biol.Chem. 1948, 176, 1401.
9. Seligson, D., and Seligson, H. A microdiffusionmethod for the determination of nitrogen liberatedas ammonia. J. Lab. clin. Med. 1951, 38, 324.
10. Gradwohl, R. B. H. Clinical Laboratory Methodsand Diagnosis, 5th ed. St. Louis, C. V. Mosby Co.,1956, vol. 1, p. 244.
11. Spear, P. W., Sass, M., and Cincotti, J. J. Am-monia levels in transfused blood. J. Lab. clin.Med. 1956, 48, 702.
12. Gorten, M. K., Shear, S., Hodson, M., and Bessman,S. P. Complications of hyperbilirubinemia in thenewborn-possible relation to the metabolism ofammonia. Pediatrics 1598, 21, 27.
13. Bessman, S. P., Fazekas, J. F., and Bessman, A. N.Uptake of ammonia by the brain in hepatic coma.Proc. Soc. exp. Biol. (N. Y.) 1954, 85, 66.
14. Bessman, S. P., and Bessman, A. N. The cerebraland peripheral uptake of ammonia in liver diseasewith an hypothesis for the mechanism of hepaticcoma. J. clin. Invest. 1955, 34, 622.
15. Bessman, S. P., and Bradley, J. E. Uptake of am-monia by muscle. Its implications in ammonia-genic coma. New Engl. J. Med. 1955, 253, 1143.
16. Summerskill, W. H. J., Wolfe, S. J., and Davidson,C. S. The metabolism of ammonia and a-keto-acids in liver disease and hepatic coma. J. clin.Invest. 1957, 36, 361.
17. Bessman, A. N., and Mirick, G. S. Unpublished ob-servations.
18. Schwartz, R., Phillips, G. B., Seegmiller, J. E.,Gabuzda, G. J., Jr., and Davidson, C. S. Dietaryprotein in the genesis of hepatic coma. New Engl.J. Med. 1954, 251, 685.
19. Phear, E. A., Ruebner, B., Sherlock, S., and Summer-skill, W. H. J. Methionine toxicity in liver dis-ease and its prevention by chlortetracycline. Clin.Sci. 1956, 15, 93.
997
ALICE N. BESSMANAND GEORGES. MIRICK
20. Fisher, C. J., and Faloon, W. W. Blood ammonialevels in hepatic cirrhosis: Their control by oraladministration of neomycin. New Engl. J. Med.1957, 256, 1030.
21. Walshe, J. M. The effect of glutamic acid on thecoma of hepatic failure. Lancet 1953, 1, 1075.
22. McDermott, W. V., Jr., Wareham, J., and Riddell,A. G. Treatment of "hepatic coma" with l-glu-tamic acid. New Engl. J. Med. 1955, 253, 1093.
23. Webster, L. T., Jr., and Davidson, C. S. The effectof sodium glutamate on hepatic coma. J. clin. In-vest. 1956, 35, 191.
24. Iber, F. L., and Chalmers, T. C. Biochemical ob-servations on the use of L-glutamic acid in treat-
ment of hepatic coma. J. clin. Invest. 1957, 36,706.
25. Najarian, J. S., and Harper, H. A. A clinical studyof the effect of arginine on blood ammonia. Amer.J. Med. 1956, 21, 832.
26. Fahey, J. L., Nathans, D., and Rairigh, D. Effect ofL-arginine on elevated blood ammonia levels inman. Amer. J. Med. 1957, 23, 860.
27. Bessman, S. P., Shear, S., and Fitzgerald, J. Theeffect of arginine and glutamate on the removalof ammonia from the blood in normal and cirrhoticpatients. New Engl. J. Med. 1957, 256, 941.
28. Nelson, R. M., and Seligson, D. Studies on bloodammonia in normal and shock states. Surgery1953, 34, 1.
998


![Alpha-Casein as a Molecular Chaperone · The major protein constituent of casein micelles, accounting for 65% of protein is S-casein [4]. The function of -casein, present at the surface](https://img.pdfslide.net/doc/110x75/5fd57079b24729154a34f060/alpha-casein-as-a-molecular-chaperone-the-major-protein-constituent-of-casein-micelles.jpg)