Embed Size (px)
Citation preview
CHAPTER FIVE
CHAPTER FIVE:
PPRROOTTEEOOMMIICCSS AAPPPPRROOAACCHH FFOORR
UUNNDDEERRSSTTAANNDDIINNGG TTHHEE MMEECCHHAANNIISSMM OOFF
BBAACCTTEERRIIAALL
RREESSIISSTTAANNCCEE TTOO HHEEAAVVYY MMEETTAALL SSTTRREESSSS
Response to heavy metals & proteomic profile of the isolate 135

CHAPTER FIVE
5.1. INTRODUCTION
The solubilization of metals from low-grade sulfide ores by the activities of
chemolithotrophic bacterium At. ferrooxidans is important to mining industry. Such
bioextraction can only be effective if the bacterium is resistant to the metal recovered as
well as to others in the environment [Ledue et al., 1997]. Although much research has been
done on the resistance of At. ferrooxidans to metals, there is a dearth of information on the
molecular mechanism involved in the tolerance of these strains to metals like zinc and
lead. At. ferrooxidans is resistance to several toxic metals. However, strain specific
difference in the level of tolerance have been reported for At. ferrooxidans isolates from
various mine sites [Garcia et al., 1991; Leduce et al.,1997]. Among different metals At.
ferrooxidans shows an unusual resistance to some metals, such as zinc, nickel, cobalt and
copper [Tuovinen et al., 1971; Hutchins et al., 1986; Garcia et al. 1991], unlike most
heterotrophic bacteria. However some metals (e.g. mercury and silver) are very toxic to the
bacteria even at low concentration [Hoffman and Hendrix, 1976; Mahapatra and Mishra,
1984; Tuovinen et al., 1985].
Most of these metals are present at high concentrations in and around mines. Hence it
would be interesting to isolate the bacterium having high resistance to such metals and try
to increase its resistance by slowly exposing it to higher concentration of certain metal that
it can resist. These improved bacteria can be good source to be applying in different mines
for extracting different metals. According to Modak & Ntarajan (1995), it is necessary to
develop At. ferrooxidans strains which are more tolerant to high concentrations of metal
and temperature fluctuations which will improve bioleaching. Efforts have been made to
Response to heavy metals & proteomic profile of the isolate 136

CHAPTER FIVE
understand the mechanism by which cells employ when exposed to exogenous metals. One
of the approaches is the use of recently developed technology of DNA micro-array as a
high throughput technique for global analysis of gene expression to understand the cellular
response to metal toxicity. However, it does not correlate well with the relative protein
abundance in the cell, and the post-translational modifications of proteins are not taken
into consideration. The other approach is proteomic which involves the global analysis of
the differentially expressed proteins along with their post-translational modifications.
In the present work, we have analyzed the tolerance level of over isolate to nine
different toxic metals (e.g. zinc, lead, arsenate, nickel, mercury, manganese, cobalt, copper
and chromium) by monitoring growth and iron oxidation capacity of isolates when
exposed to heavy metals. Differential protein expression patterns have been analyzed with
2DPAGE to understand the response of bacteria to zinc and lead.
Response to heavy metals & proteomic profile of the isolate 137
CHAPTER FIVE
5.2. MATERIALS AND METHODS
5.2.1. MATERIALS
• Salts used for MIC study:
Zn SO4. 7H2O Na2HAsO4.7H2O
Cu SO4. 2H2O Pb(NO3)2
NiCl2 . 6H2O MnSO4. H2O
HgCl2 CoCl2
CrO3
5.2.1.1. REAGENTS FOR PROTEIN EXTRACTION
• Protein Extraction Buffer (PEB):
Tris-HCl (pH 8.0) ; 50 mM, EDTA; 5 mM, Triton- X 100;0.1% and PMSF; 1 mM
• Protease Inhibitor Cocktail (PI): 1 tablet of P.I. CoKtail (mni, EDTA free,
B.M.) was dissolved in 1.5 ml of deionzied water. Aliquotes of 150 µl were
stored at -200C. PMSF- 100mM. Working solution of lysis buffer was
prepared by mixing : 847 µl PED + 143 PI µl + 10 µl PMSF
5.2.1.2 REAGENTS FOR TWO-DIMENSIONAL GEL ELECTROPHORESIS
A: ISOELECTRIC FOCUSING-TUBE GEL:
30% Acrylamide: Acrylamide; 29.1 g and N,N’-methylene bisacrylamide: 0.9 g
Dissolved in above in 60 ml of distilled water and made up the volume to 100 ml.
10% Ammonium persulphate (APS): Dissolved 0.1 g APS in 1 ml of distilled water
Tube gel preparation
Response to heavy metals & proteomic profile of the isolate 138

CHAPTER FIVE
Solution for 5 ml:
Urea; 2.4g, 30%acrylamide; 900 µl, 10% Triton-X-100; 1000 µl and distilled
water; 500 µl, Dissolved the above by heating in water bath at 37 0C for 5 min.
and added Ampholytes; 300 µl, 10% Ammonium persulfate; 5 µl, TEMED; 4 µl
Pre- Treatment Solution: Added 1 g SDS and 0.3 g DTT in 1 ml of distilled water.
Solubiliztion buffer
To prepare solubilization buffer, added
Urea; 36 mg, CHAPS; 0.4 g, Tris-amine; 10 mg, 65 mM, DTT; 10 mg
0.65% IPG Buffer; 20 µl in distilled water to make up the volume to 1 ml.
Overlay Buffer
To prepare overlay buffer, added Urea; 5.4 g + Ampholyte; 250 µl +BPB; 500 µl of 0.05%
Stock solution in distilled water to make up the volume to 10 ml.
Equilibration buffer
To prepare equilibration buffer, added
Urea; 18 g, DTT; 1g, SDS; 1 g, Glycerol; 10 ml, Tris 1.5M, (pH 8.8),12.5 ml In distilled
water to make up the volume to 50 ml.
B: ISOELECTRIC FOCUSING- STRIP GEL
Rehydration buffer
To prepare rehydration buffer, added
Urea; 4.8 g, CHAPS; 200 mg, Ampholytes; 20 mg (40% solids 50 µl )
Response to heavy metals & proteomic profile of the isolate 139

CHAPTER FIVE
DTT; 77 mg, Traces of bromophenol blue (Few particles just to give bluish
tinge) in distilled -water with a final volume of 10 ml.
Equilibration buffer 1
DTT; 1 g, SDS;1g, Urea; 18 g, 1.875 M Tris-HCL, (pH 8.8);10 ml, Glycerol; 10 ml
Dissolved the above in distilled water a final volume of 50 ml.
Equilibration buffer 2
Iodoacetamide; 1.25 g, SDS; 1g, Glycerol; 10 ml, Urea; 18 g, 1.875 M Tris-HCl, (pH 8.8);
10 ml: Dissolved the above in distilled water with a final volume of 50 ml.
C: SDS_PAGE
30% Acrylamide: 30% acrylamide was prepared as described before
1.875 M Tris-HCL, pH 8.8: Dissolved 58.6 g Tris in 100 ml distilled water, adjusted the
pH with 5N HCl and made up the volume to 250 ml.
1.25 M Tris-HCl, pH 6.8: Dissolved 37.8 g Tris in 100 ml distilled water, adjusted the pH
with 5N HCl and made up the volume to 250 ml.
10% SDS: Dissolved 10g SDS in 90 ml distilled water. Warmed to assist dissolution and
made up the volume to 100 ml.
10% APS: Dissolved 0.1 g APS in 1 ml of distilled water.
Low melting agarose gel (0.5%): Added 50 mg agarose and 10 mg of bromophenol blue
in 10 ml of SDS-electrode buffer and boiled the solution.
Response to heavy metals & proteomic profile of the isolate 140

CHAPTER FIVE
Loading buffer
For preparing 10X loading buffer, added 1.25 M Tris-Cl, (6.8); 0.5 ml, 10% SDS; 0.2 ml,
Glycerol; 1.16 ml, Bromophenol blue; 1.0 mg, In distilled water and made up the volume
to 100 ml.
SDS-Electrode buffer (1X)
For 1X electrode buffer, added; Glycine; 14.4g, Tris; 3.02 g, SDS; 1.0 g, And made up
the volume to 1000 ml with distilled water.
D: STAINING OF PROTEINS
Staining solution: Methanol; 45 ml, Distilled water; 45 ml, Acetic acid; 10 ml, Coomassie
Brilliant Blue R250; 100 mg
Destaining solution: Methanol; 45 ml, Distilled water; 45 ml, Acetic acid;10 ml
Storing solution: Dissolved 7 ml of glycerol or acetic acid in distilled water to made up
the volume to 100 ml.
5.2.1.3. REAGENTS FOR IN SITU TRYPTIC DIGESTION
Ammonium bicarbonate (NH4HCO3) (100mM)
Dissolved 0.791 g NH4HCO3 in 100 ml of distilled water.
Destain solution: 50 ml acetonitrile, 25 ml of 100 mM NH4HCO3 and 25 ml of distilled
water was dissolved to prepare 100 ml of destain solution.
Trypsin solution : Dissolved 1 µg of trypsin (lyophilized) in 100 ml of 25 mM NH4HCO3
to prepare a final concentration of 10-15 ng/ml.
Response to heavy metals & proteomic profile of the isolate 141
CHAPTER FIVE
Rehydration solution: Mixed 5 ml acetonitrile (CAN), 0.5 ml trifluoro acetic acid (TFA)
and 4.5 ml of mili-Q water to prepare 10 ml of rehydration solution.
5.2.1.4. REAGENTS FOR MASS SPECTROMETRY
Reconstitution solution for peptides or matrix (a-cyano-4-hydroxycinnamic acid,
CHCA): Mixed 5 ml acetonitrile (CAN), 10 µl trifluoro acetic acid (TFA) and 4.990 ml of
mili-Q-water to prepare 10 ml of rehydration solution.
5.2.2. METHODS
5.2.2.1. DETERMINATION OF MINIMUM INHIBITORY CONCENTRATION
(MIC) OF METALS
100 µl of inoculum from late log phase was inoculated in 10 ml of 9-K medium with
increasing concentration of metals. The concentration range chosen was as follow (mM);
Zn: 200, 400, 600, 800 and 1000 mM, Pb: 1, 2.5, 5, 7.5, 10, 12.5 and 15 mM. Cu: 10, 25,
50, 75, 100 and 125 mM. Ni: 50, 100, 150, 200 and 250 mM, Mn: 200, 400, 600, 800 and
1000 mM As: 10, 20, 40, 60 and 80 mM, Co: 20, 40, 60, 80, 100, 120 and 140 mM, Cr: 1,
2.5, 5, 7.5, 10, 12.5 and 15 mM, Hg: 0.01, 0.02, 0.03, 0.04, 0.05 0.06 and 0.07 mM.
During the experiment the culture was maintained at optimum temperature and pH. The
metal salts solution of the given concentration was filter sterilized and added to the
medium, which was sterilized by autoclaving. The culture was incubated at 35oC and 180
rpm in shaker incubator. The minimum inhibitory concentration i.e. the lowest
concentration of metal required to cause inhibition of bacterial growth was established
Response to heavy metals & proteomic profile of the isolate 142

CHAPTER FIVE
by measuring the Iron oxidation as an indicator for growth and activity of bacteria by
colorimetric method with 5-sulphosalicylic acid (SSA). Lead forms poorly soluble
complexes with sulfate in 9-K medium, hence to have the actual bioavailable concentration
of the metal in the medium the amount of soluble lead was measured by atomic absorption
spectrometry (AAS) and the insoluble part was removed by filtration.
5.2.2.2. GROWTH CURVE IN PRESENCE OF METALS
The growth carve of the isolate in the presence of these heavy metals was also
established by maintaining the bacterial culture in 100 ml 9-K medium at 35oC in a 250 ml
conical flask with continuous shaking for all the experimental conditions. The sterile heavy
metals were added to the autoclaved medium at a concentration equivalent to its MIC and
the half concentration of MIC. All the flasks were inoculated with 1 ml of inoculum (0.5
Abs). The growth curve was obtained by measuring the Iron oxidation after every two
hours for 140 hrs.
5.1.2.3. PROTEIN EXTRACTION
A: INOCULUM PREPARATION: The inoculum was prepared in 20 ml of 9-K medium
in 50 ml conical flask at 30oC and 180 rpm. Each 3 liter of 9-K medium was inoculated
with 1 ml of inoclum for control and the metals under study.
Response to heavy metals & proteomic profile of the isolate 143

CHAPTER FIVE
B: PROTEIN EXTRACTION
Bacterial cell in the stationary phase about 50 and 80 hrs of incubation for control and
metal study were harvested by centrifugation at 18,000 rpm for 10 minutes. The pelleted
cells were washed with acidic water (pH adjusted to 1.5 with sulfuric acid) and centrifuged
at 10,000 rpm for 10 minutess. The cells were suspended in 200 µl lysis buffer and
sonicated at 46 Hz for 3 minutes with an interval of 30 sec. The cell lysate was subjected to
centrifugation at 15,000 rpm for 30 minutes. Supernatant containing intracellular proteins
was collected and stored at -20oC in sealed Micro Centrifuge tubes for further studies.
C: PROTEIN CONTENT
The protein content was estimated using the Bradford method taking BSA (1mg/ml) as
standard. The absorbance was measured at 595 nm. SDS-PAGE was performed to
elucidate the intracellular protein profile of our bacterium when grown under control and
heavy metal stress conditions.
D: PROTEIN ESTIMATION PROCEDURE
BRADFORD METHOD:
The concentration of bacterial proteins was determined by Bradford protein assay
(Bradford 1976).
1. Standard protein (100 µl), BSA, with various concentration (0.01-0.1 mg per ml)
taken as standards along with blank (with 2 µl rehydration buffer per 100 µl), was
Response to heavy metals & proteomic profile of the isolate 144

CHAPTER FIVE
added in duplicates. Test samples (0.5-2 µl per 100 µl) prepared by serial dilution
were added in duplicates separately.
2. Bradford reagent (1 ml) was added to each sample (blank, standards, and test
samples) and tubes were incubated at 37 oC for 7 minutes in dark.
3. The absorbance was read at 595 nm with Shimadzou Sepectrophotometer and the
protein concentration of test samples was calculated from the standard curve.
5.2.2.4. TWO-DIMENSIONAL GEL ELECTROPHORESIS
A) ISOELECTRIC FOCUSING (TUBE-GEL)
Proteins of our bacterium were resolved by 2-DE, using tube-gel for isoelectric
focusing (IEF) and then, SDS-PAGE (12%). IEF was carried out in vertical tube gel
apparatus and the tubes were 12.5 cm in length with internal diameter of 1.5 mm. the IEF
tubes were cleaned thoroughly with detergent and then with distilled water and dried with
acetone. These tubes were then sealed at one end with parafilm before casting the tube gel.
1. The glass tubes (inner and outer diameters of 1.5 and 4 mm respectively) were
filled with 4.5% tube-gel containing 8 M Urea, 2% Triton-X-100, 6 % ampholite
(pH 3-10) with 7 cm length. Allowed the gel to polymerize for 2-3 h. space of
about 2 cm in length was reserved on the top of the gel in the tubes for loading the
sample.
2. A pre-run at 50 V and 200 V for 15 min each was given. Then, a total of 500 µg
protein and standard pI marker was loaded on tube gel with the help of Hamilton
Response to heavy metals & proteomic profile of the isolate 145

CHAPTER FIVE
syringe and isoelectric focusing was conducted at 200 V for 15 min, 500 V for 15
min, 800 V for 7 h and 1000 V for 15 min respectively.
3. Two buffers, with 0.01M H3PO4 as the upper chamber buffer and 0.02M NaOH as
the lower chamber buffer, were used for IEF.
4. Tube-gel was taken out from the glass tubes using an extrusion needle with the
continuous flushing of water till the gel start coming out from the other end of the
tube. The tube were then incubated in equilibration buffer (containing 6 M Urea,
129 mM DTT, 2% SDS, 20% glycerol, 1.5 M Tris) at room temperature for 30 min.
5. After separating the protein on the basis of their charge in the first dimension, they
were again separated using SDS-PAGE on basis of their molecular weight. Tube-
gel (equilibrated) was aligned on stacking gel for separation of proteins in second-
dimension in 12 % SDS-PAGE.
B) ISOELECTRIC FOCUSING (STRIP-GEL)
Proteins of our bacterium were resolved by 2-DE, using tube-gel for isoelectric focusing
(IEF) and then, SDS-PAGE (12%).
1. The protein sample (500 µg) dissolved in 300 µl of rehydration buffer was spread
horizontally on one side in a well of rehydration tray.
2. Removed the plastic sheet from the immobiline pH gradient (IPG) strip gel (17 cm,
with pI range 3-10) from one side and placed the strip (with gel side downward)
onto the sample and allowed it to absorb the protein sample for 1 h.
Response to heavy metals & proteomic profile of the isolate 146

CHAPTER FIVE
3. Overlayed mineral oil (4 ml) on the IPG strip gel and kept for rehydration at 20oC
for overnight. Mineral oil was added to prevent the evaporation of the sample and
precipitation of urea.
4. Mineral oil was then removed from the strip to remove the unabsorbed proteins and
fresh mineral oil was added to avoid the evaporation of protein sample during the
run.
5. Wet the electrode wicks with mili-Q water (7µl) and placed it on electrodes of IEF
tray (17 cm). IPG strip gel was placed on the IEF tray (with the gel side downward)
after removing the mineral oil. Overlayed mineral oil onto the strip and covered the
tray with lid and placed it on IEF cell (Bio-Rad, Hercules, USA).Run the strip at
the following voltages:
STEP VOLTAGE TIME MODE
1 250 V 30 min Liner mode
2 10,000 V 2:30 h Liner mode
3 10,000 V 40,000 Vh Rapid mode
4 500 V 10 h Rapid mode
6. The IPG strip gel was taken out after Step 3. Removed the mineral oil and kept the
strip gel (with gel side upward) in rehydration tray and stored at -70 oC.
7. The strip gel was equilibrated with equilibration buffer 1 and 2 for 15 min each
respectively and was then, aligned it on stacking gel for separation of proteins in
second-dimension in 12% SDS-PAGE.
Response to heavy metals & proteomic profile of the isolate 147

CHAPTER FIVE
8. the SDS-PAGE was performed using Protean IX system from BIORAD.SDS
electrophoresis was run first at 80 Volts/ gel (30 Minutes), then at 100 Volts/gel
until the dye front was 1mm from the bottom of the gel.
c) SDS_PAGE
1. SDS_PAGE (12%) was carried out in 1.5 mm thick (for tube-gel) or 1.0 mm thick
(for strip gel) discontinuous gel by method of Laemmli (Laemmli et al., 1970), at 40
mA constant current vertical slab gel electrophoresis assembly (Bio-Rad, Hercules,
USA).
2. Prepared 50 ml of 12 % resolving gel and allowed it to polymerize for 20-30 min.
onto it, added 2 ml of 5% stacking gel and allowed it to polymerize.
3. Placed the equilibrated tube gel or IPG strip gel above the stacking gel. Immediately
added melted agarose (0.5%) and aligned the gel along with stacking gel. Molecular
weigh marker (medium range 14.3-97.4 kD) was added in a well along side for
reference.
4. The gel was run at 70 V for 30 min and then, at 150 V till the tracking dye reached
the bottom
5.2.2.5. STAINING
A: SLIVER STAINING
The gel was fixed in fixative for overnight. Then it was washed with 50%
methanol after which it was (5 mins x 3 times) transferred into Hypo solution for 2
Response to heavy metals & proteomic profile of the isolate 148
CHAPTER FIVE
mins. The gel was washed with distilled water (10 mins x 2 times). The gel was
transferred to freshly prepared silver nitrate solution for 20 mins in dark. After 20 mins
the gel was washed with distilled water and developer was added for developing the
spots. After sufficient staining the gel was washed with distilled water and again fixed
in the fixative.
B: COOMASSIE BRILLIANT BLUE STAINING:
The gel was kept in Coomassie stain overnight. Then it was destained with
Destainer-I followed by destainer-II.
5.2.2.6. IN GEL TRYPSIN DIGESTION
1. Protein spots of interest were excised manually from coomassie-stained gel using a
glass capillary.
2. Gel slices trimmed to approximately 1.0 mm diameter and destained by washing
three times with 400 µl of 50% acetonitrile (CAN)/25 mM ammonium bicarbonate
(NH4HCO3), pH 8.0, for 15 min each were then soaked in 100% CAN for 5 min to
dehydrate the gels till it turns opaque/white..
3. CAN was removed and gel slices were dried in speed vacuum for 20-30 min
4. Dried bands were further soaked in 100 µl DTT (25mM) for 1 h at 56 oC
5. Then transferred in 100 µl Iodoacetamide (55mM) and incubated for 45 min in dark
at room temperature.
Response to heavy metals & proteomic profile of the isolate 149

CHAPTER FIVE
6. The gel pieces were washed with 25 mM NH4HCO3 after removing the
Iodoacetamide solution then soaked in 100% CAN for 5 min to dehydrate the gels
till it turns opaque/white.
7. And were rehydrated with approximately 15 µl cold Trypsin solution (Sigma
Sequencing Grade, Modified Trypsin 10-15 ng/ml in 25 mM NH4HCO3, pH 8.0).
8. Rehydrated gel slices were incubated at 37 0C for 16 h followed by soaking in 25-
50 µl of 50% CAN/5% trifluoro acetic acid (TFA) for 30-60 min with gentle
agitation.
9. Bands were kept in extraction buffer for 30-60 minutes with intermediate vortexing
for 1-2 mins. The sample was centrifuged at 12,000 rpm for 10 minutes so that
trimmed gel fragments separates and the supernatant was collected which contained
the peptide fragments for further sample analysis.
10. Supernatant was completely dried using Speed Vac. For 1 hr. samples were stored
at -20 oC for further use.
5.2.2.7. MASS SPECTROMETRY
MALDI-TOF
MALD-TOF-based PMF search analysis was used for identification of protein spots or
differentially expressed proteins.
1. Peptides generated by tryptic digestion of each protein spot were reconstituted in 5
µl of 50% CAN with 0.1% TFA for mass fingerprinting.
Response to heavy metals & proteomic profile of the isolate 150
CHAPTER FIVE
2. These were spotted on the matrix-assisted laser desorption/ionization (MALDI)
plate after mixing with matrix, 5 µl α-cyano-4-hydroxycinnamic acid (CHCA), and
the peptide mass fingerprint (PMF) was obtained using a Voyager-DE-STR mass
spectrometer, (MALDI-TOF-MS) (PreSeptive Biosystems, Framingham, MA,
USA).
3. Spectras were recoded in the reflectance mode using delayed extraction and each
measurement was performed using the following parameters: 20 kV acceleration
voltages. 72% grid voltage, 275-220 ns delay time and low mass gate of 750.
Spectras were accumulated from 100 laser shots.
4. Peptide mass calibration was applied performed with external mass standards
(Calmix 1 and 2; Applied Biosystems).
Response to heavy metals & proteomic profile of the isolate 151

CHAPTER FIVE
5.3. RESULTS
5.3.1. DETERMINATION OF MINIMUM INHIBITORY CONCENTRATION
(MIC)
The MIC of the nine metals, i.e., Zn, Pb, Cu, Co, Ni, As, Hg, Mn and Cr was
determined by macrodilution method. Iron oxidation was determined as an indicator for
growth and activity of bacteria by colorimetric method.
The MIC of these metals was shown that this is the highly resistant bacterium. As we
can see from Table 5.1, this isolate is having the ability to tolerate Zn and Mn toxicity as
high as 700 mM. It is also having high tolerance to nickel and cobalt with 200 and 120 mM
respectively (Table.5.1). These results could be expected; because the mine where this
bacterium was isolated, contain different concentrations of most of these metals specially
zinc and lead, so the organisms from this mine should be adapted to high concentration of
such metals. Although the resistance of bacterium to other metals was less than 100 mM
but with compare to other reports, this much resistance also is high, especially in case of
lead and chromium (10mM). Thus we can be concluded that this strain is one of the most
resistant strains of At. ferrooxidans to different heavy metals.
Response to heavy metals & proteomic profile of the isolate 152

CHAPTER FIVE
Table 5.1. The MIC of nine different heavy metals during the growth of UoP strain
Metals Zn Mn Ni Co Cu As Cr Pb Hg
MIC
(mM)
700 700 200 120 50 30 10 10 0.005
5.3.2. GROWTH PROFILE IN RESPONSE TO HEAVY METALS
The growth profile of the organism was studied in 9-K medium in present of two
different concentrations of these heavy metals. The iron oxidation (Fe3+ concentration) was
recorded spectrophotometerecally at 595 nm at an interval of 5 h for 160 h. The organisms’
growth response was different in all metal salts when compared with the control as shown
in Fig.5.1 (A - D). The basic toxic effect of the metals tested was to cause an increase in
the lag phase of isolates’ growth. At the control condition 45 h of incubation was necessary
for complete oxidation of ferrous iron by bacterium whereas in the presence of 700 mM Zn
and 10 mM Pb oxidation of ferrous iron was completed in 160 h. Similar results were also
obtained for manganese, nickel and copper that more than 140 h was required for complete
oxidation of ferrous iron. In the case of other heavy metals 70 – 90 h incubation time was
necessary for completion of growth.
Response to heavy metals & proteomic profile of the isolate 153

CHAPTER FIVE
The UoP strain had a lag phase of 40 to 50 h in presence of different heavy metals as
compared to 15-20 h in the control. However in the medium containing chromium less lag
phase obtained than the control. Hence we have tested the effect of chromium oxide on
iron oxidation in the medium without inoculum. As can be seen from Fig.5.2. in the
medium without inoculum also we had some amount of oxidation of iron as 35-40 % of
iron was oxidized after 30 hours of incubation but the remaining 65 % of oxidation was
microbially. Hence, we can conclude that chromium oxide due to its oxidation activity can
increases the rate of chemical oxidation of ferrous sulfate
Table. 5.2. The amount of Fe(III) concentration (g/l) during the growth of bacterial
strain UoP at different concentrations of heavy metals. (A) zinc and lead, (B) arsenate,
mercury and copper (C) chromium and cobalt, (D); manganese and nickel
(A)
Time (h) Control 400 mM Zn 700 mM Zn 5 mM Pb 10 mM Pb 0 0.235 0.223 0.264 0.324 0.286 19 0.584 0.35 0.354 0.362 0.264 25 1.028 0.7 0.39 0.7 0.3 43 3.03 1.012 0.435 1.538 0.459 50 3.57 1.2 0.414 2.281 0.822 69 3.896 2.612 0.701 4.096 1.06 91 3.686 3 0.928 3.929 1.617 125 3.2 1.432 2.237 150 2.21 3.07 170 3
Response to heavy metals & proteomic profile of the isolate 154

CHAPTER FIVE
(B):
Time (h) Control 25mM Cu 50mM Cu 15mM As 30mM As 0.005mM
Hg 0 0.235 0.22 0.25 0.28 0.125 0.06 19 0.584 0.424 0.312 0.331 0.155 0.062 25 1.028 0.45 0.3 0.35 0.25 0.15 43 3.03 0.531 0.463 0.365 0.455 0.2 50 3.57 0.6 0.5 0.65 0.52 0.25 69 3.896 0.962 0.849 0.948 0.758 0.38 91 3.686 1.26 1.16 1.136 1.125 0.72 125 2.4 2.2 1.8 1.65 1.2 150 2.9 2.8 2.5 2.22 1.7 170 3.1 3 2.8 2.55 2.3
(C)
Time (h) Cotrol 5mM Cr 10 mM Cr 60mM Co 120 mM
Co 0 0.235 0.913 1.461 0.25 0.3
19 0.584 1.26 2.271 0.397 0.31 25 1.028 2 2.3 0.68 0.8 43 3.03 3.562 3.639 1.634 1.076 50 3.57 3.714 3.725 1.95 1.5 69 3.896 4.175 4.12 2.096 1.988 91 3.686 3.929 3.923 2.28 2.538
(D)
Time (h) Control 500mm Mn 700mM Mn 200mM Ni 100mM Ni 0 0.235 0.25 0.22 0.26 0.22 19 0.584 0.985 0.252 0.336 0.228 25 1.028 1.2 0.26 0.4 0.5 43 3.03 1.694 0.262 0.586 0.513 50 3.57 2 0.32 0.8 0.6 69 3.896 2.8 0.878 1.264 0.813 91 3.686 2.95 1.867 2.637 1.67 125 3.1 2.41 2.9 2.1 150 3.2 2.9 3.3 2.5
Response to heavy metals & proteomic profile of the isolate 155

CHAPTER FIVE
0
0.5
1
1.5
2
2.5
3
3.5
4
4.5
0 20 40 60 80 100 120 140 160 180Time (h)
Fe3+
con
cent
ratio
(g/l)
Control 400 mM Zn 700 mM Zn 5 mM Pb 10 mM Pb
(A)
0
0.51
1.52
2.53
3.54
4.5
0 20 40 60 80 100 120Time (h)
Fe3+
con
cent
ratio
n (g
/l)
Control 5 mM Cr 10 mM Cr 60 mM Co 120 mM Co
(B)
Response to heavy metals & proteomic profile of the isolate 156

CHAPTER FIVE
0
1
2
3
4
5
0 20 40 60 80 100 120 140 160 180Time (h)
Fe3+
con
cent
ratio
n (g
/l)Control 25 mM Cu 50 mM Cu20 mM As 30 mM As 0.005 mM Hg
(C)
00.5
11.5
22.5
33.5
44.5
0 20 40 60 80 100 120 140 160Time (h)
Fe3+
con
cent
ratio
n (g
/l)
Control 500 mM Mn 700 mM Mn100 mM Ni 200 mM Ni
(D)
Fig. 5.1. (A-D) Growth profile of UoP strain in response to different
concentrations of different heavy metals.
Response to heavy metals & proteomic profile of the isolate 157

CHAPTER FIVE
0
1
2
3
4
5
0 10 20 30 40 50 60 70 80 90Time (h)
Fe3+
con
cent
ratio
n (g
/l)With Inoculum Without Inoculum
Fig. 5.2. Effect of chromium on the conversion of ferrous into ferric ions by the
bacterial isolate. Medium contains 10 mM chromium.
Response to heavy metals & proteomic profile of the isolate 158
CHAPTER FIVE
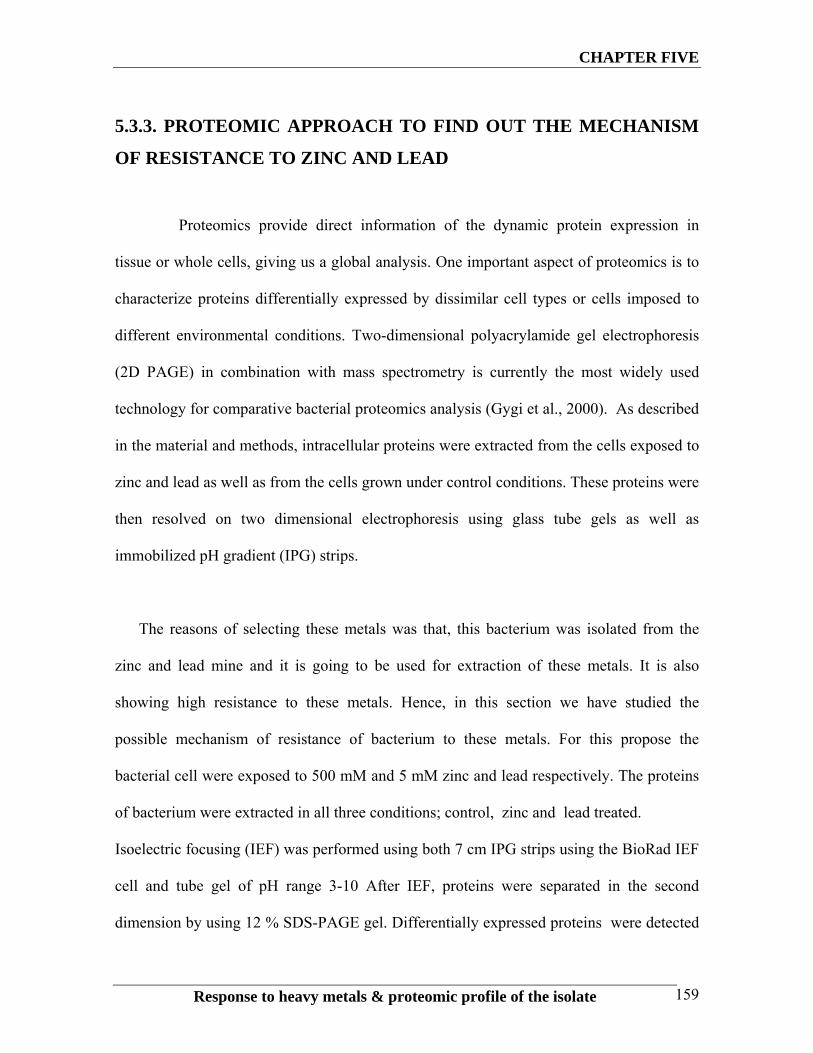
5.3.3. PROTEOMIC APPROACH TO FIND OUT THE MECHANISM
OF RESISTANCE TO ZINC AND LEAD
Proteomics provide direct information of the dynamic protein expression in
tissue or whole cells, giving us a global analysis. One important aspect of proteomics is to
characterize proteins differentially expressed by dissimilar cell types or cells imposed to
different environmental conditions. Two-dimensional polyacrylamide gel electrophoresis
(2D PAGE) in combination with mass spectrometry is currently the most widely used
technology for comparative bacterial proteomics analysis (Gygi et al., 2000). As described
in the material and methods, intracellular proteins were extracted from the cells exposed to
zinc and lead as well as from the cells grown under control conditions. These proteins were
then resolved on two dimensional electrophoresis using glass tube gels as well as
immobilized pH gradient (IPG) strips.
The reasons of selecting these metals was that, this bacterium was isolated from the
zinc and lead mine and it is going to be used for extraction of these metals. It is also
showing high resistance to these metals. Hence, in this section we have studied the
possible mechanism of resistance of bacterium to these metals. For this propose the
bacterial cell were exposed to 500 mM and 5 mM zinc and lead respectively. The proteins
of bacterium were extracted in all three conditions; control, zinc and lead treated.
Isoelectric focusing (IEF) was performed using both 7 cm IPG strips using the BioRad IEF
cell and tube gel of pH range 3-10 After IEF, proteins were separated in the second
dimension by using 12 % SDS-PAGE gel. Differentially expressed proteins were detected
Response to heavy metals & proteomic profile of the isolate 159
CHAPTER FIVE
visually and treated as separate spots. The 2D electrophoresis was repeated three times to
confirm the differentially expressed proteins. Spots were excised and digested with
proteolytic enzymes. Peptide mass fingerprints were created and analyzed with MADLI-
TOF. Proteins were identified by different bioinformatics softwares. MALDI mass spectra
were recorded in the mass range of 800-4000 Da. For protein identification two search
engines, MASCOT and ProFound, were used for database interrogation. A protein was
considered as identified when the same ID was found as first hit in both ProFound and
MASCOT searches. The probability-based score of either 50 in MASCOT or 1.5 in
Profound was taken as acceptable.
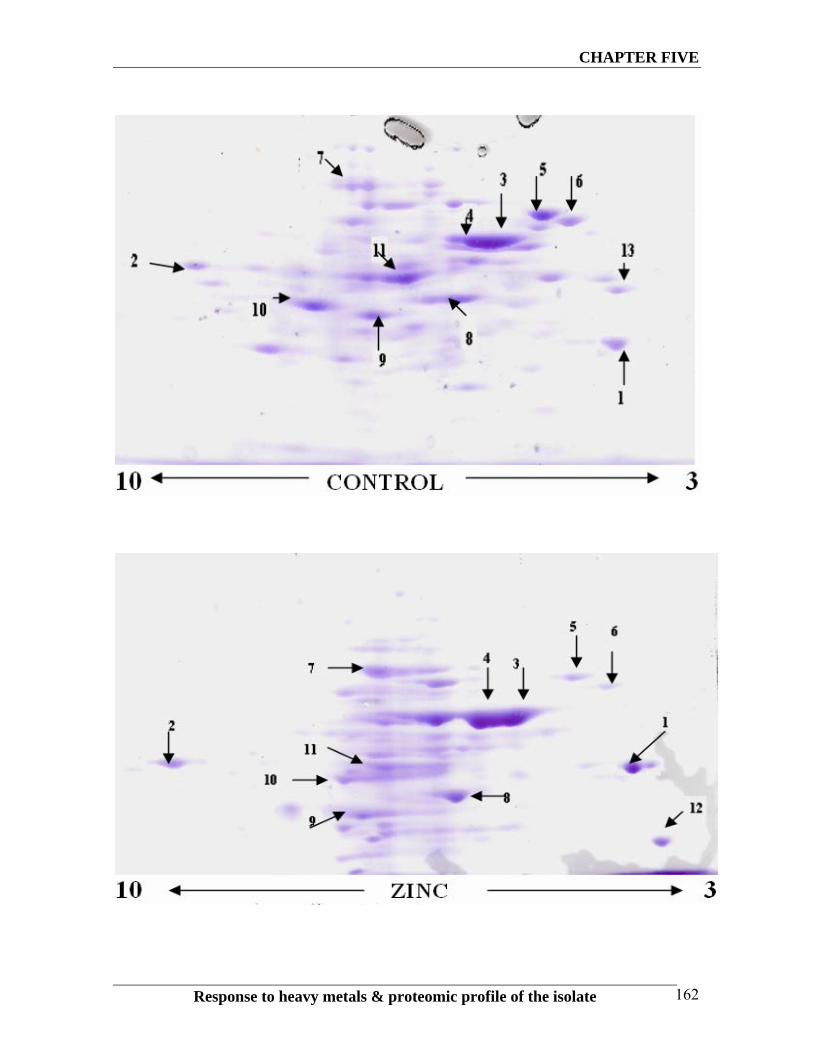
There are certain spots, which are specific to each of the growth conditions. Some of the
proteins are showing over expression or down expression when the cells were exposed to
metals. These differences are marked in the gel pictures with arrow as shown in the Fig.
5.3.
The results of 2D PAGE have indicated that under the influence of metals, there was a
differential regulation of proteins to cope-up with the metal toxicity. More than 13 proteins
have been differentially expressed. In the presence of lead there were four protein spots,
which were differentially expressed in lead treated cells as compared to the control. In
presence of zinc also there were seven protein spots, which were differentially expressed in
zinc treated cell. Certain spots were present in control but were absent or under expressed
in zinc and lead treated cells. From the above results it is clear that certain proteins are
differentially expressed in presence of metals. It can be speculated that these proteins have
some defined role to play in the tolerance of metals.
Response to heavy metals & proteomic profile of the isolate 160

CHAPTER FIVE
The highly over expressed protein was the protein with 30-40 KDa molecular weight
and with pI 4-5 which was over expressed in presence of both the metals (lead and zinc)
but the degree of over expressions was higher in case of lead treated cells (spot No. 1, Fig.
5.3. This protein is identified as major Outer Membrane Protein of At. ferrooxidans
(OMP40) with significant ProFound score (2.25) (Table. 5.3). It seems that this protein has
the significant role in resistance to metals toxicity as it was over expressed in response to
both the metals. The second most over expressed protein, had 60 KD molecular weight
with pI of 6-7 which is over expressed in presence of zinc and lead (Spot 4., Fig.5.3) but
the degree of over expressions was higher in case of zinc treated cells. This protein
showed highest significant ProFound score (1.64) and identified as Putative DNA
Restriction Methylase (Salmonella typhi) (Table 5.3). These enzymes protect the cells from
exogenous DNA, most species have DNA modification methylase but the actual role of
this enzyme in metal resistance is still unclear and there is no report on that
Response to heavy metals & proteomic profile of the isolate 161
CHAPTER FIVE
Response to heavy metals & proteomic profile of the isolate 162

CHAPTER FIVE
Fig. 5.3 2D PAGE diagram showing the differential expression of intracellular
proteins in bacterial grown in the presence of metals. Spot nos. 1, 2, and 3 are over
expressed in lead and zinc treated samples. Spot nos. 4, 5 and 6 are over expressed only in
zinc treated cells. Spot nos. 7, 8, 9, 10 are down regulated in metals treated cells when
compared with control. Spot nos. 11, 12, 13 only down regulated in lead treated cells.
Response to heavy metals & proteomic profile of the isolate 163

CHAPTER FIVE
In the presence of lead we had two more over expressed proteins (Spots No.2 and 3) but
most of other proteins were down regulated or completely disappeared in presence of lead
in comparison with the control. Those over expressed proteins had shown less ProFound
score but one of them was very basic protein (pI 9), which showed more similarity to
Holo-synthase Protein (Spot No 2). The degree of over expression of this protein is more
in Lead treated cells as compared to the same in Zinc treated cells. This enzyme belongs to
the family of transferase, specifically those transferring non-standard substituted phosphate
roups.
s are described and their possible roles in metals
sistance are discussed next section.
g
In contrast to lead and control, the number of over expressed proteins in the presence of
zinc was higher. Most of them are in the pI range of 5 -7 with different molecular weights
(Spots No 3, 4, 12). One of such protein is the protein with molecular weight of around 60
KD (Spot No 3) and showed similarity to Chapronin 60 kDa subunit with 0.9 ProFound
score (Table 5.3). Another over expressed spot (Spot No 12) in presence of zinc was
similar to Hypothetical protein of Pseudomonas syringae with top score of 62 in Mascot
search (Table 5.3). All these protein
re
There are certain proteins which have been down regulated when treated with metals.
As compared to the control five proteins have been found to be down regulated or
completly absent in strain when exposed to zinc and lead. One of these proteins (Spot No
Response to heavy metals & proteomic profile of the isolate 164

CHAPTER FIVE
11) was identified as CBBL (Ribulose bisphosphate carboxylase large subunite) of At.
ferrooxidans with the high Profound score of 2.25 and Mascot score 115 (Table 5.3). This
is an enzyme that plays a role in Calvin cycle to catalyze the first major step of carbon
fixation. The results also showed that the level of enzyme decreased in presence of heavy
metals (zinc and lead). RuBisCo is very important enzyme for the chemolithoautotrophs as
they use carbon dioxide as a carbon source. There are other 2-3 proteins which have been
down regulated in metal treated cells which have similar molecular weigh in the pI range
of 5-6. One of these proteins (Spot No. 8) showed more similarity to Hypothetical protein
SO-408 of Shewanella oneidensis with the marching of 11 of 35 peptides. Other (Spot No
0) is Putative glutamines with 9 out of 54 peptides matching (Table 5.3).
1
Response to heavy metals & proteomic profile of the isolate 165
CHAPTER FIVE
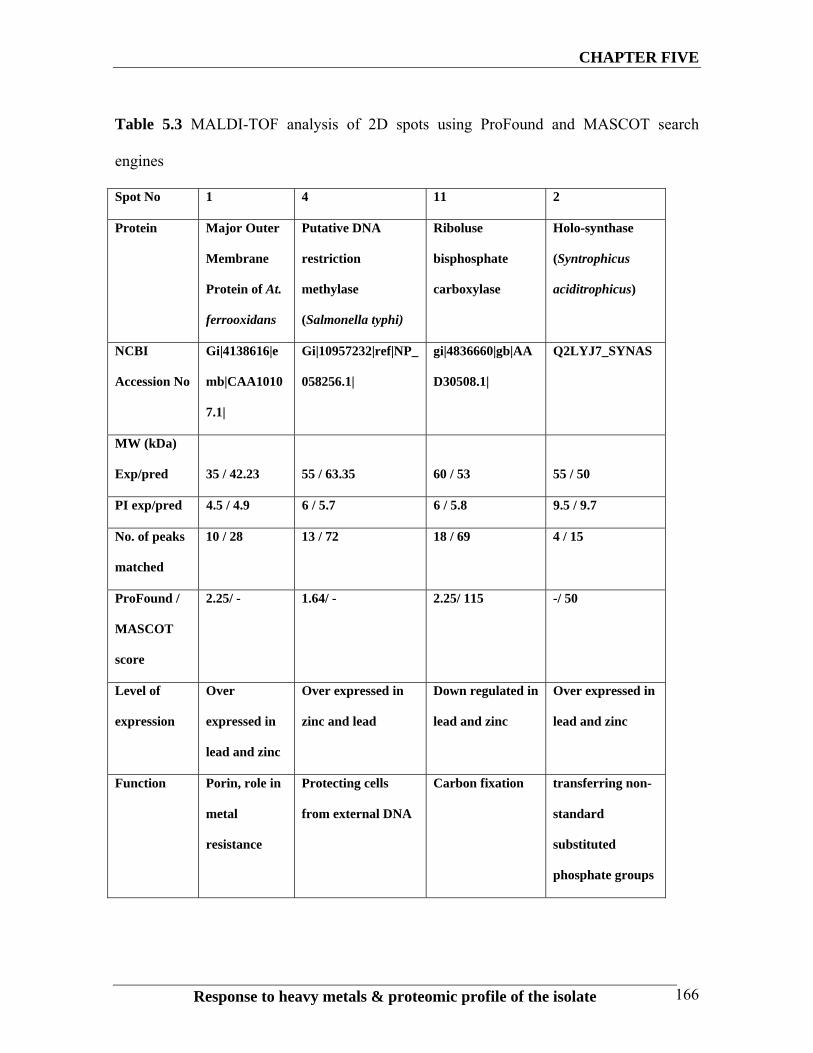
Table 5.3 MALDI-TOF analysis of 2D spots using ProFound and MASCOT search
engines
Spot No 1 4 11 2
Protein Major Outer
Membrane
Protein of At.
ferrooxidans
Putative DNA
restriction
methylase
(Salmonella typhi)
Riboluse
bisphosphate
carboxylase
Holo-synthase
(Syntrophicus
aciditrophicus)
NCBI
Accession No
Gi|4138616|e
mb|CAA1010
7.1|
Gi|10957232|ref|NP_
058256.1|
gi|4836660|gb|AA
D30508.1|
Q2LYJ7_SYNAS
MW (kDa)
Exp/pred
35 / 42.23
55 / 63.35
60 / 53
55 / 50
PI exp/pred 4.5 / 4.9 6 / 5.7 6 / 5.8 9.5 / 9.7
No. of peaks
matched
10 / 28 13 / 72 18 / 69 4 / 15
ProFound /
MASCOT
score
2.25/ - 1.64/ - 2.25/ 115 -/ 50
Level of
expression
Over
expressed in
lead and zinc
Over expressed in
zinc and lead
Down regulated in
lead and zinc
Over expressed in
lead and zinc
Function Porin, role in
metal
resistance
Protecting cells
from external DNA
Carbon fixation transferring non-
standard
substituted
phosphate groups
Response to heavy metals & proteomic profile of the isolate 166

CHAPTER FIVE
5.4. DISCUSSION
Micro-organisms require the presence of a certain metals that play essential
biochemical roles such as catalysts, enzyme co-factors, activity in redox processes and
stabilizing protein structures [Bruins et al., 2000]. Metals may accumulate above normal
physiological concentrations by the action of unspecific, constitutively expressed transport
systems, whereby they become toxic. Intracellular metals can exert a toxic effect by
forming coordinate bonds with anions blocking functional groups of enzymes, inhibiting
transport systems, displacing essential metals from their native binding sites and disrupting
cellular membrane integrity [Nies, 1999]. There are five basic mechanisms that convey an
increased level of cellular resistance to metals: (1) efflux of the toxic metal out of the cell;
(2) enzymic conversion; (3) intra- or extracellular sequestration; (4) exclusion by a
permeability barrier; and (5) reduction in sensitivity of cellular targets. In the last part of
this investigation we have investigated the level of tolerance to heavy metals among the
bioleaching related organism. Also we have studied the mechanism of bacterium to zinc
and lead toxicities at biochemical level (proteomics). For this purpose we have studied the
MIC of different metals. Studies on At. ferrooxidans from different mines, showed that this
bacterium generally tolerate wide range of heavy metals [Touvinen 1971, Leduc 1994].
Results of the present investigation are on similar lines. For metals like Zn and Mn our
isolate shows high degree of resistance.
Response to heavy metals & proteomic profile of the isolate 167

CHAPTER FIVE
The MIC was determined for nine metals and resistant to 700 mM zinc and manganese
was observed. The tolerance for other metals was in the range of 50 – 200 mM. However
low resistance was observed for lead, chromium and mercury (10, 10 and 0.005 mM
respectively). A similar study by Tuovinen et al. (1971) have shown that At. ferroxidans is
able to oxidize ferrous iron in the presence of high concentrations (10 g/l) of Zn, Ni, Cu,
Co, Mn and Al whilst Ag and anions of Te, As and Se were shown to have an inhibitory
effect on the iron oxidation activity of bacteria at concentration of 50 – 100 mg/l. The
resistance to 700 mM of Zn was one of the highest concentrations, which has been
reported earlier [Renata et al. 2005; Novo et al.2000 and Tuovinen et al.1971]. It has been
shown that the toxicity of Zn(II) to At. ferrooxidans depends on the growth substrate.
Kondratyeva et al. (1995) suggested zinc resistance is chromosomally encoded. Adaptation
of the strain to increased levels of Zn(II) resulted in an increase in genome fragment size,
suggesting increased copy numbers of the operon encoding the putative Zn(II) resistance
genes.
The resistance of our bacterium to Ni and Cu can be compared with results obtained by
Chisholm et al. (1998) indicating average of 160 mM Cu2+ and Ni2+ resistance among
different strains of At. ferrooxidan., In another study, Novo et al., (2000) had reported
resistance of At. ferrooxidans to 200 and 600 mM of Cu and Ni respectively and also
Sampson & Phillips reported the oxidation of Fe(II) by an unadapted mixed culture of
Response to heavy metals & proteomic profile of the isolate 168

CHAPTER FIVE
mesophilic acidophiles. For the mechanism of growth inhibition by Ni(II), it has been
suggested that Ni(II) binds to the cell surface, where it inhibits the RISC enzymes sulfur
dioxygenase and sulfite oxidase, and ultimately growth [Maeda et al., 1996; Nogami et al.,
1997]. Also differential protein expression of bacteria in expose to Ni(II) has been
analyzed by Novo et al. 2000 but no resistance mechanisms have been characterized.
Results of present investigation on Cu, Co and Hg are matching with the results of Garcia
et al report where it has been reported that 50 mM and 0.005 mM MIC for Cu and Hg.
Although At. ferrooxidans was shown to be highly resistant to Cu(II), virtually all of the
acidophiles were found to be more resistant than E. coli.
As regard to the arsenate toxicity it has been suggested that the toxicity of As(V) to
microorganisms is due to replacement of phosphate in cellular processes, inhibiting a
plethora of biological reactions. In metal-leaching biooxidation vessels, As(V) inhibition
can be alleviated by increasing phosphate concentrations, likely counteracting the toxic
action of As(V).
Response to heavy metals & proteomic profile of the isolate 169
CHAPTER FIVE
The growth profiles of the organism in the presence of the metals were investigated.
The log phase of isolate in the presence of different heavy metals was 40 to 50 h as
compared to 15 h in the control. These were expectable results because Garcia et al (1991),
Touvinen et al. (1985) and Renata et al. (2005) have been reported increase in the lag
phase of At. ferrooxidans and At. thiooxidans growth when exposed to different heavy
metals like cobalt, cupper, zinc and mercury.
At the control condition 45 h of incubation was necessary for complete oxidation of
ferrous iron by isolate whereas in the presence of heavy metals tended to increase between
90 h to 160 h. This prolonged growth was highest in the case of 700 mM Zn and 200 mM
Ni and 50 mM Cu. These results are comparable with the report of Novo et al. (2000)
where 100 h incubation time was reported for completion of ferrous iron oxidation in the
presence of 200 mM Cu whereas as at control conditions the same was reported as 48 h.
Based on the results of MIC of different heavy metals and growth behavior of isolates to
those concentrations, we can conclude that this strain is highly resistant to many of the
toxic metal ions. This property makes it an appropriate isolate for metal leaching
investigation and could be used in the industrial leaching processes.
Response to heavy metals & proteomic profile of the isolate 170
CHAPTER FIVE
We have studied the mechanism of resistance of our isolate to zinc and lead toxicity by
proteomics methods (2D gel electrophoresis and MALDI-TOF MS). Proteomics provide
direct information on the dynamics protein expression in tissue or whole cells. One
important aspect of proteomics is to characterize proteins differentially expressed by
dissimilar cell types or cells exposed to different environmental conditions. Two-
dimensional polyacrylamide gel electrophoresis (2D PAGE) in combination with mass
spectrometry is currently the most widely used technology for comparative bacterial
proteomics analysis [Gygi et al., 2000]. The high reproducibility of 2D PAGE is
particularly valuable for multiple sample comparisons. In addition, it directly correlates the
changes observed at the peptide level to individual protein isoforms. Several studies have
used 2D PAGE to study changes in protein expression of At. ferrooxidans under different
growth conditions. Proteins induced under heat shock [Varela and Jerez, 1992], pH stress
[Amaro et al., 1991], phosphate limitation [Seeger and Jerez, 1993; Vera et al., 2003] or
presence of heavy metals like copper [Novo et al., 2003)]have been reported. A set of
proteins that changed their levels of synthesis during growth of At. ferrooxidans ATCC
19859 in metal sulfides, thiosulfate, elemental sulfur and ferrous iron have been
characterized by using 2D PAGE [Ramirez et al., 2004].
Changes in the protein expression pattern when the organism is grown in different
conditions have been recorded with 2-D electrophoresis. The results clearly indicate that
there are proteins that are specifically up regulated or down regulated under specific
Response to heavy metals & proteomic profile of the isolate 171
CHAPTER FIVE
growth conditions. There are also proteins, which are specifically expressed in the presence
of both the zinc and lead. This is also a confirmation of presence of some common
regulatory systems for the treatment of different metals. Over all the protein numbers in the
control is found to be more than that of zinc and lead which indicate that due to high
toxicity of metals some proteins are completely inhibited.
The results of 2D PAGE indicated that more than 13 proteins are showing differential
expression in response to a metal treatment. One of the identified proteins is a major outer
membrane protein or OMP40 and it has role in bacterial tolerance to zinc and lead.
Molecular characterization of this protein suggests that OMP40 is a porin [Guiliani and
Jerez 2000]. Rodriguze et al (1986) also described a porin-like protein in the outer
membrane of At. ferrooxidans. This protein has been reported to be over expressed in
response to external pH and phosphate starvation [Jerez et al. 1992] and high
concentrations of metals like copper, zinc, nickel, or cadmium etc [Novo et al., 2000,
2003]. The bacteria make use of the specialized pore-forming proteins (porins) to facilitate
the passage of small hydrophilic molecules through their outer membrane. A major outer
membrane protein having an apparent molecular mass of 40 KDa (OMP40) in At.
ferrooxidans has been known to be organized in a trimetric structure and to form a slightly
anionic channel [Jerez et al., 1992; Guiliani and Jerez 2000]. The structure of OMP40
protein is similar to the E. coli OMPC involved in response to osmotic pressure [Guiliani
and Jerez, 2000]. The relative content of OMP40 in the outer membrane has been known to
be increased when cells grown at pH 3.5 or when cells were grown under phosphate
Response to heavy metals & proteomic profile of the isolate 172

CHAPTER FIVE
starved condition. Since OMP40 is a major outer membrane protein and has a similar
structure to that of E. coli OMPC, OMP40 is expected to be involved in rgulation of
response to osmotic pressure. However, the detailed information on effects of increasing
concentration of salts on the synthesis of OMP40 is not available. Since pH in the medium
become acidic due to the production of sulfate during sulfur oxidation, the increased
amount of OMP40 in sulfur-grown cells has implied that OMP40 is involved in the
adaptation of the cell to acidic conditions. Since an increased concentration of metal ions
(Zn and Pb) has an inhibitory effect on growth of UoP cells, the cell must develop the
mechanism allowing it to control the free passage of metal ions from the outside. The
results obtained in this study implied that OMP40 is involved in the adaptation of cell to
the increased concentration of toxic metals.
Another important protein which has been identified and showed down expression under
the metals treated conditions is the Ribulose bisphosphate carboxylase. This protein is an
enzyme that is used in the Calvin cycle to catalyze the first major step of carbon fixation.
RuBisCo is vital for the chemolitotrophic bacteria for carbon fixation. The results showed
that the level of enzyme decreased in presence of heavy metals (zinc and lead) and these
are expected results as in the presence of metals bacterial growth and activity is decreased
as compared to control.
The third identified protein was putative DNA restriction methylase (Salmonella typhi). To
protect the cell from exogenous DNA, most species have DNA modification methylase but
the actual role of this enzyme in metal resistance is still unclear and there is no report till
Response to heavy metals & proteomic profile of the isolate 173

CHAPTER FIVE
date. DNA methylases catalyze the transfer of a methyl group to DNA from S-adenosyl-L-
methionine, which is consequently converted to S-adenosyl-L-homocysteine [Morita et al.,
2008]. The later two proteins (RuBisCo and putative DNA restriction methylase) which are
differentially expressed have not been reported earlier under heavy metal stress.
The Holo-(acyl carrier protein) synthase (AcpS) is another enzyme which showed
threshold score with MASCOT search engine. This enzyme belongs to the family of
transferase, specifically those transferring non-standard substituted phosphate groups. It is
the central coenzyme of fatty acid biosynthesis and also has previously been identified and
shown to be essential for E. coli growth. Over expression of this protein in the presence of
metals suggested that the organism tried to adapt to the high concentrations of metals by
over expressing this protein which can help in enhancing the biosynthesis of fatty acids to
adapt to the toxic metals.
Thus, the functional analysis of the identified proteins, though very few, is able to
explained the basis of tolerance of heavy metals. The mechanism of lead tolerance at
protein level has been reported before and to the best of our knowledge this is the first
study of its type.
Response to heavy metals & proteomic profile of the isolate 174