Embed Size (px)
Citation preview
Protocol for Improved Ultraviolet Disinfection Design and System
Optimization
PNCWA 2010Bend, OR
26 October 2010
Jeff Bandy, Ph.D.Carollo Engineers
WRF06/2-019
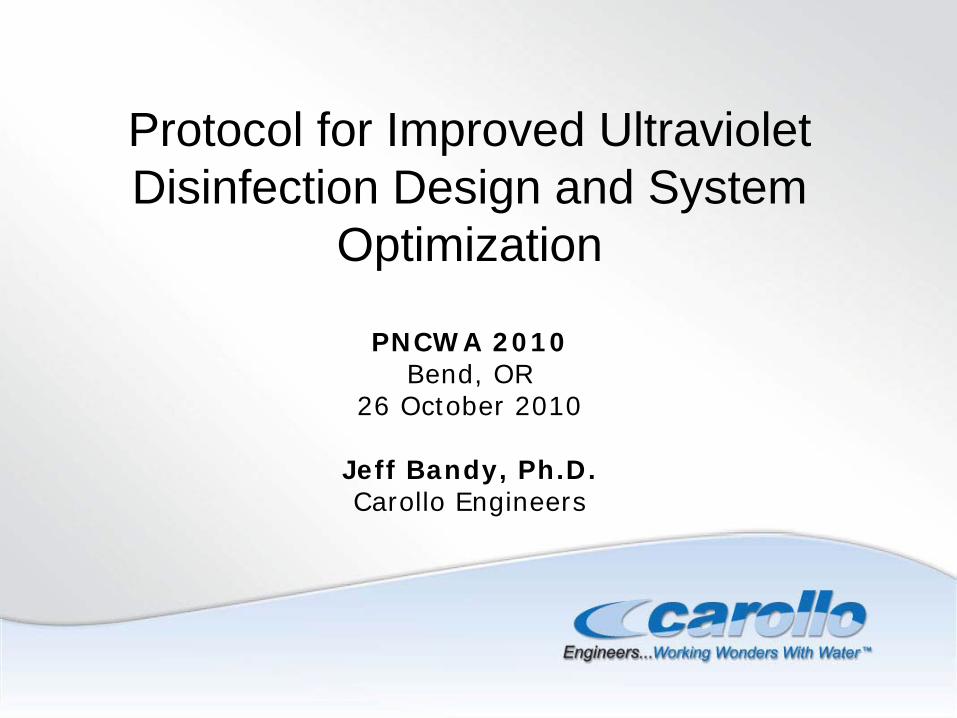
Quick Outline
1. NWRI bioassay testing: requirements, nuances, and challenges
2. Case study: Trojan UV3000 at City of Escondido’s Hale Avenue Resource Recovery Facility
3. A few take-home messages
WRF06/3-019
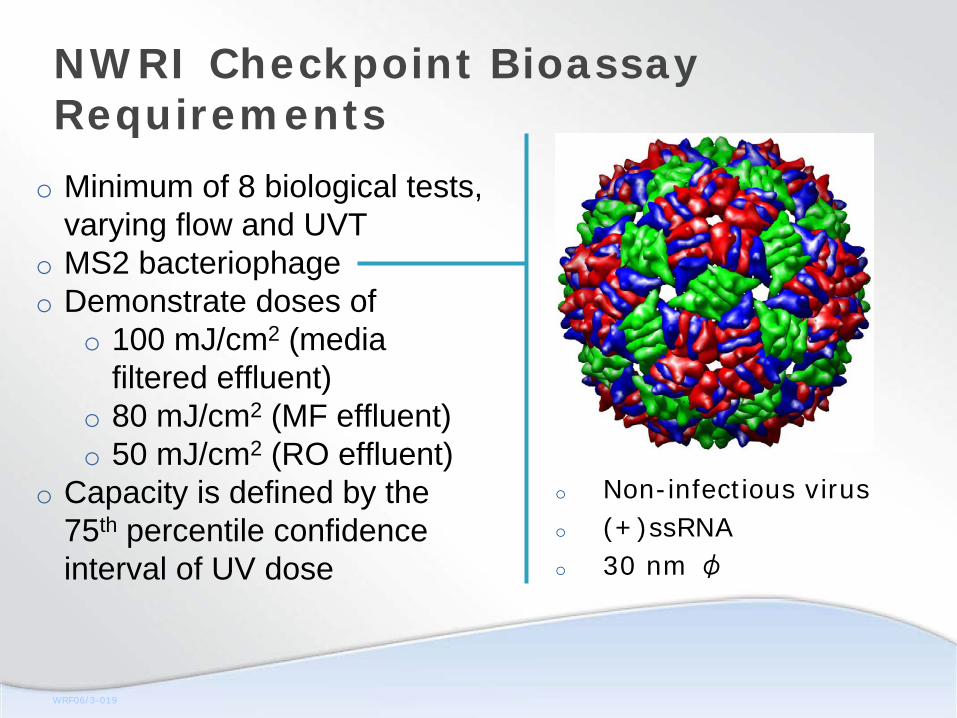
NWRI Checkpoint Bioassay Requirements
o Minimum of 8 biological tests, varying flow and UVT
o MS2 bacteriophageo Demonstrate doses of
o 100 mJ/cm2 (media filtered effluent)
o 80 mJ/cm2 (MF effluent)o 50 mJ/cm2 (RO effluent)
o Capacity is defined by the 75th percentile confidence interval of UV dose
o Non-infectious viruso (+)ssRNAo 30 nm φ
WRF06/4-019
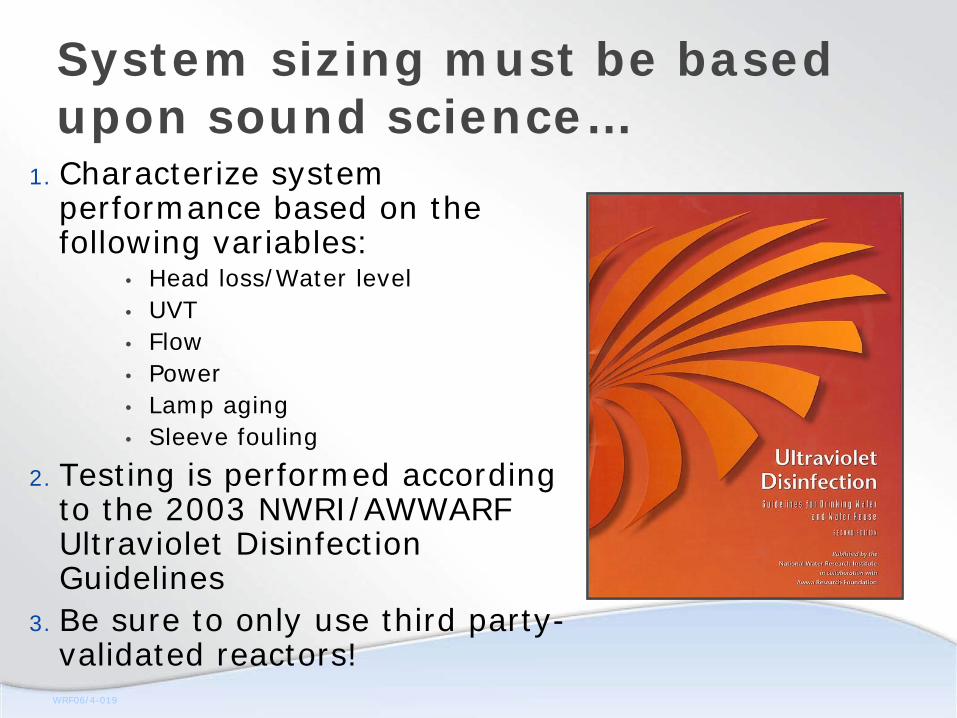
System sizing must be based upon sound science…
1. Characterize system performance based on the following variables:
• Head loss/Water level• UVT• Flow• Power• Lamp aging• Sleeve fouling
2. Testing is performed according to the 2003 NWRI/AWWARF Ultraviolet Disinfection Guidelines
3. Be sure to only use third party- validated reactors!
WRF06/5-019
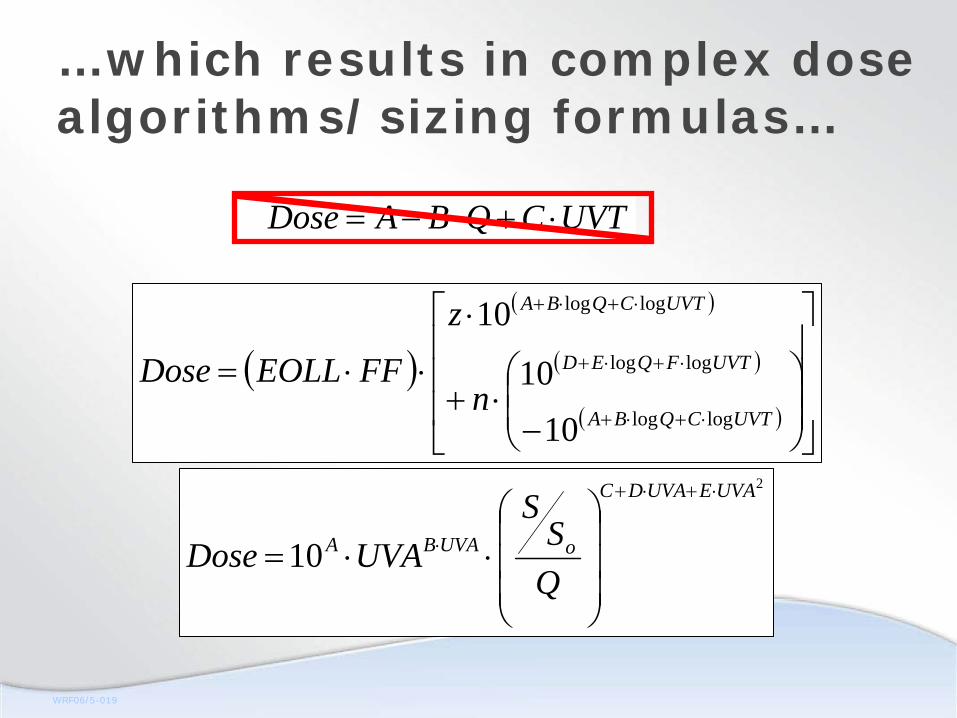
…which results in complex dose algorithms/sizing formulas…
2
10
UVAEUVADC
oUVABA
QS
SUVADose
⋅+⋅+
⋅
⎟⎟⎟
⎠
⎞
⎜⎜⎜
⎝
⎛⋅⋅=
UVTCQBADose ⋅+⋅−=
( )
( )
( )
( ) ⎥⎥⎥
⎦
⎤
⎢⎢⎢
⎣
⎡
⎟⎟⎠
⎞⎜⎜⎝
⎛
−⋅+
⋅
⋅⋅=⋅+⋅+
⋅+⋅+
⋅+⋅+
UVTCQBA
UVTFQED
UVTCQBA
n
zFFEOLLDose
loglog
loglog
loglog
1010
10
WRF06/6-019
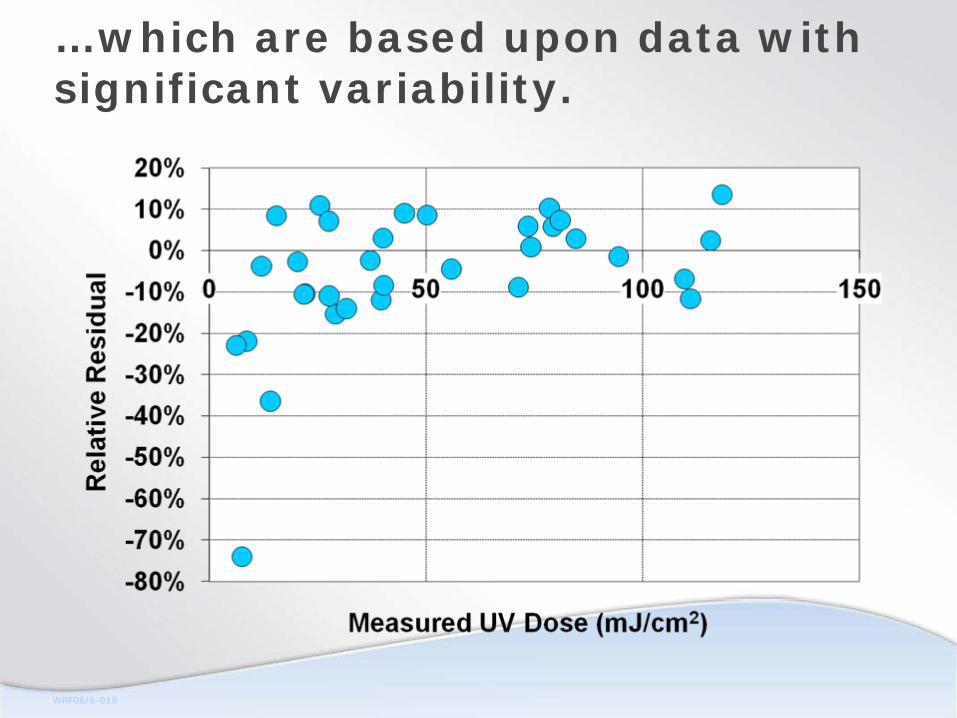
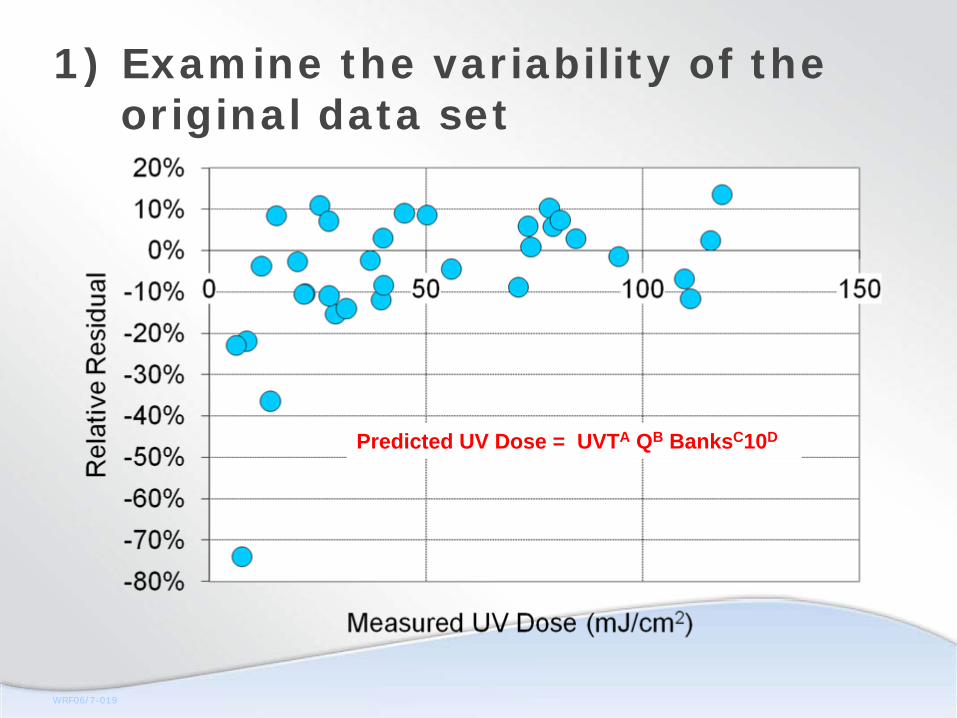
…which are based upon data with significant variability.
WRF06/7-019
1) Examine the variability of the original data set
Predicted UV Dose = UVTA QB BanksC10D
WRF06/8-019
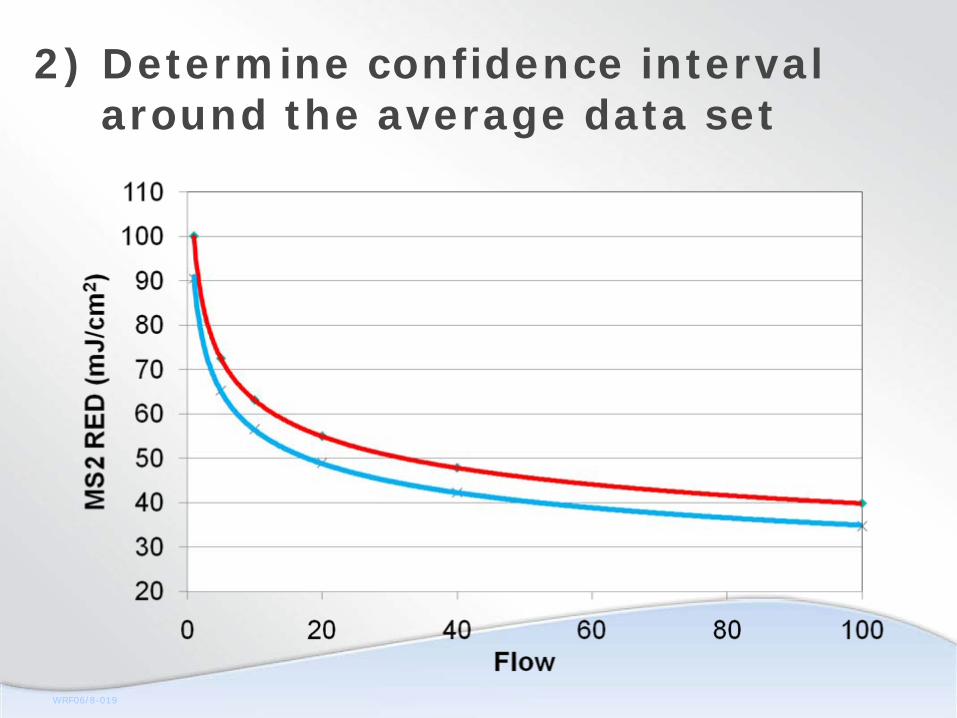
2) Determine confidence interval around the average data set
WRF06/9-019
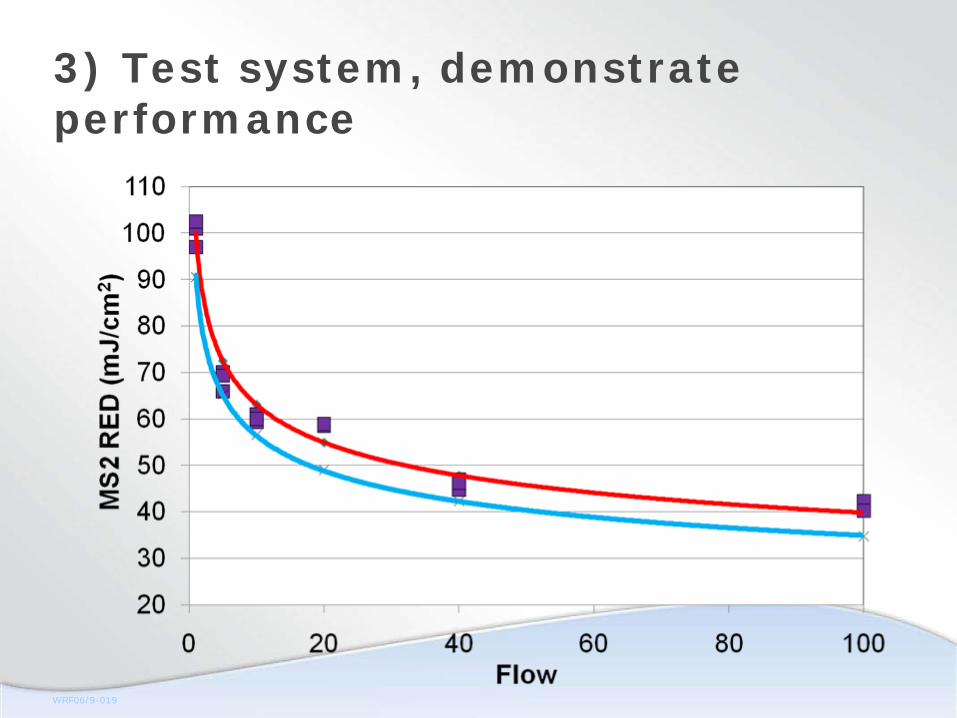
3) Test system, demonstrate performance
WRF06/10-019
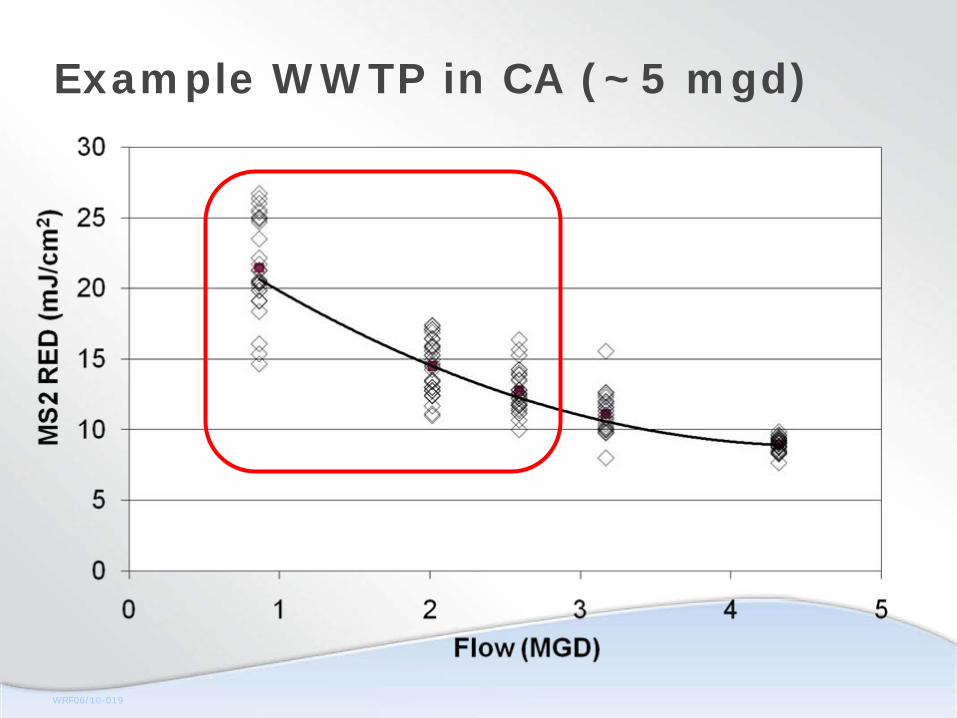
Example WWTP in CA (~5 mgd)
Wedeco Lancaster
WRF06/11-019
William Duke
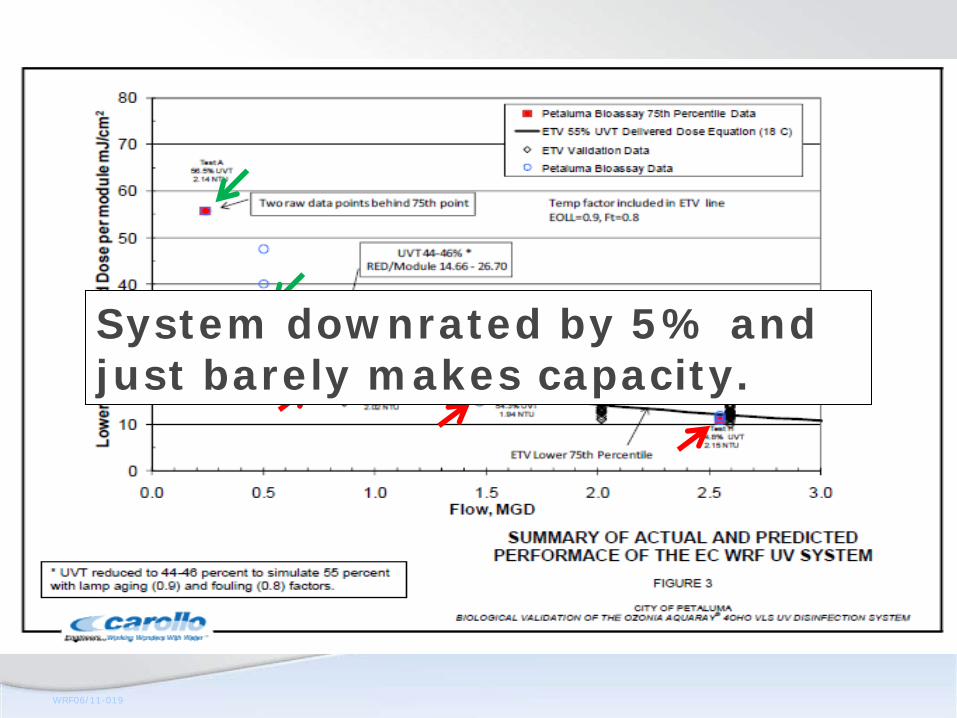
System downrated by 5% and just barely makes capacity.
WRF06/12-019
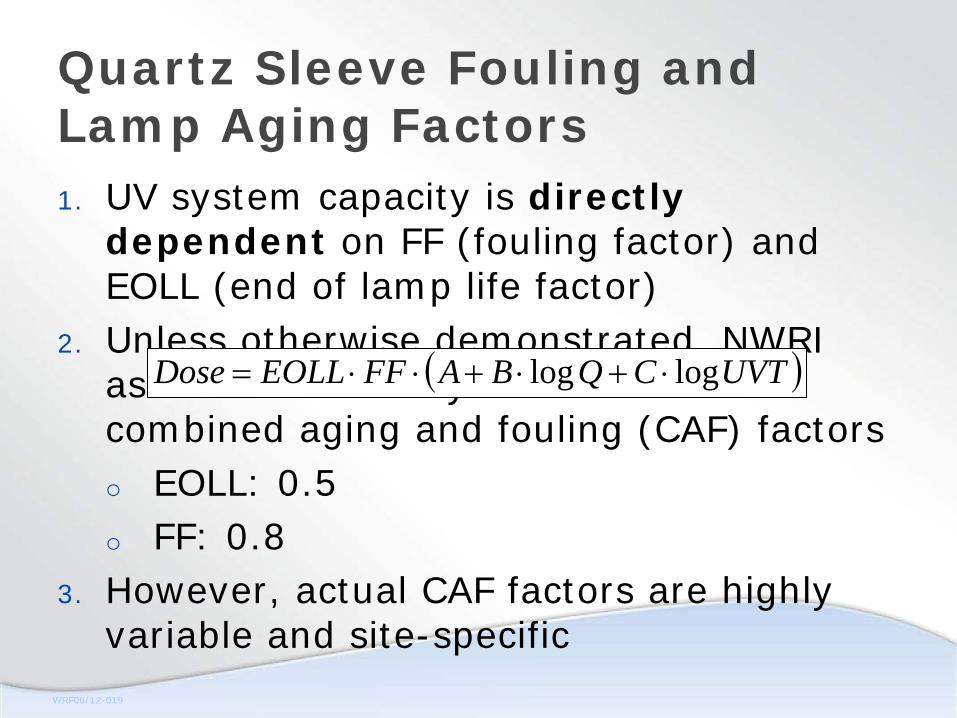
Quartz Sleeve Fouling and Lamp Aging Factors1. UV system capacity is directly
dependent on FF (fouling factor) and EOLL (end of lamp life factor)
2. Unless otherwise demonstrated, NWRI assumes extremely conservative combined aging and fouling (CAF) factorso EOLL: 0.5o FF: 0.8
3. However, actual CAF factors are highly variable and site-specific
( )UVTCQBAFFEOLLDose loglog ⋅+⋅+⋅⋅=
WRF06/13-019
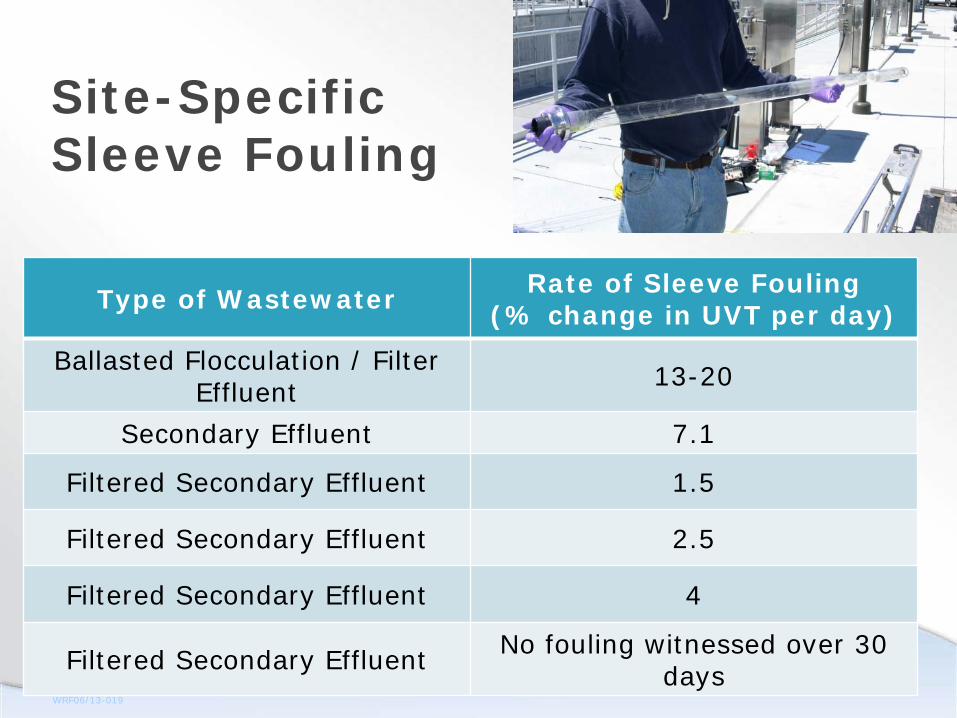
Site-Specific Sleeve Fouling
Type of Wastewater Rate of Sleeve Fouling (% change in UVT per day)
Ballasted Flocculation / Filter Effluent 13-20
Secondary Effluent 7.1
Filtered Secondary Effluent 1.5
Filtered Secondary Effluent 2.5
Filtered Secondary Effluent 4
Filtered Secondary Effluent No fouling witnessed over 30 days
WRF06/14-019
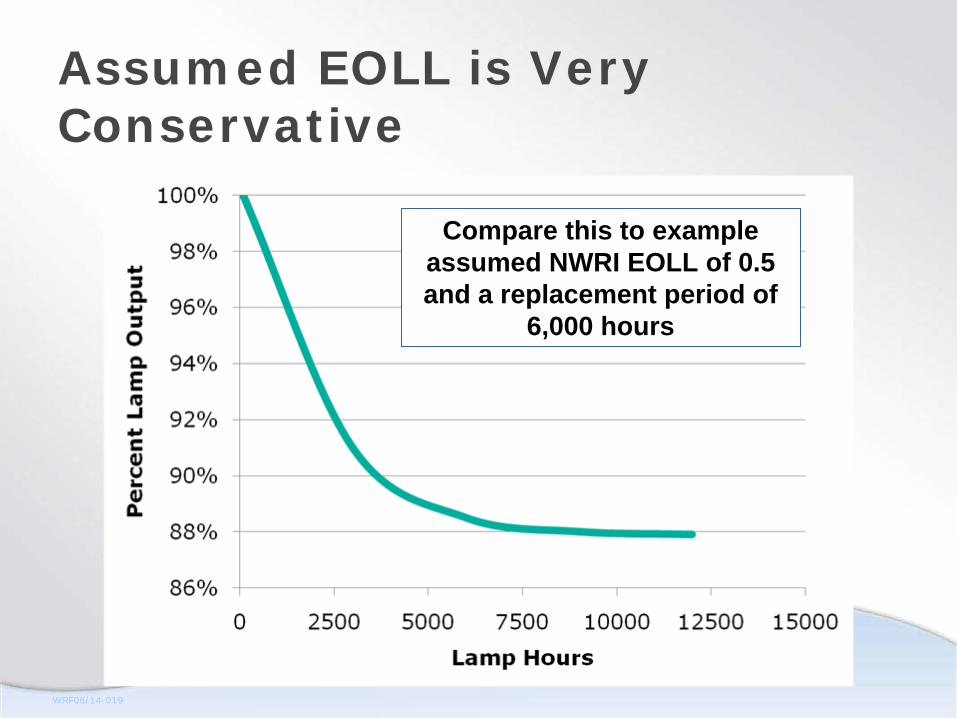
Assumed EOLL is Very Conservative
Compare this to example assumed NWRI EOLL of 0.5 and a replacement period of
6,000 hours
WRF06/15-019
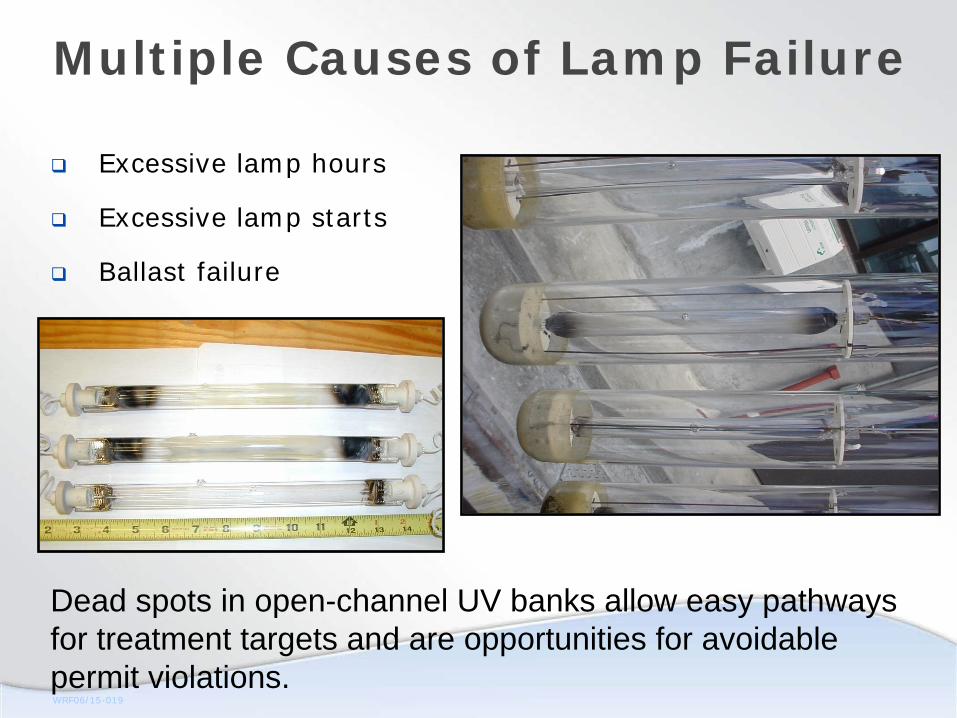
Multiple Causes of Lamp Failure
Excessive lamp hours
Excessive lamp starts
Ballast failure
Dead spots in open-channel UV banks allow easy pathways for treatment targets and are opportunities for avoidable permit violations.

WRF06/16-019
Regrowth Permit Violations
WRF06/17-019
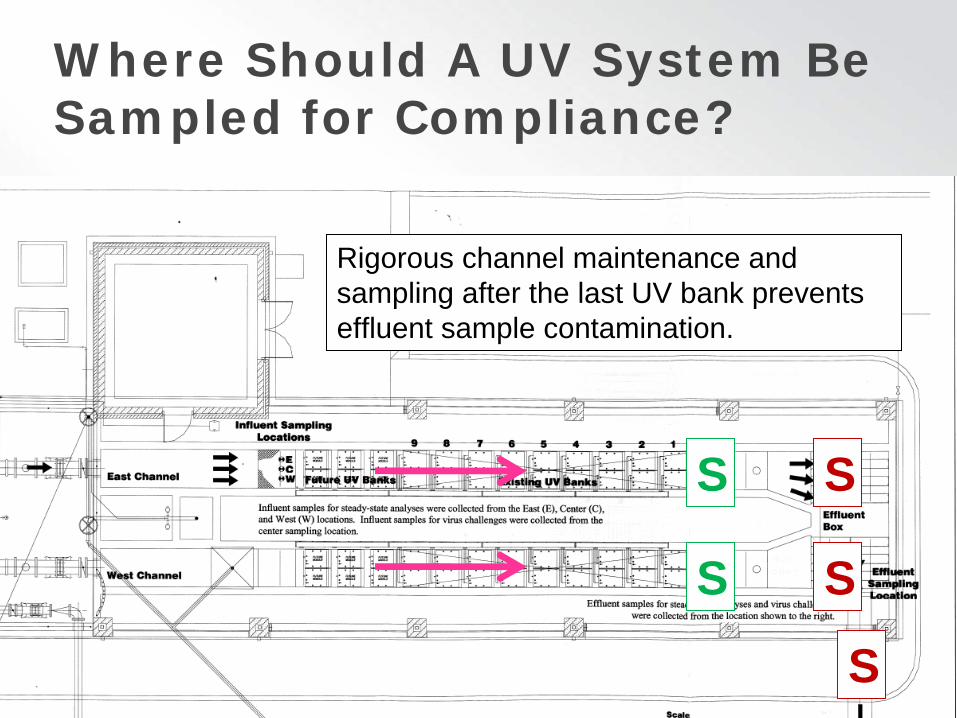
Where Should A UV System Be Sampled for Compliance?
S
S
S
S
S
Rigorous channel maintenance and sampling after the last UV bank prevents effluent sample contamination.
WRF06/18-019
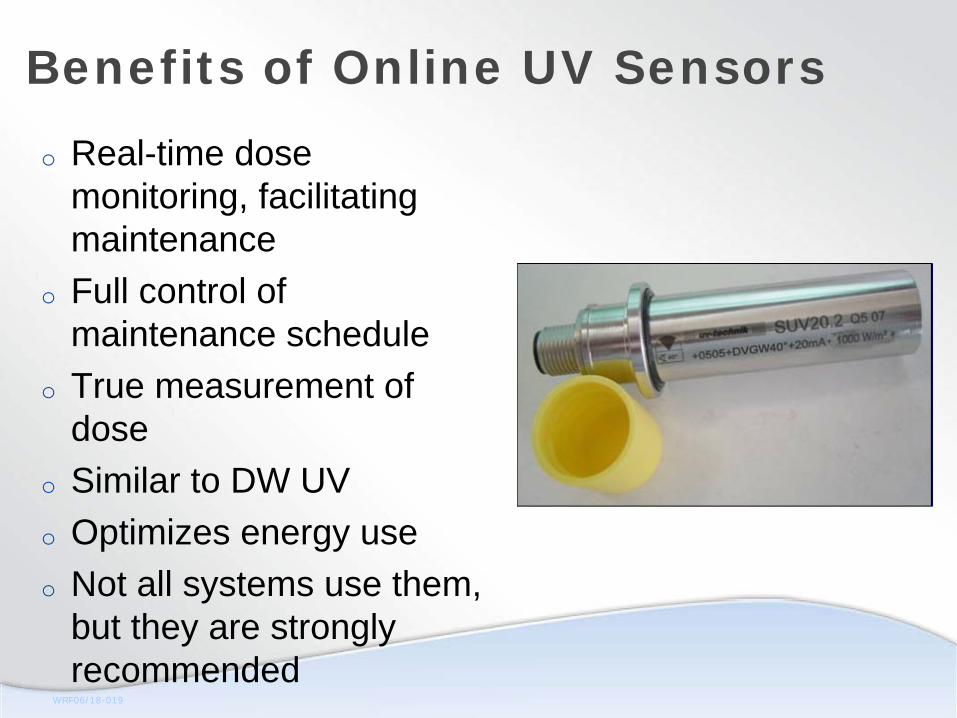
Benefits of Online UV Sensors
o Real-time dose monitoring, facilitating maintenance
o Full control of maintenance schedule
o True measurement of dose
o Similar to DW UVo Optimizes energy useo Not all systems use them,
but they are strongly recommended
WRF06/19-019
Case Study: City of Escondido Hale Avenue Resource Recovery Facility (HARRF) Trojan UV3000
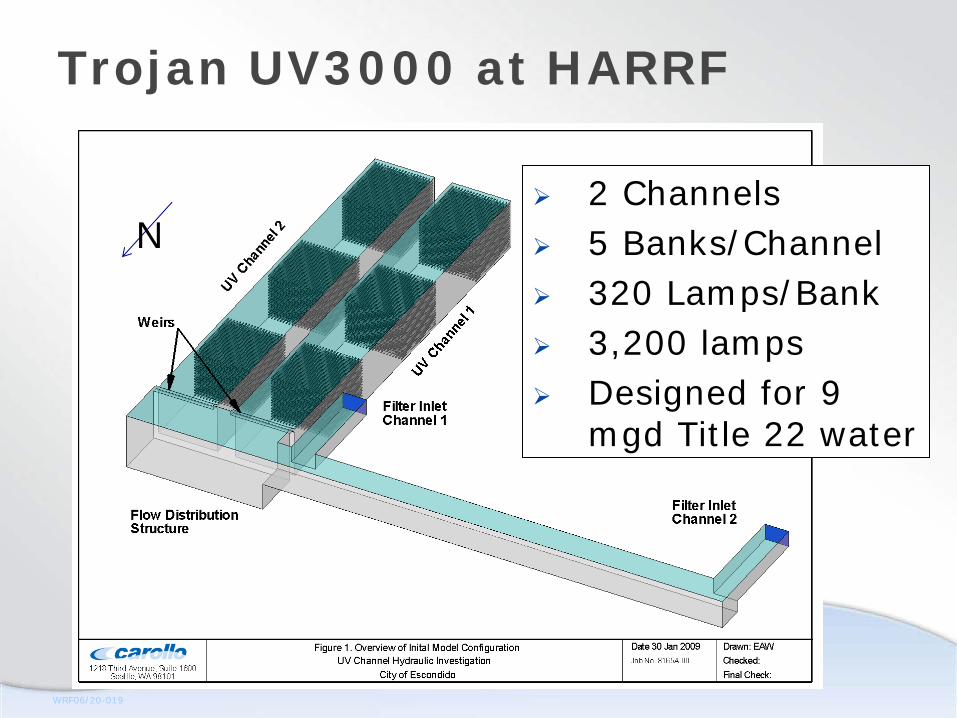
Carollo was hired to benchmark Trojan UV3000 system, diagnose problems, and increase capacity for Title 22 reuse.
WRF06/20-019
Trojan UV3000 at HARRF
2 Channels5 Banks/Channel320 Lamps/Bank3,200 lampsDesigned for 9 mgd Title 22 water
N

WRF06/21-019
Trojan UV3000 at HARRF
WRF06/22-019
N
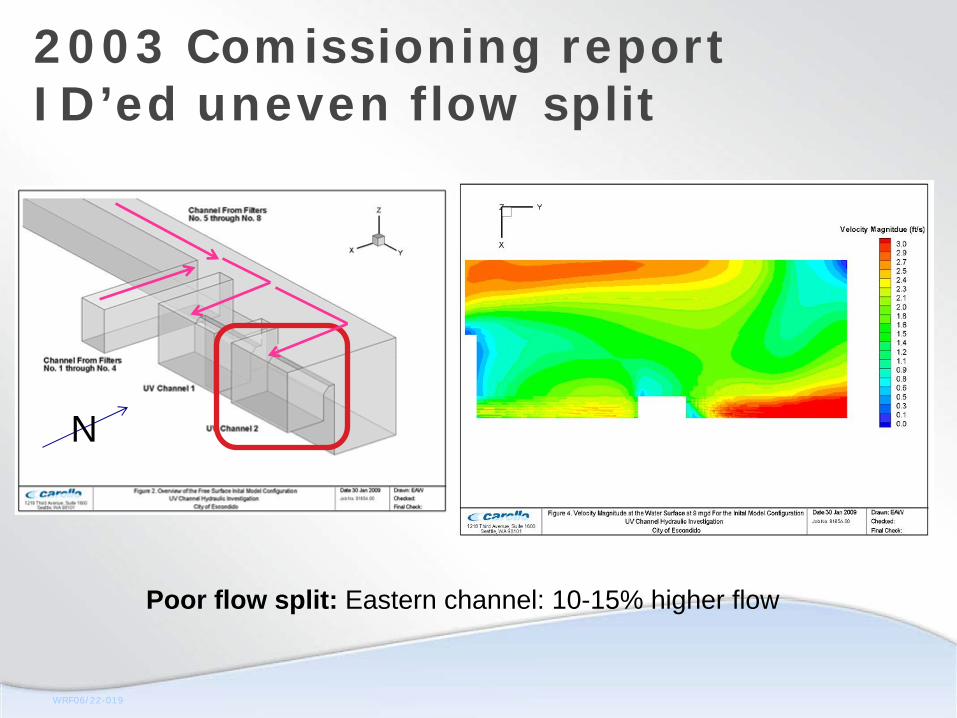
Poor flow split: Eastern channel: 10-15% higher flow
2003 Comissioning report ID’ed uneven flow split
WRF06/23-019
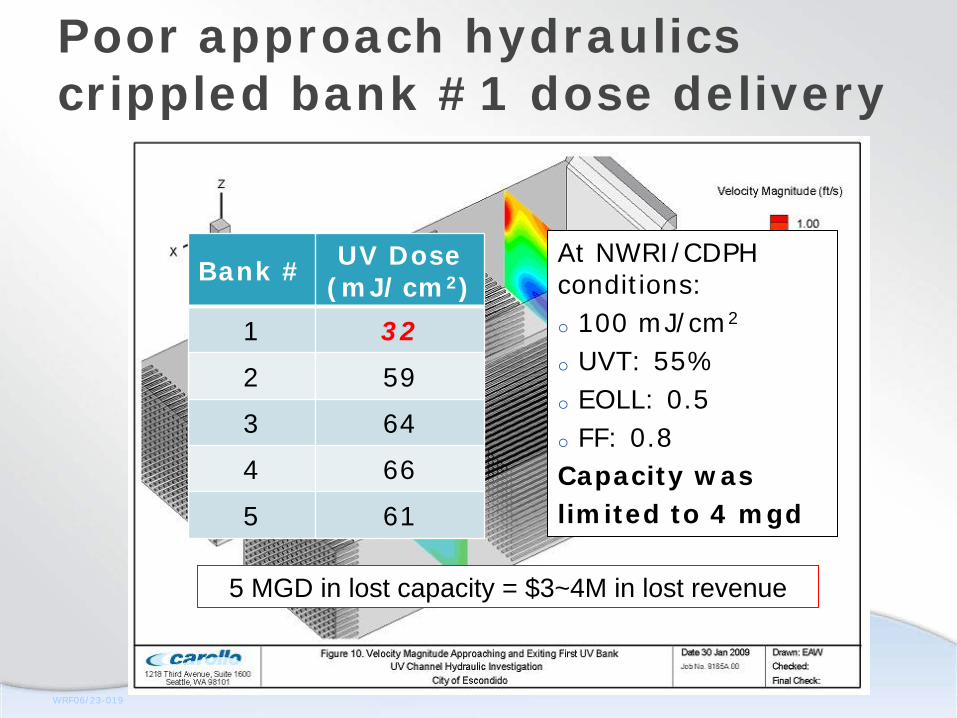
Bank # UV Dose (mJ/cm2)
1 32
2 59
3 64
4 66
5 61
At NWRI/CDPH conditions:o 100 mJ/cm2
o UVT: 55%o EOLL: 0.5o FF: 0.8Capacity waslimited to 4 mgd
Poor approach hydraulics crippled bank #1 dose delivery
5 MGD in lost capacity = $3~4M in lost revenue
WRF06/24-019
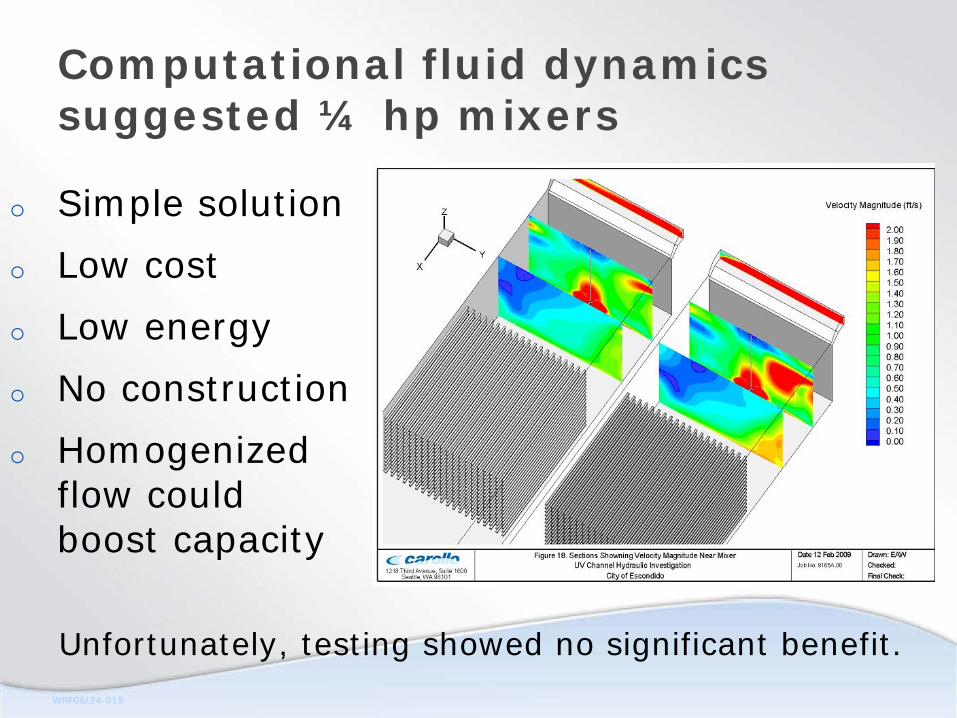
Computational fluid dynamics suggested ¼ hp mixers
o Simple solution
o Low cost
o Low energy
o No construction
o Homogenized flow could boost capacity
Unfortunately, testing showed no significant benefit.
WRF06/25-019
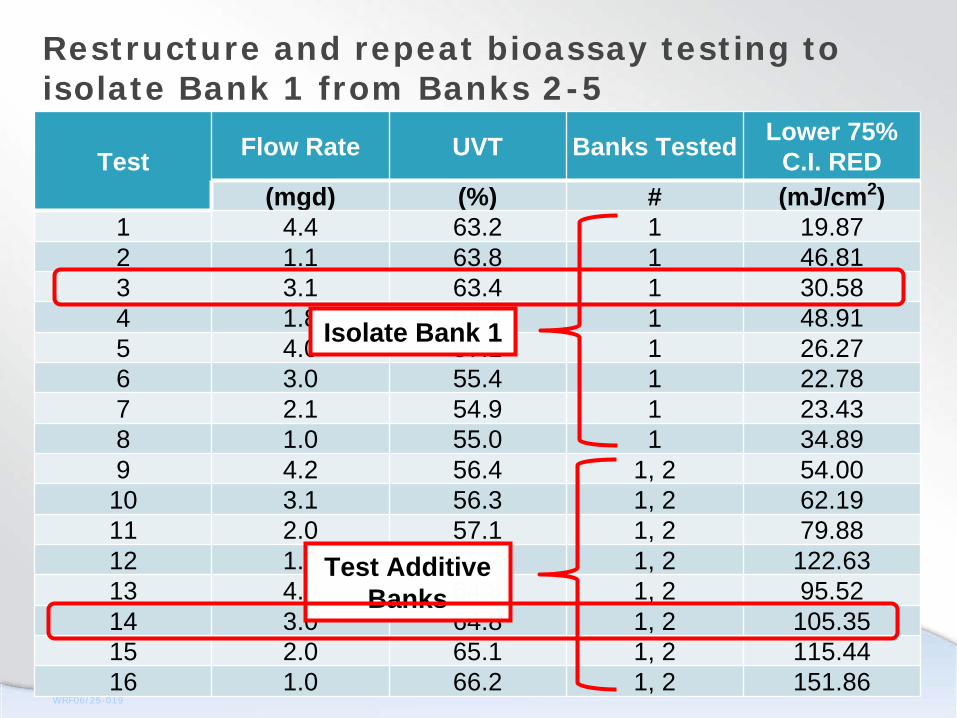
Test Flow Rate UVT Banks Tested Lower 75% C.I. RED
(mgd) (%) # (mJ/cm2)1 4.4 63.2 1 19.872 1.1 63.8 1 46.813 3.1 63.4 1 30.584 1.8 64.4 1 48.915 4.0 57.1 1 26.276 3.0 55.4 1 22.787 2.1 54.9 1 23.438 1.0 55.0 1 34.899 4.2 56.4 1, 2 54.0010 3.1 56.3 1, 2 62.1911 2.0 57.1 1, 2 79.8812 1.0 56.3 1, 2 122.6313 4.0 64.8 1, 2 95.5214 3.0 64.8 1, 2 105.3515 2.0 65.1 1, 2 115.4416 1.0 66.2 1, 2 151.86
Restructure and repeat bioassay testing to isolate Bank 1 from Banks 2-5
Isolate Bank 1
Test Additive Banks
WRF06/26-019
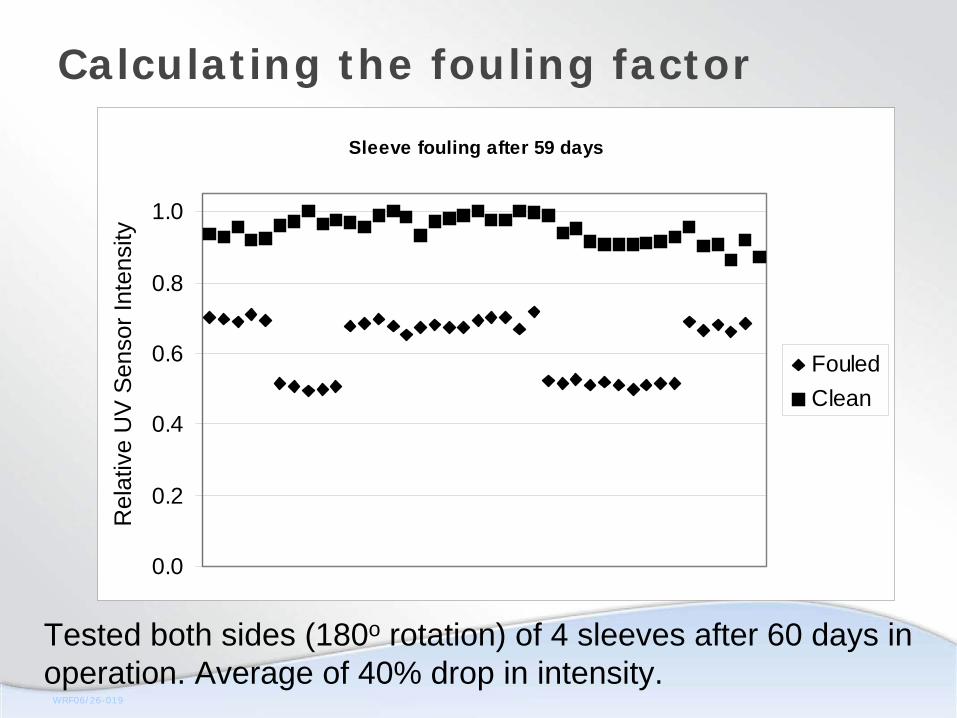
Calculating the fouling factor
Tested both sides (180o rotation) of 4 sleeves after 60 days in operation. Average of 40% drop in intensity.
Sleeve fouling after 59 days
0.0
0.2
0.4
0.6
0.8
1.0
Rel
ativ
e Se
nsor
Rea
d
FouledClean
Rel
ativ
e U
V S
enso
r Int
ensi
ty
WRF06/27-019
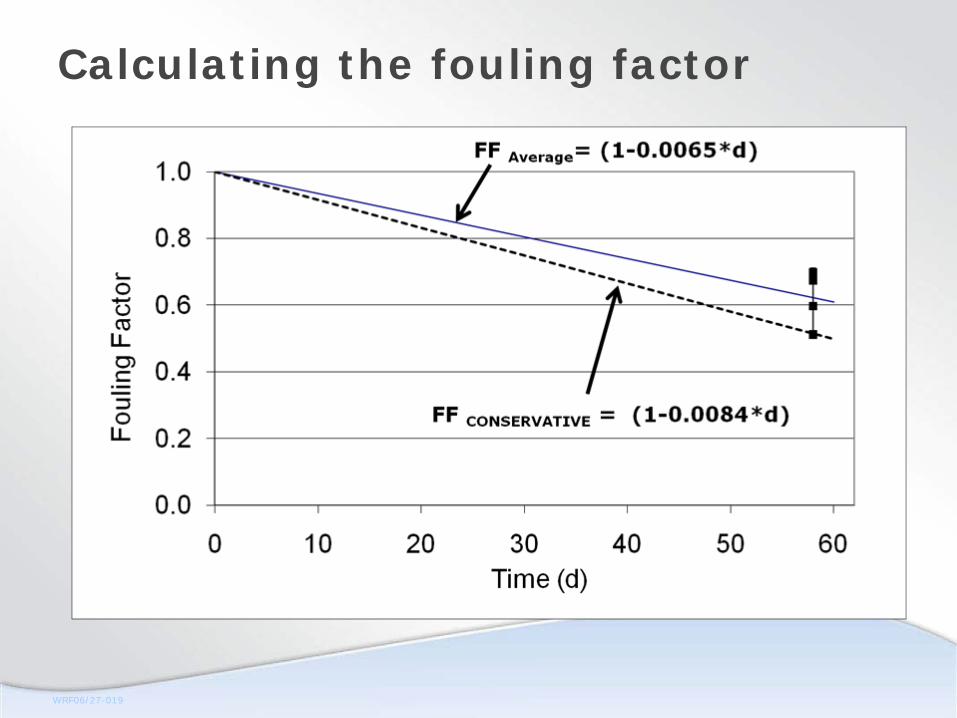
Calculating the fouling factor
WRF06/28-019
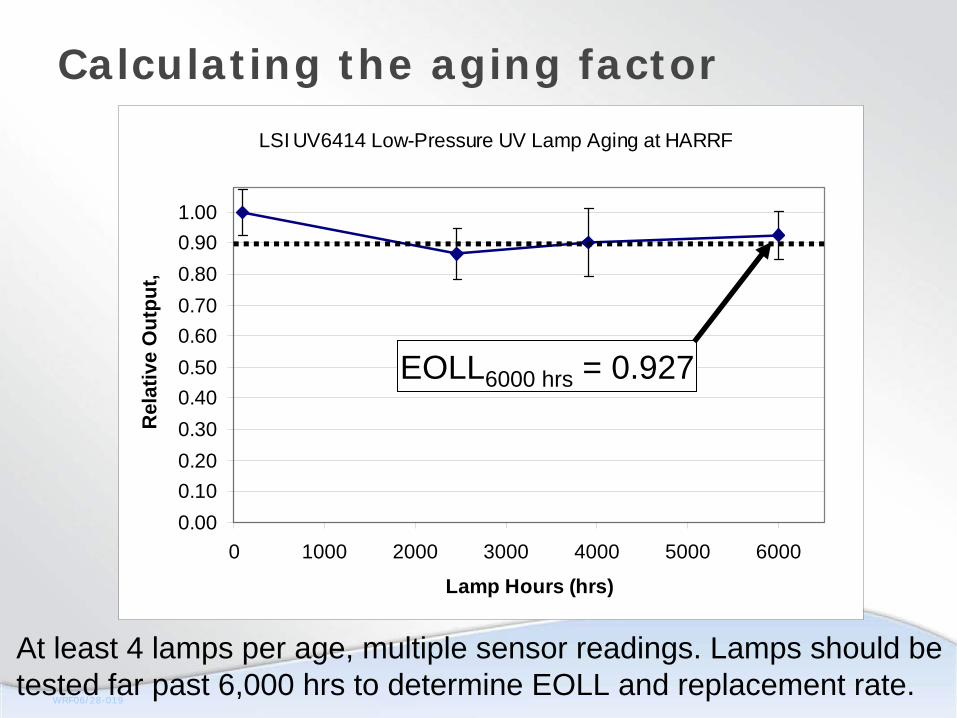
Calculating the aging factor
At least 4 lamps per age, multiple sensor readings. Lamps should be tested far past 6,000 hrs to determine EOLL and replacement rate.
LSI UV6414 Low-Pressure UV Lamp Aging at HARRF
0.000.100.200.300.400.500.600.700.800.901.00
0 1000 2000 3000 4000 5000 6000
Lamp Hours (hrs)
Rel
ativ
e O
utpu
t,
EOLL6000 hrs = 0.927
WRF06/29-019
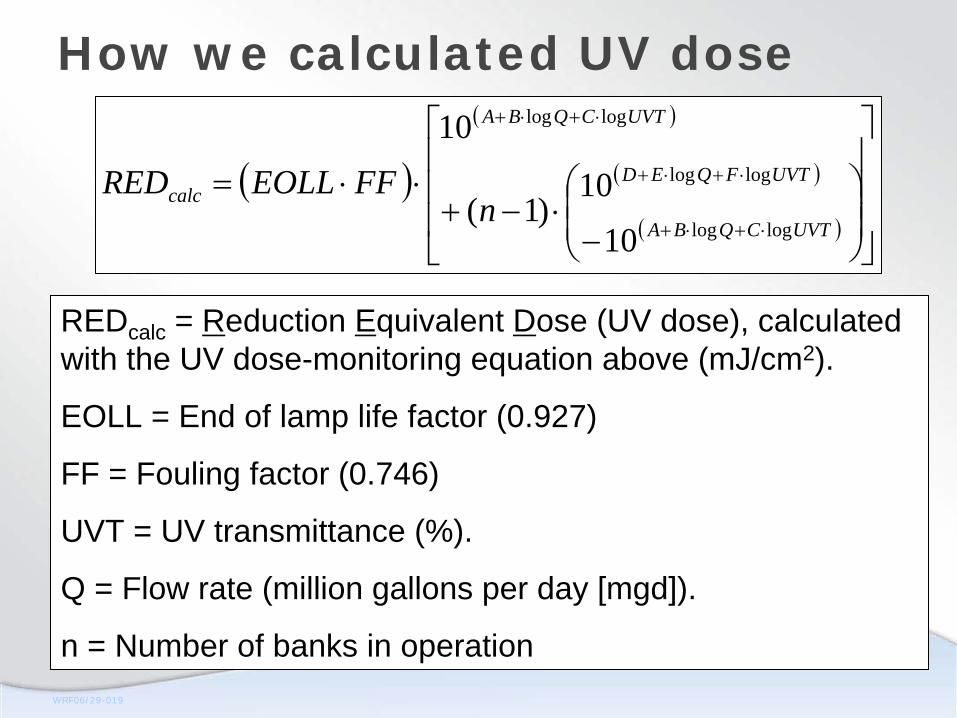
How we calculated UV dose
REDcalc = Reduction Equivalent Dose (UV dose), calculated with the UV dose-monitoring equation above (mJ/cm2).
EOLL = End of lamp life factor (0.927)
FF = Fouling factor (0.746)
UVT = UV transmittance (%).
Q = Flow rate (million gallons per day [mgd]).
n = Number of banks in operation
( )
( )
( )
( ) ⎥⎥⎥
⎦
⎤
⎢⎢⎢
⎣
⎡
⎟⎟⎠
⎞⎜⎜⎝
⎛
−⋅−+
⋅⋅=⋅+⋅+
⋅+⋅+
⋅+⋅+
UVTCQBA
UVTFQED
UVTCQBA
calc nFFEOLLRED
loglog
loglog
loglog
1010
)1(
10
WRF06/30-019
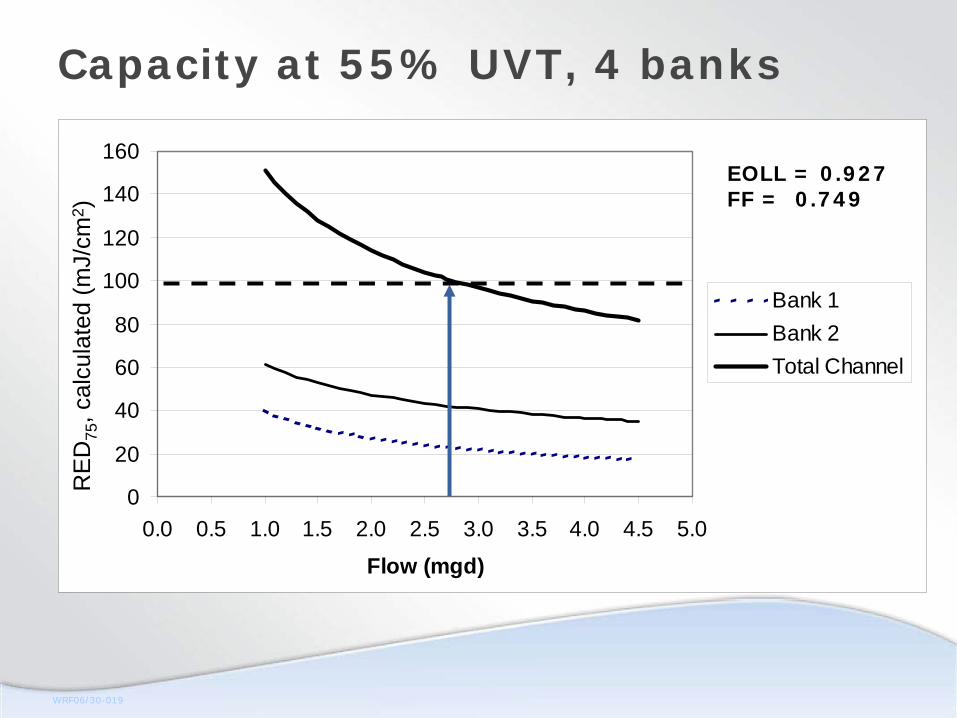
Capacity at 55% UVT, 4 banks
0
20
40
60
80
100
120
140
160
0.0 0.5 1.0 1.5 2.0 2.5 3.0 3.5 4.0 4.5 5.0
Flow (mgd)
RED
75 (c
alc Bank 1
Bank 2Total Channel
EOLL = 0.927FF = 0.749
RE
D75
, cal
cula
ted
(mJ/
cm2 )
WRF06/31-019
0
50
100
150
200
250
300
0.0 0.5 1.0 1.5 2.0 2.5 3.0 3.5 4.0 4.5 5.0
Flow (mgd)
RED
75 (c
alc Bank 1
Bank 2Total Channel
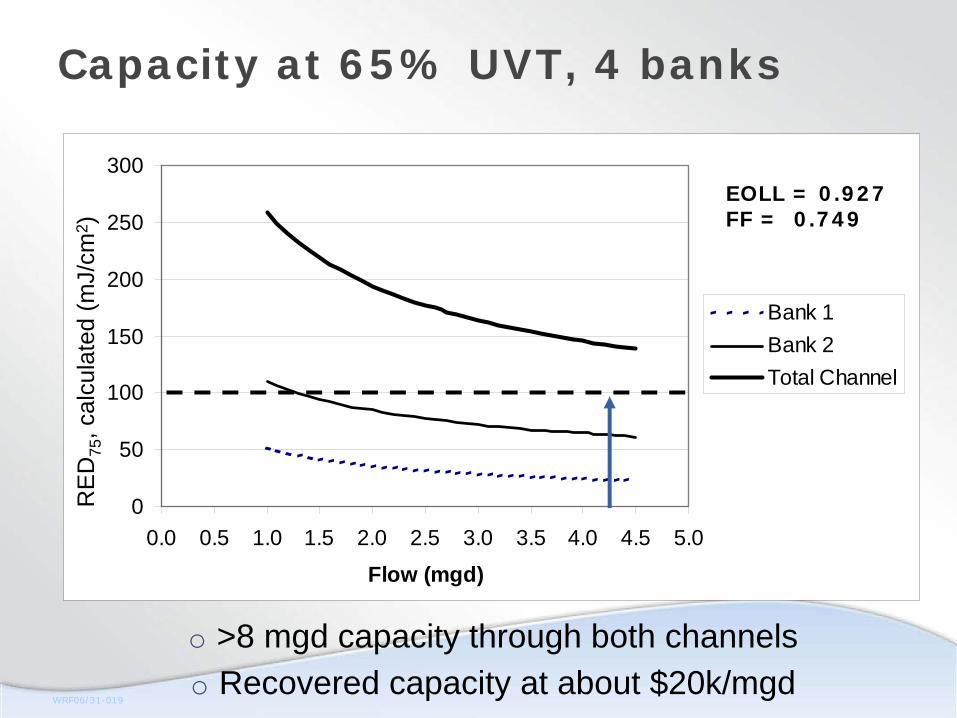
Capacity at 65% UVT, 4 banks
o >8 mgd capacity through both channelso Recovered capacity at about $20k/mgd
EOLL = 0.927FF = 0.749
RE
D75
, cal
cula
ted
(mJ/
cm2 )
WRF06/32-019
A few take-home messages…
1. Reuse UV designs require conservatism2. Equipment sizing is no longer simple3. When designing UV systems, especially in retrofitted
chlorine contact basins, hydraulic concerns are paramount
4. Appropriate and flexible data analysis and dose monitoring equations may be a silver bullet
5. If possible, find out your site-specific EOLL and FF 6. A successful UV system needs a dedicated and
proactive operations staff

WRF06/33-019
WRF06/34-019
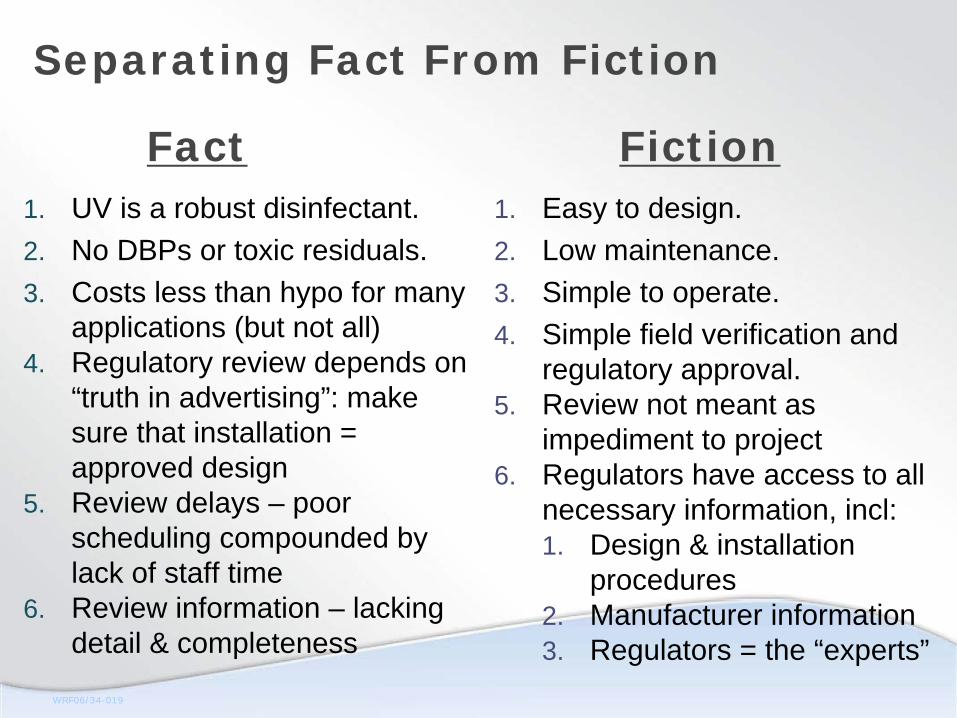
Separating Fact From Fiction
1. UV is a robust disinfectant.2. No DBPs or toxic residuals.3. Costs less than hypo for many
applications (but not all)4. Regulatory review depends on
“truth in advertising”: make sure that installation = approved design
5. Review delays – poor scheduling compounded by lack of staff time
6. Review information – lacking detail & completeness
Fact Fiction1. Easy to design.2. Low maintenance.3. Simple to operate.4. Simple field verification and
regulatory approval.5. Review not meant as
impediment to project6. Regulators have access to all
necessary information, incl:1. Design & installation
procedures2. Manufacturer information3. Regulators = the “experts”