Embed Size (px)
Citation preview
ww.sciencedirect.com
b i om a s s a n d b i o e n e r g y 6 4 ( 2 0 1 4 ) 8 1e9 0
Available online at w
ScienceDirect
http: / /www.elsevier .com/locate/biombioe
Protocol to compensate net evaporation and netprecipitation in open-pond microalgal massivecultures and permit maximal steady-stateproductivities
Mishka Talent a,b, Greg Burgess a,*, Javier G. Fernandez-Velasco a,c,1
aResearch School of Engineering, The Australian National University (ANU), Canberra, ACT 0200, Australiab Fenner School of Environment and Society, ANU, AustraliacPhotobioenergetics Group, Research School of Biology (RSB), ANU, Australia
a r t i c l e i n f o
Article history:
Received 29 February 2012
Received in revised form
3 March 2014
Accepted 12 March 2014
Available online 8 April 2014
Keywords:
Microalgae
Biomass
Bioenergy
Evaporation
Salinity
Ponds
* Corresponding author. Tel.: þ612 6125 5650E-mail address: [email protected]
1 Present address: Departamento de Cienchttp://dx.doi.org/10.1016/j.biombioe.2014.03.0961-9534/ª 2014 Elsevier Ltd. All rights rese
a b s t r a c t
Commercial cultivation of microalgae in open ponds can be strongly limited by evapora-
tion. This is particularly the case in highly evaporative areas where production plants are
likely to be located. We present a mathematical model to calculate native solute and
exogenous nutrient concentrations as affected by net evaporation or net precipitation. The
model takes into account the periodic compensatory addition of new feedstock water and/
or removal of rain-originated excess water and the eventual recycling of the culture me-
dium. We present a management protocol in which, for a wide variety of climates, it is
possible to stabilise the native solute concentrations and minimise the exogenous nutrient
washout. The protocol includes harvesting a minimum of 10% of the pond volume per day
and replacing this volume and the evaporated water with new feedstock water. We test the
approach against a 9-year daily weather data set for a locality with 1740 mm.y�1 average
net evaporation. We find that the native solute concentrations can be maintained between
1.2 and 1.5 times the feedstock water values, while the daily washout of exogenous nu-
trients is �3% and the pond volume is kept nearly constant. This protocol should prove
particularly useful for the exploitation of marine microalgae growing in open ponds with
brackish or seawater-based growth medium.
ª 2014 Elsevier Ltd. All rights reserved.
1. Introduction
Solar radiation can be harvested as a sustainable source of
energy by exploiting natural photosynthesis. Part of the visible
light energy is stored in biomass, which can be used to
.(G. Burgess).ias Basicas. Universidad019rved.
produce biofuels or a variety of industrial feedstocks. Diverse
“energy crops” are available [1] but, noticeably, some micro-
algae have the highest productivities of biomass and oil [2].
Because of their high productivities, these organisms should
be the best “energy crops” [3] and become the basis for a new
“agriculture”. Furthermore, microalgae display a variety of
Nacional de Lujan. Argentina.
b i om a s s a n d b i o e n e r g y 6 4 ( 2 0 1 4 ) 8 1e9 082
advantages over classical crops, among others: (a) They do not
need the supporting properties of a soil, and some can grow in
sea or saline water, thus not competing for land or fresh
water; (b) Their culture is hydraulic in nature, which allows
the inoculation and harvest of an extended culture from a
single pumping point and the continuous monitoring and
provision of nutrients; (c) They can display year-round
growth, whereas classical crops are productive only during a
few months per year; (d) Microalgal growth can be fertilized
with CO2 derived from power plant flue gas or from the
extraction of fossil oil and gas, or with CO2 from soluble car-
bonates [3e5]. Other advantages of marine microalgae, when
used in terrestrial industrial setups are: (a) Seawater has
minimal sediment content in comparisonwith rivers. (b) Most
non-marine algae and animals cannot tolerate seawater,
which reduces contamination effects from the terrestrial
surrounding environment. (c) Because most marine micro-
algae cannot tolerate a fresh water environment, any acci-
dental spillage will have a lower environmental impact on
neighbouring ecosystems.
A particular feature of microalgal industrial cultures is that
all the nutrients needed for biomass generation are provided
by the feedstock water and by the addition of fertilizers [6],
here called “exogenous nutrients”.
Microalgal production facilities should be placed in areas of
adequate insolation, moderate temperatures, and easy pro-
vision of water. But also, very importantly for the rational use
of soil resources, they should be located in classically non-
productive land, which typically involves areas of high evap-
oration and low rainfall. Moreover, the extended microalgal
cultivation infrastructure has to be simple and cheap, which
suggests the use of open ponds [7,8]. This however implies
significant water loss through evaporation, in addition to the
water removed for algal harvesting (which can be partly
recycled). The addition of new feedstock water to compensate
evaporation will result in increasing solute concentrations,
which if not managed may ultimately force the replacement
of the entire growth medium [9].
We present a mathematical model to predict the native
solute and exogenous nutrient concentrations as affected by
net evaporation or precipitation, initially utilising an idealised
climate with constant daily conditions, manipulating the pe-
riodic input of feedstock water or removal of growth medium
in combination with the harvesting regime. This model using
constant daily weather is used to demonstrate the role of
those variables, however it can also be directly applied to
short-term periods of steady conditions. For a wide range of
idealised climates from 4000 mm.y�1 net precipitation to
4000 mm.y�1 net evaporation, it is possible to stabilise the
native solute concentrations even with the high level of water
recycling which is required to minimise exogenous nutrient
washout. The case of net precipitation is considered as, even
in arid areas, such conditions will periodically occur andmust
bemanaged. Themodel assumes the harvest of aminimumof
10% of the pond starting volume per day, and the addition of
new feedstock water to compensate both for harvesting and
net evaporation. Growth curves of Nannochloropsis salina
measured experimentally under laboratory conditions are
used in the model. We then test the approach against a 9 year
long daily weather data set for a locality with 1740mm.y�1 net
evaporation, which includes periods of both severe evapora-
tion and precipitation. We find that by daily manipulation of
the plant operating parameters, the native solute concentra-
tions can bemaintained between 1.2 and 1.5 times the starting
values, while the daily washout of exogenous nutrients is�3%
and the pond height increases to at most 20% higher than the
starting value. The system, for the tested weather conditions,
would ideally require the selection or genetic construction of a
microalgal strain capable of proliferating well in a range of
1.0e1.5 relative feedstock solute concentrations.
2. Materials and methods
2.1. Growth of N. salina and outdoors growthsimulation
The marine unicellular microalga N. salina [10], obtained as
strain CS-190, CSIRO Collection of Living Microalgae, Hobart,
Australia, was grown in f2 medium, a half concentration of f
medium [6], prepared with filtered natural seawater (Sydney,
Australia). Cultures were performed in 2 L conical flasks
containing 1.5 L of culture at 25 � 2 �C, magnetically stirred,
continuously illuminated with an average photon irradiance
at the culture surface level of 150 mmol photons.m�2.s�1, and
continuously bubbled with a 5% volume fraction of CO2 in
humidified air, at a flow rate of 0.7 L.h�1. Biomass concen-
tration was evaluated turbidimetrically at 750 nm [11]. In the
model, growth in outdoor conditions was simulated by inter-
spacing 16 h of no growth (i.e. “night conditions”) per each 8 h
of growth (i.e. “day conditions”) using the actual growth curve
obtained under continuous light as described above. This
simulation was subsequently modified to represent the
pseudo steady-state growth in which a culture growing in the
late linear phase is partially harvested each day by the with-
drawal of 10% of the total volume. An 8 h period of linear
growth (maximal rate) is followed by a harvest and addition of
new feedstock water that brings the volume to the standard
value (e.g. equivalent to 300mmpond depth) and causes a 10%
dilution. This dilution is followed by a period of no growth.
The three phases, totalling 24 h, were repeated for many cy-
cles representing the pseudo steady-state culture.
2.2. Model assumptions
2.2.1. Pond type and mixingWe consider a standard pond depth of 300mm.We impose the
general requirement that the mixing mechanism for the open
pond should be effective for assuring the homogenization
through the pond of: a) changes in solute concentration due to
evaporation or precipitation, b) addition of new feedstock
water, and c) addition of recycled water. Raceway ponds with
paddle wheel mixing are the most common commercial
configuration [4], however our analysis is also applicable to
other geometries andmixing devices. In applying this study to
a real system, if mixing significantly increases evaporation
above the local pan evaporation rate, the model is simply
adjusted accordingly. As a variety of evaporation rates have
been evaluated, including extreme ones, the general results of
the model will remain applicable. Further refinement of the
b i om a s s a n d b i o e n e r g y 6 4 ( 2 0 1 4 ) 8 1e9 0 83
model goes beyond of the purpose of this paper, which is to
introduce amethodology for modelling andmanaging salinity
levels in open ponds. The analysis is not applicable to stag-
nant, unmixed ponds.
2.2.2. Pond evaporation ratesAs noted above, where actual weather data is used, the pond
evaporation rate is set to the measured pan evaporation rate
for the locality.
The rate of evaporation of saline water under given
ambient conditions (temperature, humidity, wind speed) is
affected by the salinity concentration and the surface area of
the body of water [12,13]. These effects are also not considered
in this paper.
2.2.3. Microalgal growth rateWhere growth curves for a microalgal culture subjected to the
regime of harvesting, recycling, and addition of feedstock
water are presented, thesemake no allowance for variation in
growth rates with salinity levels, but only to the removal and
regrowth of the culture. A more detailed model for a specific
microalgal strain should incorporate its growth rate as a
function of the pond salinity level, measured under outdoor
conditions.
This simulation derived from data drawn from laboratory
conditions is not intended to represent actual commercial
production, but only to provide an image of the behaviour of a
culture manipulated as proposed here. The growth kinetics
measured turbidimetrically describes the shape of the ki-
netics, but is not used to estimate absolute biomass
concentrations.
In an open pond, maximal microalgal productivity is
attained with the addition of concentrated CO2. Rather than
being fixed, the rate of CO2 injection would be in accordance
with the photosynthesis rate, as determined by pH
measurement.
2.2.4. Culture harvest rateThe simulation assumes a 10%daily harvest rate (i.e. 10% of the
total volumeof theponds is removed forharvestingof thealgae,
with some fraction of this possibly being recycled back into the
ponds). Some commercial systems use a significantly higher
rate (e.g. 30%) e the effect of this is discussed in Section 4.6.
2.2.5. Feedstock solute concentrationThe feedstock native solute concentration (salinity) is
assumed to remain constant over time (in practice some
feedstock sources may have varying salinity, however this is
beyond the scope of the current model). All native solute
concentrations are given relative to the feedstock
concentration.
3. Theory
3.1. Simulation of solute concentration dependence on,and compensation for, net evaporation and precipitation
The simulations were generated in Microsoft Excel� using
Visual Basic�, version 6.5.
From the universal dilution formula [14], by expressing the
pond volume as a function of its initial height (hp) and the net
evaporation or net precipitation per day as a water height (he:
positive for net evaporation), the actual concentration of any
solute [Si] in the water at time t (in days) contained by a pond
that is subjected to net evaporation or net precipitation can be
simply written as:
Si½ �t ¼hp
hp � the
� � Si½ �0 (1)
where [Si]0 is the concentration of any native solute in the
original feedstock water or any exogenous nutrient added at
time zero.
Equation (1) can be generalised to allow for water removal
or culture harvesting, and the addition of fresh feedstock
water or rain, and partial or full recycling:
Si½ �t ¼hp � he � hw þ hr
� � hphp�he
� �Si½ �t�1 þ hw � hr þ heð Þ Si½ �0
� �
hp(2)
where hw is the height of water withdrawn each day either for
harvesting and/or elimination of excess culture volume due to
net precipitation; hr is the height of harvested culture recycled
to the pond each day; he is the daily evaporation or precipi-
tation and also the height of feedstock water added, or rain
removed each day to exactly compensate that daily evapora-
tion or precipitation, and [Si]t�1 is the concentration of any
solute in the pond the previous day. To generate the solute
concentration time curves this formula is applied iteratively.
The concentration of any solute [Si]t is calculated after har-
vesting and addition or removal of water tomaintain the pond
height (hp) at a constant level. The model uses the simplifi-
cation that all processes (evaporation, harvesting, addition
and removal of water) take place over a short period each day.
For the case of exogenous nutrients [Si]0 in Equation (2) is
set equal to zero, because there are no exogenous nutrients in
the feedstock water. We do not allow for the change in con-
centration of exogenous nutrients due to assimilation by the
microalgae; i.e. in themodel exogenous nutrients are lost only
when the culture is withdrawnwithout full recycling. In a real
system, however, (exogenous) nutrients are assimilated by
growing microalgae. As the rate of assimilation increases, the
amount of nutrients lost when harvesting the culturemedium
decreases. Thus, our calculation of exogenous nutrients
washout, which does not take into account microalgal
assimilation, indicates the absolute maximal loss. Whereas
mostmacronutrients will be faster assimilated by the growing
cells, the micronutrients will be only partially consumed and
the estimation of exogenous nutrient loss could be applied at
least to them.
4. Results
4.1. Change of pond solute concentration in idealisedweather conditions
Sustained net evaporation or precipitation can strongly affect
the microalgal growth medium composition in open ponds
[7,15]. Here we develop simulations to quantify these effects.
b i om a s s a n d b i o e n e r g y 6 4 ( 2 0 1 4 ) 8 1e9 084
We consider the changes of native feedstock water solute
(“salts”) concentration (“salinity”) and exogenous nutrient
concentration due to net evaporation and net precipitation
and how those changes can be affected or governed by addi-
tions of new feedstock water or removal of growth medium
from the pond. We do not attempt to account for the natural
depletion of native or exogenous nutrients due to their uptake
by the cells during growth; as a compensatory re-addition of
nutrients is always required.
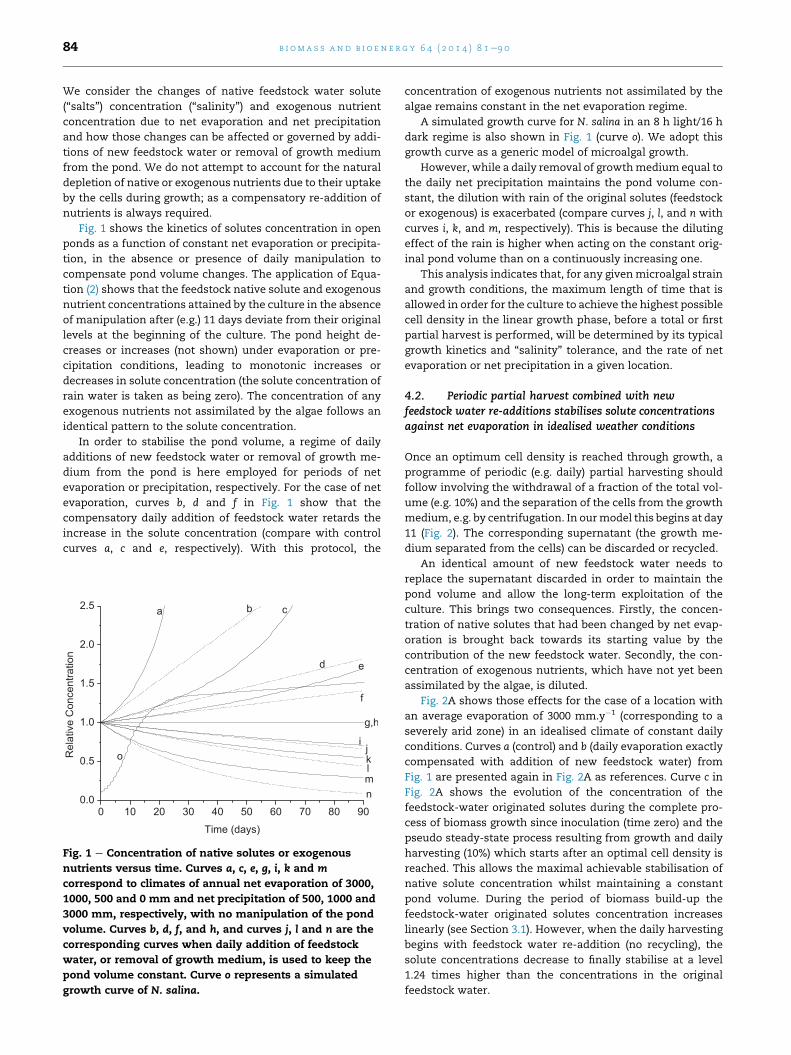
Fig. 1 shows the kinetics of solutes concentration in open
ponds as a function of constant net evaporation or precipita-
tion, in the absence or presence of daily manipulation to
compensate pond volume changes. The application of Equa-
tion (2) shows that the feedstock native solute and exogenous
nutrient concentrations attained by the culture in the absence
of manipulation after (e.g.) 11 days deviate from their original
levels at the beginning of the culture. The pond height de-
creases or increases (not shown) under evaporation or pre-
cipitation conditions, leading to monotonic increases or
decreases in solute concentration (the solute concentration of
rain water is taken as being zero). The concentration of any
exogenous nutrients not assimilated by the algae follows an
identical pattern to the solute concentration.
In order to stabilise the pond volume, a regime of daily
additions of new feedstock water or removal of growth me-
dium from the pond is here employed for periods of net
evaporation or precipitation, respectively. For the case of net
evaporation, curves b, d and f in Fig. 1 show that the
compensatory daily addition of feedstock water retards the
increase in the solute concentration (compare with control
curves a, c and e, respectively). With this protocol, the
Fig. 1 e Concentration of native solutes or exogenous
nutrients versus time. Curves a, c, e, g, i, k and m
correspond to climates of annual net evaporation of 3000,
1000, 500 and 0 mm and net precipitation of 500, 1000 and
3000 mm, respectively, with no manipulation of the pond
volume. Curves b, d, f, and h, and curves j, l and n are the
corresponding curves when daily addition of feedstock
water, or removal of growth medium, is used to keep the
pond volume constant. Curve o represents a simulated
growth curve of N. salina.
concentration of exogenous nutrients not assimilated by the
algae remains constant in the net evaporation regime.
A simulated growth curve for N. salina in an 8 h light/16 h
dark regime is also shown in Fig. 1 (curve o). We adopt this
growth curve as a generic model of microalgal growth.
However, while a daily removal of growthmedium equal to
the daily net precipitation maintains the pond volume con-
stant, the dilution with rain of the original solutes (feedstock
or exogenous) is exacerbated (compare curves j, l, and n with
curves i, k, and m, respectively). This is because the diluting
effect of the rain is higher when acting on the constant orig-
inal pond volume than on a continuously increasing one.
This analysis indicates that, for any givenmicroalgal strain
and growth conditions, the maximum length of time that is
allowed in order for the culture to achieve the highest possible
cell density in the linear growth phase, before a total or first
partial harvest is performed, will be determined by its typical
growth kinetics and “salinity” tolerance, and the rate of net
evaporation or net precipitation in a given location.
4.2. Periodic partial harvest combined with newfeedstock water re-additions stabilises solute concentrationsagainst net evaporation in idealised weather conditions
Once an optimum cell density is reached through growth, a
programme of periodic (e.g. daily) partial harvesting should
follow involving the withdrawal of a fraction of the total vol-
ume (e.g. 10%) and the separation of the cells from the growth
medium, e.g. by centrifugation. In ourmodel this begins at day
11 (Fig. 2). The corresponding supernatant (the growth me-
dium separated from the cells) can be discarded or recycled.
An identical amount of new feedstock water needs to
replace the supernatant discarded in order to maintain the
pond volume and allow the long-term exploitation of the
culture. This brings two consequences. Firstly, the concen-
tration of native solutes that had been changed by net evap-
oration is brought back towards its starting value by the
contribution of the new feedstock water. Secondly, the con-
centration of exogenous nutrients, which have not yet been
assimilated by the algae, is diluted.
Fig. 2A shows those effects for the case of a location with
an average evaporation of 3000 mm.y�1 (corresponding to a
severely arid zone) in an idealised climate of constant daily
conditions. Curves a (control) and b (daily evaporation exactly
compensated with addition of new feedstock water) from
Fig. 1 are presented again in Fig. 2A as references. Curve c in
Fig. 2A shows the evolution of the concentration of the
feedstock-water originated solutes during the complete pro-
cess of biomass growth since inoculation (time zero) and the
pseudo steady-state process resulting from growth and daily
harvesting (10%) which starts after an optimal cell density is
reached. This allows the maximal achievable stabilisation of
native solute concentration whilst maintaining a constant
pond volume. During the period of biomass build-up the
feedstock-water originated solutes concentration increases
linearly (see Section 3.1). However, when the daily harvesting
begins with feedstock water re-addition (no recycling), the
solute concentrations decrease to finally stabilise at a level
1.24 times higher than the concentrations in the original
feedstock water.
C D
A B
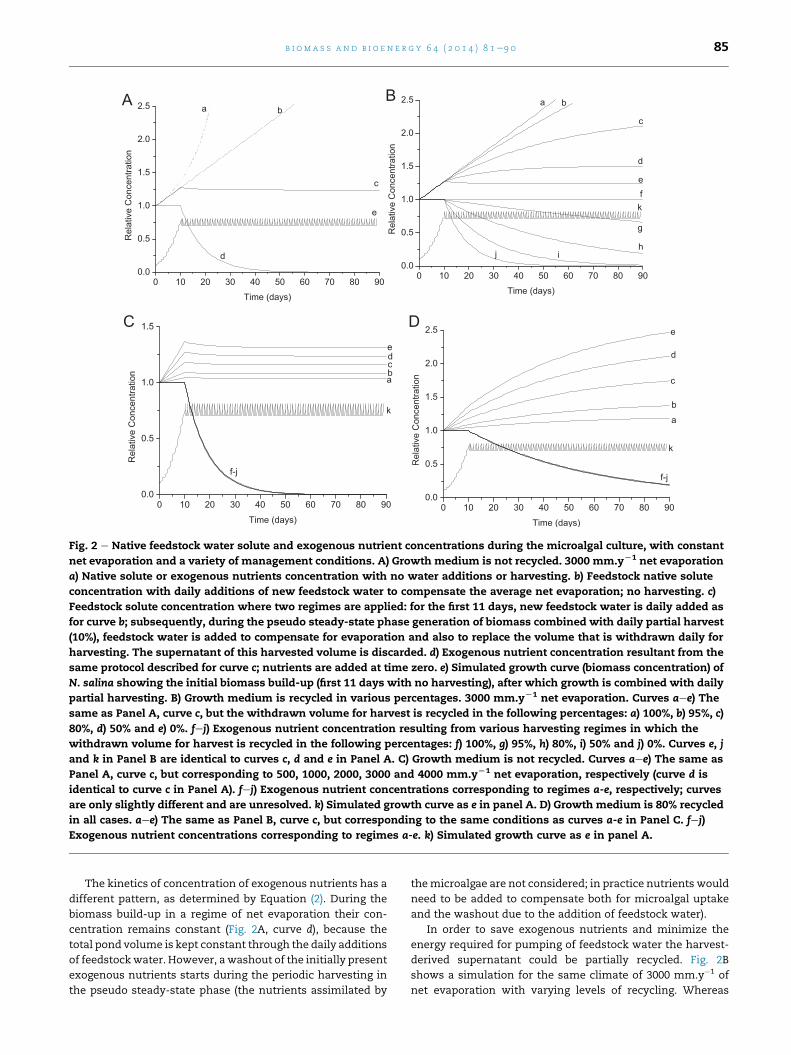
Fig. 2 e Native feedstock water solute and exogenous nutrient concentrations during the microalgal culture, with constant
net evaporation and a variety of management conditions. A) Growth medium is not recycled. 3000 mm.yL1 net evaporation
a) Native solute or exogenous nutrients concentration with no water additions or harvesting. b) Feedstock native solute
concentration with daily additions of new feedstock water to compensate the average net evaporation; no harvesting. c)
Feedstock solute concentration where two regimes are applied: for the first 11 days, new feedstock water is daily added as
for curve b; subsequently, during the pseudo steady-state phase generation of biomass combined with daily partial harvest
(10%), feedstock water is added to compensate for evaporation and also to replace the volume that is withdrawn daily for
harvesting. The supernatant of this harvested volume is discarded. d) Exogenous nutrient concentration resultant from the
same protocol described for curve c; nutrients are added at time zero. e) Simulated growth curve (biomass concentration) of
N. salina showing the initial biomass build-up (first 11 days with no harvesting), after which growth is combined with daily
partial harvesting. B) Growth medium is recycled in various percentages. 3000 mm.yL1 net evaporation. Curves aee) The
same as Panel A, curve c, but the withdrawn volume for harvest is recycled in the following percentages: a) 100%, b) 95%, c)
80%, d) 50% and e) 0%. fej) Exogenous nutrient concentration resulting from various harvesting regimes in which the
withdrawn volume for harvest is recycled in the following percentages: f) 100%, g) 95%, h) 80%, i) 50% and j) 0%. Curves e, j
and k in Panel B are identical to curves c, d and e in Panel A. C) Growth medium is not recycled. Curves aee) The same as
Panel A, curve c, but corresponding to 500, 1000, 2000, 3000 and 4000 mm.yL1 net evaporation, respectively (curve d is
identical to curve c in Panel A). fej) Exogenous nutrient concentrations corresponding to regimes a-e, respectively; curves
are only slightly different and are unresolved. k) Simulated growth curve as e in panel A. D) Growth medium is 80% recycled
in all cases. aee) The same as Panel B, curve c, but corresponding to the same conditions as curves a-e in Panel C. fej)
Exogenous nutrient concentrations corresponding to regimes a-e. k) Simulated growth curve as e in panel A.
b i om a s s a n d b i o e n e r g y 6 4 ( 2 0 1 4 ) 8 1e9 0 85
The kinetics of concentration of exogenous nutrients has a
different pattern, as determined by Equation (2). During the
biomass build-up in a regime of net evaporation their con-
centration remains constant (Fig. 2A, curve d), because the
total pond volume is kept constant through the daily additions
of feedstockwater. However, awashout of the initially present
exogenous nutrients starts during the periodic harvesting in
the pseudo steady-state phase (the nutrients assimilated by
themicroalgae are not considered; in practice nutrients would
need to be added to compensate both for microalgal uptake
and the washout due to the addition of feedstock water).
In order to save exogenous nutrients and minimize the
energy required for pumping of feedstock water the harvest-
derived supernatant could be partially recycled. Fig. 2B
shows a simulation for the same climate of 3000 mm.y�1 of
net evaporation with varying levels of recycling. Whereas
b i om a s s a n d b i o e n e r g y 6 4 ( 2 0 1 4 ) 8 1e9 086
water recycling from the harvested volume produces a higher
steady-state concentration of feedstock water solutes, it
minimizes exogenous nutrient washout. For example, after 50
days of total culture in a regime of 80% water recycling the
exogenous nutrient washout is �56%, mostly independent of
net evaporation as indicated above; whereas the solute con-
centration is 1.85 times the starting value (i.e. the concentra-
tion in the feedstock water).
Local climate conditions and recycling rate have a strong
impact on the kinetics of the native solute and exogenous
nutrient concentrations and are shown in Fig. 2C and D
respectively. Identical simulations considering awide range of
net evaporations show that the feedstock water solute con-
centration stabilises closer to the original level the lower the
net evaporation. For an extreme case of net evaporation of
4000 mm.y�1, Fig. 2C shows that the solute concentrations
reach a peak of 1.37 at day 11 to finally stabilise at a level 1.32
times higher than in the feedstock water. The kinetics of the
exogenous nutrient washout is essentially independent of the
net evaporation regime as it results mainly from the per-
centage of daily culture withdrawal. For 10% recycling the
daily washout is w10% (Fig. 3), whereas for 80% recycling it is
w2% (Figs. 2D and 3), in each case nearly independent of the
net evaporation. While this benefit is achieved at the expense
of higher pseudo steady-state native solute concentrations,
these do not exceed 2.5 times the original concentration even
with the extreme climate of 4000 mm.y�1.
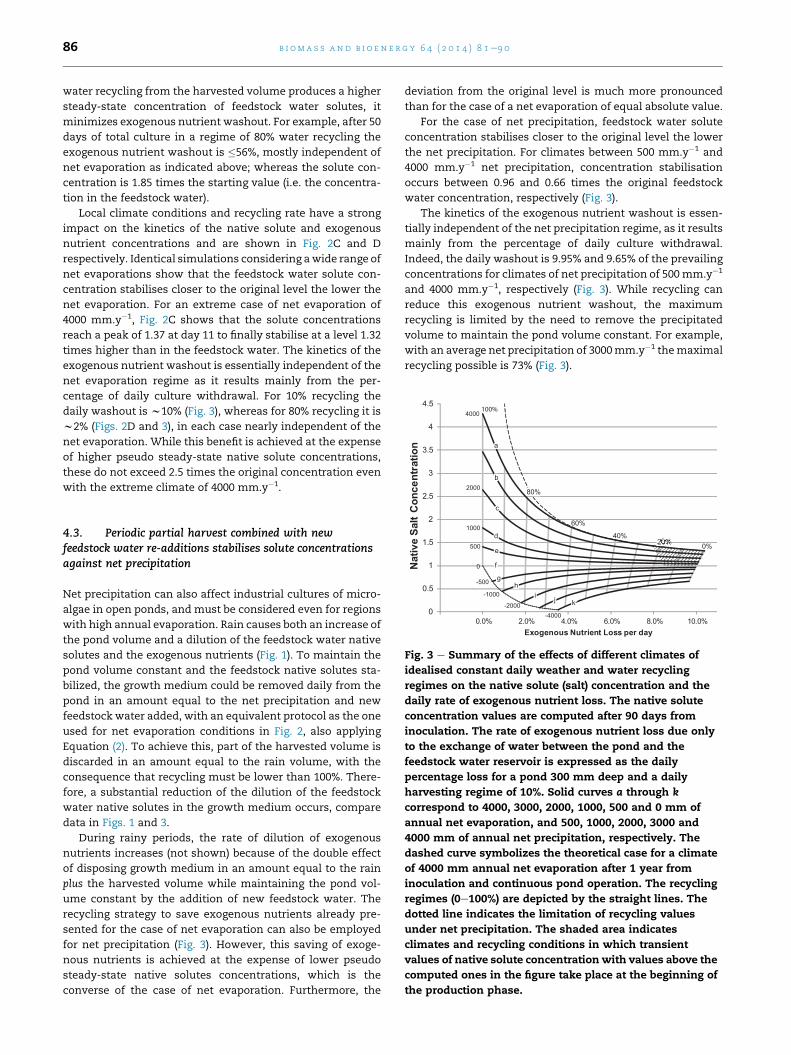
Fig. 3 e Summary of the effects of different climates of
idealised constant daily weather and water recycling
regimes on the native solute (salt) concentration and the
daily rate of exogenous nutrient loss. The native solute
concentration values are computed after 90 days from
inoculation. The rate of exogenous nutrient loss due only
to the exchange of water between the pond and the
feedstock water reservoir is expressed as the daily
percentage loss for a pond 300 mm deep and a daily
harvesting regime of 10%. Solid curves a through k
correspond to 4000, 3000, 2000, 1000, 500 and 0 mm of
annual net evaporation, and 500, 1000, 2000, 3000 and
4000 mm of annual net precipitation, respectively. The
dashed curve symbolizes the theoretical case for a climate
of 4000 mm annual net evaporation after 1 year from
inoculation and continuous pond operation. The recycling
regimes (0e100%) are depicted by the straight lines. The
dotted line indicates the limitation of recycling values
under net precipitation. The shaded area indicates
climates and recycling conditions in which transient
values of native solute concentration with values above the
computed ones in the figure take place at the beginning of
the production phase.
4.3. Periodic partial harvest combined with newfeedstock water re-additions stabilises solute concentrationsagainst net precipitation
Net precipitation can also affect industrial cultures of micro-
algae in open ponds, and must be considered even for regions
with high annual evaporation. Rain causes both an increase of
the pond volume and a dilution of the feedstock water native
solutes and the exogenous nutrients (Fig. 1). To maintain the
pond volume constant and the feedstock native solutes sta-
bilized, the growth medium could be removed daily from the
pond in an amount equal to the net precipitation and new
feedstock water added, with an equivalent protocol as the one
used for net evaporation conditions in Fig. 2, also applying
Equation (2). To achieve this, part of the harvested volume is
discarded in an amount equal to the rain volume, with the
consequence that recycling must be lower than 100%. There-
fore, a substantial reduction of the dilution of the feedstock
water native solutes in the growth medium occurs, compare
data in Figs. 1 and 3.
During rainy periods, the rate of dilution of exogenous
nutrients increases (not shown) because of the double effect
of disposing growth medium in an amount equal to the rain
plus the harvested volume while maintaining the pond vol-
ume constant by the addition of new feedstock water. The
recycling strategy to save exogenous nutrients already pre-
sented for the case of net evaporation can also be employed
for net precipitation (Fig. 3). However, this saving of exoge-
nous nutrients is achieved at the expense of lower pseudo
steady-state native solutes concentrations, which is the
converse of the case of net evaporation. Furthermore, the
deviation from the original level is much more pronounced
than for the case of a net evaporation of equal absolute value.
For the case of net precipitation, feedstock water solute
concentration stabilises closer to the original level the lower
the net precipitation. For climates between 500 mm.y�1 and
4000 mm.y�1 net precipitation, concentration stabilisation
occurs between 0.96 and 0.66 times the original feedstock
water concentration, respectively (Fig. 3).
The kinetics of the exogenous nutrient washout is essen-
tially independent of the net precipitation regime, as it results
mainly from the percentage of daily culture withdrawal.
Indeed, the daily washout is 9.95% and 9.65% of the prevailing
concentrations for climates of net precipitation of 500mm.y�1
and 4000 mm.y�1, respectively (Fig. 3). While recycling can
reduce this exogenous nutrient washout, the maximum
recycling is limited by the need to remove the precipitated
volume to maintain the pond volume constant. For example,
with an average net precipitation of 3000mm.y�1 themaximal
recycling possible is 73% (Fig. 3).
b i om a s s a n d b i o e n e r g y 6 4 ( 2 0 1 4 ) 8 1e9 0 87
4.4. Summary of achievable pseudo steady-state nativesolute concentrations and exogenous nutrient loss rates fora variety of recycling regimes
The achievable pseudo steady-state native solute concentra-
tion and the associated rate of exogenous nutrient loss for a
variety of idealised climates with constant conditions are
shown in Fig. 3. A series of climates ranging from net evapo-
ration of 4000 mm y�1 to net precipitation of 4000 mm y�1 are
considered under different water recycling regimes. The
native solute concentration is evaluated after 90 days from
inoculation, as this could be a possible duration of a culture
before it has to be restarted (cf. curve e in Fig. 2A). For strong
net evaporation (e.g. �2000 mm.y�1) and high recycling (e.g.
>50%) the native solute concentration is not stabilised after 90
days, as exemplified in Fig. 2B and D, whereas with low
recycling (e.g.�50%) the native solute concentration stabilises
before 90 days for all climates, as exemplified in Fig. 2B. This
difference is also shown by the dashed curve in Fig. 3 which
represents the same conditions as for curve a in Fig. 3 (i.e.
4000 mm.y�1 net evaporation) but after 1 year of a theoretical
continuous operation of a same culture: both curves concur at
low recycling and profoundly diverge at high recycling.
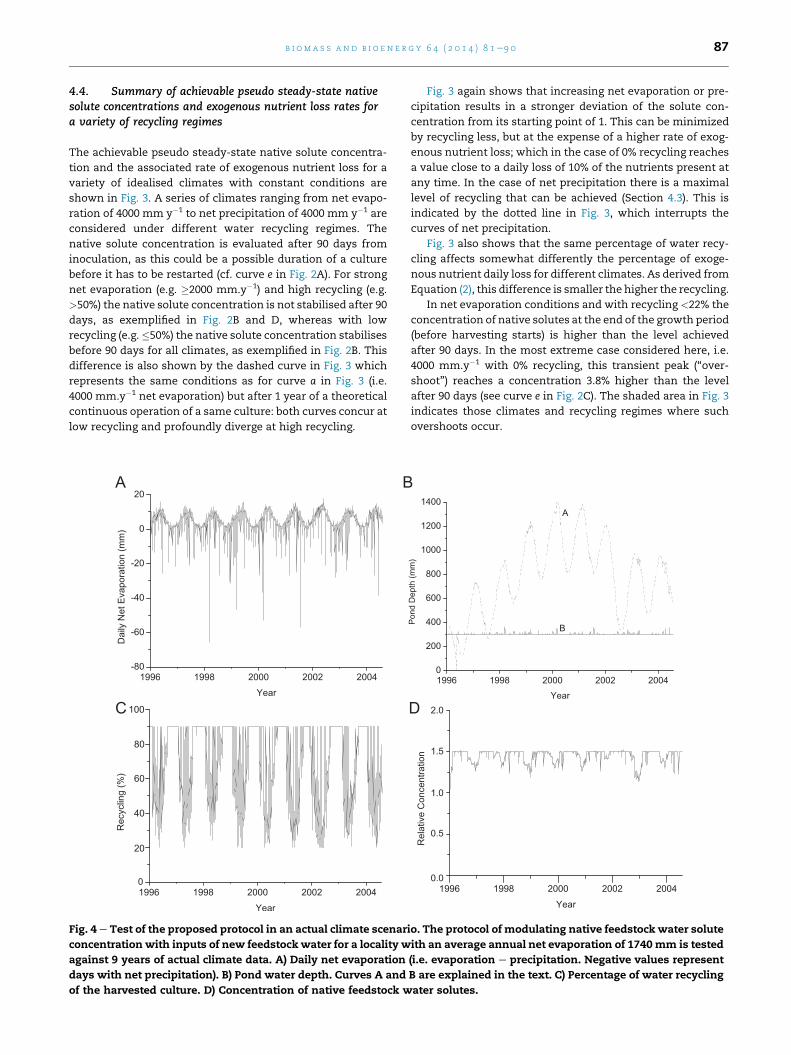
A
C
B
Fig. 4 e Test of the proposed protocol in an actual climate scenar
concentration with inputs of new feedstock water for a locality w
against 9 years of actual climate data. A) Daily net evaporation
days with net precipitation). B) Pond water depth. Curves A and
of the harvested culture. D) Concentration of native feedstock w
Fig. 3 again shows that increasing net evaporation or pre-
cipitation results in a stronger deviation of the solute con-
centration from its starting point of 1. This can be minimized
by recycling less, but at the expense of a higher rate of exog-
enous nutrient loss; which in the case of 0% recycling reaches
a value close to a daily loss of 10% of the nutrients present at
any time. In the case of net precipitation there is a maximal
level of recycling that can be achieved (Section 4.3). This is
indicated by the dotted line in Fig. 3, which interrupts the
curves of net precipitation.
Fig. 3 also shows that the same percentage of water recy-
cling affects somewhat differently the percentage of exoge-
nous nutrient daily loss for different climates. As derived from
Equation (2), this difference is smaller the higher the recycling.
In net evaporation conditions and with recycling <22% the
concentration of native solutes at the end of the growth period
(before harvesting starts) is higher than the level achieved
after 90 days. In the most extreme case considered here, i.e.
4000 mm.y�1 with 0% recycling, this transient peak (“over-
shoot”) reaches a concentration 3.8% higher than the level
after 90 days (see curve e in Fig. 2C). The shaded area in Fig. 3
indicates those climates and recycling regimes where such
overshoots occur.
D
io. The protocol of modulating native feedstock water solute
ith an average annual net evaporation of 1740mm is tested
(i.e. evaporation e precipitation. Negative values represent
B are explained in the text. C) Percentage of water recycling
ater solutes.
b i om a s s a n d b i o e n e r g y 6 4 ( 2 0 1 4 ) 8 1e9 088
4.5. Simulations with actual weather data
We tested if the conclusions obtained with simulations using
idealised climates, as described above, also apply under actual
daily weather conditions. The case of Tullakool in New South
Wales, Australia (35�220 S; 144�120 E) was considered, using a 9-
year record of precipitation and pan evaporation from the
Australian Bureau of Meteorology. The net evaporation is
shown in Fig. 4A where regular annual cycles of evaporation
are accompanied by both events of heavy rain (negative de-
flections) and above average evaporation.
We consider a possible management protocol to test
whether we can accommodate these natural variations from
the yearlymean of net evaporation; managing pond feedstock
water solutes concentration by the combined action of
importing new feedstock water and modulating the percent-
age ofwater recycling. For this test protocol a constant harvest
of 30 mm per day is taken, irrespective of the pond water
depth. The target for the water depth is 300 mm, whilst the
target range for the solute concentration is 1.0e1.5 times that
of the feedstock water.
The simulated management of the ponds involves: a)
considering the actual daily net evaporation or precipitation
and b) the highest possible recycling of the harvested volume
water in order to minimize the exogenous nutrient washout.
However, in the simulation the daily percentage of recycling
is kept in the range of 20e90% and is chosen so as to keep the
native solute concentration below 1.5. The limiting value of
salinity of 1.5 is chosen so as to maintain high productivity
[16]. It is assumed that microalgal strains can be collected
from the environment [2] or developed, which are tolerant to
this degree of salinity variation. The rationale for the limits
for the recycling percentages involves aiming to minimize
exogenous nutrient washout but to have at least some
renewal of feedstock water so as to dilute microalgal
secretions.
Fig. 4B shows the consequences of the management pro-
tocol on the pond depth (curve B). A very stable pond depth
with extremes between 300 and 362 mm results. Moreover,
the deviations from the desired value are short-lived, at most
lasting 7 days. For comparison, a more rigid protocol is also
shown (curve A) in which daily feedstock additions are con-
stant, corresponding to the yearly average evaporation of
4.77 mm.d�1 and daily recycling of 70% of the harvested me-
dium. For this inflexiblemanagement protocol the pond depth
(curve A) and the native solute concentrations (not shown)
oscillate widely. Such inflexible management protocols are
therefore not further discussed.
Fig. 4C compares the percentage of water recycling of the
harvested volume. The amount of recycling is daily varied
depending on the actual net evaporation or precipitation.
Relatively long and uninterrupted maximal recycling (90%)
periods coincide with periods of high precipitation or rela-
tively low net evaporation, as in these circumstances the
native solute concentration is maintained well below the
chosen limit of 1.5. During periods of high evaporation the
average recycling diminishes. The high variability in the level
of recycling results from the need to react to daily net pre-
cipitation or evaporation.
When days of significant rain occur in this case of average
annual net evaporation, the recycling strategy to maintain
native solutes close to the feedstock concentrations is oppo-
site to the case of a climate of average net precipitation. In the
example of Fig. 4, during rainy periods, in order to maintain
the native solutes concentration close to 1.5, low inputs of
feedstock water (concentration ¼ 1) and maximal recycling
are required.
Fig. 4D shows the resulting solute concentration levels for
the pond. The salinity initially rises quickly, but then is
maintained between 1.2 and 1.5 times the feedstock solute
concentration for the rest of the entire 9-year period. The
maximum concentration of 1.5 is higher than that which
occurred for constant 3000mm.y�1 evaporation (1.24) as in the
real climate there are periods of evaporation significantly
higher than the average.
The daily exogenous nutrient loss varies between 0.8 and
8.0% of the total content of each exogenous nutrient in a pond
of constant 300 mm height (not shown). The maximal and
minimal loss of exogenous nutrients coincides with times of
minimal and maximal recycling, respectively. Despite this
seasonal variation, the average daily exogenous nutrient loss
is 3.0%, identical to the yearly idealised climate that is depic-
ted in Fig. 3, simply resulting from the premises chosen to
begin the simulation.
4.6. Effect of culture harvest rate
For a production system with a different harvest rate to 10%
the solute and nutrient concentration curves should be
recalculated. However some insight into the effect of different
harvest rates can be obtained by considering the inter-
relationship between harvesting and recycling. The net ef-
fect of harvesting a fraction fH of the pond volume and then
recycling a fraction fR of the harvest is that the pond height is
decreased by an amount Dh given by Equation (3):
Dh ¼ fH�1� fR
�hi (3)
where hi is the height of the pond at the start of the harvesting
and recycling process. It is seen that the harvesting and
recycling rates only affect the results via the amount of water,
which is actually discharged (i.e. the blowdown) from the
system. For example, a regime with 10% harvest rate and 50%
recycling is directly equivalent to one with 30% harvest and
83% recycling.
In general terms, higher harvest rates (for a fixed recycling
percentage) lead to native solute concentrations stabilizing
closer to the feedstock concentration. However, a higher
washout of exogenous nutrients would also occur.
5. Discussion
The protocols described in this papermust be accompanied by
proper industrial management of the microalgal culture to
obtain maximal steady-state productivities. We identify the
following key aspects which are exemplified in curve e in
Fig. 2A.
b i om a s s a n d b i o e n e r g y 6 4 ( 2 0 1 4 ) 8 1e9 0 89
� Cultures must be exploited at their maximal productivity.
� Cultures must be protected against the problems of pho-
toinhibition (excessive effective irradiation of the cells
[17]); and biological contamination.
Both of these requirements are related to the culture cell
concentration. The maximal areal productivity of the culture
is maintained up to the end of the linear growth phase,
which develops after the cell division exponential phase [18].
Harvesting should occur at the end of the linear phase,
before the decline towards the culture stationary phase, and
it should be only a partial harvest. This allows the mainte-
nance of a permanent and relatively high cell concentration
in the culture, which also minimizes photoinhibition and
biological contamination. A steady-state of high cell con-
centration also avoids the risks associated with a full harvest
and a restart of the culture with lag and exponential
phases [18].
5.1. Model involving idealised climates with identicaldays
The continuous operation of a production pond in a given
climatewill in general be associatedwith the establishment of
higher or lower than feedstock solute concentrations. The
proposed protocol involves exchanges of water between the
pond and the water reservoir, which determine the loss of
exogenous nutrients. The information shown in Fig. 3 can be
used to determine, for a variety of climates of idealized con-
stant daily weather, the quasi steady-state native solutes
concentration after 90 days of inoculation and the resulting
rate of exogenous nutrient loss. For climates with very regular
weather patterns, particularly in short term spans, the data of
Fig. 3 can be directly used.
5.2. Model involving an actual climate
The results in Fig. 4 demonstrate that the application of the
concept of compensating net evaporation or precipitation
with the addition of feedstock water and/or the removal of
growth medium is feasible in a real climate scenario.
The loss of exogenous nutrients is determined solely by net
evaporation or precipitation and the rate of recycling. The
latter is determined by the chosen upper bound of the solute
concentration that the pond may attain, which is most likely
dictated by the microalgae chosen for cultivation.
Interestingly, if the selected microalga tolerates much
higher than normal feedstock water solutes, evaporation of
the growth medium before inoculation could be an excellent
means of minimizing biological contamination. Furthermore,
the pond should be operated as close as practically possible to
the maximum solute concentration that the microalgae can
tolerate in order to reduce exogenous nutrient loss.
5.3. Determination of system operating parameters
The results of the model, as given by Fig. 3, can be used to set
or determine the operating conditions for a given pond sys-
tem. Two of the variables are chosen as fixed and the third is
read as the dependent parameter:
1) A given rate of net evaporation and algal solute concen-
tration tolerance determine the average maximum level of
recycling.
2) A given rate of net evaporation and chosen acceptable
nutrient loss determine the pseudo steady-state solute
concentration.
3) A given algae solute concentration tolerance and chosen
acceptable nutrient loss determine the range of usable
climates.
The selected operating point (or range) will also determine
the rate of loss of exogenous nutrients.
The analysis can be carried out for the selected represen-
tative periods (e.g. summer) of the climate at a real site, by
extrapolating the daily evaporation or precipitation to a yearly
value, after factoring in the increase in evaporation caused by
pond mixing.
5.4. Effect of solute concentration on microalgal growthrate
In the simulation with actual weather data, the solute
concentration increases up to 1.5 the feedstock value. A
number of microalgae, including N. salina, have been found
experimentally to show nearly unchanged growth rates at
salinity levels between 22 and 34 PSU (Practical Salinity
Units) [5] [19], i.e. a range of just over 1.5. However at the
higher salinity levels, which would occur if seawater is the
feedstock (so that the starting point was 35 PSU), growth
rates will tend to decline [19]. As noted previously, a more
detailed model for a specific microalgal strain should
incorporate its growth rate as a function of the pond salinity
level.
6. Conclusion
We have shown that the solute concentration (“salinity”)
analysis and management protocol here presented demon-
strate the possibility of very large scale industrial produc-
tion of biofuels or other materials through microalgal
photosynthesis in areas with strong atmospheric water
unbalances, in particular allowing the exploitation of arid
areas and the use of seawater as the main growth medium
component. The protocol can, with appropriate changes to
the evaporation rate, be applied to any form of open pond
with forced mixing.
Acknowledgements
JGFV dedicates this work to his former teacher at Colegio
Nacional de Buenos Aires, Universidad de Buenos Aires, Prof.
Oscar Perazzo. We thank Dr. John Benemann for useful data
and discussions. This work was supported in part by an ANU-
Linkage Pilot Fund and an RSB-ANU Biotechnology Research
Centre Grant to JGFV and by an RSB-ANUHonours scholarship
to MT.
b i om a s s a n d b i o e n e r g y 6 4 ( 2 0 1 4 ) 8 1e9 090
r e f e r e n c e s
[1] Duke J. Handbook of energy crops [Internet]. PurdueUniversity: Center for New Crops and Plants Products; 1983[cited 2012 Feb 27]. Available from:, http://www.hort.purdue.edu/newcrop/duke_energy/dukeindex.html.
[2] Sheehan J, Dunahay T, Benemann J, Roessler P. A look backat the U.S. Department of Energy’s Aquatic Species Program:biodiesel from algae. Golden, CO: National Renewable EnergyLaboratory; 1998. p. 294. NREL/TP-580-24190.
[3] Benemann J, Pedroni P. Biofixation of fossil CO2 bymicroalgae for greenhouse gas abatement. In: Amadei A,editor. Encylopedia of hydrocarbons. Rome, Italy: Institutodella Enciclopedia Italiana; 2005.
[4] Benemann J. Microalgae for biofuels and animal feeds.Energies 2013;6(11):5869e86.
[5] Brennan L, Owende P. Biofuels from microalgae e a review oftechnologies for production, processing, and extractions ofbiofuels and co-products. Renew Sustain Energ Rev2010;14(2):557e77.
[6] Andersen R. Algal culturing techniques. Burlington, MA:Elsevier Academic Press; 2005.
[7] Richmond A, editor. Handbook of microalgal culture e
biotechnology and applied phycology. Oxford: BlackwellPublishing; 2004.
[8] Borowitzka M. Culturing microalgae in outdoor ponds. In:Andersen R, editor. Algal culturing techniques. Burlington,MA: Elsevier Academic Press; 2005.
[9] Borowitzka MA, Moheimani NR. Sustainable biofuels fromalgae. Mitig Adapt Strategies Global Change 2013;18(1):13e35.
[10] Graham L, Wilcox L. Algae. Upper Saddle River, NJ: PrenticeHall; 2000.
[11] Tassan S, Ferrari G. An alternative approach to absorptionmeasurements of aquatic particles retained on filters. LimnolOceanogr 1995;40(8):1358e68.
[12] Leaney F, Christen EW. Evaluating basin leakage rate,disposal capacity and plume development; 2000. CSIRO Landand Water 17/10.
[13] Ali H, Madramootoo CA, Abdel Gwad S. Evaporation model ofLake Qaroun as influenced by lake salinity. Irrig Drain2001;50(1):9e17.
[14] Harris D. Quantitative chemical analysis. New York:Freeman; 1991.
[15] Wheaton F. Aquacultural engineering. New York: John Wiley& Sons; 1977.
[16] McLachlan J. The effect of salinity on growth and chlorophyllcontent in representative classes of unicellular marine algae.Can J Microbiol 1961;7(3):399e406.
[17] Long SP, Humphries S, Falkowski PG. Photoinhibition ofphotosynthesis in nature. Annu. Rev Plant Biol1994;45(1):633e62.
[18] Lewin R, editor. Physiology and biochemistry of algae. NewYork: Academic Press; 1962.
[19] Bartley M, BoeingW, Corcoran A, Holguin F, Schaub T. Effectsof salinity on growth and lipid accumulation of biofuelmicroalga Nannochloropsis salina and invading organisms.Biomass Bioenerg 2013;54:83e8.