Embed Size (px)
Citation preview

158 IEEWACM TRANSACTIONS ON NETWORKING, VOL. 3, NO. 2, APRIL 1995
PROTON: A Media Access Control Protocol for Optical Networks with Star Topology
David A. Levine, Student Member, IEEE, and Ian F. Akyildiz, Senior Member, IEEE
Abstract- A new multiple access protocol called PROTON (PROTocol for Optical Networks) is developed for aptical lo- cal area networks based on a passive star topology. PROTON uses wavelength division multiplexing (WDM) and is highly bandwidth-efficient. One of the available wavelengths is used as a control channel. Time is divided into fixed-sized slots. The size of the slots is the same for the control and the data channels. Before transmitting a packet, a station must compete with others for a slot in a data wavelength, usi free procedure. “ n i t t i n g stations and the wavelengths for their data transmissions are dete station by a simple arMtration scheme. The pro for networks where the number of users can be mt@ larger than the number of available data channels. propagation delays, it is considered that transmitter tuning times as well as the times required te packets are not negligible. Whenever possible, and to “&e the throughput of the network, tuning and processing times of transmitters and receivers are overlapped with each other and with data transmission times. Also, data slot requests and packet transmissions are scheduled in a pipeline fashion, thus reducing the detrimental effects on throughput and packet delay of long propagation delays. The paper includes an of the maximum throughput characteristics of PROTON. A4 andyti- cal model is developed, and several performance meamres are obtained.
I. INTRODUCTION T IS ESTIMATED that a single optical fiber has a capacity I of at least 30 THz in its low-loss region (1.2-1.6 pm) [2],
[lo]. At the present time, however, it is only practical to use a fraction of this huge capacity. This is usually achieved by dividing the total bandwidth of the fiber into a number of noninterfering channels, a technique known as wavelength di- vision multiplexing (WDM). By using this technique, channels that have a relatively lower bandwidth are obtained, but with the advantage that they operate at transmission speeds that are manageable by commercial devices, reducing the famous opto-electronic and processing bottlenecks [IO].
PROTON, the protocol introduced in this paper, is ideal for local area networks where the number of stations exceeds the number of available wavelength channels. One wavelength is used as a control channel, while the rest are used as data channels. All stations are connected through a central passive star. Each station operates with at least a single TTER (tunable
Manuscript received July 1, 1994; revised October 6, 1994; approved by IEEWACM TRANSACTIONS ON NETWORKING Editor R. Ramaswami. This work was supported in part by an NSF scholarship under Grant EID-9018632.
D. A. Levine and I. F. Akyildiz are with the School of Electrical and Computer Engineering, Georgia Institute of Technology, Atlanta, GA 30332 USA (e-mail: [email protected]; [email protected]).
IEEE Log Number 9409 1 12.
transmitter/tunable receiver) pair for the data channels, and one m/FR (fixed transmittedfixed receiver) pair for the cohtrol channel. Depending on the number of available wavelength channels, PROTON can support hundreds and up to a few thousand stations.
In the past few years, several protocols have been proposed [l], [3]-[9], [11]-[13], for optical local area networks (0- LAN’s). In contrast to our protocol, in order to support a network of A4 stations, protocols like [3]-[6], [12] require more than M wavelengths (M + 1 for 131-[6], 2M for [12]), imposing a serious restriction on the maximum number of users in the network, typically limiting this number to no more than a hundred stations. Protocols like [ 1 13, [ 151-[ 171 present a throughput curve that diminishes after a certain offered load is exceeded, due to collisions in the control and/or data channels. In our protocol, channel collisions do not occur. Receiver collisions (or destination conflicts [13]) can occur, but can be reduced by increasing the processing in each station. Since channel collisions do not occur, the throughput of the protocol results in a monotonically increasing function of the input load when the destination distribution is uniform.
Most of the previously proposed protocols for 0-LAN’s have made the assumption that tuning times are negligible. Only a handful protocols like [3], [4], [SI, [13] have considered otherwise. While in [3], [4] tuning times can be assumed to be a part of packet transmission times, tuning times are considered explicitly in [8], [13]. In [8], the existence of processing times is also contemplated. As explained below, in this paper we specifically consider the existence of nonnegligible and nonequal tuning and processing times for the transmitter and the receiver. Furthermore, we also consider that propagation delays are not negligible. To our knowledge, this is the first time that a protocol captures all these factors in such a great detail.
Several attempts have been made to compare the protocols for optical LAN’s that have been proposed in recent years [lo], [12], [13]. Table I presents the comparison of some of the protocols proposed in recent years.
In Table I, the protocols are compared according to the following metrics.
Network Znterjke Unit: The NIU structure description is used to determine if the protocol uses a control channel and the number of fixed and tunable transceivers required by each station. We follow the notation in [13], where [CC] - FTaTTJ - FRkTR1 denotes that each station has i fixed transmitters, j tunable transmitters, k fixed receivers, and 1 tunable receivers. The prefix CC is
1063-6692/95$04.00 0 1995 IEEE

LEVINE AND AKYILDIZ: PROTON A MEDIA ACCESS CONTROL PROTOCOL 159
COMPARISON OF VA
schemes N N Tunhg Rocepdng StNehlR Time complexity
H- [I31 No Low MebnvmiIzol Ccm No Low sudbsp [zal NO LOW
lis 1161 YCS Modauc
-171 T-l-rR No LOW
G m I101 S-ALOHA lTFRm No Low RdomTDMA No very high
No No Yen. s
Yea - No
High Moderne Modanc
TABLE I ous MAC PROTOCOLS FOR
No YeS
No No
No No I : 1:: YCS
Yes. s
optional, and when present denotes a protocol that uses a control channel. Tuning Zhe: This is used to indicate if the protocol accommodates or ignores transceiver tuning times. An S following a “Yes” indicates that the protocol separates transmitter tuning times from receiver tuning times. Processing Complexity: This is a measure of the process- ing requirements. Processing limes: This indicates if the protocol explicitly considers the time involved in processing the pertinent information before a data packet can be transmitted. In reservation-based protocols, an S following a “Yes” indicates that the protocol considers separate processing times (of the control channel) for the sender and the receiver. Propagation Delay: Whether or not the protocol considers media propagation delays. Throughput: Characterization of the maximum throughput that a protocol can achieve. Wavelengths per Nefwork: Indicates the minimum number of wavelengths that the protocol requires to operate. M is the total number of stations in the network. Scalability: Is there an upper limit (theoretically) on the maximum number of stations that can be added given a working implementation and a fixed number of channels?
It is interesting to observe that almost none of the previous proposals have explicitly considered processing times. For very high transmission speeds, it is not inconceivable that protocols with high processing requirements and small data packets can have processing times larger than a data packet time! Yet, the potentially detrimental effects of processing
times have hardly been considered before. Some protocols such as [3], [4] consider that transceiver tuning times are simply part of the data packet time. This consideration can result in gross data channel inefficiencies, especially when low-speed tunable devices are being used.
The rest of this paper is organized as follows. Section I1 contains a detailed description of PROTON. In Section 111, we analyze several performance issues of the protocol, induding its maximum achievable throughput. In addition, we provide analytical expressions for the most important performance characteristics of the network. Numerical results from several simulations of the protocol and their comparison with analyt- ical results are presented in Section IV. A summary of our work and concluding remarks are presented in Section V.
11. THE PROTON PROTOCOL Before we describe the protocol in detail, we introduce a
Wavelength Channels: Each fiber in the network has a total of W + 1 channels numbered XO, XI, ..., Xw (typically, W will not exceed 100). Wavelength XO is reserved for the control channel, while the remaining W wavelengths are data channels. Nefwork Stations: There are a total of M stations num- bered ml, m2, . . ., m M in the network. Transmitters and Receivers per Station: Each station in the network has at least a tunable and a fixed transmit- tedreceiver pair. Tuning Zimes: Every TT and TR of any station can tune to any data channel. The worst-case (longest) tuning time
number of assumptions and necessary notation.
,
,. ..... _.” ... .. . - .”_. - . . ....I*(”,, .I. , ...- ”. ... . .

160 IEEWACM TRANSACTIONS ON NETWORKING, VOL. 3, NO. 2, APRIL 1995
Wavelength
XO
Control Slot Control Slot ! : : : K : ! K + l I t.
Data Slot 1 1 3 . . . N
Data Slot I K I K + l I . . .
A1 td
I I I . . . td A2 I I I
! ! ! t d . . . XW
Fig. 1. Structure of the control and data channels.
of any receiver is denoted as TTR, while the worst-case tuning time of any transmitter is TTT.
Processing Times: Stations in the network, whether ex- pecting to transmit or to receive a packet, process the control slots to determine the next action to take. Pro- cessing times are considered to be the worst-case time from the reception of the first bit of a control packet until the moment when the processing of the control packet is completed. We distinguish two processing times incurred by every station: r p R is the processing time required to determine if packets are being addressed to the station, and TPT is the corresponding time required by the station to process its own packet transmission request. Propagation Delays: The round-trip propagation delay of a packet 6 is not negligible.
The round trip propagation delay 6 is the same for any station. Therefore, stations that are physically closer to the star coupler than others must incorporate optical delays. We assume that all stations in the network are synchronized by using a common clock.
A. Basic Protocol The control channel is divided into control slots, and each
control slot is divided into N equally-sized mini-slots, where N 2 M, as shown in Fig. 1. There is at least one mini-slot reserved for every station in the network, and some stations may have more than one mini-slot assigned to them. When a station needs to send a packet to another station, it must first place the address of the intended receiver in its corresponding mini-slot. Each receiver is constantly reading the control slots, waiting for its address to appear in a control mini-slot. The data channels are also divided into equally-sized slots. The size of the data slots is equal to the size of a control slot. All data slots are aligned in time with respect to each other, but data slots and control slots do not need to be aligned.
Since usually N > W, an arbitration scheme for the data channels is required for those cases where there are more stations in need to transmit than available data channels. The arbitration mechanism is based on that presented in [ 141, and is as follows. Associated with each control slot, there is a pointer (the control pointer) that uniquely determines the stations that can use the data slots during a given control slot. The control pointer prompts to a single control mini-slot. If the mini-slot contains the address of a receiver, then the owner of the control mini-slot may send a packet using wavelength AI. The rest of the control mini-slots are scanned (the direction can be chosen arbitrarily, i.e., left-to-right or right-to-left, both with wrap- around) until a nonempty mini-slot is found, and when this
Control Slot K ma me ms m,
1 1 ! 2 ! 3 ! 4 ! 5 ! 8 ! 7 i 8 1 - t c _z Data Slots K
~ a t s P.~M h m mr toms I ~ a t a ~ . r ~ f m n m . t o m r I
-43 ! ~ a t a packet frcm ma to me I A4 ! D a b P . e k c t h n u t o m . 1 ~d
U d
scannine; direction -41 ! -42 !
-45 !
control pointer
! * t
Fig. 2. Example of the data channel arbitration scheme.
happens, the owner of this mini-slot is assigned wavelength XZ for the transmission of its data packet. The process is repeated until no more nonempty mini-slots are found, or until there are no more data channels, whatever occurs first. Accordingly, Fig. 2 shows an example of the arbitration scheme using a left-to- right scanning of a control slot. Here, stations m7, m8, ml, and m3 have won the right to send a data packet to stations m5,
m7, m8. and mg, using, respectively, wavelengths AI, XZ, X 3 ,
and Xq. Note that since only four stations placed a receiver’s address in their assigned control mini-slots, and since there are five data channels, the data slot in wavelength A5 will not be used. Obviously, to achieve fairness, the control pointer needs to be moved to another mini-slot with each new control slot.
The size of the data slots is dependent on the size of the control slots. The lower bound on the size of the control slots is determined by the number of stations in the network, and the transmission speed of the control slot.
For a typical network size, the normalized propagation time of packets (denoted by “a”) is high. Thus, several control packets may be en-route through the network before the first transmitted packet of a batch is actually received after a round- trip propagation delay to and from the optical star coupler. In our protocol, control packets are sent in a pipelined fashion, i.e., back-to-back. Thus, a station can send several consecutive requests through the control channel even before it can actually receive the first request that sent earlier. This mechanism greatly increases the throughput of the network.
Every station has two subsystems for the processing of control slots. As explained before, if a station wants to send a data packet, it must request access to a data channel. This is achieved by first placing the intended receiver’s address in a control minislot assigned to the transmitting station. Then, it must wait until the corresponding control slot returns after a round-trip propagation delay, possibly filled with requests from other stations. Then, the station aspiring to transmit a packet processes the control slot with a dedicated subsystem, the transmitting request subsystem (TRS). The processing time TPT is the worst possible time spent by any TRS processing a control slot. Depending on the processing speed of the TRS, TPT can span from more than one to several control slots.
If a station is able to send data packets using consecutive control slots or slots that are almost next to each other, it must have enough processing resources in its TRS so that two or more control slots can be processed in parallel (at the same time), overlapping its corresponding processing times T ~ .
Clearly, from the performance standpoint, for small values of Tpsp~ this is not essential, but can become a necessity when TpT is several control slots in length.
. , , ... . - - ...-- - . .- l_.,I,

LEVINE AND AKYILDIZ PROTON: A MEDIA ACCESS CONTROL PROMCOL 161
. . . . . . . . . . . . . . . . Arrival of Slots to all Stations . . . . 6 . . K + 1 I K + 2 I K + 3 I b I I I I I
c
TPT TTT :. Tpck
4 - reception begins 71DLE.T : 6 : Transmitter I.
: transmission starts -b I
reception ends
j I
Fig. 3. Sequence of events in the transmission and reception of a data packet.
Aside from the TRS subsystem, every station is equipped with a control channel processing subsystem (CCPS). The job of the CCPS is to continually process the control slots to find if the address of its station appears, indicating that a packet from another station will soon be transmitted. Whereas for the TRS subsystem it is not essential to overlap (if necessary) the processing of consecutive control slots, the CCPS subsystem must be able to parallel-process all control slots with overlapping processing. This is because a receiver has no way of knowing in which control packet its address will appear.
Fig. 3 shows the sequence and timing of events that must take place for the successful coordination of the transmission and reception of a data packet. For this figure, we assume that the packet time Tp& = 1.0, and then we determine the different times according to t l ~ = TPT + TIDLE,T + TTT + 1,
t5T = [ t 4 ~ ] . and t6T = t4T - t5T. The times for the receiver are determined in a similar way.
According to Fig. 3, we observe that the entire process is initiated when a station (sender) places the address of another station (the intended receiver) in the control channel, using a mini-slot assigned to the sender. After a propagation delay 6, the control slot that carries the request is distributed to all stations in the network. The sender processes the control slot in a time no worse than TPT, and if it finds that it has won the right to use a slot in a data channel, proctyxls (possibly after waiting a time TIDLE,T) to tune its TT to the assigned wavelength. At the end of the tuning operation, the sender starts to transmit the data packet, which reaches the receiver 6 units of time later. The receiver, on the other hand, after scanning and processing the control channel, proceeds (possibly after waiting a time TIDLE,R) to tune its TR to the appropriate channel. The reception of the data packet begins after the tuning operation is completed.
t2T = LtlT], t3T = t lT - t2T3 t4T = TPT + TIDLE,T,
To synchronize the arrival and reception of the data packet, it is likely that an idle time (between control packet processing and device tuning) will need to be inserted, either on the transmitter or on the receiver side.
The amount and frequency of packets that can be transmitted and received by a station is a function of multiple variables. These variables include the processing power of the TRS and CCPS subsystems, and tuning speed and number of l T s and TR’s per station. While any station can overlap control packet processing and idle times, stations with a single TR cannot overlap tuning and data packet receiving times. Taking into consideration the times that can and cannot be overlapped, it is possible to determine the minimum number of slots required for two successive receptions of data packets by a given station. This number, denoted pass-slots, can be caldulated according to: if ( t3R 5 t6R
pass-slots = t2R - t5R;
else pass-slots = rtlR1 - t5R;
where pass-slots 2 1. Note that since TTR is assumed to be the worst tuning time of any TR, the value of pass-slots is the same for any station with a single TR. For a station with multiple TR’s, the value of pass-slots is not constant, and depends on the number of TR’s of a station that are currently in use, as well as the relative times when the TR’s were called into action.
Similarly, we can determine the minimum number of slots required for two successive transmissions from a given station. We denote this number by Twazt. Note that TWazt is likely to be different from pass-slots, since in a transmitter, control channel processing is not as stringent as is with a receiver (a sender needs only to process the control packets where it has previously placed requests). Furthermore, tuning times can be quite different between ‘IT’S and TR’s.
162 IEEWACM TRANSACTIONS ON NETWORKING, VOL. 3, NO. 2, APRIL 1995
A station with several packets in its queue typically will not transmit at the maximum rate l/Twazt. Rather, the station will wait Twazt plus a random number of slots (0 to Twoit - 1) between successive transmissions. This is to prevent a cyclic condition that occurs near maximum sustainable load, where in each cycle several stations concentrate their transmission requests within a few slots, leaving the other slots practically unused (each cycle is Twoit slots long), resulting in a drastic reduction in throughput.
Setting aside hardware failure, there are some situations where a data packet may be lost after transmission. For example, two or more stations could try to send data packets at the same time to a station that only has a single TR (in this case, the packet to be received is the one closest to the control pointer). Also, a data packet may be sent to a station that is currently busy preparing for the reception of another data packet. Therefore, it is evident that implementing ACKs in the protocol is a desirable feature. This can be achieved by dividing the control channel in two parts, one for the addresses of the intended receivers, and the other for ACK signals generated by the receivers. After a data packet has been received successfully, the receiver sends an ACK signal. This signal must be sent an exact and predefined number of slots after the packet has been received, thus avoiding the need to explicitly indicate the identity of the receiver sending the ACK. The relative order of ACK signals within a control slot is also important. Each ACK sender must choose a position that reflects the data channel number where it previously received the data packet.
III. PERFORMANCE EVALUATION In this section, we study several aspects that describe the
behavior of the network under a variety of conditions. We begin by investigating the effects that the processing and tuning speeds, number of channels, propagrrtion delay, and total number of stations have on the maximum achievable throughput of the network. Several network characteristics such as throughput, channel efficiency, rate of arrival of new packets, and the total number of packets presented to the network are related to each other. Finally, we develop a model for the delay characteristics of a network that is using this protocol.
A. Modeling Assumptions Packet Generation: Packets are generated in each station due to independent Bernoulli processes. The probability of generating a new packet in a slot time is (for any station) equal to CT, the ratio of the input load I to the number of stations M. All stations have equal probability of receiving a packet, but a station generating a packet is not allowed to send the packet to itself. Bufer Size: Each station in the network has an infinite buffer capacity for data packets. Transmitters and Receivers in Each Station: Each station has a FTFR pair for the control channel, and a TT/TR pair for the data channels.
Packet Acknowledgment: After completely receiving a data packet, the receiver sends an ACK signal to the sender in the next control slot. If a sender does not get the ACK signal in the appropriate control slot, it assumes that the packet was not received and immediately schedules a retransmission.
The input load of the network I is considered to be the average rate of data packets generated by all stations in the network. The offered load to the network G is equal to the average rate of data packets being carried by the network. The internal load G' is the average number of stations that request permission for transmission during any slot.
B. Maximum Achievable Throughput (MAT) of the Network The throughput S of a network is equal to the total rate of
data slots that are received successfully and normalized by the network capacity. The maximum value of throughput that can be reached for a given network SMAT is a function of several variables, including the number of stations, data channels, and the tuning speeds of TT's and TR's. Here we derive the MAT of a network as a function of these variables.
In order to find the MAT of a network configuration, we assume that the network is operating under heavy load, i.e., in all control slots, all data channels are being requested. Under these conditions, the probability preq that a station is addressed with data packets in any slot is equal to the probability that 1 or more (up to W) data packets are being sent to this station in any slot. This is
Since when a station is free and receives a request for reception at least passslots slots must pass before it can receive another data packet, we can also consider that, in order to successfully receive a data packet, a station should not have been addressed anytime during the previous (pass-slots - 1) slots. Thus, the probability for a successful reception p,,, becomes
- (1 - ) (pass-s lo ts - l ) Prec - req P r e q .
Since this probability is the same for any of the M stations in the network, the MAT of the network is simply
(3)
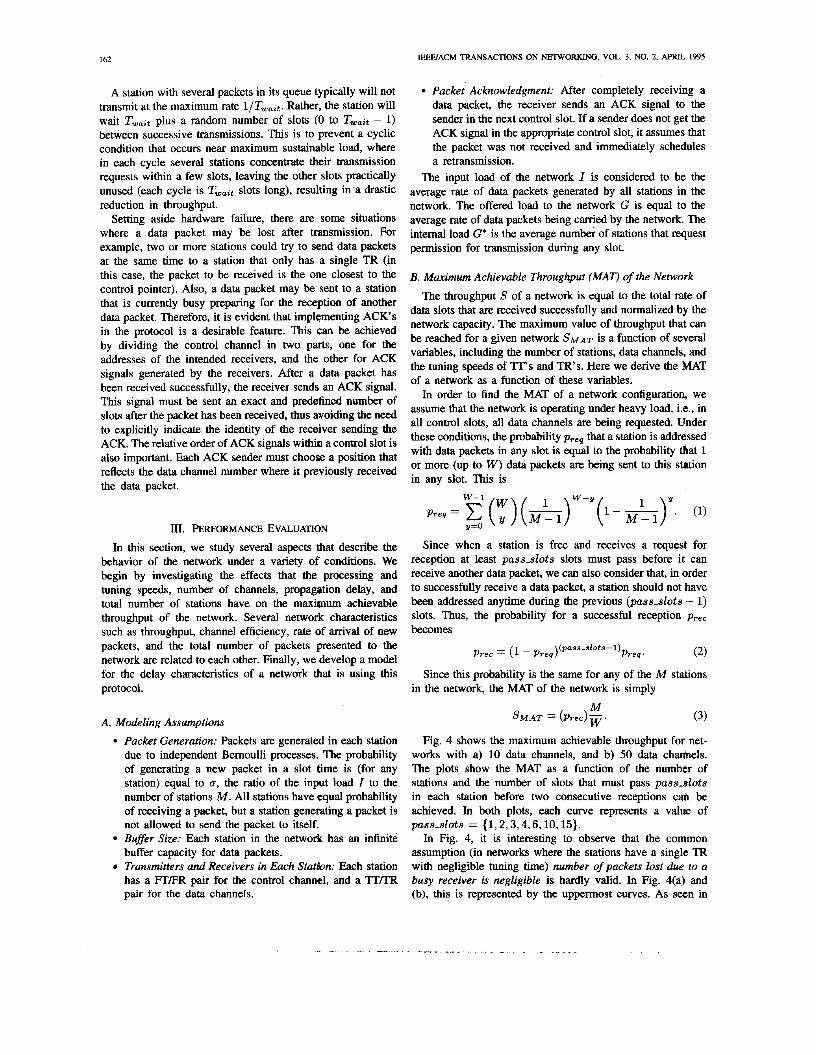
Fig. 4 shows the maximum achievable throughput for net- works with a) 10 data channels, and b) 50 data chanhels. The plots show the MAT as a function of the number of stations and the number of slots that must pass pass-slots in each station before two consecutive receptions cah be achieved. In both plots, each curve represents a value of pass3Eots = { 1,2,3,4,6,10,15}.
In Fig. 4, it is interesting to observe that the common assumption (in networks where the stations have a single TR with negligible tuning time) number ofpackets lost due to a busy receiver is negligible is hardly valid. In Fig. 4(a) and (b), this is represented by the uppermost curves. As seen in

163 LEVINE AND AKYILDIZ: PROTON: A MEDIA ACCESS CONTROL PROTOCOL
1
0 8
Y)
I I_ - - - * - 8 1 1 ' " I O O 50 1w 150 200 250 rx) 350 4w 450 500
NM&d~uoln Y
(b)
Fig. 4. MAT for pass-slots = 1,2,3,4,6,10,15 with a) W = 10, and b) W = 50.
these curves, the MAT can be as low as about 0.7 under this condition.
C. 7hroughput and Load Characteristics I ) Input Load versus Throughput: Since no collisions can
occur in the data channels, the network throughput does not decrease as the input or offered loads increase. In fact, as long as the normalized input load I /W does not exceed the maximum achievable throughput of the network SMAT, the throughput is almost directly proportional to the normalized input load. When the normalized input load is smaller than SMAT, all packets being sent are eventually successful in reaching their destinations. This usually happens during the first transmission or few retransmissions. When the normalized input load reaches the value SMAT, the network becomes saturated, and the throughput curve reaches a maximum. For subsequent increases of the input load, the throughput characteristic becomes constant at a value equal to SMAT. Therefore, the network throughput can be described by
2) mered Load to the Network and Intemal Load: Recall that during any given slot, at most W stations will be able to transmit a data packet. When there are more than W transmission requests in a control slot, some stations will not obtain a data slot. Therefore, for a given slot, internal and offered loads are equal only when the number of transmission requests is less than or equal to W . That is, in any slot j, the relation between Gj and G: is
Since in any slot, zero or up to M stations may request transmission permissions, the intemal load can be modeled as a simple process with binomial distribution and with mean equal to G*. The average offered load to the network is simply the mean of this distribution subjected to the restriction that only up to W stations may actually place a packet in a data slot. That is
W
G = = z ( y ) p r ( 1 - p)'-l x=1
x=w+1 \ - ' where p = G*/M and G* p G. When the ratio M/W is large, for G* < W . SMAT < W (ergodic system), internal and offered loads are practically equal.
3) Offered Load versus Channel EfYiciency: The channel efficiency of the network ~ N W is the ratio of the pumber of data slots carrying packets that ace received successfully to the total number of data slots carrying data (successful + unsuccessful). For low load conditions, and for stations with a small value of the parameter pass-slots, the channel efficiency should be very high (close to unity). As the load increases, the channel efficiency tends to decrease since the stations in the network tend to use more of the available data channels in every slot, increasing the possibility that two or more stations try to send a packet to the same destination. The channel efficiency also tends to decrease as the value of pass-slots increases, since under this condition it is more likely that a sender will find the receiver of its destination busy with another packet. For a given value of pass-slots, the worst-case scenario for the channel utilization occurs when the offered load is maximum, that is, IGJ = IW(. At this point, the channel efficiency is close to the MAT of the network. From the above observations, we conclude that the channel efficiency of the network: 1) is a function of the offered load and number of slots that must pass in each station before two successful receptions can be achieved, 2) it can reach values very close to unity for light loads and small values of pass-slots, and 3) it decreases as a function of increased load until it reaches a value close to SMAT (for the peak offered load). We therefore approximate the relation channel eflciency versus offered load with a straight line with end coordinates (0 , l ) and (1, SMAT), yielding the following expression:
. , -.. .

164 IEEUACM TRANSACTIONS ON NETWORKING, VOL. 3. NO. 2, APRIL 1995
4) Input Load versus Ofsered Load: When the stations of a network have a single TR for the data channels, some data packets will eventually be lost. Therefore, retransmissions at a future time will be needed, resulting in different values for the input and offered loads. Thus, for values of the input load smaller than the total capacity of the network, the offered load is always greater than or equal to the input load, with equality occuring only when every station has a fixed nxeiver for every channel in the network and the capacity to process all data channels simultaneously. During every slot, the number of packets that are sent successfully is proportional to the channel efficiency value for the current offered load. Obviously, the packets that are not delivered successfully will be retransmitted at a future time, becoming part of the internal load of a future slot. Moreover, if in a given slot the internal load is greater than W, the stations that were not successful in their request for a data channel will try again later. Finally, in subsequent slots, additional packets will be generated at the stations (with constant rate I), contributing to the total value of the internal load of the subsequent slots. With these observations in mind, we proceed to approximate this situation with the following difference equation
where k denotes a particular slot, j is the mean number of slots between retransmissions of a lost packet, ( j - h) is the mean number of slots between the unsuccessful tequest for a packet transmission and the actual transmission of the packet, and G;+j is the internal load of the network during slot (k + j ) . We are only interested in finding the steady state solution of the equation, i.e., when all the subindices tend to infinity. Obviously, when the network is in steady state, limk+j-rooG;+3 = limh,,G; and limk,,Gk = limh,,Gh. Therefore, substituting (7), we can rewrite (8) as (note that the term G* disappears)
Furthermore, we can take the limit of (9) with G = limkdoo Gk and solve the resulting equation as a simple second-order equation (( 9) converges to a value independently of the value of Go). Note, however, that the solution of (4) can take values of G greater than the maximum capacity of the network W for sufficiently large values of I. Therefore, we must restrict the value of G to the maximum network capacity. Excluding the root that results in decreasing values of G for increasing values of I, the resulting final expression is
IMJ , I -sMJ
kLkb-4
Fig. 5. Model for the average delay characteristics of data packets.
D. Delay Characteristics
In every station, outgoing data packets can be in one of three possible states: 1) new packets or packets to be retransmitted, 2) packets awaiting the outcome of a transmission request, and 3) packets already sent but awaiting confirmation of successful reception. All outgoing data packets can be stored in a single queue, provided they are marked with their generation timestamp and appropriate state. Newly generated packets are marked as being in state 1. The amount of time that a packet has to wait in this state (before a transmission request is placed) depends on the number of packages in state 1 and the value of Twait. A packet is marked with state 2 right after a transmission request for that packet is sent. After being marked, the packet has to wait for a roundtrip delay and a processing time before it can be known if the packet is going to be transmitted (placing the packet in state 3), or sent back to state 1 (if no data channels are available). When a packet is in state 3, it has to wait additional time in order to find if the packet was successfully received by the destination. This time interval is equal to the: 1) time involved in tuning the 'IT to the adequate channel, 2) transmission delay between sender and receiver so that the packet reaches its destination, 3) time necessary by the destination to process and to send the ACK signal back to the sender, and 4) time delay necessary for the ACK signal to reach the original sender. The model that is used for computing the average packet delay is presented in Fig. 5.
When a packet is generated, it is marked with state 1, and if there are no packets to be retransmitted, the station places a request for transmission in the control channel and marks the packet as being in state 2. The probability that the request is successful is Pt,. This probability is calculated by considefing the probability that a request is unsuccessful, which is simply the probability that W or more (up to M - 1) stations also requested a data slot and that the packet in question is not among the W winners. This probability is the complementary probability of Pt,. Therefore,
where pint = G*/M. The average number of transmission requests that are needed before a packet can be transmitted is simply l/Pt,.. When a request is successful, the packet is marked as being in state 3, and a copy of the packet is sent to
_I ---_ * I_ __. .. .- " . - . . " . . . , - . . . , . , I " ~ .. . , . .. . .. .. . , . ..

LEVINE AND AKYILDIZ PROTON: A MEDIA ACCESS CONTROL PROTOCOL 165
the intended receiver. The probability of success in this case is simply QNW(G) , given in (7).
The approximate number of packets waiting in the queue of each station is determined by modeling each queue as a system with bulk arrivals and single departures. The total arrival rate 9 is the sum of the extemal arrival rate $1 and the feedback rates $2 and $3. XI! is determined by
where I
M $ l = g r -
$3 = 9. (1 - Ptr). (15)
The arrival rates a1, a2 and a 3 that denote the bulk arrivals of 1, 2, or 3 packets respectively, are determined by computing the probabilities of 1, 2, or 3 arrivals a1, a2, and a 3 .
The resulting queueing system can be solved with the following equilibrium equations
(a1 + a2 + a3)pO = plpl (16)
k - 1
(a1 + a 2 + a 3 -k p ) p k = ppk+l + p;a4-(]F-i) (18) i=k-320
where PO, p l , p 2 , . . . denote the probability of being in state 0 ,1 ,2 , . . ., respectively, and p is the departure rate. When the system is in state 1, the departure rate is approximately equal to p1 = 1; when in any other state, this rate is equal to the reciprocal of Twait and the mean of the additional random number of slots that the station waits. Therefore, when the system is in a state other than 1, ,U = l/(Twuit + ~ ~ ; “ - l ( i / ~ ~ ~ ; t ) > . The approximate average number of packets waiting in the queue (in state 1) is given by
00
k=O
Finally, the average delay incurred by a packet waiting in the queue is determined by the well-known Little’s Law
-
(20)
We now proceed to determine the overall delay incurred by a packet from the moment it is generated until it is successfully received. From Fig. 6, the delays in the trajectories traversed by the data packets awaiting for transmission are
9 ‘
Taken into consideration all posible routes and branching probabilities, the final result, the approximate average packet delay Apck, becomes -
Iv. EXPERIMENTAL &XJL.TS
In this section, we present and compare results from several simulations and from the application of the analytical models developed in the previous section. The primary network model that was simulated consisted of a total of 100 stations and 11 channels (10 data + 1 control). Each group of simulations was run under the modeling assumptions described in the previous section, and with progressive levels of input loads. Although in every simulation convergence was observed within a few thousand cycles, all simulations were run for a total of 200 OOO cycles (i.e., control slots). Several system parameters of the network model were varied, including tuning and processing times, and round trip delay. The effects of these variations on the system’s performance are presented in a sequence of plots. These plots show the relationships between some of the most important performance parameters (i.e., input load I, offered load G, network throughput S, channel efficiency Q, and average packet delay G) of the system.
Fig. 6 presents the channel efficiency versus offered load characteristics for various networks. For simplicity, we denote the system parameters of a network as a quintet of the form ( 6, TPT , TTT , TPR , TTR) to repmsent, respectively, the round-trip propagation delay, transmitter’ s processing time, hrsmsmitter’s tuning time, receiver’s processing time, and re- ceiver’s tuning time. In Fig. 6, the network parameters are: A = (O,l,O,l,O), B = (70,1,0,1,0), C = (0,16,0,1,0), D = (0,1,0,16,0). Network A has ideal system parameters that result in the best possible performance. Network B is similar to A, but has a propagation delay equal to 70 control slots. As seen in Fig. 6, propagation delays appear not to have a significant effect on channel cafficiency. The Eeason for this is that propagation delays only shift in time actions to be taken for any packet, but other activities can continue while packets are in transit. Also, since here it is assumed that each station has enough computing resources to process in parallel as many control slots as necessary, networks C and D show no apparent negative effects on channel efficiency, even though their processing times are high. In fact, and excluding average packet delay, propagation delays as well as processing times have minimal detrimental effects on the performance parameters of a network. Here, a key observation

166 EEWACM TRANSACTIONS ON NETWORKING, VOL. 3, NO. 2, APRIL 1995
I 0 1 2 3 4 6 6 7 8 0 IO
0lk.dLOad
Channel efficiency versus offered load characteristics for several
0.86 I
Fig. 6. networks with different system parameters.
is that networks A, B, C, and D have all the same value for the parameter pass-slots (in all of them it is equal to one). The parameters of the other networks are: E = (0, 1, 0,1, Z), F = (35,1.3,0.7,1.3,1.7), G = (0,1,0,1,4), and H = (0, 1, 0,1,4). It can be verified that the values of the parameter passsEots for these networks are equal to 3, 3, 4, and 5, respectively. As observed in Fig. 6, the curves for each of these networks appear to be very dependent on their respective value of pass-slots. In fact, the performance of the two networks with passdlots = 3 is almost identical, and the network with worst performance is the one with the highest value of pass-slots.
Figs. 7-10 present a comparison between performance plots obtained through simulation and through the application of the developed models. The system parameters for these networks are: Network 1 = ( O , l , O , l , O ) , Network 2 = (35,1.3,0.7,1.3,1.7), Network 3 = (35,1.4,1.6,1.4,2.6), and Network 4 = (70,1.4,2.6,1.4,4.6). Network 1 is the network with ideal system parameters, while Network 4 has the highest values for each of the system Parameters that were controlled, resulting in the worst possible performance amongst these networks. For networks A, B, C, and D, the values of the parameter pass-slots are 1,3,4,5, respectively. Fig. 7 presents the channel efficiency versus offered load characteristic for each network. We observe that the nonlinear simulation curves are matched with a linear analyticai model, which provides a good approximation, especially for the networks with a small value for the parameter passslobs. In this and subsequent graphs, performance decreases as the value of the parameter pass-slots increases.
Next, we study the average packet delay versus input load characteristics in Fig. 8. For networks 2 and 3, the minimum Apck is 70, since the round trip propagation delay is 35 and at least two round trips are required before a packet can successfully be transmitted. For network 4, the minimum packet delay is 140. For these networks, as bng as the input load is kept around 2/3 of the network capacity, the average packet delay is kept very close to the minimum possible. The minimum input load I required for network saturation
-
1
0.95
0.0
0.a
1 1 0'75
0.7
0.65
0.6
I 0 1 2 3 4 6 6 7 8 0 IO
0lk.d L a d
0.55 I
Fig. 7. Channel efficiency versus offered load characteristics.
300
2XI
200
8 I 1
100
XI
0
Fig. 8. Average packet delay versus input load characteristics.
is closely related to the value of pass-slots of the net\tork. Higher values of pass-slots result in smaller values for the minimum I required for saturation and vice-versa.
The relation between average packet delay and throughput is presented in Fig. 9. This graph is almost identical to that shown in Fig. 8, except for the fact that throughput has taken the place of input load in the abscissas axis, and the range of this axis has been changed proportionally. This similarity was expected because throughput is equal to normalized input load as long as I is kept at a value that is less or equal to the network capacity W . It is important to observe that the carves do not show a throughput that decreases after a certain peak is reached, behavior observed in networks that use some form of an ALOHA-based protocol [ l l ] , [15], [16], [17].
Finally, Fig. 10 shows the offered load versus input load characteristics for the networks under study. For low input loads, I and G are almost identical, since at these loads most of the packets get to their destination on the first try and few retransmissions occur. As I increases, the channel efficiency of the network decreases, resulting in more retransmissions and in G becoming noticeably larger than I, approximately according

LEVINE AND AKYILDIZ: PROMN: A MEDIA ACCESS CONTROL PROTOCOL 167
I + ’ r‘
0 1 l o 0.1 02 0.3 0.4 0.5 0.c 0.7 0.0 0.0
T W
Average packet delay versus throughput characteristics. Fig. 9.
.-
O F I 2 4 6 I) 10
lnpul Lcdd
Fig. 10. Offered load versus input load characteristics.
to (10). Obviously, for a stable network operation, the value of I should be kept low enough so that the corresponding value of G does not become too close to the network capacity W .
V. SUMMARY AND CONCLUSIONS In this paper, we proposed a new collision-free media
access protocol for optical networks. PROTON can accom- modate a wide range of tunable devices and processors into a pipelined and highly efficient protocol that can readily be used with present technology. For a given network, the parameter pass-slots describes the minimum number of slots that must pass before any two data packets can successfully be received by a single station. By using several examples, we showed the importance of knowing the value of pass-slots in assessing the performance of a network. PROTON is a reservation- based protocol. As such, emphasis was made in designing a high-throughput protocol. Nevertheless, we showed that the average packet delay characteristics of the protocol are still very good. Contrary to ALOHA-based reservation protocols, the throughput of the proposed scheme grows monotonically as the input and offered loads increase.
throughput, these servers will need more than one miqro-slot each (to place reservations), and will be required t have multiple transmitter/receiver pairs. With enough recei rs per station, it can be proved that a network using the j p o s e d protocol can achieve a throughput equal to unity.
ACKNOWLEDGMENT
The authors would like to thank the reviewers for their insightful comments and suggestions.
REFERENCES
K. Bogineni, K. M. Sivalingam, and P. W. Dowd, “Low-complexity multiple access protocols for wavelength-division multiplexed photonic networks,” IEEE J. Selected Areas Commun., vol. 11, pp. 590604, May 1993. C. A. Brackett, “Dense wavelength division multiplexing networks: Principles and applications,” IEEE J. Select. Areas Commun., vol. 8, pp. 948-964, Aug. 1990. M.-S. Chen, N. R. Dono, and R. Ramaswad, “A media-access protocol for packet-switched wavelength division multiaccess metropolitan area networks,” IEEE J. Select. Areas Commun., vol. 8, pp. 1048-1057, Aug. 1990. M. Chen and T.-S. Yum, “A conflict-free protocol for optical WDMA networks,” in IEEE GLOBECOM 1991, pp. 1276-1281. R. Chipalkatti, Z. Zhang, and A. S . Acampora, “High speed communi- cation protocols for optical star coupler using WDM,” in Proc. IEEE INFOCOM 1992, pp. 2124-2133. -, “Protocols for optical star-coupler network using WDM: perfor- mance and complexity study,” IEEE J. Select. Areas Commun., vol. 11, pp. 579-589, May 1993. I. Chlamtac and A. Ganz, “Design alternatives of asynchronous WDM star networks,” in Proc. IEEE ICC’89, vol. 2, June 1989, pp. 739-744. P. W. Dowd and K. K. Bogineni, “Switching latency overlap tech- niques for WDM star-coupled media access protocols,” in Proc. IEEE INFOCOM ’93, vol. 1, Apr. 1993, pp. 65-74. A. Ganz and 2. Koren, “WDM passive star-Protocols and perfor- mance analysis,” in Proc. IEEE INFOCOM’91, vol. 3, Apr. 1991, pp. 991-1OOo. P. E. Green, Fiber Optic Networks. Englewood Cliffs, NJ: Prentice- Hall, 1992. I. M. I. Habbab, M. Kavehrad, and C.-E. W. Sundberg, “Protocols for very high speed optical fiber local area networks using passive star topology,” J. Lightwave Technol., vol. 5 , no. 12, pp. 1782-1794, Dec. 1987. P. A. Humblet, R. Ramaswami, and K. N. Sivarajan, “An efficient communication protocol for high-speed packet-switched multichannel networks,” IEEE J. Select. Areas Commun., vol. 11, pp. 568-578, May 1993. F. Jia and B. Mukherjee “The receiver collision avoidance (RCA) protocol for a single-hop WDM lightwave network,” J. Lightwave Technol., vol. 11, no. 5-6, pp. 1053-1065, May-June 1993. D. A. Levine and I. F. Akyildiz, “A reservation and collision-free media access protocol for optical star local area networks,” in Proc. IEEE
J. C. Lu and L. Kleinrock, “A wavelength division multiple access pro- tocol for high-speed local area networks with a passive star topology,” Perform. E d . , vol. 16, no. 1-3, pp. 223-239, Nov. 1992. N. Mehravari, “Performance and protocol improvements for a very high speed optical fiber local area networks using a passive star topology,” J. Lightwave Technol., vol. 8, no. 4, pp. 520-530, Apr. 1990. G. N. M. Sudhakar, N. D. Georganas, and M. Kavehrad, “Slotted aloha and reservation aloha protocols for very high-speed optical local area networks using passive star topology,” J. Lightwave Technol., vol. 9, no. 10, pp. 1411-1422, Oct. 1991. K. A. Williams, T. Q. Dam, and D. H.-C. Du “A media-access protocols for time- and wavelength-division multiplexed passive star networks,” IEEE J. Select. Areas Commun., vol. 11, pp. 560-567, May 1993.
GLOBECOM 1994, pp. 567-571.
... . .. . . ... .. . . ... . . . .,.

168 IEEWACM TRANSACTIONS ON NETWORKING, VOL. 3, NO. 2, APRIL 1995
David A. Levine (S’94) received the B.S. degree in electronics and communications in 1988 from the Universidad La Salle, Mexico City, and the M.S.E.E. degree in 1991 from the University of Virginia.
He is currently a Ph.D. student in computer engineering at the Georgia Institute of Technology, where he is the recipient of a scholarship from the National Science Foundation. H s c m n t kseatch interests are in wireless B-ISDN ( A m ) networks, optical LAN’s, and performance evaluation.
Ian F. Akyildiz (M’85SM.89) received the B.S., M.S., and Ph.D. degrees in computer engineering from the University of Erlangen-Nuemberg, Ger- many, in 1978, 1981, and 1984, respectively.
Currently, he is a Professor with the School of Electrical and Computer Engineering, Georgia Institute of Technology. He has held Visiting Profes- sorships at the Universidad Tecnica Federico Santa Maria, Chile, Universiti? Pierre et Marie Curie (Paris VI), and Ecole Nationale Suphieure Telecommu- nications, Paris, France. He has published over SO
technical papers in journals and conference proceedings. He is a coauthor of a textbook entitled Annlysis of Computer Systems (Germany: Teubner- Verlag, 1982). He is an associate editor for Computer Networks and ISDN Systems Joumal, and an editor for IEEE TRANSACTIONS ON COMPUTERS. and the Journal of Wireless Networks. He guest edited several special issues, such as on “Parallel and Distributed Simulation Performance” for ACM Transactions on Modeling and Simulafion; on “TeletrafEc Issues in ATM Networks,” for Computer Networks and ISDN Systems Joumal; and on “Networks in the Metropolitan Area,” for IEEE JOURNAL OF SEL- AaEAs IN COMMUNICATIONS. He was the Chairman of the 9th IEEE Computer Communications Workshop, held in Florida in October 1994. His current research interests are in B-ISDN (ATM) networks, optical LAN’s, wireless networks, performance evaluation, parallel simulation, high performance computing, and network security. Dr. Akyildiz has been a member of ACM since 1985 (SIGCOMM,
SIGMETRICS, SIGOPS) and has been a National Lecturer for ACM since 1989. He received the “Don Federico Santa Maria Medal,” for his services to the Universidad of Federico Santa Maria, Chile. He is listed in Who’s Who in the WorM (Platinum 4.) . He also received the ACM Outstanding Distinguished Lecturer Award for 1994.