Embed Size (px)
Citation preview
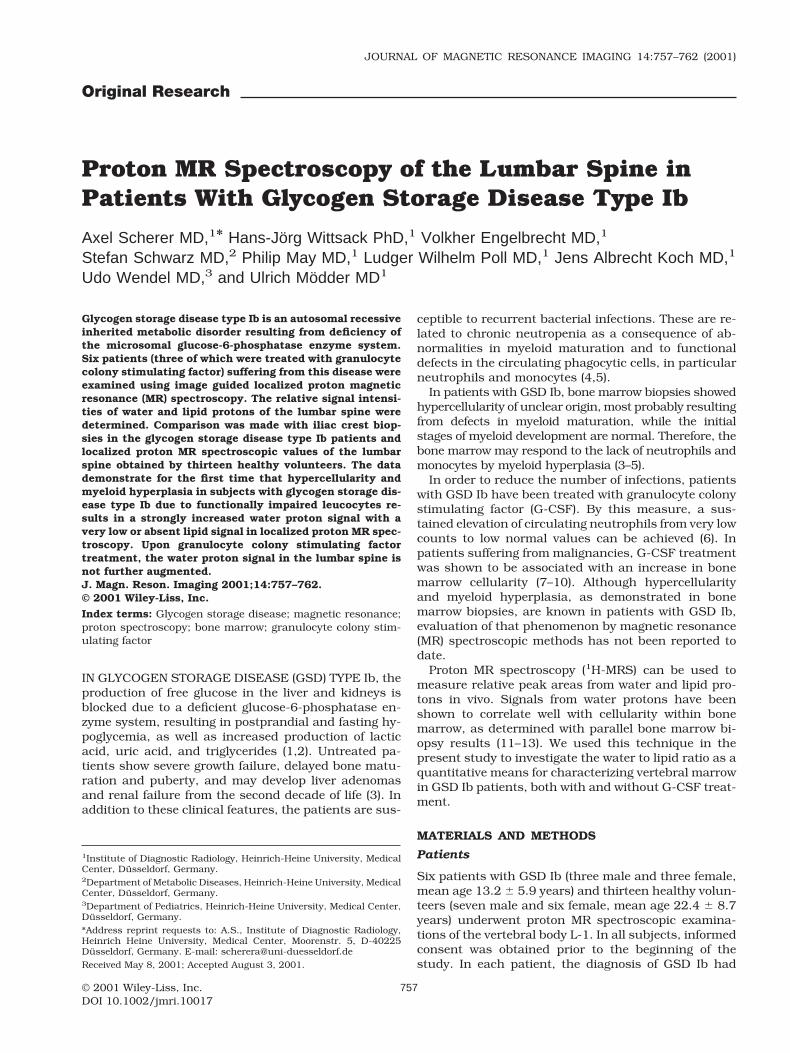
Original Research
Proton MR Spectroscopy of the Lumbar Spine inPatients With Glycogen Storage Disease Type Ib
Axel Scherer MD,1* Hans-Jorg Wittsack PhD,1 Volkher Engelbrecht MD,1
Stefan Schwarz MD,2 Philip May MD,1 Ludger Wilhelm Poll MD,1 Jens Albrecht Koch MD,1
Udo Wendel MD,3 and Ulrich Modder MD1
Glycogen storage disease type Ib is an autosomal recessiveinherited metabolic disorder resulting from deficiency ofthe microsomal glucose-6-phosphatase enzyme system.Six patients (three of which were treated with granulocytecolony stimulating factor) suffering from this disease wereexamined using image guided localized proton magneticresonance (MR) spectroscopy. The relative signal intensi-ties of water and lipid protons of the lumbar spine weredetermined. Comparison was made with iliac crest biop-sies in the glycogen storage disease type Ib patients andlocalized proton MR spectroscopic values of the lumbarspine obtained by thirteen healthy volunteers. The datademonstrate for the first time that hypercellularity andmyeloid hyperplasia in subjects with glycogen storage dis-ease type Ib due to functionally impaired leucocytes re-sults in a strongly increased water proton signal with avery low or absent lipid signal in localized proton MR spec-troscopy. Upon granulocyte colony stimulating factortreatment, the water proton signal in the lumbar spine isnot further augmented.J. Magn. Reson. Imaging 2001;14:757–762.© 2001 Wiley-Liss, Inc.
Index terms: Glycogen storage disease; magnetic resonance;proton spectroscopy; bone marrow; granulocyte colony stim-ulating factor
IN GLYCOGEN STORAGE DISEASE (GSD) TYPE Ib, theproduction of free glucose in the liver and kidneys isblocked due to a deficient glucose-6-phosphatase en-zyme system, resulting in postprandial and fasting hy-poglycemia, as well as increased production of lacticacid, uric acid, and triglycerides (1,2). Untreated pa-tients show severe growth failure, delayed bone matu-ration and puberty, and may develop liver adenomasand renal failure from the second decade of life (3). Inaddition to these clinical features, the patients are sus-
ceptible to recurrent bacterial infections. These are re-lated to chronic neutropenia as a consequence of ab-normalities in myeloid maturation and to functionaldefects in the circulating phagocytic cells, in particularneutrophils and monocytes (4,5).
In patients with GSD Ib, bone marrow biopsies showedhypercellularity of unclear origin, most probably resultingfrom defects in myeloid maturation, while the initialstages of myeloid development are normal. Therefore, thebone marrow may respond to the lack of neutrophils andmonocytes by myeloid hyperplasia (3–5).
In order to reduce the number of infections, patientswith GSD Ib have been treated with granulocyte colonystimulating factor (G-CSF). By this measure, a sus-tained elevation of circulating neutrophils from very lowcounts to low normal values can be achieved (6). Inpatients suffering from malignancies, G-CSF treatmentwas shown to be associated with an increase in bonemarrow cellularity (7–10). Although hypercellularityand myeloid hyperplasia, as demonstrated in bonemarrow biopsies, are known in patients with GSD Ib,evaluation of that phenomenon by magnetic resonance(MR) spectroscopic methods has not been reported todate.
Proton MR spectroscopy (1H-MRS) can be used tomeasure relative peak areas from water and lipid pro-tons in vivo. Signals from water protons have beenshown to correlate well with cellularity within bonemarrow, as determined with parallel bone marrow bi-opsy results (11–13). We used this technique in thepresent study to investigate the water to lipid ratio as aquantitative means for characterizing vertebral marrowin GSD Ib patients, both with and without G-CSF treat-ment.
MATERIALS AND METHODS
Patients
Six patients with GSD Ib (three male and three female,mean age 13.2 6 5.9 years) and thirteen healthy volun-teers (seven male and six female, mean age 22.4 6 8.7years) underwent proton MR spectroscopic examina-tions of the vertebral body L-1. In all subjects, informedconsent was obtained prior to the beginning of thestudy. In each patient, the diagnosis of GSD Ib had
1Institute of Diagnostic Radiology, Heinrich-Heine University, MedicalCenter, Dusseldorf, Germany.2Department of Metabolic Diseases, Heinrich-Heine University, MedicalCenter, Dusseldorf, Germany.3Department of Pediatrics, Heinrich-Heine University, Medical Center,Dusseldorf, Germany.*Address reprint requests to: A.S., Institute of Diagnostic Radiology,Heinrich Heine University, Medical Center, Moorenstr. 5, D-40225Dusseldorf, Germany. E-mail: [email protected] May 8, 2001; Accepted August 3, 2001.
JOURNAL OF MAGNETIC RESONANCE IMAGING 14:757–762 (2001)
© 2001 Wiley-Liss, Inc. 757DOI 10.1002/jmri.10017
been confirmed by enzymatic analysis on liver tissueobtained by biopsy or by mutational analysis in thegene of the microsomal glucose-6-phosphate trans-porter. Three GSD Ib patients were treated with G-CSFfor an average of 3.9 6 2.1 years and an average dose of2.4 6 1.3 m g/kg body weight/day. The individual dataof the subjects studied are summarized in Table 1.Three GSD Ib patients did not receive G-CSF sincethere was an adequate response to antibiotic therapy ofinfection. The absolute neutrophil counts in the periph-eral blood were obtained on the day of MR spectroscopicexamination in the GSD Ib patients. In all patients onG-CSF therapy, a bone marrow aspiration from the iliaccrest was performed (in two patients within 24 hoursafter the MR spectroscopic examination, in one patienttwo weeks later). All subjects were without clinicalsymptoms in the skeletal regions examined.
Localized Proton MR Spectroscopy
The examinations were recorded on a Siemens Magne-tom Vision whole-body MR scanner (Siemens MedicalSystems, Erlangen, Germany) at a field strength of 1.5Tesla. Sufficient signal-to-noise ratio from bone marrowin the lumbar spine was obtained using the body coil forradio-frequency excitation and a spine array surfacecoil for signal reception. The patients were placed in thesupine position, with the lumbar spine lying on thesurface coil. The field homogeneity was improved forspectroscopy by automatic shimming procedure. Thespectroscopic measurements were preceeded by T1-weighted (TR 450 msec/TE 14 msec/thickness 4.0 mm)spin-echo sequences in a coronal, an axial, and a sag-ittal plane. Positioning of the cubic volume of interest(VOI) in the vertebral body L-1 for spectroscopy was
image-guided in three perpendicular slices using theabove mentioned standard imaging. MR spectra fromthe cubic volume of 1.5 3 1.5 3 1.5 cm3 were acquiredby the stimulated echo acquisition mode (STEAM) se-quence (14). An echo time (TE) of 20 msec and a repe-tition time (TR) of 6 seconds was used in all measure-ments. By using these TE and TR values the resultingsignal intensities will correlate well with the water andlipid content in bone marrow because of relative smallrelaxation effects but will underestimate the real waterto lipid ratio of about 15% (9). Sixteen acquisitions foreach spectrum were accumulated to achieve a goodsignal to noise ratio within a reasonable measuringtime of one minute 36 seconds. Resulting spectra con-sisted of two peaks, the water peak at 4.7 ppm and onepeak at 1.3 ppm to lipids. For evaluation of the signalintensities of water and lipid spectra were analyzed inthe time domain using the VARPRO algorithm imple-mented in the software MRUI. Because of the high sig-nal-to-noise ratio, there was no need to use any priorinformation in analyzing the spectra. The water to lipidratios could then be derived from the resulting signalintensities (SI) by using the following equation: water tolipid ratio 5 R 5 SI H
2O / SI lipids.
These ratios were analyzed within the different pa-tient groups using the Mann-Whitney-U-test. Valuesare given as mean SD.
RESULTS
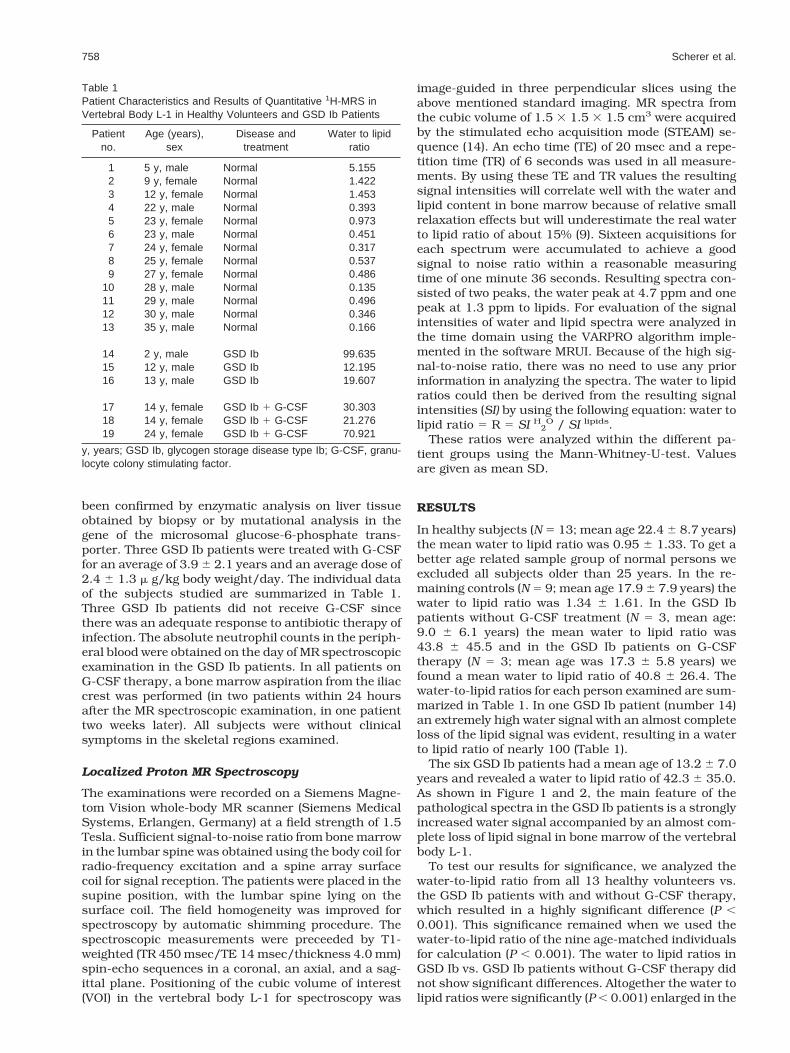
In healthy subjects (N 5 13; mean age 22.4 6 8.7 years)the mean water to lipid ratio was 0.95 6 1.33. To get abetter age related sample group of normal persons weexcluded all subjects older than 25 years. In the re-maining controls (N 5 9; mean age 17.9 6 7.9 years) thewater to lipid ratio was 1.34 6 1.61. In the GSD Ibpatients without G-CSF treatment (N 5 3, mean age:9.0 6 6.1 years) the mean water to lipid ratio was43.8 6 45.5 and in the GSD Ib patients on G-CSFtherapy (N 5 3; mean age was 17.3 6 5.8 years) wefound a mean water to lipid ratio of 40.8 6 26.4. Thewater-to-lipid ratios for each person examined are sum-marized in Table 1. In one GSD Ib patient (number 14)an extremely high water signal with an almost completeloss of the lipid signal was evident, resulting in a waterto lipid ratio of nearly 100 (Table 1).
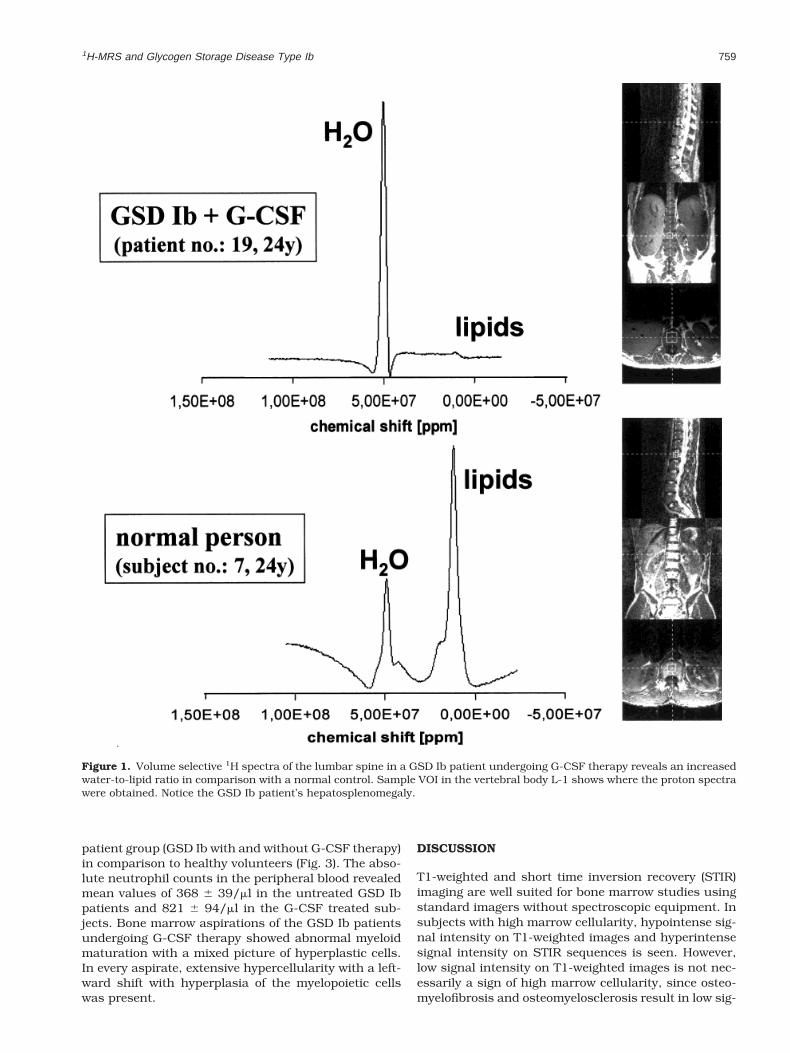
The six GSD Ib patients had a mean age of 13.2 6 7.0years and revealed a water to lipid ratio of 42.3 6 35.0.As shown in Figure 1 and 2, the main feature of thepathological spectra in the GSD Ib patients is a stronglyincreased water signal accompanied by an almost com-plete loss of lipid signal in bone marrow of the vertebralbody L-1.
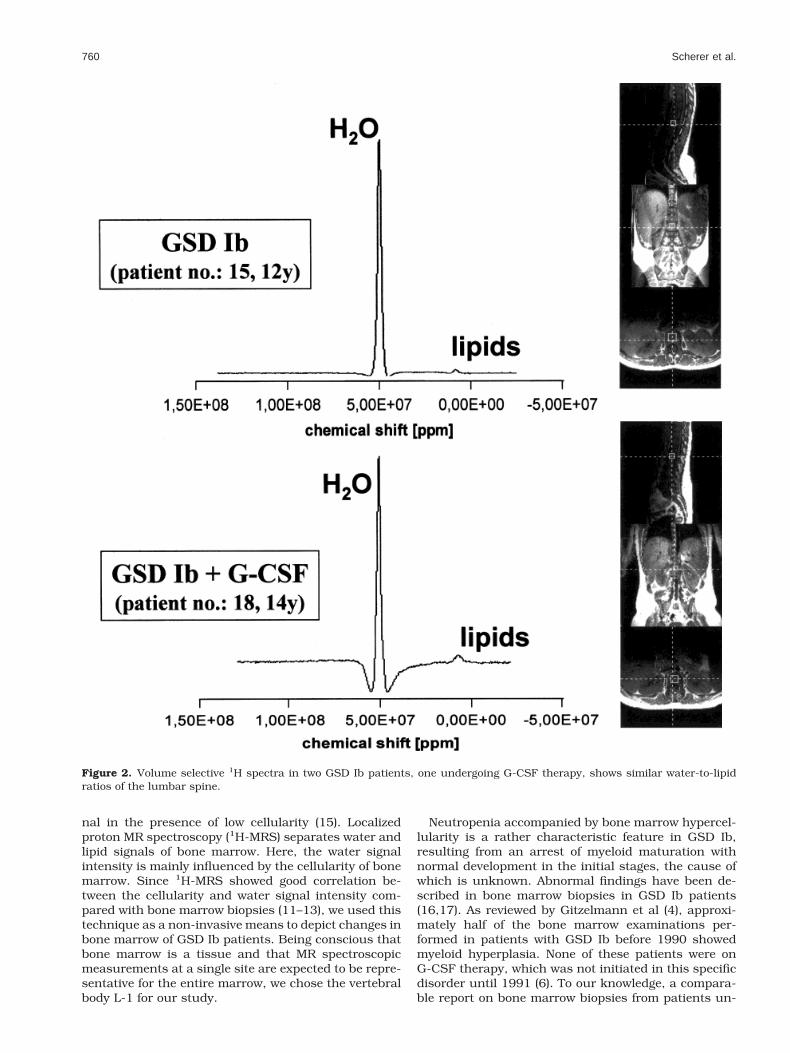
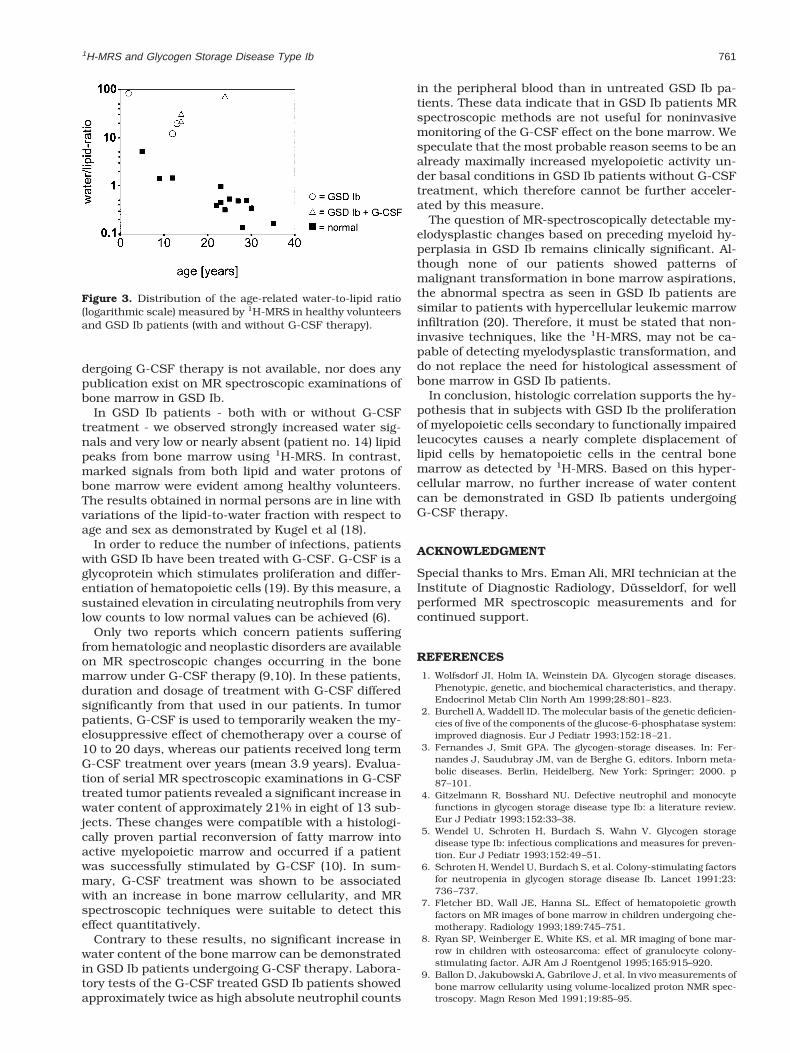
To test our results for significance, we analyzed thewater-to-lipid ratio from all 13 healthy volunteers vs.the GSD Ib patients with and without G-CSF therapy,which resulted in a highly significant difference (P ,0.001). This significance remained when we used thewater-to-lipid ratio of the nine age-matched individualsfor calculation (P , 0.001). The water to lipid ratios inGSD Ib vs. GSD Ib patients without G-CSF therapy didnot show significant differences. Altogether the water tolipid ratios were significantly (P , 0.001) enlarged in the
Table 1Patient Characteristics and Results of Quantitative 1H-MRS inVertebral Body L-1 in Healthy Volunteers and GSD Ib Patients
Patientno.
Age (years),sex
Disease andtreatment
Water to lipidratio
1 5 y, male Normal 5.1552 9 y, female Normal 1.4223 12 y, female Normal 1.4534 22 y, male Normal 0.3935 23 y, female Normal 0.9736 23 y, male Normal 0.4517 24 y, female Normal 0.3178 25 y, female Normal 0.5379 27 y, female Normal 0.486
10 28 y, male Normal 0.13511 29 y, male Normal 0.49612 30 y, male Normal 0.34613 35 y, male Normal 0.166
14 2 y, male GSD Ib 99.63515 12 y, male GSD Ib 12.19516 13 y, male GSD Ib 19.607
17 14 y, female GSD Ib 1 G-CSF 30.30318 14 y, female GSD Ib 1 G-CSF 21.27619 24 y, female GSD Ib 1 G-CSF 70.921
y, years; GSD Ib, glycogen storage disease type Ib; G-CSF, granu-locyte colony stimulating factor.
758 Scherer et al.
patient group (GSD Ib with and without G-CSF therapy)in comparison to healthy volunteers (Fig. 3). The abso-lute neutrophil counts in the peripheral blood revealedmean values of 368 6 39/ml in the untreated GSD Ibpatients and 821 6 94/ml in the G-CSF treated sub-jects. Bone marrow aspirations of the GSD Ib patientsundergoing G-CSF therapy showed abnormal myeloidmaturation with a mixed picture of hyperplastic cells.In every aspirate, extensive hypercellularity with a left-ward shift with hyperplasia of the myelopoietic cellswas present.
DISCUSSION
T1-weighted and short time inversion recovery (STIR)imaging are well suited for bone marrow studies usingstandard imagers without spectroscopic equipment. Insubjects with high marrow cellularity, hypointense sig-nal intensity on T1-weighted images and hyperintensesignal intensity on STIR sequences is seen. However,low signal intensity on T1-weighted images is not nec-essarily a sign of high marrow cellularity, since osteo-myelofibrosis and osteomyelosclerosis result in low sig-
Figure 1. Volume selective 1H spectra of the lumbar spine in a GSD Ib patient undergoing G-CSF therapy reveals an increasedwater-to-lipid ratio in comparison with a normal control. Sample VOI in the vertebral body L-1 shows where the proton spectrawere obtained. Notice the GSD Ib patient’s hepatosplenomegaly.
1H-MRS and Glycogen Storage Disease Type Ib 759
nal in the presence of low cellularity (15). Localizedproton MR spectroscopy (1H-MRS) separates water andlipid signals of bone marrow. Here, the water signalintensity is mainly influenced by the cellularity of bonemarrow. Since 1H-MRS showed good correlation be-tween the cellularity and water signal intensity com-pared with bone marrow biopsies (11–13), we used thistechnique as a non-invasive means to depict changes inbone marrow of GSD Ib patients. Being conscious thatbone marrow is a tissue and that MR spectroscopicmeasurements at a single site are expected to be repre-sentative for the entire marrow, we chose the vertebralbody L-1 for our study.
Neutropenia accompanied by bone marrow hypercel-lularity is a rather characteristic feature in GSD Ib,resulting from an arrest of myeloid maturation withnormal development in the initial stages, the cause ofwhich is unknown. Abnormal findings have been de-scribed in bone marrow biopsies in GSD Ib patients(16,17). As reviewed by Gitzelmann et al (4), approxi-mately half of the bone marrow examinations per-formed in patients with GSD Ib before 1990 showedmyeloid hyperplasia. None of these patients were onG-CSF therapy, which was not initiated in this specificdisorder until 1991 (6). To our knowledge, a compara-ble report on bone marrow biopsies from patients un-
Figure 2. Volume selective 1H spectra in two GSD Ib patients, one undergoing G-CSF therapy, shows similar water-to-lipidratios of the lumbar spine.
760 Scherer et al.
dergoing G-CSF therapy is not available, nor does anypublication exist on MR spectroscopic examinations ofbone marrow in GSD Ib.
In GSD Ib patients - both with or without G-CSFtreatment - we observed strongly increased water sig-nals and very low or nearly absent (patient no. 14) lipidpeaks from bone marrow using 1H-MRS. In contrast,marked signals from both lipid and water protons ofbone marrow were evident among healthy volunteers.The results obtained in normal persons are in line withvariations of the lipid-to-water fraction with respect toage and sex as demonstrated by Kugel et al (18).
In order to reduce the number of infections, patientswith GSD Ib have been treated with G-CSF. G-CSF is aglycoprotein which stimulates proliferation and differ-entiation of hematopoietic cells (19). By this measure, asustained elevation in circulating neutrophils from verylow counts to low normal values can be achieved (6).
Only two reports which concern patients sufferingfrom hematologic and neoplastic disorders are availableon MR spectroscopic changes occurring in the bonemarrow under G-CSF therapy (9,10). In these patients,duration and dosage of treatment with G-CSF differedsignificantly from that used in our patients. In tumorpatients, G-CSF is used to temporarily weaken the my-elosuppressive effect of chemotherapy over a course of10 to 20 days, whereas our patients received long termG-CSF treatment over years (mean 3.9 years). Evalua-tion of serial MR spectroscopic examinations in G-CSFtreated tumor patients revealed a significant increase inwater content of approximately 21% in eight of 13 sub-jects. These changes were compatible with a histologi-cally proven partial reconversion of fatty marrow intoactive myelopoietic marrow and occurred if a patientwas successfully stimulated by G-CSF (10). In sum-mary, G-CSF treatment was shown to be associatedwith an increase in bone marrow cellularity, and MRspectroscopic techniques were suitable to detect thiseffect quantitatively.
Contrary to these results, no significant increase inwater content of the bone marrow can be demonstratedin GSD Ib patients undergoing G-CSF therapy. Labora-tory tests of the G-CSF treated GSD Ib patients showedapproximately twice as high absolute neutrophil counts
in the peripheral blood than in untreated GSD Ib pa-tients. These data indicate that in GSD Ib patients MRspectroscopic methods are not useful for noninvasivemonitoring of the G-CSF effect on the bone marrow. Wespeculate that the most probable reason seems to be analready maximally increased myelopoietic activity un-der basal conditions in GSD Ib patients without G-CSFtreatment, which therefore cannot be further acceler-ated by this measure.
The question of MR-spectroscopically detectable my-elodysplastic changes based on preceding myeloid hy-perplasia in GSD Ib remains clinically significant. Al-though none of our patients showed patterns ofmalignant transformation in bone marrow aspirations,the abnormal spectra as seen in GSD Ib patients aresimilar to patients with hypercellular leukemic marrowinfiltration (20). Therefore, it must be stated that non-invasive techniques, like the 1H-MRS, may not be ca-pable of detecting myelodysplastic transformation, anddo not replace the need for histological assessment ofbone marrow in GSD Ib patients.
In conclusion, histologic correlation supports the hy-pothesis that in subjects with GSD Ib the proliferationof myelopoietic cells secondary to functionally impairedleucocytes causes a nearly complete displacement oflipid cells by hematopoietic cells in the central bonemarrow as detected by 1H-MRS. Based on this hyper-cellular marrow, no further increase of water contentcan be demonstrated in GSD Ib patients undergoingG-CSF therapy.
ACKNOWLEDGMENT
Special thanks to Mrs. Eman Ali, MRI technician at theInstitute of Diagnostic Radiology, Dusseldorf, for wellperformed MR spectroscopic measurements and forcontinued support.
REFERENCES
1. Wolfsdorf JI, Holm IA, Weinstein DA. Glycogen storage diseases.Phenotypic, genetic, and biochemical characteristics, and therapy.Endocrinol Metab Clin North Am 1999;28:801–823.
2. Burchell A, Waddell ID. The molecular basis of the genetic deficien-cies of five of the components of the glucose-6-phosphatase system:improved diagnosis. Eur J Pediatr 1993;152:18–21.
3. Fernandes J, Smit GPA. The glycogen-storage diseases. In: Fer-nandes J, Saudubray JM, van de Berghe G, editors. Inborn meta-bolic diseases. Berlin, Heidelberg, New York: Springer; 2000. p87–101.
4. Gitzelmann R, Bosshard NU. Defective neutrophil and monocytefunctions in glycogen storage disease type Ib: a literature review.Eur J Pediatr 1993;152:33–38.
5. Wendel U, Schroten H, Burdach S, Wahn V. Glycogen storagedisease type Ib: infectious complications and measures for preven-tion. Eur J Pediatr 1993;152:49–51.
6. Schroten H, Wendel U, Burdach S, et al. Colony-stimulating factorsfor neutropenia in glycogen storage disease Ib. Lancet 1991;23:736–737.
7. Fletcher BD, Wall JE, Hanna SL. Effect of hematopoietic growthfactors on MR images of bone marrow in children undergoing che-motherapy. Radiology 1993;189:745–751.
8. Ryan SP, Weinberger E, White KS, et al. MR imaging of bone mar-row in children with osteosarcoma: effect of granulocyte colony-stimulating factor. AJR Am J Roentgenol 1995;165:915–920.
9. Ballon D, Jakubowski A, Gabrilove J, et al. In vivo measurements ofbone marrow cellularity using volume-localized proton NMR spec-troscopy. Magn Reson Med 1991;19:85–95.
Figure 3. Distribution of the age-related water-to-lipid ratio(logarithmic scale) measured by 1H-MRS in healthy volunteersand GSD Ib patients (with and without G-CSF therapy).
1H-MRS and Glycogen Storage Disease Type Ib 761
10. Layer G, Sander W, Traber F, et al. Diagnostic problems of MRI instudying the effect of G-CSF therapy in bone marrow of patientswith malignoma. Radiologe 2000;40:710–715.
11. Schick F, Einsele H, Kost R, et al. Hematopoietic reconstitution afterbone marrow transplantation: assessment with MR imaging and H-1localized spectroscopy. J Magn Reson Imaging 1994;4:71–78.
12. Ballon D, Jakubowski A, Gabrilove J, et al. In vivo measurementsof bone marrow cellularity using volume-localized proton NMRspectroscopy. Magn Reson Med 1991;19:85–95.
13. Traber F, Block W, Layer G, et al. Determination of 1H relaxationtimes of water in human bone marrow by fat-suppressed turbo spinecho in comparison to MR spectroscopic methods. J Magn ResonImaging 1996;6:541–548.
14. Frahm J, Bruhn H, Gyngell ML, Merboldt KD, Hanicke W, Sauter R.Localized high-resolution proton NMR spectroscopy using stimu-lated echoes: initial applications to human brain in vivo. MagnReson Med 1989;9:79–93.
15. Moulopoulos LA, Dimopoulos MA. Magnetic resonance imaging ofthe bone marrow in hematologic malignancies. Blood 1997;90:2127–2147.
16. Ueno N, Tomita M, Ariga T, et al. Impaired monocyte function inglycogen storage disease type Ib. Eur J Pediatr 1986;145:312–314.
17. Roe TF, Thomas DW, Gilsanz V, Issacs H, Atkinson JB. Inflamatorybowel disease in glycogen storage disease type Ib. J Pediatr 1986;109:55–59.
18. Kugel H, Jung C, Schulte O, Heindel W. Age- and sex-specificdifferences in the (1)H-spectrum of the vertebral bone marrow. JMagn Reson Imaging 2001;13:263–268.
19. Lieschke GJ, Burgess AW. Granulocyte colony-stimulating factorand granulocyte-macrophage colony-stimulating factor. N EnglJ Med 1992;327:28–35.
20. Schick F, Einsele H, Lutz O, Claussen CD. Lipid selective MRimaging and localized 1H spectroscopy of bone marrow duringtherapy of leukemia. Anticancer Res 1996;16:1545–1551.
762 Scherer et al.