Embed Size (px)
Citation preview
PROTOTYPE
New England DD Health FactsState Developmental Disability Benchmarks for Health-related Indicators
HEALTH & WELLNESS BENCHMARKS
2008
This prototype document integrates the most recent National Core Indicators results for health-related measures within the New England DD state agencies with representative national benchmark data. NCI results for the participating New England states have been tested for statistical significance, with significance levels noted in footnotes that accompany data tables for the seven health indicators included in this document.
The development of appropriate benchmarks for use in comparing NCI findings with either the general population and/or specific populations reported in the literature is and will continue to be an ongoing process. While many of the benchmarks presented in this document must be viewed with extreme caution (e.g., population characteristics are different, specific measures and operational definitions vary) they can provide a very general background for conducting further analysis and review.
This document is set-up to operate as a MS PowerPoint slide presentation and is best viewed in this fashion. Hyperlinks to specific slides within the presentation are noted in BLUE type. Navigating through the presentation using these hyperlinks should facilitate finding the data the user is most interested in reviewing.
Updates to this presentation will be provided on a periodic basis. All users are strongly encouraged to provide comments regarding the document – as well as links to additional benchmarks – to:[email protected]
September 30, 2008
To Main MenuSet viewer to Slide Show now
and click “Main Menu”

PROTOTYPE
New England DD Health FactsState Developmental Disability Benchmarks for Health-related Indicators
HEALTH & WELLNESS BENCHMARKS
Annual Physical (Health) Exams
Annual Ob/Gyn Exams
Dental Exams/ Visits
Physical Activity
Tobacco Use
Weight Concerns
Psychotropic Drug Utilization
2008
CURRENTData and Benchmarks from 2007 NCI
and General Population Statistics
FUTUREData and Benchmarks proposed for future
NCI – to be available in 2009
“click” category to review data
Vision examinationHearing examinationFlu vaccinationPneumonia vaccinationPelvic examination (F)Mammogram (F)PSA test (M)Colorectal cancer screeningFalls evaluationSerious injury from fallTreatment for depression

Directions:
You must run the presentation in PowerPoint SLIDE SHOW in order to activate the hyperlinks. This will allow you to simply “click” on a link in order to be brought to the desired slide. Links are printed in BLUE and underlined.
Each slide has a BACK TO link or series of links in the upper right hand corner. Use these to return to either the main menu or the slide with data on all the participating New England states for each major category.
New England DD Health FactsState Developmental Disability Benchmarks for Health-related Indicators
HEALTH & WELLNESS BENCHMARKS2008
Back to Main Menu


Annual Health ExamsNational
Benchmark
New England States CT MA ME RI VT
NCI: Percent with physical exam
within the past year 1 86% 86% 94% 78% 81%
Percent adults in U.S. with
preventive health exam per year 2 21%
1 NCI New England State Results (2006-2007). Special report prepared by HSRI, September 12, 2008.
2 Mehrotra A, Zaslavsky A & Ayanian, J. Preventive health examinations and preventive gynecological examinations in the United States. Arch Intern Med. 2007;167(17):1876-1883
Reference group: adult general population. Sample: analysis of 8,413 ambulatory care visits in 2002-2004 extrapolated to the U.S. population to determine estimates of annual preventive health exams
Reference group: adults with DD served by state DD agecnies. Sample: 1,866 adults with DD in four NE states participating in the 2007 NCI cycle.
Pearson chi-square computed for 4 New England NCI state sample only. Chi-square not significant (asymp.sig 2 sided equal to 9.7218E-18).
Indicator: Percent of adults with a physical exam within the past year.
link
Back to Main Menu
link link linkClick link for state charts
New England DD Health FactsState Developmental Disability Benchmarks
MEDICAL EXAMS

Indicator: Percent of adult women with a Ob/Gyn exam within the past year.
Back to Main Menu
Annual Ob/Gyn ExamsNational
Benchmark
New England States CT MA ME RI VT
NCI: Percent adult women with last
ob/gyn exam within the past year 1 48% 51% 43% 51%
Percent female adults in U.S. with preventive gynecological exam per year 2
18%
1 NCI New England State Results (2006-2007). Special report prepared by HSRI, September 12, 2008.
2 Mehrotra A, Zaslavsky A & Ayanian, J. Preventive health examinations and preventive gynecological examinations in the United States. Arch Intern Med. 2007;167(17):1876-1883
Pearson chi-square computed for 3 New England NCI state sample only. Chi-square not significant (asymp.sig 2 sided equal to 7.12457E-05).
Reference group: adults with DD served by state DD agecnies. Sample: 647 female adults with DD in three NE states participating in the 2007 NCI cycle.
Reference group: adult general population. Sample: analysis of 8,413 ambulatory care visits in 2002-2004 extrapolated to the U.S. population to determine estimates of annual preventive health exams
link link linkClick link for state charts
New England DD Health FactsState Developmental Disability Benchmarks
GYN EXAMS

Dental VisitsNational
Benchmark
New England States CT MA ME RI VT
NCI: Percent with dental visit within the past 6
mo. 1 61% 61% 67% 59% 56%
Percent adults in U.S. reporting at least one
dental visit in past year (12 mo.) 2 60%
Percent persons aged 18-yrs and older who
visited a dentist in the previous year 3 42%
Percent persons with disabilities aged 18-yrs and older who visited a dentist in the previous
year 3 35%
Percent of adults who visited the dentist within
the past year, 2006 4 70% 80% 78% 71% 80% 74%
Indicator: Percent of adults who have had a dental visit within the past six months. [Note: NCI = visit within 6 mo., general population benchmarks = visit within 1 year.]
Back to Main Menu
link link link
Click link for state chartslink
2 CDC National Center for Health Statistics, Trends in Oral Health Status: United States, 1988-1994 and 1999-2004. Series 11, Number 248. 104 pp. (PHS) 2007-1698. Published April 30, 2007 at: http://www.cdc.gov/nchs/pressroom/07newsreleases/oralhealth.htm
3 CDC Healthy People 2010 Database, May 2008 Edition. Objective 21-10, available at: http://wonder.cdc.gov/scripts/broker.exe
4 The National Oral Health Surveillence System, The Center for Disease Control and Prevention (CDC), based on the Behavioral Risk Factor Surveillance System (BRFSS); data available at http://apps.nccd.cdc.gov/brfss/list.asp?cat=OH&yr=2006&qkey=6610&state=All.
Reference group: adults with DD served by state DD agecnies. Sample: 1,851 adults with DD in four NE states participating in the 2007 NCI cycle. Note: criteria for NCI is different than national benchmarks, i.e., visit within 6 mo. v national benchmarks which utilize visit within one year.
Reference group: U.S. adults aged 20 to 64 years who reported having a dental visit in the past year during 1999–2004.
Reference group: U.S. adults aged 18 years and older. Data for 2004.
Reference group: Data represent adults who reported having visited the dentist or dental clinic within the past year for any reason. Data based on the Behavioral Risk Factor Surveillance System, an ongoing, state-based, random-digit-dialed telephone survey of noninstitutionalized civilian adults aged 18 years and older. Date reported for 2006.
Pearson chi-square computed for 4 New England NCI state sample only. Chi-square not significant (asymp.sig 2 sided equal to 9.84E-15).
1 NCI New England State Results (2006-2007). Special report prepared by HSRI, September 12, 2008.
New England DD Health FactsState Developmental Disability Benchmarks
DENTAL
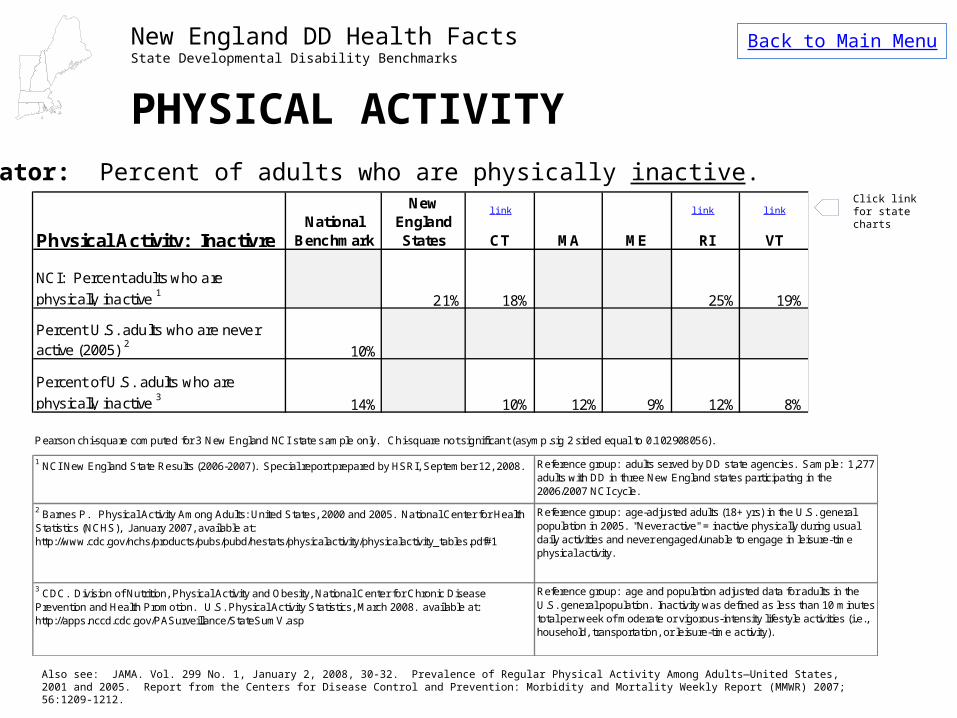
Physical Activity: Inactivre National
Benchmark
New England States CT MA ME RI VT
NCI: Percent adults who are
physically inactive 1 21% 18% 25% 19%
Percent U.S. adults who are never active (2005) 2 10%
Percent of U.S. adults who are
physically inactive 3 14% 10% 12% 9% 12% 8%
Pearson chi-square computed for 3 New England NCI state sample only. Chi-square not significant (asymp.sig 2 sided equal to 0.102908056).
Indicator: Percent of adults who are physically inactive.
link
Back to Main Menu
link linkClick link for state charts
Reference group: age and population adjusted data for adults in the U.S. general population. Inactivity was defined as less than 10 minutes total per week of moderate or vigorous-intensity lifestyle activities (i.e., household, transportation, or leisure-time activity).
3 CDC. Division of Nutrition, Physical Activity and Obesity, National Center for Chronic Disease Prevention and Health Promotion. U.S. Physical Activity Statistics, March 2008. available at: http://apps.nccd.cdc.gov/PASurveillance/StateSumV.asp
1 NCI New England State Results (2006-2007). Special report prepared by HSRI, September 12, 2008.
2 Barnes P. Physical Activity Among Adults: United States, 2000 and 2005. National Center for Health Statistics (NCHS), January 2007, available at: http://www.cdc.gov/nchs/products/pubs/pubd/hestats/physicalactivity/physicalactivity_tables.pdf#1
Reference group: adults served by DD state agencies. Sample: 1,277 adults with DD in three New England states participating in the 2006/2007 NCI cycle.
Reference group: age-adjusted adults (18+ yrs) in the U.S. general population in 2005. "Never active" = inactive physically during usual daily activities and never engaged/unable to engage in leisure-time physical activity.
Also see: JAMA. Vol. 299 No. 1, January 2, 2008, 30-32. Prevalence of Regular Physical Activity Among Adults—United States, 2001 and 2005. Report from the Centers for Disease Control and Prevention: Morbidity and Mortality Weekly Report (MMWR) 2007; 56:1209-1212.
New England DD Health FactsState Developmental Disability Benchmarks
PHYSICAL ACTIVITY

Smoking & Tobacco UseNational
Benchmark
New England States CT MA ME RI VT
NCI: Percent adults who smoke or
use tobacco 1 9% 10% 9% 9%
Percent adults in U.S. who smoke 2 19% 15% 16% 20% 17% 18%
Pearson chi-square computed for 4 New England NCI state sample only. Chi-square not significant (asymp.sig 2 sided equal to .53955).
Indicator: Percent of adults who smoke/use tobacco.
link
Back to Main Menu
link linkClick link for state charts
Reference group: adults with DD served by state DD agecnies. Sample: 1,866 adults with DD in three NE states participating in the 2007 NCI cycle.
1 NCI New England State Results (2006-2007). Special report prepared
by HSRI, September 12, 2008.
Reference group: Data represent U.S. adults who reported that they current ly smoke every day or some days. Data based on the Behavioral Risk Factor Surveillance System, an ongoing, state-based, random-digit-dialed telephone survey of noninstitutionalized civilian adults aged 18 years and older.
2 Centers for Disease Control and Prevention (CDC), Behavioral Risk
Factor Surveillance Sys tem Survey Data (BRFSS), accessed 06/10/2008. Available at http://apps.nccd.cdc.gov/brfss/list.asp?cat=TU&yr=2007&qkey=4396&state=All.
New England DD Health FactsState Developmental Disability Benchmarks
TOBACCO USE

Weight Concerns: OverweightNational
Benchmark
New England States CT MA ME RI VT
NCI: Percent adults who are overweight 1 32% 29% 35% 32%
Percent U.S. adults who are obese (2007) 2 26% 22% 22% 25% 22% 22%
Percent of U.S. adults who are overweight
(2007) 2 37% 38% 37% 38% 39% 37%Percent of U.S. adults who are obese (2003-
2004) 3 34%
Percent of U.S. adults who are overweight
(2003-2004) 3 32%
Percent of adults with intellectual disability
who are obese (1997-2000) 4 35%
Percent of adults with intellectual disability
who are overweight (1997-2000) 429%
Pearson chi-square computed for 3 New England NCI state sample for overall weight concern only. Chi-square not significant (asymp.sig 2 sided equal to 0.090679).
New England DD Health FactsState Developmental Disability Benchmarks
WEIGHTIndicator: Percent of adults who are overweight.
link
Back to Main Menu
link linkClick link for state charts
Reference group: adults with DD served by state DD agecnies - self report re: weight. Sample: 1,278 adults with DD in three NE states participating in the 2007 NCI cycle.
Reference group: adults in U.S. general population aged 20- 74-yrs for 2003-2004. Obesity defined as BMI >30; overweight defined as BMI >25 and <30. Data for Fig 13.
Reference group: adults in U.S. general population based on BMI (overweight >25<30, obese >30). Data from the BRFSS.
2 The Centers for Disease Control and Prevention (CDC), Behavioral Risk Factor Surveillance System Survey Data (BRFSS), accessed June 12, 2008. Available at http://apps.nccd.cdc.gov/brfss/list.asp?cat=OB&yr=2007&qkey=4409&state=All
1 NCI New England State Results (2006-2007). Special report prepared by HSRI, September 12, 2008.
3 National Center for Health Statistics, Health, United States, 2007 With Chartbook on Trends in the Health of Americans. Hyattsville, MD: 2007 Library. available at: http://www.cdc.gov/nchs/data/hus/hus07.pdf#074
4 Yamaki K. Body Weight Status Among Adults With Intellectual Disability in the Community. Mental Retardation: 2005, Vol. 43, No. 1, pp. 1–10. available at: http://aamr.allenpress.com/aamronline/?request=get-document&doi=10.1352%2F0047-6765(2005)43%3C1:BWSAAW%3E2.0.CO%3B2#i0047-6765-43-1-1-t02
Reference group: sample of adults between the ages of 18- and 65-yrs who lived in the community and who were diagnosed with an intellectual disability. Obesity and overweight defined based on BMI: obese (30 BMI), overweight (25 BMI < 30).

New England DD Health FactsState Developmental Disability Benchmarks
PSYCHOTROPIC DRUGUTILIZATION
Back to Main Menu
MEDICATIONS FOR:
Mood Disorders
Anxiety
Behavior Problems
Psychotic Disorders
When finished, exit Slide Show (Esc key)

Psychotropic Drugs: Mood disorders
National Benchmark
New England States CT MA ME RI VT
NCI: Percent adults who take psychotropic
medications for mood disorders 1 31% 29% 34%
Percent of U.S. general population age 18-64
yrs taking antidepressants (2002) 2 10.3%
Percent of persons with MR in LTC who take
antidepressant medications (1995) 3 6.1%
Pearson chi-square computed for 2 New England NCI state sample only. Chi-square significant (asymp.sig 2 sided equal to 0.002387).
Indicator: Percent of adults who use psychotropic medication for a mood disorder. [Note: benchmark for general population NOT directly comparable to NCI.]
link
Back to Psychotropic DrugsBack to Main Menu
link
Click link for state charts
New England DD Health FactsState Developmental Disability Benchmarks
PSYCHOTROPIC MEDICATION
MOOD DISORDERS
Reference group: children and adults with mental retardation who resided in nursing homes in OK in 1995. Sample size = 1,056.
1 NCI New England State Results (2006-2007). Special report prepared by HSRI, September 12, 2008. Reference group: adults with DD served by state DD agecnies - self report re: weight. Sample: 818 adults with DD in three NE states participating in the 2007 NCI cycle.
Reference group: non-elderly adults in the U.S. general population aged 18- to 64-yrs . Data obtained via the MEPS-HC for 2002.
3 Spreat S & Conroy J. Use of Psychotropic Medications for Persons With Mental Retardation Who Live in Oklahoma Nursing Homes. Psychiatr Serv 49:510-512, April 1998. Available at: http://psychservices.psychiatryonline.org/cgi/content/full/49/4/510
2 Stagnitti M. Trends in Antidepressant Use by the U.S. Civilian Noninstitutionalized Population, 1997 and 2002. Medical Expenditure Panel Survey: Statistical Brief No. 76. AHRQ, May 2005. Data available at: http://www.meps.ahrq.gov/mepsweb/data_files/publications/st76/stat76.pdf

Psychotropic Drugs: AnxietyNational
Benchmark
New England States CT MA ME RI VT
NCI: Percent adults who take psychotropic
medications for anxiety 128% 26% 29%
12-month prevalence of anxiety disorders in the
U.S. adult general population 219%
Percent of U.S. adult general population that
experiences an anxiety disorder each year 316%
Percent of persons with MR in LTC who take
anxiolytic medications (1995) 416%
Pearson chi-square computed for 2 New England NCI state sample only. Chi-square significant (asymp.sig 2 sided equal to 0.027837).
Indicator: Percent of adults who use psychotropic medication for anxiety. [Note: benchmark for general population NOT directly comparable to NCI.]
link
Back to Psychotropic DrugsBack to Main Menu
link
Click link for state charts
New England DD Health FactsState Developmental Disability Benchmarks
PSYCHOTROPIC MEDICATION
ANXIETY
3 U.S. Department of Health and Human Services. Mental Health: A Report of the Surgeon General—Executive Summary . Rockville, MD: U.S. Department of Health and Human Services, Substance Abuse and Mental Health Services Administration, Center for Mental Health Services, National Institutes of Health, National Institute of Mental Health, 1999. Available at: http://www.surgeongeneral.gov/library/mentalhealth/home.html
Reference group: adults in the U.S. general population between the ages of 18 to 54-yrs, 1999 report.
Reference group: adults in the U.S. general population between the ages of 18 and older - data updated to 2007.
2 National Comorbidity Survey (NCS) and National Comorbidity Survey Replication (NCS-R). Harvard Medical School, 2007. Data table available at: http://www.hcp.med.harvard.edu/ncs/ftpdir/table_ncsr_12monthprevgenderxage.pdf
4 Spreat S & Conroy J. Use of Psychotropic Medications for Persons With Mental Retardation Who Live in Oklahoma Nursing Homes. Psychiatr Serv 49:510-512, April 1998. Available at: http://psychservices.psychiatryonline.org/cgi/content/full/49/4/510
1 NCI New England State Results (2006-2007). Special report prepared by HSRI, September 12, 2008. Reference group: adults with DD served by state DD agecnies - self report re: weight. Sample: 816 adults with DD in three NE states participating in the 2007 NCI cycle.
Reference group: children and adults with mental retardation who resided in nursing homes in OK in 1995. Sample size = 1,056.

Psychotropic Drugs: Behavior Problems
National
Benchmark 2
New England States CT MA ME RI VT
NCI: Percent adults who take psychotropic
medications for behavior problems 1 23% 24% 22%
Pearson chi-square computed for 2 New England NCI state sample only. Chi-square significant (asymp.sig 2 sided equal to 0.027837).
Indicator: Percent of adults who use psychotropic medication for behavior problems. [Note: no comparable general population benchmark.]
link
Back to Psychotropic DrugsBack to Main Menu
link
Click link for state charts
New England DD Health FactsState Developmental Disability Benchmarks
PSYCHOTROPIC MEDICATION
BEHAVIOR
1 NCI New England State Results (2006-2007). Special report prepared by HSRI, September 12, 2008. Reference group: adults with DD served by state DD agecnies - self report re: weight. Sample: 816 adults with DD in three NE states participating in the 2007 NCI cycle.
2 No comparable general population benchmark available

Psychotropic Drugs: Psychotic Disorders
National Benchmark
New England States CT MA ME RI VT
NCI: Percent adults who take psychotropic
medications for psychotic disorders 115% 16% 15%
Percent of persons with MR in LTC who take
antipsychotic medications (1995) 232%
Pearson chi-square computed for 2 New England NCI state sample only. Chi-square significant (asymp.sig 2 sided equal to 0.038272).
Indicator: Percent of adults who use psychotropic medication for psychotic disorders.
link
Back to Psychotropic DrugsBack to Main Menu
link
Click link for state charts
New England DD Health FactsState Developmental Disability Benchmarks
PSYCHOTROPIC MEDICATION
PSYCHOTIC DISORDERS
2 Spreat S & Conroy J. Use of Psychotropic Medications for Persons With Mental Retardation Who Live in Oklahoma Nursing Homes. Psychiatr Serv 49:510-512, April 1998. Available at: http://psychservices.psychiatryonline.org/cgi/content/full/49/4/510
Reference group: children and adults with mental retardation who resided in nursing homes in OK in 1995. Sample size = 1,056.
1 NCI New England State Results (2006-2007). Special report prepared by HSRI, September 12, 2008. Reference group: adults with DD served by state DD agecnies - self report re: weight. Sample: 815 adults with DD in three NE states participating in the 2007 NCI cycle.

STATE SPECIFIC DATA

New England DD Health FactsState Developmental Disability Benchmarks
State: Connecticut - DDS
1 NCI: New England State Results (2006-2007). Special report prepared by HSRI, September 12, 2008.
REFERENCES:
2 Mehrotra A, Zaslavsky A & Ayanian, J. Preventive health examinations and preventive gynecological examinations in the United States. Arch Intern Med. 2007;167(17):1876-1883
Indicator: Percent of adults with a physical exam within the past year.
Back to Physical ExamsBack to Main Menu
86% 86%
21%
0%
10%
20%
30%
40%
50%
60%
70%
80%
90%
100%
NCI: CT (2007) NCI: NE Avg (2007) US Gen Pop
ConnecticutAnnual Health Exam CT NE AvgPercent adults with physical exam in past year 86% 86% 21%
NCI: 2007 1 US Gen
Pop 2

New England DD Health FactsState Developmental Disability Benchmarks
State: Maine - OACPDS
1 NCI: New England State Results (2006-2007). Special report prepared by HSRI, September 12, 2008.
REFERENCES:
2 Mehrotra A, Zaslavsky A & Ayanian, J. Preventive health examinations and preventive gynecological examinations in the United States. Arch Intern Med. 2007;167(17):1876-1883
Indicator: Percent of adults with a physical exam within the past year.
Back to Physical ExamsBack to Main Menu
94%86%
21%
0%
10%
20%
30%
40%
50%
60%
70%
80%
90%
100%
NCI: ME (2007) NCI: NE Avg (2007) US Gen Pop
MaineAnnual Health Exam ME NE AvgPercent adults with physical exam in past year 94% 86% 21%
NCI: 2007 1 US Gen
Pop 2
New England DD Health FactsState Developmental Disability Benchmarks
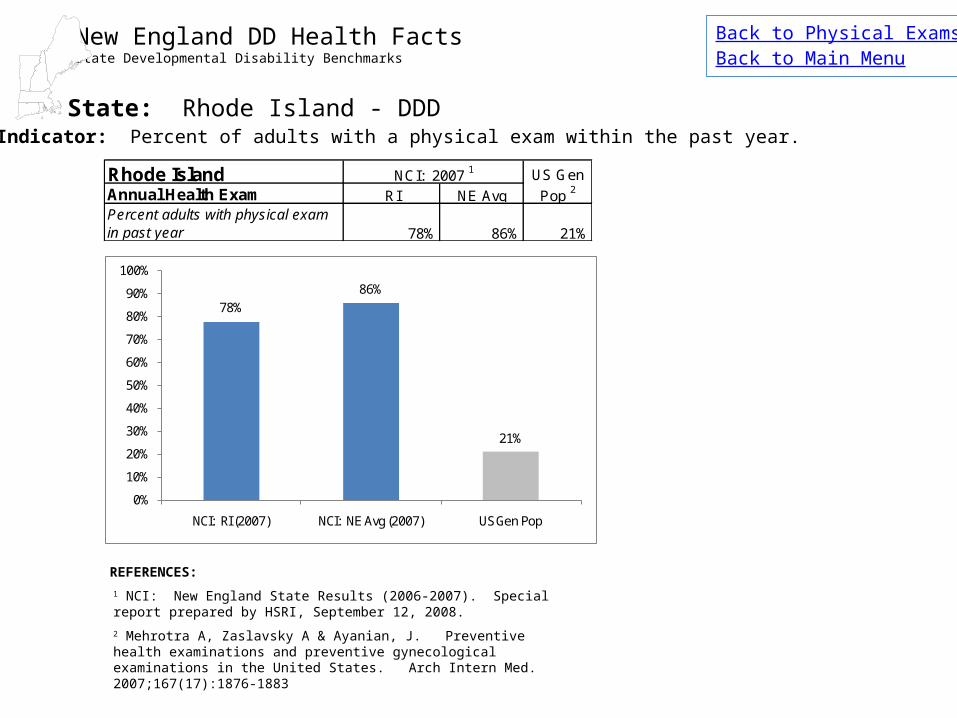
State: Rhode Island - DDD
1 NCI: New England State Results (2006-2007). Special report prepared by HSRI, September 12, 2008.
REFERENCES:
2 Mehrotra A, Zaslavsky A & Ayanian, J. Preventive health examinations and preventive gynecological examinations in the United States. Arch Intern Med. 2007;167(17):1876-1883
Indicator: Percent of adults with a physical exam within the past year.
Back to Physical ExamsBack to Main Menu
78%86%
21%
0%
10%
20%
30%
40%
50%
60%
70%
80%
90%
100%
NCI: RI (2007) NCI: NE Avg (2007) US Gen Pop
Rhode IslandAnnual Health Exam RI NE AvgPercent adults with physical exam in past year 78% 86% 21%
NCI: 2007 1 US Gen
Pop 2

New England DD Health FactsState Developmental Disability Benchmarks
State: Vermont - DAIL
1 NCI: New England State Results (2006-2007). Special report prepared by HSRI, September 12, 2008.
REFERENCES:
2 Mehrotra A, Zaslavsky A & Ayanian, J. Preventive health examinations and preventive gynecological examinations in the United States. Arch Intern Med. 2007;167(17):1876-1883
Indicator: Percent of adults with a physical exam within the past year.
Back to Physical ExamsBack to Main Menu
VermontAnnual Health Exam VT NE AvgPercent adults with physical exam in past year 81% 86% 21%
NCI: 2007 1 US Gen
Pop 2
81%86%
21%
0%
10%
20%
30%
40%
50%
60%
70%
80%
90%
100%
NCI: VT (2007) NCI: NE Avg (2007) US Gen Pop

New England DD Health FactsState Developmental Disability Benchmarks
State: Connecticut - DDS
1 NCI: New England State Results (2006-2007). Special report prepared by HSRI, September 12, 2008.
REFERENCES:
2 Mehrotra A, Zaslavsky A & Ayanian, J. Preventive health examinations and preventive gynecological examinations in the United States. Arch Intern Med. 2007;167(17):1876-1883
Indicator: Percent of adult women with an ob/gyn exam within the past year.
Back to Ob/Gyn ExamsBack to Main Menu
ConnecticutAnnual Ob/Gyn Exam CT DDS NE AvgPercent adult women with ob/gyn exam in past year 51% 48% 18%
NCI: 2007 1 US Gen
Pop 2
51%48%
18%
0%
10%
20%
30%
40%
50%
60%
NCI: CT (2007) NCI: NE Avg (2007) US Gen Pop

New England DD Health FactsState Developmental Disability Benchmarks
State: Maine - OACPDS
1 NCI: New England State Results (2006-2007). Special report prepared by HSRI, September 12, 2008.
REFERENCES:
2 Mehrotra A, Zaslavsky A & Ayanian, J. Preventive health examinations and preventive gynecological examinations in the United States. Arch Intern Med. 2007;167(17):1876-1883
Indicator: Percent of adult women with an ob/gyn exam within the past year.
Back to Ob/Gyn ExamsBack to Main Menu
MaineAnnual Ob/Gyn Exam ME BDS NE AvgPercent adult women with ob/gyn exam in past year 43% 48% 18%
NCI: 2007 1 US Gen
Pop 2
43%48%
18%
0%
10%
20%
30%
40%
50%
60%
NCI: ME (2007) NCI: NE Avg (2007) US Gen Pop

New England DD Health FactsState Developmental Disability Benchmarks
State: Rhode Island - DDD
1 NCI: New England State Results (2006-2007). Special report prepared by HSRI, September 12, 2008.
REFERENCES:
2 Mehrotra A, Zaslavsky A & Ayanian, J. Preventive health examinations and preventive gynecological examinations in the United States. Arch Intern Med. 2007;167(17):1876-1883
Indicator: Percent of adult women with an ob/gyn exam within the past year.
Back to Ob/Gyn ExamsBack to Main Menu
Rhode IslandAnnual Ob/Gyn Exam RI NE AvgPercent adult women with ob/gyn exam in past year 51% 48% 18%
NCI: 2007 1 US Gen
Pop 2
51%48%
18%
0%
10%
20%
30%
40%
50%
60%
NCI: RI (2007) NCI: NE Avg (2007) US Gen Pop

New England DD Health FactsState Developmental Disability Benchmarks
State: Connecticut DDSIndicator: Percent of adults with a dental visit within the past six months
Back to Dental VisitsBack to Main Menu
Connecticut
Dental Visit CT NE Avg
Percent adults with dental visit in past 6-mo. 61% 61%Percent adults with at least one dental visit in past year (1999-2004) 60%Percent adults who visited dentist in previous year (2004) 42%Percent adults with disabilities who visited dentist in previous year (2004) 35%Percent adults who visited dentist within past year (2006) 70% 80%
NCI: 2007 1 US Gen
Pop 2,3,4
CT Gen
Pop 4
61% 61% 60%
42%35%
80%
0%
10%
20%
30%
40%
50%
60%
70%
80%
90%
NCI: CT (2007): 6
mo.
NCI: NE Avg (2007): 6
mo.
US Gen Pop: 20-64/1 yr
US Gen Pop: 18+/1 yr
US Gen Pop: 18+ w
disab/1 yr
CT Gen Pop: adults/1yr
1 NCI: New England State Results (2006-2007). Special report prepared by HSRI, September 12, 2008.
REFERENCES:
2 CDC National Center for Health Statistics, Trends in Oral Health Status: United States, 1988-1994 and 1999-2004. Series 11, Number 248. 104 pp. (PHS) 2007-1698. Published April 30, 2007.
3 CDC Healthy People 2010 Database, May 2008 Edition. Objective 21-10.
4 The National Oral Health Surveillance System, The Center for Disease Control and Prevention (CDC), based on the Behavioral Risk Factor Surveillance System (BRFSS); data.
Visit withinpast 6-mo.
Visit withinpast 12-mo.
IMPORTANT NOTE:
NCI data is based on a more stringent criteria of dental visits within the past 6 months. This is NOT directly comparable to the general population benchmarks which rely on a criteria of a dental visit within the past year (12 months).

67%61% 60%
42%35%
71%
0%
10%
20%
30%
40%
50%
60%
70%
80%
NCI: ME (2007): 6
mo.
NCI: NE Avg (2007): 6
mo.
US Gen Pop: 20-64/1 yr
US Gen Pop: 18+/1 yr
US Gen Pop: 18+ w
disab/1 yr
ME Gen Pop: adults/1yr
New England DD Health FactsState Developmental Disability Benchmarks
State: Maine - OACPDSIndicator: Percent of adults with a dental visit within the past six months
Back to Dental VisitsBack to Main Menu
1 NCI: New England State Results (2006-2007). Special report prepared by HSRI, September 12, 2008.
REFERENCES:
2 CDC National Center for Health Statistics, Trends in Oral Health Status: United States, 1988-1994 and 1999-2004. Series 11, Number 248. 104 pp. (PHS) 2007-1698. Published April 30, 2007.
3 CDC Healthy People 2010 Database, May 2008 Edition. Objective 21-10.
4 The National Oral Health Surveillance System, The Center for Disease Control and Prevention (CDC), based on the Behavioral Risk Factor Surveillance System (BRFSS); data.
Visit withinpast 6-mo.
Visit withinpast 12-mo.
IMPORTANT NOTE:
NCI data is based on a more stringent criteria of dental visits within the past 6 months. This is NOT directly comparable to the general population benchmarks which rely on a criteria of a dental visit within the past year (12 months).
Maine
Dental Visit ME NE Avg
Percent adults with dental visit in past 6-mo. 67% 61%Percent adults with at least one dental visit in past year (1999-2004) 60%Percent adults who visited dentist in previous year (2004) 42%Percent adults with disabilities who visited dentist in previous year (2004) 35%Percent adults who visited dentist within past year (2006) 70% 71%
NCI: 2007 1 US Gen
Pop 2,3,4
ME Gen
Pop 4

59% 61% 60%
42%35%
80%
0%
10%
20%
30%
40%
50%
60%
70%
80%
90%
NCI: RI (2007): 6
mo.
NCI: NE Avg (2007): 6
mo.
US Gen Pop: 20-64/1 yr
US Gen Pop: 18+/1 yr
US Gen Pop: 18+ w
disab/1 yr
RI Gen Pop: adults/1yr
New England DD Health FactsState Developmental Disability Benchmarks
State: Rhode Island - DDDIndicator: Percent of adults with a dental visit within the past six months
Back to Dental VisitsBack to Main Menu
1 NCI: New England State Results (2006-2007). Special report prepared by HSRI, September 12, 2008.
REFERENCES:
2 CDC National Center for Health Statistics, Trends in Oral Health Status: United States, 1988-1994 and 1999-2004. Series 11, Number 248. 104 pp. (PHS) 2007-1698. Published April 30, 2007.
3 CDC Healthy People 2010 Database, May 2008 Edition. Objective 21-10.
4 The National Oral Health Surveillance System, The Center for Disease Control and Prevention (CDC), based on the Behavioral Risk Factor Surveillance System (BRFSS); data.
Visit withinpast 6-mo.
Visit withinpast 12-mo.
IMPORTANT NOTE:
NCI data is based on a more stringent criteria of dental visits within the past 6 months. This is NOT directly comparable to the general population benchmarks which rely on a criteria of a dental visit within the past year (12 months).
Rhode IslandDental Visit RI NE AvgPercent adults with dental visit in past 6-mo. 59% 61%Percent adults with at least one dental visit in past year (1999-2004) 60%Percent adults who visited dentist in previous year (2004) 42%Percent adults with disabilities who visited dentist in previous year (2004) 35%Percent adults who visited dentist within past year (2006) 70% 80%
NCI: 2007 1 US Gen
Pop 2,3,4
RI Gen
Pop 4

56%61% 60%
42%35%
74%
0%
10%
20%
30%
40%
50%
60%
70%
80%
NCI: VT (2007): 6
mo.
NCI: NE Avg (2007): 6
mo.
US Gen Pop: 20-64/1 yr
US Gen Pop: 18+/1 yr
US Gen Pop: 18+ w
disab/1 yr
VT Gen Pop: adults/1yr
New England DD Health FactsState Developmental Disability Benchmarks
State: Vermont - DAILIndicator: Percent of adults with a dental visit within the past six months
Back to Dental VisitsBack to Main Menu
1 NCI: New England State Results (2006-2007). Special report prepared by HSRI, September 12, 2008.
REFERENCES:
2 CDC National Center for Health Statistics, Trends in Oral Health Status: United States, 1988-1994 and 1999-2004. Series 11, Number 248. 104 pp. (PHS) 2007-1698. Published April 30, 2007.
3 CDC Healthy People 2010 Database, May 2008 Edition. Objective 21-10.
4 The National Oral Health Surveillance System, The Center for Disease Control and Prevention (CDC), based on the Behavioral Risk Factor Surveillance System (BRFSS); data.
Visit withinpast 6-mo.
Visit withinpast 12-mo.
IMPORTANT NOTE:
NCI data is based on a more stringent criteria of dental visits within the past 6 months. This is NOT directly comparable to the general population benchmarks which rely on a criteria of a dental visit within the past year (12 months).
VermontDental Visit VT NE AvgPercent adults with dental visit in past 6-mo. 56% 61%Percent adults with at least one dental visit in past year (1999-2004) 60%Percent adults who visited dentist in previous year (2004) 42%Percent adults with disabilities who visited dentist in previous year (2004) 35%Percent adults who visited dentist within past year (2006) 70% 74%
NCI: 2007 1 US Gen
Pop 2,3,4
VT Gen
Pop 4

New England DD Health FactsState Developmental Disability Benchmarks
State: Connecticut - DDS
REFERENCES:
Indicator: Percent of adults who are physically inactive.
Back to Physical ActivityBack to Main Menu
2 CDC. Division of Nutrition, Physical Activity and Obesity, National Center for Chronic Disease Prevention and Health Promotion. U.S. Physical Activity Statistics, March 2008. available at: http://apps.nccd.cdc.gov/PASurveillance/StateSumV.asp
ConnecticutPhysical Activity: Inactive CT NE AvgPercent adults who are physically inactive 18% 21% 14% 10%
NCI: 2007 1 US Gen
Pop 2CT Gen
Pop 2
18%
21%
14%
10%
0%
5%
10%
15%
20%
25%
NCI: CT (2007) NCI: NE Avg (2007) US Gen Pop (2007) CT Gen Pop (2007)
1 NCI New England State Results (2006-2007). Special report prepared by HSRI, September 12, 2008.
Note: Lower percentages represent greater levels of physical activity (healthier)

New England DD Health FactsState Developmental Disability Benchmarks
State: Rhode Island - DDD
REFERENCES:
Indicator: Percent of adults who are physically inactive.
Back to Physical ActivityBack to Main Menu
2 CDC. Division of Nutrition, Physical Activity and Obesity, National Center for Chronic Disease Prevention and Health Promotion. U.S. Physical Activity Statistics, March 2008. available at: http://apps.nccd.cdc.gov/PASurveillance/StateSumV.asp
1 NCI New England State Results (2006-2007). Special report prepared by HSRI, September 12, 2008.
Note: Lower percentages represent greater levels of physical activity (healthier)
Rhode IslandPhysical Activity: Inactive RI NE AvgPercent adults who are physically inactive 25% 21% 14% 12%
NCI: 2007 1 US Gen
Pop 2RI Gen
Pop 2
25%
21%
14%12%
0%
5%
10%
15%
20%
25%
30%
NCI: RI (2007) NCI: NE Avg (2007) US Gen Pop (2007) RI Gen Pop (2007)

New England DD Health FactsState Developmental Disability Benchmarks
State: Vermont- DAIL
REFERENCES:
Indicator: Percent of adults who are physically inactive.
Back to Physical ActivityBack to Main Menu
2 CDC. Division of Nutrition, Physical Activity and Obesity, National Center for Chronic Disease Prevention and Health Promotion. U.S. Physical Activity Statistics, March 2008. available at: http://apps.nccd.cdc.gov/PASurveillance/StateSumV.asp
1 NCI New England State Results (2006-2007). Special report prepared by HSRI, September 12, 2008.
Note: Lower percentages represent greater levels of physical activity (healthier)
VermontPhysical Activity: Inactive VT NE AvgPercent adults who are physically inactive 19% 21% 14% 8%
NCI: 2007 1 US Gen
Pop 2VT Gen
Pop 2
19%
21%
14%
8%
0%
5%
10%
15%
20%
25%
NCI: VT (2007) NCI: NE Avg (2007) US Gen Pop (2007) VT Gen Pop (2007)

New England DD Health FactsState Developmental Disability Benchmarks
State: Connecticut - DDS
REFERENCES:
Indicator: Percent of adults who smoke/use tobacco.
Back to Tobacco UseBack to Main Menu
1 NCI New England State Results (2006-2007). Special report prepared by HSRI, September 12, 2008.
2 Centers for Disease Control and Prevention (CDC), Behavioral Risk Factor Surveillance System Survey Data (BRFSS), accessed 06/10/2008. Available at http://apps.nccd.cdc.gov/brfss/list.asp?cat=TU&yr=2007&qkey=4396&state=All.
ConnecticutSmoking & Tobacco Use CT NE AvgPercent adults who smoke/use tobacco 10% 9% 19% 15%
NCI: 2007 1 US Gen
Pop 2CT Gen
Pop 2
10%9%
19%
15%
0%
2%
4%
6%
8%
10%
12%
14%
16%
18%
20%
NCI: CT (2007) NCI: NE Avg (2007) US Gen Pop (2007) CT Gen Pop (2007)

New England DD Health FactsState Developmental Disability Benchmarks
State: Rhode Island - DDD
REFERENCES:
Indicator: Percent of adults who smoke/use tobacco.
Back to Tobacco UseBack to Main Menu
1 NCI New England State Results (2006-2007). Special report prepared by HSRI, September 12, 2008.
2 Centers for Disease Control and Prevention (CDC), Behavioral Risk Factor Surveillance System Survey Data (BRFSS), accessed 06/10/2008. Available at http://apps.nccd.cdc.gov/brfss/list.asp?cat=TU&yr=2007&qkey=4396&state=All.
Rhode IslandSmoking & Tobacco Use RI NE AvgPercent adults who smoke/use tobacco 9% 9% 19% 17%
NCI: 2007 1 US Gen
Pop 2RI Gen
Pop 2
9% 9%
19%
17%
0%
2%
4%
6%
8%
10%
12%
14%
16%
18%
20%
NCI: RI (2007) NCI: NE Avg (2007) US Gen Pop (2007) RI Gen Pop (2007)

New England DD Health FactsState Developmental Disability Benchmarks
State: Vermont- DAIL
REFERENCES:
Indicator: Percent of adults who smoke/use tobacco.
Back to Tobacco UseBack to Main Menu
1 NCI New England State Results (2006-2007). Special report prepared by HSRI, September 12, 2008.
VermontSmoking & Tobacco Use VT NE AvgPercent adults who smoke/use tobacco 9% 9% 19% 18%
NCI: 2007 1 US Gen
Pop 2VT Gen
Pop 2
9% 9%
19%18%
0%
2%
4%
6%
8%
10%
12%
14%
16%
18%
20%
NCI: VT (2007) NCI: NE Avg (2007) US Gen Pop (2007) VT Gen Pop (2007)
2 Centers for Disease Control and Prevention (CDC), Behavioral Risk Factor Surveillance System Survey Data (BRFSS), accessed 06/10/2008. Available at http://apps.nccd.cdc.gov/brfss/list.asp?cat=TU&yr=2007&qkey=4396&state=All.
New England DD Health FactsState Developmental Disability Benchmarks
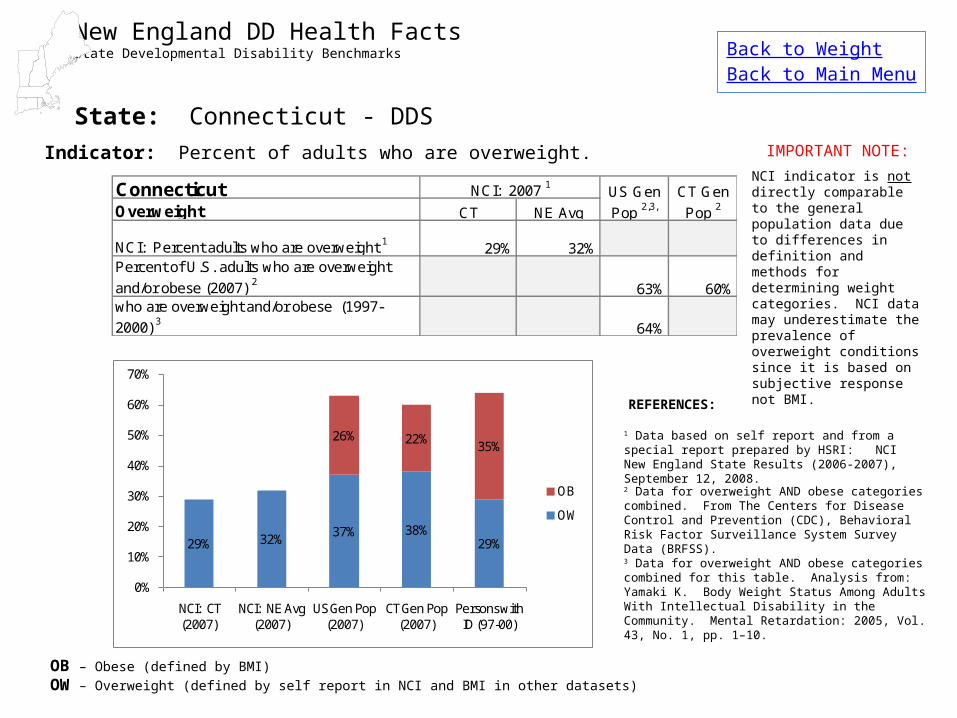
State: Connecticut - DDS
REFERENCES:
Indicator: Percent of adults who are overweight.
Back to WeightBack to Main Menu
1 Data based on self report and from a special report prepared by HSRI: NCI New England State Results (2006-2007), September 12, 2008.
2 Data for overweight AND obese categories combined. From The Centers for Disease Control and Prevention (CDC), Behavioral Risk Factor Surveillance System Survey Data (BRFSS).
3 Data for overweight AND obese categories combined for this table. Analysis from: Yamaki K. Body Weight Status Among Adults With Intellectual Disability in the Community. Mental Retardation: 2005, Vol. 43, No. 1, pp. 1–10.
IMPORTANT NOTE:
NCI indicator is not directly comparable to the general population data due to differences in definition and methods for determining weight categories. NCI data may underestimate the prevalence of overweight conditions since it is based on subjective response not BMI.
29% 32% 37% 38%29%
26% 22% 35%
0%
10%
20%
30%
40%
50%
60%
70%
NCI: CT (2007)
NCI: NE Avg (2007)
US Gen Pop (2007)
CT Gen Pop (2007)
Persons with ID (97-00)
OB
OW
OB – Obese (defined by BMI)
OW – Overweight (defined by self report in NCI and BMI in other datasets)
ConnecticutOverweight CT NE Avg
NCI: Percent adults who are overweight 1 29% 32%Percent of U.S. adults who are overweight
and/or obese (2007) 2 63% 60%Percent of adults with intellectual disability who are overweight and/or obese (1997-
2000) 364%
NCI: 2007 1 US Gen
Pop 2,3,
CT Gen
Pop 2

New England DD Health FactsState Developmental Disability Benchmarks
State: Rhode Island - DDD
REFERENCES:
Indicator: Percent of adults who are overweight.
Back to WeightBack to Main Menu
1 Data based on self report and from a special report prepared by HSRI: NCI New England State Results (2006-2007), September 12, 2008.
2 Data for overweight and obese categories combined. From The Centers for Disease Control and Prevention (CDC), Behavioral Risk Factor Surveillance System Survey Data (BRFSS).
3 Data for overweight and obese categories combined for this table. Analysis from: Yamaki K. Body Weight Status Among Adults With Intellectual Disability in the Community. Mental Retardation: 2005, Vol. 43, No. 1, pp. 1–10.
35% 32% 37% 39%29%
26% 22%35%
0%
10%
20%
30%
40%
50%
60%
70%
NCI: RI (2007)
NCI: NE Avg (2007)
US Gen Pop (2007)
RI Gen Pop (2007)
Persons with ID (97-00)
OB
OW
IMPORTANT NOTE:
NCI indicator is not directly comparable to the general population data due to differences in definition and methods for determining weight categories. NCI data may underestimate the prevalence of overweight conditions since it is based on subjective response not BMI.
OB – Obese (defined by BMI)
OW – Overweight (defined by self report in NCI and BMI in other datasets)
Rhode IslandOverweight RI NE Avg
NCI: Percent adults who are overweight 1 35% 32%Percent of U.S. adults who are overweight
and/or obese (2007) 2 63% 61%Percent of adults with intellectual disability who are overweight and/or obese (1997-
2000) 364%
NCI: 2007 1 US Gen
Pop 2,3,
RI Gen
Pop 2

New England DD Health FactsState Developmental Disability Benchmarks
State: Vermont - DAIL
REFERENCES:
Indicator: Percent of adults who are overweight.
Back to WeightBack to Main Menu
1 Data based on self report and from a special report prepared by HSRI: NCI New England State Results (2006-2007), September 12, 2008.
2 Data for overweight and obese categories combined. From The Centers for Disease Control and Prevention (CDC), Behavioral Risk Factor Surveillance System Survey Data (BRFSS).
3 Data for overweight and obese categories combined for this table. Analysis from: Yamaki K. Body Weight Status Among Adults With Intellectual Disability in the Community. Mental Retardation: 2005, Vol. 43, No. 1, pp. 1–10.
VermontOverweight VT NE Avg
NCI: Percent adults who are overweight 1 32% 32%Percent of U.S. adults who are overweight or
obese (2007) 2
63% 59%Percent of adults with intellectual disability
who are overweight or obese (1997-2000) 364%
NCI: 2007 1
US Gen
Pop 2,3,
VT Gen
Pop 2
32% 32% 37% 37%29%
26% 22% 35%
0%
10%
20%
30%
40%
50%
60%
70%
NCI: VT (2007)
NCI: NE Avg (2007)
US Gen Pop (2007)
VT Gen Pop (2007)
Persons with ID (97-00)
OB
OW
IMPORTANT NOTE:
NCI indicator is not directly comparable to the general population data due to differences in definition and methods for determining weight categories. NCI data may underestimate the prevalence of overweight conditions since it is based on subjective response not BMI.
OB – Obese (defined by BMI)
OW – Overweight (defined by self report in NCI and BMI in other datasets)

New England DD Health FactsState Developmental Disability Benchmarks
State: Connecticut - DDS
REFERENCES:
Indicator: Percent of adults who use psychotropic medications for mood disorders.
Back to Mood DisordersBack to Psychotropic DrugsBack to Main Menu
IMPORTANT NOTE:
NCI indicator is not directly comparable to the general population data due to differences in definition. National benchmarks may underestimate the prevalence of medications used to treat all mood disorders.
2 Stagnitti M. Trends in Antidepressant Use by the U.S. Civilian Noninstitutionalized Population, 1997 and 2002. Medical Expenditure Panel Survey: Statistical Brief No. 76. AHRQ, May 2005. Data available at: http://www.meps.ahrq.gov/mepsweb/data_files/publications/st76/stat76.pdf
1 NCI New England State Results (2006-2007). Special report prepared by HSRI, September 12, 2008.
3 Spreat S & Conroy J. Use of Psychotropic Medications for Persons With Mental Retardation Who Live in Oklahoma Nursing Homes. Psychiatr Serv 49:510-512, April 1998. Available at: http://psychservices.psychiatryonline.org/cgi/content/full/49/4/510
29%31%
10%
6%
0%
5%
10%
15%
20%
25%
30%
35%
NCI: CT (2007) NCI: NE Avg (2007) US Gen Pop People with ID in LTC (1995)
Connecticut
Psychotropic drug use: Mood Disorders CT NE Avg
NCI: Percent adults - psychotropic medication for mood disorders 29% 31%
Percent of U.S. general population taking antidepressants (2002) 10%
Percent of persons with MR in LTC who take antidepressant medications (1995) 6%
Benchmark
Pop 2,3
NCI: 2007 1

New England DD Health FactsState Developmental Disability Benchmarks
State: Rhode Island - DDD
Indicator: Percent of adults who use psychotropic medications for mood disorders.
Back to Mood DisordersBack to Psychotropic DrugsBack to Main Menu
IMPORTANT NOTE:
NCI indicator is not directly comparable to the general population data due to differences in definition. National benchmarks may underestimate the prevalence of medications used to treat all mood disorders.
REFERENCES:
2 Stagnitti M. Trends in Antidepressant Use by the U.S. Civilian Noninstitutionalized Population, 1997 and 2002. Medical Expenditure Panel Survey: Statistical Brief No. 76. AHRQ, May 2005. Data available at: http://www.meps.ahrq.gov/mepsweb/data_files/publications/st76/stat76.pdf
1 NCI New England State Results (2006-2007). Special report prepared by HSRI, September 12, 2008.
3 Spreat S & Conroy J. Use of Psychotropic Medications for Persons With Mental Retardation Who Live in Oklahoma Nursing Homes. Psychiatr Serv 49:510-512, April 1998. Available at: http://psychservices.psychiatryonline.org/cgi/content/full/49/4/510
34%31%
10%
6%
0%
5%
10%
15%
20%
25%
30%
35%
40%
NCI: RI (2007) NCI: NE Avg (2007)
US Gen Pop People with ID in LTC (1995)
Rhode IslandPsychotropic drug use: Mood Disorders RI NE Avg
NCI: Percent adults - psychotropic medication for mood disorders 34% 31%
Percent of U.S. general population taking antidepressants (2002) 10%
Percent of persons with MR in LTC who take antidepressant medications (1995) 6%
NCI: 2007 1
Benchmark
Pop 2,3

New England DD Health FactsState Developmental Disability Benchmarks
State: Connecticut - DDS
REFERENCES:
Indicator: Percent of adults who use psychotropic medications for anxiety.
Back to AnxietyBack to Psychotropic DrugsBack to Main Menu
IMPORTANT NOTE:
NCI indicator is not directly comparable to the general population data due to differences in definition. National benchmark may underestimate the prevalence of medications used to treat all forms of anxiety.
1 NCI New England State Results (2006-2007). Special report prepared by HSRI, September 12, 2008.
2 Spreat S & Conroy J. Use of Psychotropic Medications for Persons With Mental Retardation Who Live in Oklahoma Nursing Homes. Psychiatr Serv 49:510-512, April 1998. Available at: http://psychservices.psychiatryonline.org/cgi/content/full/49/4/510
26%28%
16%
0%
5%
10%
15%
20%
25%
30%
NCI: CT (2007) NCI: NE Avg (2007) People with ID in LTC (1995)
ConnecticutPsychotropic drug use: Anxiety CT NE AvgNCI: Percent adults - psychotropic medication for anxiety 26% 28% NAPercent of persons with ID in LTC who take anxiolytic medications. 16%
NCI: 2007 1 Benchmark
Pop 2

New England DD Health FactsState Developmental Disability Benchmarks
State: Rhode Island - DDD
Indicator: Percent of adults who use psychotropic medications for anxiety.
Back to AnxietyBack to Psychotropic DrugsBack to Main Menu
IMPORTANT NOTE:
NCI indicator is not directly comparable to the general population data due to differences in definition. National benchmark may underestimate the prevalence of medications used to treat all forms of anxiety.
REFERENCES:
1 NCI New England State Results (2006-2007). Special report prepared by HSRI, September 12, 2008.
2 Spreat S & Conroy J. Use of Psychotropic Medications for Persons With Mental Retardation Who Live in Oklahoma Nursing Homes. Psychiatr Serv 49:510-512, April 1998. Available at: http://psychservices.psychiatryonline.org/cgi/content/full/49/4/510
29% 28%
16%
0%
5%
10%
15%
20%
25%
30%
NCI: RI (2007) NCI: NE Avg (2007) People with ID in LTC (1995)
Rhode IslandPsychotropic drug use: Anxiety RI NE AvgNCI: Percent adults - psychotropic medication for anxiety 29% 28% NAPercent of persons with ID in LTC who take anxiolytic medications. 16%
Benchmark
Pop 2NCI: 2007 1

New England DD Health FactsState Developmental Disability Benchmarks
State: Connecticut - DDS
REFERENCES:
Indicator: Percent of adults who use psychotropic medications for behavior problems.
Back to Behavior ProblemsBack to Psychotropic DrugsBack to Main Menu
IMPORTANT NOTE:
NCI indicator is not directly comparable to available general population benchmarks.
1 NCI New England State Results (2006-2007). Special report prepared by HSRI, September 12, 2008.
ConnecticutPsychotropic drug use: Behavior CT NE AvgNCI: Percent adults - psychotropic medication for behavior problems 24% 23% NA
NCI: 2007 1 US Gen
Pop 2
24% 23%
0%
5%
10%
15%
20%
25%
30%
NCI: CT (2007) NCI: NE Avg (2007)

New England DD Health FactsState Developmental Disability Benchmarks
State: Rhode Island - DDD
Indicator: Percent of adults who use psychotropic medications for behavior problems.
Back to Behavior ProblemsBack to Psychotropic DrugsBack to Main Menu
IMPORTANT NOTE:
NCI indicator is not directly comparable to available general population benchmarks.
REFERENCES:
1 NCI New England State Results (2006-2007). Special report prepared by HSRI, September 12, 2008.
Rhode IslandPsychotropic drug use: Behavior RI NE AvgNCI: Percent adults - psychotropic medication for behavior problems 22% 23% NA
NCI: 2007 1 US Gen
Pop 2
22% 23%
0%
5%
10%
15%
20%
25%
30%
NCI: RI (2007) NCI: NE Avg (2007)

New England DD Health FactsState Developmental Disability Benchmarks
State: Connecticut - DDS
REFERENCES:
Indicator: Percent of adults who use psychotropic medications for psychotic disorders.
Back to Psychotic DisordersBack to Psychotropic DrugsBack to Main Menu
1 NCI New England State Results (2006-2007). Special report prepared by HSRI, September 12, 2008.
2 Spreat S & Conroy J. Use of Psychotropic Medications for Persons With Mental Retardation Who Live in Oklahoma Nursing Homes. Psychiatr Serv 49:510-512, April 1998. Available at: http://psychservices.psychiatryonline.org/cgi/content/full/49/4/510
16% 15%
32%
0%
5%
10%
15%
20%
25%
30%
35%
40%
NCI: CT (2007) NCI: NE Avg (2007) People with ID in LTC (1995)
ConnecticutPsychotropic drug use: Psychotic Disorders CT NE AvgNCI: Percent adults - psychotropic medication for psychotic disorders 16% 15% NAPercent of persons with MR in LTC who take
antipsychotic medications (1995) 2 32%
NCI: 2007 1
Benchmark
Pop 2

New England DD Health FactsState Developmental Disability Benchmarks
State: Rhode Island - DDD
Indicator: Percent of adults who use psychotropic medications for psychotic disorders.
Back to Psychotic DisordersBack to Psychotropic DrugsBack to Main Menu
REFERENCES:
1 NCI New England State Results (2006-2007). Special report prepared by HSRI, September 12, 2008.
2 Spreat S & Conroy J. Use of Psychotropic Medications for Persons With Mental Retardation Who Live in Oklahoma Nursing Homes. Psychiatr Serv 49:510-512, April 1998. Available at: http://psychservices.psychiatryonline.org/cgi/content/full/49/4/510
15% 15%
32%
0%
5%
10%
15%
20%
25%
30%
35%
40%
NCI: RI (2007) NCI: NE Avg (2007) People with ID in LTC (1995)
Rhode IslandPsychotropic drug use: Psychotic Disorders RI NE AvgNCI: Percent adults - psychotropic medication for psychotic disorders 15% 15% NAPercent of persons with MR in LTC who take
antipsychotic medications (1995) 2 32%
NCI: 2007 1
Benchmark
Pop 2


![Open Access Percentile benchmarks in patients with ... · Percentile benchmarks in patients with rheumatoid arthritis: Health Assessment ... [10]. The questionnaire is usua ... (e.g](https://img.pdfslide.net/doc/110x75/5b843ede7f8b9a784a8bedcc/open-access-percentile-benchmarks-in-patients-with-percentile-benchmarks.jpg)