Embed Size (px)
Citation preview

10/3/2019
1
Provider-Led Responses to Managed Care
& Driving Value-Based Care Katie Colgan, Esq., Executive Director of Integrated Networks
October 10, 2019
Agenda
• Value-Based & Managed Care Environment
• Opportunities in VBR & Alternative Payment Models
• Provider Owned Networks
• Provider Owned I-SNPs
• Emerging Models
• Readiness Assessment
• Questions & Next Steps
10/3/2019
2
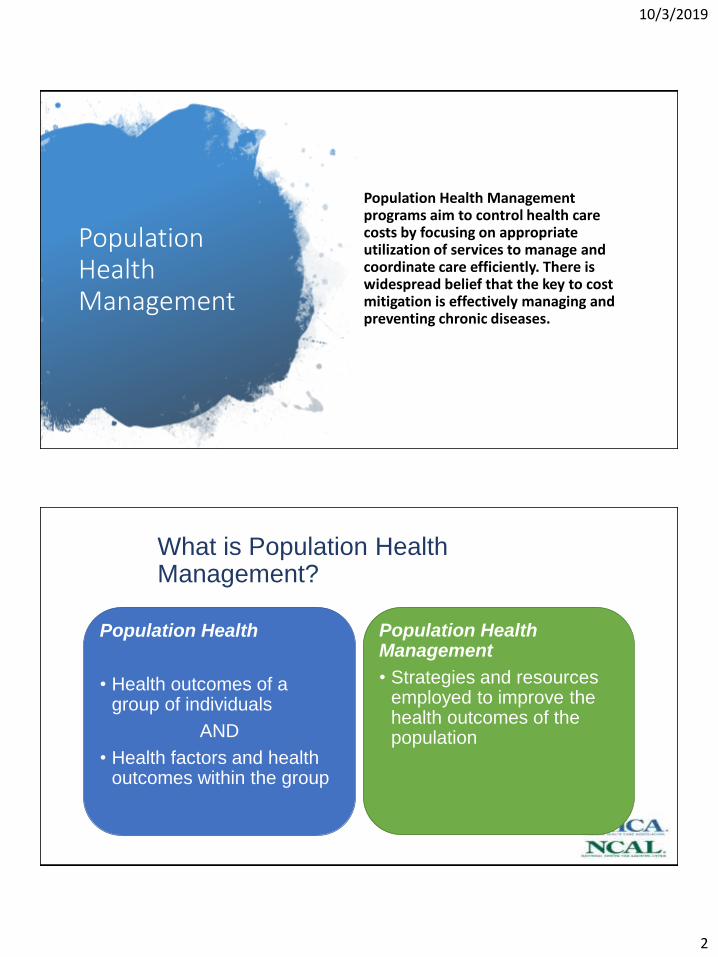
Population Health Management
Population Health Management programs aim to control health care costs by focusing on appropriate utilization of services to manage and coordinate care efficiently. There is widespread belief that the key to cost mitigation is effectively managing and preventing chronic diseases.
What is Population Health Management?
Population Health
• Health outcomes of a group of individuals
AND
• Health factors and health outcomes within the group
Population Health Management
• Strategies and resources employed to improve the health outcomes of the population
10/3/2019
3
The New Currency
Outcomes:
• Reduction in avoidable inpatient admissions (admits/1000)
• Reduction in avoidable emergency department visits (ED visits/1000)
• Decrease in overall inpatient cost
• Reduction in inpatient days/1000
• Decrease in cost per admit
The Value-Based World is Here
10/3/2019
4
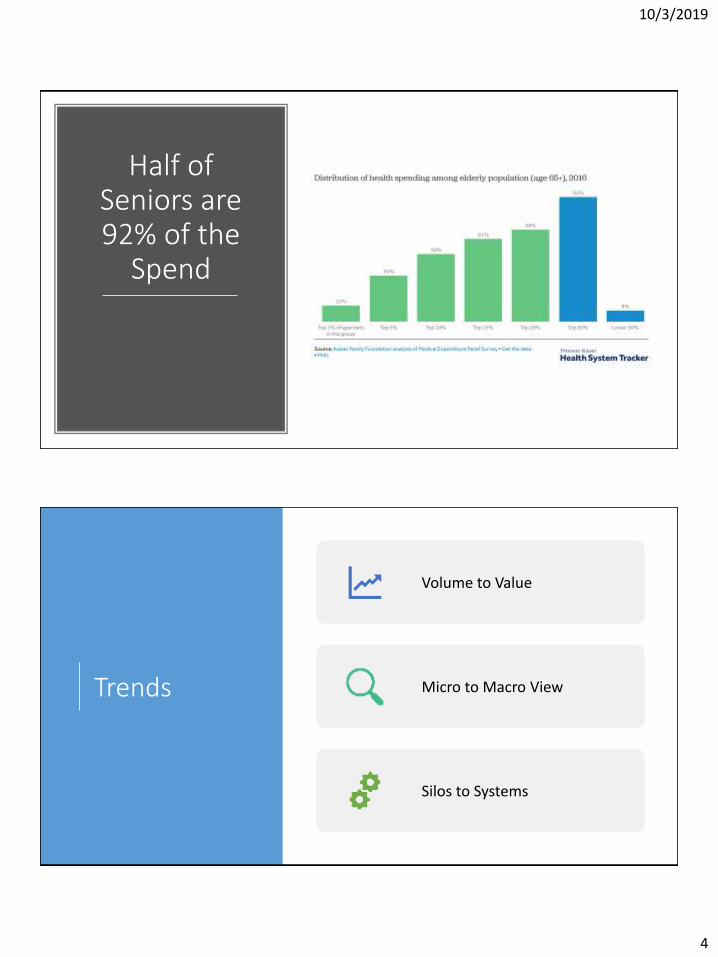
Half of Seniors are 92% of the
Spend
Trends
Volume to Value
Micro to Macro View
Silos to Systems

10/3/2019
5
CMS Shifting Risk From Volume to Value Using a Range of Models
Fee for Service – No link to quality or value
Fee for Service –Link to Quality and Value
Alternative Payment Models
Full Capitation
Deg
ree
Paym
ent
tied
to
Qu
alit
y an
d
Ou
tco
mes
Degree of Risk Assumed by Provider
Medicare Fee for Service Architecture
Medicare Managed Care Models
• Pay for Performance
• SNF Value Based Purchasing
• Independence at Home
• Shared Savings• Shared Risk• ACOs• Next Gen ACOs• Bundled
Payments• Primary Care
First Models
• MA/SNP• PACE• Some ACOs• Population
based payments
CMS is getting out
of FFS
ACOs have grown five-fold since 2012, with 10% of US population covered and two-sided risk models rapidly increasing
BPCI-A participants number approximately 1,300 hospitals and physician groups almost twice BPCI Original
48 states use some form of value based reimbursement programs
VBP span almost every provider type
Medicare Advantage enrollment has doubled over the past decade
Benefits have also significantly expanded with additional flexibilities for those with chronic conditions
Value Based Care Today

10/3/2019
6
Health Affairs: Recent Progress In The Value Journey: Growth Of ACOs And Value-Based Payment Models In 2018
Change Health Care: 2019 StateVBRstudy.com

10/3/2019
7
What Are States Doing?
4038
22
14
0
911
4038
2522
1816
13
0
5
10
15
20
25
30
35
40
45
2017 2019Change Health Care: 2019 StateVBRstudy.com
One-third of Medicare Beneficiaries are in Medicare Advantage

10/3/2019
8
Growing Managed Medicaid for LTC
• In 2017, 24 states operated MLTSS programs, a 50% increase from 2012 (16 states)
PAC Has Generated Most of the Savings in Value Based Care, But Not Reaped the Benefit
Savings
Lower cost settings
Decreased LOS
Reduced Readmissio
ns
Hospitals Conveners Health Plans Physicians
10/3/2019
9
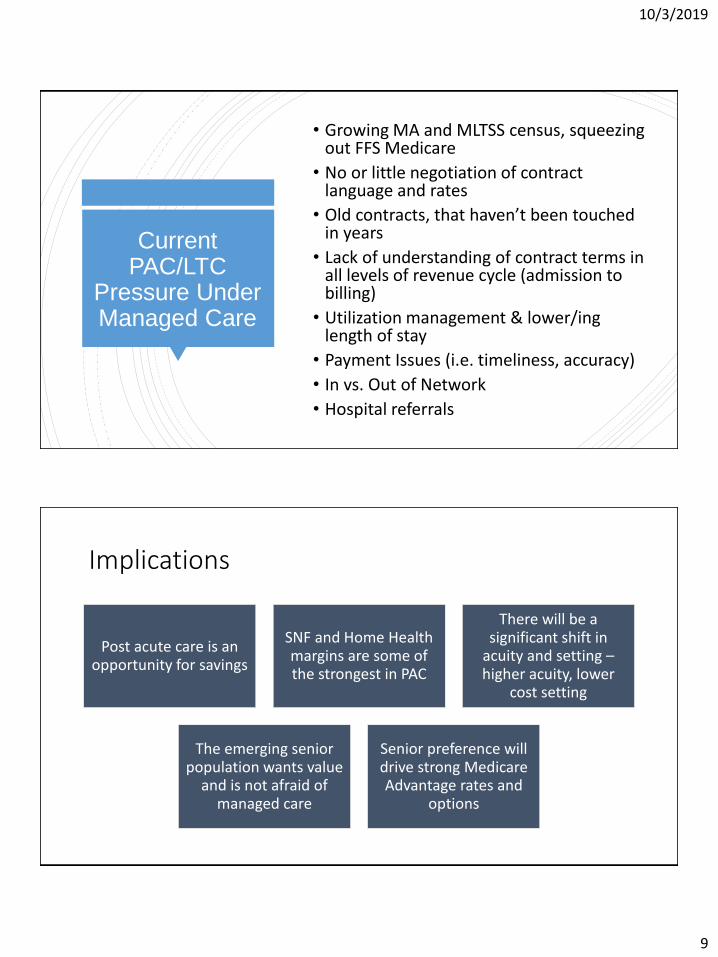
Current PAC/LTC
Pressure Under Managed Care
• Growing MA and MLTSS census, squeezing out FFS Medicare
• No or little negotiation of contract language and rates
• Old contracts, that haven’t been touched in years
• Lack of understanding of contract terms in all levels of revenue cycle (admission to billing)
• Utilization management & lower/inglength of stay
• Payment Issues (i.e. timeliness, accuracy)
• In vs. Out of Network
• Hospital referrals
Implications
Post acute care is an opportunity for savings
SNF and Home Health margins are some of the strongest in PAC
There will be a significant shift in
acuity and setting –higher acuity, lower
cost setting
The emerging senior population wants value
and is not afraid of managed care
Senior preference will drive strong Medicare Advantage rates and
options
10/3/2019
10
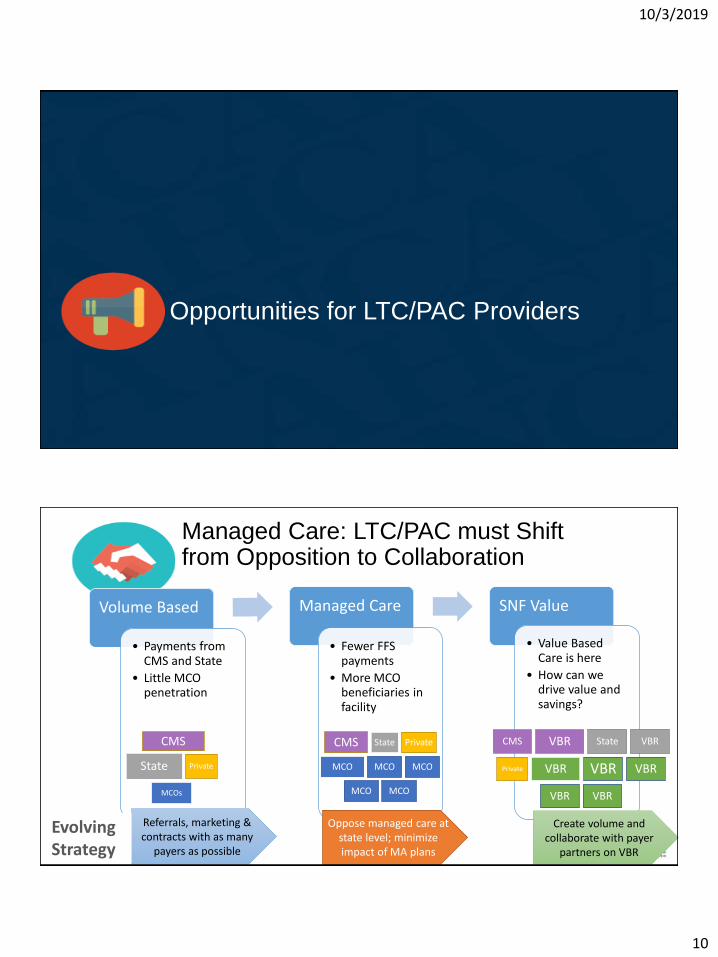
Opportunities for LTC/PAC Providers
Managed Care: LTC/PAC must Shift from Opposition to Collaboration
Volume Based
• Payments from CMS and State
• Little MCO penetration
Managed Care
• Fewer FFS payments
• More MCO beneficiaries in facility
SNF Value
• Value Based Care is here
• How can we drive value and savings?
Referrals, marketing & contracts with as many
payers as possible
Create volume and collaborate with payer
partners on VBR
Oppose managed care at state level; minimize impact of MA plans
EvolvingStrategy
CMS
State Private
MCOs
CMS State Private
MCO MCO MCO
MCO MCO
CMS VBR State VBR
Private VBR VBR VBR
VBR VBR
10/3/2019
11
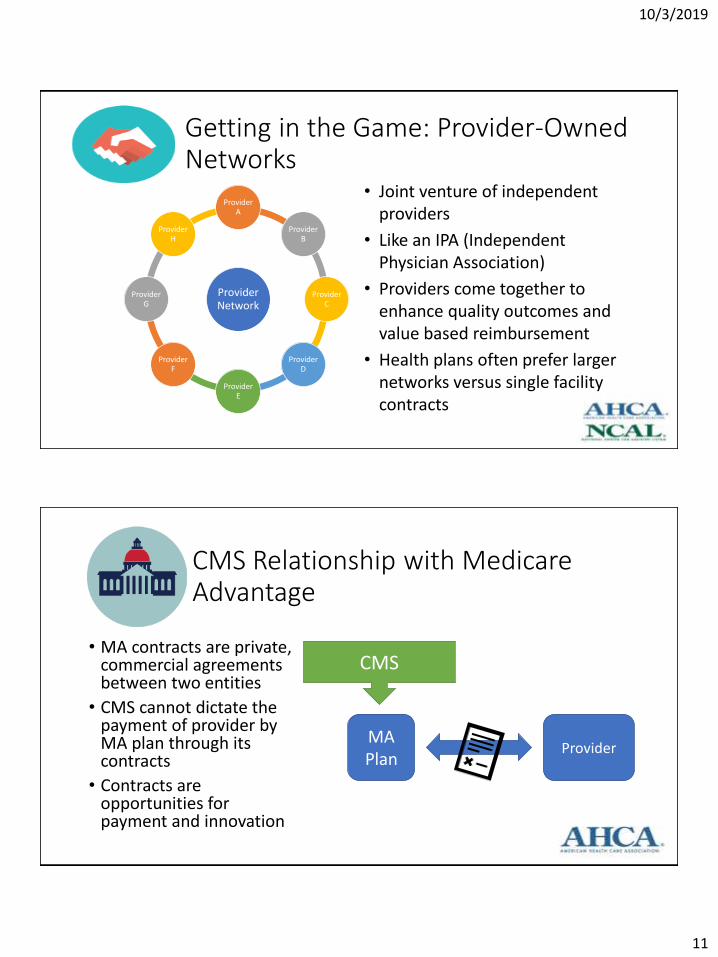
Getting in the Game: Provider-Owned Networks
Provider Network
Provider A
Provider B
Provider C
Provider D
Provider E
Provider F
Provider G
Provider H
• Joint venture of independent providers
• Like an IPA (Independent Physician Association)
• Providers come together to enhance quality outcomes and value based reimbursement
• Health plans often prefer larger networks versus single facility contracts
CMS Relationship with Medicare Advantage
• MA contracts are private, commercial agreements between two entities
• CMS cannot dictate the payment of provider by MA plan through its contracts
• Contracts are opportunities for payment and innovation
MA Plan
Provider
CMS
10/3/2019
12
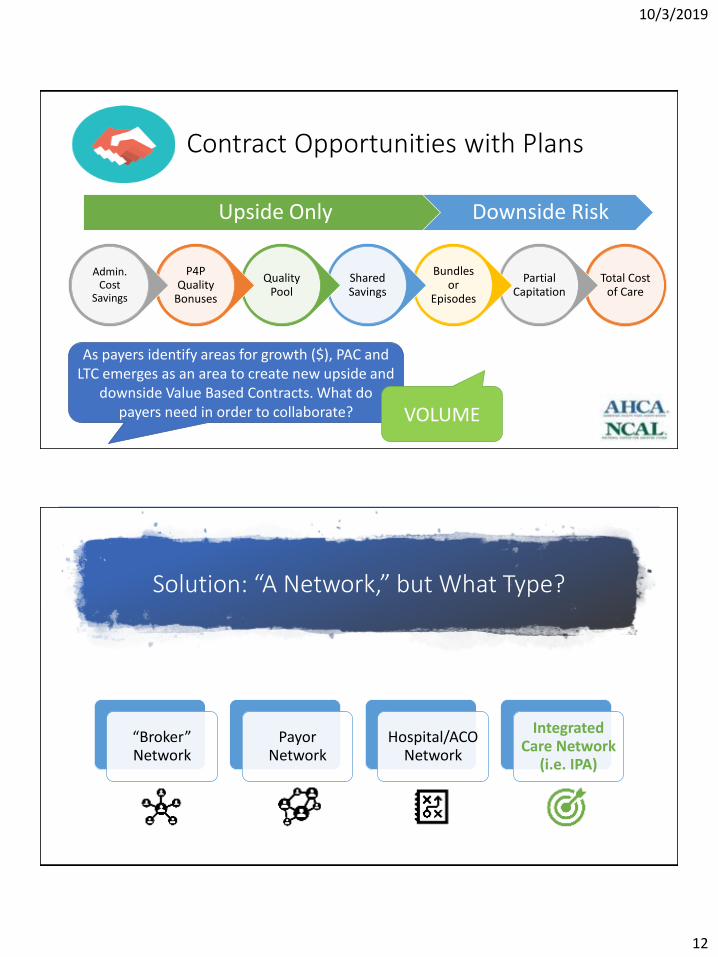
Contract Opportunities with Plans
Total Cost of Care
Partial Capitation
Bundles or
Episodes
Shared Savings
Quality Pool
P4P Quality
Bonuses
Admin. Cost
Savings
Upside Only Downside Risk
As payers identify areas for growth ($), PAC and LTC emerges as an area to create new upside and
downside Value Based Contracts. What do payers need in order to collaborate? VOLUME
Solution: “A Network,” but What Type?
“Broker” Network
Payor Network
Hospital/ACO Network
Integrated Care Network
(i.e. IPA)
10/3/2019
13
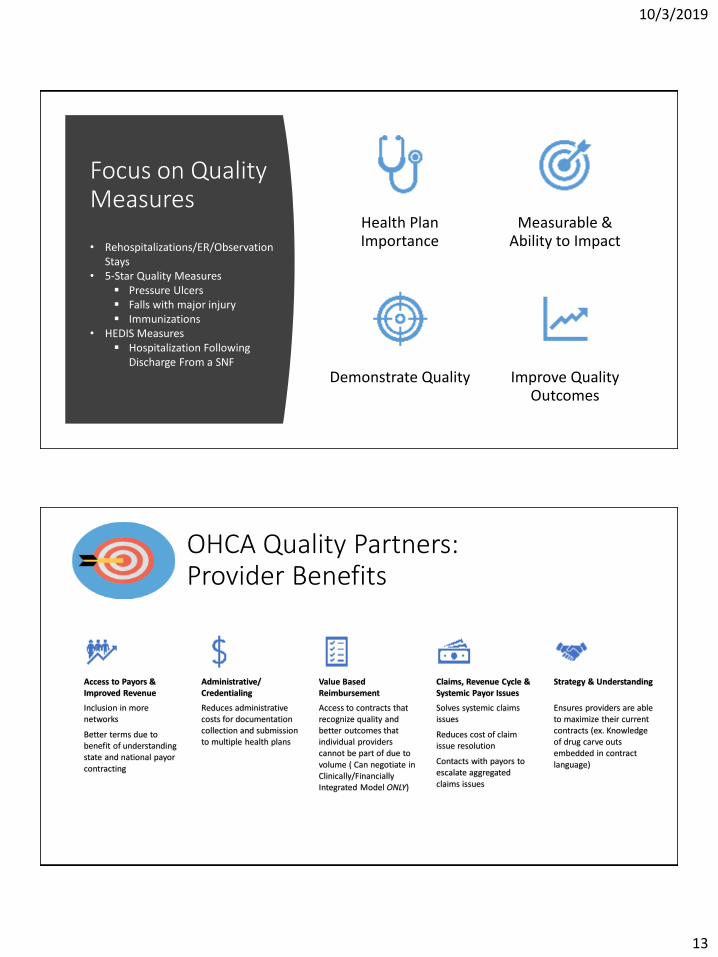
Focus on Quality Measures
Health Plan Importance
Measurable & Ability to Impact
Demonstrate Quality Improve Quality Outcomes
• Rehospitalizations/ER/Observation Stays
• 5-Star Quality Measures Pressure Ulcers Falls with major injury Immunizations
• HEDIS Measures Hospitalization Following
Discharge From a SNF
OHCA Quality Partners: Provider Benefits
Access to Payors & Improved Revenue
Inclusion in more networks
Better terms due to benefit of understanding state and national payor contracting
Administrative/ Credentialing
Reduces administrative costs for documentation collection and submission to multiple health plans
Value Based Reimbursement
Access to contracts that recognize quality and better outcomes that individual providers cannot be part of due to volume ( Can negotiate in Clinically/Financially Integrated Model ONLY)
Claims, Revenue Cycle & Systemic Payor Issues
Solves systemic claims issues
Reduces cost of claim issue resolution
Contacts with payors to escalate aggregated claims issues
Strategy & Understanding
Ensures providers are able to maximize their current contracts (ex. Knowledge of drug carve outs embedded in contract language)
10/3/2019
14
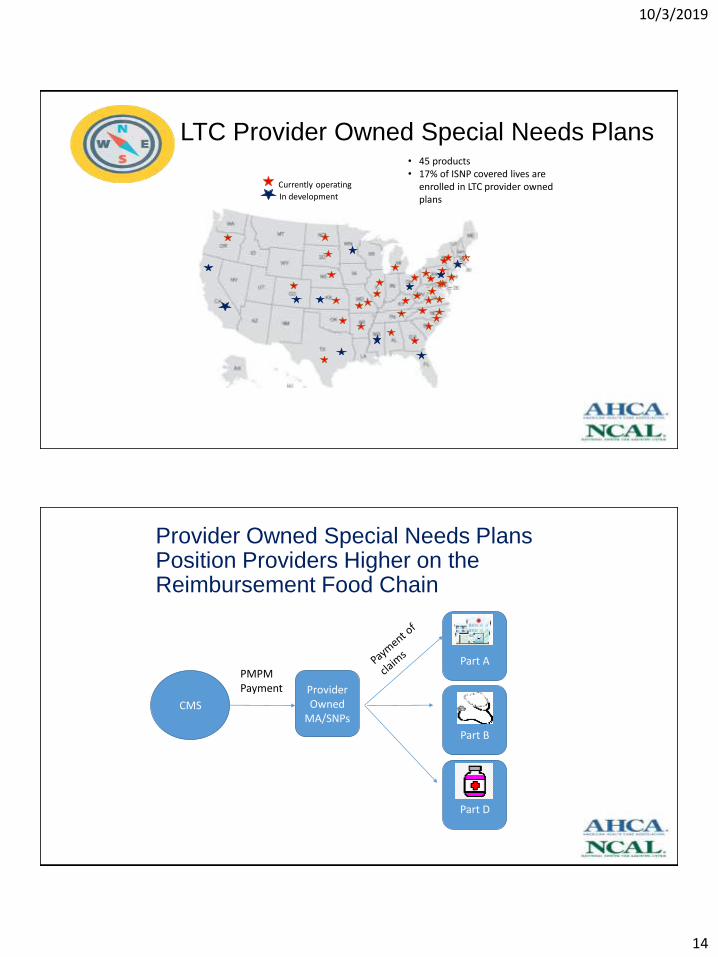
LTC Provider Owned Special Needs Plans
v
Currently operating
In development
• 45 products• 17% of ISNP covered lives are
enrolled in LTC provider owned plans
Provider Owned Special Needs Plans Position Providers Higher on the Reimbursement Food Chain
CMS
Provider Owned
MA/SNPs
Part A
Part B
Part D
PMPM Payment
10/3/2019
15
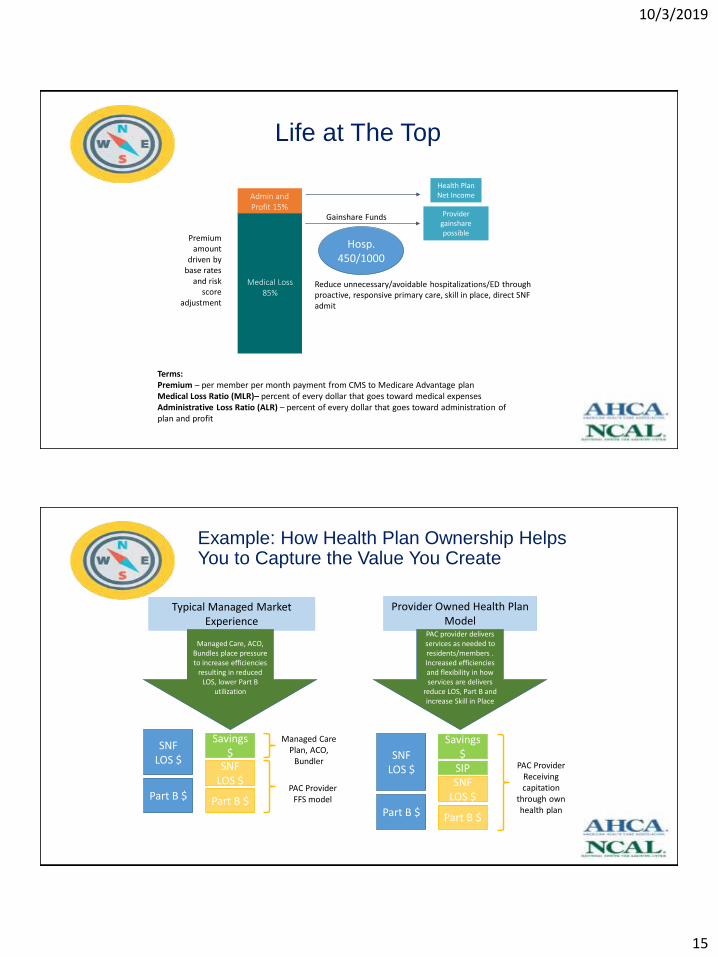
Life at The Top
Admin and Profit 15%
Medical Loss 85%
Gainshare Funds Provider gainshare possible
Reduce unnecessary/avoidable hospitalizations/ED through proactive, responsive primary care, skill in place, direct SNF admit
Premium amount
driven by base rates
and risk score
adjustment
Health Plan Net Income
Terms:Premium – per member per month payment from CMS to Medicare Advantage planMedical Loss Ratio (MLR)– percent of every dollar that goes toward medical expensesAdministrative Loss Ratio (ALR) – percent of every dollar that goes toward administration of plan and profit
Hosp. 450/1000
Typical Managed Market Experience
Provider Owned Health Plan Model
Managed Care, ACO, Bundles place pressure to increase efficiencies
resulting in reduced LOS, lower Part B
utilization
SNF LOS $
Part B $
SNF LOS $
Part B $
Savings $
Managed Care Plan, ACO,
Bundler
PAC Provider FFS model
PAC provider delivers services as needed to residents/members . Increased efficiencies and flexibility in how services are delivers
reduce LOS, Part B and increase Skill in Place
SNF LOS $
Part B $
SNF LOS $
Part B $
Savings $
PAC Provider Receiving capitation
through own health plan
SIP
Example: How Health Plan Ownership Helps You to Capture the Value You Create

10/3/2019
16
7 Steps to Successful Health Plan Development
Education, education, education
Emerging Models

10/3/2019
17
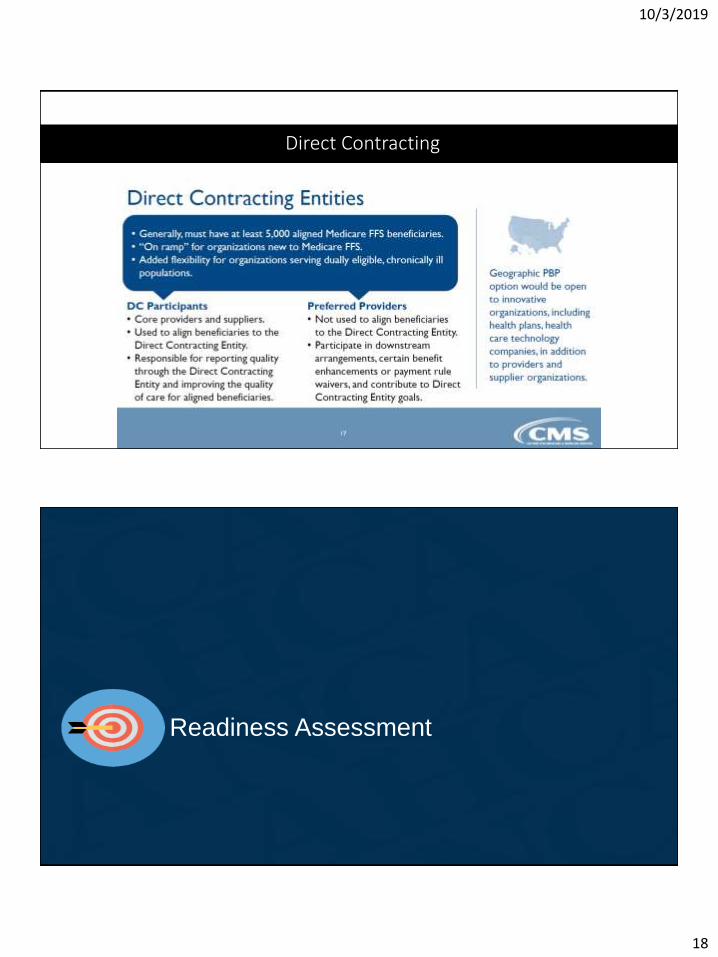
Direct Contracting
Direct Contracting
10/3/2019
18
Direct Contracting
Readiness Assessment
10/3/2019
19
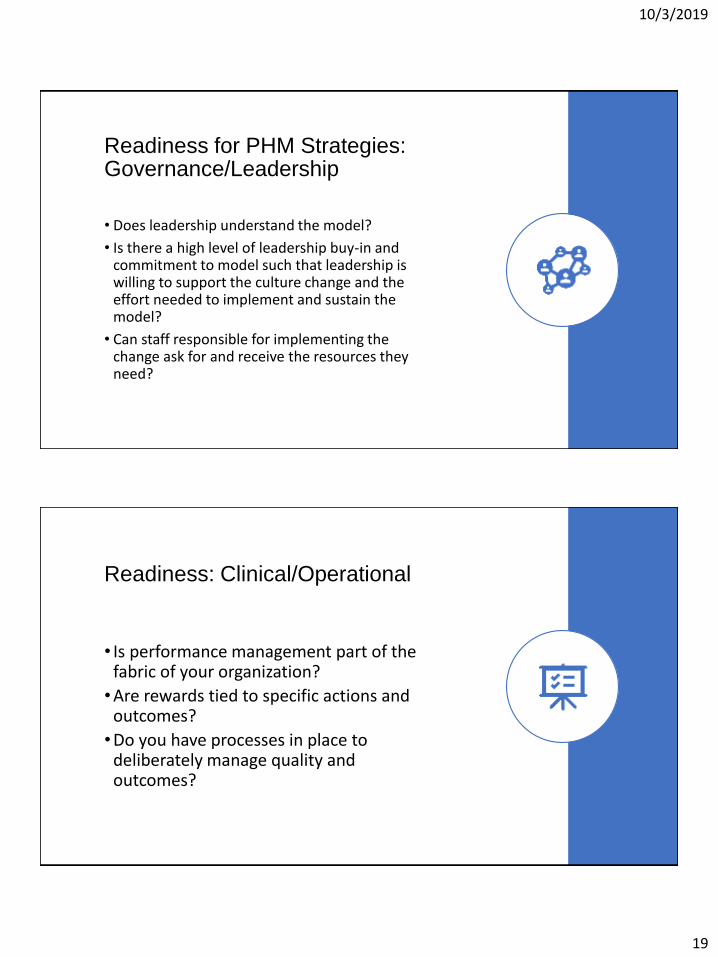
Readiness for PHM Strategies: Governance/Leadership
• Does leadership understand the model?
• Is there a high level of leadership buy-in and commitment to model such that leadership is willing to support the culture change and the effort needed to implement and sustain the model?
• Can staff responsible for implementing the change ask for and receive the resources they need?
Readiness: Clinical/Operational
• Is performance management part of the fabric of your organization?
•Are rewards tied to specific actions and outcomes?
•Do you have processes in place to deliberately manage quality and outcomes?

10/3/2019
20
Technology/Data Infrastructure
• Do you have an EHR?
• Do you have a certified EHR, EMR capable of 2-way exchange of clinical information?
• Are you able to manage a longitudinal patient record?
• Do you have the ability to manage claims data from CMS?
External environment
• Do you have established, and strong referral partnerships i.e. are you a preferred provider to hospitals, bundlers or ACOs?
• Do you have engaged hospital, health systems and physician groups?
• Do you have a positive market reputation?
10/3/2019
21
Key TakeawaysSuccessful organizations need to be able to:
• Be flexible, pivot when there are opportunities and challenges
• Broader vision across provider types and payment systems
• Ability to reorganize, manage change and execute
AHCA/NCAL Resources
10/3/2019
22
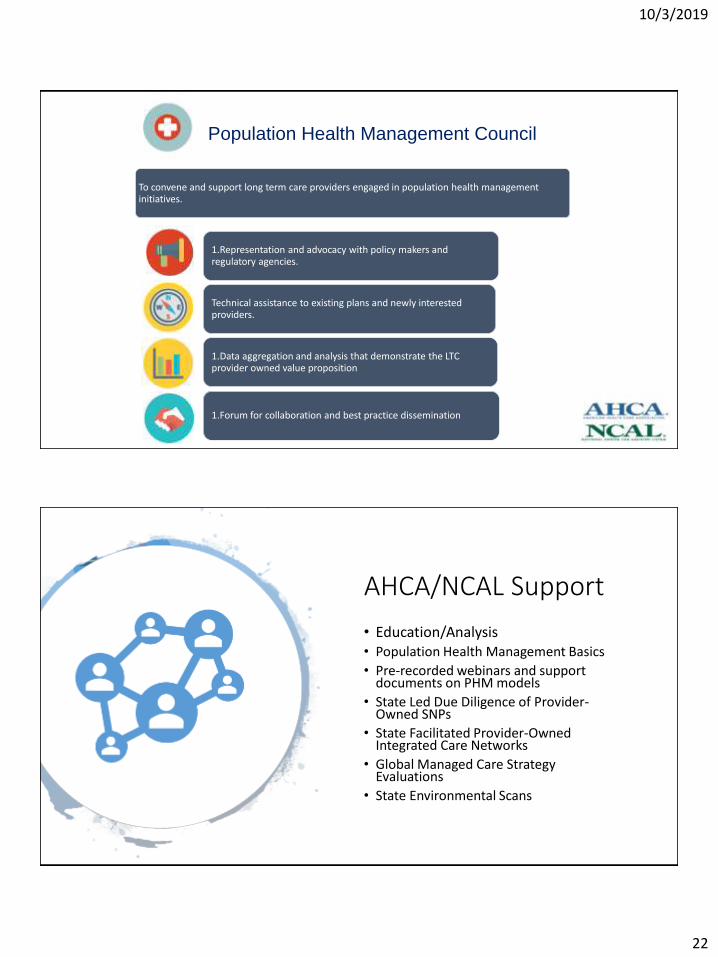
Population Health Management Council
To convene and support long term care providers engaged in population health management initiatives.
1.Representation and advocacy with policy makers and regulatory agencies.
Technical assistance to existing plans and newly interested providers.
1.Data aggregation and analysis that demonstrate the LTC provider owned value proposition
1.Forum for collaboration and best practice dissemination
AHCA/NCAL Support
• Education/Analysis• Population Health Management Basics
• Pre-recorded webinars and support documents on PHM models
• State Led Due Diligence of Provider-Owned SNPs
• State Facilitated Provider-Owned Integrated Care Networks
• Global Managed Care Strategy Evaluations
• State Environmental Scans
10/3/2019
23
Save the Date