Embed Size (px)
Citation preview

Provider Pay Practices,Provider Pay Practices,Physician CompensationPhysician Compensation
Arrangements and What Plans AreArrangements and What Plans AreDoing Today to CompensateDoing Today to Compensate
Providers for Superior PerformanceProviders for Superior Performance
June 2003June 2003
WEBCASTWEBCAST
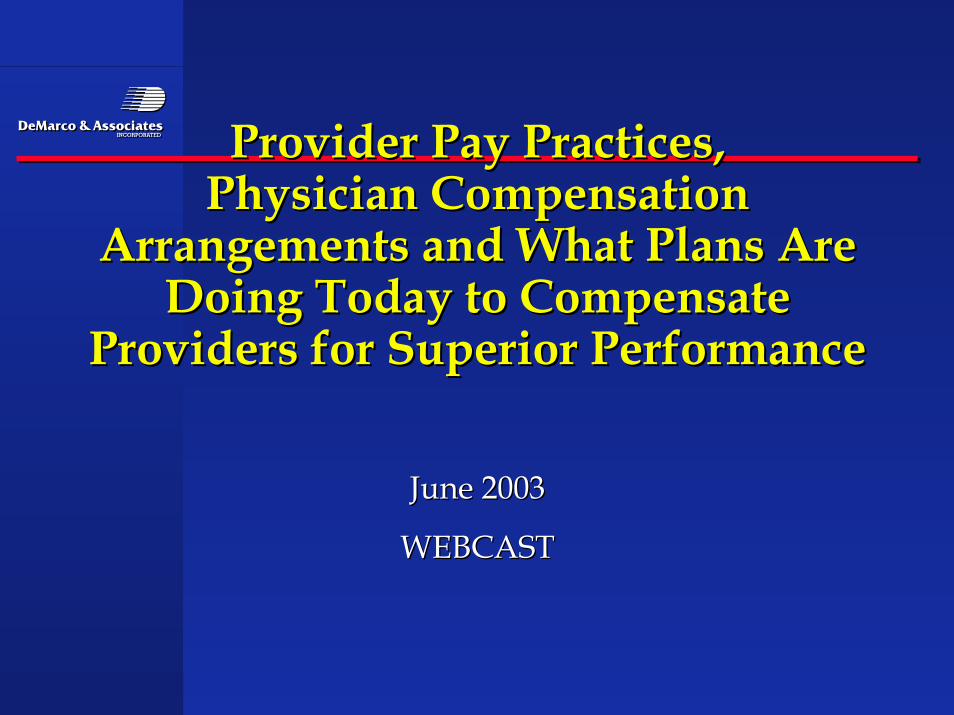
Progression of ReimbursementProgression of Reimbursement
Chickens Fee Schedule RBRVS APG FutureDRG & ETG
ProcedureCodes
19401940 19501950 19901990 19961996 20052005
ConversionFactor
ConversionConversionFactorFactor
BundledGlobal
BundledBundledGlobalGlobal
PackageCase RatePackagePackage
Case RateCase RateFeesFeesFees
EvidenceEvidenceConsults:Consults:1.1. How the patient got to youHow the patient got to you2.2. What you did, why you did it, what did you anticipate would happenWhat you did, why you did it, what did you anticipate would happen3.3. Payment linked to diagnosis and episodes of care with severityPayment linked to diagnosis and episodes of care with severityadjustmentsadjustments
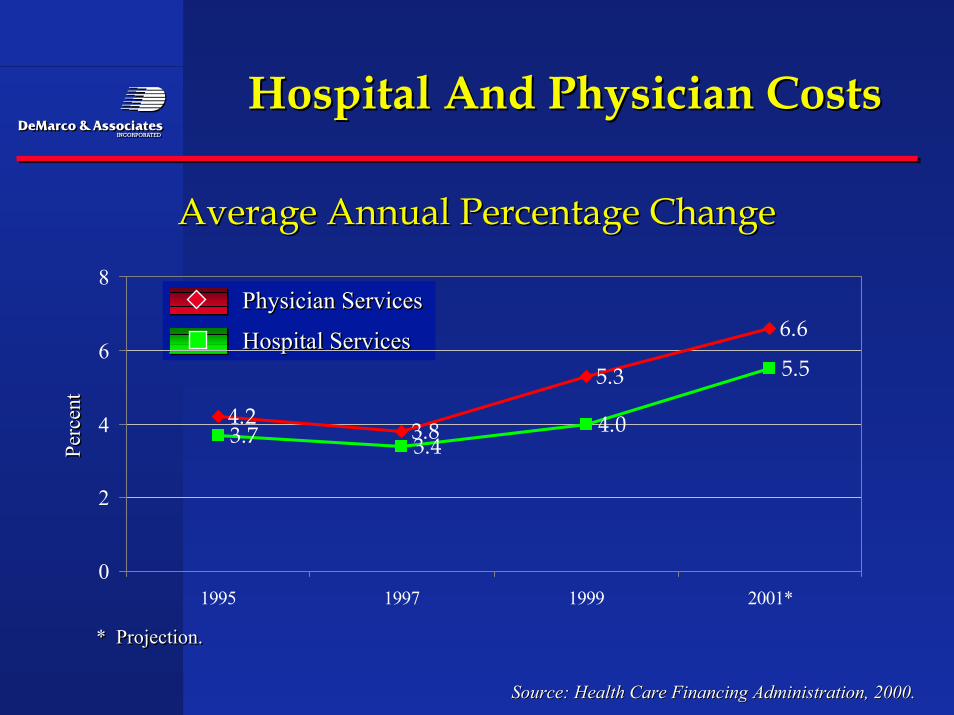
Hospital And Physician CostsHospital And Physician Costs
Source: Health Care Financing Administration, 2000.Source: Health Care Financing Administration, 2000.
Average Annual Percentage ChangeAverage Annual Percentage Change
Physician Services
Hospital Services
Physician ServicesPhysician Services
Hospital ServicesHospital Services
4.23.8
5.3
6.6
3.7 3.44.0
5.5
0
2
4
6
8
1995 1997 1999 2001*
* Projection.* Projection.
Perc
ent
Perc
ent
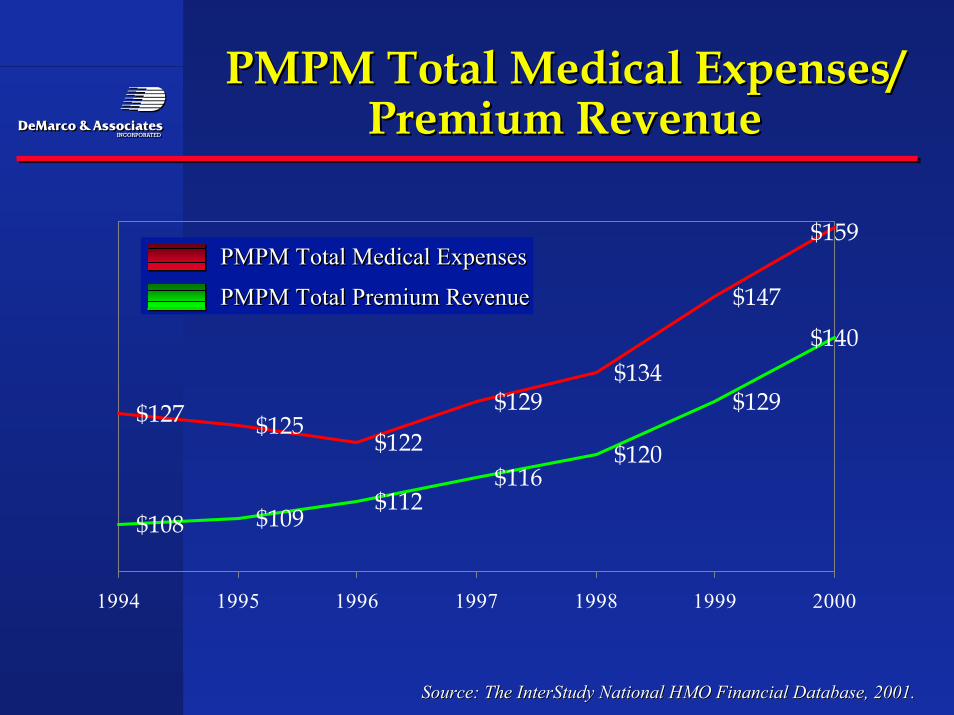
PMPM Total Medical Expenses/PMPM Total Medical Expenses/Premium RevenuePremium Revenue
Source: The InterStudy National HMO Financial Database, 2001.Source: The InterStudy National HMO Financial Database, 2001.
$127 $125$122
$129$134
$147
$159
$108 $109$112
$116$120
$129
$140
1994 1995 1996 1997 1998 1999 2000
PMPM Total Medical Expenses
PMPM Total Premium Revenue
PMPM Total Medical ExpensesPMPM Total Medical Expenses
PMPM Total Premium RevenuePMPM Total Premium Revenue
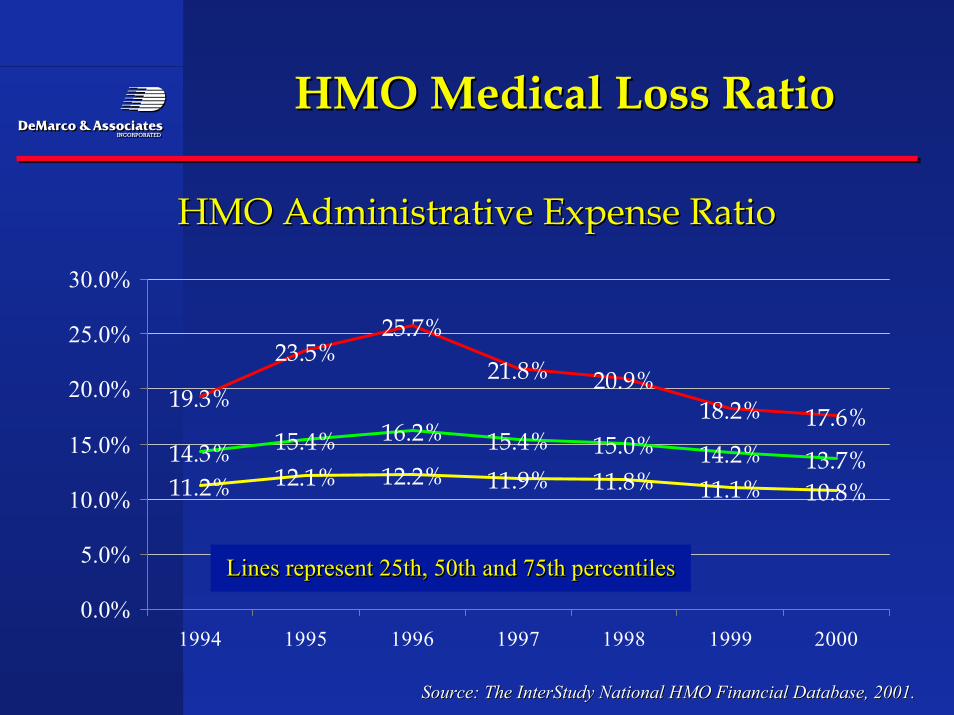
HMO Medical Loss RatioHMO Medical Loss Ratio
HMO Administrative Expense RatioHMO Administrative Expense Ratio
Source: The InterStudy National HMO Financial Database, 2001.Source: The InterStudy National HMO Financial Database, 2001.
19.3%
23.5%25.7%
21.8% 20.9%18.2% 17.6%
14.3% 15.4% 16.2% 15.4% 15.0% 14.2% 13.7%11.2% 12.1% 12.2% 11.9% 11.8% 11.1% 10.8%
0.0%
5.0%
10.0%
15.0%
20.0%
25.0%
30.0%
1994 1995 1996 1997 1998 1999 2000
Lines represent 25th, 50th and 75th percentilesLines represent 25th, 50th and 75th percentilesLines represent 25th, 50th and 75th percentiles
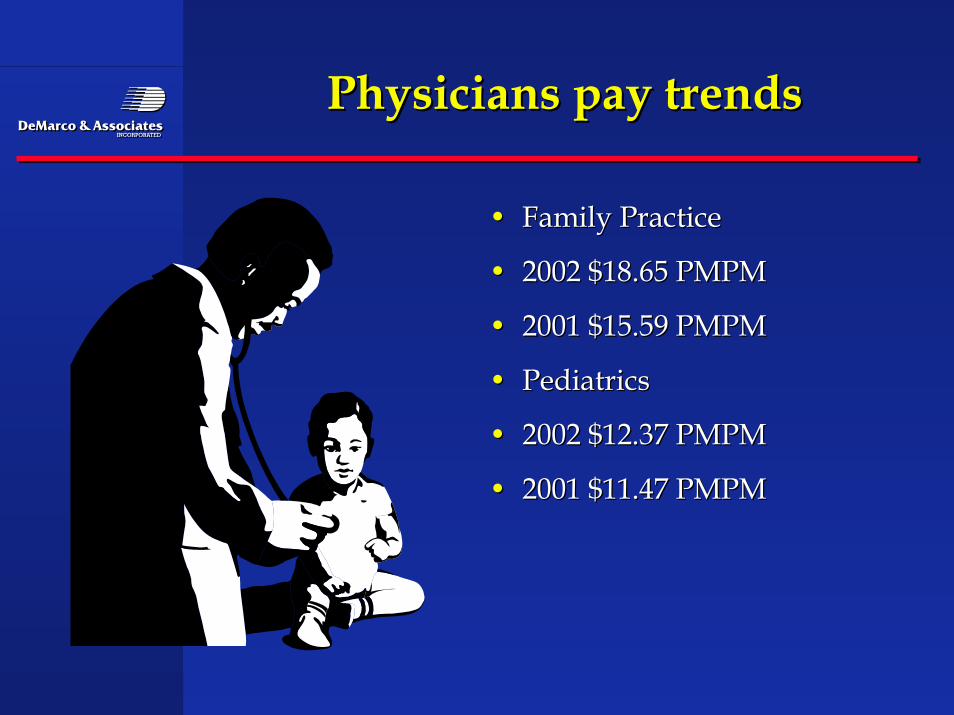
Physicians pay trendsPhysicians pay trends
•• Family PracticeFamily Practice
•• 2002 $18.65 PMPM2002 $18.65 PMPM
•• 2001 $15.59 PMPM2001 $15.59 PMPM
•• PediatricsPediatrics
•• 2002 $12.37 PMPM2002 $12.37 PMPM
•• 2001 $11.47 PMPM2001 $11.47 PMPM
Physicians pay trendsPhysicians pay trends
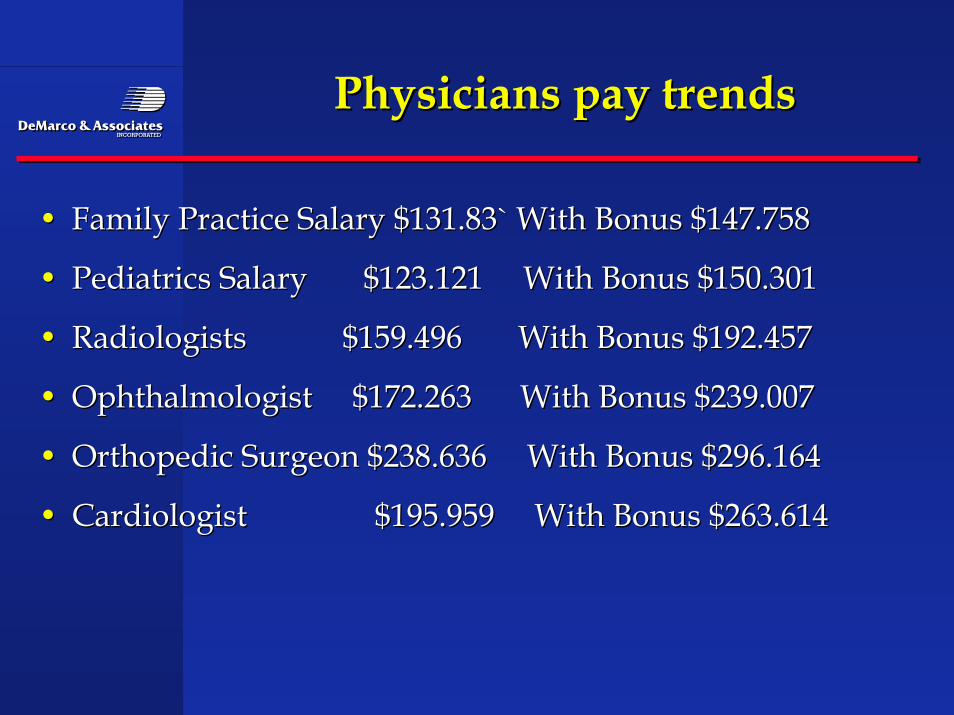
•• Family Practice Salary $131.83` With Bonus $147.758Family Practice Salary $131.83` With Bonus $147.758
•• Pediatrics Salary $123.121 With Bonus $150.301Pediatrics Salary $123.121 With Bonus $150.301
•• Radiologists $159.496 With Bonus $192.457Radiologists $159.496 With Bonus $192.457
•• Ophthalmologist $172.263 With Bonus $239.007Ophthalmologist $172.263 With Bonus $239.007
•• Orthopedic Surgeon $238.636 With Bonus $296.164Orthopedic Surgeon $238.636 With Bonus $296.164
•• Cardiologist $195.959 With Bonus $263.614Cardiologist $195.959 With Bonus $263.614
Cost And Quality:Cost And Quality:A Complex RelationshipA Complex Relationship
Source: IOM March 2003.Source: IOM March 2003.
The U.S. Government recently reported that America spent a recordThe U.S. Government recently reported that America spent a record$1.42 trillion on healthcare in 2001, and it may seem logical that$1.42 trillion on healthcare in 2001, and it may seem logical thathealthcare quality would increase in lock-step. Of course, thehealthcare quality would increase in lock-step. Of course, therelationship between cost and quality is far more complicated that that.relationship between cost and quality is far more complicated that that.Despite all of our spending, the Institute of Medicine reports thatDespite all of our spending, the Institute of Medicine reports thatmedical errors continue to be pervasive, costing the U.S. about $37.6medical errors continue to be pervasive, costing the U.S. about $37.6billion each year. In addition, nursing shortages and work stoppagesbillion each year. In addition, nursing shortages and work stoppagesrelated to high malpractice insurance and other physician grievancesrelated to high malpractice insurance and other physician grievancescontinue to vex the healthcare system. Rising cost have also forcedcontinue to vex the healthcare system. Rising cost have also forcedcompanies to provide fewer health insurance choices for their workers.companies to provide fewer health insurance choices for their workers.
Why More SpendingWhy More SpendingDoesn’t Always Mean Higher QualityDoesn’t Always Mean Higher Quality
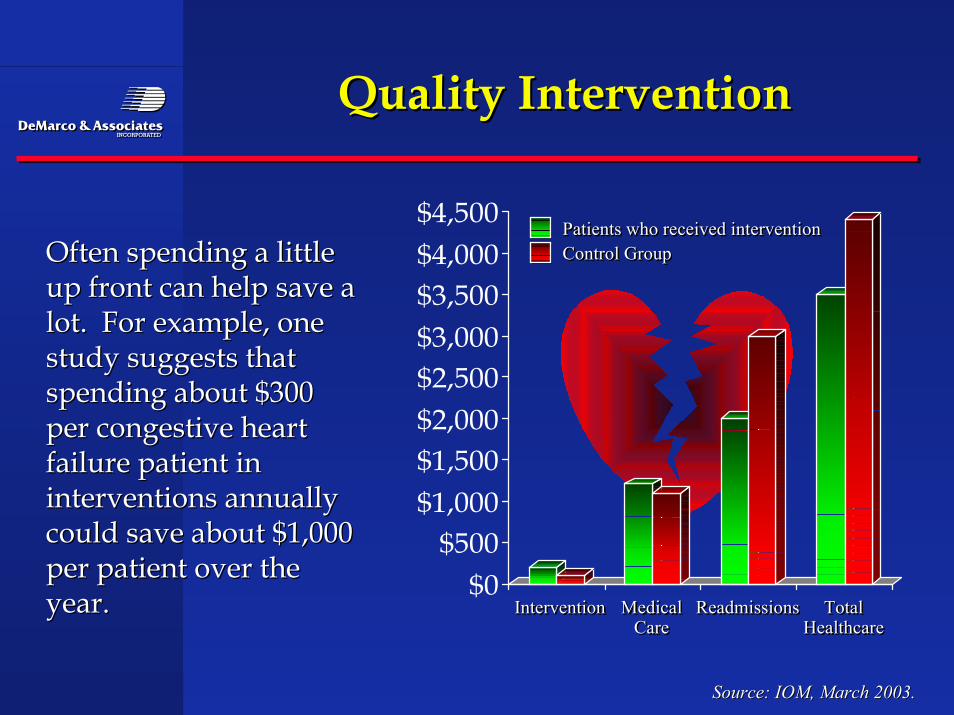
Quality InterventionQuality Intervention
Source: IOM, March 2003.Source: IOM, March 2003.
Often spending a littleOften spending a littleup front can help save aup front can help save alot. For example, onelot. For example, onestudy suggests thatstudy suggests thatspending about $300spending about $300per congestive heartper congestive heartfailure patient infailure patient ininterventions annuallyinterventions annuallycould save about $1,000could save about $1,000per patient over theper patient over theyear.year. $0
$500$1,000$1,500$2,000$2,500$3,000$3,500$4,000$4,500
Intervention Medical Readmissions TotalCare Healthcare
InterventionIntervention MedicalMedical ReadmissionsReadmissions TotalTotalCareCare HealthcareHealthcare
Patients who received interventionControl GroupPatients who received interventionPatients who received interventionControl GroupControl Group
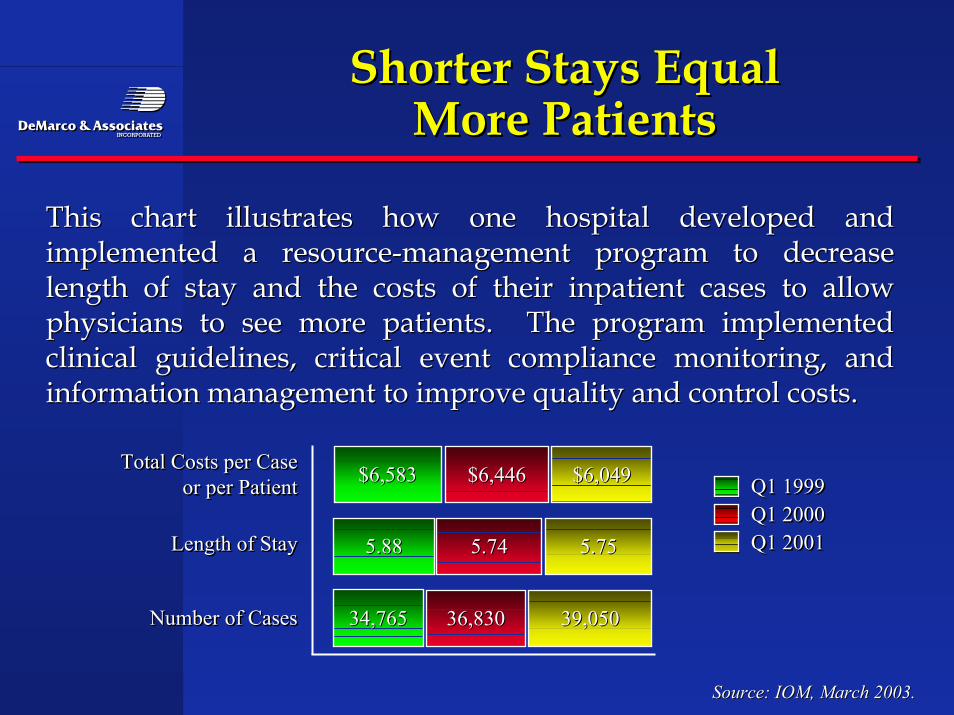
Shorter Stays EqualShorter Stays EqualMore PatientsMore Patients
Source: IOM, March 2003.Source: IOM, March 2003.
This chart illustrates how one hospital developed andThis chart illustrates how one hospital developed andimplemented a resource-management program to decreaseimplemented a resource-management program to decreaselength of stay and the costs of their inpatient cases to allowlength of stay and the costs of their inpatient cases to allowphysicians to see more patients. The program implementedphysicians to see more patients. The program implementedclinical guidelines, critical event compliance monitoring, andclinical guidelines, critical event compliance monitoring, andinformation management to improve quality and control costs.information management to improve quality and control costs.
$6,583$6,583Total Costs per Caseor per Patient
Length of Stay
Number of Cases
Total Costs per CaseTotal Costs per Caseor per Patientor per Patient
Length of StayLength of Stay
Number of CasesNumber of Cases
Q1 1999Q1 2000Q1 2001
Q1 1999Q1 1999Q1 2000Q1 2000Q1 2001Q1 20015.885.88
34,76534,765
$6,446$6,446
5.745.74
36,83036,830
$6,049$6,049
5.755.75
39,05039,050
8.1
11.111.8
0
2
4
6
8
10
12
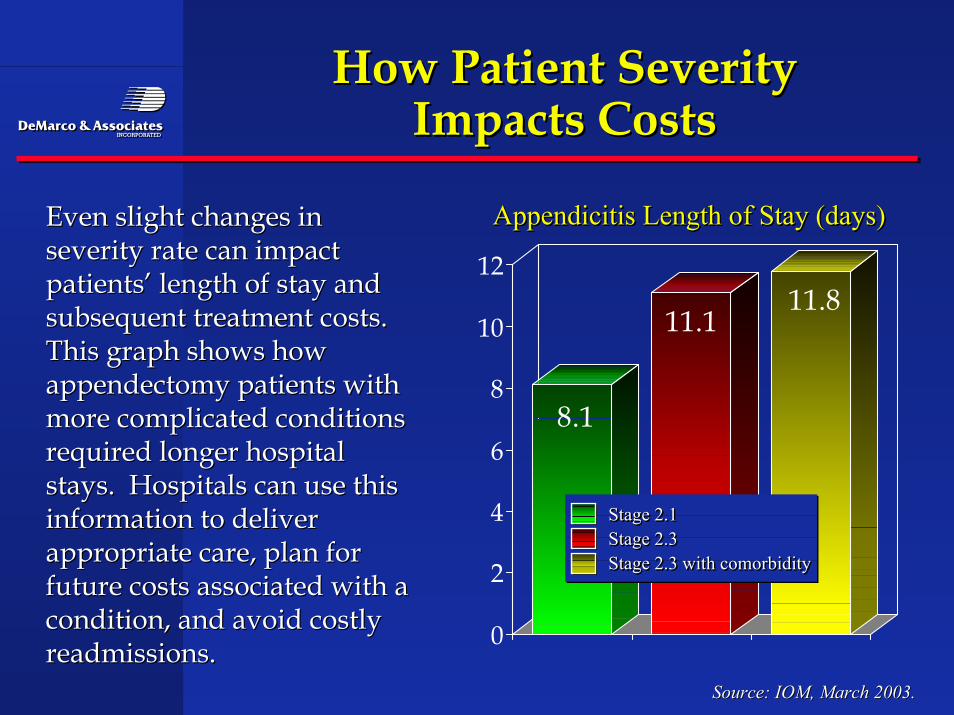
How Patient SeverityHow Patient SeverityImpacts CostsImpacts Costs
Source: IOM, March 2003.Source: IOM, March 2003.
Even slight changes inEven slight changes inseverity rate can impactseverity rate can impactpatients’ length of stay andpatients’ length of stay andsubsequent treatment costs.subsequent treatment costs.This graph shows howThis graph shows howappendectomy patients withappendectomy patients withmore complicated conditionsmore complicated conditionsrequired longer hospitalrequired longer hospitalstays. Hospitals can use thisstays. Hospitals can use thisinformation to deliverinformation to deliverappropriate care, plan forappropriate care, plan forfuture costs associated with afuture costs associated with acondition, and avoid costlycondition, and avoid costlyreadmissions.readmissions.
Appendicitis Length of Stay (days)Appendicitis Length of Stay (days)Appendicitis Length of Stay (days)
Stage 2.1Stage 2.3Stage 2.3 with comorbidity
Stage 2.1Stage 2.1Stage 2.3Stage 2.3Stage 2.3 with comorbidityStage 2.3 with comorbidity
59%54%
45%
56%
27%
10%
20%26%
15%
38%
0%10%20%30%40%50%60%70%80%90%
100%
Australia Canada New U.K. U.S.Zealand
AustraliaAustralia CanadaCanada NewNew U.K.U.K. U.S.U.S.ZealandZealand
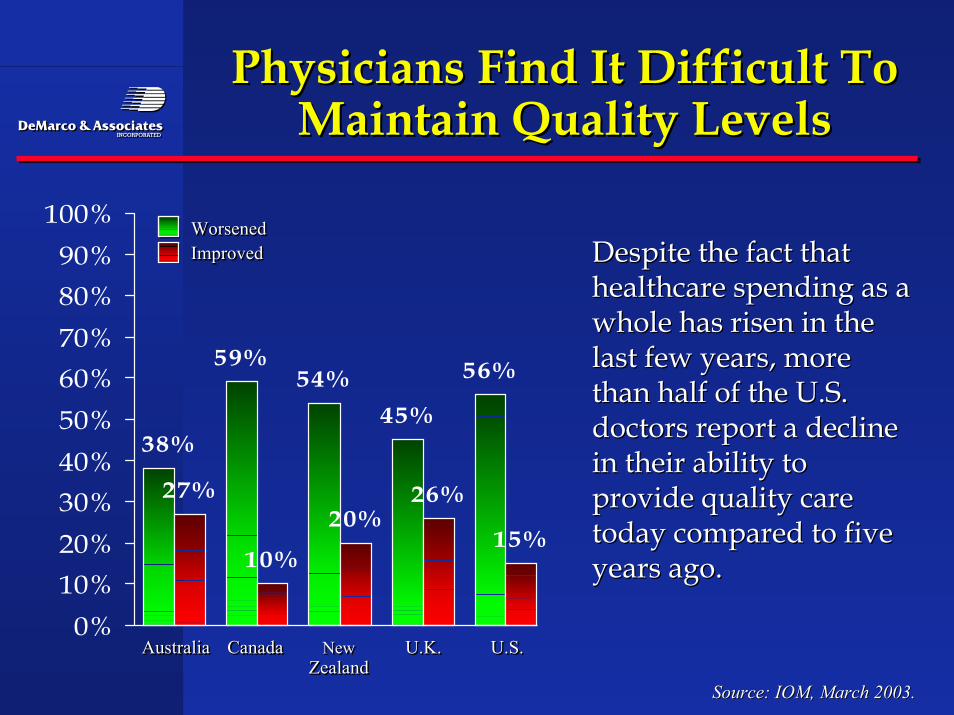
WorsenedImprovedWorsenedWorsenedImprovedImproved
Physicians Find It Difficult ToPhysicians Find It Difficult ToMaintain Quality LevelsMaintain Quality Levels
Source: IOM, March 2003.Source: IOM, March 2003.
Despite the fact thatDespite the fact thathealthcare spending as ahealthcare spending as awhole has risen in thewhole has risen in thelast few years, morelast few years, morethan half of the U.S.than half of the U.S.doctors report a declinedoctors report a declinein their ability toin their ability toprovide quality careprovide quality caretoday compared to fivetoday compared to fiveyears ago.years ago.
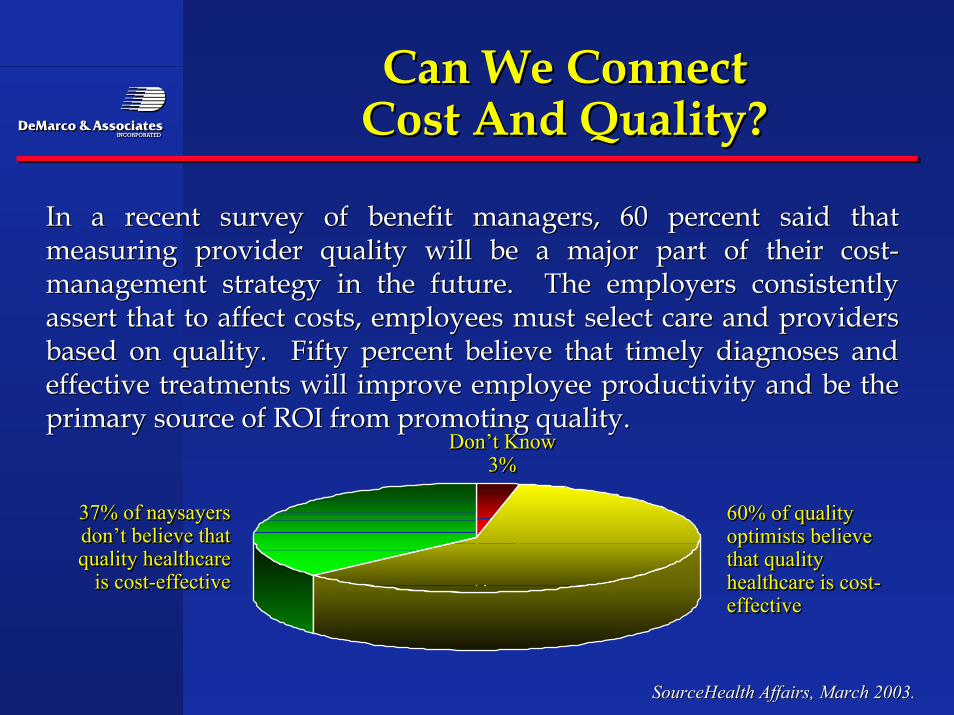
Can We ConnectCan We ConnectCost And Quality?Cost And Quality?
SourceHealth Affairs, March 2003.SourceHealth Affairs, March 2003.
In a recent survey of benefit managers, 60 percent said thatIn a recent survey of benefit managers, 60 percent said thatmeasuring provider quality will be a major part of their cost-measuring provider quality will be a major part of their cost-management strategy in the future. The employers consistentlymanagement strategy in the future. The employers consistentlyassert that to affect costs, employees must select care and providersassert that to affect costs, employees must select care and providersbased on quality. Fifty percent believe that timely diagnoses andbased on quality. Fifty percent believe that timely diagnoses andeffective treatments will improve employee productivity and be theeffective treatments will improve employee productivity and be theprimary source of ROI from promoting quality.primary source of ROI from promoting quality.
Don’t Know3%
Don’t KnowDon’t Know3%3%
60% of qualityoptimists believethat qualityhealthcare is cost-effective
60% of quality60% of qualityoptimists believeoptimists believethat qualitythat qualityhealthcare is cost-healthcare is cost-effectiveeffective
37% of naysayersdon’t believe thatquality healthcare
is cost-effective
37% of naysayers37% of naysayersdon’t believe thatdon’t believe thatquality healthcarequality healthcare
is cost-effectiveis cost-effective
Health Plans ManageHealth Plans ManageDisease And CostsDisease And Costs
Source: ,PHDC March 2003.Source: ,PHDC March 2003.
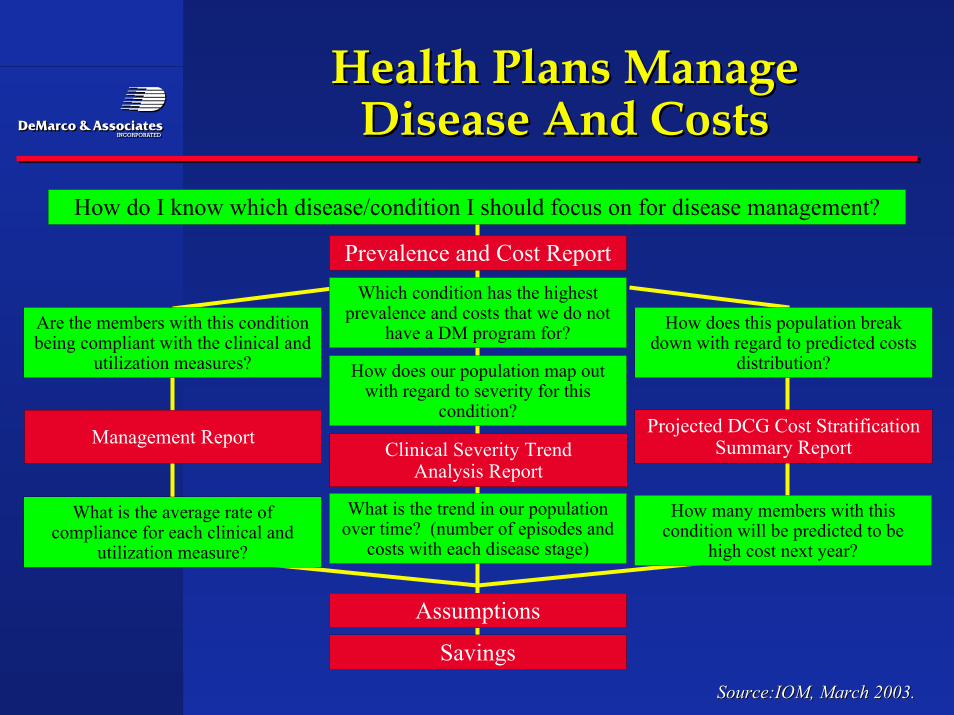
The following flow chart helps map out the steps a healthThe following flow chart helps map out the steps a healthplan can take to develop disease management programsplan can take to develop disease management programsthat reduce healthcare costs. The first step is to identify thethat reduce healthcare costs. The first step is to identify thecondition with the highest prevalence and costs. Thencondition with the highest prevalence and costs. Thenadditional reports can be produced that identify complianceadditional reports can be produced that identify complianceand utilization rates, trends in patient severity andand utilization rates, trends in patient severity andpredicted costs.predicted costs.
Health Plans ManageHealth Plans ManageDisease And CostsDisease And Costs
Source:IOM, March 2003.Source:IOM, March 2003.
How do I know which disease/condition I should focus on for disease management?
Prevalence and Cost ReportWhich condition has the highest
prevalence and costs that we do nothave a DM program for?Are the members with this condition
being compliant with the clinical andutilization measures?
How does this population breakdown with regard to predicted costs
distribution?How does our population map outwith regard to severity for this
condition?Projected DCG Cost Stratification
Summary ReportClinical Severity TrendAnalysis Report
What is the trend in our populationover time? (number of episodes and
costs with each disease stage)
How many members with thiscondition will be predicted to be
high cost next year?
What is the average rate ofcompliance for each clinical and
utilization measure?
Assumptions
Savings
Management Report
IdentifyingIdentifyingProfitable Service LinesProfitable Service Lines
Source: IOM, March 2003.Source: IOM, March 2003.
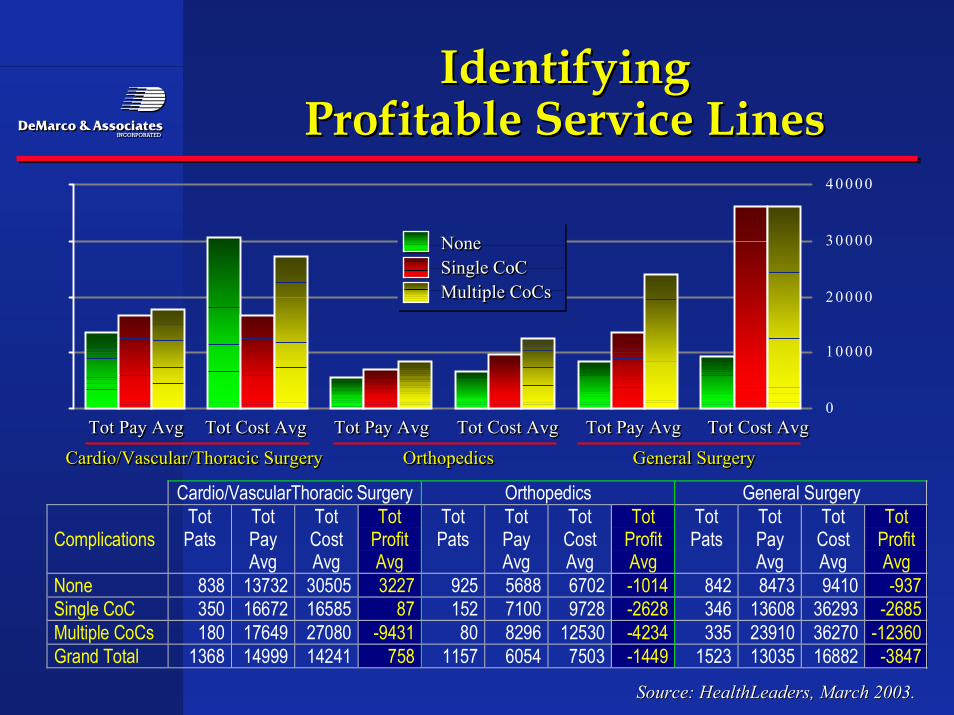
Increased complications in care means increased cost forIncreased complications in care means increased cost forhealthcare providers. In this example, a hospital was able tohealthcare providers. In this example, a hospital was able toidentify that general surgery saw the largest number ofidentify that general surgery saw the largest number ofpatients and incurred the highest profit/loss overall and atpatients and incurred the highest profit/loss overall and ateach severity stage. Linking patient severity to cost helpseach severity stage. Linking patient severity to cost helpsidentify profitable product lines.identify profitable product lines.
0
1 0 0 0 0
2 0 0 0 0
3 0 0 0 0
4 0 0 0 0
IdentifyingIdentifyingProfitable Service LinesProfitable Service Lines
Source: HealthLeaders, March 2003.Source: HealthLeaders, March 2003.
Cardio/VascularThoracic Surgery Orthopedics General Surgery
ComplicationsTotPats
TotPayAvg
TotCostAvg
TotProfitAvg
TotPats
TotPayAvg
TotCostAvg
TotProfitAvg
TotPats
TotPayAvg
TotCostAvg
TotProfitAvg
None 838 13732 30505 3227 925 5688 6702 -1014 842 8473 9410 -937Single CoC 350 16672 16585 87 152 7100 9728 -2628 346 13608 36293 -2685Multiple CoCs 180 17649 27080 -9431 80 8296 12530 -4234 335 23910 36270 -12360Grand Total 1368 14999 14241 758 1157 6054 7503 -1449 1523 13035 16882 -3847
Tot Pay Avg Tot Cost Avg Tot Pay Avg Tot Cost Avg Tot Pay Avg Tot Cost AvgTot Pay AvgTot Pay Avg Tot Cost AvgTot Cost Avg Tot Pay AvgTot Pay Avg Tot Cost AvgTot Cost Avg Tot Pay AvgTot Pay Avg Tot Cost AvgTot Cost Avg
NoneSingle CoCMultiple CoCs
NoneNoneSingle CoCSingle CoCMultiple CoCsMultiple CoCs
Cardio/Vascular/Thoracic Surgery Orthopedics General SurgeryCardio/Vascular/Thoracic SurgeryCardio/Vascular/Thoracic Surgery OrthopedicsOrthopedics General SurgeryGeneral Surgery
Private InsurancePrivate InsuranceAbsorbing More CostAbsorbing More Cost
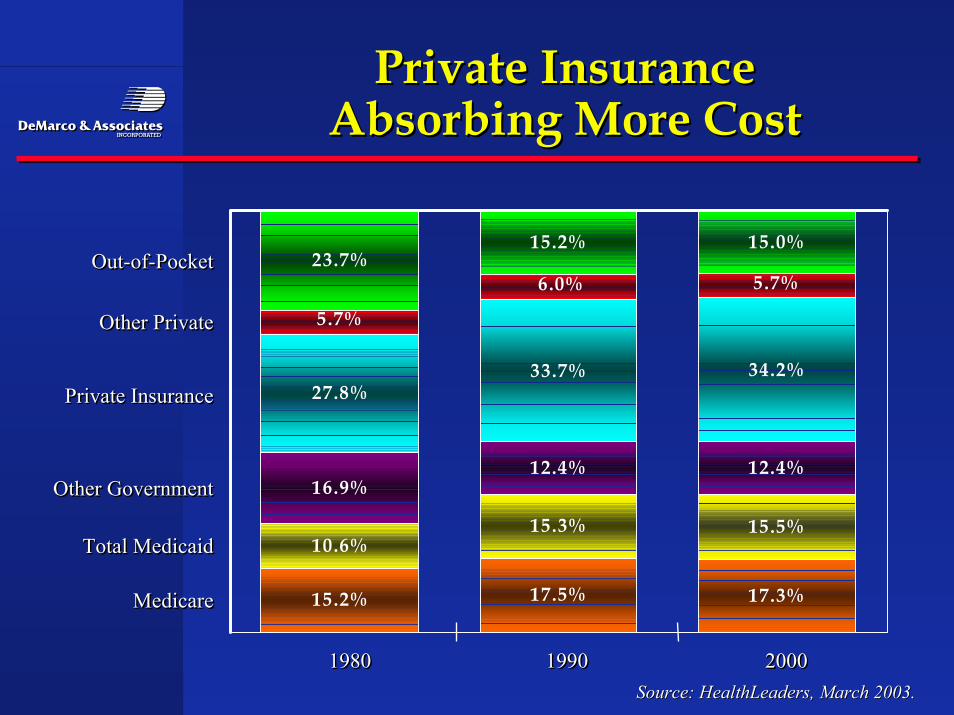
23.7%15.2% 15.0%
27.8%33.7% 34.2%
16.9%12.4% 12.4%
10.6%15.3% 15.5%
15.2% 17.5% 17.3%
5.7%6.0%
5.7%
1980 1990 200019801980 19901990 20002000
Out-of-Pocket
Other Private
Private Insurance
Other Government
Total Medicaid
Medicare
Out-of-PocketOut-of-Pocket
Other PrivateOther Private
Private InsurancePrivate Insurance
Other GovernmentOther Government
Total MedicaidTotal Medicaid
MedicareMedicare
Source: HealthLeaders, March 2003.Source: HealthLeaders, March 2003.
EmployersEmployers
•• Employers are willing to take the heat from change such asEmployers are willing to take the heat from change such asGeneral Electric being threatened by employees with aGeneral Electric being threatened by employees with awork stoppage unless copays return to normal or countywork stoppage unless copays return to normal or countygovernments who are saying we cannot afford it we aregovernments who are saying we cannot afford it we aredropping the insurance.dropping the insurance.
•• Our state government regulators have discussed with us Our state government regulators have discussed with ustheir concern over pension plans and large employeetheir concern over pension plans and large employeebuying organizations failing due to overutiliztion and orbuying organizations failing due to overutiliztion and orover charges for utilization.over charges for utilization.
•• Some employers are even taking managed care into theirSome employers are even taking managed care into theirown hands using the direct contracting approach.own hands using the direct contracting approach.
Central Florida Health CareCentral Florida Health CareCoalitionCoalition
•• Encouraging the use of Platinum providers as deemed byEncouraging the use of Platinum providers as deemed bythe coalition.the coalition.
•• Created because previous coalition activities did notCreated because previous coalition activities did notbenefit everyone and the local community did not seebenefit everyone and the local community did not seeoverall improvement .overall improvement .
•• Aligning incentives for all makes sense for big and smallAligning incentives for all makes sense for big and smallemployers.employers.
•• Hospitals and physicians are not waiting unit theHospitals and physicians are not waiting unit thegovernment come up with standards, “at least we havegovernment come up with standards, “at least we haveinput in Orlando”.input in Orlando”.
HealthCare 21 a ProviderHealthCare 21 a ProviderEmployer CoalitionEmployer Coalition
•• Spotlights what providers need to do to make a saferSpotlights what providers need to do to make a saferhospital and physician delivery system by followinghospital and physician delivery system by followingLeapFrog StandardsLeapFrog Standards
•• Early returns indicate employers are having and impact byEarly returns indicate employers are having and impact bybeing consistent in standards measurement.being consistent in standards measurement.
•• Was launched five years ago as a way for employers toWas launched five years ago as a way for employers tohave an impact on Knoxville providers but wanted tohave an impact on Knoxville providers but wanted toimprove care for the community not just a few employers.improve care for the community not just a few employers.
Leapfrog GroupLeapfrog Group
•• 115 public and private employers offering benefits to 32115 public and private employers offering benefits to 32million Americans formed to promote safety and qualitymillion Americans formed to promote safety and qualitymeasures.measures.
•• Three main criteria:Three main criteria:
•• Computerized physicians order entry systemComputerized physicians order entry system
•• specific volume of certain procedures before they arespecific volume of certain procedures before they areperformedperformed
•• Intensive care staffing at the ER and other unitsIntensive care staffing at the ER and other units
•• Either you are in or you are out, if you are out all theEither you are in or you are out, if you are out all theconsumers know it.consumers know it.
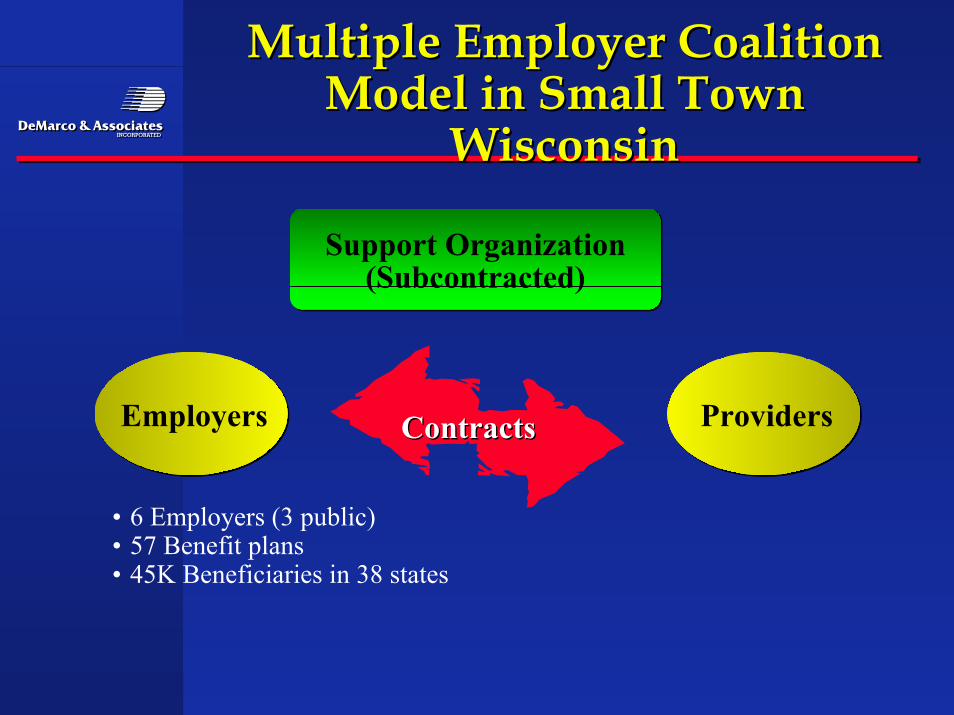
Multiple Employer CoalitionMultiple Employer CoalitionModel in Small TownModel in Small Town
WisconsinWisconsin
Support Organization(Subcontracted)
Employers Providers
• 6 Employers (3 public)• 57 Benefit plans• 45K Beneficiaries in 38 states
ContractsContracts
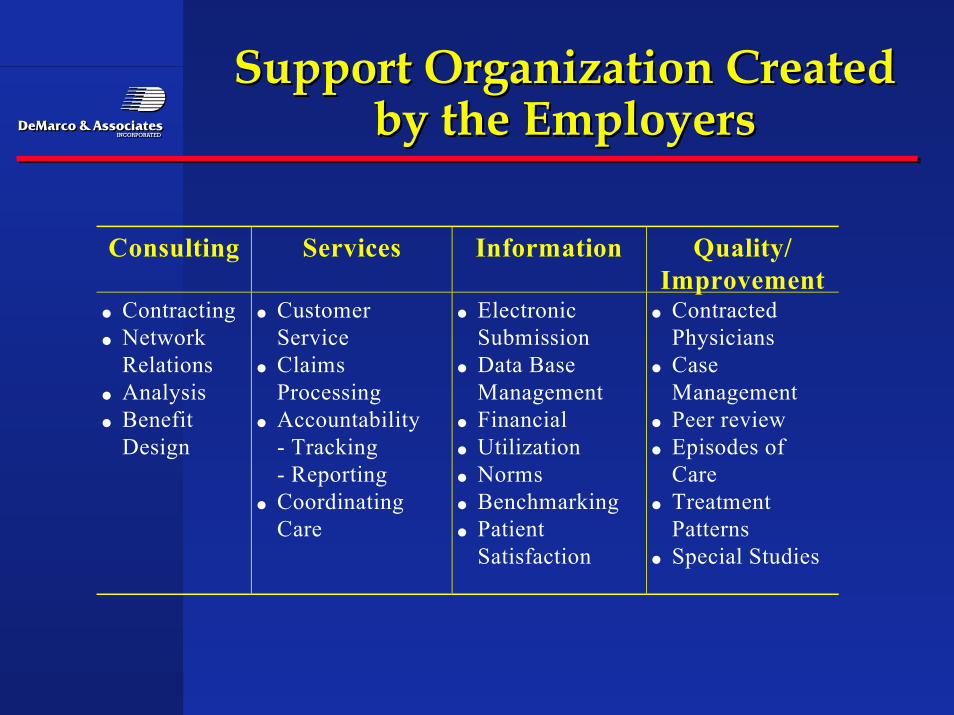
Support Organization CreatedSupport Organization Createdby the Employersby the Employers
Consulting Services Information Quality/Improvement
• Contracting• Network
Relations• Analysis• Benefit
Design
• CustomerService
• ClaimsProcessing
• Accountability - Tracking - Reporting• Coordinating
Care
• ElectronicSubmission
• Data BaseManagement
• Financial• Utilization• Norms• Benchmarking• Patient
Satisfaction
• ContractedPhysicians
• CaseManagement
• Peer review• Episodes of
Care• Treatment
Patterns• Special Studies
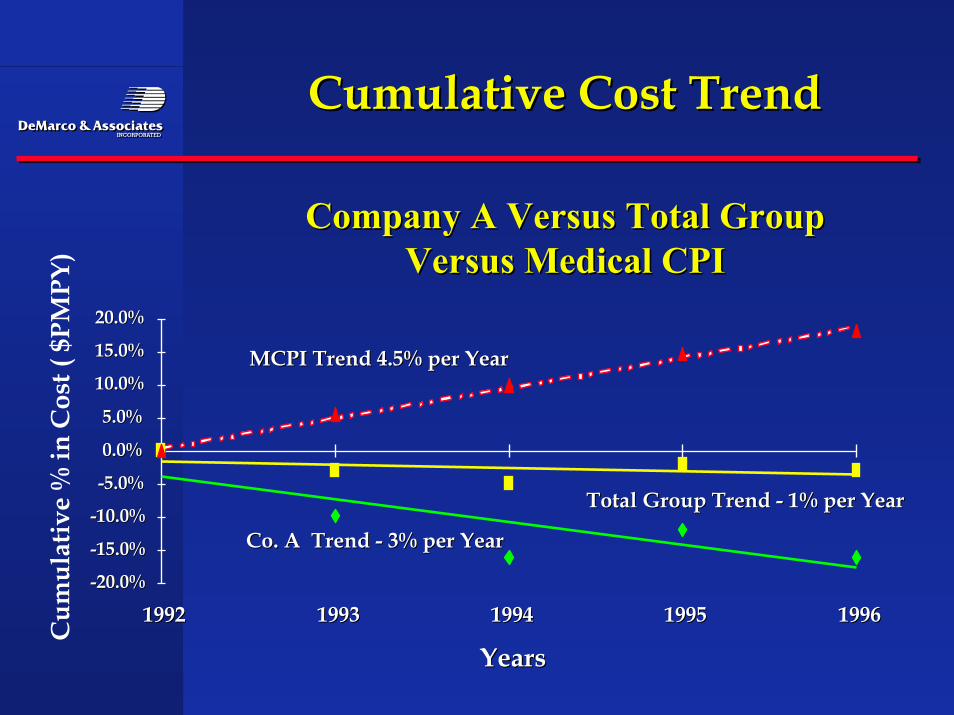
Cumulative Cost TrendCumulative Cost Trend
Company A Versus Total GroupCompany A Versus Total GroupVersus Medical CPIVersus Medical CPI
Co. A Trend - 3% per YearCo. A Trend - 3% per Year
Total Group Trend - 1% per YearTotal Group Trend - 1% per Year
MCPI Trend 4.5% per YearMCPI Trend 4.5% per Year
-20.0%-20.0%
-15.0%-15.0%
-10.0%-10.0%
-5.0%-5.0%
0.0%0.0%
5.0%5.0%
10.0%10.0%
15.0%15.0%
20.0%20.0%
19921992 19931993 19941994 19951995 19961996
YearsYears
Cum
ulat
ive
% in
Cos
t ( $
PMPY
)
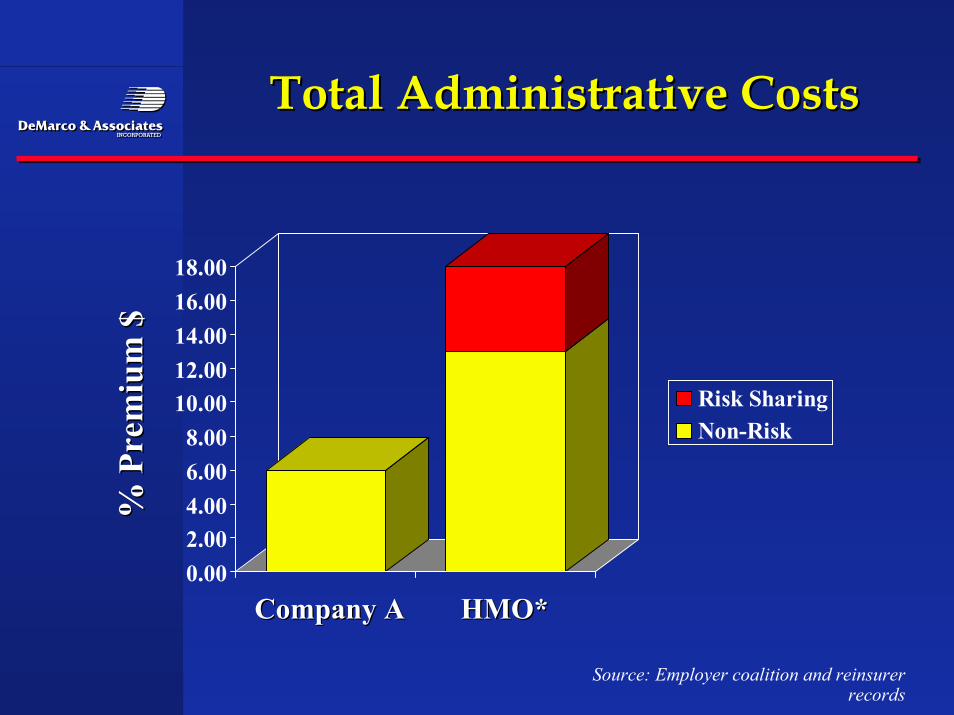
Total Administrative CostsTotal Administrative Costs
0.002.004.006.008.00
10.0012.0014.0016.0018.00
Risk SharingNon-Risk
% P
rem
ium
$%
Pre
miu
m $
Company ACompany A HMO* HMO*
Source: Employer coalition and reinsurerrecords
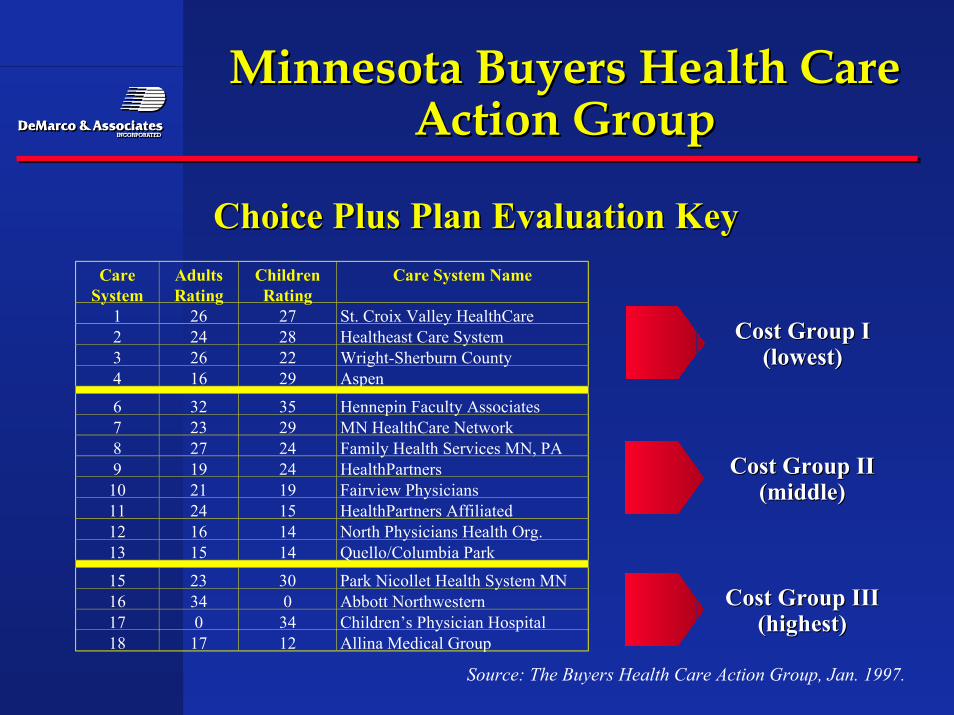
Minnesota Buyers Health CareMinnesota Buyers Health CareAction GroupAction Group
Source: The Buyers Health Care Action Group, Jan. 1997.
Choice Plus Plan Evaluation KeyChoice Plus Plan Evaluation KeyCare
SystemAdultsRating
ChildrenRating
Care System Name
1 26 27 St. Croix Valley HealthCare2 24 28 Healtheast Care System3 26 22 Wright-Sherburn County4 16 29 Aspen
6 32 35 Hennepin Faculty Associates7 23 29 MN HealthCare Network8 27 24 Family Health Services MN, PA9 19 24 HealthPartners
10 21 19 Fairview Physicians11 24 15 HealthPartners Affiliated12 16 14 North Physicians Health Org.13 15 14 Quello/Columbia Park
15 23 30 Park Nicollet Health System MN16 34 0 Abbott Northwestern17 0 34 Children’s Physician Hospital18 17 12 Allina Medical Group
Cost Group ICost Group I(lowest)(lowest)
Cost Group IICost Group II(middle)(middle)
Cost Group IIICost Group III(highest)(highest)
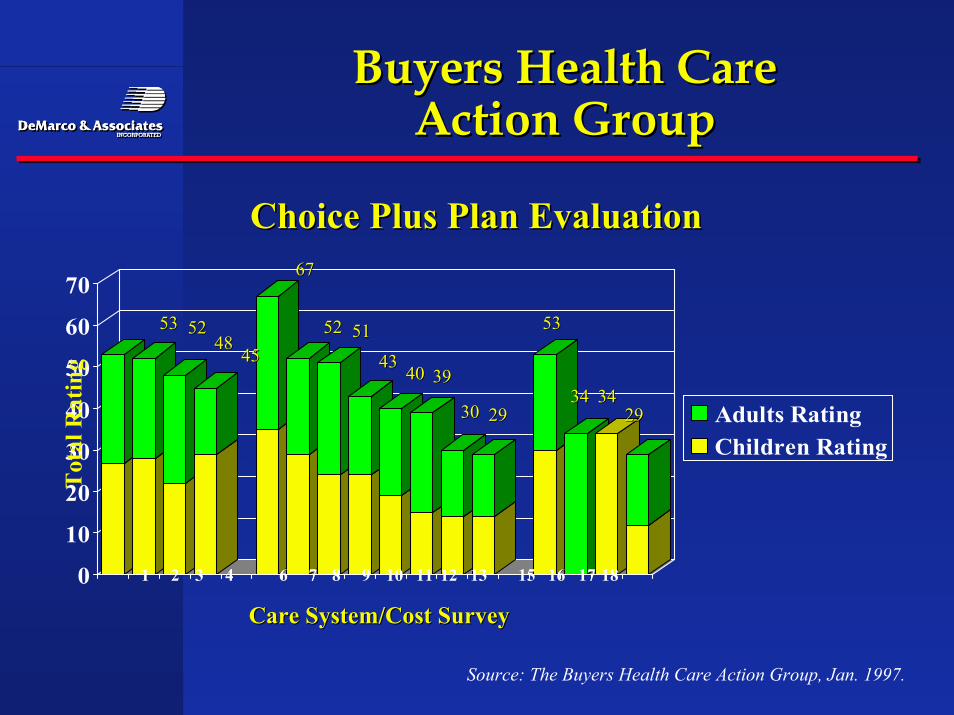
Buyers Health CareBuyers Health CareAction GroupAction Group
Choice Plus Plan EvaluationChoice Plus Plan Evaluation
0
10
20
30
40
50
60
70
Adults RatingChildren Rating
Source: The Buyers Health Care Action Group, Jan. 1997.
1 2 3 4 6 7 8 9 10 11 12 13 15 16 17 18
Care System/Cost SurveyCare System/Cost Survey
Tot
al R
atin
g
5353 52524848
4545
6767
5252 5151
43434040 3939
3030 2929
5353
3434 34342929
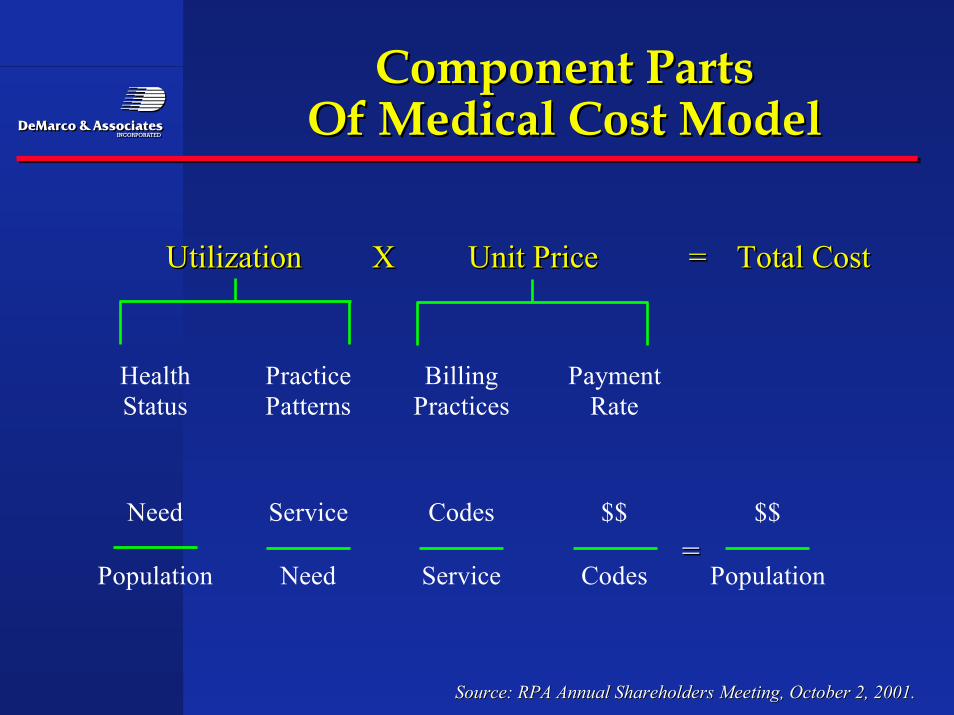
Component PartsComponent PartsOf Medical Cost ModelOf Medical Cost Model
Source: RPA Annual Shareholders Meeting, October 2, 2001.Source: RPA Annual Shareholders Meeting, October 2, 2001.
HealthStatus
PracticePatterns
BillingPractices
PaymentRate
Need Service Codes $$ $$
Population Need Service Codes Population
Utilization X Unit Price = Total CostUtilizationUtilization XX Unit PriceUnit Price == Total CostTotal Cost
===
Insurers attempting toInsurers attempting toaccommodate this changeaccommodate this change
•• Blue Cross of MassachusettsBlue Cross of Massachusetts
•• Several medical groups in California adopting P4PSeveral medical groups in California adopting P4P
•• Illinois Blue Cross BlueIllinois Blue Cross Blue
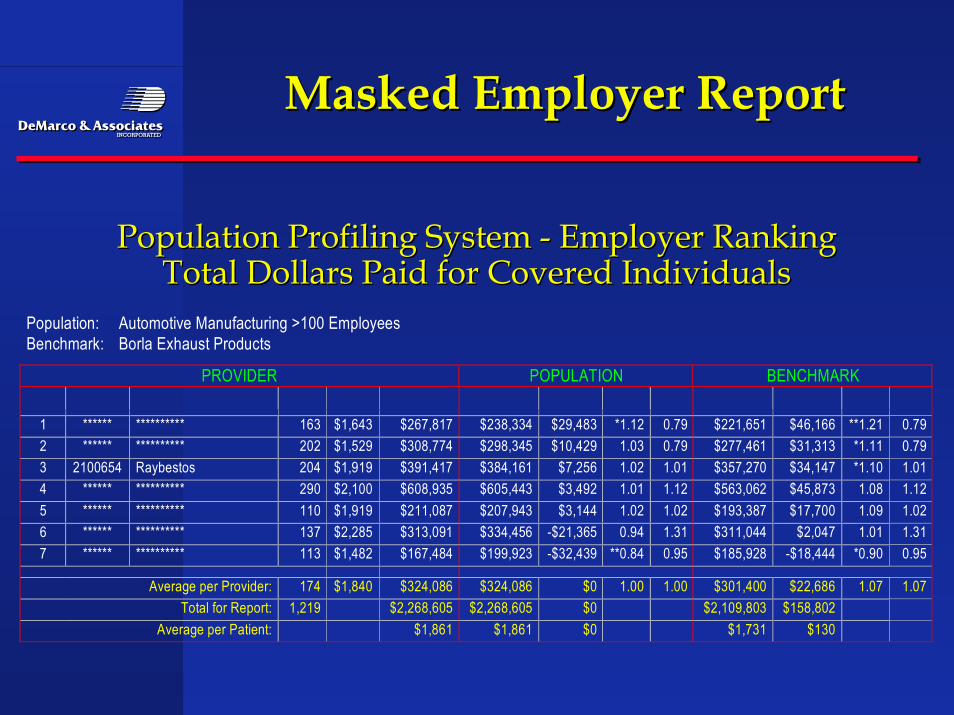
Population: Automotive Manufacturing >100 EmployeesBenchmark: Borla Exhaust Products
PROVIDER POPULATION BENCHMARK
1 ****** ********** 163 $1,643 $267,817 $238,334 $29,483 *1.12 0.79 $221,651 $46,166 **1.21 0.792 ****** ********** 202 $1,529 $308,774 $298,345 $10,429 1.03 0.79 $277,461 $31,313 *1.11 0.793 2100654 Raybestos 204 $1,919 $391,417 $384,161 $7,256 1.02 1.01 $357,270 $34,147 *1.10 1.014 ****** ********** 290 $2,100 $608,935 $605,443 $3,492 1.01 1.12 $563,062 $45,873 1.08 1.125 ****** ********** 110 $1,919 $211,087 $207,943 $3,144 1.02 1.02 $193,387 $17,700 1.09 1.026 ****** ********** 137 $2,285 $313,091 $334,456 -$21,365 0.94 1.31 $311,044 $2,047 1.01 1.317 ****** ********** 113 $1,482 $167,484 $199,923 -$32,439 **0.84 0.95 $185,928 -$18,444 *0.90 0.95
Average per Provider: 174 $1,840 $324,086 $324,086 $0 1.00 1.00 $301,400 $22,686 1.07 1.07Total for Report: 1,219 $2,268,605 $2,268,605 $0 $2,109,803 $158,802
Average per Patient: $1,861 $1,861 $0 $1,731 $130
Masked Employer ReportMasked Employer Report
Population Profiling System - Employer RankingPopulation Profiling System - Employer RankingTotal Dollars Paid for Covered IndividualsTotal Dollars Paid for Covered Individuals
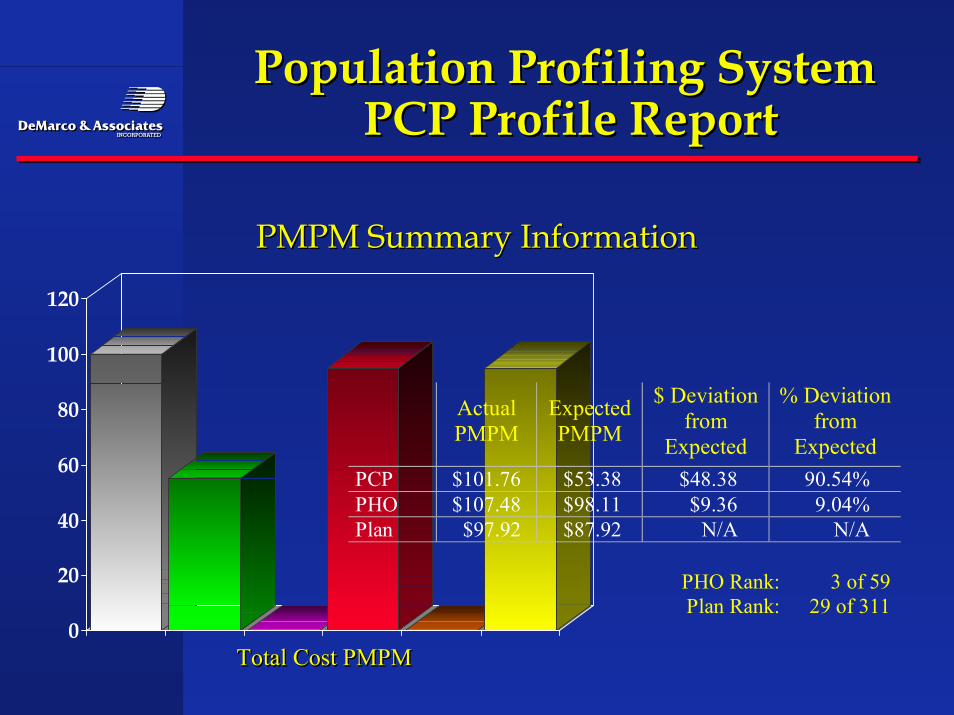
Population Profiling SystemPopulation Profiling System PCP Profile Report PCP Profile Report
PMPM Summary InformationPMPM Summary Information
0
20
40
60
80
100
120
Total Cost PMPMTotal Cost PMPMTotal Cost PMPM
ActualPMPM
ExpectedPMPM
$ Deviationfrom
Expected
% Deviationfrom
ExpectedPCP $101.76 $53.38 $48.38 90.54%PHO $107.48 $98.11 $9.36 9.04%Plan $97.92 $87.92 N/A N/A
PHO Rank: 3 of 59Plan Rank: 29 of 311
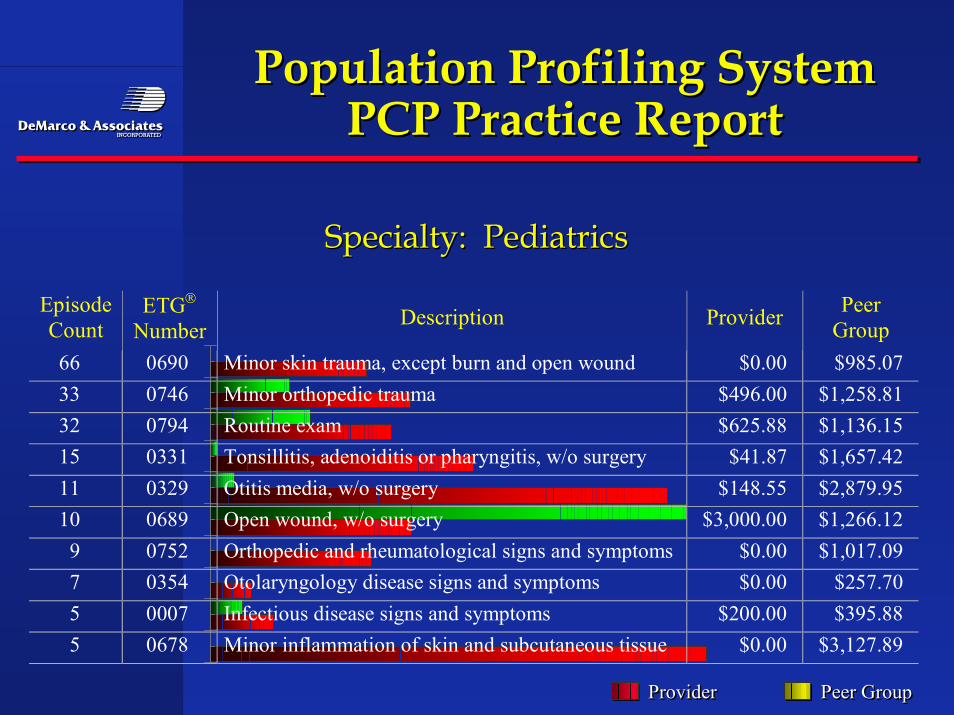
EpisodeCount
ETG
Number Description Provider PeerGroup
66 0690 Minor skin trauma, except burn and open wound $0.00 $985.0733 0746 Minor orthopedic trauma $496.00 $1,258.8132 0794 Routine exam $625.88 $1,136.1515 0331 Tonsillitis, adenoiditis or pharyngitis, w/o surgery $41.87 $1,657.4211 0329 Otitis media, w/o surgery $148.55 $2,879.9510 0689 Open wound, w/o surgery $3,000.00 $1,266.12
9 0752 Orthopedic and rheumatological signs and symptoms $0.00 $1,017.097 0354 Otolaryngology disease signs and symptoms $0.00 $257.705 0007 Infectious disease signs and symptoms $200.00 $395.885 0678 Minor inflammation of skin and subcutaneous tissue $0.00 $3,127.89
Population Profiling SystemPopulation Profiling SystemPCP Practice ReportPCP Practice Report
Specialty: PediatricsSpecialty: Pediatrics
ProviderProviderProvider Peer GroupPeer GroupPeer Group
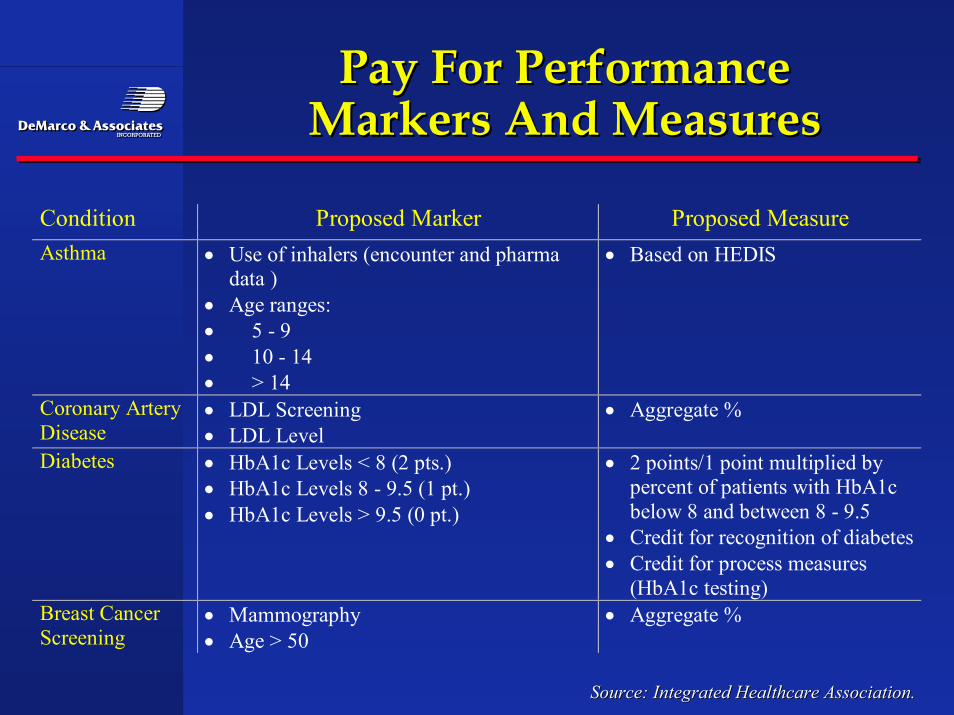
Condition Proposed Marker Proposed MeasureAsthma • Use of inhalers (encounter and pharma
data )• Age ranges:• 5 - 9• 10 - 14• > 14
• Based on HEDIS
Coronary ArteryDisease
• LDL Screening• LDL Level
• Aggregate %
Diabetes • HbA1c Levels < 8 (2 pts.)• HbA1c Levels 8 - 9.5 (1 pt.)• HbA1c Levels > 9.5 (0 pt.)
• 2 points/1 point multiplied bypercent of patients with HbA1cbelow 8 and between 8 - 9.5
• Credit for recognition of diabetes• Credit for process measures
(HbA1c testing)Breast CancerScreening
• Mammography• Age > 50
• Aggregate %
Pay For PerformancePay For PerformanceMarkers And MeasuresMarkers And Measures
Source: Integrated Healthcare Association.Source: Integrated Healthcare Association.
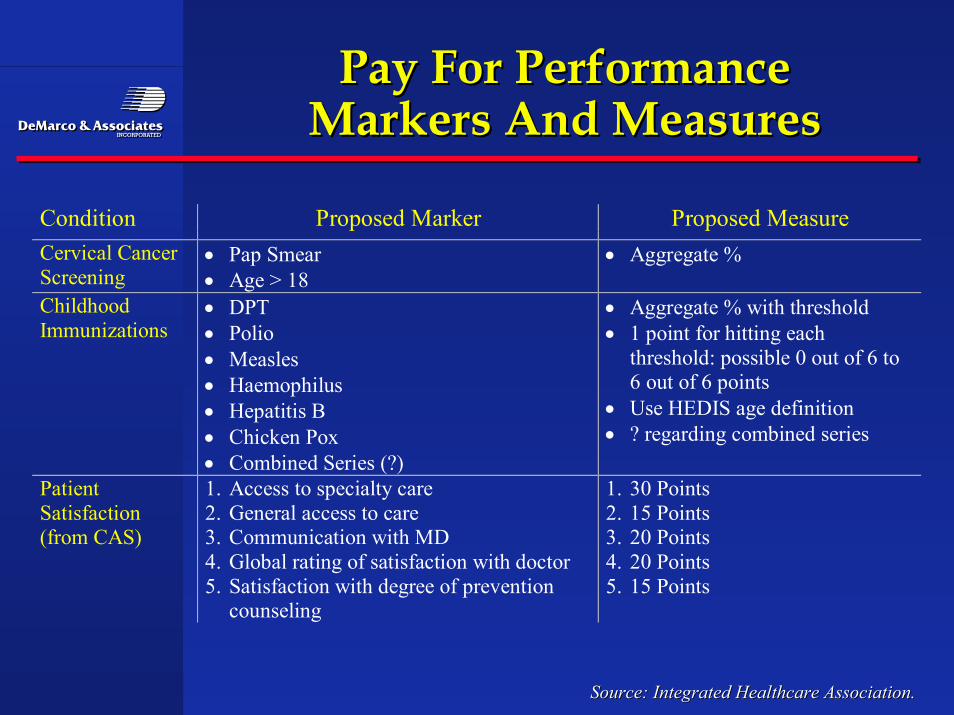
Condition Proposed Marker Proposed MeasureCervical CancerScreening
• Pap Smear• Age > 18
• Aggregate %
ChildhoodImmunizations
• DPT• Polio• Measles• Haemophilus• Hepatitis B• Chicken Pox• Combined Series (?)
• Aggregate % with threshold• 1 point for hitting each
threshold: possible 0 out of 6 to6 out of 6 points
• Use HEDIS age definition• ? regarding combined series
PatientSatisfaction(from CAS)
1. Access to specialty care2. General access to care3. Communication with MD4. Global rating of satisfaction with doctor5. Satisfaction with degree of prevention
counseling
1. 30 Points2. 15 Points3. 20 Points4. 20 Points5. 15 Points
Pay For PerformancePay For PerformanceMarkers And MeasuresMarkers And Measures
Source: Integrated Healthcare Association.Source: Integrated Healthcare Association.
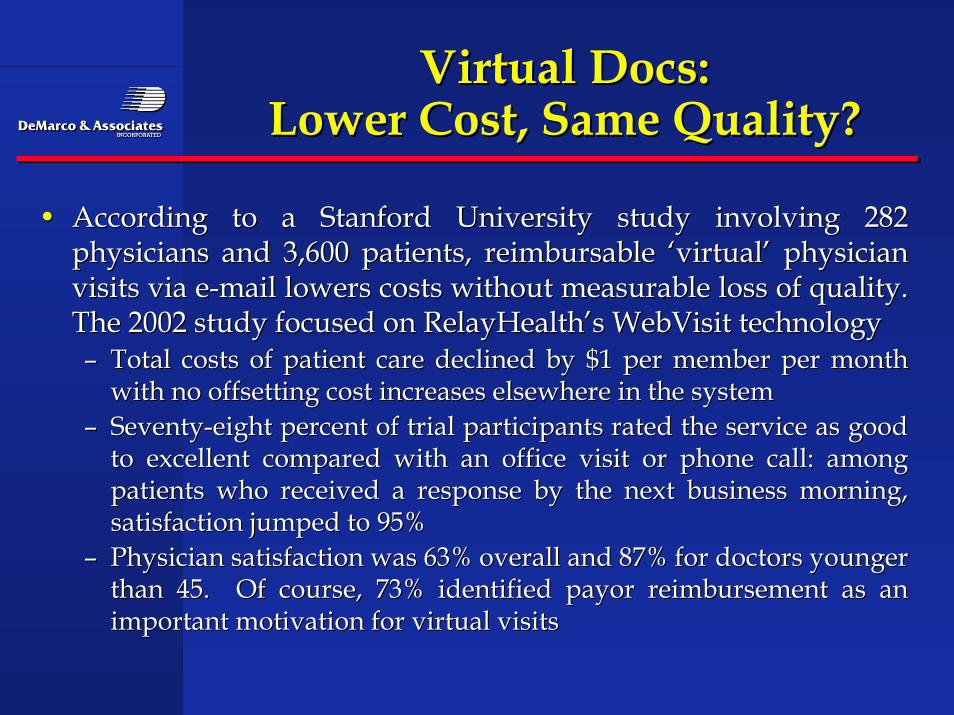
Virtual Docs:Virtual Docs:Lower Cost, Same Quality?Lower Cost, Same Quality?
•• According to a Stanford University study involving 282According to a Stanford University study involving 282physicians and 3,600 patients, reimbursable ‘virtual’ physicianphysicians and 3,600 patients, reimbursable ‘virtual’ physicianvisits via e-mail lowers costs without measurable loss of quality.visits via e-mail lowers costs without measurable loss of quality.The 2002 study focused on RelayHealth’s WebVisit technologyThe 2002 study focused on RelayHealth’s WebVisit technology–– Total costs of patient care declined by $1 per member per monthTotal costs of patient care declined by $1 per member per month
with no offsetting cost increases elsewhere in the systemwith no offsetting cost increases elsewhere in the system–– Seventy-eight percent of trial participants rated the service as goodSeventy-eight percent of trial participants rated the service as good
to excellent compared with an office visit or phone call: amongto excellent compared with an office visit or phone call: amongpatients who received a response by the next business morning,patients who received a response by the next business morning,satisfaction jumped to 95%satisfaction jumped to 95%
–– Physician satisfaction was 63% overall and 87% for doctors youngerPhysician satisfaction was 63% overall and 87% for doctors youngerthan 45. Of course, 73% identified payor reimbursement as anthan 45. Of course, 73% identified payor reimbursement as animportant motivation for virtual visitsimportant motivation for virtual visits
SummarySummary
•• Employers are acting upon managed care by either doingEmployers are acting upon managed care by either doingit for them or getting managed care to shift the focus toit for them or getting managed care to shift the focus totieringtiering of hospitals and physicians to meet new and of hospitals and physicians to meet new andimproved quality and safety standardsimproved quality and safety standards
•• HMOs built a demand driven system of comprehensiveHMOs built a demand driven system of comprehensivebenefits and non deductibles, Performance was managedbenefits and non deductibles, Performance was managedby the insurance company.Insurance companies failed andby the insurance company.Insurance companies failed andmanaging care because of a simple conflict inmanaging care because of a simple conflict inpremium/medical expense management .premium/medical expense management .
•• Now we are going backwards into higher deductibles and Now we are going backwards into higher deductibles andcopays where employees are expected to know who thecopays where employees are expected to know who thetop performers are to get the best value.top performers are to get the best value.
SummarySummary
•• More marketshare and money is tied to top performanceMore marketshare and money is tied to top performancefor providers and employers are at the helm steeringfor providers and employers are at the helm steeringemployees through incentives designed by themselves ,employees through incentives designed by themselves ,their coalition or their insurance company. In some cases atheir coalition or their insurance company. In some cases alocal coalition has more clout that the insurer.local coalition has more clout that the insurer.
•• What has changed is the metrics of what constitutesWhat has changed is the metrics of what constitutesquality care versus just activity. The accounting trick ofquality care versus just activity. The accounting trick ofmanipulating fees to get recoveries for substandard care ismanipulating fees to get recoveries for substandard care isoverover
•• The leading employers and providers will not wait forThe leading employers and providers will not wait forUncle Sam to label which hospitals or specialty isUncle Sam to label which hospitals or specialty issubstandard they will want to know which departmentsubstandard they will want to know which departmentand which physicians is best.and which physicians is best.
ConclusionConclusion
•• The old words of Quality improvement is wearing thin inThe old words of Quality improvement is wearing thin inthe doctors lounge. The next generation of integratingthe doctors lounge. The next generation of integratingoutcomes and resources to measure efficiency andoutcomes and resources to measure efficiency andeffectiveness of care are evolving as we speak.effectiveness of care are evolving as we speak.
•• Hospitals and physicians groups who wait for theHospitals and physicians groups who wait for thegovernment to publish reports on quality performance riskgovernment to publish reports on quality performance riskeverything once the report is out unless a solid ability toeverything once the report is out unless a solid ability torefute mistaken info and assumptions can be developed atrefute mistaken info and assumptions can be developed atthe local level.the local level.
•• The new model of compensation for physicians willThe new model of compensation for physicians willinclude these performance adjustments or physicians willinclude these performance adjustments or physicians willgo to a medical staff where this is available.go to a medical staff where this is available.