Embed Size (px)
Citation preview

APS+C Annual Report 2019
Annual Report 2019
Providing digital solutions with a human touch
For
per
sona
l use
onl
y

B PS+C Annual Report 2019
We combine technology, digital and innovation capabilities with deep industry knowledge to help our clients solve their business challenges, gain greater customer intimacy and bring their brands to life.
Business Profile
ContentsChairperson/CEO Report 2
Directors’ Report 6
Auditor’s Independence Declaration 14
Corporate Governance Statement 15
Financial Statements 16
Statement of Profit or Loss and Other Comprehensive Income 17
Statement of Financial Position 18
Statement of Changes in Equity 19
Statement of Cash Flows 20
Notes to the Financial Statements 21
Directors’ Declaration 58
Independent Auditor’s Report to the Members of PS&C Ltd 59
Shareholder Information 64
PS+C Annual Report 2019
ABN 50 164 718 361F
or p
erso
nal u
se o
nly
1PS+C Annual Report 2019
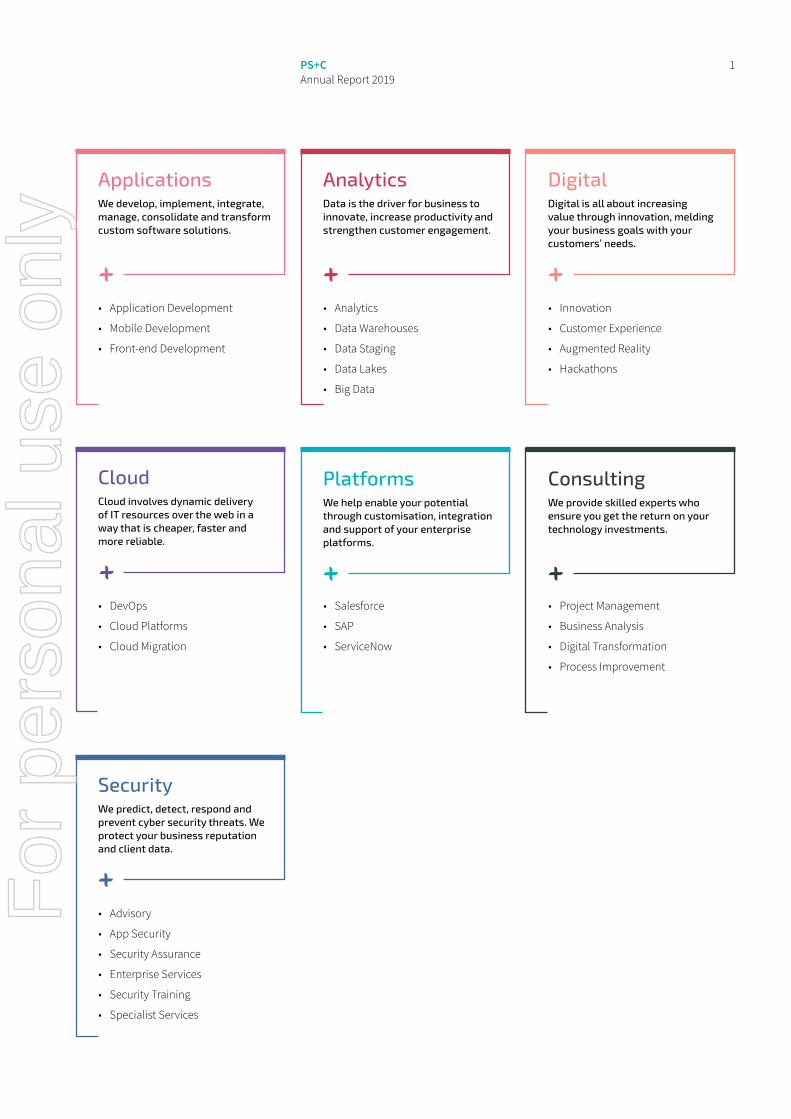
Applications We develop, implement, integrate, manage, consolidate and transform custom software solutions.
• Application Development
• Mobile Development
• Front-end Development
AnalyticsData is the driver for business to innovate, increase productivity and strengthen customer engagement.
DigitalDigital is all about increasing value through innovation, melding your business goals with your customers’ needs.
SecurityWe predict, detect, respond and prevent cyber security threats. We protect your business reputation and client data.
• Analytics
• Data Warehouses
• Data Staging
• Data Lakes
• Big Data
• Innovation
• Customer Experience
• Augmented Reality
• Hackathons
• Advisory
• App Security
• Security Assurance
• Enterprise Services
• Security Training
• Specialist Services
CloudCloud involves dynamic delivery of IT resources over the web in a way that is cheaper, faster and more reliable.
• DevOps
• Cloud Platforms
• Cloud Migration
PlatformsWe help enable your potential through customisation, integration and support of your enterprise platforms.
ConsultingWe provide skilled experts who ensure you get the return on your technology investments.
• Salesforce
• SAP
• ServiceNow
• Project Management
• Business Analysis
• Digital Transformation
• Process Improvement
For
per
sona
l use
onl
y
Dear Fellow Shareholders,
1 Excludes $1.75m of Glass Establishment Costs in FY18 that were expensed in FY18.
PS&C Limited (ASX:PSZ) (PS+C) is pleased to provide the Company’s Annual Report for the year ended 30 June 2019.
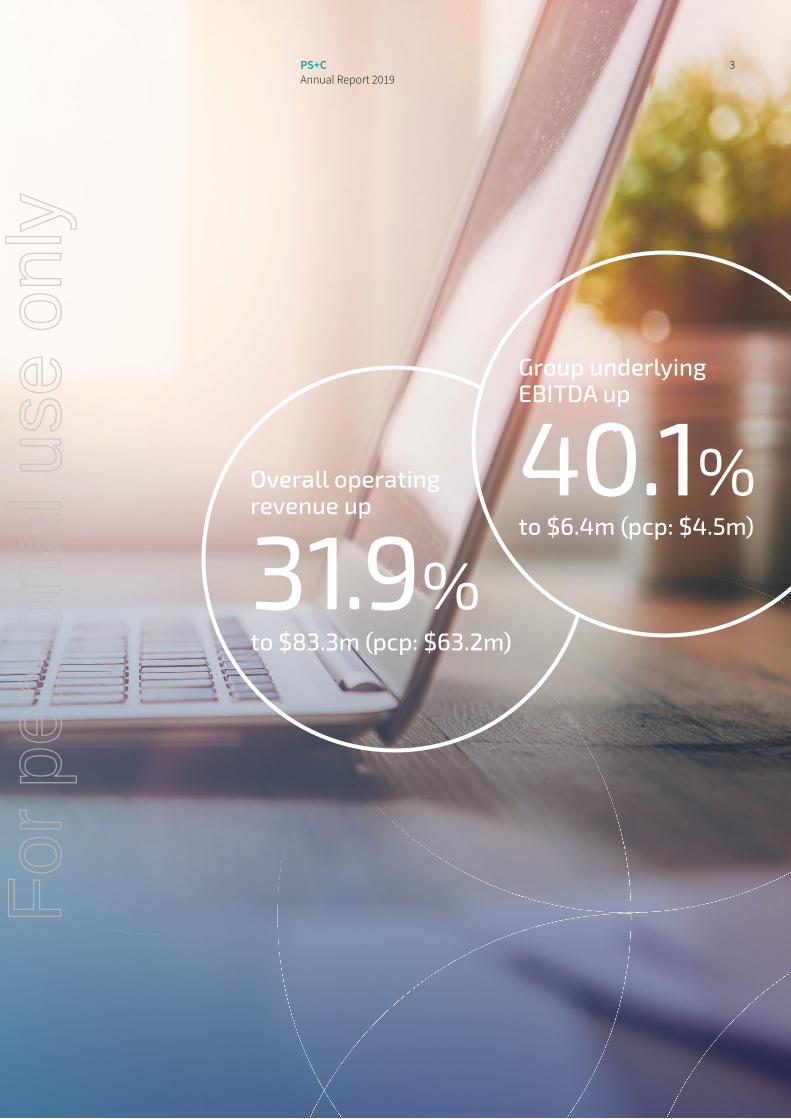
Despite being constrained by limited working capital, the resilience of our business model delivered growth in revenue from continuing operations of 31.9% and growth in underlying EBITDA of 40.1% to $6.4m. This is in line with guidance provided to the market on 21 June 2019.
Pleasingly, the Company produced positive cash flows from operations of $5.0m representing 78% of underlying EBITDA from continuing operations.
In the 2H19 PS+C strengthened its sales and marketing organisation to more strongly align with market opportunities and ramped up recruitment of more talent in all locations to meet the growing demand. Further overhead cost reduction measures were implemented at the back end of the financial year that will impact positively on earnings in FY20.
The significant structural changes made continue to mature, leading to more efficient teaming across sales, recruitment and administration making it easier to do business with our clients. The changes and actions taken throughout the year mean that PS+C is well poised for further growth in the future.
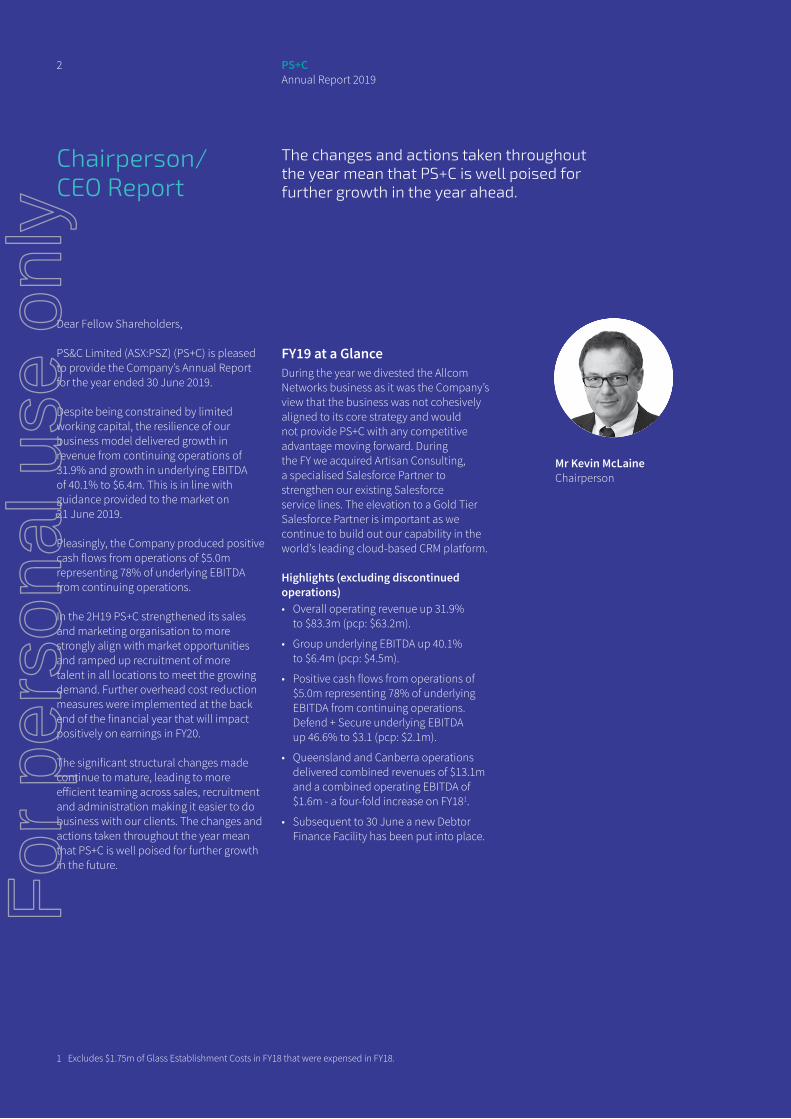
FY19 at a GlanceDuring the year we divested the Allcom Networks business as it was the Company’s view that the business was not cohesively aligned to its core strategy and would not provide PS+C with any competitive advantage moving forward. During the FY we acquired Artisan Consulting, a specialised Salesforce Partner to strengthen our existing Salesforce service lines. The elevation to a Gold Tier Salesforce Partner is important as we continue to build out our capability in the world’s leading cloud-based CRM platform.
Highlights (excluding discontinued operations)• Overall operating revenue up 31.9%
to $83.3m (pcp: $63.2m).
• Group underlying EBITDA up 40.1% to $6.4m (pcp: $4.5m).
• Positive cash flows from operations of $5.0m representing 78% of underlying EBITDA from continuing operations.Defend + Secure underlying EBITDA up 46.6% to $3.1 (pcp: $2.1m).
• Queensland and Canberra operations delivered combined revenues of $13.1m and a combined operating EBITDA of $1.6m - a four-fold increase on FY181.
• Subsequent to 30 June a new Debtor Finance Facility has been put into place.
The changes and actions taken throughout the year mean that PS+C is well poised for further growth in the year ahead.
Mr Kevin McLaine Chairperson
Chairperson/ CEO Report
2 PS+C Annual Report 2019
For
per
sona
l use
onl
y
to $83.3m (pcp: $63.2m)
Overall operating revenue up
to $6.4m (pcp: $4.5m)
Group underlying EBITDA up
40.1%
31.9%
3PS+C Annual Report 2019
For
per
sona
l use
onl
y
4 PS+C Annual Report 2019
Chairperson/ CEO Report continued
CommentaryDespite the normal effects of Federal Elections, PS+C’s Canberra operations performed strongly adding new clients and being engaged in significant new projects towards the back end of FY19. Our Queensland operations also saw a broadening of their client base with the result being increased utilization across the consultant base at the same time overall consultant numbers grew.
We see a key industry driver being the adoption of agile methodologies which has resulted in ‘mini’ business transformation projects as opposed to large, multi-year plus transformations. These mini projects are shorter, more focused and provide the foundation for considerable business enhancement without the need to invest in large scale transformation programs. This landscape is playing to PS+C’s strengths in the market and a large portion of the structural changes we have made support this.
The Financial Services, Federal Government, Gaming, Agriculture and Utilities sectors remain strong and will be a mainstay of the Company going forward. These sectors are expected to be the source of continued investment throughout FY20 and beyond.
From our Queensland operations we delivered several innovative solutions to a number of key clients using our Design Thinking and Innovation Methodologies including the reimagining of retail spaces, running innovation hackathons and helping clients set their Customer Experience and Technology Roadmaps.
While margin pressure remained during the year, it is not expected to have any further impact in FY20. The investment made in our People and Culture function has established initiatives to attract and retain the best people possible in the industry.
Importantly, in the last quarter of FY19 we generated sales in excess of our revenue run rate which means we are improving our work pipeline, in turn providing greater confidence as we enter the new financial year.
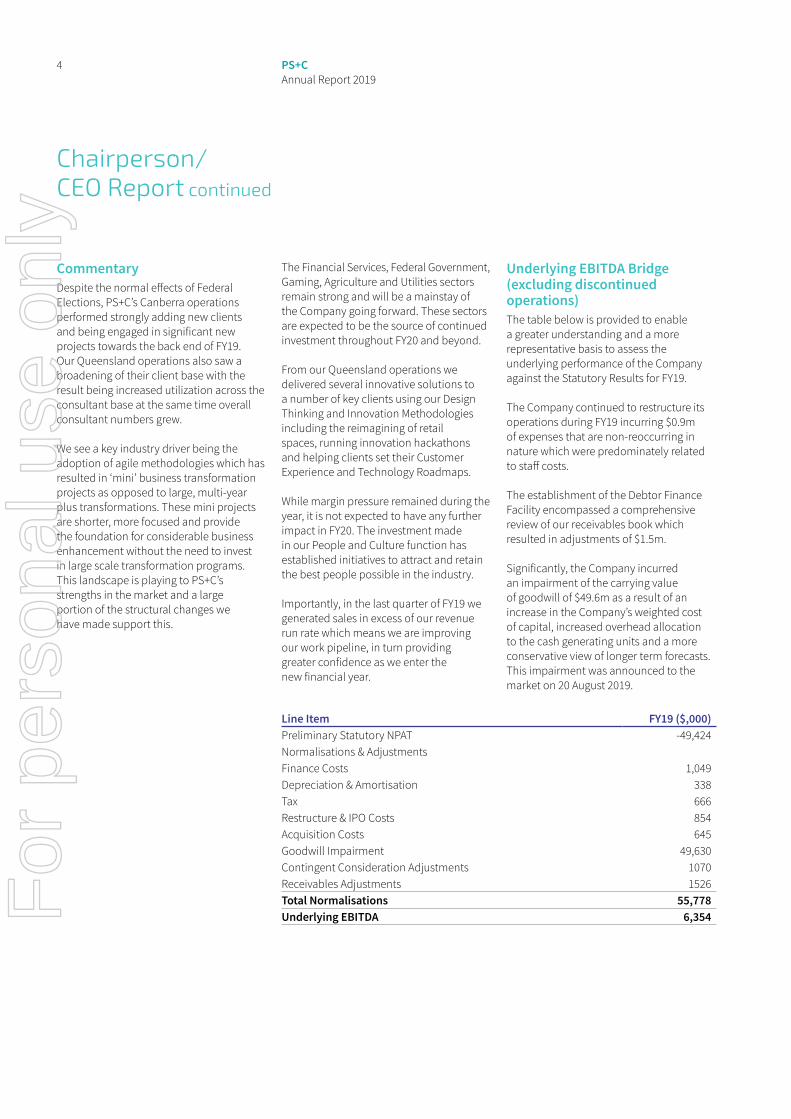
Underlying EBITDA Bridge (excluding discontinued operations)The table below is provided to enable a greater understanding and a more representative basis to assess the underlying performance of the Company against the Statutory Results for FY19.
The Company continued to restructure its operations during FY19 incurring $0.9m of expenses that are non-reoccurring in nature which were predominately related to staff costs.
The establishment of the Debtor Finance Facility encompassed a comprehensive review of our receivables book which resulted in adjustments of $1.5m.
Significantly, the Company incurred an impairment of the carrying value of goodwill of $49.6m as a result of an increase in the Company’s weighted cost of capital, increased overhead allocation to the cash generating units and a more conservative view of longer term forecasts. This impairment was announced to the market on 20 August 2019.
Line Item FY19 ($,000)Preliminary Statutory NPAT -49,424Normalisations & AdjustmentsFinance Costs 1,049Depreciation & Amortisation 338Tax 666Restructure & IPO Costs 854Acquisition Costs 645Goodwill Impairment 49,630Contingent Consideration Adjustments 1070Receivables Adjustments 1526Total Normalisations 55,778Underlying EBITDA 6,354F
or p
erso
nal u
se o
nly

5PS+C Annual Report 2019
Strategic VisionWe have refreshed our three-year strategy to capitalise on the structural changes we have made over the past two reporting periods.
The revised strategy includes both short-term and longer-term responses to ensure PS+C is equipped to deal with challenges as they arise ensuring we retain a strategic vision of driving growth over the next three-year period. A key component of the revised strategy is moving PS+C to a capability services model which will be rolled out along with new marketing materials in FY20.
In the short-term we will focus on delivering more predictable financial performance now the new operating structure has reached the right level of maturity.
Finally, we feel strongly that further sector consolidation will occur in the short to medium term. Whilst the changes we have made have placed PS+C in strong position to grow profitably across all regions, we will openly participate in any sector consolidation if the Board feels it will deliver the right outcomes for our people, our clients and importantly maximise value for our Shareholders.
The Board is actively pursuing divestment opportunities in order to unlock value for Shareholders, including strengthening the Company’s Balance Sheet.
5PS+C Annual Report 2019
For
per
sona
l use
onl
y
6 PS+C Annual Report 2019
Directors’ Report
DirectorsThe names of the Directors in office at any time during or since the end of the year are::
Non-Executive DirectorsMr Kevin McLaine (Chairperson)• Appointed Director 9 July 2013, appointed
Chairperson 6 December 2017.
• Kevin has over 20 years’ experience in the Australian public market, having held senior roles at both Shomega Limited and CSG Limited. Kevin spent several years with GE Capital in Thailand as Managing Director of its commercial lending business. He has also been the general manager of a manufacturing facility. Kevin holds a Bachelor of Business and is a Fellow of CPA Australia and a member of the AICD. He is a member of the Audit & Risk Management Committee (Chair from 30 May 2017 to 6 December 2017) and is Chair of the Remuneration & Nomination Committee (appointed 6 December 2017).
Mr Nigel Warren• Appointed Director 6 December 2017.
• Resigned 16 August 2019.
• Nigel has been an investment Director for Invest Australia in San Francisco, the Vice President of Sales for Equilibrium Inc. an enterprise software and services company and the Australian Counsel-General in San Francisco. He has also held the position of Senior Trade Commissioner Latin America based in Santiago, Chile. He has a Bachelor of International Business and is a member of the AICD. He is Chair of the Audit & Risk Management Committee (appointed 6 December 2017 to 16 August 2019) and a member of the Remuneration & Nomination Committee.
Mrs Renata Sguario• Appointed director 2 September 2019.
• Renata is an experienced senior executive with almost three decades specialising in customer centred, technology-led, business transformation at leading companies both in Australia and abroad. Most recently Renata held the position of Head of Shared Services, Sales and Operations at Latitude Financial Services where she led the establishment of a central and highly leveraged enterprise operational excellence function. Prior to that Renata held various senior positions at National Australia Bank including, General Manager, Operational Excellence. Renata holds a Bachelor of Computer Science and Information Management from The University of Melbourne and holds a Level 1 & 2 certificate from the Institute of Executive Coaching.
Executive DirectorsMr Glenn Fielding• Appointed 19 May 2017.
• Glenn is a very experienced senior executive in the IT services industry and has a history of creating value demonstrated through his positions at UXC Limited, DWS Limited, SMS Consulting Group, and Ingena Group Limited. He was most recently Chief Executive Officer of Professional Solutions at UXC from 2008 to 2016. He was a founding member of SMS Consulting Group and during his 13 years at SMS, he performed many senior roles including commercial management and merger and acquisition activities. He was instrumental in setting up and running the national contracting arm of SMS. Glenn has also held senior IT management roles in banking and finance industries.
Mr Robert Hogeland• Appointed 16 August 2019.
• Robert has extensive experience in the IT Services industry spanning more than 15 years. He is presently the Regional Director of Sales in Victoria having joined PS&C Ltd as part of the Seisma Pty Ltd acquisition completed in March 2018. Previously, Robert worked as the Group Executive, Southern Region at ASX listed RXP Services Limited. The appointment at RXP followed 9 years as a major account executive at FinXL Professional Solutions. Robert has a Bachelor of Business degree from Monash University.
Group SecretaryThe following person held the position of Group Secretary at the end of the financial year:
Mr Jeff Bennett• Jeff is a highly experienced finance
executive with extensive experience in all facets of finance and business within IT. Prior to joining PS&C Ltd, Jeff spent 10 years at DXC Technology, Computer Sciences Corporation, UXC Limited and Ingena Limited in senior finance roles. Jeff has experience as Chairman of the Board of a publicly listed company and is currently a non-executive director of publicly listed company Kneo Media Ltd. In addition, he has a thorough understanding of the complexities involved with multinationals and companies listed on the ASX. Jeff holds a Bachelor of Commerce and is a Fellow of CPA Australia.
The Directors present their report with the financial report of the consolidated entity consisting of PS&C Ltd and the entities it controlled, (PS&C or the group) for the financial year ended 30 June 2019 and Auditors’ Report thereon. This financial report has been prepared in accordance with Australian Accounting Standards.
For
per
sona
l use
onl
y
7PS+C Annual Report 2019
Principal activitiesThe principal activities of the consolidated entity during the financial year consisted of:
• Provision of information and communications technology services.
ResultsThe consolidated loss after income tax attributable to the members of PS&C Ltd was $53,489,313. This represents loss for the period between 1 July 2018 to 30 June 2019 for the parent and operating entities including discontinued operations.
Review of operationsRefer to the messages from the Chairperson and Managing Director on pages 2-5.
Financial positionThe Directors believe the group is in a stable financial position with $4.3m of cash, a new receivables financing facility that has allowed the reduction in other bank debt, positive net cash inflows, ability to divest business segments and access to capital via the equity markets.
Significant changes in the state of affairsDuring the year, the group divested its share of Allcom Networks Pty Ltd as outlined in Note 7 and purchased Artisan Consulting Pty Ltd as outlined in Note 40.
Events after the reporting periodGlenn Fielding has resigned as Chief Executive Officer effective 30 September 2019, however, will remain as a non-executive Director.
Robert Hogeland has been appointed Acting Chief Executive Officer and was appointed to the Board on 16 August 2019.
Kevin McLaine, Non-Executive Chairman, has announced he will not seek re-election as a Director at the Annual General Meeting and accordingly he will retire at the end of the meeting or earlier should a suitable replacement be found.
Renata Sguario was appointed to the board on 2 September 2019.
Other than those disclosed in Note 43, there are no other significant events after the reporting period.
Likely developmentsThe group has determined to simplify its segment reporting for the financial year 2020. To further improve the consolidated group’s profit and maximise shareholder wealth, the following developments are intended for implementation in the near future:
People segment• continued growth of diverse service
offerings for Innovation and Amplified Intelligence in the Queensland market with services available to replicate/leverage nationally.
• continue to grow our general IT competency through our support of Tier 1, Tier 2 and Government Agency clients. Will realise continued growth of our Artisan investment by growing Salesforce capabilities into our existing clients, and through leveraging our Salesforce expertise to garner new clients and agreements.
• continued growth in cloud migration, increase service offerings, project opportunities and software sales-based annuities through strengthened vendor relationships, improving margins through the rebalancing of permanent/contractor staff mix and expanding the number of large-scale cloud projects.
Security segment• expansion of our GRC offerings,
broadening operations into new Queensland with dedicated account support, as well as cross-selling to existing customers and expanding new client base.
These developments, together with the current strategy, are expected to assist in the achievement of the consolidated group’s long-term goals and development of new business opportunities.
In addition, the Board is actively pursuing divestment opportunities to unlock value for Shareholders and to strengthen the group’s Balance Sheet.
Environmental regulationThe consolidated entity’s operations are not subject to any significant Commonwealth or State environmental regulations or laws.
For
per
sona
l use
onl
y
8 PS+C Annual Report 2019
Directors’ Report continued
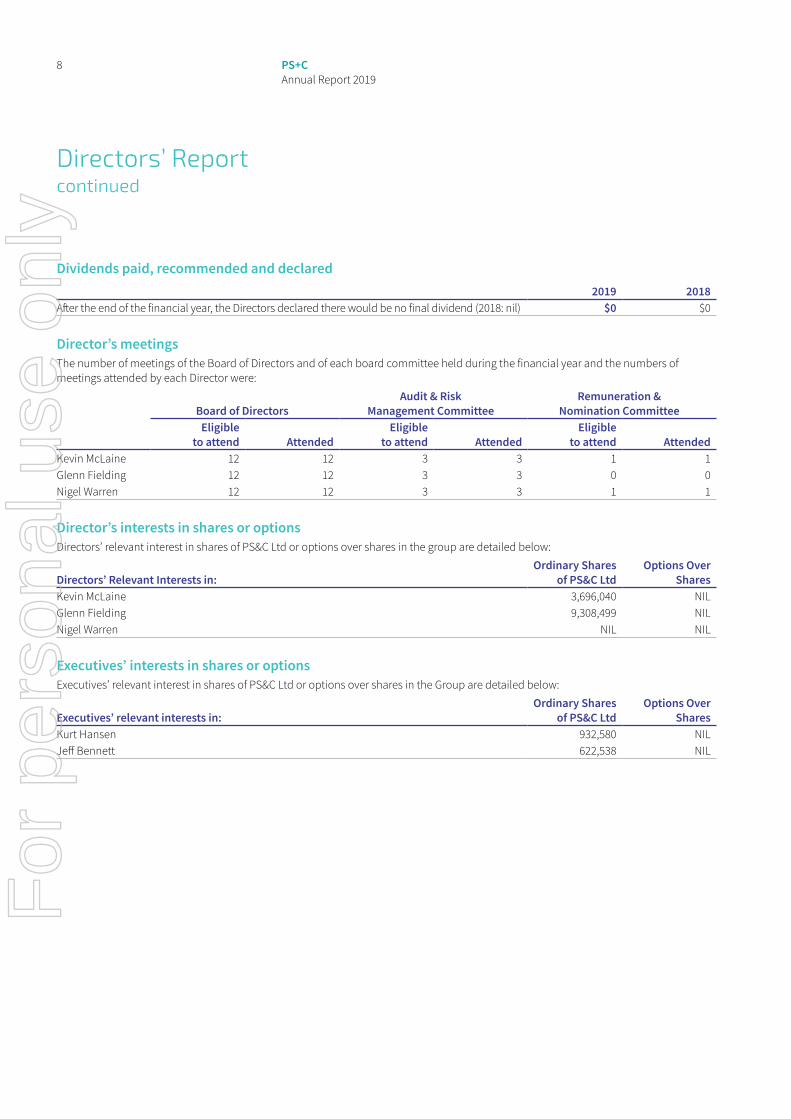
Dividends paid, recommended and declared2019 2018
After the end of the financial year, the Directors declared there would be no final dividend (2018: nil) $0 $0
Director’s meetingsThe number of meetings of the Board of Directors and of each board committee held during the financial year and the numbers of meetings attended by each Director were:
Board of DirectorsAudit & Risk
Management CommitteeRemuneration &
Nomination CommitteeEligible
to attend AttendedEligible
to attend AttendedEligible
to attend AttendedKevin McLaine 12 12 3 3 1 1Glenn Fielding 12 12 3 3 0 0Nigel Warren 12 12 3 3 1 1
Director’s interests in shares or optionsDirectors’ relevant interest in shares of PS&C Ltd or options over shares in the group are detailed below:
Directors’ Relevant Interests in:Ordinary Shares
of PS&C LtdOptions Over
SharesKevin McLaine 3,696,040 NILGlenn Fielding 9,308,499 NILNigel Warren NIL NIL
Executives’ interests in shares or optionsExecutives’ relevant interest in shares of PS&C Ltd or options over shares in the Group are detailed below:
Executives’ relevant interests in:Ordinary Shares
of PS&C LtdOptions Over
SharesKurt Hansen 932,580 NILJeff Bennett 622,538 NIL
For
per
sona
l use
onl
y
9PS+C Annual Report 2019
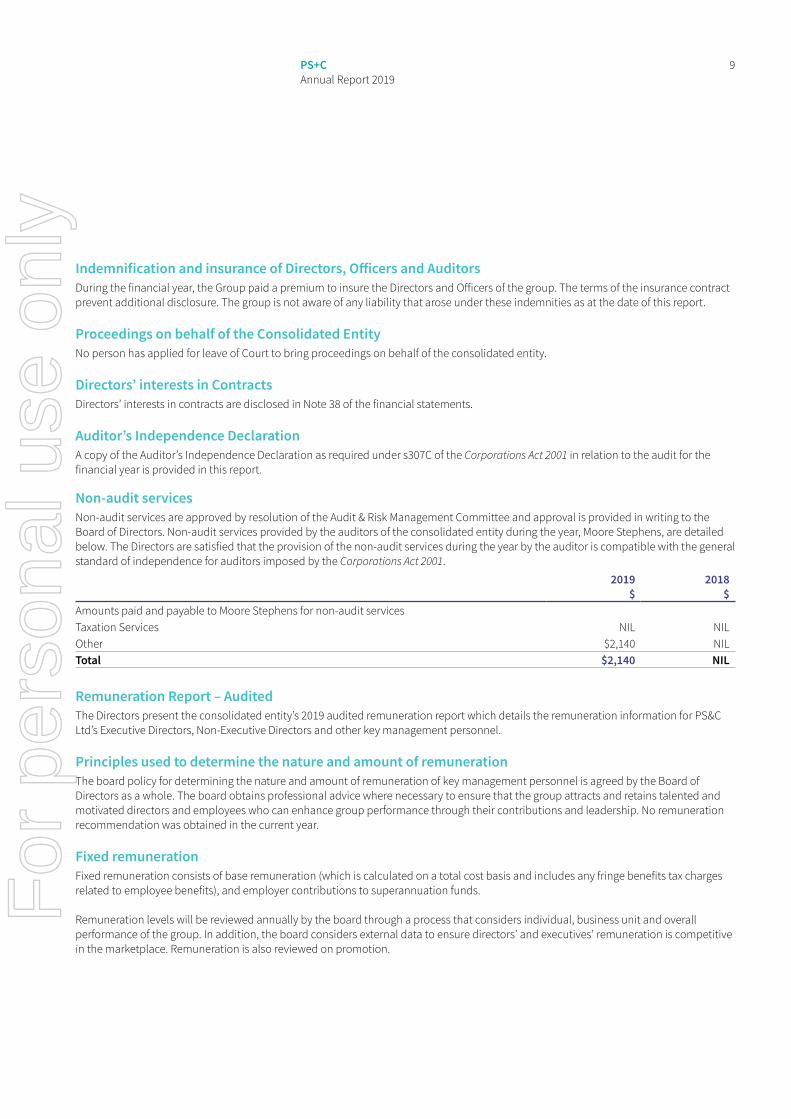
Indemnification and insurance of Directors, Officers and AuditorsDuring the financial year, the Group paid a premium to insure the Directors and Officers of the group. The terms of the insurance contract prevent additional disclosure. The group is not aware of any liability that arose under these indemnities as at the date of this report.
Proceedings on behalf of the Consolidated EntityNo person has applied for leave of Court to bring proceedings on behalf of the consolidated entity.
Directors’ interests in ContractsDirectors’ interests in contracts are disclosed in Note 38 of the financial statements.
Auditor’s Independence DeclarationA copy of the Auditor’s Independence Declaration as required under s307C of the Corporations Act 2001 in relation to the audit for the financial year is provided in this report.
Non-audit servicesNon-audit services are approved by resolution of the Audit & Risk Management Committee and approval is provided in writing to the Board of Directors. Non-audit services provided by the auditors of the consolidated entity during the year, Moore Stephens, are detailed below. The Directors are satisfied that the provision of the non-audit services during the year by the auditor is compatible with the general standard of independence for auditors imposed by the Corporations Act 2001.
2019$
2018$
Amounts paid and payable to Moore Stephens for non-audit servicesTaxation Services NIL NILOther $2,140 NILTotal $2,140 NIL
Remuneration Report – AuditedThe Directors present the consolidated entity’s 2019 audited remuneration report which details the remuneration information for PS&C Ltd’s Executive Directors, Non-Executive Directors and other key management personnel.
Principles used to determine the nature and amount of remunerationThe board policy for determining the nature and amount of remuneration of key management personnel is agreed by the Board of Directors as a whole. The board obtains professional advice where necessary to ensure that the group attracts and retains talented and motivated directors and employees who can enhance group performance through their contributions and leadership. No remuneration recommendation was obtained in the current year.
Fixed remunerationFixed remuneration consists of base remuneration (which is calculated on a total cost basis and includes any fringe benefits tax charges related to employee benefits), and employer contributions to superannuation funds.
Remuneration levels will be reviewed annually by the board through a process that considers individual, business unit and overall performance of the group. In addition, the board considers external data to ensure directors’ and executives’ remuneration is competitive in the marketplace. Remuneration is also reviewed on promotion.
For
per
sona
l use
onl
y
10 PS+C Annual Report 2019
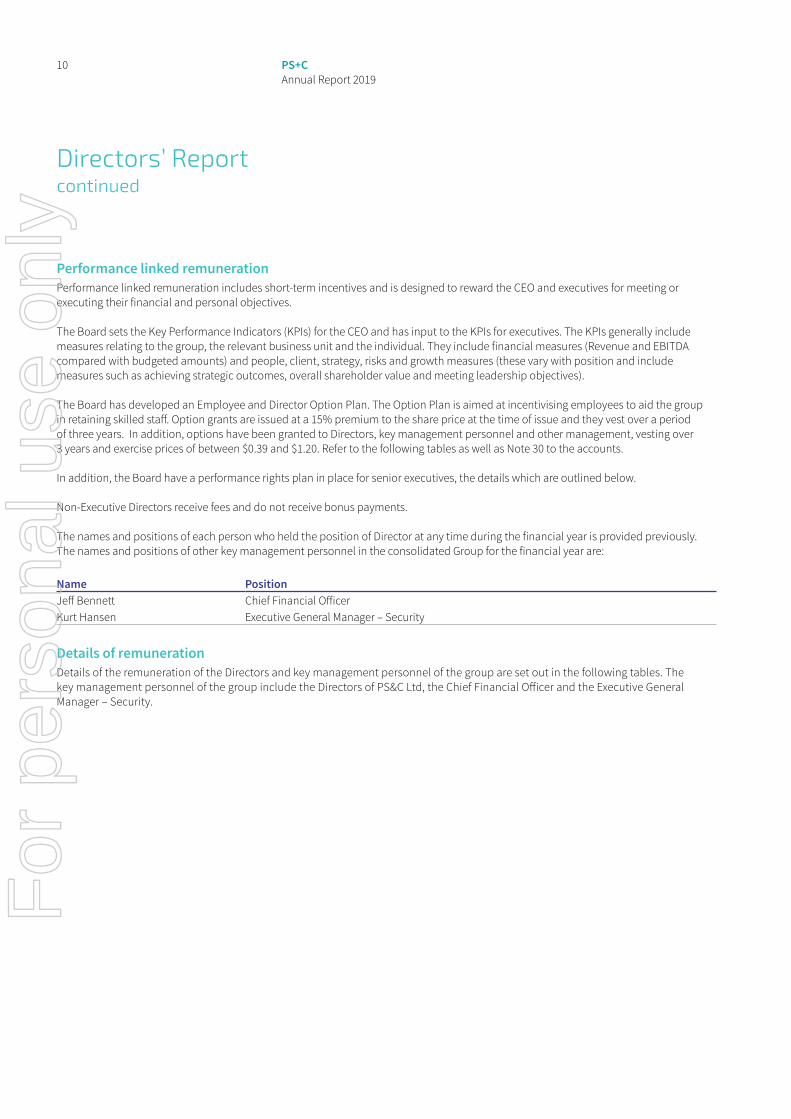
Performance linked remunerationPerformance linked remuneration includes short-term incentives and is designed to reward the CEO and executives for meeting or executing their financial and personal objectives.
The Board sets the Key Performance Indicators (KPIs) for the CEO and has input to the KPIs for executives. The KPIs generally include measures relating to the group, the relevant business unit and the individual. They include financial measures (Revenue and EBITDA compared with budgeted amounts) and people, client, strategy, risks and growth measures (these vary with position and include measures such as achieving strategic outcomes, overall shareholder value and meeting leadership objectives).
The Board has developed an Employee and Director Option Plan. The Option Plan is aimed at incentivising employees to aid the group in retaining skilled staff. Option grants are issued at a 15% premium to the share price at the time of issue and they vest over a period of three years. In addition, options have been granted to Directors, key management personnel and other management, vesting over 3 years and exercise prices of between $0.39 and $1.20. Refer to the following tables as well as Note 30 to the accounts.
In addition, the Board have a performance rights plan in place for senior executives, the details which are outlined below.
Non-Executive Directors receive fees and do not receive bonus payments.
The names and positions of each person who held the position of Director at any time during the financial year is provided previously. The names and positions of other key management personnel in the consolidated Group for the financial year are:
Name PositionJeff Bennett Chief Financial OfficerKurt Hansen Executive General Manager – Security
Details of remunerationDetails of the remuneration of the Directors and key management personnel of the group are set out in the following tables. The key management personnel of the group include the Directors of PS&C Ltd, the Chief Financial Officer and the Executive General Manager – Security.
Directors’ Report continued
For
per
sona
l use
onl
y
11PS+C Annual Report 2019
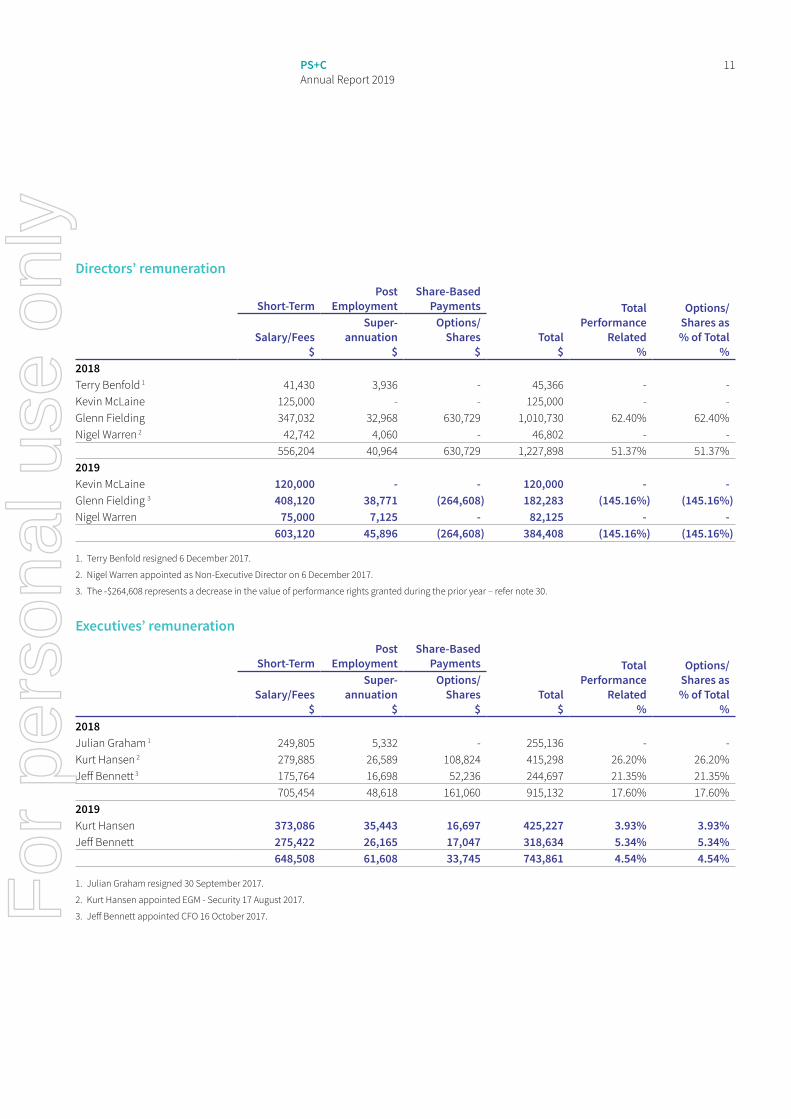
Directors’ remuneration
Short-TermPost
EmploymentShare-Based
Payments
Total$
Total Performance
Related%
Options/ Shares as % of Total
%Salary/Fees
$
Super-annuation
$
Options/ Shares
$2018Terry Benfold 1 41,430 3,936 - 45,366 - -Kevin McLaine 125,000 - - 125,000 - -Glenn Fielding 347,032 32,968 630,729 1,010,730 62.40% 62.40%Nigel Warren 2 42,742 4,060 - 46,802 - -
556,204 40,964 630,729 1,227,898 51.37% 51.37%2019Kevin McLaine 120,000 - - 120,000 - -Glenn Fielding 3 408,120 38,771 (264,608) 182,283 (145.16%) (145.16%)Nigel Warren 75,000 7,125 - 82,125 - -
603,120 45,896 (264,608) 384,408 (145.16%) (145.16%)
1. Terry Benfold resigned 6 December 2017.
2. Nigel Warren appointed as Non-Executive Director on 6 December 2017.
3. The -$264,608 represents a decrease in the value of performance rights granted during the prior year – refer note 30.
Executives’ remuneration
Short-TermPost
EmploymentShare-Based
Payments
Total$
Total Performance
Related%
Options/Shares as % of Total
%Salary/Fees
$
Super-annuation
$
Options/ Shares
$2018Julian Graham 1 249,805 5,332 - 255,136 - -Kurt Hansen 2 279,885 26,589 108,824 415,298 26.20% 26.20%Jeff Bennett 3 175,764 16,698 52,236 244,697 21.35% 21.35%
705,454 48,618 161,060 915,132 17.60% 17.60%2019Kurt Hansen 373,086 35,443 16,697 425,227 3.93% 3.93%Jeff Bennett 275,422 26,165 17,047 318,634 5.34% 5.34%
648,508 61,608 33,745 743,861 4.54% 4.54%
1. Julian Graham resigned 30 September 2017.
2. Kurt Hansen appointed EGM - Security 17 August 2017.
3. Jeff Bennett appointed CFO 16 October 2017.For
per
sona
l use
onl
y
12 PS+C Annual Report 2019
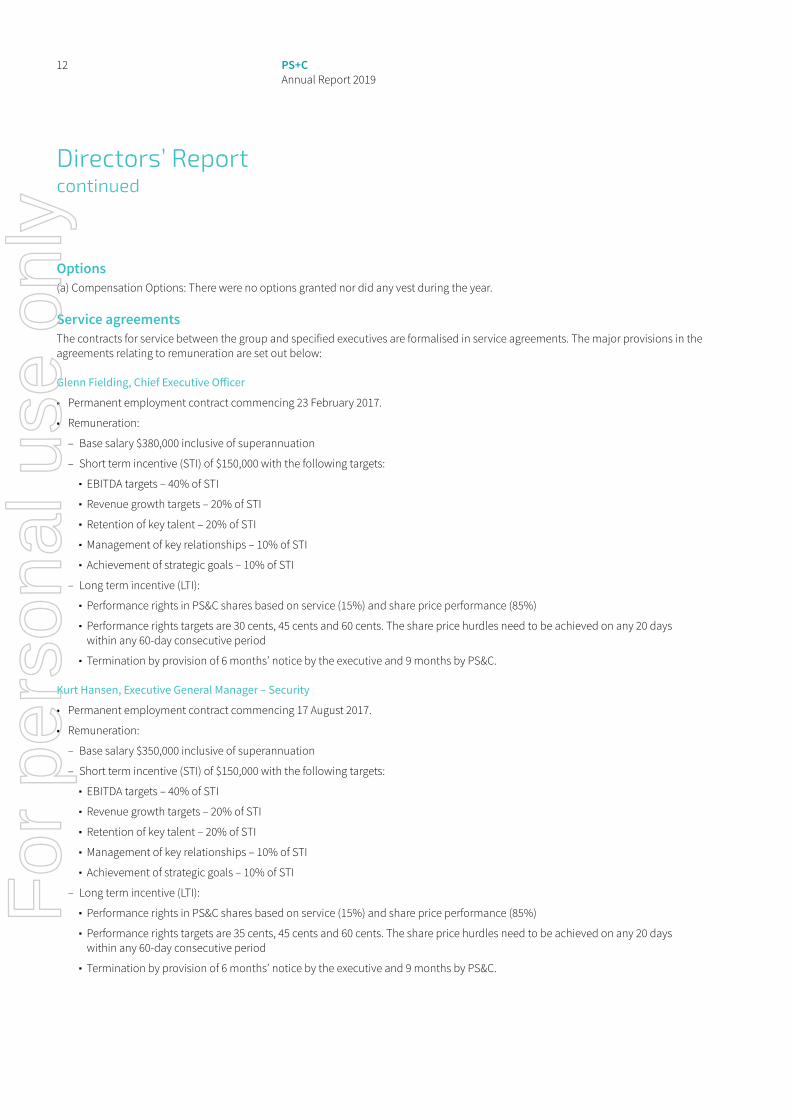
Options(a) Compensation Options: There were no options granted nor did any vest during the year.
Service agreementsThe contracts for service between the group and specified executives are formalised in service agreements. The major provisions in the agreements relating to remuneration are set out below:
Glenn Fielding, Chief Executive Officer
• Permanent employment contract commencing 23 February 2017.
• Remuneration:
– Base salary $380,000 inclusive of superannuation
– Short term incentive (STI) of $150,000 with the following targets: ■ EBITDA targets – 40% of STI ■ Revenue growth targets – 20% of STI ■ Retention of key talent – 20% of STI ■ Management of key relationships – 10% of STI ■ Achievement of strategic goals – 10% of STI
– Long term incentive (LTI): ■ Performance rights in PS&C shares based on service (15%) and share price performance (85%) ■ Performance rights targets are 30 cents, 45 cents and 60 cents. The share price hurdles need to be achieved on any 20 days
within any 60-day consecutive period ■ Termination by provision of 6 months’ notice by the executive and 9 months by PS&C.
Kurt Hansen, Executive General Manager – Security
• Permanent employment contract commencing 17 August 2017.
• Remuneration:
– Base salary $350,000 inclusive of superannuation
– Short term incentive (STI) of $150,000 with the following targets: ■ EBITDA targets – 40% of STI ■ Revenue growth targets – 20% of STI ■ Retention of key talent – 20% of STI ■ Management of key relationships – 10% of STI ■ Achievement of strategic goals – 10% of STI
– Long term incentive (LTI): ■ Performance rights in PS&C shares based on service (15%) and share price performance (85%) ■ Performance rights targets are 35 cents, 45 cents and 60 cents. The share price hurdles need to be achieved on any 20 days
within any 60-day consecutive period ■ Termination by provision of 6 months’ notice by the executive and 9 months by PS&C.
Directors’ Report continued
For
per
sona
l use
onl
y
13PS+C Annual Report 2019
Jeff Bennett, Chief Financial Officer
• Permanent employment contract commencing 16 October 2017.
• Remuneration:
– Base salary $270,000 inclusive of superannuation
– Short term incentive (STI) of $100,000 with the following targets: ■ EBITDA targets – 40% of STI ■ Revenue growth targets – 20% of STI ■ Retention of key talent – 20% of STI ■ Management of key relationships – 10% of STI ■ Achievement of strategic goals – 10% of STI
– Long term incentive (LTI): ■ Performance rights in PS&C shares based on service (15%) and share price performance (85%) ■ Performance rights targets are 35 cents, 45 cents and 60 cents. The share price hurdles need to be achieved on any 20 days
within any 60-day consecutive period ■ Termination by provision of 6 months’ notice by the executive and 9 months by PS&C.
End of Remuneration Report.
Signed in accordance with a resolution of the Directors.
Glenn Fielding CEO, Melbourne
26 September 2019
For
per
sona
l use
onl
y
14 PS+C Annual Report 2019
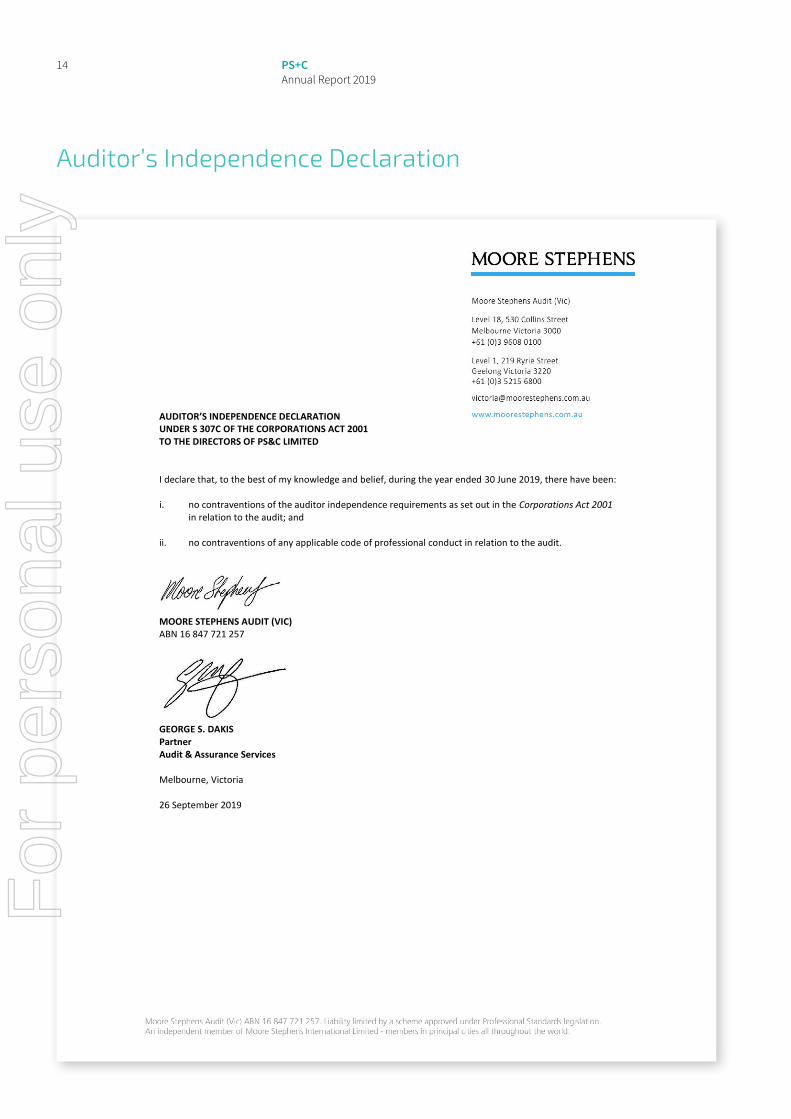
Auditor’s Independence Declaration
AUDITOR’S INDEPENDENCE DECLARATION UNDER S 307C OF THE CORPORATIONS ACT 2001 TO THE DIRECTORS OF PS&C LIMITED I declare that, to the best of my knowledge and belief, during the year ended 30 June 2019, there have been: i. no contraventions of the auditor independence requirements as set out in the Corporations Act 2001
in relation to the audit; and
ii. no contraventions of any applicable code of professional conduct in relation to the audit.
MOORE STEPHENS AUDIT (VIC) ABN 16 847 721 257
GEORGE S. DAKIS Partner Audit & Assurance Services Melbourne, Victoria 26 September 2019
For
per
sona
l use
onl
y

Corporate Governance Statement
The Board of PS&C Limited is committed to adhering to the highest standards of corporate governance. PS&C Limited and its controlled entities have adopted to the third edition of the Corporate Governance Principles and Recommendations which was released by the ASX Corporate Governance Council on 27 March 2014 and became effective for financial years beginning on or after 1 July 2014. PS&C Limited’s Corporate Governance Statement for the financial year ending 30 June 2019 was approved by the Board on 28th August 2019. The Corporate Governance Statement is available on our website at www.pscgroup.com.au/investors/
15PS+C Annual Report 2019
For
per
sona
l use
onl
y
16 PS+C Annual Report 2019
16 PS+C Annual Report 2019
General informationThe financial statements cover PS&C Ltd as a Group consisting of PS&C Ltd and the entities it controlled at the end of, or during, the year. The financial statements are presented in Australian dollars, which is PS&C Ltd’s functional and presentation currency.
PS&C Ltd is a listed public company limited by shares, incorporated and domiciled in Australia. Its registered office and principal place of business is:
Level 10, 410 Collins Street, Melbourne VIC 3000
PS&C Ltd’s Corporate Governance Statement is available on our website at www.pscgroup.com.au
The financial statements were authorised for issue, in accordance with a resolution of directors, on 18 September 2019. The Directors have the power to amend and reissue the financial statements.
Financial Statements30 June 2019
ContentsStatement of Profit or Loss and Other Comprehensive Income 17
Statement of Financial Position 18
Statement of Changes in Equity 19
Statement of Cash Flows 20
Notes to the Financial Statements 21
Directors’ Declaration 58
Independent Auditor’s Report to the Members of PS&C Ltd 59
Shareholder Information 64
For
per
sona
l use
onl
y
17PS+C Annual Report 2019
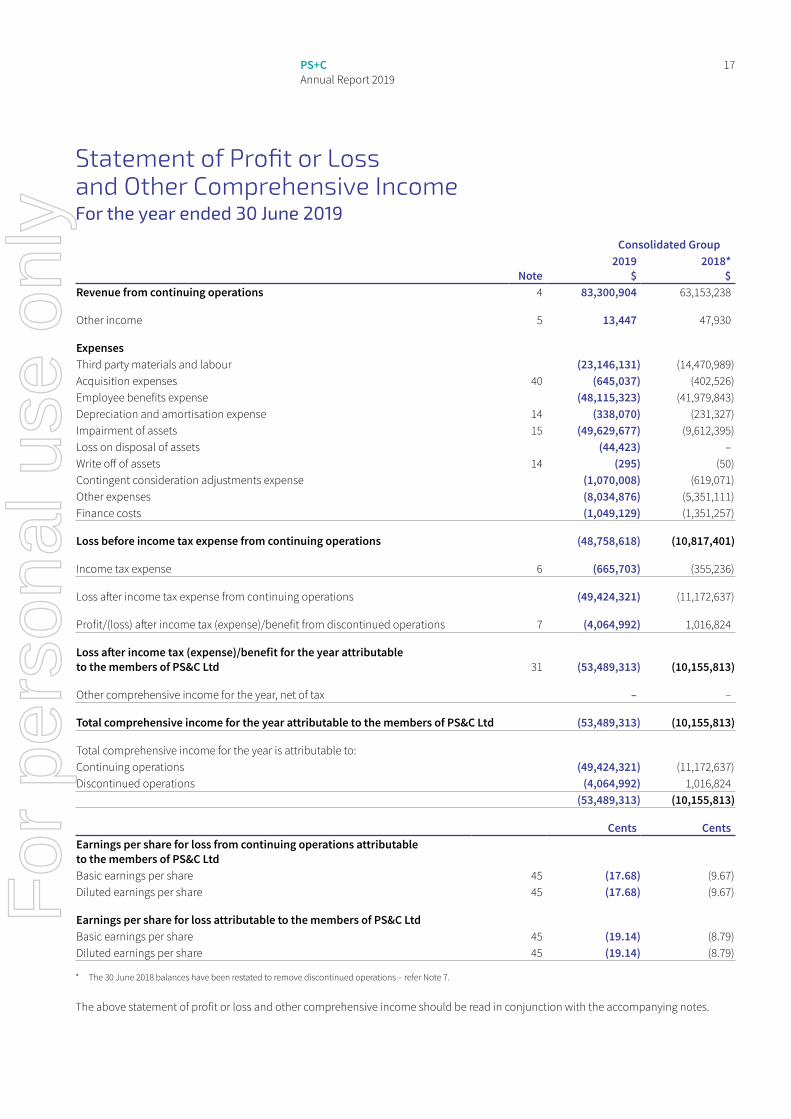
Statement of Profit or Loss and Other Comprehensive IncomeFor the year ended 30 June 2019
Consolidated Group
Note2019
$2018*
$Revenue from continuing operations 4 83,300,904 63,153,238
Other income 5 13,447 47,930
ExpensesThird party materials and labour (23,146,131) (14,470,989)Acquisition expenses 40 (645,037) (402,526)Employee benefits expense (48,115,323) (41,979,843)Depreciation and amortisation expense 14 (338,070) (231,327)Impairment of assets 15 (49,629,677) (9,612,395)Loss on disposal of assets (44,423) – Write off of assets 14 (295) (50)Contingent consideration adjustments expense (1,070,008) (619,071)Other expenses (8,034,876) (5,351,111)Finance costs (1,049,129) (1,351,257)
Loss before income tax expense from continuing operations (48,758,618) (10,817,401)
Income tax expense 6 (665,703) (355,236)
Loss after income tax expense from continuing operations (49,424,321) (11,172,637)
Profit/(loss) after income tax (expense)/benefit from discontinued operations 7 (4,064,992) 1,016,824
Loss after income tax (expense)/benefit for the year attributable to the members of PS&C Ltd 31 (53,489,313) (10,155,813)
Other comprehensive income for the year, net of tax – –
Total comprehensive income for the year attributable to the members of PS&C Ltd (53,489,313) (10,155,813)
Total comprehensive income for the year is attributable to:Continuing operations (49,424,321) (11,172,637)Discontinued operations (4,064,992) 1,016,824
(53,489,313) (10,155,813)
Cents CentsEarnings per share for loss from continuing operations attributable to the members of PS&C LtdBasic earnings per share 45 (17.68) (9.67)Diluted earnings per share 45 (17.68) (9.67)
Earnings per share for loss attributable to the members of PS&C LtdBasic earnings per share 45 (19.14) (8.79)Diluted earnings per share 45 (19.14) (8.79)
* The 30 June 2018 balances have been restated to remove discontinued operations – refer Note 7.
The above statement of profit or loss and other comprehensive income should be read in conjunction with the accompanying notes.
For
per
sona
l use
onl
y
18 PS+C Annual Report 2019
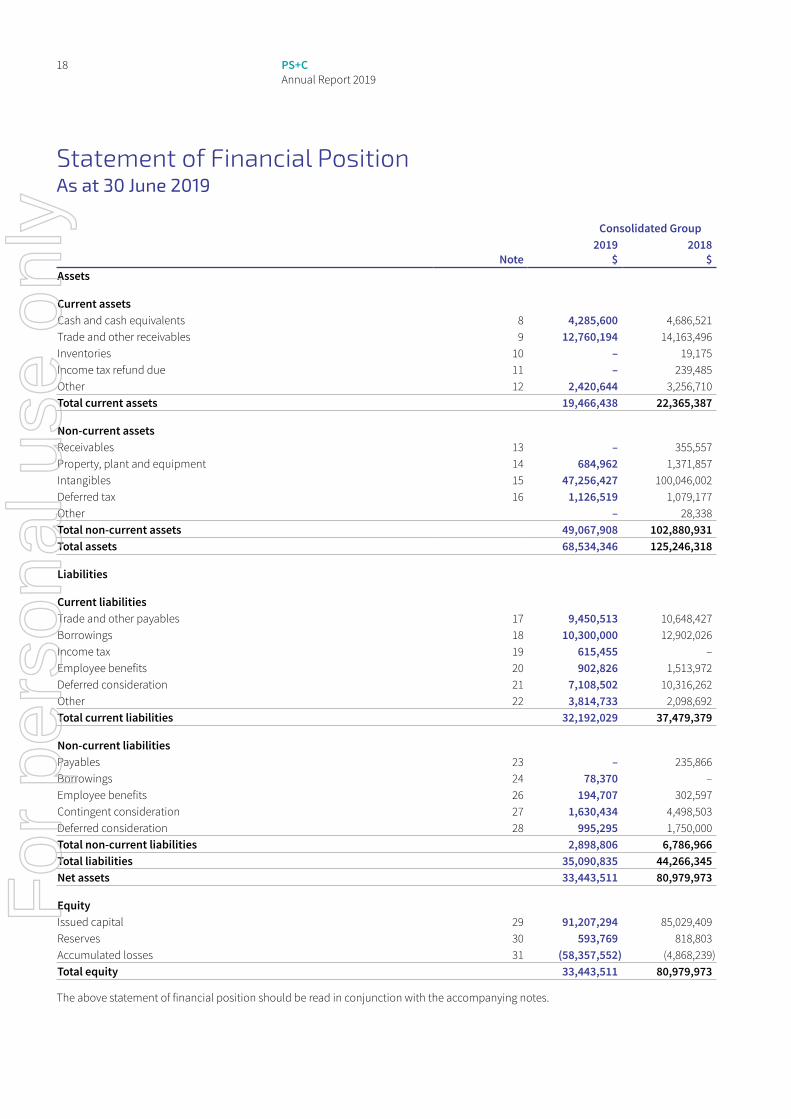
Statement of Financial PositionAs at 30 June 2019
Consolidated Group
Note2019
$2018
$Assets
Current assetsCash and cash equivalents 8 4,285,600 4,686,521 Trade and other receivables 9 12,760,194 14,163,496 Inventories 10 – 19,175 Income tax refund due 11 – 239,485 Other 12 2,420,644 3,256,710 Total current assets 19,466,438 22,365,387
Non-current assetsReceivables 13 – 355,557 Property, plant and equipment 14 684,962 1,371,857 Intangibles 15 47,256,427 100,046,002 Deferred tax 16 1,126,519 1,079,177 Other – 28,338 Total non-current assets 49,067,908 102,880,931 Total assets 68,534,346 125,246,318
Liabilities
Current liabilitiesTrade and other payables 17 9,450,513 10,648,427 Borrowings 18 10,300,000 12,902,026 Income tax 19 615,455 – Employee benefits 20 902,826 1,513,972 Deferred consideration 21 7,108,502 10,316,262 Other 22 3,814,733 2,098,692 Total current liabilities 32,192,029 37,479,379
Non-current liabilitiesPayables 23 – 235,866 Borrowings 24 78,370 – Employee benefits 26 194,707 302,597 Contingent consideration 27 1,630,434 4,498,503 Deferred consideration 28 995,295 1,750,000 Total non-current liabilities 2,898,806 6,786,966 Total liabilities 35,090,835 44,266,345 Net assets 33,443,511 80,979,973
EquityIssued capital 29 91,207,294 85,029,409 Reserves 30 593,769 818,803 Accumulated losses 31 (58,357,552) (4,868,239)Total equity 33,443,511 80,979,973
The above statement of financial position should be read in conjunction with the accompanying notes.
For
per
sona
l use
onl
y
19PS+C Annual Report 2019
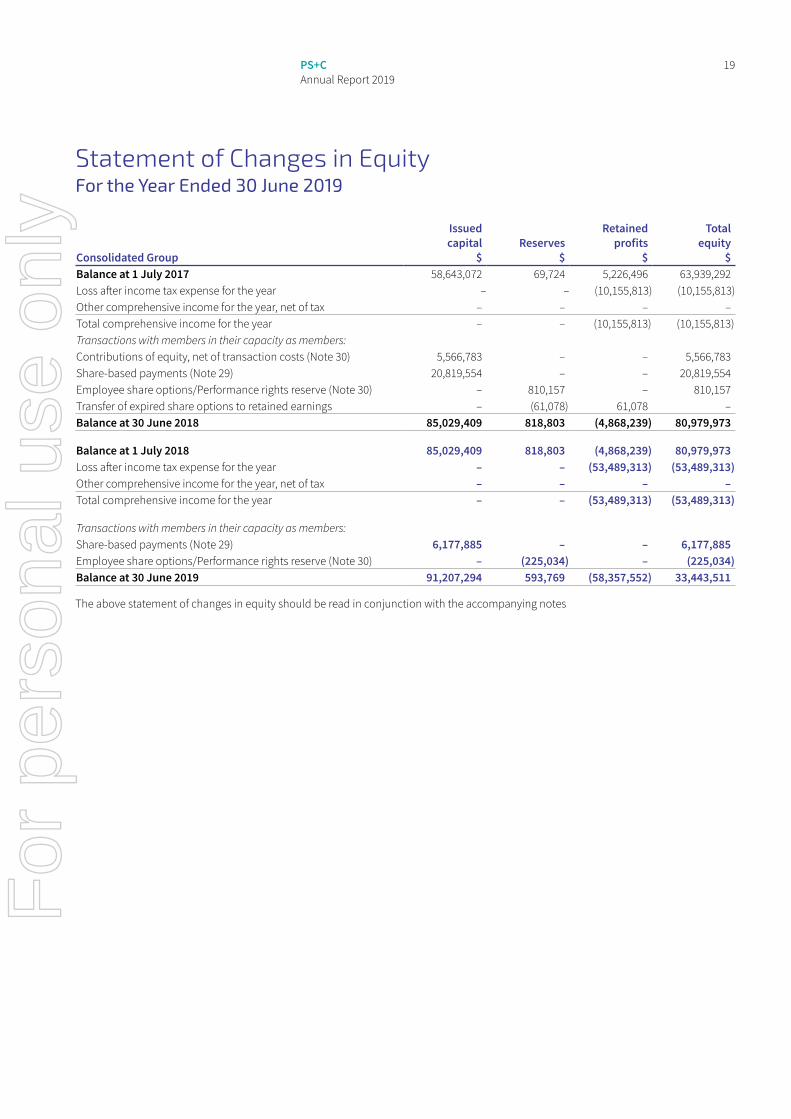
Statement of Changes in EquityFor the Year Ended 30 June 2019
Consolidated Group
Issued capital
$Reserves
$
Retained profits
$
Total equity
$Balance at 1 July 2017 58,643,072 69,724 5,226,496 63,939,292Loss after income tax expense for the year – – (10,155,813) (10,155,813)Other comprehensive income for the year, net of tax – – – –Total comprehensive income for the year – – (10,155,813) (10,155,813)Transactions with members in their capacity as members:Contributions of equity, net of transaction costs (Note 30) 5,566,783 – – 5,566,783Share-based payments (Note 29) 20,819,554 – – 20,819,554Employee share options/Performance rights reserve (Note 30) – 810,157 – 810,157Transfer of expired share options to retained earnings – (61,078) 61,078 –Balance at 30 June 2018 85,029,409 818,803 (4,868,239) 80,979,973
Balance at 1 July 2018 85,029,409 818,803 (4,868,239) 80,979,973Loss after income tax expense for the year – – (53,489,313) (53,489,313)Other comprehensive income for the year, net of tax – – – –Total comprehensive income for the year – – (53,489,313) (53,489,313)
Transactions with members in their capacity as members:Share-based payments (Note 29) 6,177,885 – – 6,177,885Employee share options/Performance rights reserve (Note 30) – (225,034) – (225,034)Balance at 30 June 2019 91,207,294 593,769 (58,357,552) 33,443,511
The above statement of changes in equity should be read in conjunction with the accompanying notes
For
per
sona
l use
onl
y
20 PS+C Annual Report 2019
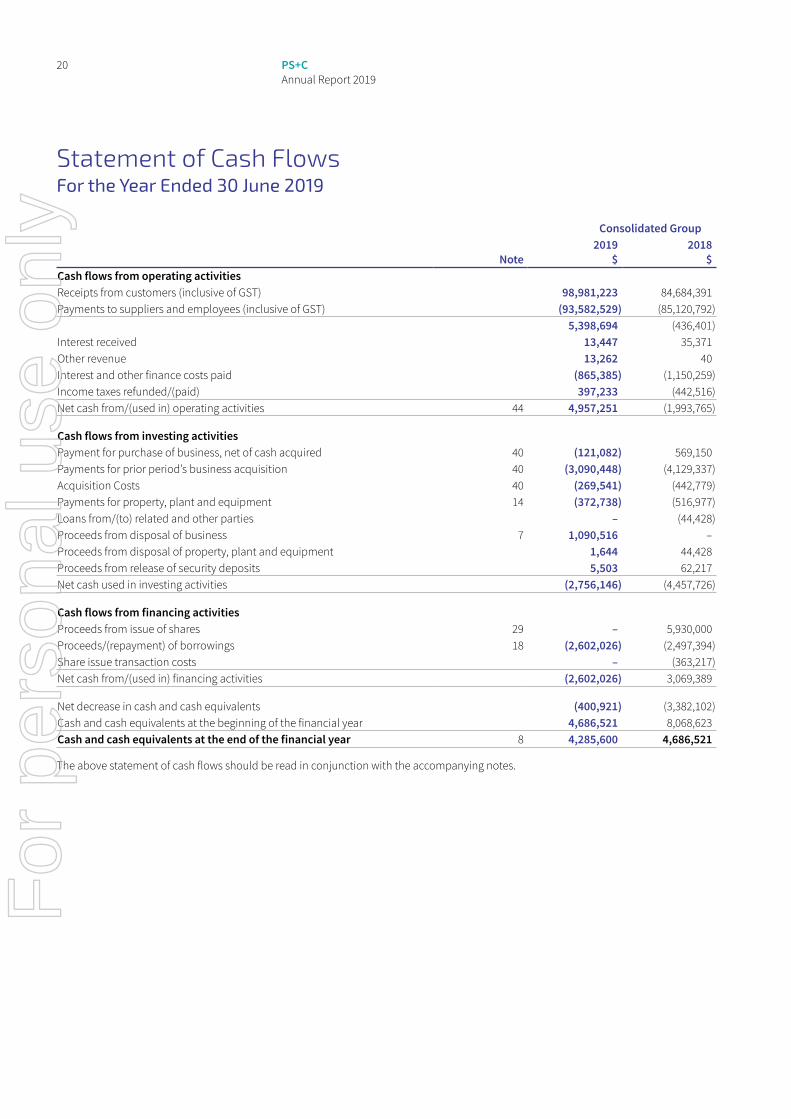
Statement of Cash FlowsFor the Year Ended 30 June 2019
Consolidated Group
Note2019
$2018
$Cash flows from operating activitiesReceipts from customers (inclusive of GST) 98,981,223 84,684,391 Payments to suppliers and employees (inclusive of GST) (93,582,529) (85,120,792)
5,398,694 (436,401)Interest received 13,447 35,371 Other revenue 13,262 40 Interest and other finance costs paid (865,385) (1,150,259)Income taxes refunded/(paid) 397,233 (442,516)Net cash from/(used in) operating activities 44 4,957,251 (1,993,765)
Cash flows from investing activitiesPayment for purchase of business, net of cash acquired 40 (121,082) 569,150 Payments for prior period’s business acquisition 40 (3,090,448) (4,129,337)Acquisition Costs 40 (269,541) (442,779)Payments for property, plant and equipment 14 (372,738) (516,977)Loans from/(to) related and other parties – (44,428)Proceeds from disposal of business 7 1,090,516 – Proceeds from disposal of property, plant and equipment 1,644 44,428 Proceeds from release of security deposits 5,503 62,217 Net cash used in investing activities (2,756,146) (4,457,726)
Cash flows from financing activitiesProceeds from issue of shares 29 – 5,930,000 Proceeds/(repayment) of borrowings 18 (2,602,026) (2,497,394)Share issue transaction costs – (363,217)Net cash from/(used in) financing activities (2,602,026) 3,069,389
Net decrease in cash and cash equivalents (400,921) (3,382,102)Cash and cash equivalents at the beginning of the financial year 4,686,521 8,068,623 Cash and cash equivalents at the end of the financial year 8 4,285,600 4,686,521
The above statement of cash flows should be read in conjunction with the accompanying notes.
For
per
sona
l use
onl
y
21PS+C Annual Report 2019
Notes to the Financial Statements30 June 2019
Note 1. Significant accounting policiesThe principal accounting policies adopted in the preparation of the financial statements are set out below. These policies have been consistently applied to all the years presented, unless otherwise stated.
New or amended Accounting Standards and Interpretations adoptedThe group has adopted all of the new or amended Accounting Standards and Interpretations issued by the Australian Accounting Standards Board (‘AASB’) that are mandatory for the current reporting period.
Any new or amended Accounting Standards or Interpretations that are not yet mandatory have not been early adopted.
The adoption of these Accounting Standards and Interpretations did not have any significant impact on the financial performance or position of the group.
The following Accounting Standards and Interpretations are most relevant to the group:
The group has adopted AASB 9 from 1 January 2018. The standard introduced new classification and measurement models for financial assets. A financial asset shall be measured at amortised cost if it is held within a business model whose objective is to hold assets in order to collect contractual cash flows which arise on specified dates and that are solely principal and interest. A debt investment shall be measured at fair value through other comprehensive income if it is held within a business model whose objective is to both hold assets in order to collect contractual cash flows which arise on specified dates that are solely principal and interest as well as selling the asset on the basis of its fair value. All other financial assets are classified and measured at fair value through profit or loss unless the entity makes an irrevocable election on initial recognition to present gains and losses on equity instruments (that are not held-for-trading or contingent consideration recognised in a business combination) in other comprehensive income (‘OCI’). Despite these requirements, a financial asset may be irrevocably designated as measured at fair value through profit or loss to reduce the effect of, or eliminate, an accounting mismatch. For financial liabilities designated at fair value through profit or loss, the standard requires the portion of the change in fair value that relates to the entity’s own credit risk to be presented in OCI (unless it would create an accounting mismatch). New simpler hedge accounting requirements are intended to more closely align the accounting treatment with the risk management activities of the entity. New impairment requirements use an ‘expected credit loss’ (‘ECL’) model to recognise an allowance. Impairment is measured using a 12-month ECL method unless the credit risk on a financial instrument has increased significantly since initial recognition in which case the lifetime ECL method is adopted. For receivables, a simplified approach to measuring expected credit losses using a lifetime expected loss allowance is available.
The group has adopted AASB 15 from 1 January 2018. The standard provides a single comprehensive model for revenue recognition. The core principle of the standard is that an entity shall recognise revenue to depict the transfer of promised goods or services to customers at an amount that reflects the consideration to which the entity expects to be entitled in exchange for those goods or services. The standard introduced a new contract-based revenue recognition model with a measurement approach that is based on an allocation of the transaction price. This is described further in the accounting policies below. Credit risk is presented separately as an expense rather than adjusted against revenue. Contracts with customers are presented in an entity’s statement of financial position as a contract liability, a contract asset, or a receivable, depending on the relationship between the entity’s performance and the customer’s payment. Customer acquisition costs and costs to fulfil a contract can, subject to certain criteria, be capitalised as an asset and amortised over the contract period.
Basis of preparation
Historical cost convention
The financial statements have been prepared under the historical cost convention, except for, where applicable, the revaluation of financial assets and liabilities at fair value through profit or loss, financial assets at fair value through other comprehensive income, investment properties, certain classes of property, plant and equipment and derivative financial instruments.
Critical accounting estimates
The preparation of the financial statements requires the use of certain critical accounting estimates. It also requires management to exercise its judgement in the process of applying the group’s accounting policies. The areas involving a higher degree of judgement or complexity, or areas where assumptions and estimates are significant to the financial statements, are disclosed in Note 2.
For
per
sona
l use
onl
y
22 PS+C Annual Report 2019
Notes to the Financial Statements continued30 June 2019
Note 1. Significant accounting policies continued
Going concernThe consolidated financial statements have been prepared on a going concern basis, which assumes the continuity of normal business activities and the settlement of liabilities in the normal course of business. During the year ended 30 June 2019, the group incurred a net loss after tax of $53,489,313 (2018: loss of $10,155,815) and at that date, the group’s current liabilities exceeded its current assets by $12,725,591. The above has been impacted by a $49,629,677 intangible asset impairment charge and the classification of the group’s borrowings of $10,300,000 as a current liability.
In determining that the going concern basis is appropriate, the Directors have had regard to:
• The group has entered into an agreement with Scottish Pacific Business Finance Pty Ltd (‘Scottish Pacific’) to provide a receivables backed financing facility with a funding limit up to $15,000,000 – Refer Note 43: Subsequent Events;
• The group successfully renegotiated the terms of its borrowings payable to ANZ after a $5,000,000 repayment in July 2019. The group’s bank facility expires in December 2019 – Refer Note 43: Subsequent Events;
• The group’s cash flow forecast and budgets for the next 12 months show positive operating cash flows and an improvement in profitability/increased EBITDA;
• The group has positive net cash inflows from operating activities;
• The group’s ability to raise equity; and
• The group’s ability to divest business segments.
The group’s ability to continue to operate as a going concern is dependent upon the items listed above. Should these events not occur as anticipated, the group may not be able to pursue its business objectives and will have difficulty continuing to operate as a going concern, including realising its assets and extinguishing its liabilities at the amounts shown in the financial statements.
Parent entity informationIn accordance with the Corporations Act 2001, these financial statements present the results of the group only. Supplementary information about the parent entity is disclosed in Note 39.
Principles of consolidationThe consolidated financial statements incorporate the assets and liabilities of all subsidiaries of PS&C Ltd (‘company’ or ‘parent entity’) as at 30 June 2019 and the results of all subsidiaries for the year then ended. PS&C Ltd and its subsidiaries together are referred to in these financial statements as the ‘group’.
Subsidiaries are all those entities over which the group has control. The group controls an entity when the group is exposed to, or has rights to, variable returns from its involvement with the entity and has the ability to affect those returns through its power to direct the activities of the entity. Subsidiaries are fully consolidated from the date on which control is transferred to the group. They are de-consolidated from the date that control ceases.
Intercompany transactions, balances and unrealised gains on transactions between entities in the group are eliminated. Unrealised losses are also eliminated unless the transaction provides evidence of the impairment of the asset transferred. Accounting policies of subsidiaries have been changed where necessary to ensure consistency with the policies adopted by the group.
The acquisition of subsidiaries is accounted for using the acquisition method of accounting. A change in ownership interest, without the loss of control, is accounted for as an equity transaction, where the difference between the consideration transferred and the book value of the share of the non-controlling interest acquired is recognised directly in equity attributable to the parent.
Where the group loses control over a subsidiary, it derecognises the assets including goodwill, liabilities and non-controlling interest in the subsidiary together with any cumulative translation differences recognised in equity. The group recognises the fair value of the consideration received and the fair value of any investment retained together with any gain or loss in profit or loss.
For
per
sona
l use
onl
y
23PS+C Annual Report 2019
Operating segmentsOperating segments are determined by distinguishable components whereby the risk and returns are different from the other segments.
Revenue recognitionThe group adopted AASB 15 Revenue from Contracts with Customers from 1 July 2018. AASB 15 provides (other than in relation to some specific exceptions, such as lease contracts and insurance contracts) a single source of accounting requirements for all contracts with customers, thereby replacing all current accounting pronouncements on revenue.
The core principle of AASB 15 is that an entity recognises revenue to depict the transfer of promised goods or services to a customer in an amount that reflects the consideration to which the entity expects to be entitled in exchange for those goods or services. Accordingly, in contrast to the approach under AASB 118 Revenue, AASB 15 does not prescribe different patterns of revenue recognition depending on whether the entity provides a good or service to the customer.
The group adopted AASB 15 with no material impact resulting to revenue.
Revenue arises mainly from consulting and IT services, the sale of security software and contracts for penetration testing of computer systems.
The group recognises contract liabilities for consideration received in respect of unsatisfied performance obligations and reports these amounts as other liabilities in the statement of financial position. Similarly, if the group satisfies a performance obligation before it receives the consideration, the group recognises either a contract asset or a receivable in its statement of financial position, depending on whether something other than the passage of time is required before the consideration is due.
Consulting and IT services
The group provides consulting services relating to ICT projects, contractor management, recruitment, business transformation, digital strategies and IT security and Assurance services. Revenue from these services is recognised on a time-and-materials basis as the services are provided. Customers are invoiced monthly as work progresses. Any amounts remaining unbilled at the end of a reporting period are presented in the statement of financial position as accounts receivable as only the passage of time is required before payment of these amounts will be due as accrued revenue.
Sale of software
Revenue from the sale of software for a fixed fee is recognised when or as the group transfers control of the assets to the customer. Invoices for goods or services transferred are due upon receipt by the customer. Amounts disclosed are net of sales returns and trade discounts.
Penetration testing
The group provides penetration testing services to evaluate the security of computer systems. Revenue from these services is contractual and recognised as the services are provided. Customers are invoiced upon completion of the work. Any amounts remaining unbilled at the end of a reporting period are presented in the statement of financial position as accounts receivable as only the passage of time is required before payment of these amounts will be due as accrued revenue.
Interest
Interest revenue is recognised as interest accrues using the effective interest method. This is a method of calculating the amortised cost of a financial asset and allocating the interest income over the relevant period using the effective interest rate, which is the rate that exactly discounts estimated future cash receipts through the expected life of the financial asset to the net carrying amount of the financial asset.
Other revenue
Other revenue is recognised when it is received or when the right to receive payment is established.For
per
sona
l use
onl
y
24 PS+C Annual Report 2019
Notes to the Financial Statements continued30 June 2019
Note 1. Significant accounting policies continued
Income taxThe income tax expense or benefit for the period is the tax payable on that period’s taxable income based on the applicable income tax rate for each jurisdiction, adjusted by the changes in deferred tax assets and liabilities attributable to temporary differences, unused tax losses and the adjustment recognised for prior periods, where applicable.
Deferred tax assets and liabilities are recognised for temporary differences at the tax rates expected to be applied when the assets are recovered or liabilities are settled, based on those tax rates that are enacted or substantively enacted, except for:
• When the deferred income tax asset or liability arises from the initial recognition of goodwill or an asset or liability in a transaction that is not a business combination and that, at the time of the transaction, affects neither the accounting nor taxable profits; or
• When the taxable temporary difference is associated with interests in subsidiaries, associates or joint ventures, and the timing of the reversal can be controlled and it is probable that the temporary difference will not reverse in the foreseeable future.
Deferred tax assets are recognised for deductible temporary differences and unused tax losses only if it is probable that future taxable amounts will be available to utilise those temporary differences and losses.
The carrying amount of recognised and unrecognised deferred tax assets are reviewed at each reporting date. Deferred tax assets recognised are reduced to the extent that it is no longer probable that future taxable profits will be available for the carrying amount to be recovered. Previously unrecognised deferred tax assets are recognised to the extent that it is probable that there are future taxable profits available to recover the asset.
Deferred tax assets and liabilities are offset only where there is a legally enforceable right to offset current tax assets against current tax liabilities and deferred tax assets against deferred tax liabilities; and they relate to the same taxable authority on either the same taxable entity or different taxable entities which intend to settle simultaneously.
A discontinued operation is a component of the group that has been disposed of or is classified as held for sale and that represents a separate major line of business or geographical area of operations, is part of a single co-ordinated plan to dispose of such a line of business or area of operations, or is a subsidiary acquired exclusively with a view to resale. The results of discontinued operations are presented separately on the face of the statement of profit or loss and other comprehensive income.
Assets and liabilities are presented in the statement of financial position based on current and non-current classification.
An asset is classified as current when: it is either expected to be realised or intended to be sold or consumed in the group’s normal operating cycle; it is held primarily for the purpose of trading; it is expected to be realised within 12 months after the reporting period; or the asset is cash or cash equivalent unless restricted from being exchanged or used to settle a liability for at least 12 months after the reporting period. All other assets are classified as non-current.
A liability is classified as current when: it is either expected to be settled in the group’s normal operating cycle; it is held primarily for the purpose of trading; it is due to be settled within 12 months after the reporting period; or there is no unconditional right to defer the settlement of the liability for at least 12 months after the reporting period. All other liabilities are classified as non-current.
Deferred tax assets and liabilities are always classified as non-current.
Cash and cash equivalentsCash and cash equivalents includes cash on hand, deposits held at call with financial institutions, other short-term, highly liquid investments with original maturities of three months or less that are readily convertible to known amounts of cash and which are subject to an insignificant risk of changes in value.
Financial Instruments
Initial recognition and measurement
Financial assets and liabilities are recognised when the group becomes a party to the contractual provisions of the instrument. For financial assets, this is the equivalent to the date that the group commits itself to either the purchase or sale of the asset (i.e. trade date accounting is adopted).
Financial instruments are initially measured at fair value adjusted for transaction costs, except where the instrument is classified as fair value through profit or loss, in which case the transaction costs are immediately recognised as expenses in profit or loss.
For
per
sona
l use
onl
y
25PS+C Annual Report 2019
Classification of financial assets
Financial assets recognised by the group are subsequently measured in their entirety at either amortised cost or fair value, subject to their classification and whether the group irrevocably designates the financial asset on initial recognition at fair value through other comprehensive income in accordance with the relevant criteria in AASB 9.
Financial assets not irrevocably designated on initial recognition at fair value through other comprehensive income are classified as subsequently measured at amortised cost, fair value through other comprehensive income or fair value through profit or loss on the basis of both:
(a) the group’s business model for managing the financial assets; and(b) the contractual cash flow characteristics of the financial asset.
Classification of financial liabilities
Financial liabilities as held for trading, contingent consideration payable by the group for the acquisition of a business and financial liabilities designated at fair value through the profit or loss, are subsequently measured at fair value.
All other financial liabilities recognised by the group are subsequently measured at amortised cost.
Trade and other receivables
Trade receivables are initially recognised at fair value and subsequently measured at amortised cost using the effective interest method, less any allowance for expected credit losses. Trade receivables are generally due for settlement within 30 days.
Impairment of financial assets
The following financial assets are tested for impairment by applying the ‘expected credit loss’ impairment model:
(a) debt instruments measured at amortised cost;(b) debt instruments classified at fair value through other comprehensive income; and (c) receivables from contracts with customers and contract assets.
The group applies the simplified approach under AASB 9 to measuring the allowance for credit losses for both receivables from contracts with customers and contract assets. Under the AASB 9 simplified approach, the group determines the allowance for credit losses for receivables from contracts with customers and contract assets on the basis of the lifetime of expected credit losses of the financial asset. Lifetime expected credit losses represent the expected credit losses that are expected to result from default events over the expected life of the financial asset.
For all other financial assets subject to impairment testing, when there has been a significant increase in credit risk since the initial recognition of the financial asset, the allowance for credit losses is recognised on the basis of the lifetime expected credit losses. Where there has not been an increase in credit risk since initial recognition, the allowance for credit losses is recognised on the basis of 12-month expected credit losses. ‘12-month expected credit losses’ is the portion of lifetime expected credit losses that represent the expected credit losses that result from default events on a financial instrument that are possible within the 12 months after the reporting date.
The group consider a range of information when assessing whether the credit risk has increased significantly since initial recognition. This includes such factors as the identification of significant changes in external market indicators of credit risk, significant adverse changes in the financial performance or financial position of the counterparty, significant changes in the value of collateral, and past due information.
The group assumes that the credit risk on a financial asset has not increased significantly since initial recognition when the financial asset is determined to have a low credit risk at the reporting date. The group considers a financial asset to have a low credit risk when the counterparty has an external ‘investment grade’ credit rating (if available) of BBB or higher, or otherwise is assessed by the group to have a strong financial position and no history of past due amounts from previous transactions with the group.
The group assumes that the credit risk on a financial instrument has increased significantly since initial recognition when contractual payments are more than 30 days past due.
The group determines expected credit losses using a provision matrix based on the group’s historical credit loss experience, adjusted for factors that are specific to the financial asset as well as current and future expected economic conditions relevant to the financial asset. When material, the time value of money is incorporated into the measurement of expected credit losses. There has been no change in the estimation techniques or significant assumptions made during the reporting period.
For
per
sona
l use
onl
y
26 PS+C Annual Report 2019
Notes to the Financial Statements continued30 June 2019
Note 1. Significant accounting policies continued
Financial Instruments continued
Impairment of financial assets continued
The group has identified contractual payments more than 90 days past due as default events for the purpose of measuring expected credit losses. These default events have been selected based on the group’s historical experience. Because contract assets are directly related to unbilled work in progress, contract assets have a similar credit risk profile to receivables from contracts with customers. Accordingly, the group applies the same approach to measuring expected credit losses of receivables from contracts with customers as it does to measuring impairment losses on contract assets.
The measurement of expected credit losses reflects the group’s ‘expected rate of loss’, which is a product of the probability of default and the loss given default, and its ‘exposure at default’, which is typically the carrying amount of the relevant asset. Expected credit losses are measured as the difference between all contractual cash flows due and all contractual cash flows expected based on the group’s exposure at default, discounted at the financial asset’s original effective interest rate.
Financial assets are regarded as ‘credit-impaired’ when one or more events have occurred that have a detrimental impact on the estimated future cash flows of the financial asset. Indicators that a financial asset is ‘credit-impaired’ include observable data about the following:
(a) significant financial difficulty of the issuer or the borrower;(b) breach of contract;(c) the lender, for economic or contractual reasons relating to the borrower’s financial difficulty, has granted concessions to the borrower
that the lender would not otherwise consider; or(d) it is becoming probable that the borrower will enter bankruptcy or other financial reorganisation.
The gross carrying amount of a financial asset is written off (i.e., reduced directly) when the counterparty is in severe financial difficulty and the group has no realistic expectation of recovery of the financial asset. Financial assets written off remain subject to enforcement action by the group. Recoveries, if any, are recognised in profit or loss.
InventoriesStock on hand is stated at the lower of cost and net realisable value. Cost comprises of purchase and delivery costs, net of rebates and discounts received or receivable.
Net realisable value is the estimated selling price in the ordinary course of business less the estimated costs of completion and the estimated costs necessary to make the sale.
Property, plant and equipmentPlant and equipment is stated at historical cost less accumulated depreciation and impairment. Historical cost includes expenditure that is directly attributable to the acquisition of the items.
Depreciation is calculated on a straight-line basis to write off the net cost of each item of property, plant and equipment (excluding land) over their expected useful lives as follows:
Leasehold improvements 3 – 5 yearsPlant and equipment 2.5 – 5 years
The residual values, useful lives and depreciation methods are reviewed, and adjusted if appropriate, at each reporting date.
An item of property, plant and equipment is derecognised upon disposal or when there is no future economic benefit to the group. Gains and losses between the carrying amount and the disposal proceeds are taken to profit or loss. Any revaluation surplus reserve relating to the item disposed of is transferred directly to retained profits.
Intangible assets
Goodwill
Goodwill arises on the acquisition of a business. Goodwill is not amortised. Instead, goodwill is tested annually for impairment, or more frequently if events or changes in circumstances indicate that it might be impaired, and is carried at cost less accumulated impairment losses. Impairment losses on goodwill are taken to profit or loss and are not subsequently reversed.
For
per
sona
l use
onl
y
27PS+C Annual Report 2019
Goodwill and other intangible assets that have an indefinite useful life are not subject to amortisation and are tested annually for impairment, or more frequently if events or changes in circumstances indicate that they might be impaired. Other non-financial assets are reviewed for impairment whenever events or changes in circumstances indicate that the carrying amount may not be recoverable. An impairment loss is recognised for the amount by which the asset’s carrying amount exceeds its recoverable amount.
Recoverable amount is the higher of an asset’s fair value less costs of disposal and value-in-use. The value-in-use is the present value of the estimated future cash flows relating to the asset using a pre-tax discount rate specific to the asset or cash-generating unit to which the asset belongs. Assets that do not have independent cash flows are grouped together to form a cash-generating unit.
Trade and other payablesThese amounts represent liabilities for goods and services provided to the group prior to the end of the financial year and which are unpaid. Due to their short-term nature they are measured at amortised cost and are not discounted. The amounts are unsecured and are usually paid within 30 days of recognition.
Finance costsFinance costs attributable to qualifying assets are capitalised as part of the asset. All other finance costs are expensed in the period in which they are incurred.
ProvisionsProvisions are recognised when the group has a present (legal or constructive) obligation as a result of a past event, it is probable the group will be required to settle the obligation, and a reliable estimate can be made of the amount of the obligation. The amount recognised as a provision is the best estimate of the consideration required to settle the present obligation at the reporting date, taking into account the risks and uncertainties surrounding the obligation. If the time value of money is material, provisions are discounted using a current pre-tax rate specific to the liability. The increase in the provision resulting from the passage of time is recognised as a finance cost.
Employee benefits
Short-term employee benefits
Liabilities for wages and salaries, including non-monetary benefits, annual leave and long service leave expected to be settled wholly within 12 months of the reporting date are measured at the amounts expected to be paid when the liabilities are settled.
Other long-term employee benefits
The liability for annual leave and long service leave not expected to be settled within 12 months of the reporting date are measured as the present value of expected future payments to be made in respect of services provided by employees up to the reporting date using the projected unit credit method. Consideration is given to expected future wage and salary levels, experience of employee departures and periods of service. Expected future payments are discounted using market yields at the reporting date on corporate bonds with terms to maturity and currency that match, as closely as possible, the estimated future cash outflows.
Share-based payments
Equity-settled and cash-settled share-based compensation benefits are provided to employees.
Equity-settled transactions are awards of shares, or options over shares, that are provided to employees in exchange for the rendering of services. Cash-settled transactions are awards of cash for the exchange of services, where the amount of cash is determined by reference to the share price.
The cost of equity-settled transactions are measured at fair value on grant date. Fair value is independently determined using either the Binomial or Black-Scholes option pricing model that takes into account the exercise price, the term of the option, the impact of dilution, the share price at grant date and expected price volatility of the underlying share, the expected dividend yield and the risk free interest rate for the term of the option, together with non-vesting conditions that do not determine whether the group receives the services that entitle the employees to receive payment. No account is taken of any other vesting conditions.
The cost of equity-settled transactions are recognised as an expense with a corresponding increase in equity over the vesting period. The cumulative charge to profit or loss is calculated based on the grant date fair value of the award, the best estimate of the number of awards that are likely to vest and the expired portion of the vesting period. The amount recognised in profit or loss for the period is the cumulative amount calculated at each reporting date less amounts already recognised in previous periods.
For
per
sona
l use
onl
y
28 PS+C Annual Report 2019
Notes to the Financial Statements continued30 June 2019
Note 1. Significant accounting policies continued
Employee benefits continued
Share-based payments continued
The cost of cash-settled transactions is initially, and at each reporting date until vested, determined by applying either the Binomial or Black-Scholes option pricing model, taking into consideration the terms and conditions on which the award was granted. The cumulative charge to profit or loss until settlement of the liability is calculated as follows:
• during the vesting period, the liability at each reporting date is the fair value of the award at that date multiplied by the expired portion of the vesting period.
• from the end of the vesting period until settlement of the award, the liability is the full fair value of the liability at the reporting date.
All changes in the liability are recognised in profit or loss. The ultimate cost of cash-settled transactions is the cash paid to settle the liability.
Market conditions are taken into consideration in determining fair value. Therefore any awards subject to market conditions are considered to vest irrespective of whether or not that market condition has been met, provided all other conditions are satisfied.
If equity-settled awards are modified, as a minimum an expense is recognised as if the modification has not been made. An additional expense is recognised, over the remaining vesting period, for any modification that increases the total fair value of the share-based compensation benefit as at the date of modification.
If the non-vesting condition is within the control of the group or employee, the failure to satisfy the condition is treated as a cancellation. If the condition is not within the control of the group or employee and is not satisfied during the vesting period, any remaining expense for the award is recognised over the remaining vesting period, unless the award is forfeited.
If equity-settled awards are cancelled, it is treated as if it has vested on the date of cancellation, and any remaining expense is recognised immediately. If a new replacement award is substituted for the cancelled award, the cancelled and new award is treated as if they were a modification.
Fair value measurementWhen an asset or liability, financial or non-financial, is measured at fair value for recognition or disclosure purposes, the fair value is based on the price that would be received to sell an asset or paid to transfer a liability in an orderly transaction between market participants at the measurement date; and assumes that the transaction will take place either: in the principal market; or in the absence of a principal market, in the most advantageous market.
Fair value is measured using the assumptions that market participants would use when pricing the asset or liability, assuming they act in their economic best interests. For non-financial assets, the fair value measurement is based on its highest and best use. Valuation techniques that are appropriate in the circumstances and for which sufficient data are available to measure fair value, are used, maximising the use of relevant observable inputs and minimising the use of unobservable inputs.
Issued capitalOrdinary shares are classified as equity.
Incremental costs directly attributable to the issue of new shares or options are shown in equity as a deduction, net of tax, from the proceeds.
Business combinationsThe acquisition method of accounting is used to account for business combinations regardless of whether equity instruments or other assets are acquired.
The consideration transferred is the sum of the acquisition-date fair values of the assets transferred, equity instruments issued or liabilities incurred by the acquirer to former owners of the acquiree and the amount of any non-controlling interest in the acquiree. For each business combination, the non-controlling interest in the acquiree is measured at either fair value or at the proportionate share of the acquiree’s identifiable net assets. All acquisition costs are expensed as incurred to profit or loss.
For
per
sona
l use
onl
y
29PS+C Annual Report 2019
On the acquisition of a business, the group assesses the financial assets acquired and liabilities assumed for appropriate classification and designation in accordance with the contractual terms, economic conditions, the group’s operating or accounting policies and other pertinent conditions in existence at the acquisition-date.
Where the business combination is achieved in stages, the group remeasures its previously held equity interest in the acquiree at the acquisition-date fair value and the difference between the fair value and the previous carrying amount is recognised in profit or loss.
Contingent consideration to be transferred by the acquirer is recognised at the acquisition-date fair value. Subsequent changes in the fair value of the contingent consideration classified as an asset or liability is recognised in profit or loss. Contingent consideration classified as equity is not remeasured and its subsequent settlement is accounted for within equity.
The difference between the acquisition-date fair value of assets acquired, liabilities assumed and any non-controlling interest in the acquiree and the fair value of the consideration transferred and the fair value of any pre-existing investment in the acquiree is recognised as goodwill. If the consideration transferred and the pre-existing fair value is less than the fair value of the identifiable net assets acquired, being a bargain purchase to the acquirer, the difference is recognised as a gain directly in profit or loss by the acquirer on the acquisition-date, but only after a reassessment of the identification and measurement of the net assets acquired, the non-controlling interest in the acquiree, if any, the consideration transferred and the acquirer’s previously held equity interest in the acquirer.
Business combinations are initially accounted for on a provisional basis. The acquirer retrospectively adjusts the provisional amounts recognised and also recognises additional assets or liabilities during the measurement period, based on new information obtained about the facts and circumstances that existed at the acquisition-date. The measurement period ends on either the earlier of (i) 12 months from the date of the acquisition or (ii) when the acquirer receives all the information possible to determine fair value.
Earnings per share
Basic earnings per share
Basic earnings per share is calculated by dividing the profit attributable to the members of PS&C Ltd, excluding any costs of servicing equity other than ordinary shares, by the weighted average number of ordinary shares outstanding during the financial year, adjusted for bonus elements in ordinary shares issued during the financial year.
Diluted earnings per share
Diluted earnings per share adjusts the figures used in the determination of basic earnings per share to take into account the after income tax effect of interest and other financing costs associated with dilutive potential ordinary shares and the weighted average number of shares assumed to have been issued for no consideration in relation to dilutive potential ordinary shares.
Goods and Services Tax (‘GST’) and other similar taxesRevenues, expenses and assets are recognised net of the amount of associated GST, unless the GST incurred is not recoverable from the tax authority. In this case it is recognised as part of the cost of the acquisition of the asset or as part of the expense.
Receivables and payables are stated inclusive of the amount of GST receivable or payable. The net amount of GST recoverable from, or payable to, the tax authority is included in other receivables or other payables in the statement of financial position.
Cash flows are presented on a gross basis. The GST components of cash flows arising from investing or financing activities which are recoverable from, or payable to the tax authority, are presented as operating cash flows.
Commitments and contingencies are disclosed net of the amount of GST recoverable from, or payable to, the tax authority.
New Accounting Standards and Interpretations not yet mandatory or early adoptedAustralian Accounting Standards and Interpretations that have recently been issued or amended but are not yet mandatory, have not been early adopted by the group for the annual reporting period ended 30 June 2019. The group’s assessment of the impact of these new or amended Accounting Standards and Interpretations, most relevant to the group, are set out below.
For
per
sona
l use
onl
y
30 PS+C Annual Report 2019
Notes to the Financial Statements continued30 June 2019
Note 1. Significant accounting policies continued
New Accounting Standards and Interpretations not yet mandatory or early adopted continued
AASB 16 Leases
The standard replaces AASB 117 ‘Leases’ and for lessees eliminates the classifications of operating leases and finance leases. Except for short-term leases and leases of low-value assets, right-of-use assets and corresponding lease liabilities are recognised in the statement of financial position. Straight-line operating lease expense recognition is replaced with a depreciation charge for the right-of-use assets (included in operating costs) and an interest expense on the recognised lease liabilities (included in finance costs). In the earlier periods of the lease, the expenses associated with the lease under AASB 16 will be higher when compared to lease expenses under AASB 117. However, EBITDA (Earnings Before Interest, Tax, Depreciation and Amortisation) results improve as the operating expense is now replaced by interest expense and depreciation in profit or loss. For classification within the statement of cash flows, the interest portion is disclosed in operating activities and the principal portion of the lease payments are separately disclosed in financing activities. For lessor accounting, the standard does not substantially change how a lessor accounts for leases.
AASB 16 will be applied by the Company from its mandatory adoption date of 1 July 2019. The Company intends to apply the simplified transition approach and will not restate comparative amounts for the year prior to first adoption. While the right-of-use assets for property leases will be measured on transition as if the new rules had always been applied, all other right-of-use assets will be measured at the amount of the lease liability on adoption (after adjustments for any prepaid or accrued lease expenses). The Company’s non-cancellable operating lease commitments amount to $3.3m as at the reporting date. No material amount of the non-cancellable operating lease commitments are either short-term leases or low-value leases. The Company has performed a preliminary impact assessment and has estimated that on 1 July 2019, the Company expects to recognise the right-of-use assets and lease liabilities of approximately $3.9m less accumulated depreciation of $1.5m and lease liabilities of $2.8m. Following the adoption of this new Standard, EBITDA is expected to increase by $0.8m in the 2020 financial year. The Company’s net profit after tax is expected to decrease by approximately $17k in 2020. The repayment of the principal portion of the lease liabilities will be classified as cash flows from financing activities, thus increasing operating cash flows and decreasing financing cash flows by approximately $0.8m.
Note 2. Critical accounting judgements, estimates and assumptionsThe preparation of the financial statements requires management to make judgements, estimates and assumptions that affect the reported amounts in the financial statements. Management continually evaluates its judgements and estimates in relation to assets, liabilities, contingent liabilities, revenue and expenses. Management bases its judgements, estimates and assumptions on historical experience and on other various factors, including expectations of future events, management believes to be reasonable under the circumstances. The resulting accounting judgements and estimates will seldom equal the related actual results. The judgements, estimates and assumptions that have a significant risk of causing a material adjustment to the carrying amounts of assets and liabilities (refer to the respective notes) within the next financial year are discussed below.
Share-based payment transactionsThe group measures the cost of equity-settled transactions with employees by reference to the fair value of the equity instruments at the date at which they are granted. The fair value is determined by using either the Binomial or Black-Scholes model taking into account the terms and conditions upon which the instruments were granted. The accounting estimates and assumptions relating to equity-settled share-based payments would have no impact on the carrying amounts of assets and liabilities within the next annual reporting period but may impact profit or loss and equity.
Allowance for expected credit lossesThe allowance for expected credit losses assessment requires a degree of estimation and judgement. It is based on the lifetime expected credit loss, grouped based on days overdue, and makes assumptions to allocate an overall expected credit loss rate for each group. These assumptions include recent sales experience and historical collection rates.
Goodwill and other indefinite life intangible assetsThe group tests annually, or more frequently if events or changes in circumstances indicate impairment, whether goodwill and other indefinite life intangible assets have suffered any impairment, in accordance with the accounting policy stated in Note 1. The recoverable amounts of cash-generating units have been determined based on value-in-use calculations. These calculations require the use of assumptions, including estimated discount rates based on the current cost of capital and growth rates of the estimated future cash flows. Further information is detailed in Note 14.
For
per
sona
l use
onl
y
31PS+C Annual Report 2019
Income taxThe group is subject to income taxes in the jurisdictions in which it operates. Significant judgement is required in determining the provision for income tax. There are many transactions and calculations undertaken during the ordinary course of business for which the ultimate tax determination is uncertain. The group recognises liabilities for anticipated tax audit issues based on the group’s current understanding of the tax law. Where the final tax outcome of these matters is different from the carrying amounts, such differences will impact the current and deferred tax provisions in the period in which such determination is made.
Recovery of deferred tax assetsDeferred tax assets are recognised for deductible temporary differences only if the group considers it is probable that future taxable amounts will be available to utilise those temporary differences and losses.
Contingent considerationThe contingent consideration liability is the difference between the total purchase consideration, usually on an acquisition of a business combination, and the amounts paid or settled up to the reporting date, discounted to net present value. The group applies provisional accounting for any business combination. Any reassessment of the liability during the earlier of the finalisation of the provisional accounting or 12 months from acquisition-date is adjusted for retrospectively as part of the provisional accounting rules in accordance with AASB 3 ‘Business Combinations’. Thereafter, at each reporting date, the contingent consideration liability is reassessed against revised estimates and any increase or decrease in the net present value of the liability will result in a corresponding gain or loss to profit or loss. The increase in the liability resulting from the passage of time is recognised as a finance cost.
Business combinationsAs discussed in Note 1, business combinations are initially accounted for on a provisional basis. The fair value of assets acquired, liabilities and contingent liabilities assumed are initially estimated by the group taking into consideration all available information at the reporting date. Fair value adjustments on the finalisation of the business combination accounting is retrospective, where applicable, to the period the combination occurred and may have an impact on the assets and liabilities, depreciation and amortisation reported.
Note 3. Operating segmentsIdentification of reportable operating segmentsThe group is organised into four operating segments: Discovery + Insights, Design + Process, Delivery + Cloud and Defend + Secure. Operating segments are determined by distinguishable components whereby the risk and returns are different from the other segments.
Types of products and servicesThe principal products and services of each of these operating segments are as follows:
Discovery + Insights The Discovery + Insights segment, comprising GlassandCo Pty Ltd, is involved in shaping digital ambition, strategy and business cases based on insights.
Design + Process The Design + Process segment, comprising Systems and People Pty Ltd, Bexton IT Services Pty Ltd, Coroma Consulting Pty Ltd, Seisma Pty Ltd, NTH Consulting Pty Ltd and Artisan Consulting Pty Ltd, is involved in sourcing and providing specialist contractors to customers for medium and long term ICT projects, while also managing the payroll function for customers. It is focused on reinventing and prototyping new capabilities and journeys as part of the program.
Delivery + Cloud The Delivery + Cloud segment, comprising Sacon Pty Ltd, is involved in consulting and implementation of services around unified communications, conferencing and messaging, contact centre solutions and secure voice technologies.
Defend + Secure The Defend + Secure segment, comprising Pure Hacking Pty Ltd, Securus Global Consulting Pty Ltd, Hacklabs Pty Ltd and Certitude Pty Ltd, is involved in services and consulting around reducing operational, financial, reputational risk and digital security matters.
Intersegment transactionsThere were no material transactions between operating segments.
For
per
sona
l use
onl
y
32 PS+C Annual Report 2019
Notes to the Financial Statements continued30 June 2019
Note 3. Operating segments continued
Intersegment receivables, payables and loansIntersegment loans are initially recognised at the consideration received. Intersegment loans receivable and loans payable that earn or incur non-market interest are not adjusted to fair value based on market interest rates. Intersegment loans are eliminated on consolidation.
Revenue CategorisedRevenue is generated by the group and is categorised into the reportable segments disclosed below. Sales to external customers is recognised when the performance obligations are delivered over time. Once a contract has been entered into, the Group has an enforceable right to payment for work completed to date. Therefore, revenue is recognised over time.
Operating segment information
Consolidated Group – 2019
Discovery + Insights
$
Design + Process
$
Delivery + Cloud
$
Defend + Secure
$Corporate
$
Discontinued Operations
$Total
$RevenueSales to external customers 6,921,212 53,705,150 6,266,855 16,407,687 – 4,599,013 87,899,917Total revenue 6,921,212 53,705,150 6,266,855 16,407,687 – 4,599,013 87,899,917EBITDA 1,026,238 4,721,162 534,424 3,140,738 (8,218,763) (924,451) 279,348Depreciation and amortisation (204) (34,584) (6,815) (187,671) (108,794) (64,023) (402,091)Impairment of assets – – – – (49,629,677) – (49,629,677)Loss on disposal of discontinued operation – – – – (3,360,521) – (3,360,521)Interest revenue – 1,445 252 50 11,700 – 13,447Finance costs – 134 847 3,506 1,044,642 6,380 1,055,509Deferred consideration adjustments – – – – (1,070,008) – (1,070,008)Profit/(loss) before income tax expense 1,026,034 4,688,157 528,708 2,956,623 (61,331,421) (982,094) (53,113,993)Income tax expense (375,320)Loss after income tax expense (53,489,313)AssetsSegment assets 1,036,389 9,818,014 2,126,416 5,029,712 50,523,815 – 68,534,346Total assets 68,534,346LiabilitiesSegment liabilities 867,289 8,053,117 998,472 2,900,718 22,271,239 – 35,090,835Total liabilities 35,090,835
Consolidated Group – 2018RevenueSales to external customers 1,460,575 42,080,796 5,831,535 13,812,710 – 15,165,550 78,351,166Total revenue 1,460,575 42,080,796 5,831,535 13,812,710 – 15,165,550 78,351,166EBITDA (1,402,033) 4,141,248 1,953,022 2,142,074 (6,491,763) 1,638,923 1,981,471Depreciation and amortisation – (19,682) (9,409) (142,871) (59,365) (169,921) (401,248)Impairment of assets – – – – (9,612,395) – (9,612,395)Interest revenue – 2,081 5,152 95 27,702 341 35,371Finance costs – (67) (2,411) – (1,348,779) (14,785) (1,366,042)Profit/(loss) before income tax expense (1,402,033) 4,123,580 1,946,354 1,999,298 (17,484,600) 1,454,558 (9,362,843)Income tax expense (792,970)Loss after income tax expense (10,155,813)AssetsSegment assets 1,154,826 9,738,849 1,718,498 4,090,907 104,079,600 4,463,638 125,246,318Total assets 125,246,318LiabilitiesSegment liabilities 508,724 5,331,280 693,318 2,526,701 30,145,747 5,060,575 44,266,345Total liabilities 44,266,345
For
per
sona
l use
onl
y
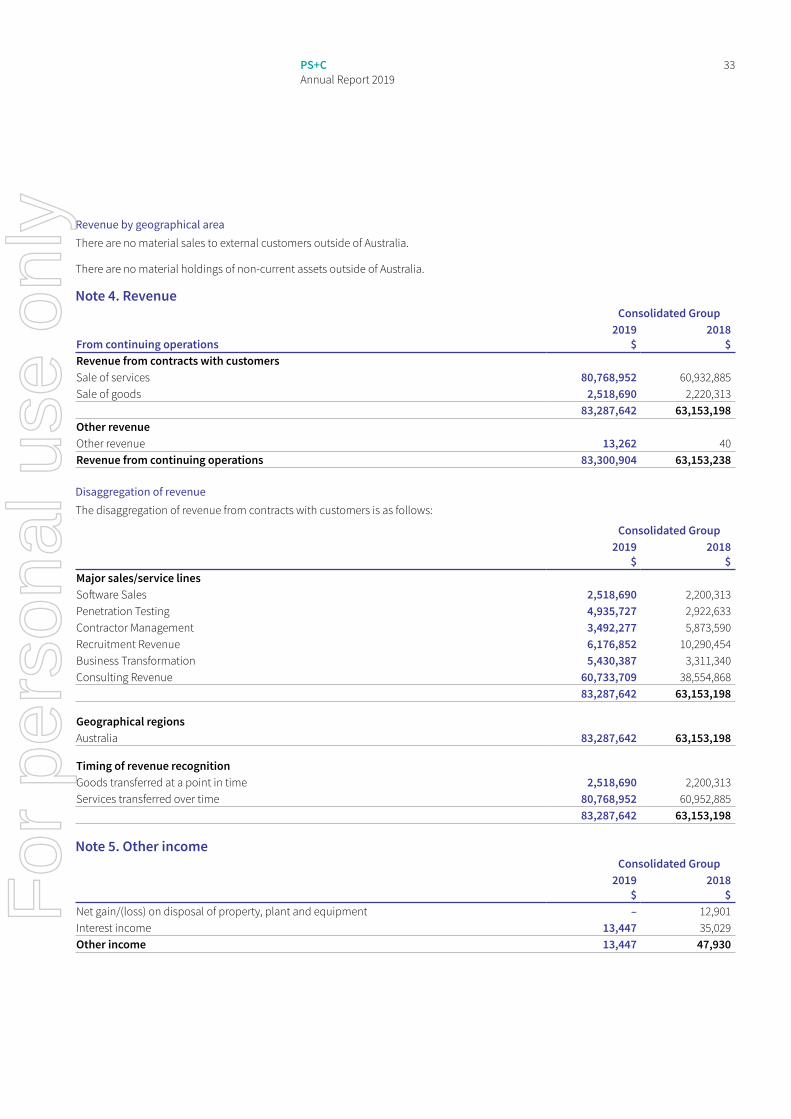
33PS+C Annual Report 2019
Revenue by geographical areaThere are no material sales to external customers outside of Australia.
There are no material holdings of non-current assets outside of Australia.
Note 4. RevenueConsolidated Group
From continuing operations2019
$2018
$Revenue from contracts with customersSale of services 80,768,952 60,932,885 Sale of goods 2,518,690 2,220,313
83,287,642 63,153,198 Other revenueOther revenue 13,262 40 Revenue from continuing operations 83,300,904 63,153,238
Disaggregation of revenueThe disaggregation of revenue from contracts with customers is as follows:
Consolidated Group2019
$2018
$Major sales/service linesSoftware Sales 2,518,690 2,200,313 Penetration Testing 4,935,727 2,922,633 Contractor Management 3,492,277 5,873,590 Recruitment Revenue 6,176,852 10,290,454 Business Transformation 5,430,387 3,311,340 Consulting Revenue 60,733,709 38,554,868
83,287,642 63,153,198
Geographical regionsAustralia 83,287,642 63,153,198
Timing of revenue recognitionGoods transferred at a point in time 2,518,690 2,200,313 Services transferred over time 80,768,952 60,952,885
83,287,642 63,153,198
Note 5. Other incomeConsolidated Group
2019 $
2018 $
Net gain/(loss) on disposal of property, plant and equipment – 12,901 Interest income 13,447 35,029 Other income 13,447 47,930
For
per
sona
l use
onl
y
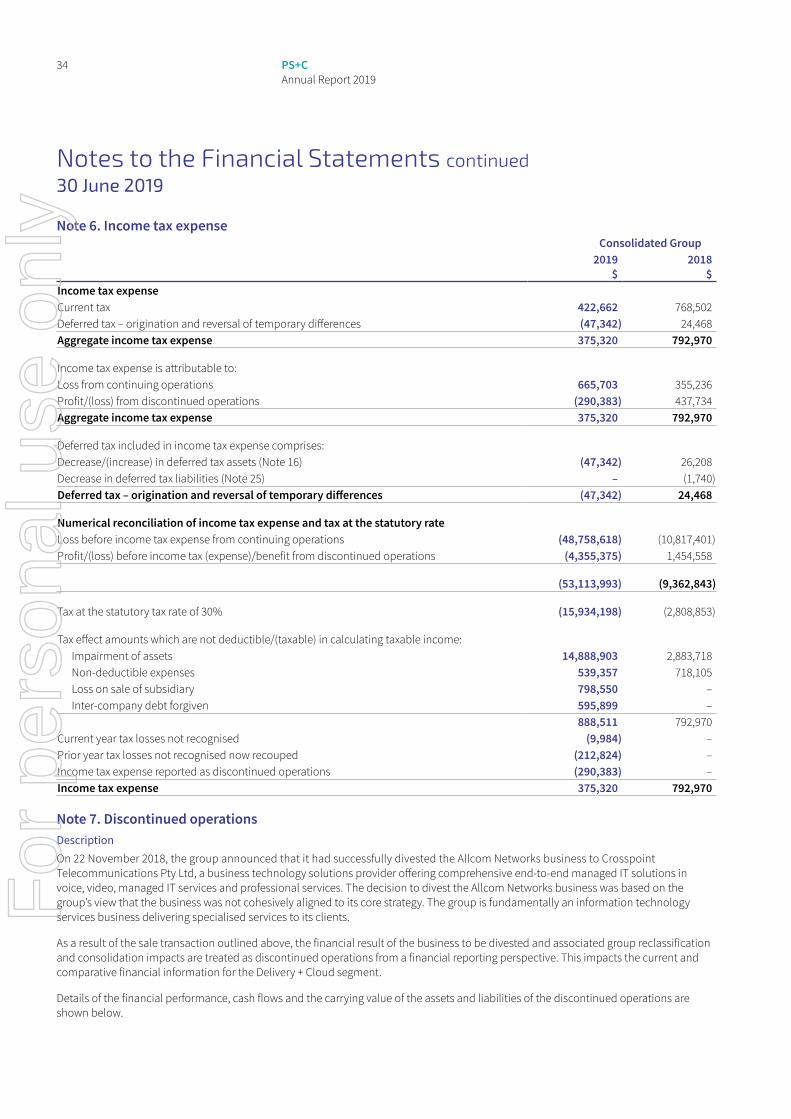
34 PS+C Annual Report 2019
Notes to the Financial Statements continued30 June 2019
Note 6. Income tax expenseConsolidated Group
2019 $
2018 $
Income tax expenseCurrent tax 422,662 768,502 Deferred tax – origination and reversal of temporary differences (47,342) 24,468 Aggregate income tax expense 375,320 792,970
Income tax expense is attributable to:Loss from continuing operations 665,703 355,236 Profit/(loss) from discontinued operations (290,383) 437,734 Aggregate income tax expense 375,320 792,970
Deferred tax included in income tax expense comprises:Decrease/(increase) in deferred tax assets (Note 16) (47,342) 26,208 Decrease in deferred tax liabilities (Note 25) – (1,740)Deferred tax – origination and reversal of temporary differences (47,342) 24,468
Numerical reconciliation of income tax expense and tax at the statutory rateLoss before income tax expense from continuing operations (48,758,618) (10,817,401)Profit/(loss) before income tax (expense)/benefit from discontinued operations (4,355,375) 1,454,558
(53,113,993) (9,362,843)
Tax at the statutory tax rate of 30% (15,934,198) (2,808,853)
Tax effect amounts which are not deductible/(taxable) in calculating taxable income:Impairment of assets 14,888,903 2,883,718 Non-deductible expenses 539,357 718,105 Loss on sale of subsidiary 798,550 – Inter-company debt forgiven 595,899 –
888,511 792,970 Current year tax losses not recognised (9,984) – Prior year tax losses not recognised now recouped (212,824) – Income tax expense reported as discontinued operations (290,383) – Income tax expense 375,320 792,970
Note 7. Discontinued operationsDescriptionOn 22 November 2018, the group announced that it had successfully divested the Allcom Networks business to Crosspoint Telecommunications Pty Ltd, a business technology solutions provider offering comprehensive end-to-end managed IT solutions in voice, video, managed IT services and professional services. The decision to divest the Allcom Networks business was based on the group’s view that the business was not cohesively aligned to its core strategy. The group is fundamentally an information technology services business delivering specialised services to its clients.
As a result of the sale transaction outlined above, the financial result of the business to be divested and associated group reclassification and consolidation impacts are treated as discontinued operations from a financial reporting perspective. This impacts the current and comparative financial information for the Delivery + Cloud segment.
Details of the financial performance, cash flows and the carrying value of the assets and liabilities of the discontinued operations are shown below.
For
per
sona
l use
onl
y
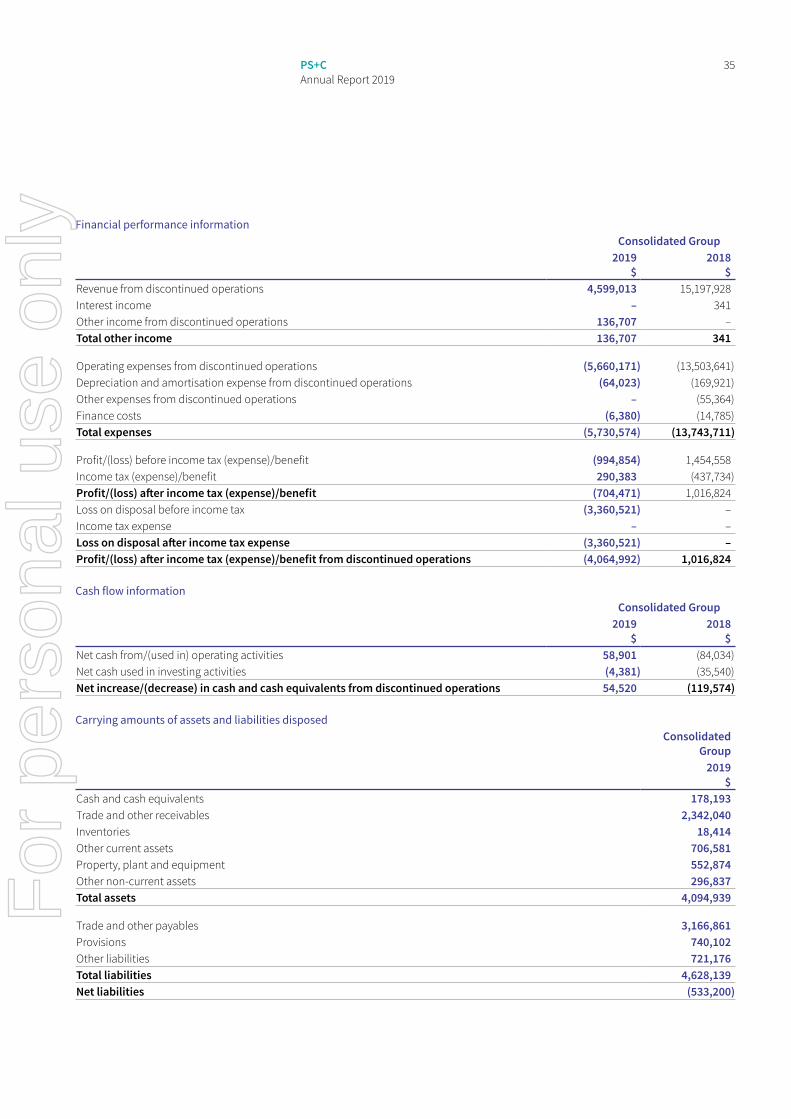
35PS+C Annual Report 2019
Financial performance informationConsolidated Group
2019 $
2018 $
Revenue from discontinued operations 4,599,013 15,197,928 Interest income – 341 Other income from discontinued operations 136,707 – Total other income 136,707 341
Operating expenses from discontinued operations (5,660,171) (13,503,641)Depreciation and amortisation expense from discontinued operations (64,023) (169,921)Other expenses from discontinued operations – (55,364)Finance costs (6,380) (14,785)Total expenses (5,730,574) (13,743,711)
Profit/(loss) before income tax (expense)/benefit (994,854) 1,454,558 Income tax (expense)/benefit 290,383 (437,734)Profit/(loss) after income tax (expense)/benefit (704,471) 1,016,824 Loss on disposal before income tax (3,360,521) – Income tax expense – – Loss on disposal after income tax expense (3,360,521) – Profit/(loss) after income tax (expense)/benefit from discontinued operations (4,064,992) 1,016,824
Cash flow informationConsolidated Group
2019 $
2018 $
Net cash from/(used in) operating activities 58,901 (84,034)Net cash used in investing activities (4,381) (35,540)Net increase/(decrease) in cash and cash equivalents from discontinued operations 54,520 (119,574)
Carrying amounts of assets and liabilities disposedConsolidated
Group2019
$Cash and cash equivalents 178,193 Trade and other receivables 2,342,040 Inventories 18,414 Other current assets 706,581 Property, plant and equipment 552,874 Other non-current assets 296,837 Total assets 4,094,939
Trade and other payables 3,166,861 Provisions 740,102 Other liabilities 721,176 Total liabilities 4,628,139 Net liabilities (533,200)
For
per
sona
l use
onl
y
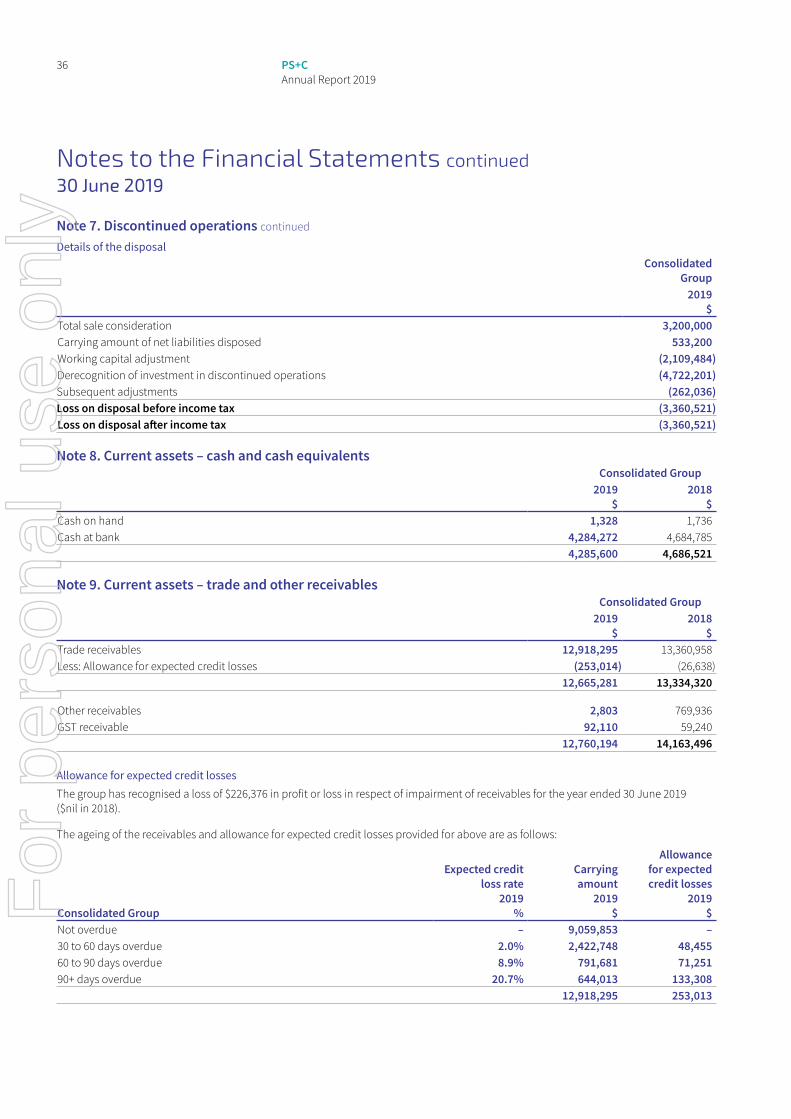
36 PS+C Annual Report 2019
Notes to the Financial Statements continued30 June 2019
Note 7. Discontinued operations continued
Details of the disposalConsolidated
Group2019
$Total sale consideration 3,200,000 Carrying amount of net liabilities disposed 533,200 Working capital adjustment (2,109,484)Derecognition of investment in discontinued operations (4,722,201)Subsequent adjustments (262,036)Loss on disposal before income tax (3,360,521)Loss on disposal after income tax (3,360,521)
Note 8. Current assets – cash and cash equivalentsConsolidated Group
2019 $
2018 $
Cash on hand 1,328 1,736 Cash at bank 4,284,272 4,684,785
4,285,600 4,686,521
Note 9. Current assets – trade and other receivablesConsolidated Group
2019 $
2018 $
Trade receivables 12,918,295 13,360,958 Less: Allowance for expected credit losses (253,014) (26,638)
12,665,281 13,334,320
Other receivables 2,803 769,936 GST receivable 92,110 59,240
12,760,194 14,163,496
Allowance for expected credit lossesThe group has recognised a loss of $226,376 in profit or loss in respect of impairment of receivables for the year ended 30 June 2019 ($nil in 2018).
The ageing of the receivables and allowance for expected credit losses provided for above are as follows:
Consolidated Group
Expected credit loss rate
2019 %
Carrying amount
2019 $
Allowance for expected credit losses
2019 $
Not overdue – 9,059,853 –30 to 60 days overdue 2.0% 2,422,748 48,45560 to 90 days overdue 8.9% 791,681 71,25190+ days overdue 20.7% 644,013 133,308
12,918,295 253,013
For
per
sona
l use
onl
y
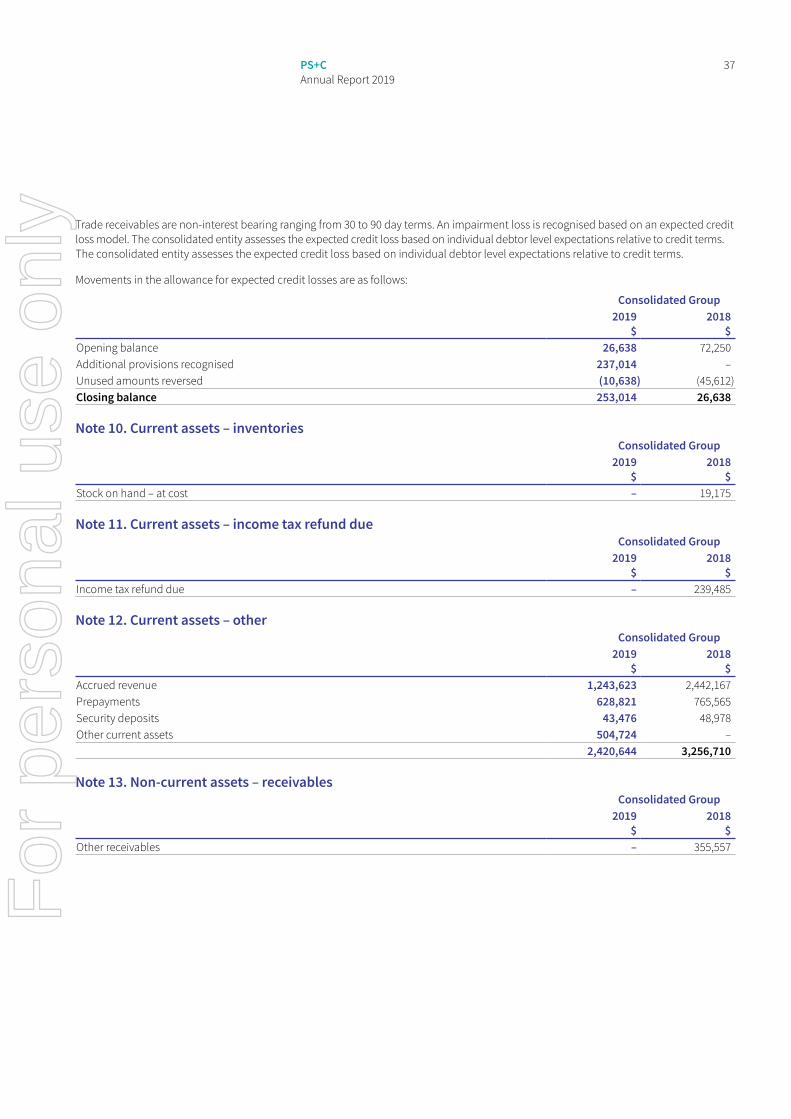
37PS+C Annual Report 2019
Trade receivables are non-interest bearing ranging from 30 to 90 day terms. An impairment loss is recognised based on an expected credit loss model. The consolidated entity assesses the expected credit loss based on individual debtor level expectations relative to credit terms. The consolidated entity assesses the expected credit loss based on individual debtor level expectations relative to credit terms.
Movements in the allowance for expected credit losses are as follows:
Consolidated Group2019
$2018
$Opening balance 26,638 72,250 Additional provisions recognised 237,014 – Unused amounts reversed (10,638) (45,612)Closing balance 253,014 26,638
Note 10. Current assets – inventoriesConsolidated Group
2019 $
2018 $
Stock on hand – at cost – 19,175
Note 11. Current assets – income tax refund dueConsolidated Group
2019 $
2018 $
Income tax refund due – 239,485
Note 12. Current assets – otherConsolidated Group
2019 $
2018 $
Accrued revenue 1,243,623 2,442,167 Prepayments 628,821 765,565 Security deposits 43,476 48,978 Other current assets 504,724 –
2,420,644 3,256,710
Note 13. Non-current assets – receivablesConsolidated Group
2019 $
2018 $
Other receivables – 355,557
For
per
sona
l use
onl
y
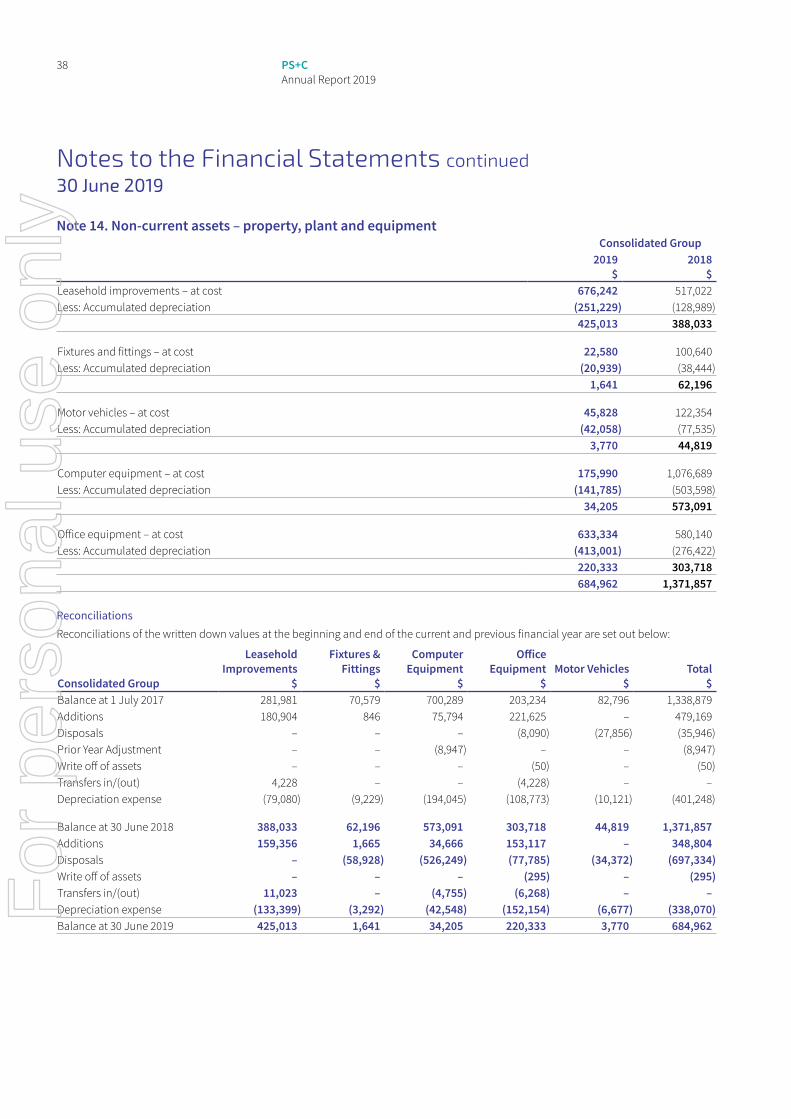
38 PS+C Annual Report 2019
Notes to the Financial Statements continued30 June 2019
Note 14. Non-current assets – property, plant and equipmentConsolidated Group
2019 $
2018 $
Leasehold improvements – at cost 676,242 517,022 Less: Accumulated depreciation (251,229) (128,989)
425,013 388,033
Fixtures and fittings – at cost 22,580 100,640 Less: Accumulated depreciation (20,939) (38,444)
1,641 62,196
Motor vehicles – at cost 45,828 122,354 Less: Accumulated depreciation (42,058) (77,535)
3,770 44,819
Computer equipment – at cost 175,990 1,076,689 Less: Accumulated depreciation (141,785) (503,598)
34,205 573,091
Office equipment – at cost 633,334 580,140 Less: Accumulated depreciation (413,001) (276,422)
220,333 303,718 684,962 1,371,857
ReconciliationsReconciliations of the written down values at the beginning and end of the current and previous financial year are set out below:
Consolidated Group
Leasehold Improvements
$
Fixtures & Fittings
$
Computer Equipment
$
Office Equipment
$Motor Vehicles
$Total
$Balance at 1 July 2017 281,981 70,579 700,289 203,234 82,796 1,338,879Additions 180,904 846 75,794 221,625 – 479,169Disposals – – – (8,090) (27,856) (35,946)Prior Year Adjustment – – (8,947) – – (8,947)Write off of assets – – – (50) – (50)Transfers in/(out) 4,228 – – (4,228) – –Depreciation expense (79,080) (9,229) (194,045) (108,773) (10,121) (401,248)
Balance at 30 June 2018 388,033 62,196 573,091 303,718 44,819 1,371,857Additions 159,356 1,665 34,666 153,117 – 348,804Disposals – (58,928) (526,249) (77,785) (34,372) (697,334)Write off of assets – – – (295) – (295)Transfers in/(out) 11,023 – (4,755) (6,268) – –Depreciation expense (133,399) (3,292) (42,548) (152,154) (6,677) (338,070)Balance at 30 June 2019 425,013 1,641 34,205 220,333 3,770 684,962F
or p
erso
nal u
se o
nly
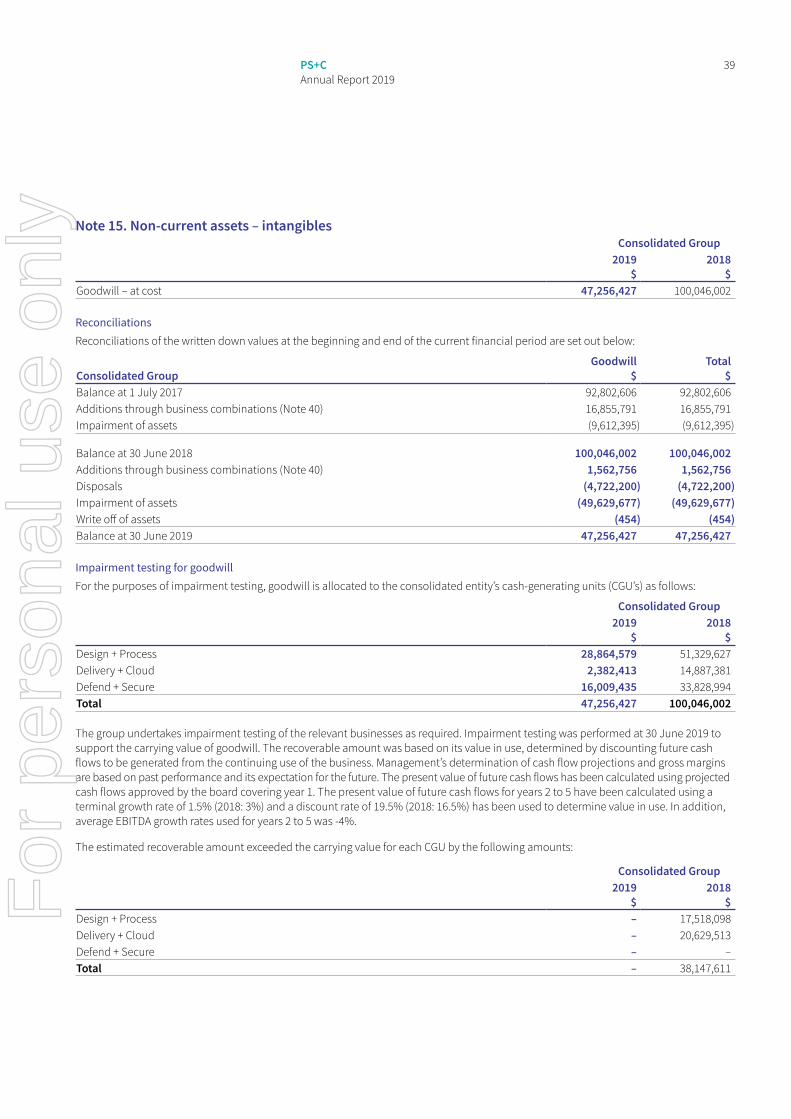
39PS+C Annual Report 2019
Note 15. Non-current assets – intangiblesConsolidated Group
2019 $
2018 $
Goodwill – at cost 47,256,427 100,046,002
ReconciliationsReconciliations of the written down values at the beginning and end of the current financial period are set out below:
Consolidated GroupGoodwill
$Total
$Balance at 1 July 2017 92,802,606 92,802,606Additions through business combinations (Note 40) 16,855,791 16,855,791Impairment of assets (9,612,395) (9,612,395)
Balance at 30 June 2018 100,046,002 100,046,002Additions through business combinations (Note 40) 1,562,756 1,562,756Disposals (4,722,200) (4,722,200)Impairment of assets (49,629,677) (49,629,677)Write off of assets (454) (454)Balance at 30 June 2019 47,256,427 47,256,427
Impairment testing for goodwillFor the purposes of impairment testing, goodwill is allocated to the consolidated entity’s cash-generating units (CGU’s) as follows:
Consolidated Group2019
$2018
$Design + Process 28,864,579 51,329,627 Delivery + Cloud 2,382,413 14,887,381 Defend + Secure 16,009,435 33,828,994 Total 47,256,427 100,046,002
The group undertakes impairment testing of the relevant businesses as required. Impairment testing was performed at 30 June 2019 to support the carrying value of goodwill. The recoverable amount was based on its value in use, determined by discounting future cash flows to be generated from the continuing use of the business. Management’s determination of cash flow projections and gross margins are based on past performance and its expectation for the future. The present value of future cash flows has been calculated using projected cash flows approved by the board covering year 1. The present value of future cash flows for years 2 to 5 have been calculated using a terminal growth rate of 1.5% (2018: 3%) and a discount rate of 19.5% (2018: 16.5%) has been used to determine value in use. In addition, average EBITDA growth rates used for years 2 to 5 was -4%.
The estimated recoverable amount exceeded the carrying value for each CGU by the following amounts:
Consolidated Group2019
$2018
$Design + Process – 17,518,098 Delivery + Cloud – 20,629,513 Defend + Secure – –Total – 38,147,611
For
per
sona
l use
onl
y
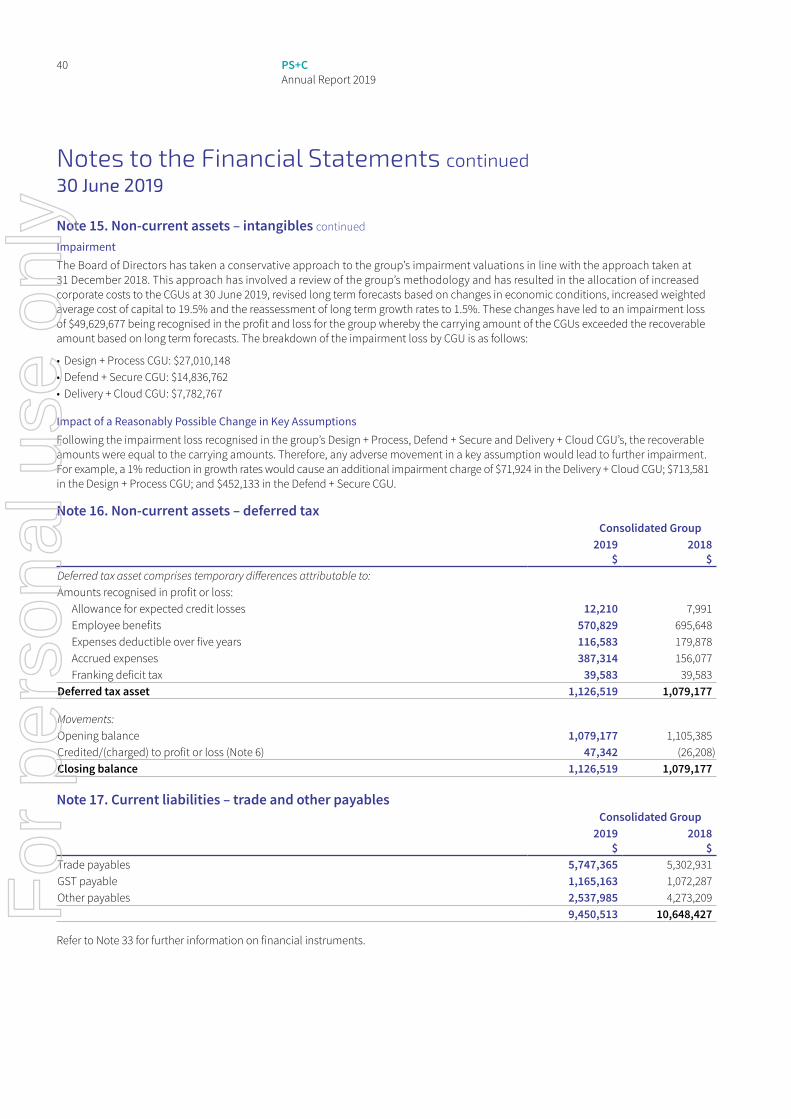
40 PS+C Annual Report 2019
Notes to the Financial Statements continued30 June 2019
Note 15. Non-current assets – intangibles continued
ImpairmentThe Board of Directors has taken a conservative approach to the group’s impairment valuations in line with the approach taken at 31 December 2018. This approach has involved a review of the group’s methodology and has resulted in the allocation of increased corporate costs to the CGUs at 30 June 2019, revised long term forecasts based on changes in economic conditions, increased weighted average cost of capital to 19.5% and the reassessment of long term growth rates to 1.5%. These changes have led to an impairment loss of $49,629,677 being recognised in the profit and loss for the group whereby the carrying amount of the CGUs exceeded the recoverable amount based on long term forecasts. The breakdown of the impairment loss by CGU is as follows:
• Design + Process CGU: $27,010,148 • Defend + Secure CGU: $14,836,762• Delivery + Cloud CGU: $7,782,767
Impact of a Reasonably Possible Change in Key AssumptionsFollowing the impairment loss recognised in the group’s Design + Process, Defend + Secure and Delivery + Cloud CGU’s, the recoverable amounts were equal to the carrying amounts. Therefore, any adverse movement in a key assumption would lead to further impairment. For example, a 1% reduction in growth rates would cause an additional impairment charge of $71,924 in the Delivery + Cloud CGU; $713,581 in the Design + Process CGU; and $452,133 in the Defend + Secure CGU.
Note 16. Non-current assets – deferred taxConsolidated Group
2019 $
2018 $
Deferred tax asset comprises temporary differences attributable to:Amounts recognised in profit or loss:
Allowance for expected credit losses 12,210 7,991 Employee benefits 570,829 695,648 Expenses deductible over five years 116,583 179,878 Accrued expenses 387,314 156,077 Franking deficit tax 39,583 39,583
Deferred tax asset 1,126,519 1,079,177
Movements:Opening balance 1,079,177 1,105,385 Credited/(charged) to profit or loss (Note 6) 47,342 (26,208)Closing balance 1,126,519 1,079,177
Note 17. Current liabilities – trade and other payablesConsolidated Group
2019 $
2018 $
Trade payables 5,747,365 5,302,931 GST payable 1,165,163 1,072,287 Other payables 2,537,985 4,273,209
9,450,513 10,648,427
Refer to Note 33 for further information on financial instruments.
For
per
sona
l use
onl
y
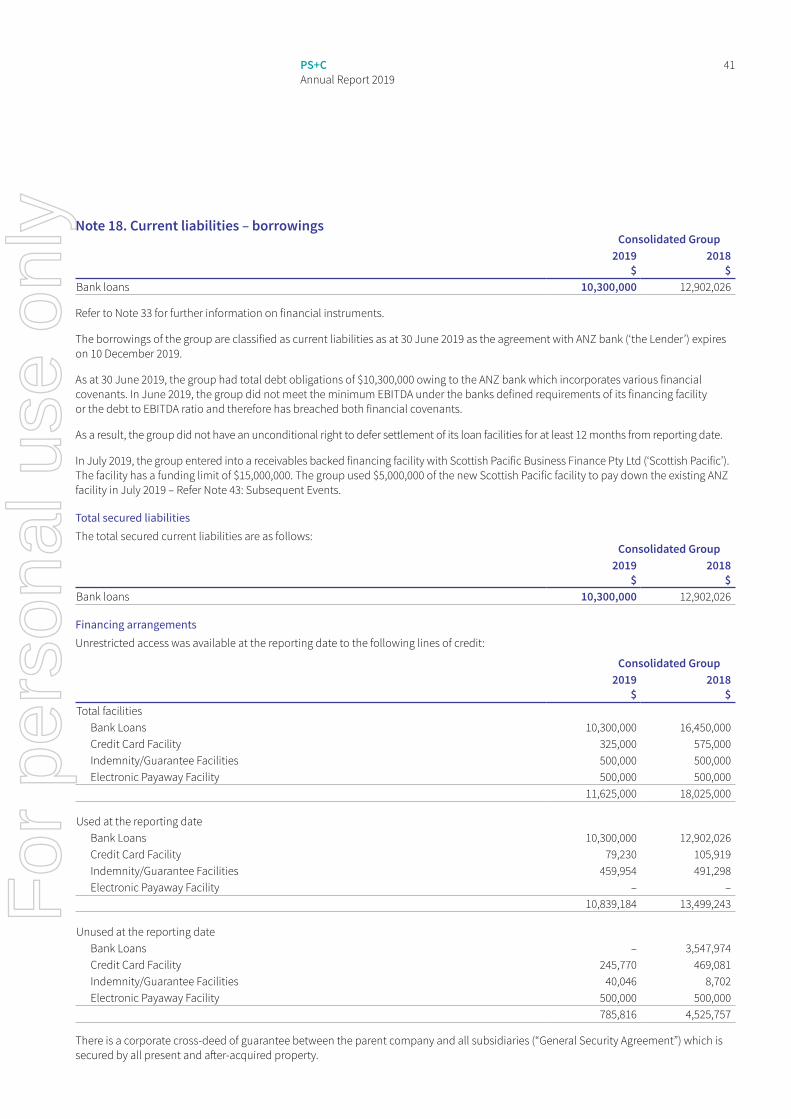
41PS+C Annual Report 2019
Note 18. Current liabilities – borrowingsConsolidated Group
2019 $
2018 $
Bank loans 10,300,000 12,902,026
Refer to Note 33 for further information on financial instruments.
The borrowings of the group are classified as current liabilities as at 30 June 2019 as the agreement with ANZ bank (‘the Lender’) expires on 10 December 2019.
As at 30 June 2019, the group had total debt obligations of $10,300,000 owing to the ANZ bank which incorporates various financial covenants. In June 2019, the group did not meet the minimum EBITDA under the banks defined requirements of its financing facility or the debt to EBITDA ratio and therefore has breached both financial covenants.
As a result, the group did not have an unconditional right to defer settlement of its loan facilities for at least 12 months from reporting date.
In July 2019, the group entered into a receivables backed financing facility with Scottish Pacific Business Finance Pty Ltd (‘Scottish Pacific’). The facility has a funding limit of $15,000,000. The group used $5,000,000 of the new Scottish Pacific facility to pay down the existing ANZ facility in July 2019 – Refer Note 43: Subsequent Events.
Total secured liabilitiesThe total secured current liabilities are as follows:
Consolidated Group2019
$2018
$Bank loans 10,300,000 12,902,026
Financing arrangementsUnrestricted access was available at the reporting date to the following lines of credit:
Consolidated Group2019
$2018
$Total facilities
Bank Loans 10,300,000 16,450,000 Credit Card Facility 325,000 575,000 Indemnity/Guarantee Facilities 500,000 500,000 Electronic Payaway Facility 500,000 500,000
11,625,000 18,025,000
Used at the reporting dateBank Loans 10,300,000 12,902,026 Credit Card Facility 79,230 105,919 Indemnity/Guarantee Facilities 459,954 491,298 Electronic Payaway Facility – –
10,839,184 13,499,243
Unused at the reporting dateBank Loans – 3,547,974 Credit Card Facility 245,770 469,081 Indemnity/Guarantee Facilities 40,046 8,702 Electronic Payaway Facility 500,000 500,000
785,816 4,525,757
There is a corporate cross-deed of guarantee between the parent company and all subsidiaries (“General Security Agreement”) which is secured by all present and after-acquired property.
For
per
sona
l use
onl
y
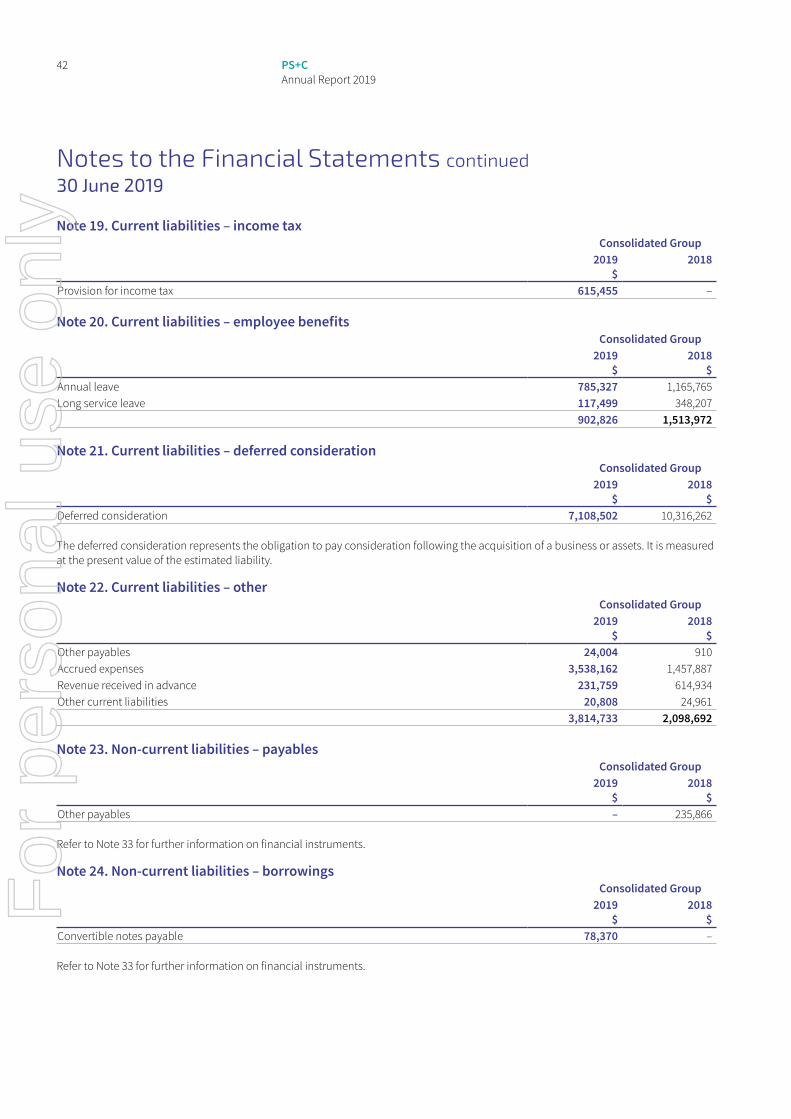
42 PS+C Annual Report 2019
Notes to the Financial Statements continued30 June 2019
Note 19. Current liabilities – income taxConsolidated Group
2019 $
2018
Provision for income tax 615,455 –
Note 20. Current liabilities – employee benefitsConsolidated Group
2019 $
2018 $
Annual leave 785,327 1,165,765 Long service leave 117,499 348,207
902,826 1,513,972
Note 21. Current liabilities – deferred considerationConsolidated Group
2019 $
2018 $
Deferred consideration 7,108,502 10,316,262
The deferred consideration represents the obligation to pay consideration following the acquisition of a business or assets. It is measured at the present value of the estimated liability.
Note 22. Current liabilities – otherConsolidated Group
2019 $
2018 $
Other payables 24,004 910 Accrued expenses 3,538,162 1,457,887 Revenue received in advance 231,759 614,934 Other current liabilities 20,808 24,961
3,814,733 2,098,692
Note 23. Non-current liabilities – payablesConsolidated Group
2019 $
2018 $
Other payables – 235,866
Refer to Note 33 for further information on financial instruments.
Note 24. Non-current liabilities – borrowingsConsolidated Group
2019 $
2018 $
Convertible notes payable 78,370 –
Refer to Note 33 for further information on financial instruments.
For
per
sona
l use
onl
y
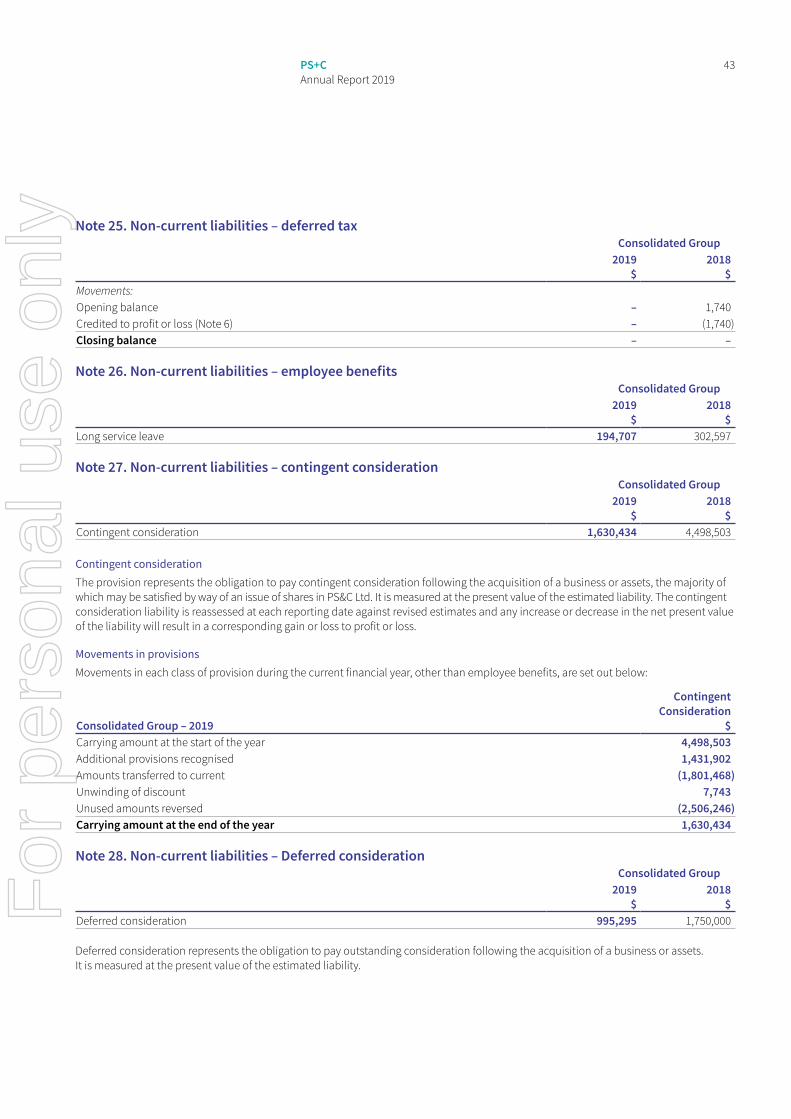
43PS+C Annual Report 2019
Note 25. Non-current liabilities – deferred taxConsolidated Group
2019 $
2018 $
Movements:Opening balance – 1,740 Credited to profit or loss (Note 6) – (1,740)Closing balance – –
Note 26. Non-current liabilities – employee benefitsConsolidated Group
2019 $
2018 $
Long service leave 194,707 302,597
Note 27. Non-current liabilities – contingent considerationConsolidated Group
2019 $
2018 $
Contingent consideration 1,630,434 4,498,503
Contingent considerationThe provision represents the obligation to pay contingent consideration following the acquisition of a business or assets, the majority of which may be satisfied by way of an issue of shares in PS&C Ltd. It is measured at the present value of the estimated liability. The contingent consideration liability is reassessed at each reporting date against revised estimates and any increase or decrease in the net present value of the liability will result in a corresponding gain or loss to profit or loss.
Movements in provisionsMovements in each class of provision during the current financial year, other than employee benefits, are set out below:
Consolidated Group – 2019
Contingent Consideration
$Carrying amount at the start of the year 4,498,503Additional provisions recognised 1,431,902Amounts transferred to current (1,801,468)Unwinding of discount 7,743Unused amounts reversed (2,506,246)Carrying amount at the end of the year 1,630,434
Note 28. Non-current liabilities – Deferred considerationConsolidated Group
2019 $
2018 $
Deferred consideration 995,295 1,750,000
Deferred consideration represents the obligation to pay outstanding consideration following the acquisition of a business or assets. It is measured at the present value of the estimated liability.
For
per
sona
l use
onl
y
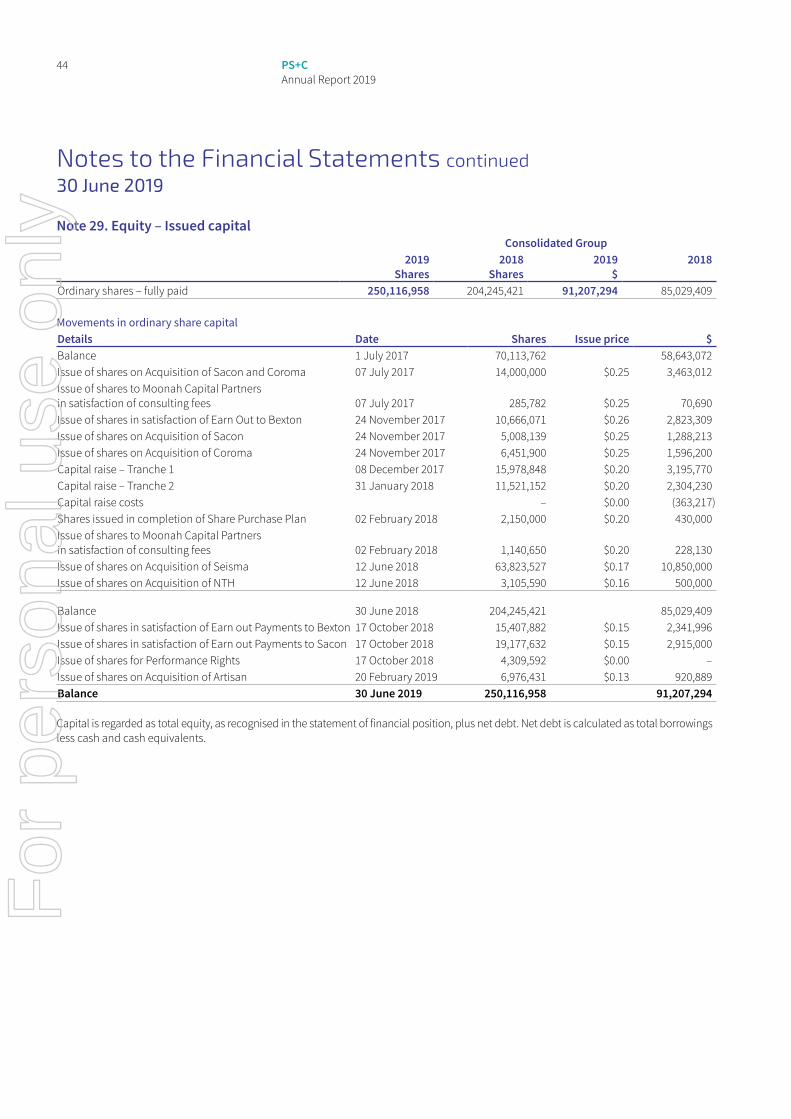
44 PS+C Annual Report 2019
Notes to the Financial Statements continued30 June 2019
Note 29. Equity – Issued capitalConsolidated Group
2019 Shares
2018 Shares
2019 $
2018
Ordinary shares – fully paid 250,116,958 204,245,421 91,207,294 85,029,409
Movements in ordinary share capitalDetails Date Shares Issue price $Balance 1 July 2017 70,113,762 58,643,072Issue of shares on Acquisition of Sacon and Coroma 07 July 2017 14,000,000 $0.25 3,463,012Issue of shares to Moonah Capital Partners in satisfaction of consulting fees 07 July 2017 285,782 $0.25 70,690Issue of shares in satisfaction of Earn Out to Bexton 24 November 2017 10,666,071 $0.26 2,823,309Issue of shares on Acquisition of Sacon 24 November 2017 5,008,139 $0.25 1,288,213Issue of shares on Acquisition of Coroma 24 November 2017 6,451,900 $0.25 1,596,200Capital raise – Tranche 1 08 December 2017 15,978,848 $0.20 3,195,770Capital raise – Tranche 2 31 January 2018 11,521,152 $0.20 2,304,230Capital raise costs – $0.00 (363,217)Shares issued in completion of Share Purchase Plan 02 February 2018 2,150,000 $0.20 430,000Issue of shares to Moonah Capital Partners in satisfaction of consulting fees 02 February 2018 1,140,650 $0.20 228,130Issue of shares on Acquisition of Seisma 12 June 2018 63,823,527 $0.17 10,850,000Issue of shares on Acquisition of NTH 12 June 2018 3,105,590 $0.16 500,000
Balance 30 June 2018 204,245,421 85,029,409Issue of shares in satisfaction of Earn out Payments to Bexton 17 October 2018 15,407,882 $0.15 2,341,996Issue of shares in satisfaction of Earn out Payments to Sacon 17 October 2018 19,177,632 $0.15 2,915,000Issue of shares for Performance Rights 17 October 2018 4,309,592 $0.00 –Issue of shares on Acquisition of Artisan 20 February 2019 6,976,431 $0.13 920,889Balance 30 June 2019 250,116,958 91,207,294
Capital is regarded as total equity, as recognised in the statement of financial position, plus net debt. Net debt is calculated as total borrowings less cash and cash equivalents.
For
per
sona
l use
onl
y
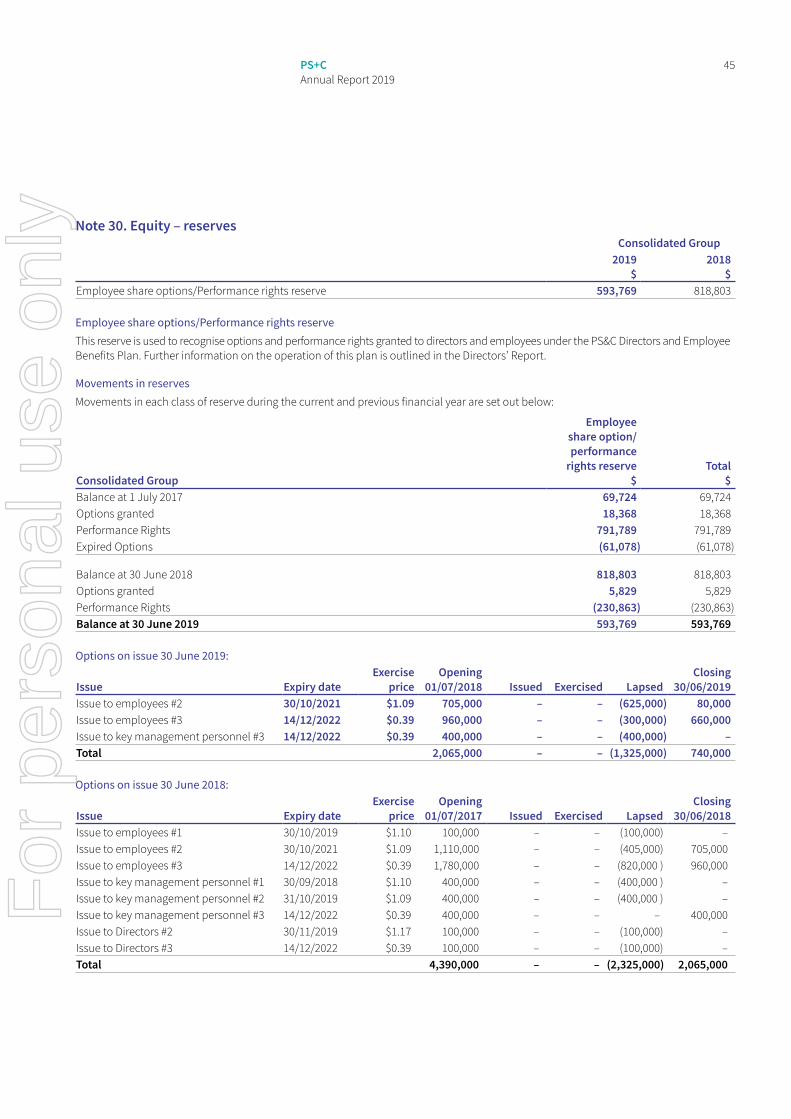
45PS+C Annual Report 2019
Note 30. Equity – reservesConsolidated Group
2019 $
2018 $
Employee share options/Performance rights reserve 593,769 818,803
Employee share options/Performance rights reserveThis reserve is used to recognise options and performance rights granted to directors and employees under the PS&C Directors and Employee Benefits Plan. Further information on the operation of this plan is outlined in the Directors’ Report.
Movements in reservesMovements in each class of reserve during the current and previous financial year are set out below:
Consolidated Group
Employee share option/performance
rights reserve $
Total $
Balance at 1 July 2017 69,724 69,724Options granted 18,368 18,368Performance Rights 791,789 791,789Expired Options (61,078) (61,078)
Balance at 30 June 2018 818,803 818,803Options granted 5,829 5,829Performance Rights (230,863) (230,863)Balance at 30 June 2019 593,769 593,769
Options on issue 30 June 2019:
Issue Expiry dateExercise
priceOpening
01/07/2018 Issued Exercised LapsedClosing
30/06/2019Issue to employees #2 30/10/2021 $1.09 705,000 – – (625,000) 80,000 Issue to employees #3 14/12/2022 $0.39 960,000 – – (300,000) 660,000 Issue to key management personnel #3 14/12/2022 $0.39 400,000 – – (400,000) –Total 2,065,000 – – (1,325,000) 740,000
Options on issue 30 June 2018:
Issue Expiry dateExercise
priceOpening
01/07/2017 Issued Exercised LapsedClosing
30/06/2018Issue to employees #1 30/10/2019 $1.10 100,000 – – (100,000) –Issue to employees #2 30/10/2021 $1.09 1,110,000 – – (405,000) 705,000 Issue to employees #3 14/12/2022 $0.39 1,780,000 – – (820,000 ) 960,000 Issue to key management personnel #1 30/09/2018 $1.10 400,000 – – (400,000 ) –Issue to key management personnel #2 31/10/2019 $1.09 400,000 – – (400,000 ) –Issue to key management personnel #3 14/12/2022 $0.39 400,000 – – – 400,000 Issue to Directors #2 30/11/2019 $1.17 100,000 – – (100,000) –Issue to Directors #3 14/12/2022 $0.39 100,000 – – (100,000) –Total 4,390,000 – – (2,325,000) 2,065,000
For
per
sona
l use
onl
y
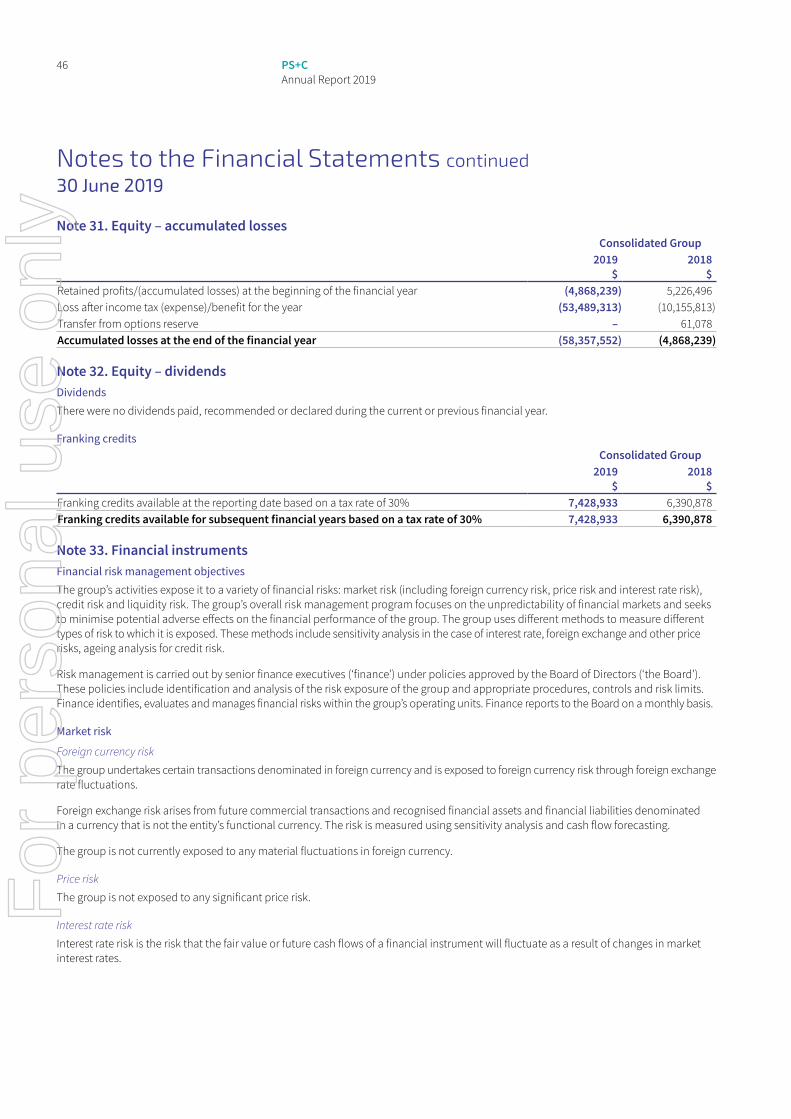
46 PS+C Annual Report 2019
Notes to the Financial Statements continued30 June 2019
Note 31. Equity – accumulated lossesConsolidated Group
2019 $
2018 $
Retained profits/(accumulated losses) at the beginning of the financial year (4,868,239) 5,226,496 Loss after income tax (expense)/benefit for the year (53,489,313) (10,155,813)Transfer from options reserve – 61,078 Accumulated losses at the end of the financial year (58,357,552) (4,868,239)
Note 32. Equity – dividendsDividendsThere were no dividends paid, recommended or declared during the current or previous financial year.
Franking creditsConsolidated Group
2019 $
2018 $
Franking credits available at the reporting date based on a tax rate of 30% 7,428,933 6,390,878 Franking credits available for subsequent financial years based on a tax rate of 30% 7,428,933 6,390,878
Note 33. Financial instrumentsFinancial risk management objectivesThe group’s activities expose it to a variety of financial risks: market risk (including foreign currency risk, price risk and interest rate risk), credit risk and liquidity risk. The group’s overall risk management program focuses on the unpredictability of financial markets and seeks to minimise potential adverse effects on the financial performance of the group. The group uses different methods to measure different types of risk to which it is exposed. These methods include sensitivity analysis in the case of interest rate, foreign exchange and other price risks, ageing analysis for credit risk.
Risk management is carried out by senior finance executives (‘finance’) under policies approved by the Board of Directors (‘the Board’). These policies include identification and analysis of the risk exposure of the group and appropriate procedures, controls and risk limits. Finance identifies, evaluates and manages financial risks within the group’s operating units. Finance reports to the Board on a monthly basis.
Market risk
Foreign currency risk
The group undertakes certain transactions denominated in foreign currency and is exposed to foreign currency risk through foreign exchange rate fluctuations.
Foreign exchange risk arises from future commercial transactions and recognised financial assets and financial liabilities denominated in a currency that is not the entity’s functional currency. The risk is measured using sensitivity analysis and cash flow forecasting.
The group is not currently exposed to any material fluctuations in foreign currency.
Price risk
The group is not exposed to any significant price risk.
Interest rate risk
Interest rate risk is the risk that the fair value or future cash flows of a financial instrument will fluctuate as a result of changes in market interest rates.
For
per
sona
l use
onl
y
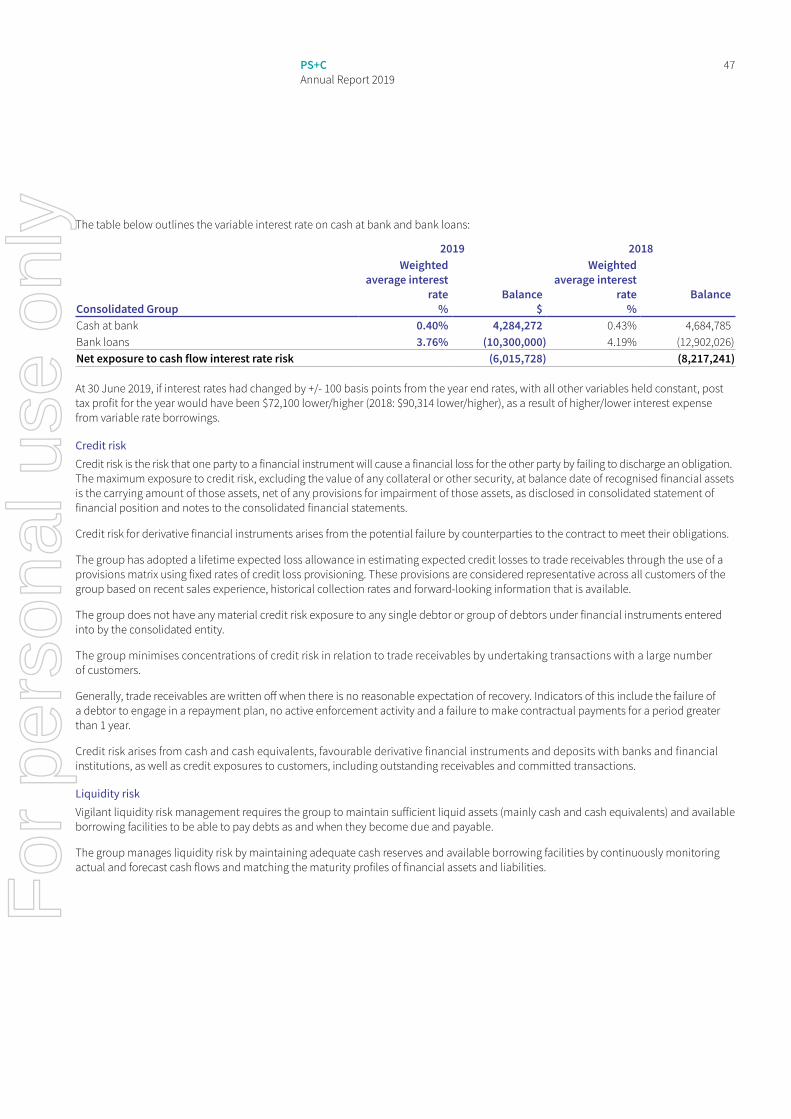
47PS+C Annual Report 2019
The table below outlines the variable interest rate on cash at bank and bank loans:
2019 2018
Consolidated Group
Weighted average interest
rate %
Balance $
Weighted average interest
rate %
Balance
Cash at bank 0.40% 4,284,272 0.43% 4,684,785Bank loans 3.76% (10,300,000) 4.19% (12,902,026)Net exposure to cash flow interest rate risk (6,015,728) (8,217,241)
At 30 June 2019, if interest rates had changed by +/- 100 basis points from the year end rates, with all other variables held constant, post tax profit for the year would have been $72,100 lower/higher (2018: $90,314 lower/higher), as a result of higher/lower interest expense from variable rate borrowings.
Credit riskCredit risk is the risk that one party to a financial instrument will cause a financial loss for the other party by failing to discharge an obligation. The maximum exposure to credit risk, excluding the value of any collateral or other security, at balance date of recognised financial assets is the carrying amount of those assets, net of any provisions for impairment of those assets, as disclosed in consolidated statement of financial position and notes to the consolidated financial statements.
Credit risk for derivative financial instruments arises from the potential failure by counterparties to the contract to meet their obligations.
The group has adopted a lifetime expected loss allowance in estimating expected credit losses to trade receivables through the use of a provisions matrix using fixed rates of credit loss provisioning. These provisions are considered representative across all customers of the group based on recent sales experience, historical collection rates and forward-looking information that is available.
The group does not have any material credit risk exposure to any single debtor or group of debtors under financial instruments entered into by the consolidated entity.
The group minimises concentrations of credit risk in relation to trade receivables by undertaking transactions with a large number of customers.
Generally, trade receivables are written off when there is no reasonable expectation of recovery. Indicators of this include the failure of a debtor to engage in a repayment plan, no active enforcement activity and a failure to make contractual payments for a period greater than 1 year.
Credit risk arises from cash and cash equivalents, favourable derivative financial instruments and deposits with banks and financial institutions, as well as credit exposures to customers, including outstanding receivables and committed transactions.
Liquidity riskVigilant liquidity risk management requires the group to maintain sufficient liquid assets (mainly cash and cash equivalents) and available borrowing facilities to be able to pay debts as and when they become due and payable.
The group manages liquidity risk by maintaining adequate cash reserves and available borrowing facilities by continuously monitoring actual and forecast cash flows and matching the maturity profiles of financial assets and liabilities.
For
per
sona
l use
onl
y
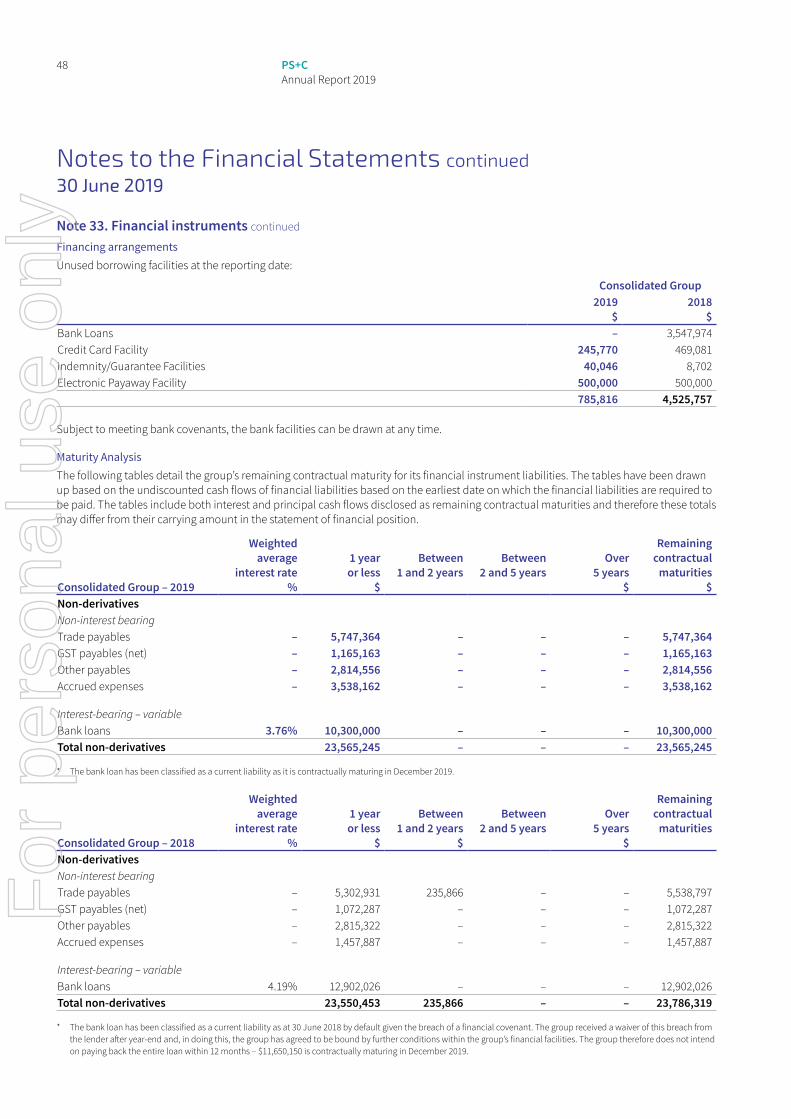
48 PS+C Annual Report 2019
Notes to the Financial Statements continued30 June 2019
Note 33. Financial instruments continued
Financing arrangementsUnused borrowing facilities at the reporting date:
Consolidated Group2019
$2018
$Bank Loans – 3,547,974 Credit Card Facility 245,770 469,081 Indemnity/Guarantee Facilities 40,046 8,702 Electronic Payaway Facility 500,000 500,000
785,816 4,525,757
Subject to meeting bank covenants, the bank facilities can be drawn at any time.
Maturity AnalysisThe following tables detail the group’s remaining contractual maturity for its financial instrument liabilities. The tables have been drawn up based on the undiscounted cash flows of financial liabilities based on the earliest date on which the financial liabilities are required to be paid. The tables include both interest and principal cash flows disclosed as remaining contractual maturities and therefore these totals may differ from their carrying amount in the statement of financial position.
Consolidated Group – 2019
Weighted average
interest rate %
1 year or less
$
Between 1 and 2 years
Between 2 and 5 years
Over 5 years
$
Remaining contractual
maturities $
Non-derivativesNon-interest bearingTrade payables – 5,747,364 – – – 5,747,364GST payables (net) – 1,165,163 – – – 1,165,163Other payables – 2,814,556 – – – 2,814,556Accrued expenses – 3,538,162 – – – 3,538,162
Interest-bearing – variableBank loans 3.76% 10,300,000 – – – 10,300,000Total non-derivatives 23,565,245 – – – 23,565,245
* The bank loan has been classified as a current liability as it is contractually maturing in December 2019.
Consolidated Group – 2018
Weighted average
interest rate %
1 year or less
$
Between 1 and 2 years
$
Between 2 and 5 years
Over 5 years
$
Remaining contractual
maturities
Non-derivativesNon-interest bearingTrade payables – 5,302,931 235,866 – – 5,538,797GST payables (net) – 1,072,287 – – – 1,072,287Other payables – 2,815,322 – – – 2,815,322Accrued expenses – 1,457,887 – – – 1,457,887
Interest-bearing – variableBank loans 4.19% 12,902,026 – – – 12,902,026Total non-derivatives 23,550,453 235,866 – – 23,786,319
* The bank loan has been classified as a current liability as at 30 June 2018 by default given the breach of a financial covenant. The group received a waiver of this breach from the lender after year-end and, in doing this, the group has agreed to be bound by further conditions within the group’s financial facilities. The group therefore does not intend on paying back the entire loan within 12 months – $11,650,150 is contractually maturing in December 2019.
For
per
sona
l use
onl
y
49PS+C Annual Report 2019
The cash flows in the maturity analysis above are not expected to occur significantly earlier than contractually disclosed above.
Fair value of financial instrumentsThe fair values of cash, receivables, other payables and current tax payables approximate their carrying amounts as a result of their short-term maturity.
Note 34. Key management personnel disclosuresCompensationThe aggregate compensation made to directors and other members of key management personnel of the group is set out below:
Consolidated Group2019
$2018
$Short-term employee benefits 1,251,628 1,077,299 Post-employment benefits 107,505 89,583 Termination benefits – 184,359 Share-based payments (230,863) 791,789
1,128,270 2,143,030
Further details of key management personnel compensation are contained within the Remuneration Report section of the Director’s Report.
Note 35. Remuneration of auditorsDuring the financial year the following fees were paid or payable for services provided by Moore Stephens (Vic) Pty Ltd, the auditor of the company:
Consolidated Group2019
$2018
Audit services – Moore Stephens (Vic) Pty LtdAudit or review of the financial statements 167,169 187,500
Other services – Moore Stephens (Vic) Pty LtdOther 2,140 –
169,309 187,500
Note 36. Contingent liabilitiesThe group has given bank guarantees as at 30 June 2019 of $459,954 (2018: $491,298) in satisfaction of building lease guarantees, as per the financing arrangements outlined in Note 33.
Note 37. CommitmentsConsolidated Group
2019 $
2018 $
Lease commitments – operatingCommitted at the reporting date but not recognised as liabilities, payable:Within one year 1,048,208 991,047 One to five years 2,255,675 1,799,662
3,303,883 2,790,709
Operating lease commitments includes contracted amounts for various offices under non-cancellable operating leases expiring within 1 to 4 years with, in some cases, options to extend. The leases have various escalation clauses. On renewal, the terms of the leases are renegotiated.
For
per
sona
l use
onl
y
50 PS+C Annual Report 2019
Notes to the Financial Statements continued30 June 2019
Note 38. Related party transactionsParent entityPS&C Ltd is the parent entity.
SubsidiariesInterests in subsidiaries are set out in Note 41.
Key management personnelDisclosures relating to key management personnel are set out in Note 34 and the remuneration report included in the Directors’ Report.
Transactions with related partiesThere were no transactions with related parties during the current and previous financial year.
Receivable from and payable to related partiesThe following balances are outstanding at the reporting date in relation to transactions with related parties:
Consolidated Group2019
$2018
$Current receivables:Trade receivables from commonly controlled entity – 987,607
Current payables:Trade payables to commonly controlled entity – 987,607
Loans to/from related partiesThe following balances are outstanding at the reporting date in relation to loans with related parties:
Consolidated Group2019
$2018
$Current receivables:Loans to commonly controlled entities 21,673,091 15,347,398
Current borrowings:Loans from commonly controlled entities 21,673,091 15,347,398
Terms and conditionsAll transactions were made on normal commercial terms and conditions and at market rates.
For
per
sona
l use
onl
y
51PS+C Annual Report 2019
Note 39. Parent entity informationSet out below is the supplementary information about the parent entity.
Statement of profit or loss and other comprehensive incomeParent
2019 $
2018 $
Loss after income tax (58,638,606) (15,819,302)Total comprehensive income (58,638,606) (15,819,302)
Statement of financial positionParent
2019 $
2018 $
Total current assets 1,924,638 3,395,708 Total assets 54,450,251 109,300,582 Total current liabilities 40,596,384 39,233,224 Total liabilities 43,328,868 45,493,572
EquityIssued capital 91,206,990 85,029,104 Employee share options/Performance rights reserve 593,769 818,803 Accumulated losses (80,679,376) (22,040,897)
Total equity 11,121,383 63,807,010
Guarantees entered into by the parent entity in relation to the debts of its subsidiariesPlease see Note 42 in relation to the deed of cross guarantee in place.
Contingent liabilitiesThe parent entity has entered into acquisition agreements with the entities described in Note 40. Under the terms of the agreements, the parent entity may have to pay more than what has been provided for in contingent consideration in Note 40 if the entities’ operating performance is better than forecast for the purposes of calculating contingent consideration. Other than that, the parent entity had no contingent liabilities as at 30 June 2019.
Capital commitments – Property, plant and equipmentThe parent entity had no capital commitments for property, plant and equipment at as 30 June 2019.
Significant accounting policiesThe accounting policies of the parent entity are consistent with those of the group, as disclosed in Note 1, except for the following:
• Investments in subsidiaries are accounted for at cost, less any impairment, in the parent entity.• Investments in associates are accounted for at cost, less any impairment, in the parent entity.• Dividends received from subsidiaries are recognised as other income by the parent entity and its receipt may be an indicator
of an impairment of the investment.For
per
sona
l use
onl
y
52 PS+C Annual Report 2019
Notes to the Financial Statements continued30 June 2019
Note 40. Business combinations(a) Current Period
Artisan Consulting Pty Ltd
On 1 February 2019, PS&C Ltd acquired 100% of the ordinary shares of Artisan Consulting Pty Ltd. This business is exclusively focussed on Salesforce solutions and is currently a Salesforce Silver Tier System Implementation/Consulting Partner servicing mid-large enterprises. It operates in the Design + Process division of the group. Details of the purchase consideration, the net assets acquired and goodwill are set out below. The goodwill of $1,562,756 represents the amount of consideration paid for the business acquisition less fair value of net assets, plus additional amounts paid for performance, both current and implied by forecasts. The acquired business contributed revenue of $506,406 and profit after tax of $108,131 from 1 February 2019 to 30 June 2019. If the acquisition occurred on 1 July 2018, the full year contribution would have been a profit after tax of $260,755.
Under the terms of the agreement, the parent entity may have to pay more (or less) than what has been provided for in contingent consideration if the entity’s operating performance is better (or worse) than forecast for the purposes of calculating contingent consideration. The Directors are still assessing any potential impacts to the total consideration transferred whilst within the measurement period.
Details of the acquisition are as follows:
Artisan Consulting Pty
Ltd Fair value $
Total Acquired Fair value
$Cash and cash equivalents 118,918 118,918Trade receivables 56,513 56,513Other payables (41,549) (41,549)Provision for income tax (35,045) (35,045)Employee benefits (20,590) (20,590)
Net assets acquired 78,247 78,247Goodwill 1,562,756 1,562,756Acquisition-date fair value of the total consideration transferred 1,641,003 1,641,003
Representing:Cash paid or payable to vendor 240,000 240,000PS&C Ltd shares issued to vendor 920,889 920,889Deferred consideration 480,114 480,114
1,641,003 1,641,003
Cash used to acquire business, net of cash acquired:Acquisition-date fair value of the total consideration transferred 1,641,003 1,641,003Less: cash and cash equivalents (118,918) (118,918)Less: deferred consideration (480,114) (480,114)Less: shares issued by company as part of consideration (920,889) (920,889)Net cash used 121,082 121,082
Acquisition costs expensed to the statement of profit or loss and other comprehensive income during the year ended 30 June 2019 amounted to $645,037 (2018: $402,526) for services provided by consultants and legal advisers as well as share issue costs. This was incurred in relation to existing businesses and prospective transactions.
During the year ending 30 June 2019, cash payments of $3,090,448 were made to the vendors of the businesses acquired in prior periods, in satisfaction of business purchase and earn out payments as per the terms of the share sale and purchase agreements. In addition, $5,256,998 worth of PS&C Ltd shares (equal to 34,585,514 shares) were issued in satisfaction of business purchase and earn out payments, as per the terms of the share sale and purchase agreements.
For
per
sona
l use
onl
y
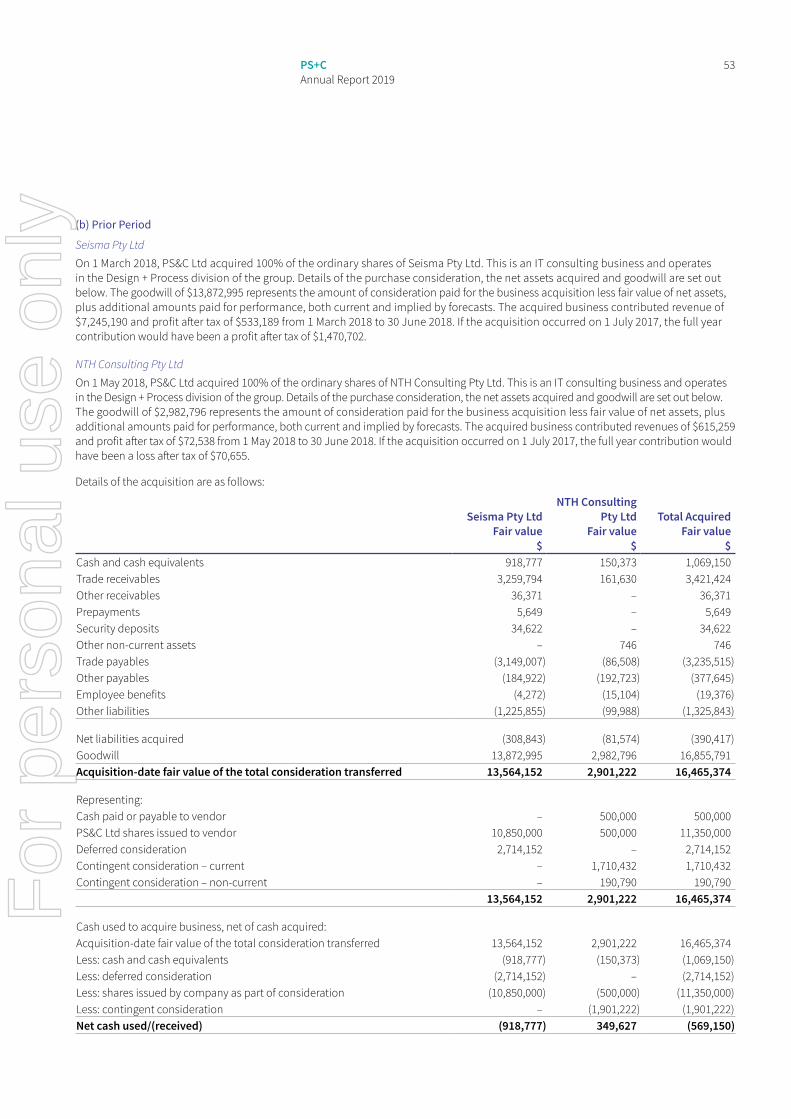
53PS+C Annual Report 2019
(b) Prior Period
Seisma Pty Ltd
On 1 March 2018, PS&C Ltd acquired 100% of the ordinary shares of Seisma Pty Ltd. This is an IT consulting business and operates in the Design + Process division of the group. Details of the purchase consideration, the net assets acquired and goodwill are set out below. The goodwill of $13,872,995 represents the amount of consideration paid for the business acquisition less fair value of net assets, plus additional amounts paid for performance, both current and implied by forecasts. The acquired business contributed revenue of $7,245,190 and profit after tax of $533,189 from 1 March 2018 to 30 June 2018. If the acquisition occurred on 1 July 2017, the full year contribution would have been a profit after tax of $1,470,702.
NTH Consulting Pty Ltd
On 1 May 2018, PS&C Ltd acquired 100% of the ordinary shares of NTH Consulting Pty Ltd. This is an IT consulting business and operates in the Design + Process division of the group. Details of the purchase consideration, the net assets acquired and goodwill are set out below. The goodwill of $2,982,796 represents the amount of consideration paid for the business acquisition less fair value of net assets, plus additional amounts paid for performance, both current and implied by forecasts. The acquired business contributed revenues of $615,259 and profit after tax of $72,538 from 1 May 2018 to 30 June 2018. If the acquisition occurred on 1 July 2017, the full year contribution would have been a loss after tax of $70,655.
Details of the acquisition are as follows:
Seisma Pty Ltd Fair value
$
NTH Consulting Pty Ltd
Fair value $
Total Acquired Fair value
$Cash and cash equivalents 918,777 150,373 1,069,150Trade receivables 3,259,794 161,630 3,421,424Other receivables 36,371 – 36,371Prepayments 5,649 – 5,649Security deposits 34,622 – 34,622Other non-current assets – 746 746Trade payables (3,149,007) (86,508) (3,235,515)Other payables (184,922) (192,723) (377,645)Employee benefits (4,272) (15,104) (19,376)Other liabilities (1,225,855) (99,988) (1,325,843)
Net liabilities acquired (308,843) (81,574) (390,417)Goodwill 13,872,995 2,982,796 16,855,791Acquisition-date fair value of the total consideration transferred 13,564,152 2,901,222 16,465,374
Representing:Cash paid or payable to vendor – 500,000 500,000PS&C Ltd shares issued to vendor 10,850,000 500,000 11,350,000Deferred consideration 2,714,152 – 2,714,152Contingent consideration – current – 1,710,432 1,710,432Contingent consideration – non-current – 190,790 190,790
13,564,152 2,901,222 16,465,374
Cash used to acquire business, net of cash acquired:Acquisition-date fair value of the total consideration transferred 13,564,152 2,901,222 16,465,374Less: cash and cash equivalents (918,777) (150,373) (1,069,150)Less: deferred consideration (2,714,152) – (2,714,152)Less: shares issued by company as part of consideration (10,850,000) (500,000) (11,350,000)Less: contingent consideration – (1,901,222) (1,901,222)Net cash used/(received) (918,777) 349,627 (569,150)
For
per
sona
l use
onl
y
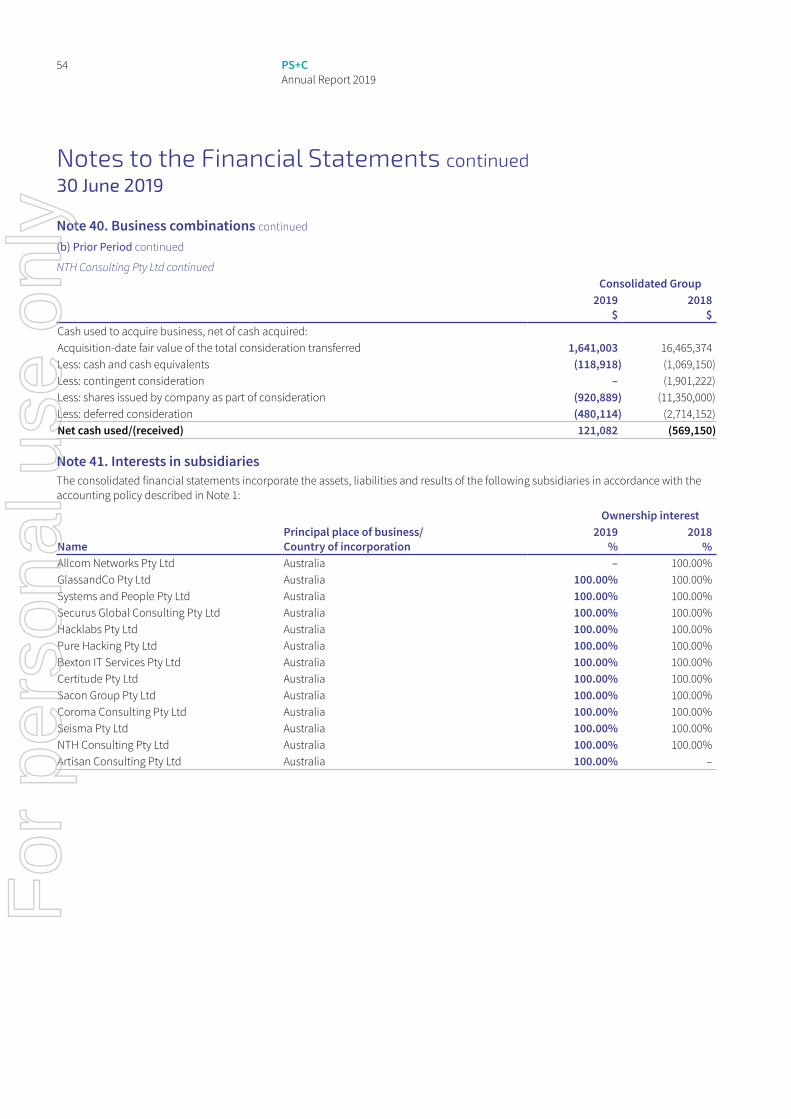
54 PS+C Annual Report 2019
Notes to the Financial Statements continued30 June 2019
Note 40. Business combinations continued
(b) Prior Period continued
NTH Consulting Pty Ltd continuedConsolidated Group
2019 $
2018 $
Cash used to acquire business, net of cash acquired:Acquisition-date fair value of the total consideration transferred 1,641,003 16,465,374 Less: cash and cash equivalents (118,918) (1,069,150)Less: contingent consideration – (1,901,222)Less: shares issued by company as part of consideration (920,889) (11,350,000)Less: deferred consideration (480,114) (2,714,152)Net cash used/(received) 121,082 (569,150)
Note 41. Interests in subsidiariesThe consolidated financial statements incorporate the assets, liabilities and results of the following subsidiaries in accordance with the accounting policy described in Note 1:
Ownership interest
NamePrincipal place of business/ Country of incorporation
2019 %
2018 %
Allcom Networks Pty Ltd Australia – 100.00% GlassandCo Pty Ltd Australia 100.00% 100.00% Systems and People Pty Ltd Australia 100.00% 100.00% Securus Global Consulting Pty Ltd Australia 100.00% 100.00% Hacklabs Pty Ltd Australia 100.00% 100.00% Pure Hacking Pty Ltd Australia 100.00% 100.00% Bexton IT Services Pty Ltd Australia 100.00% 100.00% Certitude Pty Ltd Australia 100.00% 100.00% Sacon Group Pty Ltd Australia 100.00% 100.00% Coroma Consulting Pty Ltd Australia 100.00% 100.00% Seisma Pty Ltd Australia 100.00% 100.00% NTH Consulting Pty Ltd Australia 100.00% 100.00% Artisan Consulting Pty Ltd Australia 100.00% –
For
per
sona
l use
onl
y
55PS+C Annual Report 2019
Note 42. Deed of cross guaranteeThe following entities are party to a deed of cross guarantee under which each company guarantees the debts of the others:
GlassandCo Pty Ltd
Systems and People Pty Ltd
Securus Global Consulting Pty Ltd
Hacklabs Pty Ltd
Pure Hacking Pty Ltd
Bexton IT Services Pty Ltd
Certitude Pty Ltd
Sacon Group Pty Ltd
Coroma Consulting Pty Ltd
Seisma Pty Ltd
NTH Consulting Pty Ltd
PS&C Ltd
By entering into the deed, the wholly-owned entities have been relieved from the requirement to prepare financial statements and Directors’ Report under Corporations Instrument 2016/785 issued by the Australian Securities and Investments Commission.
The above companies represent a ‘Closed Group’ for the purposes of the Corporations Instrument, and as there are no other parties to the deed of cross guarantee that are controlled by PS&C Ltd, they also represent the ‘Extended Closed Group’.
The statement of profit or loss and other comprehensive income and statement of financial position are the same as the group and therefore have not been separately disclosed.
Note 43. Events after the reporting periodThe group has entered into an agreement with Scottish Pacific Business Finance Pty Ltd (‘Scottish Pacific’) to provide a receivables backed financing facility. The Scottish Pacific facility has a funding limit up to $15,000,000. The facility became available on 9 July 2019.
As at 30 June 2019, the group had total debt obligations of $10,300,000 owing to ANZ bank (‘the Lender’). $5,000,000 of the new Scottish Pacific facilities has been directed to reduce the exposure to the ANZ bank. A new loan agreement has therefore been entered into with ANZ bank dated 5 July 2019. The termination date of this new agreement with ANZ bank is 10 December 2019.
On the 2 September 2019, the group announced that the Board had accepted the resignation of its Chief Executive Officer (CEO), Mr Glenn Fielding.
The Board also advised that Mr Kevin McLaine, the group’s Non-Executive Chairman, had advised the Board that he will not seek re-election at the 2019 Annual General Meeting (AGM). Accordingly, Mr McLaine will retire at the end of the AGM when a suitable replacement is appointed.
Mr Robert Hogeland, recently appointed to the Board as an Executive Director, has been appointed Acting CEO until the group completes its internal and external search for a new CEO.
Mr Fielding will work with Mr Hogeland in a handover capacity until the end of September 2019 after which Mr Fielding will become a Non-Executive director of the group.
No other matter or circumstance has arisen since 30 June 2019 that has significantly affected, or may significantly affect the group’s operations, the results of those operations, or the group’s state of affairs in future financial years.
For
per
sona
l use
onl
y
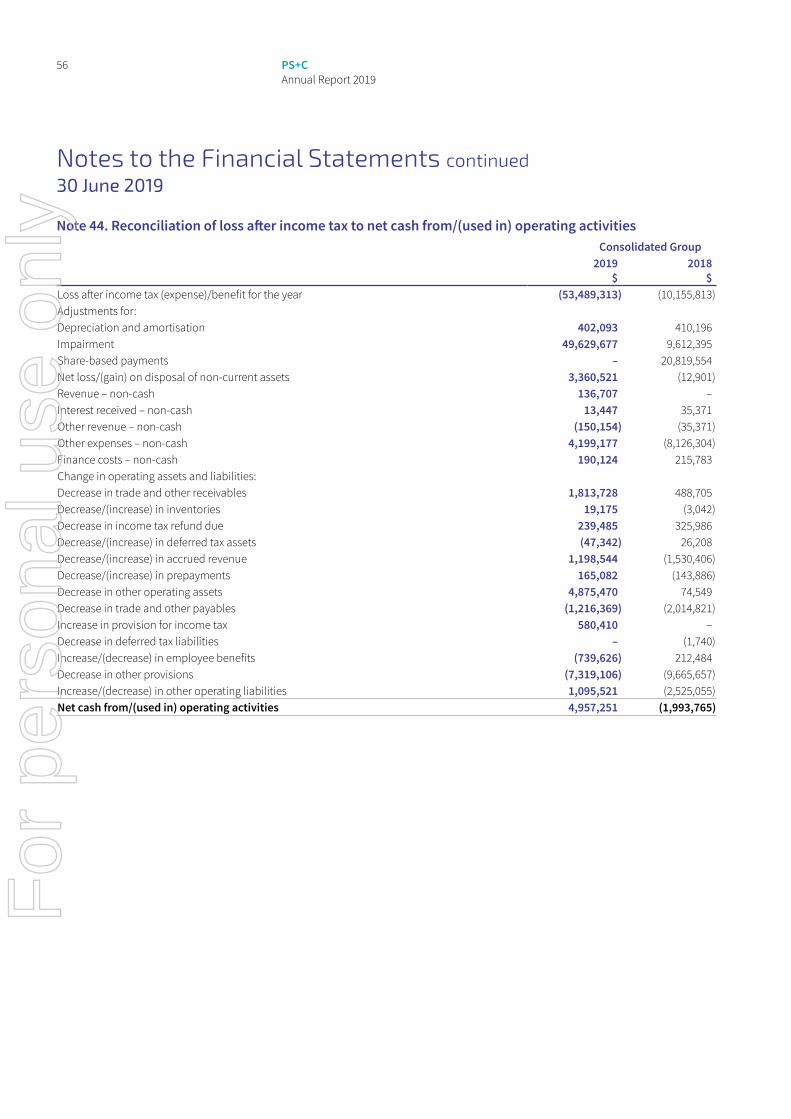
56 PS+C Annual Report 2019
Notes to the Financial Statements continued30 June 2019
Note 44. Reconciliation of loss after income tax to net cash from/(used in) operating activitiesConsolidated Group
2019 $
2018 $
Loss after income tax (expense)/benefit for the year (53,489,313) (10,155,813)Adjustments for:Depreciation and amortisation 402,093 410,196 Impairment 49,629,677 9,612,395 Share-based payments – 20,819,554 Net loss/(gain) on disposal of non-current assets 3,360,521 (12,901)Revenue – non-cash 136,707 – Interest received – non-cash 13,447 35,371 Other revenue – non-cash (150,154) (35,371)Other expenses – non-cash 4,199,177 (8,126,304)Finance costs – non-cash 190,124 215,783 Change in operating assets and liabilities:Decrease in trade and other receivables 1,813,728 488,705 Decrease/(increase) in inventories 19,175 (3,042)Decrease in income tax refund due 239,485 325,986 Decrease/(increase) in deferred tax assets (47,342) 26,208 Decrease/(increase) in accrued revenue 1,198,544 (1,530,406)Decrease/(increase) in prepayments 165,082 (143,886)Decrease in other operating assets 4,875,470 74,549 Decrease in trade and other payables (1,216,369) (2,014,821)Increase in provision for income tax 580,410 – Decrease in deferred tax liabilities – (1,740)Increase/(decrease) in employee benefits (739,626) 212,484 Decrease in other provisions (7,319,106) (9,665,657)Increase/(decrease) in other operating liabilities 1,095,521 (2,525,055)Net cash from/(used in) operating activities 4,957,251 (1,993,765)
For
per
sona
l use
onl
y
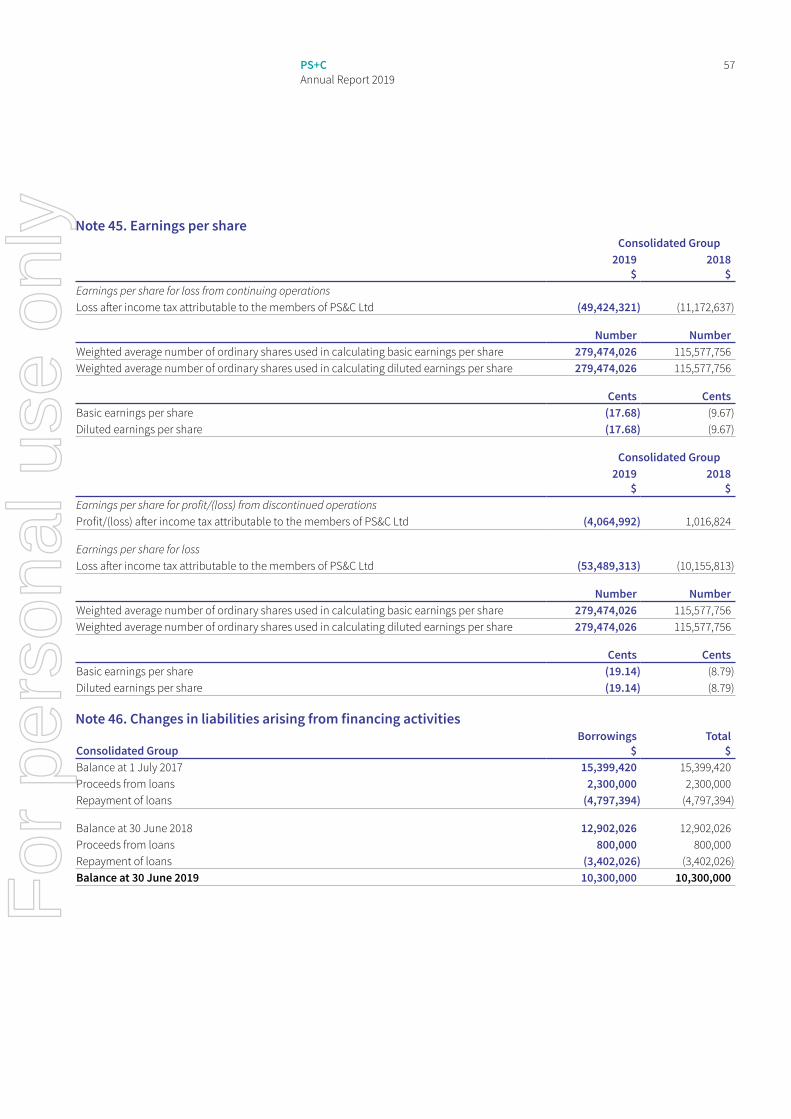
57PS+C Annual Report 2019
Note 45. Earnings per shareConsolidated Group
2019 $
2018 $
Earnings per share for loss from continuing operationsLoss after income tax attributable to the members of PS&C Ltd (49,424,321) (11,172,637)
Number NumberWeighted average number of ordinary shares used in calculating basic earnings per share 279,474,026 115,577,756Weighted average number of ordinary shares used in calculating diluted earnings per share 279,474,026 115,577,756
Cents CentsBasic earnings per share (17.68) (9.67)Diluted earnings per share (17.68) (9.67)
Consolidated Group2019
$2018
$Earnings per share for profit/(loss) from discontinued operationsProfit/(loss) after income tax attributable to the members of PS&C Ltd (4,064,992) 1,016,824
Earnings per share for lossLoss after income tax attributable to the members of PS&C Ltd (53,489,313) (10,155,813)
Number NumberWeighted average number of ordinary shares used in calculating basic earnings per share 279,474,026 115,577,756Weighted average number of ordinary shares used in calculating diluted earnings per share 279,474,026 115,577,756
Cents CentsBasic earnings per share (19.14) (8.79)Diluted earnings per share (19.14) (8.79)
Note 46. Changes in liabilities arising from financing activities
Consolidated GroupBorrowings
$Total
$Balance at 1 July 2017 15,399,420 15,399,420Proceeds from loans 2,300,000 2,300,000Repayment of loans (4,797,394) (4,797,394)
Balance at 30 June 2018 12,902,026 12,902,026Proceeds from loans 800,000 800,000Repayment of loans (3,402,026) (3,402,026)Balance at 30 June 2019 10,300,000 10,300,000F
or p
erso
nal u
se o
nly
58 PS+C Annual Report 2019
Directors’ Declaration30 June 2019
In the Directors’ opinion:
• the attached financial statements and notes comply with the Corporations Act 2001, the Accounting Standards, the Corporations Regulations 2001 and other mandatory professional reporting requirements;
• the attached financial statements and notes comply with International Financial Reporting Standards as issued by the International Accounting Standards Board as described in Note 1 to the financial statements;
• the attached financial statements and notes give a true and fair view of the group’s financial position as at 30 June 2019 and of its performance for the financial year ended on that date;
• there are reasonable grounds to believe that the Company will be able to pay its debts as and when they become due and payable; and
• at the date of this declaration, there are reasonable grounds to believe that the members of the Extended Closed Group will be able to meet any obligations or liabilities to which they are, or may become, subject by virtue of the deed of cross guarantee described in Note 42 to the financial statements.
The Directors have been given the declarations required by section 295A of the Corporations Act 2001.
Signed in accordance with a resolution of Directors made pursuant to section 295(5)(a) of the Corporations Act 2001.
On behalf of the Directors
Glenn Fielding Managing Director
26 September 2019 Melbourne
For
per
sona
l use
onl
y
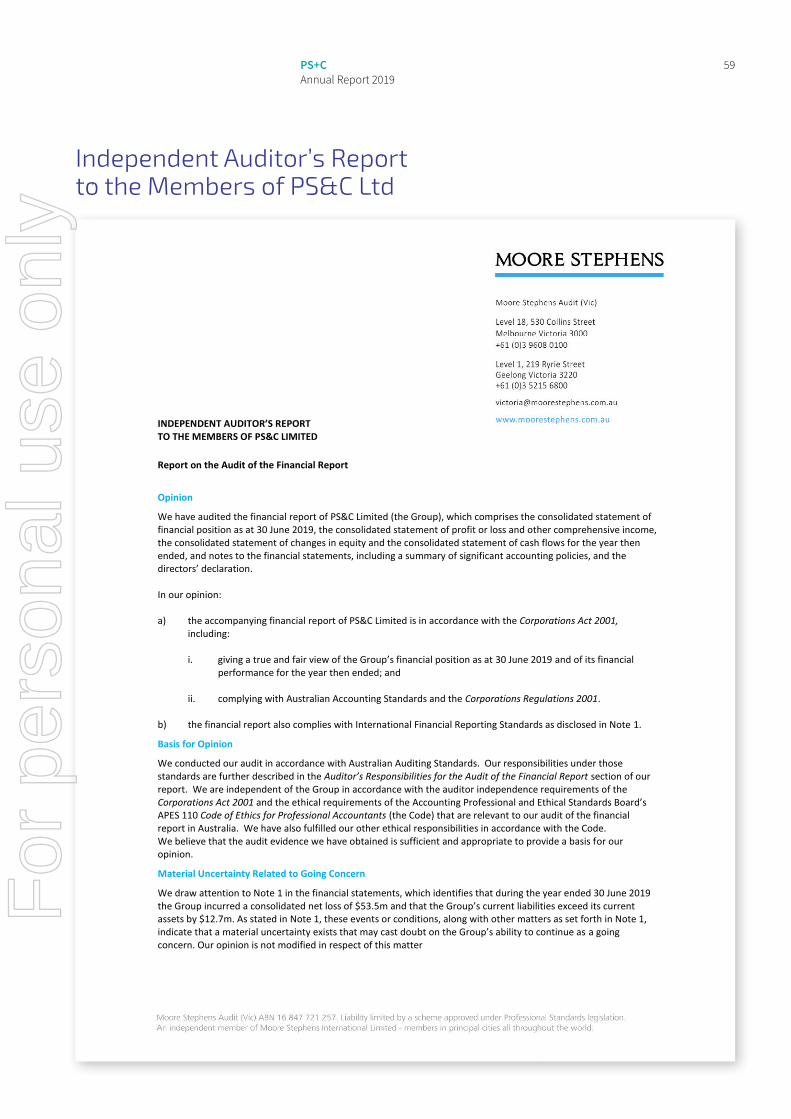
59PS+C Annual Report 2019
INDEPENDENT AUDITOR’S REPORT TO THE MEMBERS OF PS&C LIMITED Report on the Audit of the Financial Report
Opinion
We have audited the financial report of PS&C Limited (the Group), which comprises the consolidated statement of financial position as at 30 June 2019, the consolidated statement of profit or loss and other comprehensive income, the consolidated statement of changes in equity and the consolidated statement of cash flows for the year then ended, and notes to the financial statements, including a summary of significant accounting policies, and the directors’ declaration. In our opinion: a) the accompanying financial report of PS&C Limited is in accordance with the Corporations Act 2001,
including:
i. giving a true and fair view of the Group’s financial position as at 30 June 2019 and of its financial performance for the year then ended; and
ii. complying with Australian Accounting Standards and the Corporations Regulations 2001.
b) the financial report also complies with International Financial Reporting Standards as disclosed in Note 1.
Basis for Opinion
We conducted our audit in accordance with Australian Auditing Standards. Our responsibilities under those standards are further described in the Auditor’s Responsibilities for the Audit of the Financial Report section of our report. We are independent of the Group in accordance with the auditor independence requirements of the Corporations Act 2001 and the ethical requirements of the Accounting Professional and Ethical Standards Board’s APES 110 Code of Ethics for Professional Accountants (the Code) that are relevant to our audit of the financial report in Australia. We have also fulfilled our other ethical responsibilities in accordance with the Code. We believe that the audit evidence we have obtained is sufficient and appropriate to provide a basis for our opinion.
Material Uncertainty Related to Going Concern
We draw attention to Note 1 in the financial statements, which identifies that during the year ended 30 June 2019 the Group incurred a consolidated net loss of $53.5m and that the Group’s current liabilities exceed its current assets by $12.7m. As stated in Note 1, these events or conditions, along with other matters as set forth in Note 1, indicate that a material uncertainty exists that may cast doubt on the Group’s ability to continue as a going concern. Our opinion is not modified in respect of this matter
Independent Auditor’s Report to the Members of PS&C Ltd
INDEPENDENT AUDITOR’S REPORT TO THE MEMBERS OF PS&C LIMITED Report on the Audit of the Financial Report
Opinion
We have audited the financial report of PS&C Limited (the Group), which comprises the consolidated statement of financial position as at 30 June 2019, the consolidated statement of profit or loss and other comprehensive income, the consolidated statement of changes in equity and the consolidated statement of cash flows for the year then ended, and notes to the financial statements, including a summary of significant accounting policies, and the directors’ declaration. In our opinion: a) the accompanying financial report of PS&C Limited is in accordance with the Corporations Act 2001,
including:
i. giving a true and fair view of the Group’s financial position as at 30 June 2019 and of its financial performance for the year then ended; and
ii. complying with Australian Accounting Standards and the Corporations Regulations 2001.
b) the financial report also complies with International Financial Reporting Standards as disclosed in Note 1.
Basis for Opinion
We conducted our audit in accordance with Australian Auditing Standards. Our responsibilities under those standards are further described in the Auditor’s Responsibilities for the Audit of the Financial Report section of our report. We are independent of the Group in accordance with the auditor independence requirements of the Corporations Act 2001 and the ethical requirements of the Accounting Professional and Ethical Standards Board’s APES 110 Code of Ethics for Professional Accountants (the Code) that are relevant to our audit of the financial report in Australia. We have also fulfilled our other ethical responsibilities in accordance with the Code. We believe that the audit evidence we have obtained is sufficient and appropriate to provide a basis for our opinion.
Material Uncertainty Related to Going Concern
We draw attention to Note 1 in the financial statements, which identifies that during the year ended 30 June 2019 the Group incurred a consolidated net loss of $53.5m and that the Group’s current liabilities exceed its current assets by $12.7m. As stated in Note 1, these events or conditions, along with other matters as set forth in Note 1, indicate that a material uncertainty exists that may cast doubt on the Group’s ability to continue as a going concern. Our opinion is not modified in respect of this matter
For
per
sona
l use
onl
y
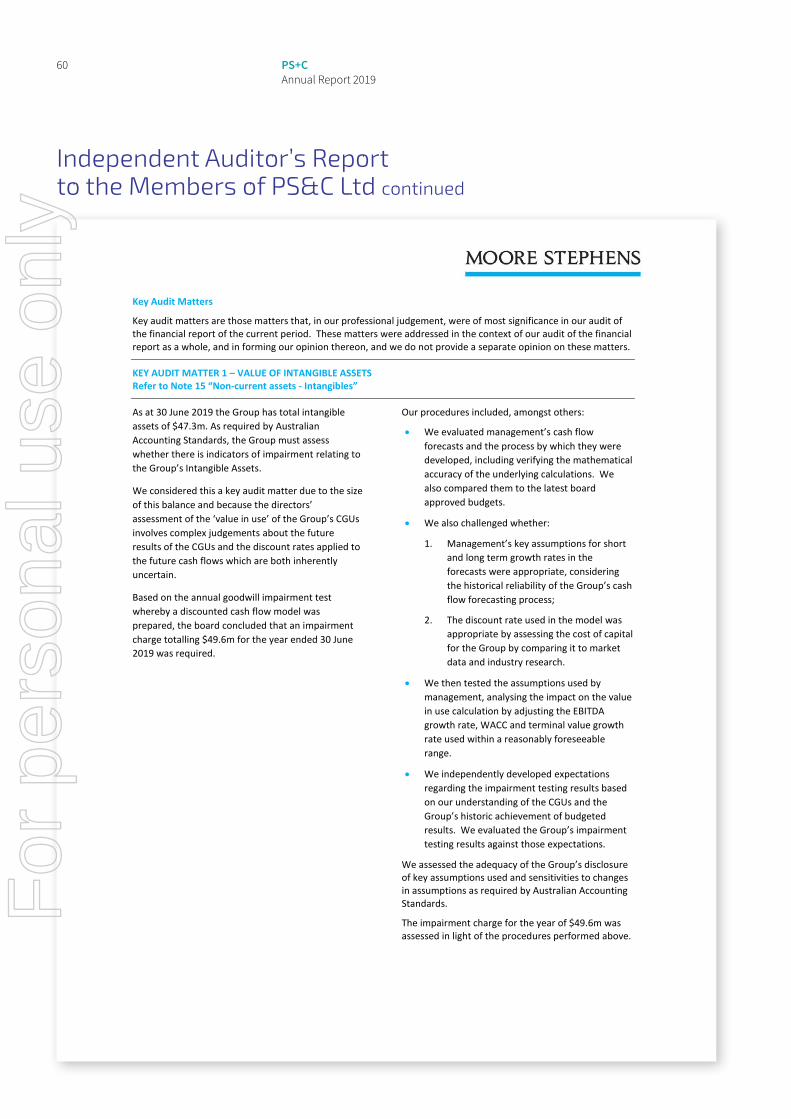
60 PS+C Annual Report 2019
Independent Auditor’s Report to the Members of PS&C Ltd continued
Key Audit Matters
Key audit matters are those matters that, in our professional judgement, were of most significance in our audit of the financial report of the current period. These matters were addressed in the context of our audit of the financial report as a whole, and in forming our opinion thereon, and we do not provide a separate opinion on these matters.
KEY AUDIT MATTER 1 – VALUE OF INTANGIBLE ASSETS Refer to Note 15 “Non-current assets - Intangibles”
As at 30 June 2019 the Group has total intangible assets of $47.3m. As required by Australian Accounting Standards, the Group must assess whether there is indicators of impairment relating to the Group’s Intangible Assets.
We considered this a key audit matter due to the size of this balance and because the directors’ assessment of the ‘value in use’ of the Group’s CGUs involves complex judgements about the future results of the CGUs and the discount rates applied to the future cash flows which are both inherently uncertain.
Based on the annual goodwill impairment test whereby a discounted cash flow model was prepared, the board concluded that an impairment charge totalling $49.6m for the year ended 30 June 2019 was required.
Our procedures included, amongst others:
We evaluated management’s cash flow forecasts and the process by which they were developed, including verifying the mathematical accuracy of the underlying calculations. We also compared them to the latest board approved budgets.
We also challenged whether:
1. Management’s key assumptions for short and long term growth rates in the forecasts were appropriate, considering the historical reliability of the Group’s cash flow forecasting process;
2. The discount rate used in the model was appropriate by assessing the cost of capital for the Group by comparing it to market data and industry research.
We then tested the assumptions used by management, analysing the impact on the value in use calculation by adjusting the EBITDA growth rate, WACC and terminal value growth rate used within a reasonably foreseeable range.
We independently developed expectations regarding the impairment testing results based on our understanding of the CGUs and the Group’s historic achievement of budgeted results. We evaluated the Group’s impairment testing results against those expectations.
We assessed the adequacy of the Group’s disclosure of key assumptions used and sensitivities to changes in assumptions as required by Australian Accounting Standards.
The impairment charge for the year of $49.6m was assessed in light of the procedures performed above.
For
per
sona
l use
onl
y
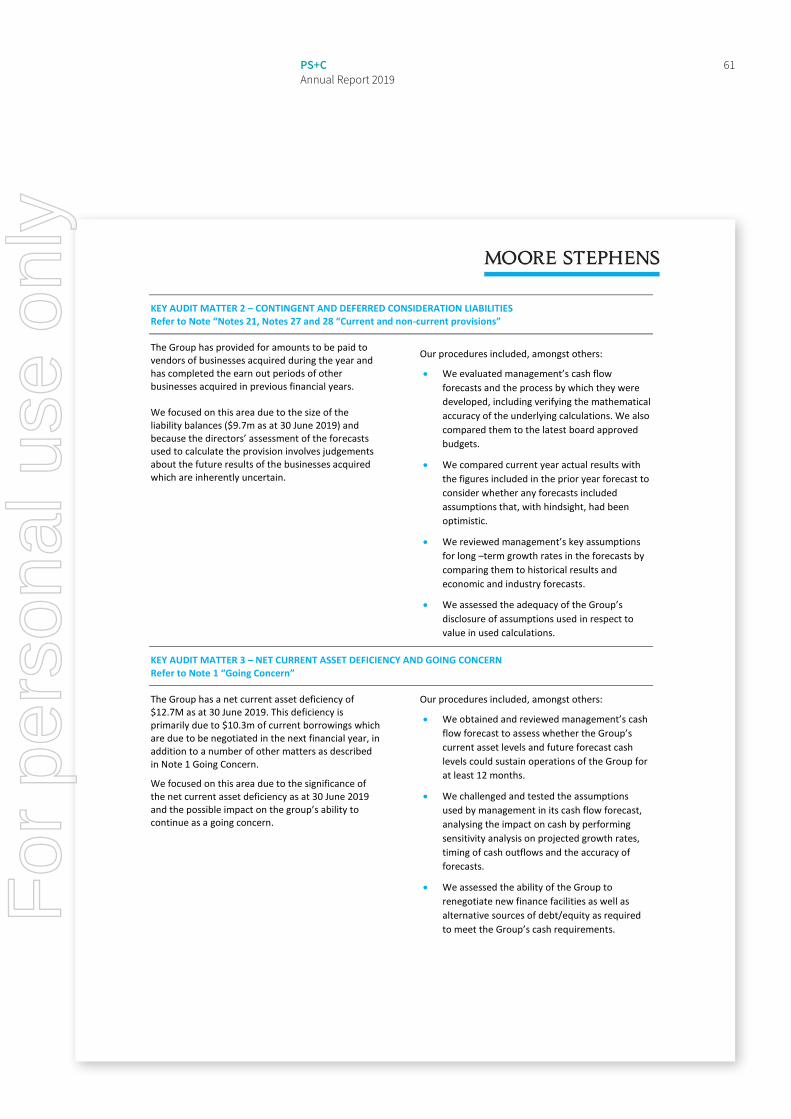
61PS+C Annual Report 2019
KEY AUDIT MATTER 2 – CONTINGENT AND DEFERRED CONSIDERATION LIABILITIES Refer to Note “Notes 21, Notes 27 and 28 “Current and non-current provisions”
The Group has provided for amounts to be paid to vendors of businesses acquired during the year and has completed the earn out periods of other businesses acquired in previous financial years. We focused on this area due to the size of the liability balances ($9.7m as at 30 June 2019) and because the directors’ assessment of the forecasts used to calculate the provision involves judgements about the future results of the businesses acquired which are inherently uncertain.
Our procedures included, amongst others:
We evaluated management’s cash flow forecasts and the process by which they were developed, including verifying the mathematical accuracy of the underlying calculations. We also compared them to the latest board approved budgets.
We compared current year actual results with the figures included in the prior year forecast to consider whether any forecasts included assumptions that, with hindsight, had been optimistic.
We reviewed management’s key assumptions for long –term growth rates in the forecasts by comparing them to historical results and economic and industry forecasts.
We assessed the adequacy of the Group’s disclosure of assumptions used in respect to value in used calculations.
KEY AUDIT MATTER 3 – NET CURRENT ASSET DEFICIENCY AND GOING CONCERN Refer to Note 1 “Going Concern”
The Group has a net current asset deficiency of $12.7M as at 30 June 2019. This deficiency is primarily due to $10.3m of current borrowings which are due to be negotiated in the next financial year, in addition to a number of other matters as described in Note 1 Going Concern.
We focused on this area due to the significance of the net current asset deficiency as at 30 June 2019 and the possible impact on the group’s ability to continue as a going concern.
Our procedures included, amongst others:
We obtained and reviewed management’s cash flow forecast to assess whether the Group’s current asset levels and future forecast cash levels could sustain operations of the Group for at least 12 months.
We challenged and tested the assumptions used by management in its cash flow forecast, analysing the impact on cash by performing sensitivity analysis on projected growth rates, timing of cash outflows and the accuracy of forecasts.
We assessed the ability of the Group to renegotiate new finance facilities as well as alternative sources of debt/equity as required to meet the Group’s cash requirements.
For
per
sona
l use
onl
y
62 PS+C Annual Report 2019
Independent Auditor’s Report to the Members of PS&C Ltd continued
Other Information
The directors are responsible for the other information. The other information comprises the information included in the Group’s annual report for the year ended 30 June 2019, but does not include the financial report and our auditor’s report thereon. Our opinion on the financial report does not cover the other information and accordingly we do not express any form of assurance conclusion thereon. In connection with our audit of the financial report, our responsibility is to read the other information and, in doing so, consider whether the other information is materially inconsistent with the financial report or our knowledge obtained in the audit or otherwise appears to be materially misstated. If, based on the work we have performed, we conclude that there is a material misstatement of this other information, we are required to report that fact. We have nothing to report in this regard.
Responsibilities of the Directors for the Financial Report
The directors of the Company are responsible for the preparation of the financial report that gives a true and fair view in accordance with Australian Accounting Standards and the Corporations Act 2001 and for such internal control as the directors determine is necessary to enable the preparation of the financial report that gives a true and fair view and is free from material misstatement, whether due to fraud or error. In preparing the financial report, the directors are responsible for assessing the ability of the Company to continue as a going concern, disclosing, as applicable, matters related to going concern and using the going concern basis of accounting unless the directors either intend to liquidate the Company or to cease operations, or has no realistic alternative but to do so.
Auditor’s Responsibilities for the Audit of the Financial Report
Our objectives are to obtain reasonable assurance about whether the financial report as a whole is free from material misstatement, whether due to fraud or error, and to issue an auditor’s report that includes our opinion. Reasonable assurance is a high level of assurance, but is not a guarantee that an audit conducted in accordance with the Australian Auditing Standards will always detect a material misstatement when it exists. Misstatements can arise from fraud or error and are considered material if, individually or in the aggregate, they could reasonably be expected to influence the economic decisions of users taken on the basis of this financial report.
A further description of our responsibilities for the audit of the financial report is located on the Auditing and Assurance Standards Board website at: http://www.auasb.gov.au/auditors_responsibilities/ar1.pdf. This description forms part of our auditor’s report. We also provide the directors with a statement that we have complied with relevant ethical requirements regarding independence, and to communicate with them all relationships and other matters that may reasonably be thought to bear on our independence, and where applicable, related safeguards. From the matters communicated with the directors, we determine those matters that were of most significance in the audit of the financial report of the current period and are therefore the key audit matters. We describe these matters in our auditor’s report unless law or regulation precludes public disclosure about the matter or when, in extremely rare circumstances, we determine that a matter should not be communicated in our report because the adverse consequences of doing so would reasonably be expected to outweigh the public interest benefits of such communication.
For
per
sona
l use
onl
y
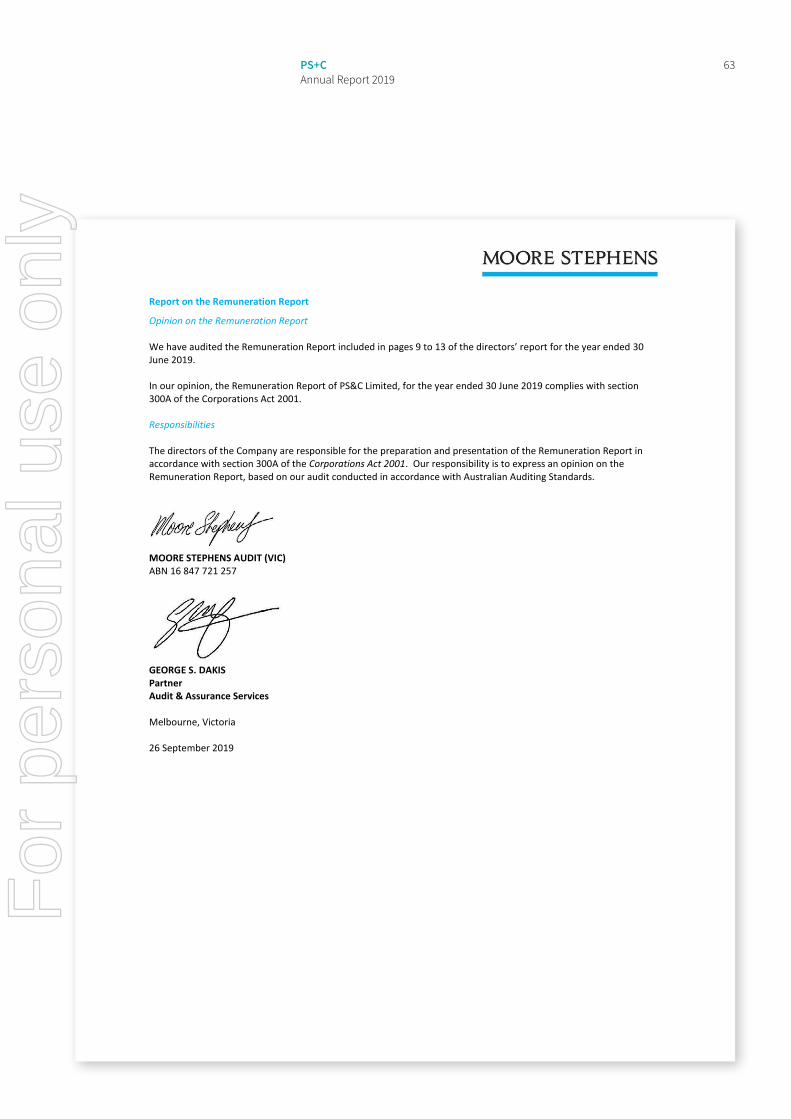
63PS+C Annual Report 2019
Report on the Remuneration Report
Opinion on the Remuneration Report We have audited the Remuneration Report included in pages 9 to 13 of the directors’ report for the year ended 30 June 2019. In our opinion, the Remuneration Report of PS&C Limited, for the year ended 30 June 2019 complies with section 300A of the Corporations Act 2001. Responsibilities The directors of the Company are responsible for the preparation and presentation of the Remuneration Report in accordance with section 300A of the Corporations Act 2001. Our responsibility is to express an opinion on the Remuneration Report, based on our audit conducted in accordance with Australian Auditing Standards.
MOORE STEPHENS AUDIT (VIC) ABN 16 847 721 257
GEORGE S. DAKIS Partner Audit & Assurance Services Melbourne, Victoria 26 September 2019
For
per
sona
l use
onl
y
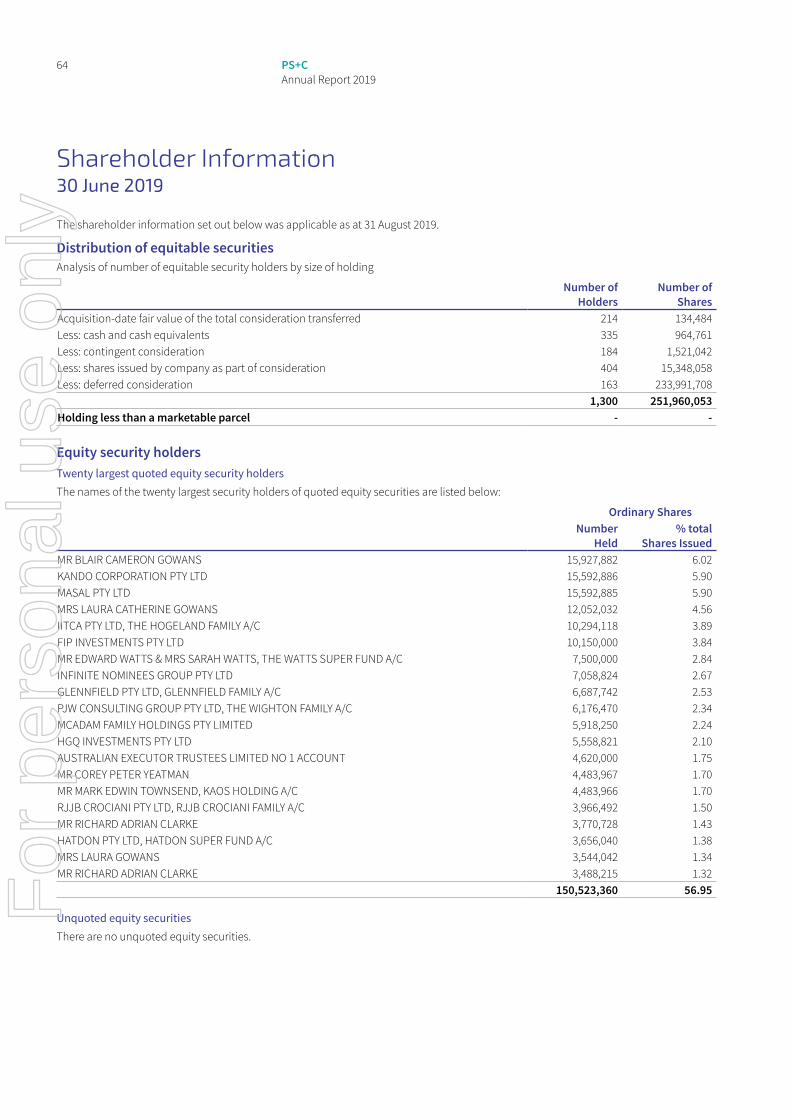
64 PS+C Annual Report 2019
The shareholder information set out below was applicable as at 31 August 2019.
Distribution of equitable securitiesAnalysis of number of equitable security holders by size of holding
Number of Holders
Number of Shares
Acquisition-date fair value of the total consideration transferred 214 134,484Less: cash and cash equivalents 335 964,761Less: contingent consideration 184 1,521,042Less: shares issued by company as part of consideration 404 15,348,058Less: deferred consideration 163 233,991,708
1,300 251,960,053Holding less than a marketable parcel - -
Equity security holdersTwenty largest quoted equity security holdersThe names of the twenty largest security holders of quoted equity securities are listed below:
Ordinary Shares Number
Held% total
Shares IssuedMR BLAIR CAMERON GOWANS 15,927,882 6.02KANDO CORPORATION PTY LTD 15,592,886 5.90MASAL PTY LTD 15,592,885 5.90MRS LAURA CATHERINE GOWANS 12,052,032 4.56IITCA PTY LTD, THE HOGELAND FAMILY A/C 10,294,118 3.89FIP INVESTMENTS PTY LTD 10,150,000 3.84MR EDWARD WATTS & MRS SARAH WATTS, THE WATTS SUPER FUND A/C 7,500,000 2.84INFINITE NOMINEES GROUP PTY LTD 7,058,824 2.67GLENNFIELD PTY LTD, GLENNFIELD FAMILY A/C 6,687,742 2.53PJW CONSULTING GROUP PTY LTD, THE WIGHTON FAMILY A/C 6,176,470 2.34MCADAM FAMILY HOLDINGS PTY LIMITED 5,918,250 2.24HGQ INVESTMENTS PTY LTD 5,558,821 2.10AUSTRALIAN EXECUTOR TRUSTEES LIMITED NO 1 ACCOUNT 4,620,000 1.75MR COREY PETER YEATMAN 4,483,967 1.70MR MARK EDWIN TOWNSEND, KAOS HOLDING A/C 4,483,966 1.70RJJB CROCIANI PTY LTD, RJJB CROCIANI FAMILY A/C 3,966,492 1.50MR RICHARD ADRIAN CLARKE 3,770,728 1.43HATDON PTY LTD, HATDON SUPER FUND A/C 3,656,040 1.38MRS LAURA GOWANS 3,544,042 1.34MR RICHARD ADRIAN CLARKE 3,488,215 1.32
150,523,360 56.95
Unquoted equity securitiesThere are no unquoted equity securities.
Shareholder Information30 June 2019
For
per
sona
l use
onl
y
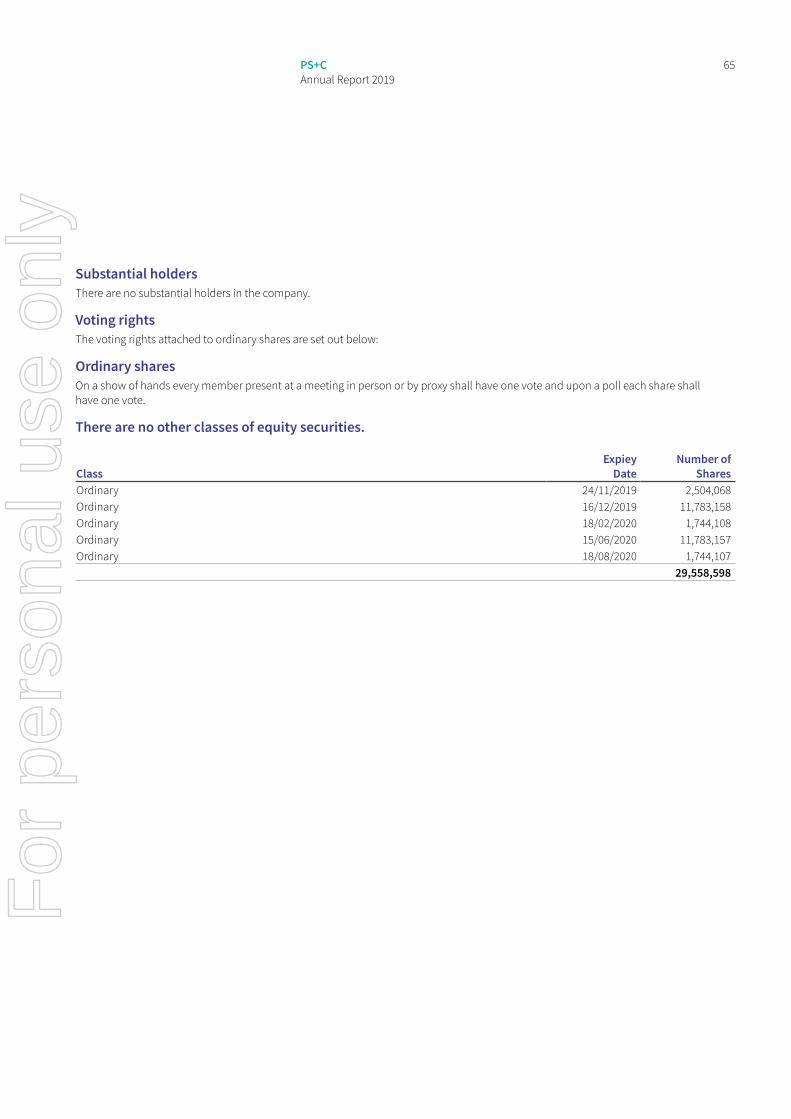
65PS+C Annual Report 2019
Substantial holdersThere are no substantial holders in the company.
Voting rightsThe voting rights attached to ordinary shares are set out below:
Ordinary sharesOn a show of hands every member present at a meeting in person or by proxy shall have one vote and upon a poll each share shall have one vote.
There are no other classes of equity securities.
ClassExpiey
DateNumber of
SharesOrdinary 24/11/2019 2,504,068Ordinary 16/12/2019 11,783,158Ordinary 18/02/2020 1,744,108Ordinary 15/06/2020 11,783,157Ordinary 18/08/2020 1,744,107
29,558,598
For
per
sona
l use
onl
y

For
per
sona
l use
onl
y