Embed Size (px)
DESCRIPTION
Provincial tests tell parents:. how their child compares against provincial standards whether the child is learning what he or she is expected to learn. Benefits. Provincial tests help schools:. monitor student progress in relation to school achievement targets - PowerPoint PPT Presentation
Citation preview

Provincial tests tell parents:
how their child compares against provincial standards
whether the child is learning what he or she is expected to learn
Benefits

Provincial tests help schools:
monitor student progress in relation to school achievement targets
improve classroom instructional practices by identifying relative strengths and weaknesses
develop action plans to increase student understanding in specific areas of the curriculum
Benefits

Provincial tests tell Albertans:
how well Alberta students are learning the Alberta curriculum
which areas of the curriculum need improvement
Benefits

Achievement Tests - Grade 3
Part A - Writing 70 minutes May
Part B - Reading June
Mathematics Timed Number Facts May
Multiple Choice June
60 minutes
6 minutes
60 minutes
English Language Arts

Achievement Tests - Grade 6
Part A - Writing 120 minutes
May
Part B - Reading June
Mathematics Operations and Number Sense May
Multiple Choice June
60 minutes
30 minutes
60 minutes
English Language Arts
ScienceMultiple Choice June60 minutes
Social Studies
Multiple Choice June60 minutes
Tips for parents
achievement tests are like any other test
excessive test rehearsals and coaching should be discouraged
one way parents can help their children is by supporting their development of strong reading skills

Achievement tests
achievement tests are aligned with the curriculum
the best preparation for achievement tests is classroom instruction based on the full range of learning outcomes in the Alberta curriculum

Test accommodations
may include larger print, Braille, audiotapes, a scribe, more time
help students with special test writing needs do their best
are aligned with daily instructional practice as outlined in the individual program plan

Teacher involvement
writing, revising and reviewing questions
setting standards
developing scoring guides
field testing
validating the tests
administering the tests
marking the tests

Use of test results
no single test can assess everything
large scale provincial testing is intended for use in conjunction with classroom assessment strategies
the clearest picture of student growth and development is gained when a wide variety of assessment information is considered

Report cards
the teacher is responsible for classroom assessment
teachers and school jurisdictions decide whether or not to use the results for the students’ final grades
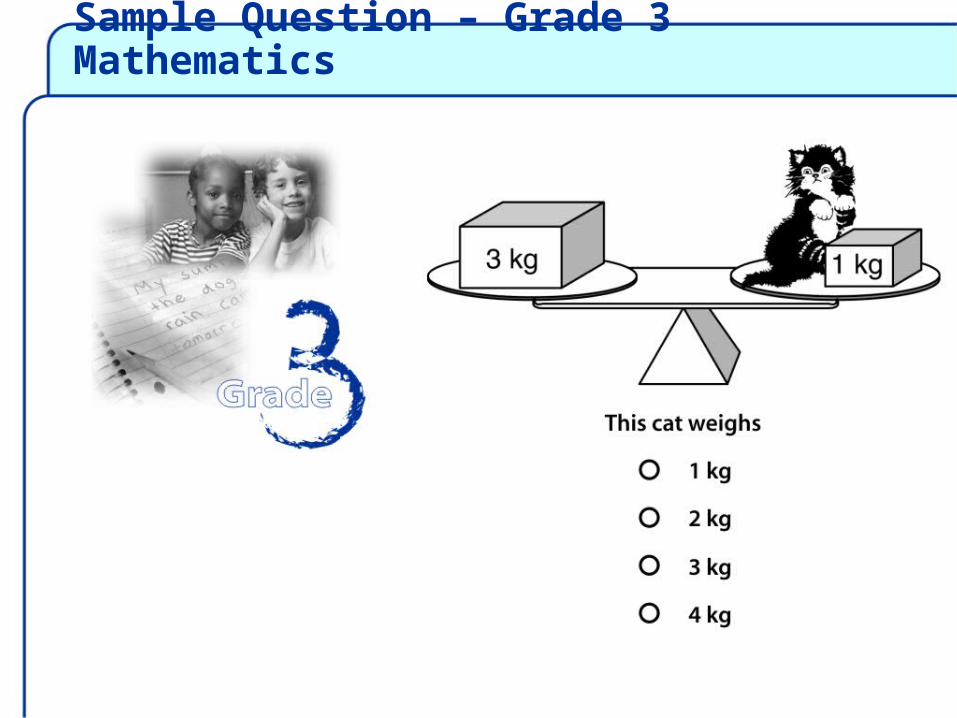
Sample Question – Grade 3 Mathematics

Sample Question – Grade 3 Mathematics

Sample Question – Grade 3 Mathematics
Core Learning Outcomes
estimating mass
using a standard unit (kg)

Sample Question – Grade 6 Science

Sample Question – Grade 6 Science

Sample Question – Grade 6 Science
Core Learning Outcomes
Air, Aerodynamics and Flight theory
Identify elevators as the structure of an airplane that controls its descent

Provincial Expectations – Achievement Tests
Alberta Learning has shifted away from an expectation on achievement tests that 15% of students achieve the standard of excellence and at least 85% achieve the acceptable standard.
emphasis now placed on continuous improvement – comparing results to stated targets and performance over time

School Results – Grade 3
Results
SchoolResults
2007Provincial
Results
English Language Arts
Acceptable 84.6% 89.1%
Excellence
Below Acc.
15.4%
15.4%
19.6%
10.9%
Mathematics Acceptable 76.9% 88.4%
Excellence
Below Acc.
15.4%
23.1%
25.9%
11.6%

Grade 3 Writing
Writing
Standard School Results
Provincial Results
Acceptable 84.6% 89.1%
Excellence 92.3% 90.6%
Below Acceptable
7.7% 9.4%

Participation Report
13 students wrote both parts of the test
- 2 were ESL
- 3 were Special Education
- 8 were regular
- 1 student was absent
- 2 students were excused
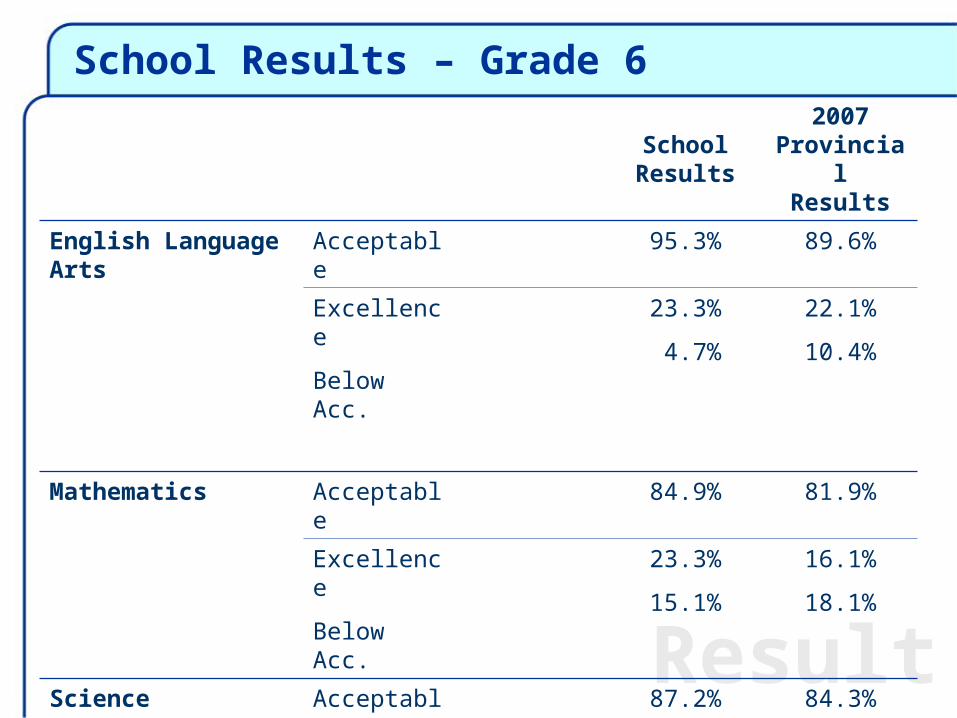
School Results – Grade 6
Results
SchoolResults
2007Provincial
Results
English Language Arts
Acceptable
95.3% 89.6%
Excellence
Below Acc.
23.3%
4.7%
22.1%
10.4%
Mathematics Acceptable
84.9% 81.9%
Excellence
Below Acc.
23.3%
15.1%
16.1%
18.1%
Science Acceptable
87.2% 84.3%
Excellence
Below Acc.
33.7%
12.8%
30.2%
15.7%
Social Studies Acceptable
89.5% 86.4%
Excellence
Below Acc.
27.9%
10.5%
25.5%
13.6%

Grade 6 - Writing
Writing
Standard School Results
Provincial Results
Acceptable 97.7% 89.4%
Excellence 23.3% 22.1%
Below Acceptable
4.7% 10.4%

Participation Report
86 students wrote the tests
-33 were ESL*
-17 were Special Education
-37 were regular students
- 0 students were absent
- 6 students were excused

Next Steps: School Councils and School Staff
What are the strengths of our instructional programs?
*a three year Alberta Initiative for School Improvement (AISI) which focused on looking deeper into curriculum using multiple literacies
* a Mathematics goal in our 2007-2008 School Development Plan
* student support team that provides ESL support and modified programming
*teacher professional development focusing on writing and using multiple literacies and best practices in Mathematics
Discussion

What are the areas requiring improvement?
* Mathematics – skills, knowledge and multi-step problem solving
*Writing is improving but still remains a focus
*Reading for meaning; understanding main ideas/details; organization of ideas and relationships between form and content;associating meaning and synthesizing ideas (Informational, Narrative and Poetic)
Areas for the School to focus on

What factors could be contributing to our students’ performance?
*Increased number of ESL students and students with special needs
*Number of students moving into the school throughout the year
Significant Factors

Multi- Year Results – Grade 3 Language Arts
2005-2006 N=17
Total Test-Language Arts
Acceptable =14 students (63.6%)
Standard of Excellence=3 students (13.6%)
Below Acceptable Standard=3 students (13.6%)
2006-2007 N=13
Total Test-Language Arts
Acceptable =11 students (84.6%)
Standard of Excellence=2 students (15.4%)
Below Acceptable Standard=2 students (15.4%)

Gr. 3 Language Arts Targets for 2005-2007
An increase in the number of students at the Acceptable Standard in Reading
2005 there were 13 students out of the 18 students who wrote at the Acceptable Level (72.2%)
2006 –there were 14 students out of the 17 students who wrote at the Acceptable Level (82.4%)
2007 – there were 11 students out of 13 students who wrote at the Acceptable Level (84.6%)

Multi Year Grade 3 Mathematics
2005-2006 N=17
Total Test –Mathematics
Acceptable=14 students (82.4%)
Standard of Excellence =3 students (17.6%)
Below Acceptable Standard = 3 students (18.6%)
2006-2007 N=13
Total Test –Mathematics
Acceptable=10 students (76.9%)
Standard of Excellence =2 students (15.4%)
Below Acceptable Standard = 3 students (23.1%)

Gr. 3 Mathematics Targets for 2005-2007
Working towards increasing the number of students at the Acceptable Standard in Mathematics
2005 there were 14 students out of 18 students at the Acceptable Level (73.7%)
2006 there were 14 students out of 17 students at the Acceptable Level (63.6%)
2007 there were 10 students out of 13 students at the Acceptable Level (62.6%)

Multi-Year Results – Grade 6 Language Arts
2005-2006 N= 43
Total Test – Language Arts
Acceptable = 38 students (88.4%)
Standard of Excellence =8 students (18.6%)
Below Acceptable Standard =5 students (11.6%)
2006-2007 N= 86
Total Test – Language Arts
Acceptable = 82 students (95.3%)
Standard of Excellence =20 students (23.3%)
Below Acceptable Standard =4 students (4.7%)

Gr. 6 Language Arts Targets for 2005-2007
An increase in the number of students at the Acceptable Standard in Language Arts
2005 there were 62 students out of 68 students at the Acceptable Level (89.9%)
2006 there were 38 students out of 43 students at the Acceptable Level (70.4%)
2007 there were 82 students out of 86 students at the Acceptable Level (89.1%)

Multi-Year Results – Grade 6 Mathematics
2005-2006 N=41
Total Test-Mathematics
Acceptable =38 students (70.4%)
Standard of Excellence =11 students (20.4%)
Below Acceptable Standard =3 students (5.6%)
2006-2007 N=86
Total Test-Mathematics
Acceptable =73 students (84.9%)
Standard of Excellence =20 students (23.3%)
Below Acceptable Standard =13 students (15.1%)

Gr. 6 Mathematics Targets for 2005-2007
An increase in the number of students at the Acceptable Level
2005 there were 62 students out of 67 students at the Acceptable Level (89.9%)
2006 there were 38 students out of 41 students at the Acceptable Level (70.4%)
2007 there were 73 students out of 86 students at the Acceptable Level (79.3%)

Multi-Year Grade 6 Science
2005-2006 N=43
Total Test -Science
Acceptable=41 students (95.3%)
Standard of Excellence=18 students (41.9%)
Below Acceptable Standard =2 students (4.7%)
2006-2007 N=86
Total Test -Science
Acceptable=75 students (87.2%)
Standard of Excellence=29 students (33.7%)
Below Acceptable Standard =11 students (12.8%)

Gr. 6 Science Targets for 2005-2007
An increase in the number of students at the Acceptable Level
2005 there were 61 students out of 68 students at the Acceptable Level (88.4%)
2006 there were 41 students out of 43 students at the Acceptable Level (75.9%)
2007 there were 75 students out of 86 students at the Acceptable Level (81.5%)

Multi-Year Grade 6 Social Studies
2005-2006 N=44
Total Test – Social Studies
Acceptable=42 students (77.8%)
Standard of Excellence=12 students (22.2%)
Below Acceptable Standard =2 students (3.7%)
2006-2007 N=86
Total Test – Social Studies
Acceptable=77 students (89.5%)
Standard of Excellence=24 students (27.9%)
Below Acceptable Standard =9 students (10.5%)

Gr. 6 Social Studies Targets for 2005-2007
An increase in the number of students at the Acceptable Level
2005 there were 63 students out of 68 students at the Acceptable Level (91.3%)
2006 there were 42 students out of 44 students at the Acceptable Level (77.8%)
2007 there were 77 students out of 86 students at the Acceptable Level (83.7%)

Next Steps: School Councils and School Staff
What are our school achievement targets for this year?
*5% more students will be at the acceptable standard
*5% more students will be at the excellence standard
Discussion

What plans address the areas requiring improvement and help students succeed?
*Following the Class Size Initiative
*Support in target area of Guided Writing and Mathematics
*AISI Learning Leader and Professional Learning Communities at CJP will explore best practices in the area of writing and mathematics
Future Plans

Future Plans continued
*Ongoing Professional Development in the areas of Multiple Literacies, Writing and Mathematics
*Implementing the Calgary Reads program for our younger students.


![Welcome! [] · •Code coverage •Headless test execution Show & Tell •Reporting •ALM integration ... iOS, JavaFX Tests through the GUI •No / minimal difference to manual test](https://img.pdfslide.net/doc/110x75/5f195ce33b586b2c263686c8/welcome-acode-coverage-aheadless-test-execution-show-tell-areporting.jpg)