Embed Size (px)
Citation preview
Proving ERM Value through
Objective Measurement
David Smith
Divisional VP
Risk Management
Family Dollar
Johnny Cagle
Director
Internal Audit
Fruit of the Loom
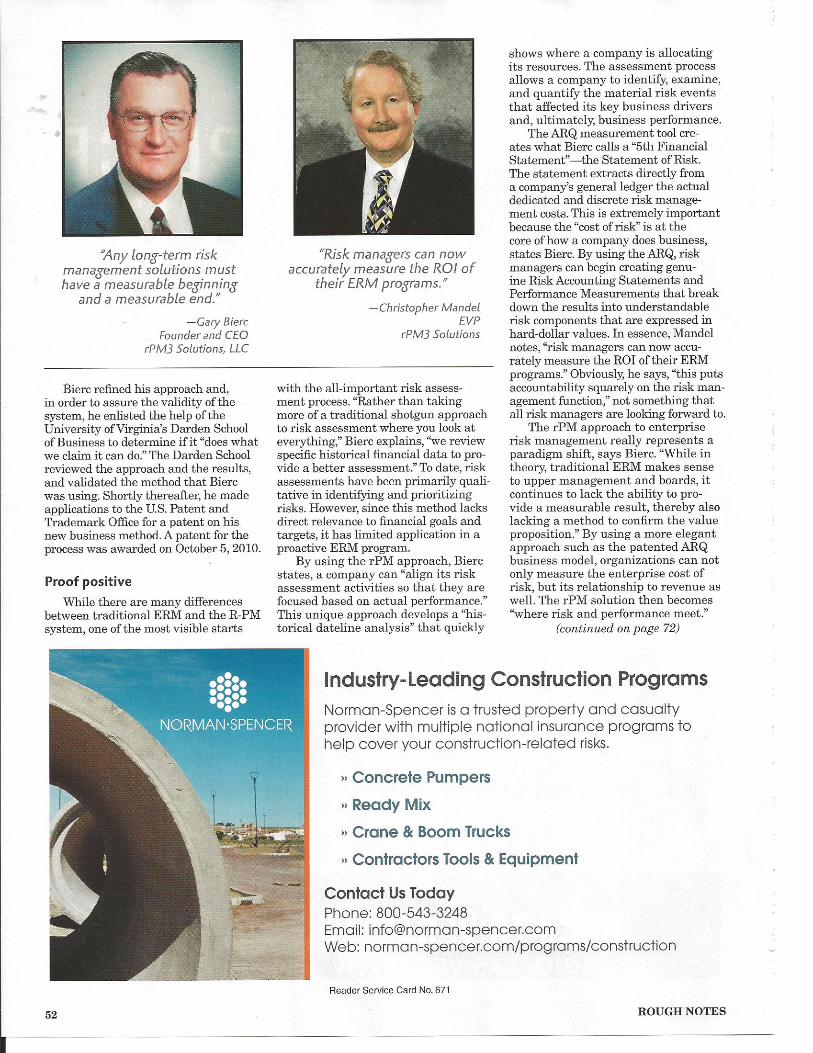
Chris Mandel
EVP
rPM3
Solutions, LLC
Agenda
• Overview of a new risk paradigm
• A risk leader’s view of risk and performance
• Overview of Aggregate Risk Quantification
• An audit leader’s view
• Aligning Risk and Performance Systems
• Q & A
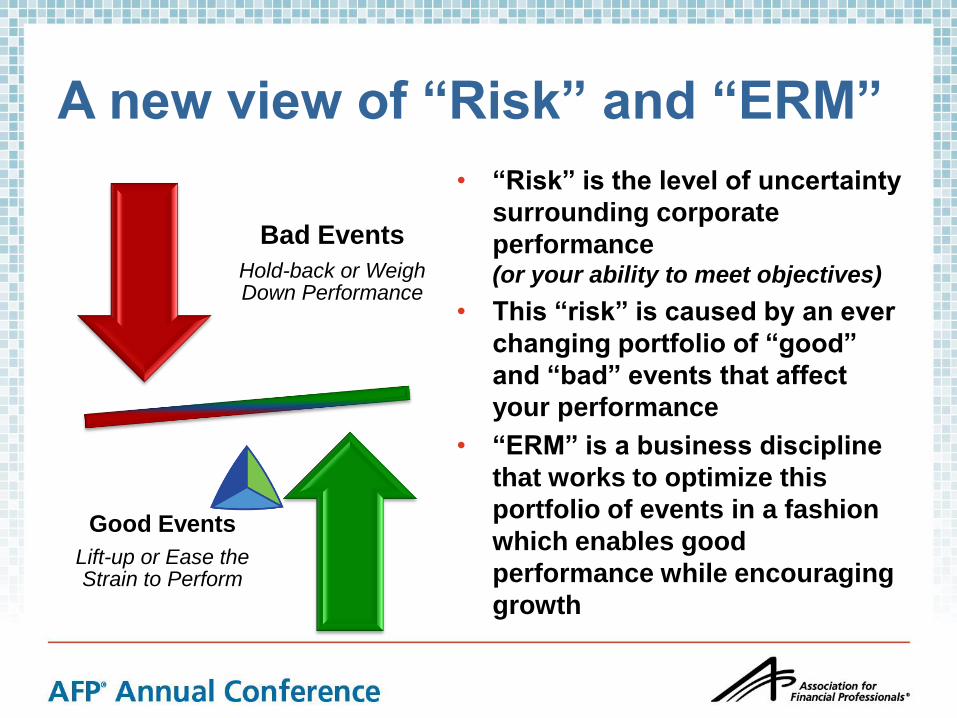
A new view of “Risk” and “ERM”
Bad Events
Hold-back or Weigh Down Performance
Good Events
Lift-up or Ease the Strain to Perform
• “Risk” is the level of uncertainty
surrounding corporate
performance (or your ability to meet objectives)
• This “risk” is caused by an ever
changing portfolio of “good”
and “bad” events that affect
your performance
• “ERM” is a business discipline
that works to optimize this
portfolio of events in a fashion
which enables good
performance while encouraging
growth
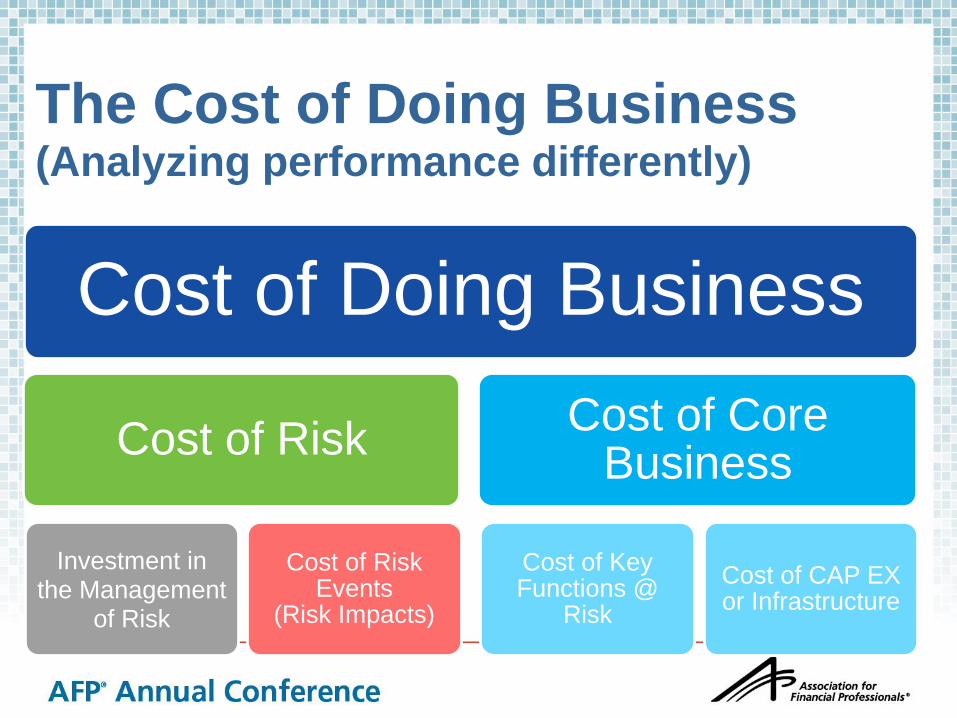
The Cost of Doing Business (Analyzing performance differently)
Cost of Doing Business
Cost of Risk
Investment in the Management
of Risk
Cost of Risk Events
(Risk Impacts)
Cost of Core Business
Cost of Key Functions @
Risk
Cost of CAP EX or Infrastructure
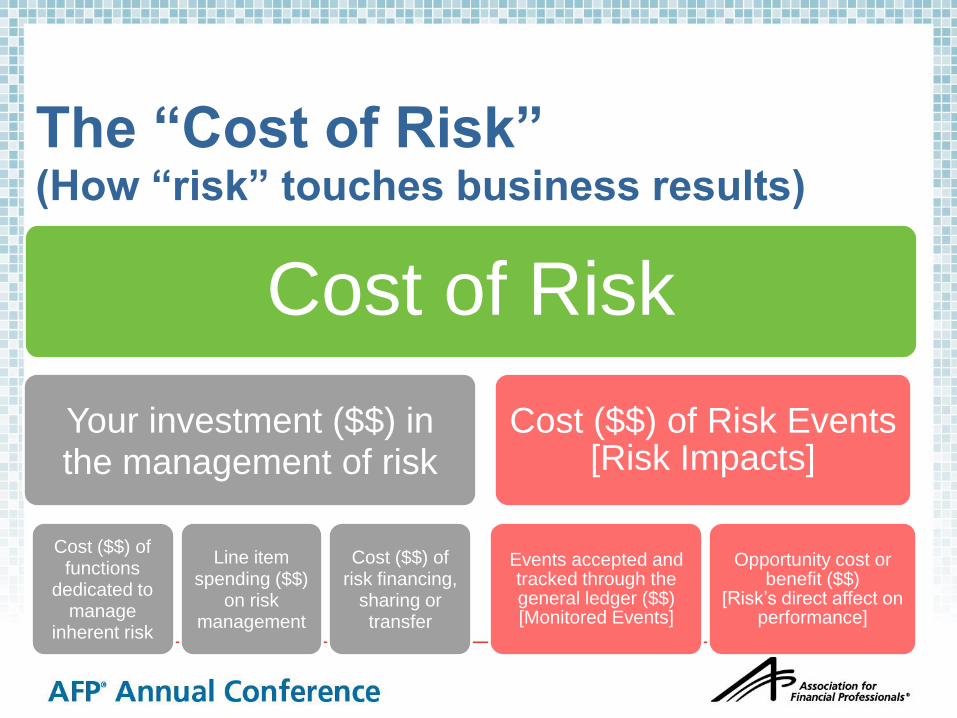
The “Cost of Risk” (How “risk” touches business results)
Cost of Risk
Your investment ($$) in the management of risk
Cost ($$) of functions
dedicated to manage
inherent risk
Line item spending ($$)
on risk management
Cost ($$) of risk financing,
sharing or transfer
Cost ($$) of Risk Events [Risk Impacts]
Events accepted and tracked through the general ledger ($$) [Monitored Events]
Opportunity cost or benefit ($$)
[Risk’s direct affect on performance]
A RISK MANAGER’S VIEW OF
RISK AND PERFORMANCE
David Smith, Divisional VP, Risk
Management, Family Dollar
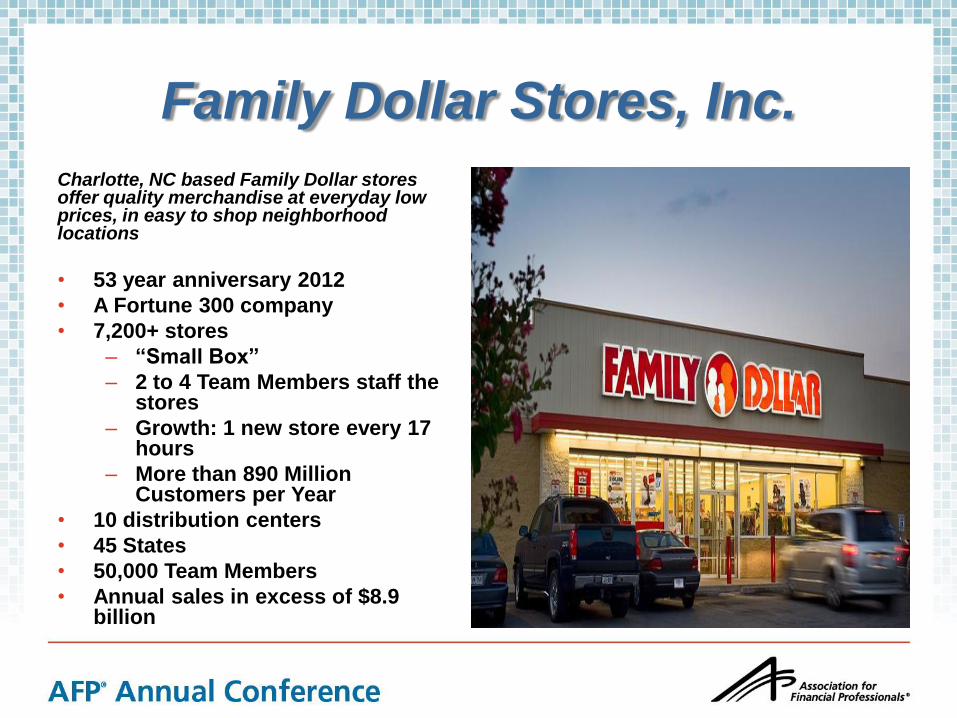
Family Dollar Stores, Inc.
Charlotte, NC based Family Dollar stores offer quality merchandise at everyday low prices, in easy to shop neighborhood locations
• 53 year anniversary 2012
• A Fortune 300 company
• 7,200+ stores
– “Small Box”
– 2 to 4 Team Members staff the stores
– Growth: 1 new store every 17 hours
– More than 890 Million Customers per Year
• 10 distribution centers
• 45 States
• 50,000 Team Members
• Annual sales in excess of $8.9 billion
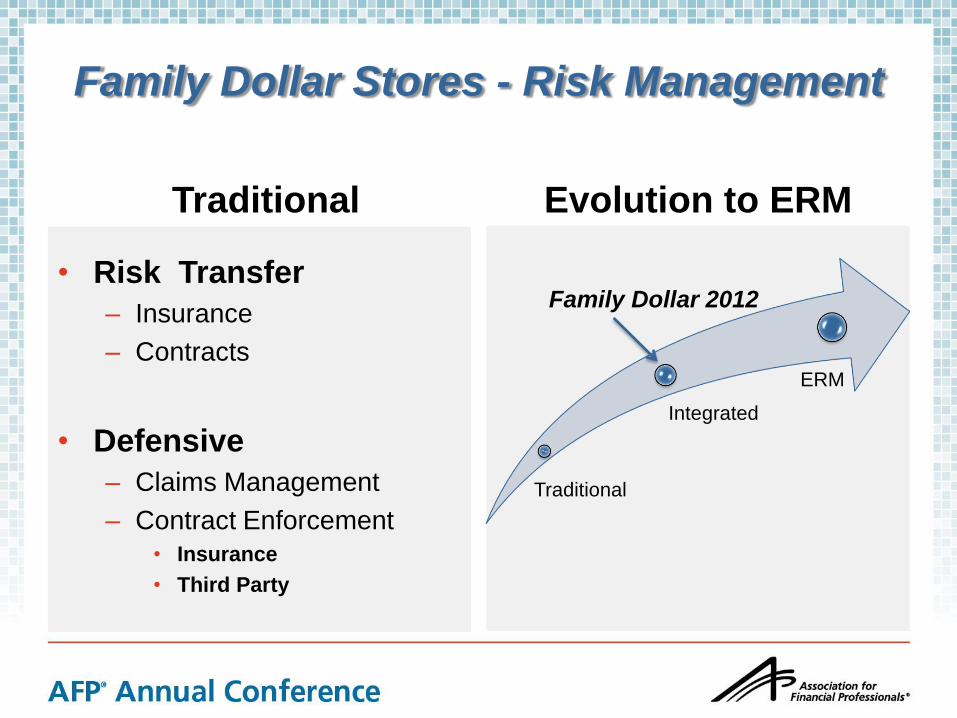
Family Dollar Stores - Risk Management
Traditional Evolution to ERM
Traditional
Integrated
ERM
Family Dollar 2012
• Risk Transfer
– Insurance
– Contracts
• Defensive
– Claims Management
– Contract Enforcement
• Insurance
• Third Party
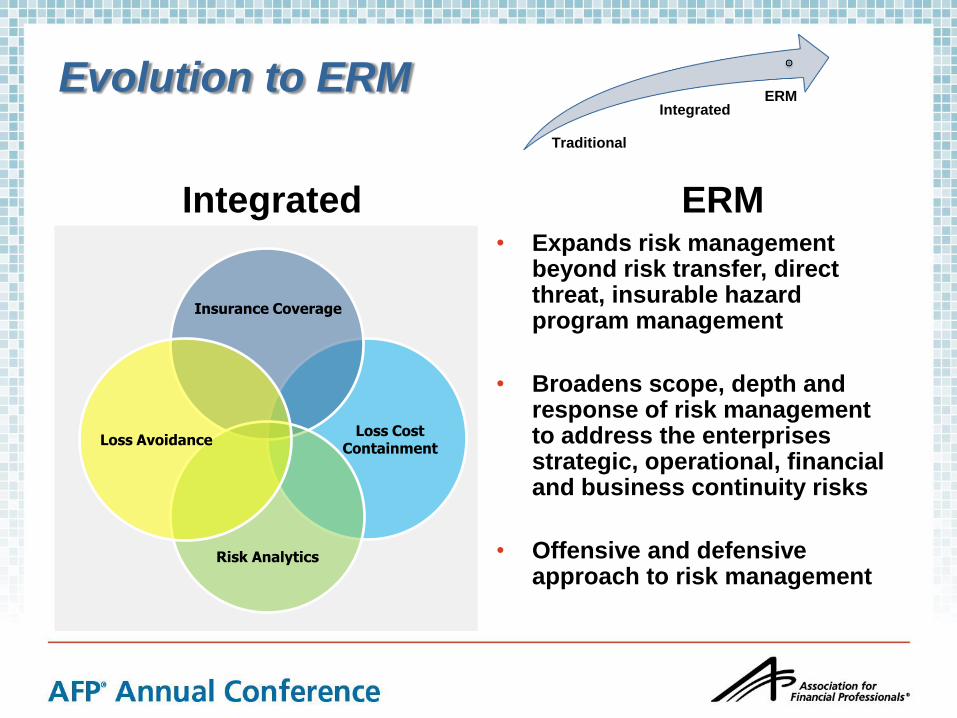
Evolution to ERM
Integrated
ERM
Loss Cost Containment
Insurance Coverage
Risk Analytics
Loss Avoidance
ERM Integrated
Traditional
• Expands risk management beyond risk transfer, direct threat, insurable hazard program management
• Broadens scope, depth and response of risk management to address the enterprises strategic, operational, financial and business continuity risks
• Offensive and defensive approach to risk management
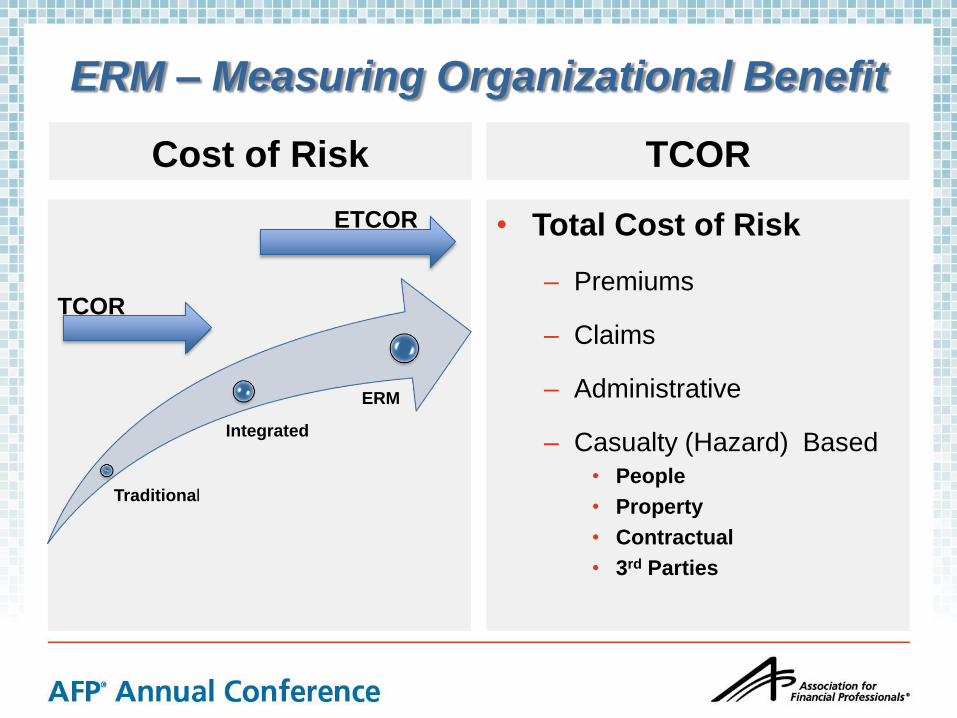
ERM – Measuring Organizational Benefit
Cost of Risk
Traditional
Integrated
ERM
TCOR
• Total Cost of Risk
– Premiums
– Claims
– Administrative
– Casualty (Hazard) Based
• People
• Property
• Contractual
• 3rd Parties
TCOR
ETCOR
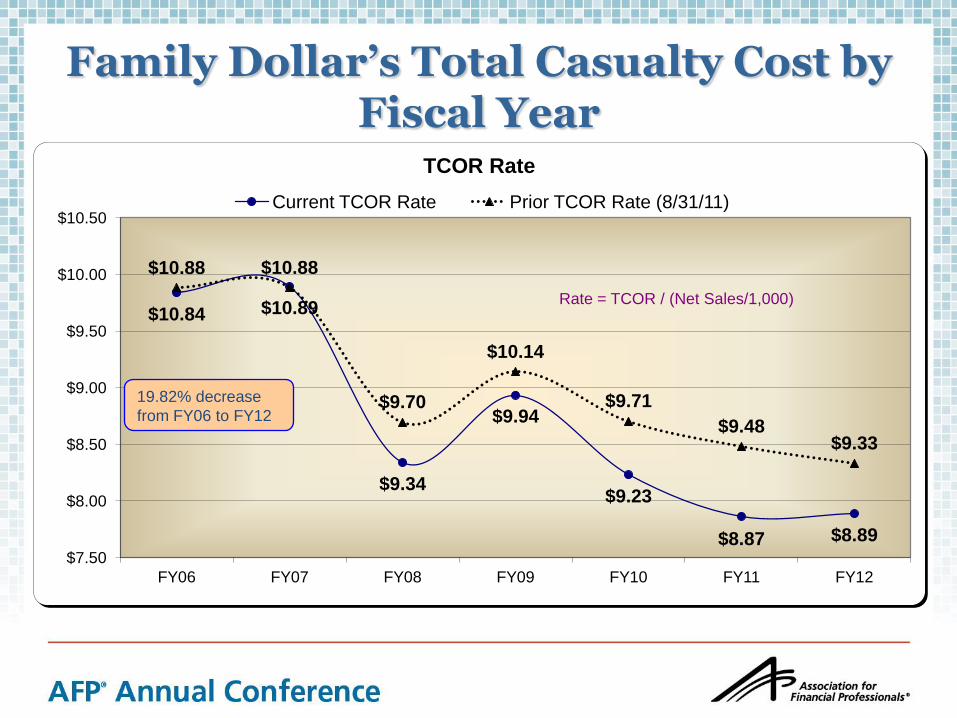
$10.84 $10.89
$9.34
$9.94
$9.23
$8.87 $8.89
$10.88 $10.88
$9.70
$10.14
$9.71
$9.48 $9.33
$7.50
$8.00
$8.50
$9.00
$9.50
$10.00
$10.50
FY06 FY07 FY08 FY09 FY10 FY11 FY12
TCOR Rate
Current TCOR Rate Prior TCOR Rate (8/31/11)
Family Dollar’s Total Casualty Cost by Fiscal Year
Rate = TCOR / (Net Sales/1,000)
19.82% decrease
from FY06 to FY12
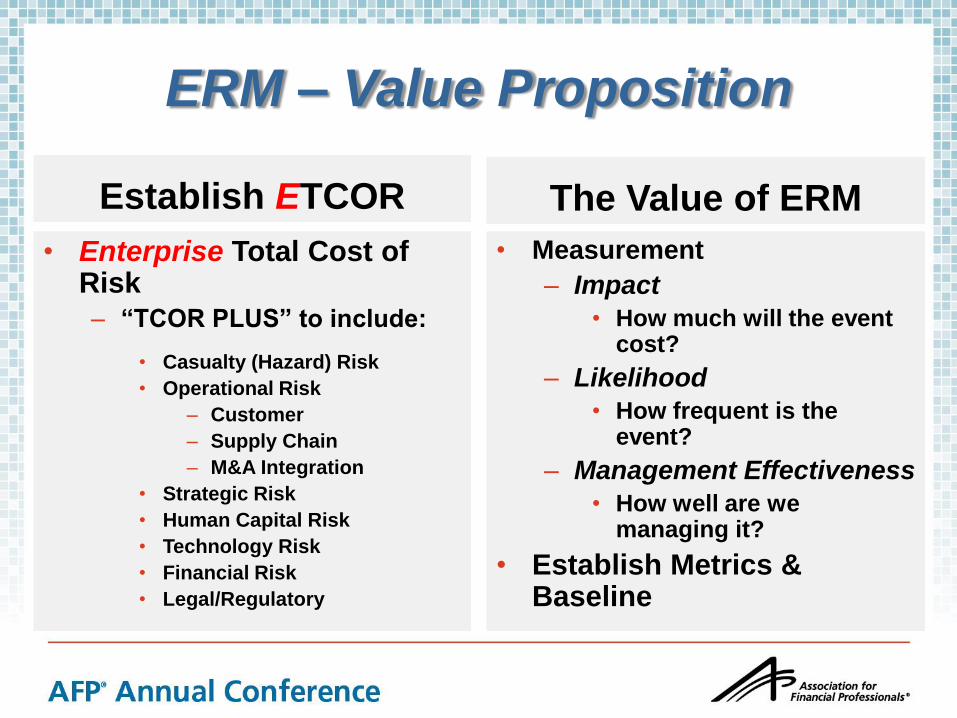
ERM – Value Proposition
Establish ETCOR
• Enterprise Total Cost of Risk
– “TCOR PLUS” to include:
• Casualty (Hazard) Risk
• Operational Risk
– Customer
– Supply Chain
– M&A Integration
• Strategic Risk
• Human Capital Risk
• Technology Risk
• Financial Risk
• Legal/Regulatory
The Value of ERM
• Measurement
– Impact
• How much will the event cost?
– Likelihood
• How frequent is the event?
– Management Effectiveness
• How well are we managing it?
• Establish Metrics & Baseline
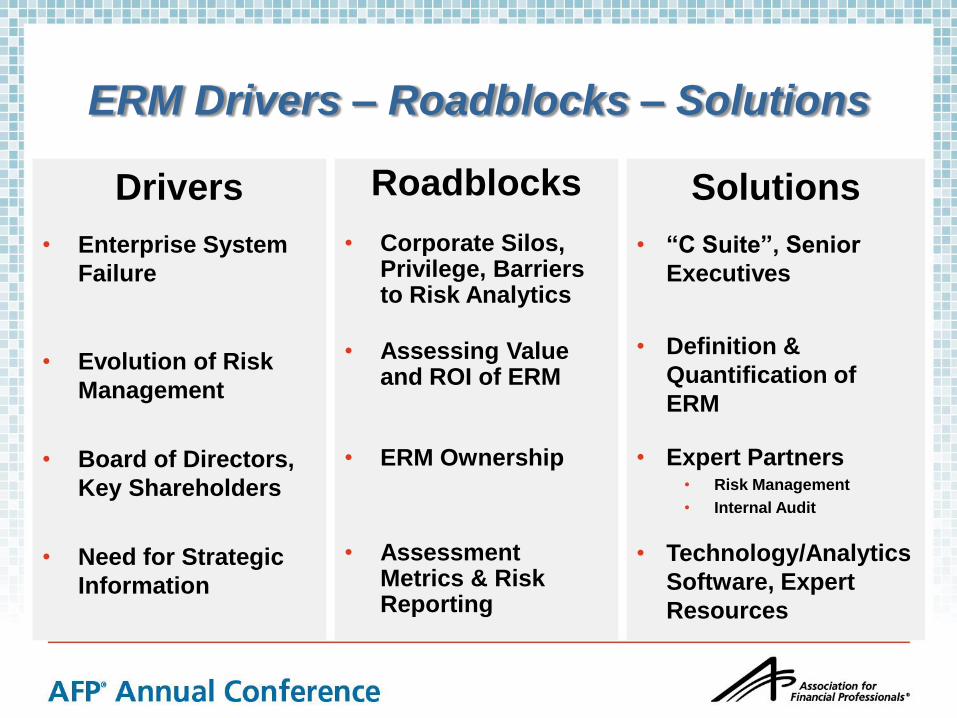
ERM Drivers – Roadblocks – Solutions
Drivers
• Enterprise System
Failure
• Evolution of Risk
Management
• Board of Directors,
Key Shareholders
• Need for Strategic
Information
Solutions
• “C Suite”, Senior
Executives
• Definition &
Quantification of
ERM
• Expert Partners • Risk Management
• Internal Audit
• Technology/Analytics
Software, Expert
Resources
Roadblocks
• Corporate Silos, Privilege, Barriers to Risk Analytics
• Assessing Value and ROI of ERM
• ERM Ownership
• Assessment Metrics & Risk Reporting
MEASURING RISKS TO
PERFORMANCE
Chris Mandel, EVP, rPM3 Solutions, LLC
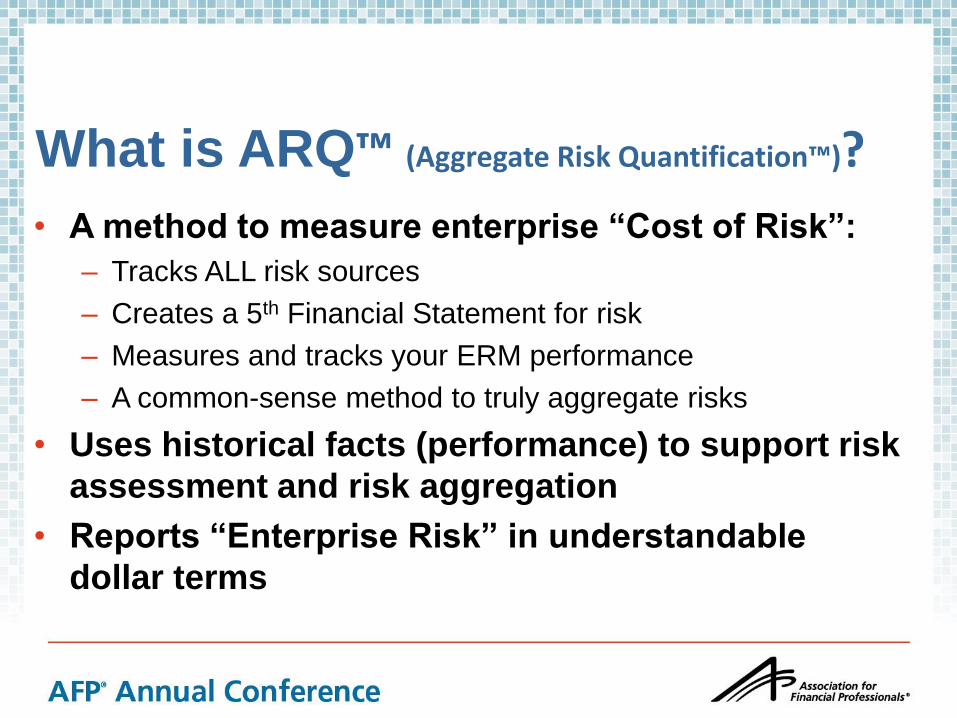
What is ARQ™ (Aggregate Risk Quantification™)?
• A method to measure enterprise “Cost of Risk”:
– Tracks ALL risk sources
– Creates a 5th Financial Statement for risk
– Measures and tracks your ERM performance
– A common-sense method to truly aggregate risks
• Uses historical facts (performance) to support risk
assessment and risk aggregation
• Reports “Enterprise Risk” in understandable
dollar terms
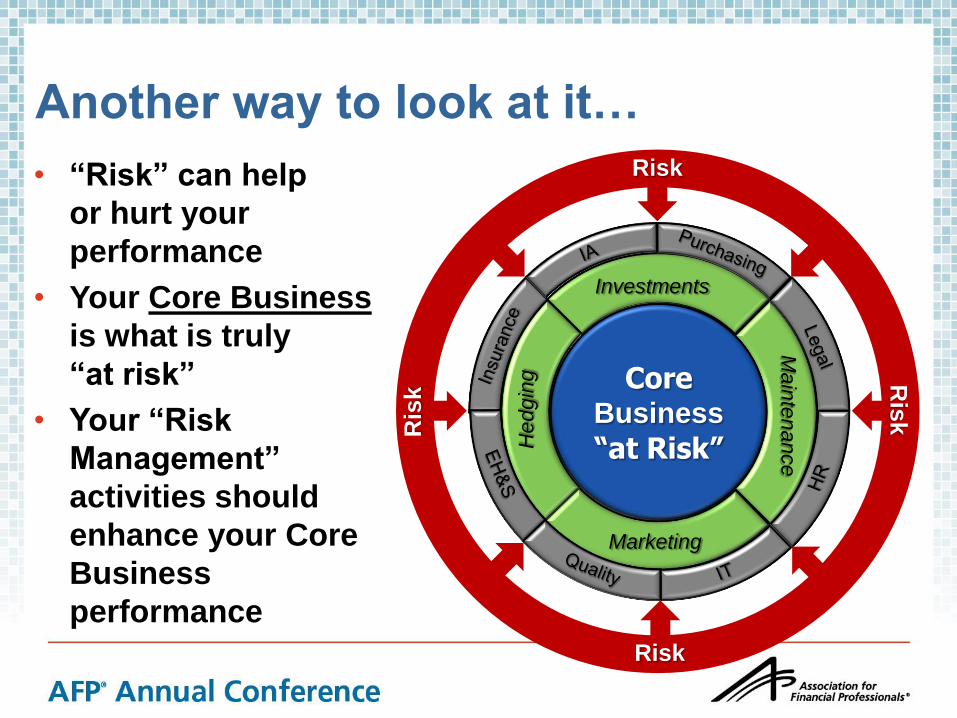
Another way to look at it…
• “Risk” can help
or hurt your
performance
• Your Core Business
is what is truly
“at risk”
• Your “Risk
Management”
activities should
enhance your Core
Business
performance
Investments
Marketing
Main
tenance
Hedgin
g
Core Business
“at Risk”
Risk
Risk
Ris
k R
isk
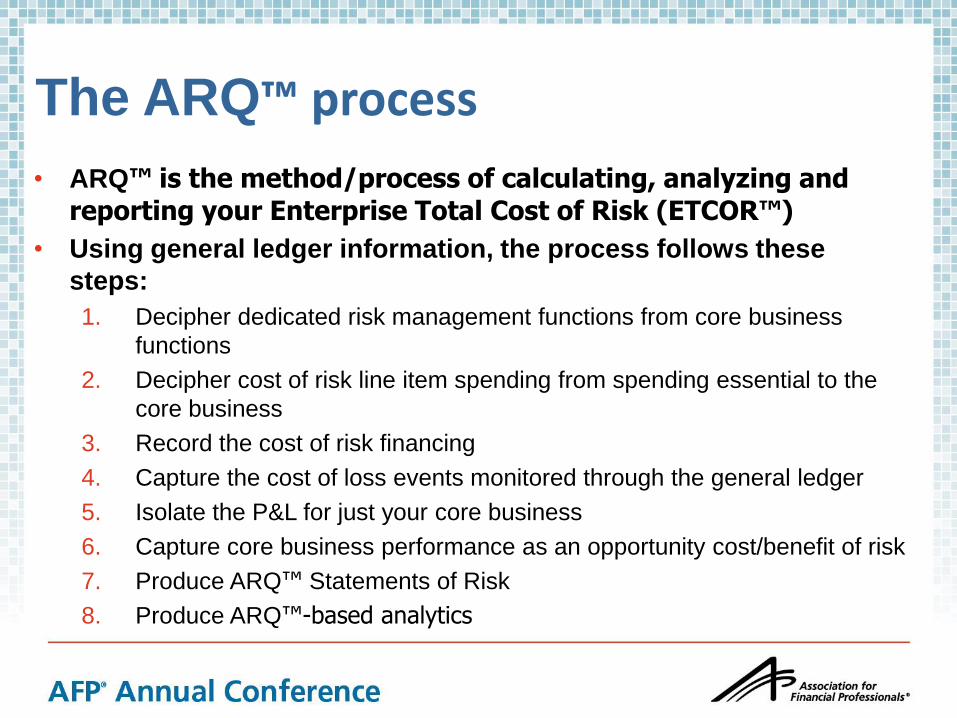
The ARQ™ process
• ARQ™ is the method/process of calculating, analyzing and
reporting your Enterprise Total Cost of Risk (ETCOR™)
• Using general ledger information, the process follows these
steps:
1. Decipher dedicated risk management functions from core business
functions
2. Decipher cost of risk line item spending from spending essential to the
core business
3. Record the cost of risk financing
4. Capture the cost of loss events monitored through the general ledger
5. Isolate the P&L for just your core business
6. Capture core business performance as an opportunity cost/benefit of risk
7. Produce ARQ™ Statements of Risk
8. Produce ARQ™-based analytics
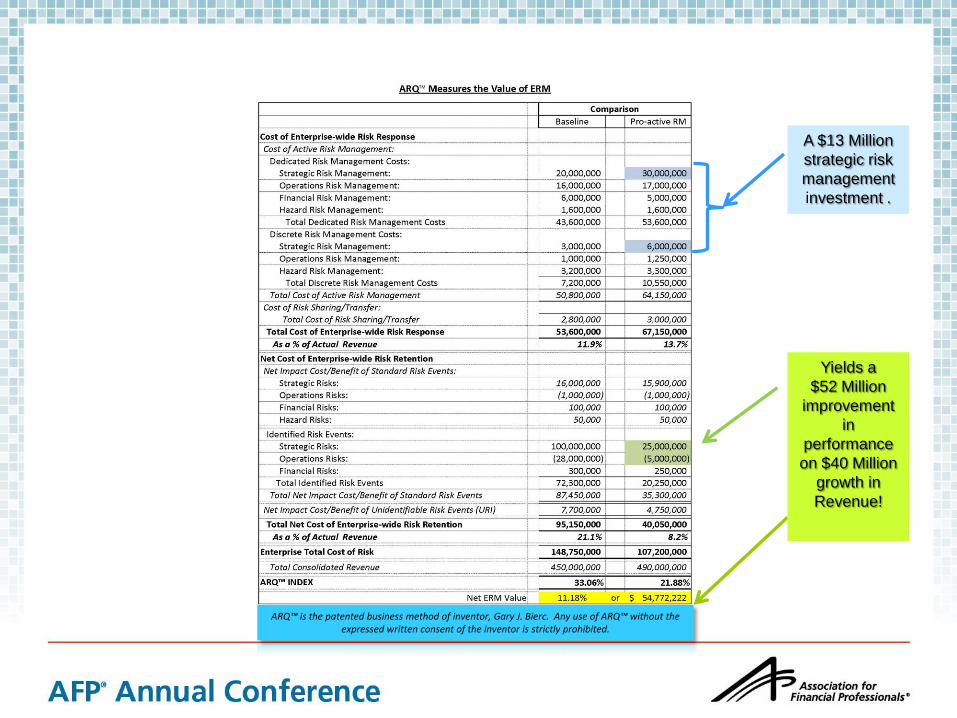
A $13 Million
strategic risk
management
investment .
ARQ™ is the patented business method of inventor, Gary J. Bierc. Any use of ARQ™ without the expressed written consent of the inventor is strictly prohibited.
Yields a
$52 Million
improvement
in
performance
on $40 Million
growth in
Revenue!
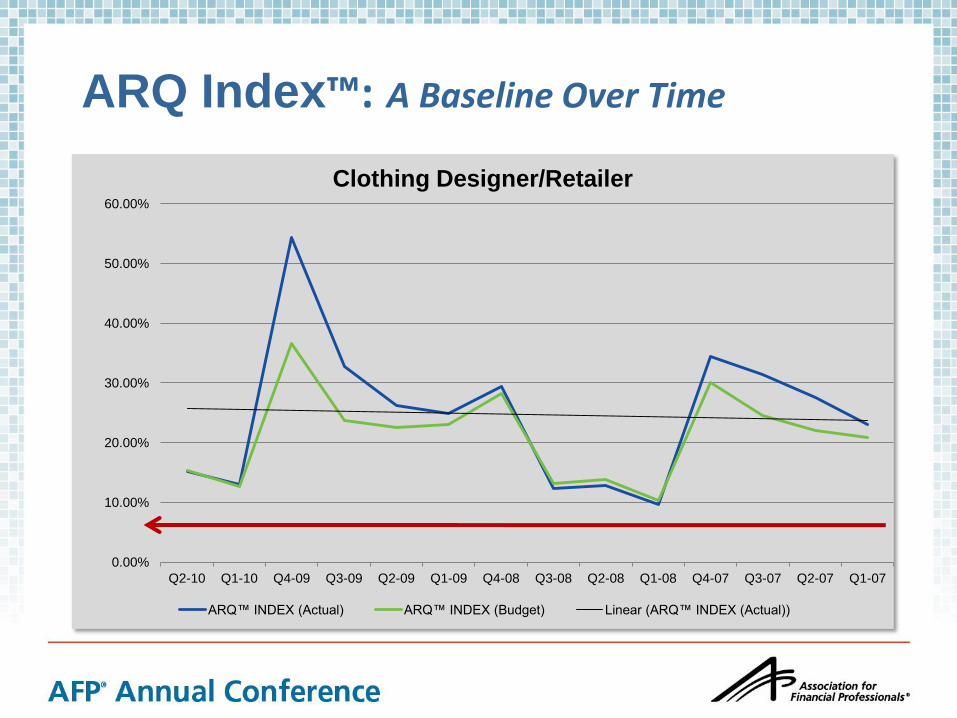
ARQ Index™: A Baseline Over Time
0.00%
10.00%
20.00%
30.00%
40.00%
50.00%
60.00%
Q2-10 Q1-10 Q4-09 Q3-09 Q2-09 Q1-09 Q4-08 Q3-08 Q2-08 Q1-08 Q4-07 Q3-07 Q2-07 Q1-07
Clothing Designer/Retailer
ARQ™ INDEX (Actual) ARQ™ INDEX (Budget) Linear (ARQ™ INDEX (Actual))
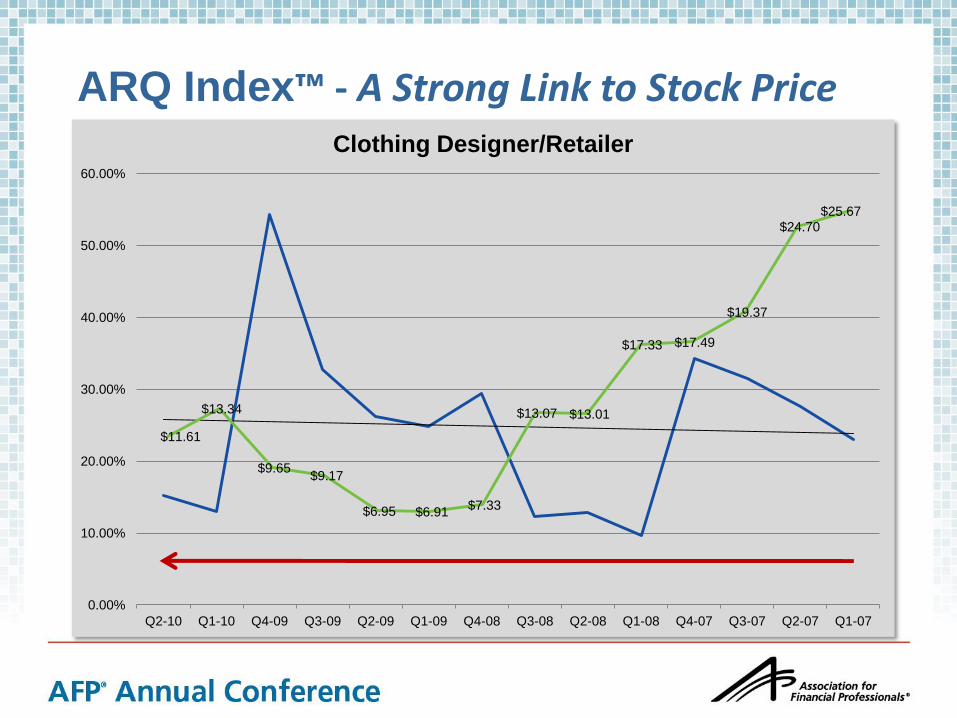
ARQ Index™ - A Strong Link to Stock Price
0.00%
10.00%
20.00%
30.00%
40.00%
50.00%
60.00%
Q2-10 Q1-10 Q4-09 Q3-09 Q2-09 Q1-09 Q4-08 Q3-08 Q2-08 Q1-08 Q4-07 Q3-07 Q2-07 Q1-07
Clothing Designer/Retailer
$11.61
$13.34
$9.65 $9.17
$6.95 $6.91 $7.33
$13.07 $13.01
$17.33 $17.49
$19.37
$24.70
$25.67
AN AUDITOR’S VIEW
Johnny Cagle, Director Internal Audit, Fruit of the Loom
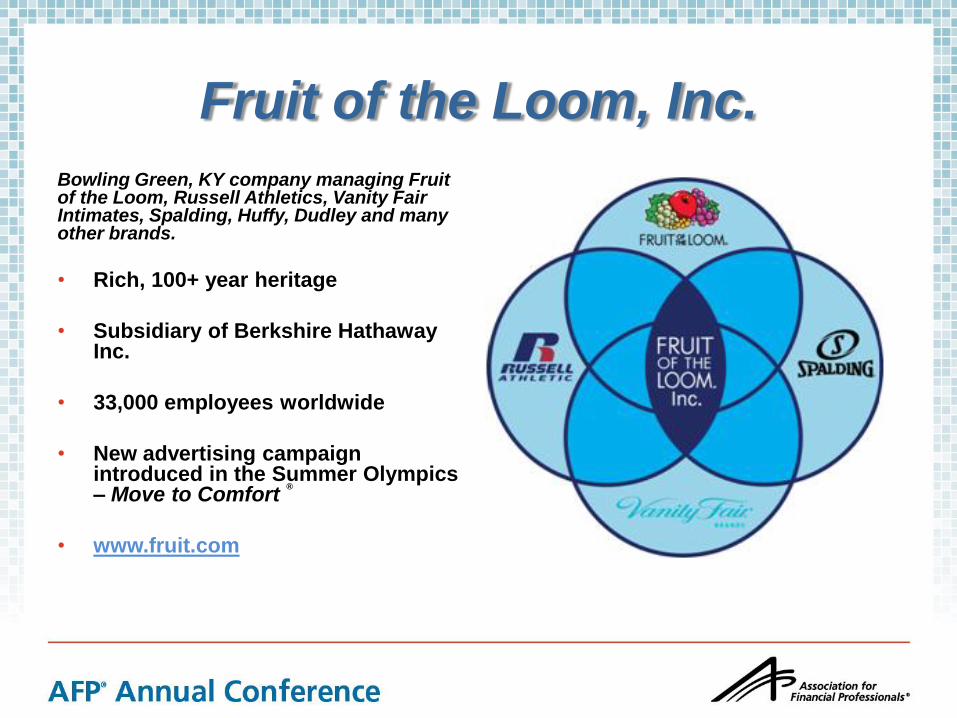
Fruit of the Loom, Inc.
Bowling Green, KY company managing Fruit of the Loom, Russell Athletics, Vanity Fair Intimates, Spalding, Huffy, Dudley and many other brands.
• Rich, 100+ year heritage
• Subsidiary of Berkshire Hathaway Inc.
• 33,000 employees worldwide
• New advertising campaign introduced in the Summer Olympics – Move to Comfort
®
• www.fruit.com
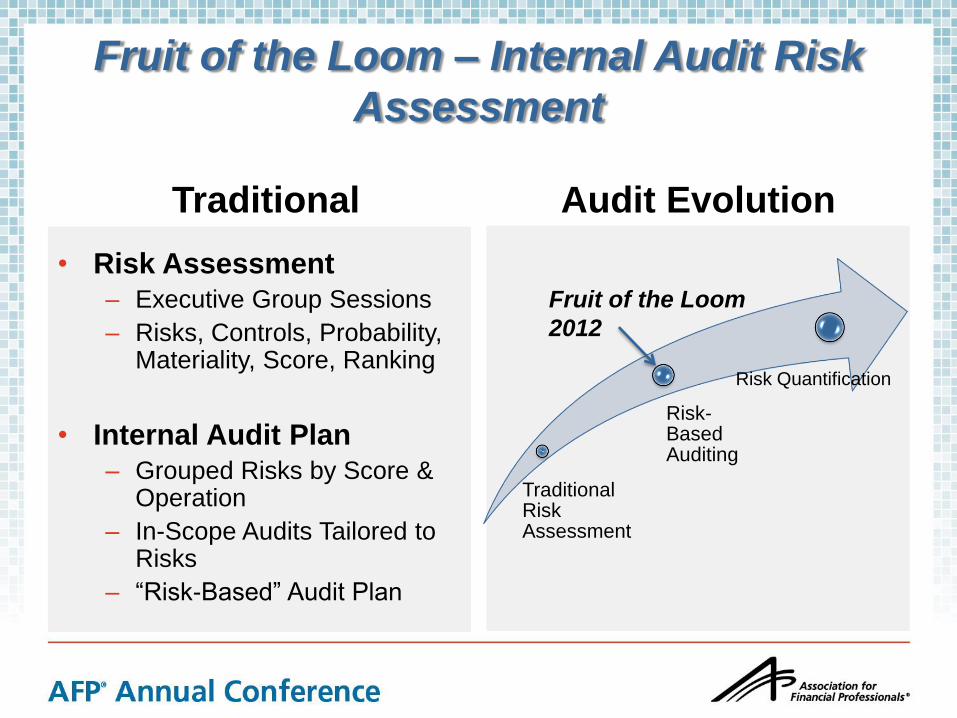
Fruit of the Loom – Internal Audit Risk
Assessment
Traditional Audit Evolution
Traditional Risk Assessment
Risk-Based Auditing
Risk Quantification
Fruit of the Loom
2012
• Risk Assessment
– Executive Group Sessions
– Risks, Controls, Probability, Materiality, Score, Ranking
• Internal Audit Plan
– Grouped Risks by Score & Operation
– In-Scope Audits Tailored to Risks
– “Risk-Based” Audit Plan
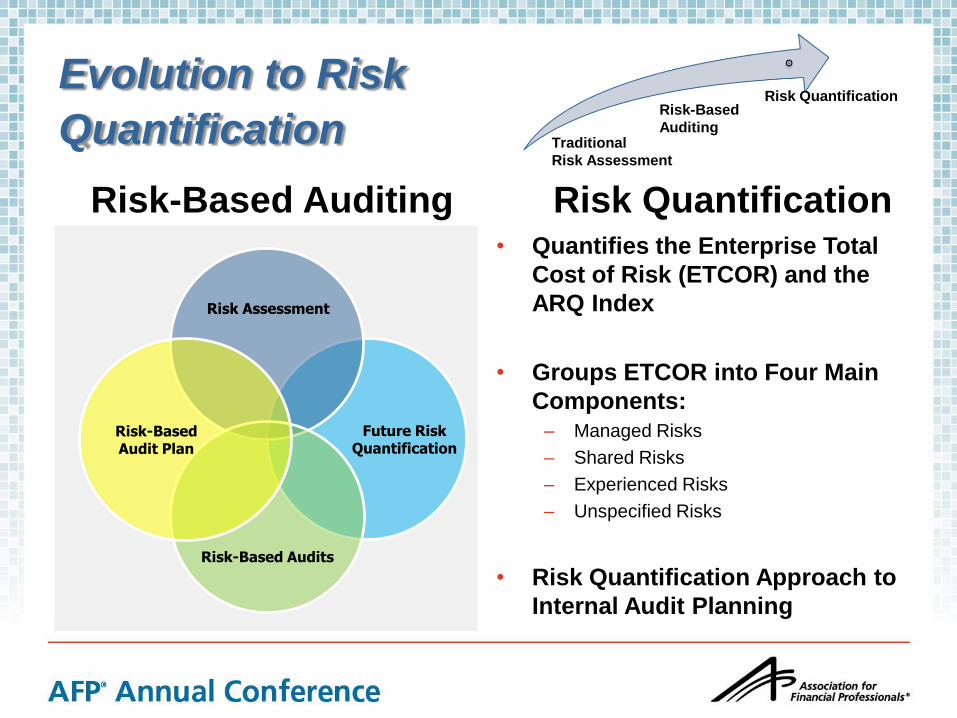
Evolution to Risk
Quantification
Risk-Based Auditing
Risk Quantification
Future Risk Quantification
Risk Assessment
Risk-Based Audits
Risk-Based Audit Plan
Risk Quantification Risk-Based
Auditing Traditional
Risk Assessment
• Quantifies the Enterprise Total
Cost of Risk (ETCOR) and the
ARQ Index
• Groups ETCOR into Four Main
Components: – Managed Risks
– Shared Risks
– Experienced Risks
– Unspecified Risks
• Risk Quantification Approach to
Internal Audit Planning
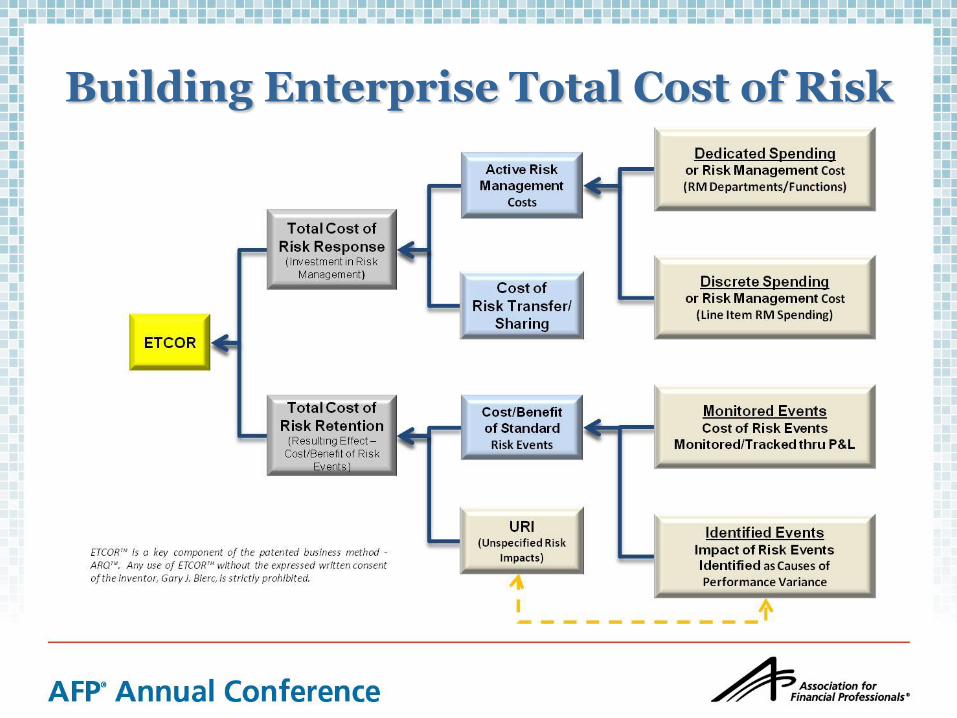
Building Enterprise Total Cost of Risk
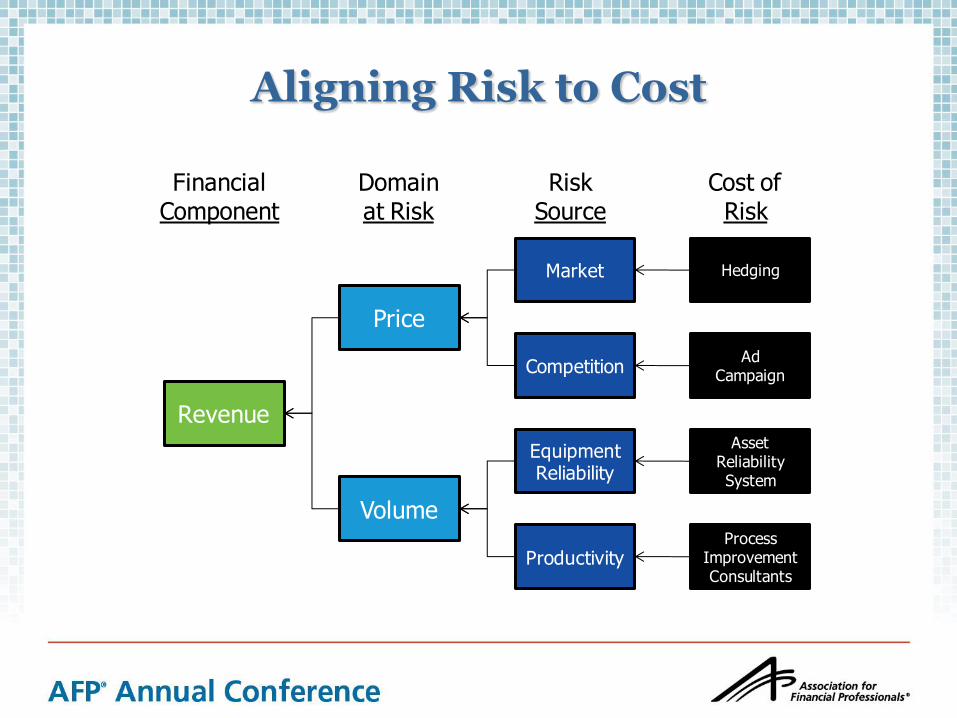
Market
Revenue
Volume
Hedging
Price
Competition
EquipmentReliability
Productivity
AdCampaign
Asset Reliability System
ProcessImprovementConsultants
Domainat Risk
Cost ofRisk
RiskSource
FinancialComponent
Aligning Risk to Cost
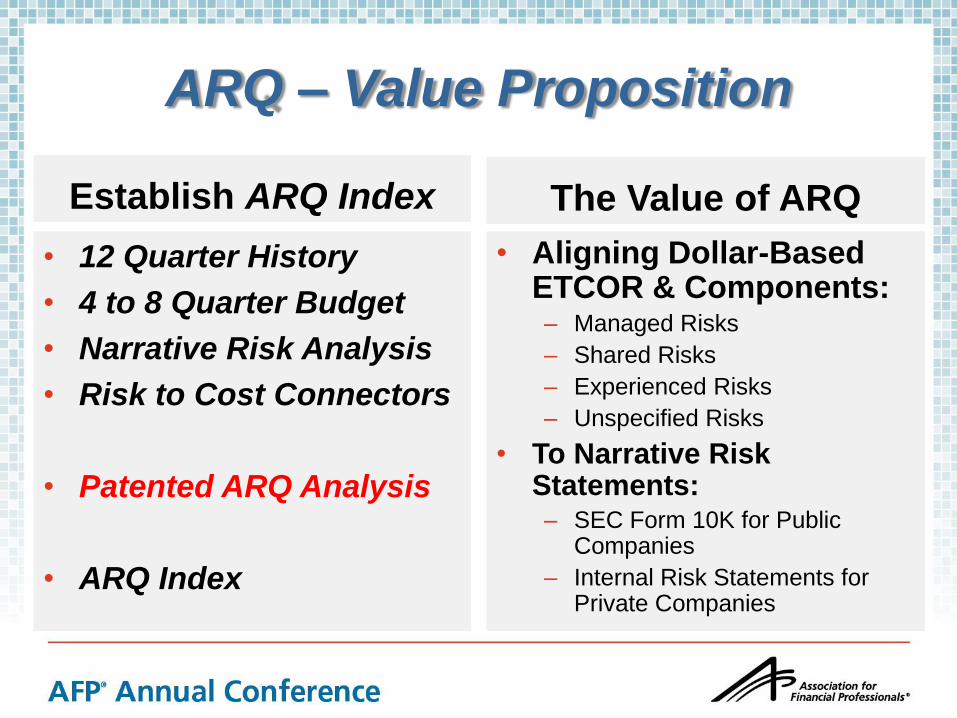
ARQ – Value Proposition
Establish ARQ Index
• 12 Quarter History
• 4 to 8 Quarter Budget
• Narrative Risk Analysis
• Risk to Cost Connectors
• Patented ARQ Analysis
• ARQ Index
The Value of ARQ
• Aligning Dollar-Based ETCOR & Components: – Managed Risks
– Shared Risks
– Experienced Risks
– Unspecified Risks
• To Narrative Risk Statements: – SEC Form 10K for Public
Companies
– Internal Risk Statements for Private Companies
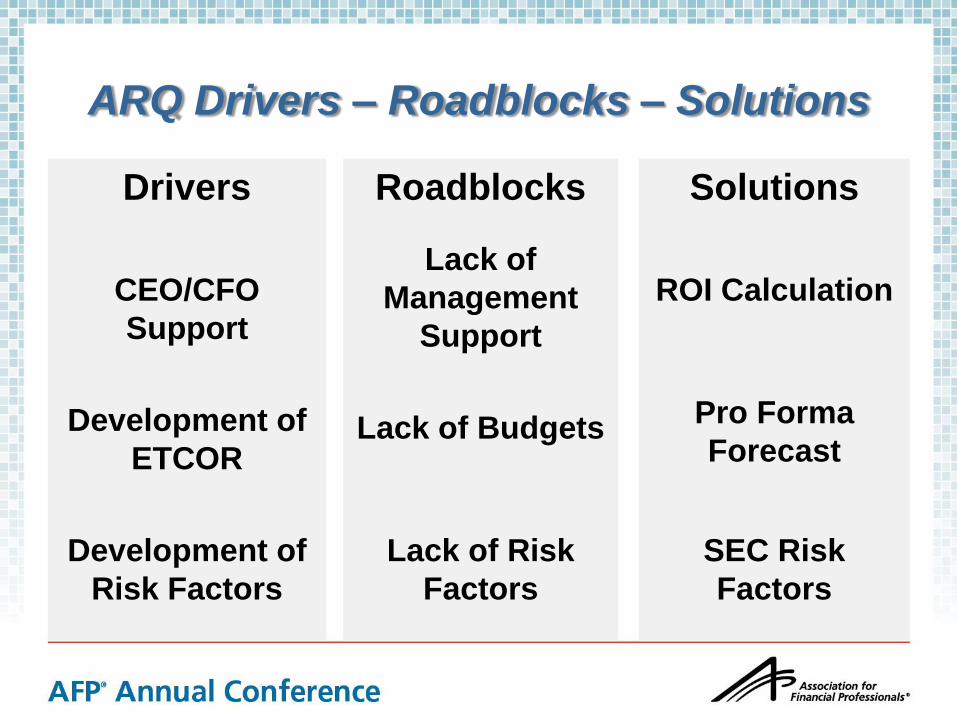
ARQ Drivers – Roadblocks – Solutions
Drivers
CEO/CFO
Support
Development of
ETCOR
Development of
Risk Factors
Solutions
ROI Calculation
Pro Forma
Forecast
SEC Risk
Factors
Roadblocks
Lack of
Management
Support
Lack of Budgets
Lack of Risk
Factors
WRAP UP
Chris Mandel, EVP, rPM3 Solutions, LLC
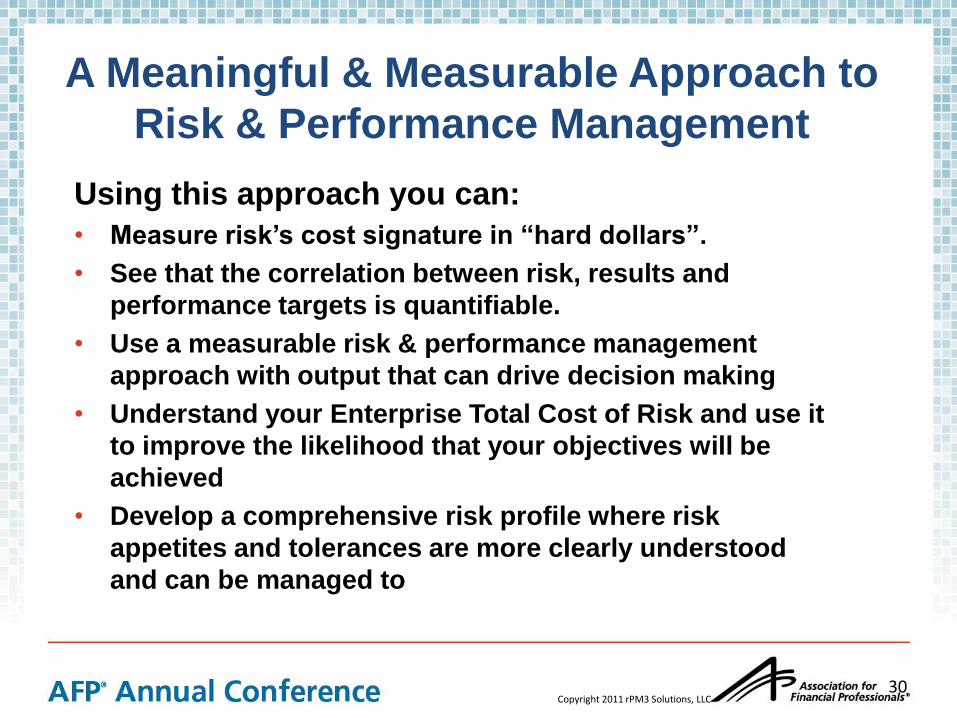
A Meaningful & Measurable Approach to
Risk & Performance Management
Using this approach you can:
• Measure risk’s cost signature in “hard dollars”.
• See that the correlation between risk, results and
performance targets is quantifiable.
• Use a measurable risk & performance management
approach with output that can drive decision making
• Understand your Enterprise Total Cost of Risk and use it
to improve the likelihood that your objectives will be
achieved
• Develop a comprehensive risk profile where risk
appetites and tolerances are more clearly understood
and can be managed to
Copyright 2011 rPM3 Solutions, LLC 30
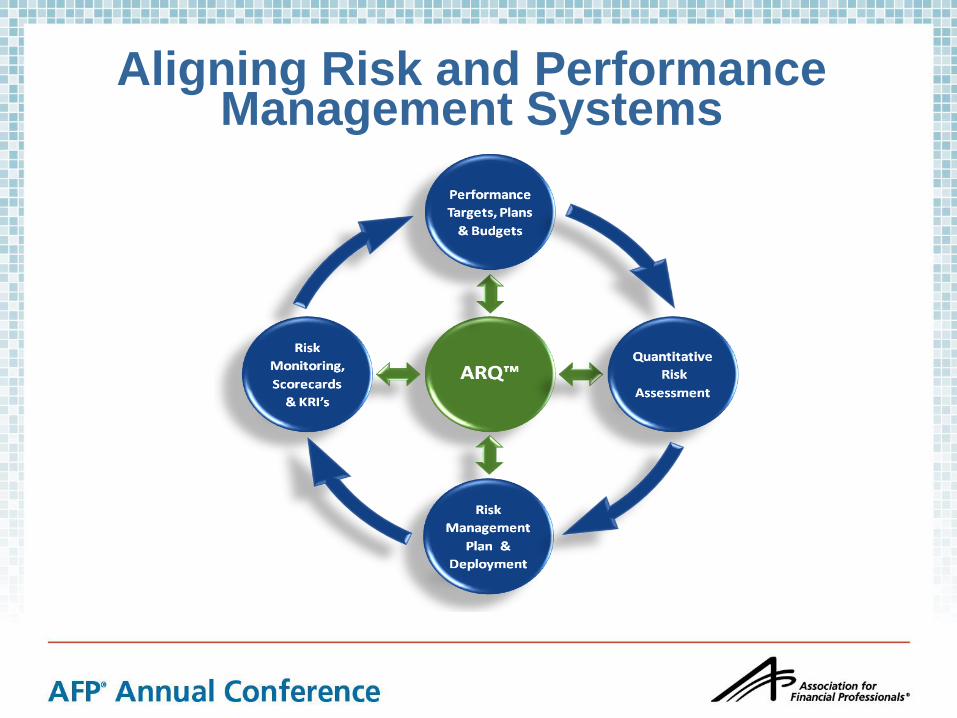
Aligning Risk and Performance Management Systems
QUESTIONS?
Speaker Contact Information
• Dave Smith
• Johnny Cagle
• Chris Mandel
Follow our blog: http://rpm3solutions.com/blog/
Drive Business Performance with
Enterprise Risk Management
September 23, 2012
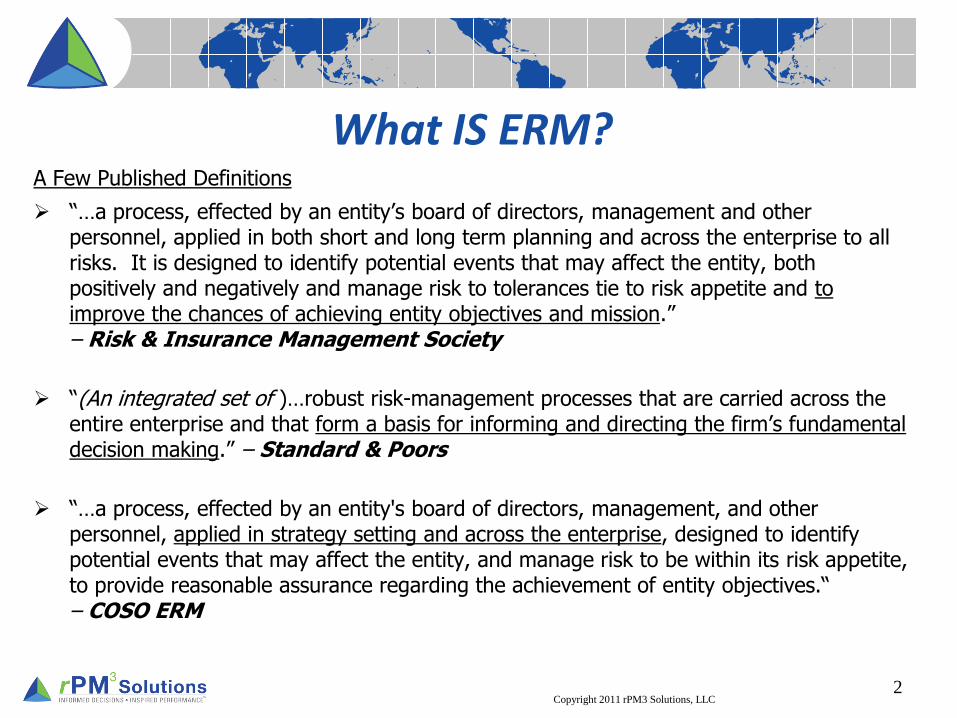
What IS ERM? A Few Published Definitions
“…a process, effected by an entity’s board of directors, management and other personnel, applied in both short and long term planning and across the enterprise to all risks. It is designed to identify potential events that may affect the entity, both positively and negatively and manage risk to tolerances tie to risk appetite and to improve the chances of achieving entity objectives and mission.” – Risk & Insurance Management Society
“(An integrated set of )…robust risk-management processes that are carried across the entire enterprise and that form a basis for informing and directing the firm’s fundamental decision making.” – Standard & Poors
“…a process, effected by an entity's board of directors, management, and other personnel, applied in strategy setting and across the enterprise, designed to identify potential events that may affect the entity, and manage risk to be within its risk appetite, to provide reasonable assurance regarding the achievement of entity objectives.“ – COSO ERM
Copyright 2011 rPM3 Solutions, LLC 2
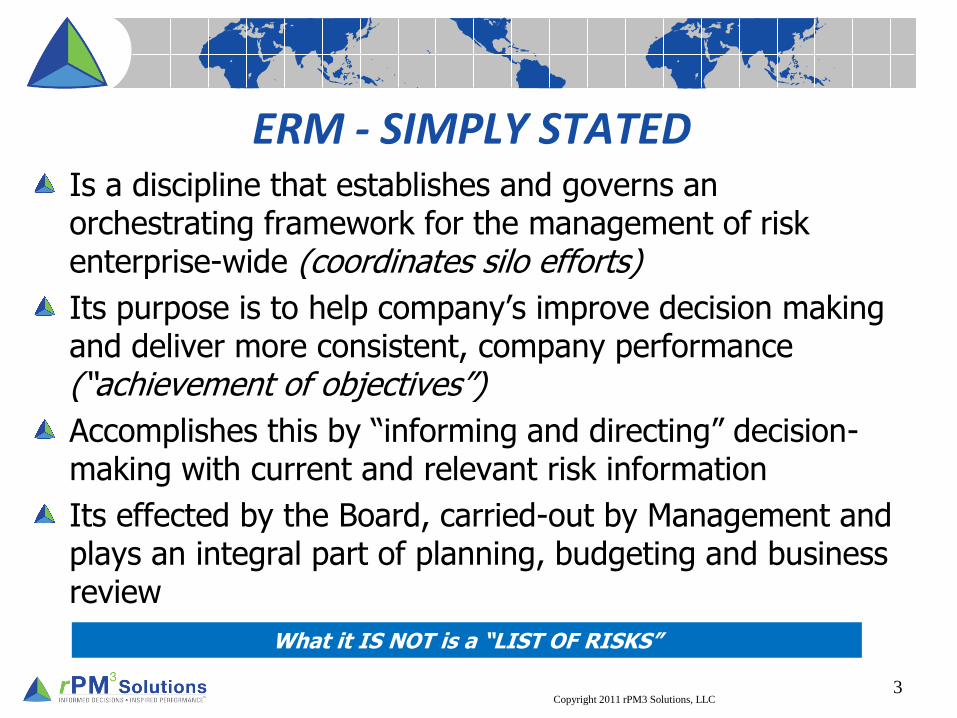
ERM - SIMPLY STATED Is a discipline that establishes and governs an orchestrating framework for the management of risk enterprise-wide (coordinates silo efforts)
Its purpose is to help company’s improve decision making and deliver more consistent, company performance (“achievement of objectives”)
Accomplishes this by “informing and directing” decision-making with current and relevant risk information
Its effected by the Board, carried-out by Management and plays an integral part of planning, budgeting and business review
Copyright 2011 rPM3 Solutions, LLC 3
What it IS NOT is a “LIST OF RISKS”
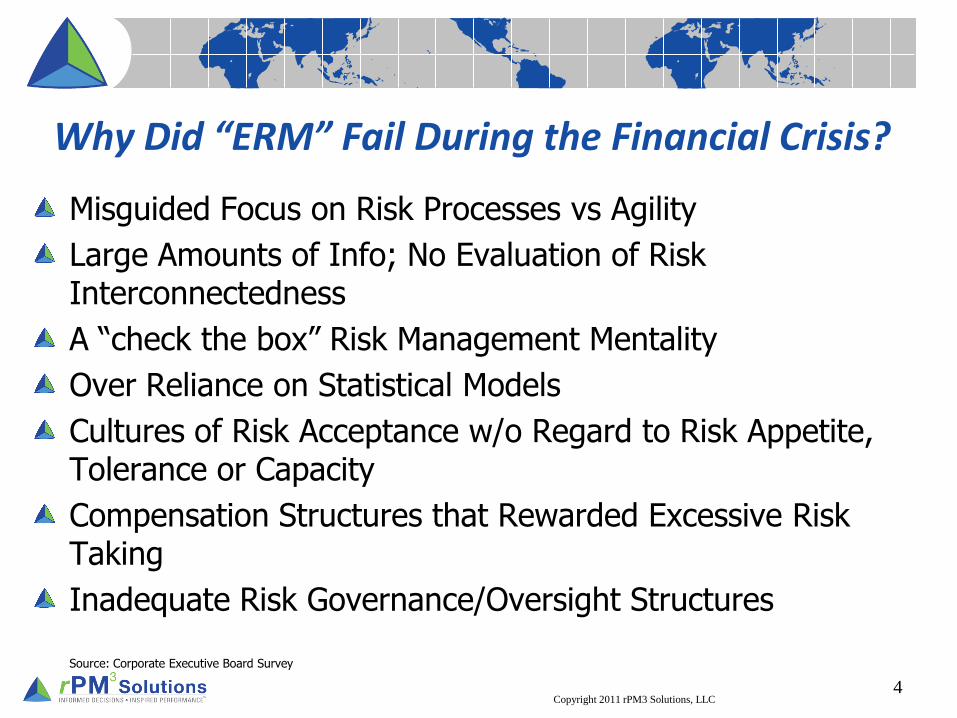
Why Did “ERM” Fail During the Financial Crisis?
Misguided Focus on Risk Processes vs Agility
Large Amounts of Info; No Evaluation of Risk Interconnectedness
A “check the box” Risk Management Mentality
Over Reliance on Statistical Models
Cultures of Risk Acceptance w/o Regard to Risk Appetite, Tolerance or Capacity
Compensation Structures that Rewarded Excessive Risk Taking
Inadequate Risk Governance/Oversight Structures Source: Corporate Executive Board Survey
Copyright 2011 rPM3 Solutions, LLC 4
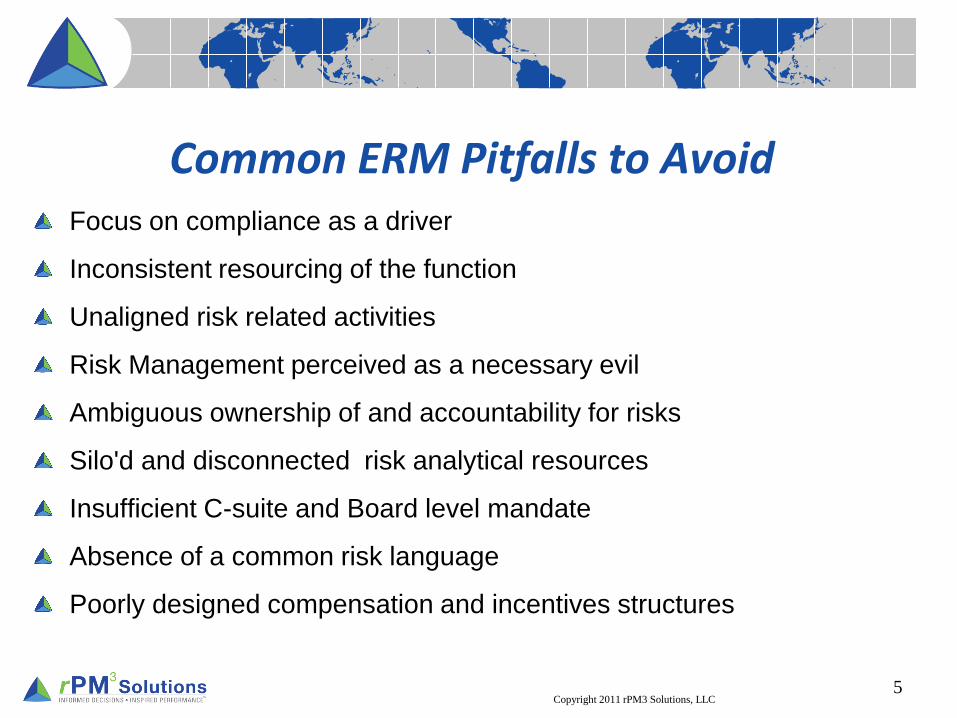
Common ERM Pitfalls to Avoid Focus on compliance as a driver
Inconsistent resourcing of the function
Unaligned risk related activities
Risk Management perceived as a necessary evil
Ambiguous ownership of and accountability for risks
Silo'd and disconnected risk analytical resources
Insufficient C-suite and Board level mandate
Absence of a common risk language
Poorly designed compensation and incentives structures
Copyright 2011 rPM3 Solutions, LLC 5
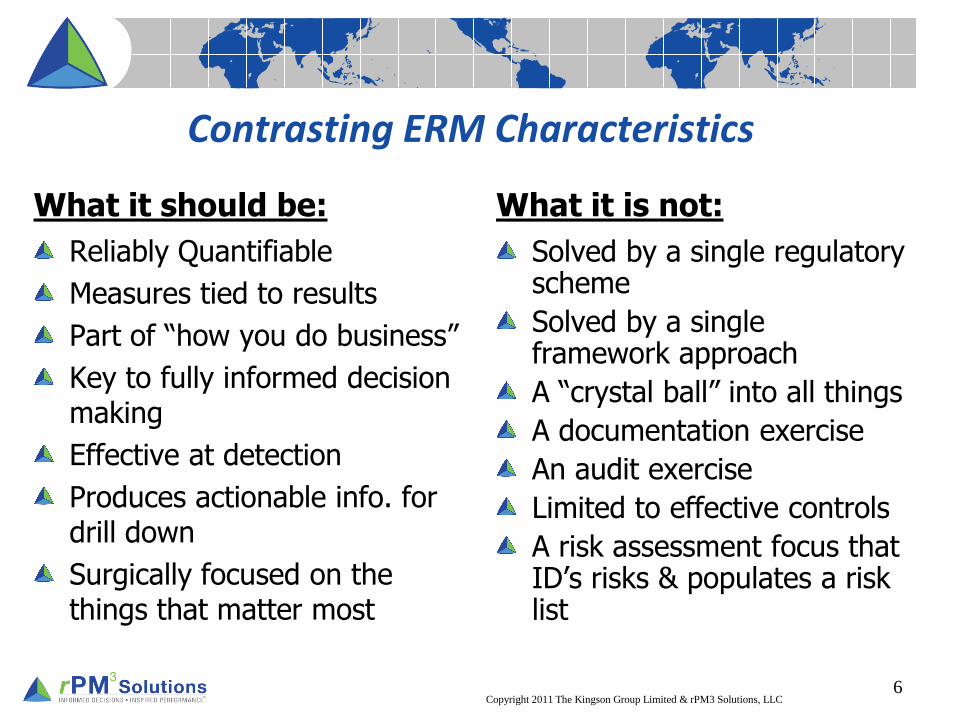
Contrasting ERM Characteristics
What it should be:
Reliably Quantifiable
Measures tied to results
Part of “how you do business”
Key to fully informed decision making
Effective at detection
Produces actionable info. for drill down
Surgically focused on the things that matter most
What it is not:
Solved by a single regulatory scheme
Solved by a single framework approach
A “crystal ball” into all things
A documentation exercise
An audit exercise
Limited to effective controls
A risk assessment focus that ID’s risks & populates a risk list
Copyright 2011 The Kingson Group Limited & rPM3 Solutions, LLC 6
Why should I adopt ERM? Improved Performance
From its inception, by definition, ERM has been linked to objectives, but until recently,
there has not been a quantifiable connection to results.
A key driver for ERM has been aligning typically silo’d risk management, to drive risk
management effectiveness
Effectively deployed, ERM enables consistency and alignment of risk management
efforts across silos
It should leverage a results-oriented approach which produces:
• economies of scale
• better focus and shared best practices, which leads to:
• stronger and more consistent company performance.
Copyright 2011 rPM3 Solutions, LLC 7
Meeting or Exceeding Performance Goals Should be the Priority
And the Other Reasons are…. Regulatory Compliance
More disciplined focus on risk management effectiveness has emerged from state and federal regulators such as:
• Securities & Exchange Commission
• National Association of Insurance Commissioners
• Sarbanes Oxly
• NACD Blue Ribbon Commission
Improved Credit Rating
S&P, Moody’s, AM Best and others now include ERM criteria in the development of their rating
Governance
The NYSE, NASDAQ, TSX and other stock exchanges, standards boards and industry associations have either mandated or established ERM as a business governance best-practice.
Copyright 2011 rPM3 Solutions, LLC
8
Important But Not Key Drivers for Doing ERM
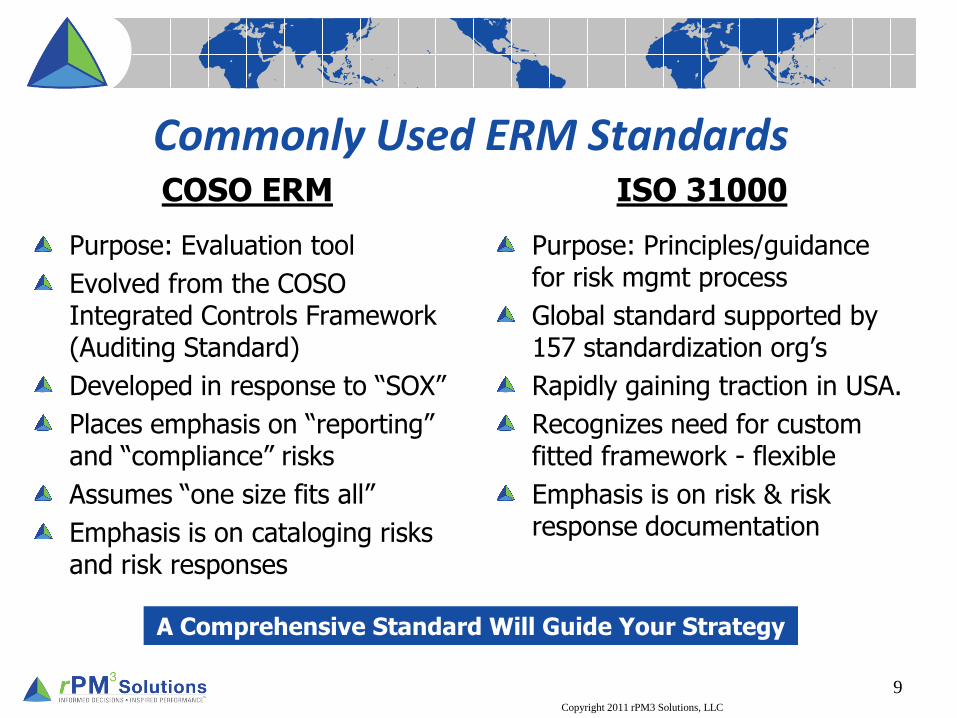
Commonly Used ERM Standards COSO ERM
Purpose: Evaluation tool
Evolved from the COSO Integrated Controls Framework (Auditing Standard)
Developed in response to “SOX”
Places emphasis on “reporting” and “compliance” risks
Assumes “one size fits all”
Emphasis is on cataloging risks and risk responses
ISO 31000
Purpose: Principles/guidance for risk mgmt process
Global standard supported by 157 standardization org’s
Rapidly gaining traction in USA.
Recognizes need for custom fitted framework - flexible
Emphasis is on risk & risk response documentation
Copyright 2011 rPM3 Solutions, LLC
9
A Comprehensive Standard Will Guide Your Strategy
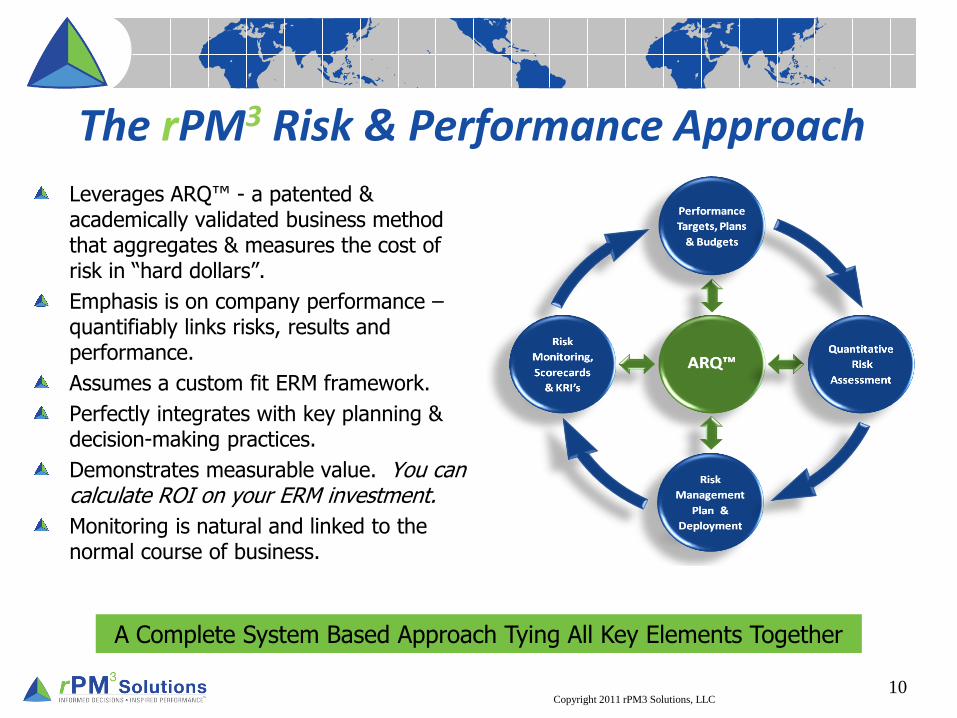
The rPM3 Risk & Performance Approach
Leverages ARQ™ - a patented & academically validated business method that aggregates & measures the cost of risk in “hard dollars”.
Emphasis is on company performance – quantifiably links risks, results and performance.
Assumes a custom fit ERM framework.
Perfectly integrates with key planning & decision-making practices.
Demonstrates measurable value. You can calculate ROI on your ERM investment.
Monitoring is natural and linked to the normal course of business.
Copyright 2011 rPM3 Solutions, LLC 10
A Complete System Based Approach Tying All Key Elements Together
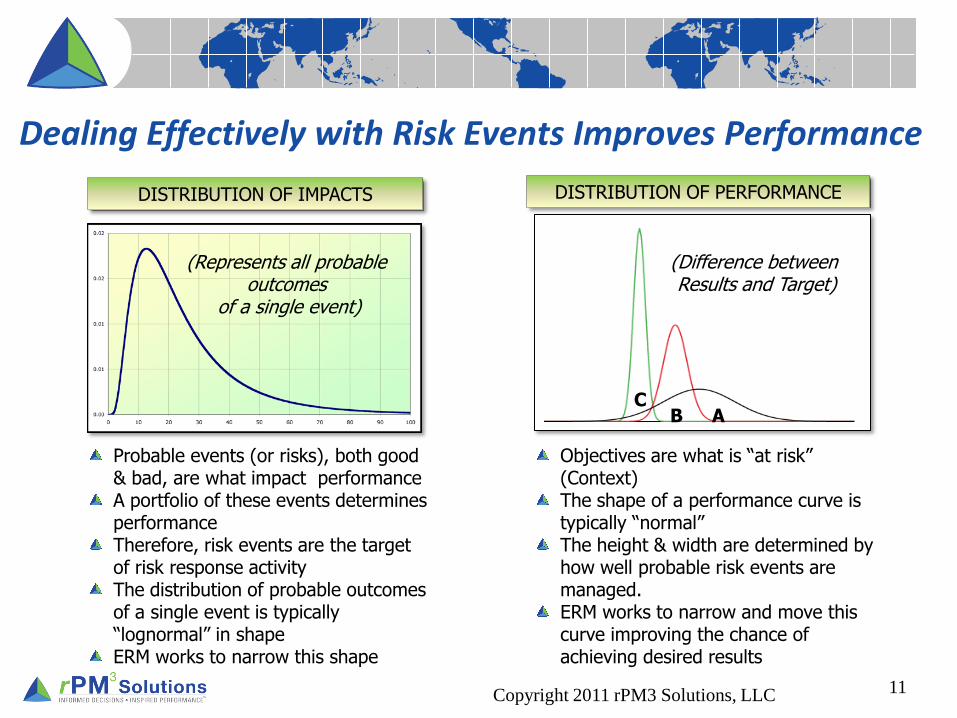
Dealing Effectively with Risk Events Improves Performance
Copyright 2011 rPM3 Solutions, LLC 11
DISTRIBUTION OF IMPACTS DISTRIBUTION OF PERFORMANCE
A B C
(Difference between Results and Target)
(Represents all probable outcomes
of a single event)
Probable events (or risks), both good & bad, are what impact performance A portfolio of these events determines performance Therefore, risk events are the target of risk response activity The distribution of probable outcomes of a single event is typically “lognormal” in shape ERM works to narrow this shape
Objectives are what is “at risk” (Context) The shape of a performance curve is typically “normal” The height & width are determined by how well probable risk events are managed. ERM works to narrow and move this curve improving the chance of achieving desired results
Tying ERM to Strategy & Performance Tactical ERM focuses on expected losses & improving
Fraud, business continuity, compliance related
Strategic ERM focuses on transparency for key ops risks that could affect strategic outcomes
Both are needed, but the tactical view often distorts and focuses on insignificant issues
Correcting this means: Ensuring you can identify and measure the most impactful or key risks, and
Using cost-benefit analysis, identify the best tools and techniques to control them
The Result: The more significant, higher impact losses will be both better understood and
effectively treated
Your aggregate view of risk will be more complete and meaningful
You will have greater assurance of meeting your firm’s performance goals
Copyright 2011 rPM3 Solutions, LLC 12
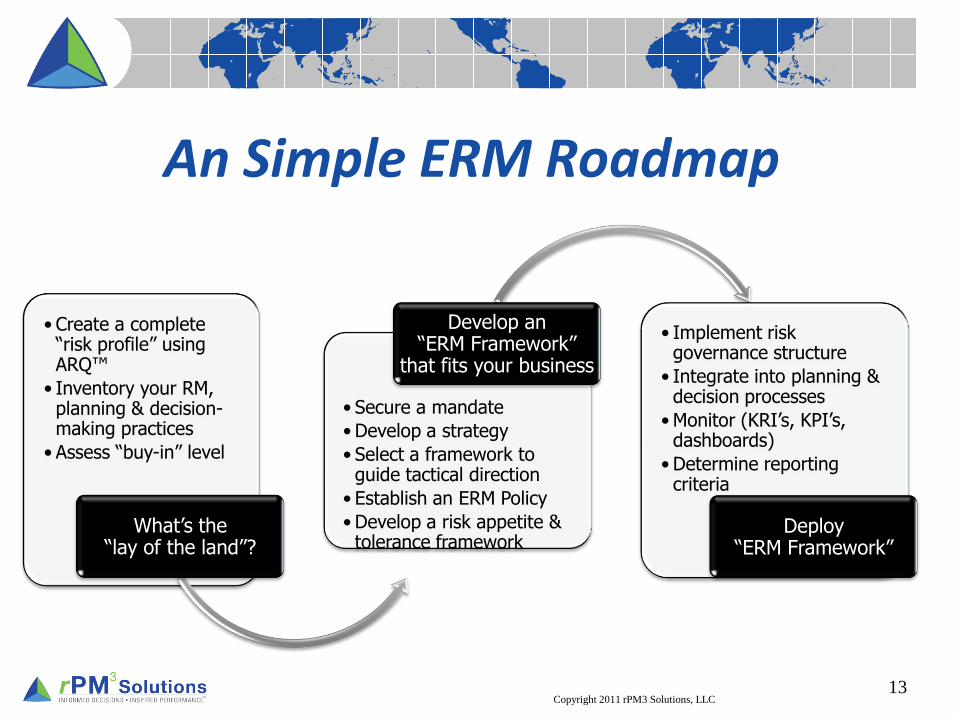
An Simple ERM Roadmap
• Create a complete “risk profile” using ARQ™
• Inventory your RM, planning & decision-making practices
• Assess “buy-in” level
What’s the “lay of the land”?
• Secure a mandate
• Develop a strategy
• Select a framework to guide tactical direction
• Establish an ERM Policy
• Develop a risk appetite & tolerance framework
Develop an “ERM Framework”
that fits your business
• Implement risk governance structure
• Integrate into planning & decision processes
• Monitor (KRI’s, KPI’s, dashboards)
• Determine reporting criteria
Deploy “ERM Framework”
Copyright 2011 rPM3 Solutions, LLC 13
The rPM3 Difference
Leading innovator of Risk & Performance Mgmt. Our patented ARQ™ risk-performance measure.
ARQ™ quantifies the link between “Risk” and “Performance”.
It makes dollar-based risk quantification possible.
Brings into view the whole forest, before you focus on individual trees.
Our mission is to accelerate your performance. So, our approach is performance-oriented - first.
We deliver practical & flexible solutions.
Leading expertise – hands-on experience.
“rPM” and “ERM” are what we do!
Proven results.
Copyright 2011 rPM3 Solutions, LLC
14
Contact Information Robert Eckels EVP, Business Development 410-384-9491 [email protected]
Chris Mandel EVP, Professional Services 210-845-5804 [email protected]
www.rpm3solutions.com
Copyright 2011 rPM3 Solutions, LLC
15