Embed Size (px)
Citation preview
BIOCONVERSION OF AGRICULTURAL WASTES TO
LYSINE AND ITS BIOLOGICAL EVALUATION IN BROILER
CHICKS
BY
SHAGUFTA IRSHAD
(2009-VA-255)
A THESIS SUBMITTED IN THE PARTIAL FULFILLMENT
OF THE REQUIREMENT FOR THE DEGREE
OF
DOCTOR OF PHILOSOPHY
IN
BIOCHEMISTRY
FACULTY OF BIOSCIENCES
UNIVERSITY OF VETERINARY AND ANIMAL SCIENCES
LAHORE, PAKISTAN
2014

i
To,
The Controller of Examinations,
University of Veterinary & Animal Sciences,
Lahore.
We, the Supervisory Committee, certify that the contents and form of the
thesis, submitted by Ms. Shagufta Irshad, have been found satisfactory and
recommend that it be processed for the evaluation by the External Examiner (s)
for award of the Degree.
Supervisor _____________________________________
(Dr. Abu Saeed Hashmi)
Co-Supervisor _____________________________________
(Dr. Mohammad Mohsin Javed)
Member _____________________________________
(Dr. Masroor Ellahi Babar)
Member _____________________________________
(Dr. Ali Raza Awan)

i
DEDICATION
I dedicate my research work, fruits of thoughts and my study to my
beloved husband with whom continuous support and appreciation, I would
be able to achieve this goal of PhD, my sons and to my parents with whom
prayers I am able to achieve this state in my life.

ii
AKNOWLEDMENTS
With the name of ALLAH the most merciful, the most beneficent, the lord of lords, who
guides us in darkness and helps us in all difficulties all praises are for ALLAH Almighty. All
respects and regards to Holy Prophet (PBUH) for enlightening all conscience with essence
of faith in Allah, converging all His kindness and mercy upon us.
It is great honour for me to express my profound and cordial gratitude to my kind and
respected research supervisor Dr. Abu Saeed Hashmi, Associate Professor, Dept. of
Biochemistry UVAS, Lahore Pakistan for his learned guidance, skilled advice and
sympathetic attitude during the course of my research work. I would like to express my
sincere gratitude to my co-supervisor Dr. Muhammad Mohsin Javed, Associate Professor,
Institute of Industrial Biotechnology, GCU, Lahore Pakistan. His guidance helped me in all
the time of research and writing of this thesis.
I am also grateful to my respected and kind supervisory committee members; Prof.
Dr. Masroor Ellahi Babar, Director of Livestock and Dr. Ali Raza Awan, Assistant
Professor, Institute of Biochemistry and Biotechnology, UVAS, Lahore Pakistan, whom
intelligence and experiences enabled me to learn a lot.
I feel great honour in thanking to Prof. Dr. Tahir Yaqub, Director of Institute of
Biochemistry and Biotechnology, UVAS, Lahore, Pakistan. He takes keen interest in research
projects of his institute and have kind inspiring attitude during period of my research work.
I am very thankful to Dr. Aftab Anjum, Associate Professor, Dept. of Microbiology,
UVAS, Lahore Pakistan who helped me a lot during the research work and no doubt what the
knowledge I have about microbiology is just because of their Department of Microbiology,
I am especially thankful to Mr. Anwer (Senior Lab. Assistant microbiology) for his co-
operation.

iii
I would like to express my heartiest thanks to Prof. Dr. Ikram ul Haq, Director
Institute of Industrial Biotechnology, GCU, Lahore, who allowed me to work in his institute
and provides me all the facilities to complete my research work. I am thankful to all my co-
researchers there; Mr. Naeem, Mr. Amjad, Mr. Asjad, Ms. Sana and Ms. Asma for their
cooperation and moral support during my research work. I would like to oblige the
cooperation of all the Lab Attendants of their institute.
I am thankful to Mr. Muhammad Saeed Chaudhry, Chief Executive and Mr.
Muhammad Asif Awan, Manager Electrical at Hunza sugar mills and distillery Shahkot,
Jhumra road Faisalabad Pakistan. I am grateful to Dr. Nafeesa, Incharge Romers Lab, for
toxin evaluation of fermented broth from Romers Lab Rawalpindi. I feel great honour in
thanking Dr. Gulraiz, Quality Assurance Manager and Mr. Sajid Hussain, Quality Control
Manager at SB Feeds amino acid analysis lab who have performed the Amino acid analysis
in Sadiq Feed (Pvt.) Rawalpindi, Pakistan. I feel pleasure in thanking Dr. Muhammad
Athar, General Manager at Hi Tech feed who allowed me to perform biological trial in the
Control-shed of Hi- Tech Feed Mill, Lahore, Pakistan and I would like to thank their
Production Managers; Mr. Mehmood and Dr. Yasir. I am also thankful to their Staff who
attended the broiler chicks.
I am really happy to mention my gratitude to my Father and Father in Law; Mr.
Irshad Ahmed Khan (late) and Mr. Sana Ullah Khan (late) who guided and encouraged
me for PhD. I would like to thank my mother, brothers and sisters for their endless prayers,
my Husband Mr. Gulraiz Ahmed Khan for his valuable guidance and support and my
brave beloved Sons; Abdullah, Abdul Rehman and Abdul Rahim Khan who suffered and
neglected a lot during my research work, but I care and love them a lot.

iv
LIST OF TABLES
TABLE NO. TITLE PAGE NO.
Table 3.1. Composition of Nutrient agar 28
Table 3.2 Composition of MM for mutant selection 35
Table 4.1 Screening of mutants for L-lysine production 67
Table 4.2 Comparison of kinetic parameters of wild and mutant culture
of B. flavum in 7.5L fully controlled glass vessel bioreactors
under optimized conditions
90
Table 4.3 Proximate analysis of fermented broth 91
Table 4.4 Amino acid profile of fermented broth by mutant (FB2) 101
Table 4.5 Amino acid profile of fermented broth by wild (FB3) 102
Table 4.7 Toxicity evaluation of produced lysine 103
Table 4.8 Independent Sample t. test on parameters observed after five
weeks on broiler chicks
106

v
LIST OF FIGURES
FIGURE NO. TITLE PAGE NO.
Figure 2.1 Structure of L-lysine 9
Figure 2.2 L-lysine synthesis pathway in prokaryotes 21
Figure 3.1 Standard curve of lysine 41
Figure 3.2 Standard curve of glucose 42
Figure 4.1 B. flavum on nutrient agar plates at 30 oC and pH 7.0± 0.2. 49
Figure 4.2 Screening of fermentation medium on the basis of L-lysine
production by wild B. flavum in 250ml Erlenmeyer shake
flask
51
Figure 4.3 Influence of different substrates (%) for Lysine production 52
Figure 4.4 Effect of various degrees of temperature on Lysine
production
53
Figure 4.5 Influence of inoculum size on Lysine production 54
Figure 4.6 Effect of pH on Lysine production 55
Figure 4.7 Influence of organic and inorganic nitrogen source on lysine
production
56
Figure 4.8 Effect of different concentrations of salts on Lysine
production
57
Figure 4.9 Optimization of different percentages of CSL for Lysine
hyper-production
58
Figure 4.10 Optimization of concentration of Biotin in (mg) per 100 mL
for hyper production of Lysine
59

vi
Figure 4.11 Suvival/ kill curve of B. flavum after UV irradiation 61
Figure 4.12 Survival/ kill curve of B. flavum after nitrous acid treatment 62
Figure 4.13 Survival/ kill curve of B. flavum after Ethidium bromide
treatment
63
Figure 4.14 Survival/ kill curve of B. flavum after ethyl methyl
sulphonate (EMS) treatment
64
Figure 4.15 Survival/ kill curve owf B. flavum after exposure to gamma
irradiations
65
Figure 4.16 Survival/ kill curve of B. flavum after N-nitroso N-ethyl urea
(ENU) treatment
66
Figure 4.17 Trend of mutant growth observed at 600 nm after every
8th
hour
69
Figure 4.18 Optimization of incubation period for the production of
Lysine from mutant B. flavum
70
Figure 4.19 Effect of different conc. of molasses (brix) for the
production of Lysine by (BFENU2
)
71
Figure 4.20 Influence of different degrees of temperature for the
production of lysine by (BFENU2
)
72
Figure 4.21 Effect of initial and final pH on Lysine production by
(BFENU2
)
74
Figure 4.22 Influence of various sizes of inoculum for hyper production
of Lysine from (BFENU2
)
75
Figure 4.23 Influence of various concentrations of (NH4)2SO4 as nitrogen
source for hyper production of Lysine from 4% inoculum of
(BFENU2
)
76

vii
Figure 4.24 Effect of various concentrations of urea as organic neutral
nitrogen source for hyper production of Lysine from 4%
inoculum of (BFENU2
)
77
Figure 4.25 Effect of various concentrations of CaCO3 for hyper
production of Lysine from 4% inoculum of (BFENU2
)
78
Figure 4.26 Influence of various concentrations of soybean hydrolysate
for hyper production of Lysine from 4%inoculum of
(BFENU2
)
79
Figure 4.27 Effect of various concentrations of tryptone for hyper
production of Lysine from 4% inoculum of (BFENU2
)
80
Figure 4.28 Effect of agitation in 7.5L fermenter on the production of
L- lysine by wild and mutant cultures of B. flavum.
82
Figure 4.29 Effect of aeration in 7.5L fermenter on the production of
L- lysine by wild and mutant cultures of B. flavum.
84
Figure 4.30 Effect of controlled and uncontrolled pH at 7.0 on the
production of L-lysine by wild and mutant cultures of B.
flavum
86
Figure 4.31 Effect of inoculum size on the production of L-lysine by
wild and mutant cultures of B. flavum.
87
Figure 4.32 Time course studies using wild and mutant culture of B.
flavum for lysine production under optimized conditions and
medium.
89
Figure 4.33 Thin layer chromatography (TLC) of fermented broth
obtained from the fermentation of molasses as substrate with
wild and mutant B. flavum
92

viii
Figure 4.34 Pale yellow crude Crystals of L-Lysine obtained after
crystallization
93
Figure 4.35 Pure crystals of L- Lysine 94
Figure 4.36 Thin layer chromatography of crystallized Lysine (sample)
and standard Lysine.
96
Figure 4.37 Amino acid analysis of fermented broth of mutant (BFENU2)
97
Figure 4.38 Amino acid analysis of fermented broth of wild (BF) 98
Figure 4.39 Amino acid analysis crystalline Lysine 99

ix
LIST OF APPENDICES
APPENDIX
NO.
TITLE
Appendix I classification of B. flavum
Appendix II Characteristic features of B. flavum
Appendix III Morphological features of Coryneform bacteria
Appendix IV Morphological and Biochemical identification
Appendix V Proximate analysis of substrates
Appendix VI statistical analysis of different substrate used for lysine production by
wild BF
Appendix VII statistical analysis on the parameters used for fermentation by wild BF
Appendix VIII statistical analysis of nitrogen sources of fermentation by wild BF
Appendix IX statistical analysis on the parameters used for fermentation by wild BF
Appendix X statistical analysis on the parameters used for fermentation by BFENU2
Appendix XI statistical analysis on the parameters used for fermentation by BFENU2
Appendix XII statistical analysis on the parameters used for fermentation by BFENU2
Appendix XIII Feed composition of control and test broilers
Appendix XIV Proximate analysis report
Appendix XV Toxin report
Appendix XVI Average weight gained (kg) by test and control broilers (each replica = 20
chicks) during the five weeks of Biological trial
Appendix XVII Postmortem report

x
CONTENTS
DEDICATION (i)
ACKNOWLEDGEMENT (ii)
LIST OF TABLES (iv)
LIST OF FIGURES (v)
LIST OF APPENDICES (ix)
Sr.
NO.
CHAPTERS PAGE NO.
1 INTRODUCTION 1
2 REVIEW OF LITERATURE 8
3 MATERIALS AND METHODS 27
4 RESULTS 49
5 DISCUSSION 107
6 SUMMARY 134
7 LITERATURE CITED 137
8 APPENDICES

xi
LIST OF ABBREVIATIONS
ABBREVIATIONS MEANINGS
(AEC)r
resistant to AEC
(NH4)2SO4 ammonium sulphate
µ Specific growth rate
AD aspartaldehydate dehydrogenase
AEC 2-amino ethyl L-cystein
AK aspartate kinase
B. falvum Brevibacterium flavum
B. lactofermentum Brevibacterium lactofermentum
B. linen Brevibacterium linen
BF wild B. flavum
BFENU2
mutant B. flavum
C. glutamicum Corynebacterium glutamicum
C. lilium Corynebacterium lilium
CaCO3 calcium carbonate
CH3OH methanol
CHCl3 Chloroform
CP crude protein
CSL corn steep liquor
DAP diaminopimelic acid
DD diaminopimelate decarboxylase
DDH DAP dehydrogenase

xii
DNS 3, 5 di-nitro salicylic acid
DS Dihydrodipicolinate synthase
EMP Embdon Meyerholf
EMS ethyl methane sulfonate
ENU N-nitroso N-ethyle urea
EtBr Ethidium bromide
FCR feed conversion ratio
GCU Government College University
HMPs Hexose monophosphate shunt
HPLC High Pressure Liquid Chromatography
HSD homoserine dehydrogenase
HSDleaky
Lysine analogue resistant mutant
K2HPO4.H2O di potassium hydrogen phosphate
KH2PO4.H2O potassium di-hydrogen phosphate
LSD least significant difference
MgSO4.7H2O magnesium sulphate
MM minimal medium
MNNG N-methyl-N-nitro-N- nitrosoguanidine
NaCl sodium chloride
NaOH sodium hydroxide
NB nutrient broth
NH3 ammonia
NH4+
ammonium ion
NH4NO3 ammonium nitrate
OD optical density
ppb parts per billion
QLys volumetric rate of lysine formation

xiii
qP specific rate of lysine production
Rf relative flow
S mixed carbohydrates consumption
TLC thin layer chromatography
UV Ultraviolet
UVAS University of Veterinary and Animal Sciences
wt/vol weight/volume
X cell mass formation
YLys/S lysine synthesis based on substrate uptake
YLys/X lysine synthesis based cell mass formation
YX/S substrate consumption yield coefficient with respect to growth
γ- irradiation gamma irradiation

1
CHAPTER 1
INTRODUCTION
Amino acids are the basic units that build up the body tissues, which show an
important role in human as well animal nutrition. For chemical industry these amino acids
have a worth because of their functional and chiral features (Leuchtenberger et al. 2005).
Therefore the demand of amino acids has grown rapidly (5- 7% annually) accompanied by
the development of their mass production. For every amino acid with the exploitation of new
uses such as they are supplemented as food additives, feed supplements. They have great
applications in the manufacturing of cosmetics, polymer materials, pharmaceuticals and
agricultural chemicals. From the last 20 years, the essential amino acids like lysine,
methionine, threonine and tryptophan are used as feed additives with maximum share (56%)
of the total amino acids (Ikeda, 2003; Bhalla et al. 2006). From the naturally occurring twenty
amino acids, nine essential amino acids have an important and prominent place in the feed or
food of animals and human because they cannot synthesize these amino acids in their body.
These essential amino acids that must be ingested through the food and feed are lysine,
threonine, methionine, valine, leucine, isoleucine, histidine, phenylalanine, and tryptophan
(Anastassiadis, 2007).
Lysine is the key element in health as it proved helpful to overcome heart symptom
like angina pectoris and prevent from cancer. It is an important and essential ingredient in
body that has a role in cleaning arteries (Javaid et al. 2012). The cell division is also
promoted in its presence and is necessary for carnitine production, which is a vital substance
to bring long chain fatty acids to the site of oxidation in mitochondria and convert it into
simpler compound and ATPs (Rambabu, 2007). Some studies revealed that it also performs a
critical role with arginine in the synthesis of collagen. Collagen is a protein that is necessary

INTRODU CTION
2
for connective tissues and bones integrally found in cartilage, tendon and skin. Lysine and
arginine are mostly found on the protein surface and have a vital role on protein stability by
forming special electrostatic interactions (Sokalingam et al. 2012). It is very essential for
children and growing animals. It also supports bone health by insuring adequate absorption of
calcium and therefore prevents osteoporosis (Christensen, 2011). It is a ketogenic amino acid
and gives rise to acetyl Co A that has very important functions and produce energy through
citric acid cycle. Lysine plays an important role in production of antibodies for healthy
immune system hence it is efficient against herpes virus. It also plays an important role in
body building and most of the athletes over use it for development of their muscles. This
amino acid helps in speed recovery of damage cause by over fatigue (Haas, 2006). In addition
to all, it has pharmaceutical applications both in the formulation of diets with a balanced
amino acid composition (Nasab et al. 2007).
With the development of amino acid market, a new era for the production of these
amino acids by many companies and academic associations have enthusiastically arisen with
the start of research and development in this field to increase the rate of amino acid
production. This technological race has expedited the expansion of amino acid manufacture
by various methods. Now these days, almost all the amino acids can be manufactured by any
of the four methods as extraction from chemical synthesis, protein hydrolysates, enzymatic
synthesis and fermentation. However, industrially, the most advantageous and economical
method used for amino acids manufacture is microbial method, that is fermentation (Ikeda,
2003). For almost fifty years, amino acids have been produced through fermentation
(Rastegari et al. 2013). Out of nine essential amino acids, lysine has the high priority due to
that it stands first in the list as it commercially very important amino acid used in feed of
animals (Javaid et al. 2012).

INTRODU CTION
3
Lysine, which is 2, 6 diamino hexanoic acid has the molecular formula C6H14N2O2
and molecular mass 146.19 g. It is a basic amino acid having two amino groups, one of them,
on α - position and other at the end of a 6- carbon aliphatic chain (Tome and Bos, 2007; Rao
et al. 2011; Malothu et al. 2012). It is the second most amino acid that is produced on large
scale with 800,000 tons of production per year and its requirement has been increased day by
day (Anastassiadis, 2007).
Lysine is not synthesized in monogastric animals. This speciality is only equipped in
plants and bacteria that can synthesize this critical amino acid. It is an essential constituent of
every protein that is present in body. The important plant sources of lysine are soybean,
common bean, buffalo gourd, lentil and buckwheat. It is observed in a small amount in
cereals, while pulses are a significant source of lysine. Some important plant sources of lysine
are soybean, berro, common bean, lentil, buffalo gourd and buckwheat. In addition to these,
lysine is found rich in meat especially red meat, in pork and poultry. The cheese and fish are
the rich sources of it. It is also significantly found in eggs. It is generally recognized as the
most deficient and first limiting amino acid in the food supply of man and meat producing
animals (Pellett and Ghosh, 2004). Since monogastric animal feed is usually deficient in
lysine therefore it must be added to their feed to provide a balance diet. Moreover, it is used
to enrich human foods which lack this essential amino acid (Shah, 1998). It is the first
limiting amino acid in virtually every cereal grain known to man, thus it has large potential
for enlightening the protein quality of cereal based human diets especially in those countries
that owing to their high dependence on cereal foods (Nasab et al. 2007).
Both chemical and biochemical methods are used for lysine production
(Anastassiadis, 2007; Nelofer et al. 2008). From the commercially manufactured lysine, 80 %
is manufactured by biochemical method and only 20 % by chemical means (Malothu et al.
2012). Among biochemical methods, fermentation is the most economical and practical

INTRODU CTION
4
means of producing lysine, as in this method low temperature and low cost carbon sources
are used for the lysine production (Ekwealor and Obeta, 2005). Fermentation is eco-friendly
and most economical. This microbial process is currently gaining ground because it has
produced the high cost compounds from the low cost industrial and agricultural wastes.
Microorganisms have a protruding role in producing a variety of products having
solicitations in different zones of life, such as energy, food, chemicals, diagnostics,
pharmaceuticals etc. They also used to produce enzymes, organic acids, amino acids,
vitamins, antibiotics, single cell proteins and other useful chemicals that are commercially
very important (Bhalla et al. 2006, Gupta et al. 2012).
Thus, lysine is being produced on industrial scale using Corynebacterium glutamicum
(C. glutamicum) as fermenting agent. The other sub species are Brevibacterium flavum,
Brevibacterium lectofermentum, Corynebacterium lilium, Brevibacterium dicvaricatum
(Kircher and Pfeerle 2001; Sindelar and Wendisch, 2007). The special features of these
strains included; gram-positive, coccal or rod-like, non-sporulating and non-motile. They all
require biotin for their growth. Now these days all of these strains are supposed to belong to
the genus Corynebacterium (Kumagai, 2000). Among them Brevibacterium flavum (B.
flavum) is considered the most suitable organism for the lysine production (Ali et al. 2009).
B. flavum is an industrially important microorganism that is used for the production of
lysine (Sattar et al. 2008). It has the potential to utilize diversity of carbohydrates as single
sources of carbon and energy for their growth and amino acid production (Kircher and
Pfeerle 2001). However, for the industrial fermentation, the use of complex sugar substrates
such as cane molasses, beet molasses, or hydrolysates from corn, wheat or cassava became
standard. The type of sugar which preferably used for the production of amino acids is also

INTRODU CTION
5
determined by the geographic location of that production plant (Hermann, 2003; Ikeda,
2003).
As a nitrogen source, numerous inorganic and organic compounds such as ammonium
salts and other similar compounds, urea can be used. However some complex compounds are
also used as a nitrogen source such as naturally protein containing substances that are
peptone, casein hydrolysate, yeast extract, corn steep liquor and soybean hydrolysate. Some
of the extracts of vegetal and animal tissues can be employed as a nitrogen source. In addition
to carbon and nitrogen sources, the culture media employed normally contain usual inorganic
essential nutrients for production of amino acids and for microorganism growth (Coello et al.
2000).
Microorganisms have a regulatory mechanism to control the quantities and qualities
of enzymes that are involved in the synthesis of amino acids. Therefore, it is necessary to use
this regulatory mechanism in order to get the mass production of the target amino acid.
Moreover the titre of amino acid increases if the enzymes involve in the production of the
required amino acid are found in large amounts under workable situations. For this purpose,
strains of microorganisms are improved using several techniques to make this process
possible (Kothari, 2009).
Microorganisms employed for amino acid production are categorized into four
groups; including the wild-type, auxotrophic, regulatory and auxotrophic regulatory mutant.
The species of Corynebacterium or Brevibacterium are famous for glutamic acid production
also employed for lysine fermentation. Moreover, their mutant strains that are also
auxotrophic or resistant to certain chemicals gave the enhanced production of lysine
(Anastassiadis, 2007). Auxotrophs are developed that excreted large quantities of lysine
(Ikeda, 2003). In the wild coryneforms, when their metabolic control of lysine production is

INTRODU CTION
6
studied it showed that in their metabolic pathway the first key step is the conversion of
aspartate to aspartyl phosphate. This conversion step is catalyzed by aspartokinase and is
controlled through feedback inhibition by two end products; lysine and threonine that are
synthesized after a number of steps. The over producing strains have faults in this feedback
inhibitory control mechanisms. They are lacking by homoserine dehydrogenase activity and
are consequently homoserine auxotrophs (Kavita, 2003). It was reported that homoserine
auxotrophs were the most powerful producers of lysine (Sano and Shiio, 1970). Thus,
homoserine auxotrophs can be established by random mutation of wild B. flavum which can
be utilized in the hyper- production of lysine that can be a good source required for food and
feed (Ali et al. 2009). First homoserine auxotroph of C. glutamicum was produced by
inducing mutation by physical mean such as UV radiation. That strain accumulated large
amount of lysine in the fermented broth by utilizing various carbohydrates (Kinoshita et al.
1957; Nakayama et al. 1961).
As Pakistan is an agricultural country and hundred thousand tons of agricultural
wastes are produced annually. These wastes can be utilized as substrates for fermentation
because they might offer an inexpensive alternative for microbial products such as amino
acids. Among those wastes, molasses is an agro-industrial waste and also a by-product of the
sugar industry which has a perceptible amount of reducing and non- reducing carbohydrates.
In fact, it is a dark brown thick solution that is achieved in the last process of table sugar
crystallization. It is commonly used in chemical industries for the production of baker yeast
and ethanol. Upgraded and pre-treated molasses are the major inexpensive source of
carbohydrate for amino acid fermentation. Molasses confined reduced polymeric
carbohydrates that can additionally be treated by dilute acids to produce monomeric
fermentable carbohydrates. After giving pre- treatment to molasses the most prominent
carbohydrate that produced is glucose that can be efficiently assimilated by the

INTRODU CTION
7
microorganism as a raw carbon source (Shafaghat et al. 2010). Sugar and poultry industries
are considered as main industries in Pakistan (Ali, 2004). It has reported that Pakistan sugar
sector has the capacity to produce over 2.5 million metric tons (MMT) of molasses (Aazim,
2013) which could be a good source of carbon, minerals and energy.
Wheat bran is the outer covering of wheat that is separated from the starchy endosperm
during the first stage of milling. It is rich in vitamin B, minerals, fibre (50%), high level of
carbohydrates and proteins (Sramkova et al. 2009). Rice polishing is also an agricultural
waste that is produced as bulks in rice milling. It can also be used as cheapest source of
energy for fermentation. It is a good source of vitamins specially vitamin B, minerals and
protein. It also contains about 10% of paddy and accessible in large amounts in major rice
developing regions of the world (Ambreen et al. 2006).
As Pakistan is a developing country and its feed industry utilized a huge amount of
foreign exchange for the import of lysine that is required for livestock and poultry feed. For
the annual production of 542.74 million broilers in Pakistan, minimum requirement of lysine
is around 0.1- 0.4% in broiler feed formulations. Therefore, there is gigantic prospective for
utilization of locally produced lysine in broiler feed (Rehman et al. 2012) to boost up the
economy of Pakistan.

8
CHAPTER 2
LITERATURE REVIEW
2.1: Amino acids and their production
The vital and fundamental unit of protein; amino acids are basically biomolecule
accomplishing the imperative structural and functional roles in human and animal life. There
are various twenty types of amino acids divided into two categories depending upon their
need to body system; such as essential and non- essential amino acids. Essential are those
amino acids that are not produced in body and their supply is requisite for numerous body
functions and fulfilled by consuming food enriched with essential amino acids. The rest of
amino acids are non-essential amino acids as they synthesized in body and their presence in
food is not requisite. Therefore, demand of essential amino acids for animal and human
nutrition is growing gradually. Consequently, fermentative production of amino acids has
encouraged a superior interest for scientists due to its nutritional values (Mahmood, 1996). At
this time, the amino acids are preferably mass-produced through fermentation of natural
materials; similar to yogurt, beer, vinegar, miso (bean paste), soya-sauce, etc. Actually amino
acid fermentation is a process that is used for the production of amino acid operating the
phenomenon in which microorganisms transform nutrients to various vital components
needed to them. During this process, the substrate that serves as a carbon and energy source
comprised of agricultural wastes; like cereal bran, molasses, corn steep liquor and
hydrolysates. These are added to the fermentation media to culture microorganism and
allowed to produce amino acids. The choice of microorganism is very important in the

LITERATURE REVIEW
9
production of a particular amino acid. Therefore microorganisms are first screened to find
their potential for secretion of desired amino acid (Kothari, 2009).
2.2: Lysine production through fermentation
Amino acids are biomolecules of diverse nature. They are prime mediators of virtually every
cellular process; therefore, their deficiency can lead to a vast variety of health problems.
Among all essential amino acids lysine is the most deficient one that must be supplemented
to the feed of livestock and poultry (Joseph et al. 1962; Faurie and Thommel, 2003; Ekwealor
et al. 2005; Nelson et al. 2008). Children as well as growing animals require ample amounts
of lysine for bone formation and tissue synthesis. It has been reported that nausea, dizziness
and hypersensitivity are among the few symptoms experienced by people having lysine
deficiency (Fig 2.1).
Fig. 2.1: Structure of L-lysine adopted from Nelson et al. 2008.
Lysine is cationic in nature with numerous potential uses in agricultural, medicine and
pharmaceutical industries. Its primary use is as a feed additive (Ekwealor and Obeta 2005) to
meet the nutritional requirements of chicks, humans and animals, as crude feed materials are
found to be deficient in lysine (Kircher and Pfeerle, 2001; Koffas and Stephanopoulos 2005).
From medicinal point of view, lysine blocks the bio-availability of arginine that is required
by herpes virus for reproduction; thus, it can inhibit the symptoms of Chronic Fatigue
Dysfunction Syndrome. It also increases body’s interferon level and helps in combating
immune infections. In pharmaceutical industries, lysine is used in formulating diets and in
amino acid infusion (Nelofer et al. 2008). For all these reasons, lysine demand has steadily

LITERATURE REVIEW
10
increased over the years with an inevitable increase in supply. It is currently being produced
worldwide at a rate of 6 ×10⁵ to 8×10
5 tons per year (Gunji and Yasueda, 2006;
Anastassiadis, 2007; Ali et al. 2009). It is reported to be second largely produced amino acid.
Moreover, lysine market has been speculated to have growth potential of 7-10% per year
(Koffas and Stephanopoulos, 2005). As the world population is increasing at alarming rate
and therefore the demand of food in the form of protein is also increased with that rate. By
taking in view of these aspects scientists are working day and night to develop some
conventional and non- conventional method to enhance the productivity of meat producing
animals (Tryfona and Bustard, 2004). Moreover Pakistan being a developing country, its feed
sector need to develop such process that are economical and beneficial (Ali et al. 2009).
Lysine is an essential amino acid for both human and animals. Majority of amino
acids are commercially produced by fermentation process. Corynebacterium has been widely
used for industrial production of lysine (Eggeling and Sahm, 1999; Herman, 2003). After the
evolutionary changes that occur during 1970 several successful mutation methods were
discovered that produce a valuable amount of this amino acid that lead to the expansion of
amino acid industry using fermentation with several microorganisms such as C. glutamicum,
B. flavum, B. lactofermentum (Hirose and Shibai, 1980). During 1960s, fermentation of lysine
was first time started in Japan. The valuable and high cost compounds are manufactured
through fermentation by using cheap industrial and agricultural wastes. Moreover this method
of amino acid fermentation is environmental friendly and more efficient. The fermentative
method of amino acids production is more advantageous as it produced 100 % L amino acids
that is metabolized by the microorganism whereas by chemical method 50% D amino acids
and 50% L amino acids are synthesized that cannot be assimilated for protein synthesis by
living organisms (Khan et al. 2006). It was reported by Anastassiadis (2007) that
fermentation has more attraction for biotechnologist as compared to synthetic methods of

LITERATURE REVIEW
11
amino acid manufacture due to stereo specificity. Furthermore after identification of more
lysine producing strains, mutant strains of Brevibacterium and Corynebacterium were
developed that are used to produce lysine and other amino acids. Moreover fermentation
technology also replaced the classical methods such as acid hydrolysis that was costly and
low yield method as compared to these emerging techniques of fermentation.
Fermentation is carried out by following two types of culturing; such as continuous
and fed-batch culture. Some fermentation experiments were performed by Kiss and
Stephanopoulos (1991) with the C. glutamicum (A lysine producer) to determine the
maximum lysine producing culture process with biomass production as well as respiratory
measurements were also determined. The fed batch was found to be the best suitable
culturing method with reference to product and biomass formation. Moreover they developed
two schematic methods to find that either the microbes get affected by environmental factors
during the culturing process of continuous and fed batch. Moreover metabolism of microbes
was greatly affected by environmental factors for over production. They reported after their
studies that fed batch was a successful method for maintaining the yield. Microbes are
cooperated with facility to synthesize all the amino acid as an essential components but their
production is limited. For this purpose to enhance its productivity scientists have developed
large variety of mutant strains by using various techniques. For fermentation the selection of
substrate is as important as microbe selection. But during the selection it was preferred to use
cheap and economical substrate such as molasses, cereal bran and starch hydrolysate (Shah
and Khan, 2008).
2.3: Industrially important microorganisms
Microorganisms are able to synthesize both essential and non-essential amino acids.
They tend to produce extracellular lysine that can be easily recovered from the fermentation
broth. Lysine can be produced via following methods; preparation of protein hydrolysates

LITERATURE REVIEW
12
and then extraction of amino acids, enzymatic method of amino acid manufacture, chemical
and fermentative processes that was used for amino acid manufacture (Faurie and Thommel,
2003). Initially extraction from protein hydrolysate was the main process through which
lysine was produced but then gradually chemical and enzymatic synthesis took over (Shah et
al. 2002). Chemical synthesis produced only D and L form of amino acids and required
additional step of optical resolution to render biologically active L-isomers. Enzymatic
synthesis, on the other hand, produced optically active D& L amino acids in high
concentrations. It also produced lesser amounts of by-products making the downstream
process simpler. This method employed use of substrates that were converted to their
corresponding amino acids with the help of microorganisms (Faurie and Thommel, 2003).
However, none of these methods were cost-effective and practicable on industrial scale level.
Fermentative processes opened up a vast arena for the production of industrially
important metabolites and L-lysine is one of them. C. glutamicum was discovered to produce
Lysine through fermentation in 1958 at Kyowa Hakko’s plant in Japan (Kelle et al. 2005).
Since then, there has been no turning back for fermentation industry. Recombinant DNA
technology and strain improvement of microbes producing amino acids have enabled
production of lysine at industrial scale (Ali et al. 2009). Fermentation contributes 80% of the
lysine that is annually produced worldwide while the remaining 20% is contributed by other
processes (Coello et al. 2000 & 2002) This method is preferred over all the other methods
because it employs low temperature, low pressure, low cost carbon sources and renders
biological form of lysine as the final product (Nasab et al. 2007).
Microorganisms that have been reported to produce lysine include Corynebacterium
glutamicum (Nelofer et al. 2008), Bacillus megaterium (Ekwealor and Obeta, 2005),
Brevibacterium linens, Streptomyces Albulus IFO (Shih and Shen, 2006), Brevubacterium
flavum, Methylotrophus methylophilis (Ishikawa et al. 2008), Brevibacterium lactofermentum

LITERATURE REVIEW
13
(Tosaka et al. 1979), Bacillus subtilis (Leuchtenberger, 1996) and Bacillus laterosporus
(Umerie et al. 2000). Among these, C. glutamicum has been widely exploited industrially for
lysine production (Pfefferle et al. 2003). C. glutamicum and its other subspecies are known to
be well lysine producing stains including B. flavum, B. lactofermentum and C. lilium. They
have their specific characteristic features that are rod shaped, gram positive and aerobic
bacteria. Coryneform bacteria that was famous for amino acid production was first time
identified in 1950s (Wittmann and Becker, 2007). Therefore, these strains are industrially
important and famous for amino acid fermentation. In order to investigate the control of sugar
transportation mechanism and lysine production mechanism, these strains are under
observation. Moreover, it was explored that B. flavum, C. glutamicum and B. lactofermentum
are genetically closely related to each other (Ruklisha and Ionina, 2000).
2.4: Fermentation media for lysine production
Fermentation media for lysine production must have a good substrate, organic or
inorganic nitrogen source, some growth nutrients, minerals and essential additives. Some
complex media contains special component including; peptone, tryptone, yeast extract, corn
steep liquor and molasses that serves not only as substrates but also mineral reservoir. The
vitamins and minerals that used for fermentation are biotin, thiamine, iron and manganese
salts and various types of inorganic ions are used in lysine fermentation which are
dipotassium hydrogen phosphate that is the source of phosphate and potassium with
potassium di- hydrogen phosphate, magnesium sulfate and magnesium chloride provides the
magnesium that is the macro nutrient whereas ferrous chloride, ferrous sulfate and
manganese sulfate serves as micro nutrient (Gubler et al. 1994). Whereas Adnan et al. (2011)
reported lysine 23.57g/L with the organism B. linen. They had utilized the agricultural wastes
for solid state fermentation and utilized rice husk, rice bran, wheat bran and soya bean meal
and had also optimized different physical and nutritional parameters like 13.0g soybean

LITERATURE REVIEW
14
meal,4.0% inoculum size,87.50% moisture level, and 0.65g ammonium sulphate. All over the
world carbohydrates are exclusively used as significant feedstock. Different researcher
utilized various components for the production of their required product through
fermentation, as Ahmed et al. 2010 performed the fermentation by sequential culturing
Arachniotus sp. followed by Candida utilis at 35oC for 72 h of incubation and produced
microbial biomass protein that is enriched with essential amino acids. The fermentation
medium used was 1% molasses, 6% corn stover, 0.0075% CaCl2.2H2O, 0.01% KH2PO4,
0.005% MgSO4.7H2O and (30:1).C: N ratio.
With the passage of time to accomplish the increasing demand of lysine
manufacturers are building various project to optimize numerous levels of carbohydrates and
other condition (Ishikawa et al. 2008). Moreover the coryneform bacteria have special
metabolism to utilize beet pulp, molasses, sucrose and other sugars as major carbon source
that is an important cost reducing factors of finally produced amino acid on industrial scale.
Different researchers worked to optimize the fermentation media for hyper production of
lysine. Among them Sattar et al. (2008) described their finding after their studies on B.
flavum that was found as one of the important coryneform bacteria used for lysine
production. Actually they enhanced the lysine contents in yeast sludge from 1.54% to 4.78%.
They found molasses (1%), protein hydrolysate (25 mg/100mL) and corn steep liquor (4%) as
optimum level for maximum lysine production with yeast sludge as substrate at 30oC and pH
7. The time course of 48 hours was mentioned in their study by using B. flavum as fermenting
agent.
Lysine synthesis was also investigated by Nasab et al. (2007), they reported that a
number of valuable products like single cell proteins, enzymes and amino acids can be
produced by utilizing agricultural wastes as a cheap source of carbon and energy. Therefore
they used a variety of agricultural wastes as a carbon source in their studies for fermentation

LITERATURE REVIEW
15
by using a reported strain of C. glutamicum. The agricultural by products; like date pulp and
molasses were used and then results were related with glucose as substrate. They found the
maximum production of lysine (48 g/L) after 96 hours of incubation with molasses as
substrate. They also optimized different nitrogen sources for hyper production of lysine and
found during the investigation that ammonium sulphate was a best nitrogen source.
Furthermore after increasing the incubation time from the optimum time lysine titre was
decreased.
Ekwealor and Obeta (2005) optimized different ionic and minerals concentration and
described their effect on lysine production by using Bacillus megaterium as fermenting agent.
Use of complex substances like molasses, yeast extract, corn steep liquor necessitates the
process of optimization that involves optimizing parameters such as culture media,
temperature, pH etc. It is a pre-requisite for scaling up of all biotechnological process and
determining the feasibility of any process (Eggeling, 2005). Optimization of cultural
conditions in fermentation aims to increase the titre of lysine production and reduce the
amount of by-products that are likely to be formed under unfavourable conditions (Kircher
and Pfeerle, 2001).
As those mutant strains that are auxotroph, they needed special nutrients for their
growth such as lysine are produced more by those mutants that are auxotroph of homoserine
and homoserine or its source is required by those strain. A study was conducted by Tada et al.
(2000) to optimize the concentration of threonine in homoserine auxotroph of B flavum.
During that process, the continuous addition of L-threonine was investigated in an automatic
glucose supplying system that maintained 10% glucose with the production of 70 g/L of
lysine. It was observed during their study that three folds lysine production was increased by
the exponential addition of L-threonine. Actually L-threonine increased the metabolic flux of
carbon for lysine biosynthesis pathway than in normal growth phase use. The essential amino

LITERATURE REVIEW
16
acids like valine and lysine was produced in high amount by using B. flavum as fermenting
agent. On commercial scale it is also manufactured by aspartate kinase resistant mutant of C.
glutamicum that were obtained after classical screening. Overproduction and secretion carrier
of lysine is closely related to each other in organism as reported by (Tryfona and Bustard,
2004). Although secretion carrier of lysine is present in both wild and mutant strains, but over
production is shown only by mutant strain. Therefore wild strains of coryneform are
subjected to mutation to enhance their potential for lysine secretion.
2.5: Mutagenesis
Wild strains of these organisms have very low potential for L-lysine production. To
date, many studies on strain improvement have been carried out using various methods
including conventional mutagenesis and screening, genetic engineering, and metabolic
engineering (Malothu et al. 2012). Recent work on C. glutamicum was the development of
complete genome sequence, and the genetic information is very valuable for strain
development for higher performance, in coordination with various “omics” analyses. Through
random mutation and selection a large number of amino acid producers were developed from
over many years (Kelle et al. 2005). Many regulatory and auxotrophic mutants of this species
have been developed that have been well characterized hyper-producers of L-lysine.
Homoserine and threonine auxotrophs have been developed as these amino acids are
produced via similar metabolic pathway as lysine (Shah et al. 2002). Amongst the regulatory
mutants, feedback resistant mutants are common that are developed by screening mutants for
their ability to tolerate lysine analogues so to obtain mutants that resist feedback inhibition
phenomena and overproduce L-lysine. Many recombinant strains of C. glutamicum have been
developed that are used to improve the production of lysine (Blombach et al. 2009, Shah et
al. 2012). The over production of desirable product by microbial metabolism, strains require
different techniques. Mutagenesis is one of them which are applied to modify organism.

LITERATURE REVIEW
17
Chemical and physical are two types of mutagens which may be used for genetic removal of
feedback control in wild organism but the rate at which mutations are induced in organism
and nature of mutation is an important factor. After mutation strain should not be revertible.
Strong chemical mutagens are nitroso compounds and alkylating agents like ethyl methane
sulfonate (EMS). And physical mutagens are heat, UV- radiations (254 nm), X-rays and
ionizing radiations. Exposure of UV-radiations is most recommended physical mutagen
because both frame shift and base pair mutations can be induced. But it can be reversed when
culture is incubated in darkness under non growth conditions (Ali, 2004). B. flavum produced
maximum lysine at pH 7and 37oC temperature. As far as mutations are concerned, exposure
of UV radiations to organism for 30 minutes produced maximum lysine. Substrate water
ratio, quantity of molasses and corn steep liquor were optimized. Highest efficiency of
organism for lysine production was achieved at 40% substrate water ratio, (Naz et al. 2001).
Lysine was the first amino acid that was produced with the help of mutant strains that
require homoserine for hyper production in industry (Shah and Khan, 2008). Homoserine
auxotrophic mutants were developed from a local strain of C. glutamicum (PCSIR-BI4)
through mean of N-methyl-N-nitro-N nitrosoguanidine (MNNG) as a mutagen. The produced
mutants were screened for the lysine production through fermentation by using cane molasses
as substrate in fermentation medium. Different initial sugar levels of molasses were engaged
to obtain better lysine production in the medium by using selected homoserine auxotroph.
The optimal sugar concentration was investigated to be 60g/L
at 30°C after 120 hours of
incubation, which enhanced lysine production from 4.00 to 25.05g/L. All the kinetic
parameters including yield coefficients and volumetric rates shown the hyper production of
lysine by the mutant exhausting black strap molasses as a single source of carbon (Nelofer et
al. 2008). For maximum lysine biosynthesis in shake flask selection was completed for two
strains of C. glutamicum and B. flavum. In the comparison of these two strains the optimum

LITERATURE REVIEW
18
culture was developed by Mutagenesis of B. flavum was done by ethidium bromide,
irradiation to UV rays and treatment of nitrous acid in order to develop improved
manufacturer of lysine. Five different mutants isolates were screened to get the best lysine
producer and B. flavum (IIBUV2) were found to excellent producer of lysine. Optimization of
(IIBUV2) and its wild strain were performed in order to find comparison and found the
constant optimal condition for basal medium. Maximum lysine production of 8.8 g/L was
attained when mutant was growing on basal medium requiring (w/v): 0.5% peptone, 0.1%
(NH4)2SO4, 5 mg% K2HPO4 and 3.0% glucose at 7.5 pH, 32°C and 8% inoculums size.
When the mutant was cultured in 7.5 L stirred glass fermenter was following 120h
incubation, agitation of 300 rpm and aeration of 4.0 VVM. After scale up studies lysine
production was raised up to 17.8 g/L (Javaid et al. 2012).
N-nitroso-N-ethyl urea (ENU) was used as chemical mutagen for extreme lysine
production. The mutant of B. flavum was developed by refreshing the wild strain on suitable
medium having reported concentrations. The refreshed bacterial growth after centrifugation
at 10,000 rpm was washed with citrate buffer and then exposed to 35 mM ENU for 5-30
minutes. Consequently the excess of ENU was removed by successive washing with sodium
citrate buffer (pH= 4.2). After that the mutated strain was inoculated to fermentation medium
that is supplemented with methionine and threonine as auxotrophic needs. From mutant
strain the biosynthesis of lysine was improved more than the wild; as from 81 to 125 g/L.it
was concluded at the end that lysine production by using B. flavum as fermenting agent was
enhanced by supplemented with optimum levels of vitamins and minerals in fermentation
medium alongside with optimum physical parameters (Javed et al. 2011).the researcher
Ekwealor and Obeta (2006), also developed UV- mutant that was also resistant to analogue of
lysine that is 2-amino ethyl L-cystein (AEC) and showing auxotrophy for L-homoserine.
Another mutant was produced by researchers (Rehman et al. 2012) using UV exposure as
LITERATURE REVIEW
19
physical mutagen. That mutant was selected to optimize nutritional and physical conditions
for fermentation and produced lysine was 8.2 mg/mL in shake flask. They optimized different
conditions such as; 30°C temperature, 7.6 pH and 60 hours of incubation at 300 rpm. By
using sugars 15% (wt/vol.) cane molasses and corn starch hydrolysate as a mixture and
kysine titre was enhanced from 8.2 mg/mL to 18 mg/mL. Thus it was concluded that by using
mutant strain lysine demand can be achieved. They was found that UV radiations were most
potent one to induce mutations for that it created pyrimidines dimmers among adjacent and
complementary strands. Subsequently auxotrophic mutants of B. flavum and C. glutamicum
were developed and exposed to lysine over production. In mutant strains feedback inhibition
was noticed by L-lysine in first step where aspartokinase enzyme is responsible to catalyse
this step in lysine synthesis from aspartate. Development of regulatory mutant is another
method in which mutant should be insensitive to feedback inhibition of repression. Typically
such type of mutants is deficient in regulatory enzymes. B. flavum also showed such sort of
performance in lysine production (Shah and Khan, 2008). In this way an insensitive
aspartokinase containing mutant was developed for lysine production at higher ranks. For
overproduction of lysine in C. glutamicum alteration of metabolic flux has a significant
importance. It was perceived that aspartokinase enzyme of mutant C. glutamicum
investigated double flux after entering into pentose monophosphate shunt (Radmacher and
Eggeling, 2007).
Seven homoserine, 42 methionine, 42 threonine, and 15 isoleucine auxotrophs were
achieved from B. flavum No. 2247 (ATCC No. 14067) by physical and chemical mutagens
such as x ray irradiation and (MNNG) treatment. Considering the lysine-producing
capability, the homoserine auxotrophs were found to be the best lysine producer and the next
ranked was one-half of the threonine auxotrophs. The rest of threonine auxotrophs and all of
the methionine and isoleucine auxotrophs were manufactured less lysine. The exploration of

LITERATURE REVIEW
20
enzyme activities of threonine was conceded by Sano and Shiio, (1970). One of the
Escherichia coli was isolated from irrigation water channel by Nadeem et al. 2001. That
strain was formerly accomplished of producing 1.8 g/L of glutamic acid and then strain was
progressively upgraded through mutation for lysine production. The wild bacterial cells were
exposed to MNNG (100 μg/mL) as a mutagen for 90 minutes. The mutant showed resistance
against (AEC), a lysine analogue, and produced lysine (0.1-0.5 g/L). They developed three
mutants; from them AR305 strain was over exposed to MNNG. Three mutants, thus produced
were able to produce 13-15 g/L of lysine
2.6: Biosynthetic pathway of lysine in microorganism
The biosynthesis of L-lysine by coryneform bacteria via fermentation includes the
following steps. Glucose is oxidatively converted to pyruvate by both HMPs (Hexose
monophosphate shunt) and EMP (Embdon Meyerholf) pathways. From pyruvate and
phosphoenol pyruvate, oxaloacetate is formed by pyruvate carboxylase and phosphoenol
pyruvate carboxylase respectively. Pyruvate from Acetyl Co A enters in the central
metabolism by condensation with oxaloacetate and forms α-ketoglutarate. Its oxidation step
is blocked in glutamate producing organism (C. glutamicum). Aspartate is formed by the
transamination of oxaloacetate in said organism. It involves three reactions from aspartate to
two branched points intermediate compounds aspartic β-semialdehyde and homoserine. It
converts to aspartyl phosphate through aspartate kinase and aspartyl phosphate is converted
to aspartic β-semialdehyde by aspartate kinase and aspartate β-semialdehyde dehydrogenase.
The other branch point homoserine is formed by the action of homoserine dehydrogenase on
aspartic β-semialdehyde. In the next step the condensation of aspartic semialdehyde with
pyruvate yields a compound that cyclizes to 2,3-dihydrodipicolinate which then reduces in an
NADPH linked reaction forming piperdine-2,6-dicarboxylate which then forms L-α-amino-ε-
ketopimelate, this compound forms L-lysine by diaminopimelic acid (DAP) pathway and

LITERATURE REVIEW
21
DAP dehydrogenase (DDH) by path. In case of DAP pathway, L-α-amino-ε-ketopimelate is
trapped by succinylation or acetylation forming N-succinyl-α-ε-diaminopimelate. The acetyl
is removed to yield L, L-diaminopimelate. Decarboxylation of a substrate, that is the
mesoform of DAP, catalyzes the final step in biosynthesis of L-lysine. In DDH bypath L-α-
amino-ε-ketopimelate is converted to meso-α-ε-diaminopimelate by DDH, decarboxylation of
this form L-lysine (figure 2.2). Contribution of DAP pathway to the L-lysine production is
about 60-70 % and that of DDH by path is 30-40%. Another branch point intermediate
homoserine is formed from aspartate semialdehyde which forms threonine on one side and
methionine on the other side (Weinberger and Gilvarg, 1970; Yamaguchi et al. 1986).
Figure 2.2: L-lysine synthesis pathway in prokaryotes (Weinberger and Gilvarg, 1970)

LITERATURE REVIEW
22
The biosynthetic pathway of lysine in Brevibacterium linens was investigated by
Chatterjee, (1998) before and after mutations and it was observed that aspartate kinase (AK)
and aspartaldehydate dehydrogenase (AD) show maximum activity during exponential phase
of organism. In mutated strains activity of these enzymes was enhanced 10 to 20%.
Dihydrodipicolinate synthase (DS) and diaminopimelate decarboxylase (DD) are two
enzymes in wild type which are inhibited and repressed by lysine but mutant AEC NV 20r50
of B. linens show insensitivity in these two enzymes to repression and inhibition. So,
persistent activity of these enzymes and large excretion of lysine from mutant AEC NV 20r50
was obtained at late stationary phase.
The fermentative production of lysine in B. flavum and C. glutamicum depends on
oxaloacetate, pyruvate and two ammonia molecules with the addition of four NADPH
molecules as reducing powers. It is interesting to note that these organisms split the pathway
into branched form (Wittmann and Becker, 2007). Lysine belongs to the family of amino
acids depending on aspartate biosynthetic pathway so it is expected that lysine has a close
relationship with aspartate family amino acids. For lysine production three different pathways
are present in bacteria. First step is phosphorylation of aspartate by aspartate kinase and this
is the most critical step because it is related to concerted feedback inhibition. On the other
hand E.coli and gram positive bacteria initiate this step through succinilase pathway and lead
towards d, l-diaminopimelate, directly which is lysine precursor. Lot of hypotheses is
proposed for lysine efflux in C. glutamicum. One such hypothesis is that physical change can
increase membrane permeability. Another hypothesis put forward is that membrane
permeability may be enhanced with limited supply of air (Tryfona and Bustard, 2004). Lysine
synthesis in C. glutamicum and B. flavum takes place via (DAP) pathway. This synthetic
pathway begins from the central metabolite of L-aspartate. During the first two steps of lysine
synthesis aspartate is phosphorylated by aspartokinase and it is reduced by aspartate

LITERATURE REVIEW
23
semialdehyde dehydrogenase to produce L-aspartate semialdehyde. It is located on the branch
points of methionine, threonine, iso-leucine and lysine biosynthesis. Other steps are catalysed
by Dihydrodipicolinate synthase and dihydrodipicolinate reductase respectively. These
enzymes also regulate the flux to the meso-diaminopimelate and lysine synthesis (Yang et al.
2000).
Transport and uptake of lysine is an important aspect for it excretion outside the
microorganisms. In C. glutamicum lysine uptake occurs through lysine/alanine exchange
carrier. In case of limited lysine inside the wild type or auxotrophic mutant cells lysine uptake
occurs by exchange with alanine, valine, or leucine. But if lysine concentrations are high in
organism then lysine/lysine counter-exchange mechanism helps with no net transport. Trans-
membrane spanning helices are present hydro- phobically so it acts as a dimmer and works as
secondary mechanism in which lysine gradient and electrochemical proton potential are
driving forces (Burkovski and Krämer, 2002; Eggeling and Sahm, 2001; Ruklisha and Ionina,
2000).
2.7: Down streaming of Lysine
The estimation of lysine can be performed by following different qualitative and
quantitative methods used by different researchers. Qualitative analysis of lysine was carried
out by paper chromatography while quantitative estimation was performed by
spectrophotometric method using ninhydrin copper reagent (Shah et al. 2002). Paper
chromatography was used by Khan et al. (2006) applying small volume of sample on filter
paper whattman and the developing solvent had the ratio of solvent n-butanol: acetic acid:
water (4:1:5) for18 hours to upsurged the solvent. Then spots were visualized after sprayed
with 1% ninhydrin at 70oC for 15 minutes. Overlapping of amino acids was resolved by paper
electrophoresis. The quantitative valuation was conceded out by spectrophotometer by
cutting the spot and eluting their complete colour in 3ml of methanol. The absorbance was

LITERATURE REVIEW
24
tested at 550 nm by using methanol as blank. The quantification of each amino acid was
determined by using standard curve. Nasab et al. (2007) employed thin layer chromatography
(TLC) for the detection of L-lysine in the culture broth the solvent used was n-butanol, acetic
acid and water (1:2:4) and the spots were visualized by 0.5% ninhydrin in butanol. The
quantity of Lysine was measured by scrapping the developed spots and diluting with water,
then centrifuged to separate microorganism from silica at 2000 rpm. The supernatant was
lyophilized using SPEDI-VAC-GAUGE freeze dryer. After one day brown crystalline solid
was obtained. Anatassiadis (2007) used High Pressure Liquid Chromatography (HPLC) and
acidic ninhydrin method for the estimation of lysine. HPLC with pre-column deriviatization
with ortho phthaldehyde and amino acid separation was used Ion exchange chromatography
was used for the detection of amino acid composition by auto-analyzer. Post column reaction
was also used with ninhydrin. L-lysine can also be detected by bioassay method with the use
of amino acid analyzer. Lysine is extracted by different methods like crystallization,
centrifugation, ion exchange extraction and drying process.
Sometimes fermentation broth is also used as source of lysine in animal feed. Due to
increasing demands of lysine in poultry feed industries are seeking for innovative research
projects to lead in the business of amino acid production. High Pressure Liquid
Chromatography method is employed for assessment of lysine from biomass liquor and
ninhydrin solution in acetone process is also employed for lysine estimation. Ion exchange
chromatography containing column of cation resins of ammonium type was used for
purification of amino acids. Amino acids composition was checked by using auto-analyzer
(Anatassiadis. 2007). A novel ion-exchange moving bed has been developed which uses
resin-liquid slurry tanks, thereby allowing fermentation broth to be fed directly to the resin
process without pre- treatment. A previous study using Lysine fermentation broth
demonstrated that clogging by bacteria did not occur, but such problems as poor performance

LITERATURE REVIEW
25
in the elution process and instability of the equipment remained. To overcome these
problems, the experimental apparatus was improved by using a new type of resin separator.
Stable operation was achieved, and the production of L-Lysine reached 15.4 ton in 12 days.
The elution process was especially improved compared to the previous work. The amount of
the eluent could be reduced and the concentration of L-Lysine in the eluent increased. The
novel method also produced a smaller amount of waste water than the conventional fluidized
bed. In addition, a numerical simulation model was constructed in order to optimize the
operation. The predictions from the simulation agreed well with the experimental data
(Kusunose et al. 1999).
Pure lysine is recovered in the form of its monohydrochloride from fermentation
broths also containing neutral amino acids and inorganic cations by passing the broth at about
pH 2.0 over a strongly acidic cation exchange resin of the ammonium ion (NH4+) type,
eluting the lysine with ammonium hydroxide solution, and crystallizing the lysine as an acid
salt from the partly evaporated and acidified eluate. The resin is regenerated by the eluent and
ready to return to the process after elution (Moriyoshi et al. 1971). L-lysine is critical amino
acid and it has great importance in human diet as essential element and also added as
supplement for chicks and animal feeds in order to get maximum growth. Due to its great
importance and utility in nutrition has motivated the attention of researcher to explore the
metabolic pathways of lysine producing strain and their metabolic engineering in order to
productivity, and also find out others strains capability to produce bulk of Lysine. Some of
the strains which were used for biosynthesizing of lysine were found early in few years. A
total of 7.5 lacs tons of lysine, produced by efficient biotechnological techniques is due to the
known physiology of C. glutamicum, its optimization on large scale for the production of this
strain (Ohnishi and Ikeda, 2006).
LITERATURE REVIEW
26
2.8: Statement of problem
Keeping in view facts and problems in mind, the present project was designed with the
following objectives:
1. Utilization of different agriculture wastes for Lysine production.
2. Random mutagenesis; for strain improvement to get improved production of Lysine.
3. Optimization of fermentation medium utilized by wild and mutated strains for
maximum production of Lysine.
4. Pilot scale production of Lysine was studied with optimized conditions in an
automatic fermenter.
5. Biological evaluation of produced Lysine on Broiler chicks.

27
CHAPTER 3
MATERIALS AND METHODS
3.1: Study plan
Most of the present research work was performed at Institute of Biochemistry and
Biotechnology, University of Veterinary and Animal Sciences (UVAS) and Institute of
Industrial Biotechnology, Government College University (GCU), Lahore, Pakistan. Some
experimental work was performed in the Department of Microbiology (UVAS), Lahore,
Pakistan. Proximate analysis of fermented broth was analyzed at Food analysis laboratory in
Department of Food Science & Human Nutrition (UVAS), Lahore, Pakistan. Amino acid
analysis was performed at Sadiq feeds (Pvt) Limited, Rawalpindi, Pakistan. Toxin evaluation
was executed at Romers Labs, Rawalpindi, Pakistan. Biological evaluation of produced
lysine was performed at Hi- Tech feeds Mill, Raiwind Road Lahore, Pakistan.
3.1.1: Materials
Different industrial agricultural wastes like rice polishing and wheat bran were
procured from the local market of Lahore. Molasses was provided by Humza sugar mills and
distillery Shahkot, Jhumra road Faisalabad Pakistan.
3.1.2: Chemicals
Analytical grade chemicals were used during the research work. These were bought
from local distributors of different companies (American Sigma Chemicals Company,
German company Merck, Across Belgium, BDH of U.K and Fluka of Switzerland) with the
assistance of local agents.

MATERIALS AND METHODS
28
3.1.3: Bacterial strain and maintenance
Brevibacterium flavum (NRC- 207 F Rev. 2/78) was procured from the International
University Tokoyo, Japan. The organism was revived and maintained on nutrient agar plates
shown in table 3.1.
Table 3.1: Composition of Nutrient agar
Ingredients Composition (g/L)
Beef extract 5.0
Peptone 10.0
NaCl 5.0
Agar 15
pH= 7± 0.1
3.2: Substrate selection
For the production of lysine through microbial fermentation different agro- industrial
wastes were used as substrate B. flavum as fermenting agent (Adnan et al. 2011). These
substrate that were used to select the maximum lysine producers included wheat bran, rice
polishing and cane molasses.
3.2.1: Proximate Analysis
Before using different agricultural wastes as substrate, the proximate analysis was
performed by following AOAC method (1990) on as such basis. The description of the
method used was as under.

MATERIALS AND METHODS
29
3.2.1.1: Moisture
Firstly samples were weighed and kept for two hours in oven at 100oC. Then to dry
the sample completely its temperature was reduced to 70oC. The moisture contents were
determined by finding the difference in weights between the raw sample and its dried form.
The moisture percentage (%) was calculated as:
% of moisture = (wet sample weight- dried sample weight) × 100
Weight of sample
3.2.1.2: Ether extract
Moisture free samples were used to obtain ether extract by Soxhlets apparatus. Ether
was evaporated at 70oC by hot air oven and weight of extracted fat was recorded.
3.2.1.3: Crude fibre
It was determined by completely removing the acid and alkali soluble extractives and
weighing the un-hydrolysed, insoluble dried residue which was then incinerated to ash and
finally weighed. The differences in weights of the extracted and incinerated samples were
recorded as crude fibre.
% of crude fibre = weight of residue – ash weight × 100
Sample total weight
3.2.1.4: Crude protein
It was calculated by Kjeldhel method. It was calculated by multiplying the percentage
of total nitrogen with protein factor (6.25).

MATERIALS AND METHODS
30
3.2.1.5: Ash
The ash was obtained by igniting the weighed samples on burner and incinerated at
550oC in muffle furnace.
% of ash = Sample weight – ash weight × 100
Total sample weight
3.2.1.6: Nitrogen free extracts (NFE)
The value of NFE was calculated by subtracting the total concentrations of crude
fibre, ash, moisture, crude protein and crude fat from 100.
% of NFE = 100 – % of (moisture+ ash+ crude fat+ crude protein+ crude fibre)
3.3: Pre-treatment of Molasses
First hand molasses in equal volume was mixed with water and kept at 40o
C for 5
hours then centrifuged at 5000 rpm for 5 min. The pH was adjusted at 3.0 with 0.1 N H2SO4.
Thereafter it was allowed to stand at room temperature for overnight and then it was
centrifuged at 3000 rpm for 15 minutes. Supernatant was taken to make the required bricks
with the help of refractometer (Inamdar, 1994). The pre-treated molasses was used as a
substrate for fermentation studies (Shafaghat et al. 2010).
3.4: Media used for fermentation
Medium-1; Glucose 10 gL-1
, Peptone 10 gL-1
, Meat extract 5gL-1
, Yeast extract 2gL-
1, NaCl 2.5gL
-1 (Modified Baullin medium)
Medium-2; Clarified cane molasses 20 gL-1
, (NH4)2SO4 40 gL-1
, CaCO3 20 gL-1
,
NaCl 2gL-1
, MgSO4 0.4 gL-1
, KH2PO4 0.5 gL-1
, K2HPO41 gL-1
(Nelofer et al. 2008)
Medium-3; (NH4)2SO4 5 g/L, Urea 5 g/L, MgSO4.7H2O 0.25 g/L, KH2PO4 0.5 g/L,
K2HPO4 0.5 g/L, FeSO4.7H2O 0.01 g/L, MnSO4.H2O 0.01 g/L, Calcium chloride 0.01 g/L,

MATERIALS AND METHODS
31
Zinc Sulphate hepta hydrate 1 mg/L, copper sulphate 0.2 mg/L, Nickle chloride 0.02 mg/L,
Biotin 200 µg/L, Glucose 50 g/L (Broer et al. 1993)
Medium-4; Glucose 70 gL-1
, Peptone 1%, NaCl 3 g/L, potassium dihydrogen
phosphate 0.5 g/L, Yeast extract 0.5%, di-potassium hydrogen phosphate1.5 g/L, MnSO4 0.5
g/L, ammonium sulphate5 g/L, Biotin 25 µg/L (Slightly modified Anastassidis, 2007)
Medium-5; Glucose 80 g/L, K2HPO4 0.12% , potassium di-hydrogen phosphate
0.12%, MnSO4.2H2O 12 mg/L, ammonium sulphate 60 g/L, Biotin 2 mgL-1
, Magnesium
sulphate hepta hydrate 0.5 gL-1
, FeSO4 2 mgL-1
, manganese sulphate 12 mgL-1
, Calcium
pentothenate 2 mgL-1
, Corn steep liquor 40 g/L (Gulbler et al. 1994)
Medium-6; Glucose 5 g/L, Trypton 5 g/L, Yeast extract 3 g/L, NaCl 5 g/L (Modified
LB medium)
Medium-7; For one litre: Ammonium sulphate 20 g, Urea 3 g, MgSO4.7H2O 0.5
g,KH2PO4 1 g, MnSO4.H2O 4.2 mg, Biotin 100 µg, Glucose 30 g, Thiamine 100 µg, Soya
hydrolysate 20 g ( Oh et al. 1993)
Medium-8; Sucrose 50 g/L, CaCO3 30 g/L, ammonium sulphate30 g/L, Urea 2 g/L,
Magnsium sulphate hepta-hydrate 0.5 g/L, potassium di-hydrogen phosphate 0.05%,
dipotassium hydrogen phosphate 0.05%, FeSO4.7H2O 20 mgL-1
, MnSO4.4H2O 10 mgL-1
,
NaCl 1.0 g/L, zinc sulphate10 mg/L (Bathe et al. 2004)
Medium-9; Malt extract 0.3%, Peptone 3 g/L, yeast extract 2.5 g/L, Glucose 30 g/L,
di-potassium hydrogen phosphate 2.5 g/L, MgSO4.7H2O 0.2 g/L (Slightly modified, Rattray
and Fox, 1997)
Medium-10; Urea 6 g/L, Magnesium sulphate hepta-hydrate 0.4 g/L, potassium di-
hydrogen phosphate 1 g/L, FeSO4.7H2O 0.01 g/L, Biotin 1 µg/L, Glucose 60 g/L, Thiamine
HCl 80 µg/L (Calik et al. 2001)

MATERIALS AND METHODS
32
Medium-11; Glucose 30 g/L, Peptone 5 g/L, Yeast extract 2.5 g/L, ammonium
sulphate30 g/L, Biotin 2 mg/L, CaCl2 0.5 g/L, potassium di-hydrogen phosphate 0.5 g/L, di-
potassium hydrogen phosphate 0.5 g/L (Locally designed)
3.5: Random mutation for culture improvement
The culture of wild B. flavum was improved by using various physical and chemical
mutagens. The methodology of these treatments was given below;
3.5.1: Ultraviolet (UV) and gamma (γ) irradiation
From freshly prepared 18 hours inoculum, 1.00 mL transferred to a sterilized nutrient
agar petri plates and these cells were subjected to UV irradiation exposure with 05 minutes
time interval for 15- 60 minutes under the beam (λ= 253nm and 220V at 50c/s) of UV lamp
(Model: Mineral Light, UVS- 12, California, USA). For each cell suspension to get the 95 %
kill rate, a distance of 8.0 cm was adjusted between lamp and cell suspension (Azin and
Noroozi, 2001). Fresh streaked slant were exposed for different time interval by 80Gy γ-
irradiation at by Mark IV irradiator Co (60) at Pakistan atomic research reactor (PARR) in
order to get 99% death. Survivals were further subjected to mutant selection medium and
screened out for their potential to produce Lysine.
3.5.2: Ethidium bromide (EtBr) & Ethyl methyl sulphonate (EMS) treatment
The fresh inoculum of parent strain was grown that have a cell proportion in medium
with approximate population density of 3×10⁸ cells per mL. These cells were subjected to
induce mutation. The pellet of cells was obtained after centrifugation at 10,000 rpm for 5
minutes. Thereafter double washing was given to the pellet of cells with 0.1M citrate buffer
(pH 7.5) and re-suspended in the buffer (4.0 mL). To the cell suspension of (final

MATERIALS AND METHODS
33
concentration 100 mg/ mL) 0.2 mL (EtBr) of 2.0 mg/mL concentration was added whereas
ethyl methyl sulphonate (EMS) with concentration of 1000µL/mL and incubated in shaking
incubator working 200 rpm, at 30oC for 45 minutes (Dhawan et al. 2003; Sharaf et al. 2009).
After these mutagenic treatments the treated cells were separated by centrifugation (10,000
rpm) for 5 minutes. These treated cells were re- suspended with the same volume of
phosphate buffer and their dilutions were made and each dilution was then spread on nutrient
agar plates and incubated over night at 30oC. On the next day those colonies were calculated
which appeared on the plate after treatment of EtBr. Every colony was picked and plated with
sterile toothpick. Survivals were further subjected to mutant selection medium and screened
out for their potential to produce L- lysine.
3.5.3: Nitrous acid treatment
Parental cell pellet (18 hour freshly grown) was treated with HNO2 for 10 minutes
with one minute time interval at 4± 1oC (Sinha and Chakrabarty, 1977; Carlton and Brown,
1981; Azin and Noroozi, 2001). The solution was shaken thoroughly and one mL of the
reaction mixture was diluted 5 folds in phosphate citrate buffer (pH 7.5) to stop the reaction.
After centrifugation at 10,000 rpm for 5 minutes, cells were subjected to triple washing with
phosphate citrate buffer (pH 7.5) and were suspended again in the same buffer. Treated cells
appearing on the plates were counted next day. Each colony was picked with sterile toothpick
and plated. Survivals were further subjected to mutant selection medium and screened out for
their potential to produce L- lysine.
3.5.4: N- nitroso-N-ethylurea (ENU) treatment
Protective ceil of ENU was carefully opened and various concentrations 100mM,
150mM, 200mM, 250mM, 300mM and 350mM were prepared to make the death curve.

MATERIALS AND METHODS
34
3.5.4.1: Procedure of mutation by ENU
Seed culture of 18 hour was freshly prepared by using nutrient broth medium. Pellet
of 1mL parent cells was obtained after 5 min. of centrifugation (10,000 rpm). It was re-
suspended in 1mL sodium citrate buffer (pH 4.2) and re- centrifuged for 5 minutes at 10,000
rpm (Javed et al 2011). Then pellet obtained was incubated with 1mL optimum concentration
of ENU (250mM) for 5, 10, 15, 20, 25 and 30 minutes. During each interval, every
concentration of ENU was centrifuged for 5 minutes at 10,000 rpm and then pellet was
washed with sodium citrate buffer (pH 4.2) to remove excess of ENU. The pellet thus
obtained was re-suspended in NB medium for growth. The growth medium of 100µL was
spread on plates of nutrient agar medium with the help of spreader. The plates were incubated
for 24 hours at 30oC. Those plates which have 99% kill were further subjected to mutant
selection medium and also screened out for more lysine production.
3.5.5: Mutant selection
For the mutant selection, plates were prepared having minimal medium (MM) for the
selection of mutant. The composition of MM is given in (table 3.2). The colonies were
aseptically transferred to the MM plates with and without homoserine, threonine and S-(2-
amino ethyl cysteine (AEC) through replica plating method (Rehman et al. 2012). The
colonies appeared on MM supplemented with 0.1 mM homoserine, 0.1 mM threonine and 10
mM (AEC) and not on without these components were considered as homoserine and
threonine auxotroph and resistant to AEC (AEC)r.

MATERIALS AND METHODS
35
Table 3.2: Composition of MM for mutant selection
Ingredients Composition (g/100 mL)
Glucose 0.8
MgSO4. 7H2O 0.01
(NH4)2SO4 0.2
NaCl 0.5
K2HPO4 0.3
Biotin 5µL
Agar 1.5
(1 mM) Homoserine 400 µL/ 20mL
(1 mM) threonine 500 µL/ 20mL
(10 mM) AEC 200 µL/ 20mL
3.6: Fermentation
3.6.1: Inoculum preparation
For the preparation of inoculum, loop full of the refreshed culture of B. flavum was
aseptically transferred to sterilized inoculum medium (25 ml) in 250 ml Erlenmeyer flask.
The inoculum medium contained 0.8 % nutrient broth (pH= 7.0± 0.2) was kept for 18 hours
on an orbital shaker at 30oC and 120 rpm (Nasab et al. 2007). The optical density of the
culture was adjusted to 0.6 at 600 nm by diluting the culture with sterilized distilled water
(Athar et al. 2009).

MATERIALS AND METHODS
36
3.6.2: Basal medium
During fermentation, for optimization of the parameters, like substrate water ratio
with incubation time period, temperature, pH, inoculum size, concentrations of salts,
concentration of calcium carbonate and biotin, the basal medium was prepared by adding
MgSO4.7H2O 4 g, KH2PO4.H2O 8 g, NaCl 1 g, (NH4)2SO4 2.5 g, CaCO3 20- 40 g, urea 5 g,
biotin 4 mg, vitamin B complex 3 ml/L. The initial pH was adjusted at 7± 0.1 with 1N NaOH
and medium having different concentrations (1-5%) of substrate (wheat bran, molasses and
rice polishing) was autoclaved for 15 min. The growth medium was inoculated by fresh
inoculum of 18 hours old of B. flavum. The fermentation was carried out for specific
optimum conditions on orbital shaker at 180 rpm at 30oC.
3.6.3: Shake flask
Twenty millilitre of fermentation medium was taken in 250 ml Erlenmeyer flask. It
was plugged properly with cotton plug and autoclaved at 121˚C for 15 minutes. Autoclaved
medium was inoculated with seed inoculum and incubated under different conditions to be
optimized.
3.6.4: Scale up studies (Stirred fermenter)
Pilot scale study was carried out in a 7.5 L stirred glass vessel fermenter (Model:
Bioflow-110 Fermentor/Bioreactor, USA) with two impellers having six blades and 5.0 L
working volume. The fermenter glass vessel containing approximately 4.7 L fermentation
medium was sterilized for 25 minutes at 15 lb/in2 pressure (121ºC) in a stainless steel
autoclave (Model: KT-40 L, ALP, Japan) and after that at room temperature it was cooled.
Under aseptic conditions through a hole at the top plate inoculum was moved to the vessel.
The incubation temperature was automatically retained at 301C throughout the
fermentation period whereas the aeration and agitation rates were maintained. The sterilized

MATERIALS AND METHODS
37
air was supplied by passing through membrane filters of 0.45 µm pore size. To control
foaming the sterilized 10% (v/v) silicone oil (prepared in distilled water) was used that was
formed during the fermentation process.
3.7: Parameter to be optimized
Following parameters were optimized for Lysine production by using wild and mutant
B. flavum.
1. Substrate water ratio (1 to 5%) with incubation period 24, 48, 72 hrs.
2. Temperature (25oC, 30
oC, 35
oC and 40
oC)
3. Initial pH (6.6, 6.8, 7.0, 7.2 and 7.4)
4. Inoculum size (1 to 5 %)
5. Nitrogen source (urea, (NH4)2SO4 and NH4NO3)
6. Concentration of salts (MgSO4. 7H2O, KH2PO4 and NaCl from 0.1- 0.5%)
7. Concentration of CaCO3 (1 to 5%)
8. Addition of corn steep liquor (0.2, 0.4, 0.6, 0.8 and 1%)
9. Inclusion of soybean hydrolysate (0.25- 1%)
All the parameters of fermentation were optimized on micro- scale in 250 mL Erlenmeyer
flasks having 25 mL of total fermentation medium.
3.7.1: Substrate water ratio with incubation period
Various agricultural wastes such as wheat bran, rice polishing and molasses were used
to optimize different levels of substrate water ratio with 1, 2, 3, 4 and 5 percent. The different
substrates were used to find the best carbon source that will produce the highest yield of L-
Lysine. The fermentation medium contained all the basal nutrients as mentioned in basal
medium. It was monitored after 24, 48 and 72 hours for lysine production.

MATERIALS AND METHODS
38
3.7.2: Temperature
To find the metabolically favoured temperature of B. flavum to secrete more Lysine,
different degrees of temperature like 25oC, 30
oC, 35
oC and 40
oC were optimized. At the
termination of fermentation period, the produced lysine was estimated to find the optimum
temperature that produced maximum lysine.
3.7.3: Effect of pH
Among different physical parameters that drastically effect fermented product, pH is
very important. Therefore, various ranges 6.6, 6.8, 7.0, 7.2 and 7.4 of pH were used to
optimize favourable pH for hyper production of Lysine.
3.7.4: Inoculum size
The size of seed culture medium (inoculum) is a deciding parameter that utilize
fermentation medium and confirm its conversion into required product completely. Different
percentages of inoculum (1, 2, 3, 4 and 5%) were used to optimize the size of inoculum to get
high titre of Lysine.
3.7.5: Nitrogen source
Various organic and inorganic nitrogen sources like urea, (NH4)2SO4 and NH4NO3
were used for high Lysine production. Different ranges as 0.25%, 0.5%, 0.75%, 1% and
1.25% of above sources were tested with pre- optimized substrate and other physical
parameters to find best optimized concentration.

MATERIALS AND METHODS
39
3.7.6: Concentration of salts
The concentration of macro and micro nutrients has great importance in basal medium for
fermentation. Various concentrations of ionic salts like 0.1, 0.2, 0.3, 0.4 and 0.5 % like
MgSO4.7H2O, NaCl and KH2PO4 were used for optimization.
3.7.7: Concentration of CaCO3
The concentrations (1, 2, 3, 4 and 5 %) of CaCO3 were optimized to get high yield of
Lysine with pre- optimized conditions. It was dry sterilized with respect of other medium and
added later with sterilized conditions in sterilized fermentation medium at the time of
inoculation.
3.7.8: Addition of corn steep liquor
The fermentation of pre-optimized parameters of basal medium was further carried
out by addition of corn steep liquor (CSL) as complex nitrogen source. CSL with numerous
concentrations such as 0.2, 0.4, 0.6, 0.8 and 1.0 % v/v was used to get optimized
concentration for maximum production of lysine.
3.7.9: Inclusion of soybean hydrolysate
Soybean hydrolysate as a complex medium was used to enhance the Lysine
production. Various increasing concentration 0.25%- 1% was used to have an optimized
concentration of soybean hydrolysate for enhance Lysine production.
3.8: Analytical Methods
3.8.1: Lysine estimation
The fermented broth was autoclaved and cell mass was separated by centrifugation
(10,000 rpm) for 10 minutes. Then qualitative and quantitative estimation of produced lysine

MATERIALS AND METHODS
40
from the supernatant was done (Ekwealor and Obeta, 2005) by following these methods
given below;
3.8.1.1: Qualitative method
TLC technique was used to find lysine qualitatively. The developing solvent
comprised of chloroform (CHCl3), methanol (CH3OH) and 17% ammonia (NH3) with 2: 2:1
ratio. A spot of (5µl) sample and standard was spotted on pre-coated TLC plate. It was kept
in the chromatographic tank for 4-6 hours at 4oC for good separation of amino acids. To
identify the produced lysine on dried plate was sprayed with 0.2% ninhydrin in acetone and
coloured spots were developed by heating the plate for 5 minutes at 110oC in oven (Stock and
Rice, 1967).
3.8.1.2: Quantitative method
The lysine produced in the fermented broth was quantitatively measured by
spectrophotometric method following Chaves et al. 1988, which is described as under.
To 1 mL of biomass liquor, 4 mL of acetone was added. Then 1 mL of 5% sodium
nitroprusside and 5 mL 5% sodium tetra-borate was added in 100 mL conical flask. Flask was
kept on shaker for 60 minutes at 150 rpm and 30oC. Finally the volume of flask was raised to
20 mL with distilled water. Same procedure was applied for other samples, standard and
blank having 1 mL of distilled water rather than sample. The absorbance at 545 nm of each
sample and standard was estimated by spectrophotometer.
3.8.1.2.1: Standard curve of Lysine
To estimate lysine quantitatively by spectrophometer method followed Chaves et al.
1988, the standard curve was firstly plotted between various diluted concentrations (0.075-
0.2%) of standard lysine and their respective (optical density) OD at 545 nm. The trend in

MATERIALS AND METHODS
41
(fig. 3.1) represented the increasing OD with increasing standard lysine concentrations. The
maximum OD (1.932) at 540nm was corresponded to high standard lysine concentration
(0.2%).
Figure 3.1: Standard curve of Lysine
3.8.2: Estimation of residual sugar
The residual sugar was estimated by DNS method (Tasun et al. 1970). Supernatant of
fermented broth was used for the estimation of residual sugar.
3.8.2.1: Standard curve of glucose
To draw the standard curve, a stock solution of 0.1 gm of D- glucose was prepared in
a volumetric flask (100 mL) in 80 mL of distilled water and then volume was raised to 100
mL so that each mL of solution contained 1mg of D- glucose. Ten dilutions (0.1- 1 mg) were
prepared in distilled water. To perform DNS test, each dilutions (1 mL) were taken in ten
clean, dried test tubes and 2 mL of DNS reagent was added in each test tube. All the test
tubes were placed in boiling water bath for 5 minutes and mixture was cooled. Final volume
0
0.2
0.4
0.6
0.8
1
1.2
1.4
1.6
1.8
2
0.075 0.1 0.125 0.15 0.175 0.2
OD
(5
45
nm
)
conc. of Lysine (%)

MATERIALS AND METHODS
42
0
0.02
0.04
0.06
0.08
0.1
0.12
0.14
0.16
0.18
0.1 0.2 0.3 0.4 0.5 0.6 0.7 0.8 0.9 1
OD
at
54
0 n
m
glucose (mg/100 mL)
of mixture was raised to 20 mL with distilled water. One test tube of blank was also run
parallel to above samples having 1 mL of distilled water and 2 mL of DNS reagent. The
developed colour was measured by spectrophotometer at 540 nm. Graph was plotted between
glucose concentration along x- axis and absorbance along y- axis as shown in fig. 3.2. Slop of
the graph was used for the determination of residual sugar.
Figure 3.2: standard curve of glucose
3.8.3: Estimation of Biomass
Fermented broth was subjected to centrifugation (10,000 rpm) for 5 minutes in 50 mL
falcon tube. Then the pellet was separated through filtration and was dried at 90oC overnight
in a hot air oven. Then dried pellet was weighed on an electrical balance.
3.8.4: Estimation of protein from fermented broth
Protein was determined by the estimation of nitrogen by Micro- kjeldahl method after
digesting the sample with concentrated H2SO4 and SeO2 mixture.
The dried sample of about 200 mg was weighed in digestion bulb and then added in it 10 mL
concentrated H2SO4 and few tablets of SeO2 as a catalyst. It was heated on direct flame and

MATERIALS AND METHODS
43
when the sample was cleared it was considered to be digested. Thereafter at room
temperature sample was allowed to cool. After that, the digested sample was diluted with
distilled water and total 100 mL volume was maintained. Digested solution 10 mL was
poured into the Markham apparatus of distillation and then pH was raised to become basic 10
mL of 40% NaOH solution was added. Steam distillation was carried out, and ammonia was
collected in beaker containing 5 mL of 2% boric acid and methyl red solution (used as
indicator). The distillate was titrated against N/70 hydrochloric acid to pink colour end point.
The volume of acid consumed during neutralization was noted (Markham, 1942). Percentage
of protein in the dried biomass was determined by the following formula;
Percentage of protein= x × 100 × 0.0002 × 100 ×6.25
10× 0.2
Where x is the volume of N/70 HCl used against the ammonia released.
3.9: Down-streaming (recovery and purification) of L-lysine
The biomass liquor was subjected to various techniques for down streaming of lysine
from fermented broth through cell lysis, cell separation, purification, evaporation and
crystallization (Anastassiadis, 2007).
3.9.1: Cell lysis
The biomass liquor was autoclaved for 20 minutes to cease the growth of culture
cells. Cell lysis was executed by adding 400 mL of acetone to the 200 mL fermentation broth
containing cell mass. Cell wall of fermented organism was ruptured as it come in contact with
acetone and released intracellular lysine. Moreover acetone also precipitated out the soluble
protein from the fermented broth.

MATERIALS AND METHODS
44
3.9.2: Cell separation
The cell debris was separated from the liquor by centrifugation (10,000 rpm) for 5
minutes. The supernatant was collected and concentrated at 80oC in water bath up to 500 mL
of the total volume 2.5 L (Tanaka et al. 1978). The concentrated fermented broth was
adjusted to pH 3 with 8N H2SO4 so all the Lysine present must acquire charge for binding
with cation exchanger (Rouy and Yerres, 1992).
3.9.3: Ion exchange chromatography
3.9.3.1: Packing of column
Glass column was clamped on an iron stand in exactly vertical position. The bottom
of the washed, dried glass column was sealed with glass wool up to 2- 3 cm. About 50 gm of
cation- exchange resin was taken in a 250 mL beaker. The resin was first soaked in 4 N HCl
(100 mL) to remove contaminating metal ions while shaking at 120 rpm on an orbital shaker
at room temperature for 20 minutes. The HCl was drained out and then soaked for 20 minutes
in 2N NaOH (100 mL) to charge the resin in the form of Na+. The NaOH was drained out.
The resin was washed with sodium citrate buffer pH 3 and the column was packed with resin
slowly while swirling. When all of the resin beads were settled, buffer was poured in to
column until the over- head volume remained 2- 3 mL of buffer on the packed column
(Rodney FB, 1993). Now column was ready for sample loading.
3.9.3.2: Loading of sample and collection of fractions
The concentrated centrifuged fermented broth (5 mL) having pH 3, was loaded on the
packed column of cation exchange resin for the separation of Lysine. Sample was fractionally
eluted in labelled test tubes up to 2 mL each, first with citrate buffer of pH 3 for the elution of
acidic amino acid there after it was eluted with citrate buffer pH 6 to elute neutral amino

MATERIALS AND METHODS
45
acids and finally it was eluted with tris HCl (pH 9- 10) to elute Lysine as its iso- electrical
point 9- 10 pH. To test fractions for the presence of Lysine, 1 drop from each fraction were
placed on to a strip of chromatography paper. Spots were dried on hot plate and it was
sprayed in the fume hood with 0.2% ninhydrin in acetone. Violet spots appeared after 2
minutes in preheated oven at 110oC indicating the presence of Lysine in that fraction. The
fractions were collected until there was no violet colour spot appeared on chromatographic
paper with ninhydrin. It was further confirmed by spectrophotometric method.
3.9.4: Crystallization
The fractions containing lysine obtained by eluting with tris HCl buffer (pH 9) were
concentrated to 1/4th
of volume on water bath at 70- 80oC. Then crystallization of L-lysine
was carried out firstly by acidification of fraction with 8N HCl and adjusted its pH 4. Three
volumes of 95% ethanol were added to concentrated fractions to get the crude crystals of
lysine of brown colour at 4oC, those were re-dissolved in distilled water and decolourized
with 0.5% activated charcoal. Concentrated and needle like yellowish colour pure crystals of
Lysine were obtained after addition of 95% ethanol (Su et al. 1990).
3.9.5: Drying
Yellowish colour crystals of L-lysine HCl were dried for 3 hours in water bath at
80oC.
3.9.6: TLC of purified Lysine crystals
The purity of lysine crystals was tested. Its 100 mg / 100 mL solution of purified
lysine was prepared and spotted 5 µL of it on TLC plate (10 x 20 cm coated with silica gel)
along with standard lysine HCl solution (100 mg / 100 mL). The impregnated plate was
placed in chromatographic tank containing 100 mL of solvent mixture containing chloroform,

MATERIALS AND METHODS
46
Methanol and 17% NH3 solution in the ratio of (2: 2: 1) for development at 4oC temperature
(Stock and Rice, 1967).when the solvent raised 10 cm from the spotted line. The TLC plate
was taken out of the chromatographic tank. It was dried in the oven at 80oC thereafter it was
sprayed with 0.2% ninhydrin in acetone. The plate was again placed in the preheated oven at
110oC for 5 minutes to develop colour.
3.10: Proximate analysis of fermented broth
Fermented broth was analyzed at Food analysis laboratory in Department of Food
Science & Human Nutrition for proximate composition analysis. This analysis was performed
to determine the (%) composition of the material in terms of moisture, ash, crude fiber, ether
extract, nitrogen free extract and crude protein.
3.11: Amino acid analysis of fermented broth and purified Lysine crystals
Amino acid analysis of fermented broth and purified Lysine crystals was performed
by amino acid analyser (Biochrom Cambridge UK. Bio30+) at Sadiq feeds Pvt Limited,
Rawalpindi, Pakistan.
3.12: Toxicity evaluation of produced lysine
Toxicity evaluation of produced lysine was performed at Romers Labs, Rawalpindi,
Pakistan.
3.13: Biological evaluation of produced Lysine
Biological evaluation of produced lysine was performed at Hi-Tech feed industry,
Raiwind Road, Lahore. The produced lysine was evaluated by feeding trials in Broiler chicks
in terms of feed consumption (kg), weight gain (kg) and feed conversion ratio (FCR). For this
purpose, 80 day old broiler chicks were selected on uniform weight basis. Chicks were
divided into two groups, test (T) and control (C). That were further randomly sub divided into
four units in a way that there were 20 birds in each unit. Two diets C and T were prepared
and composition is given in appendix XII. Diet C served as control diet containing 0.4 %

MATERIALS AND METHODS
47
commercial lysine sulphate. Diet T was containing the same ingredients as that of C diet, but
also supplemented with 0.4 % lysine in the form of microbial biomass produced. These
rations were randomly assigned to the four units such that there were two replicates on each
ration. All the birds were weighed before the start of feeding trial and after that on weekly
basis. The birds were offered feed and water ad libitum for a period of five weeks. During
feeding trial all prophylactic measures were adopted and proper vaccinations were made to
keep birds healthy. The data thus obtained have been expressed in terms of feed intake,
weight gain and feed conversion ratio to evaluate the quality of Lysine produced from
fermentation of molasses under predetermined conditions with B. flavum.
3.14: Kinetics studies
All kinetic parameters were determined as described earlier (Aiba et al. 1973). The
differential equations which captured the dynamics of cell mass formation (X), mixed
carbohydrates consumption (S), and lysine synthesis are given as follows:
dX/dt = µX, (1)
dLys/dt = QLys × X, (2)
-dS/dt=-µX/Yx/s - QLys X/YLys/s, (3)
dP/dS=YLys/S, (4)
dP/dX=YLys/X, (5)
Where QLys, µ, qP, YX/S, YLys/S and YLys/X are the volumetric rate of lysine formation,
specific growth rate, specific rate of lysine production, substrate consumption yield
coefficient with respect to growth, lysine synthesis based on substrate uptake and cell mass
formation respectively.

MATERIALS AND METHODS
48
3.15: Statistical analysis
Processing of data was carried out through a statistical method by SPSS 13.0 soft-
ware (Levesque, 2007). All the optimization parameters were analysed by compare of mean
through One-Way ANOVA and multiple comparisons were made through LSD and
Descriptive analysis given in appendices (VI- XI). Biological evaluation result was
statistically studied by applying an independent sample t. test.

49
CHAPTER 4
RESULTS
4.1: Bacterial strain and maintenance
Brevibacterium flavum (NRC- 207 F Rev. 2/78) as a fermenting agent used for L-
Lysine production through fermentation by utilizing agricultural wastes as substrate. The
organism was revived in sterilized nutrient broth and after 18 hours of incubation at 30oC
turbidity obtained in clear medium. The purity of organism without contamination was
observed by making slide of that turbid medium. Further turbid medium was streaked on
sterilized nutrient agar plates at pH (7.0± 0.2) and pure single colony growth was observed
after 24 hours of incubation at 30oC as shown in fig. 4.1.
Figure 4.1: B. flavum on nutrient agar plates at 30 oC and pH 7.0± 0.2
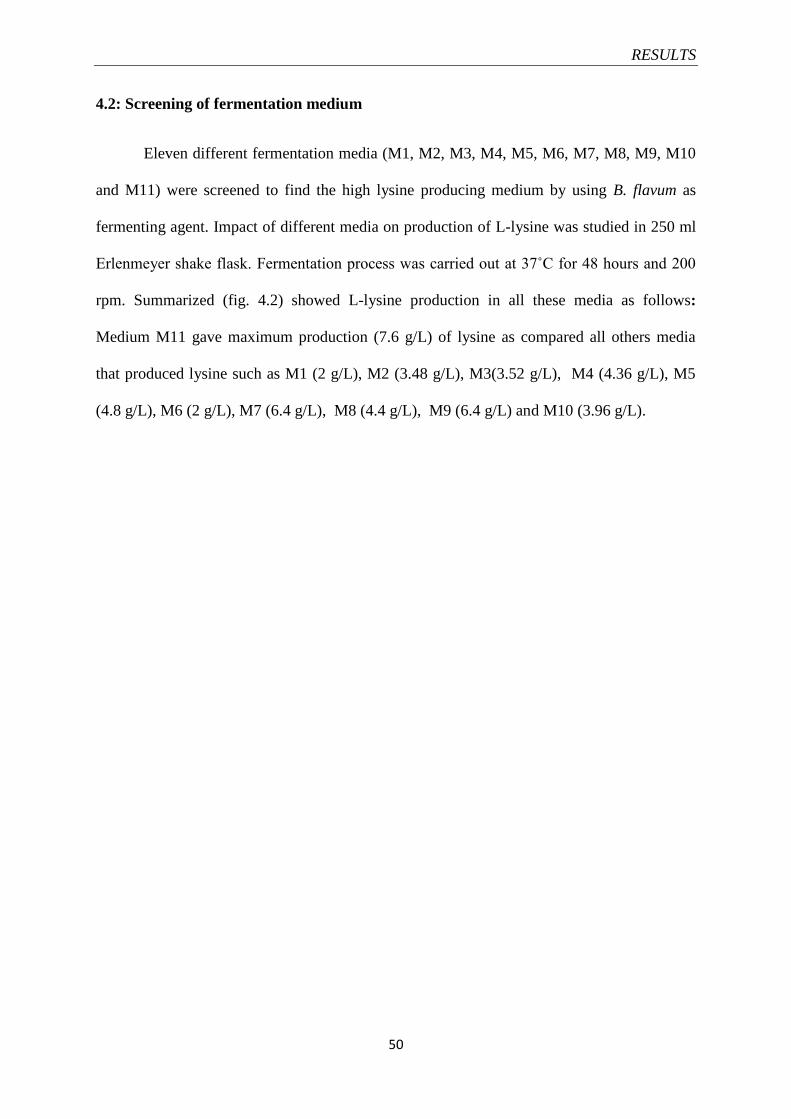
RESULTS
50
4.2: Screening of fermentation medium
Eleven different fermentation media (M1, M2, M3, M4, M5, M6, M7, M8, M9, M10
and M11) were screened to find the high lysine producing medium by using B. flavum as
fermenting agent. Impact of different media on production of L-lysine was studied in 250 ml
Erlenmeyer shake flask. Fermentation process was carried out at 37˚C for 48 hours and 200
rpm. Summarized (fig. 4.2) showed L-lysine production in all these media as follows:
Medium M11 gave maximum production (7.6 g/L) of lysine as compared all others media
that produced lysine such as M1 (2 g/L), M2 (3.48 g/L), M3(3.52 g/L), M4 (4.36 g/L), M5
(4.8 g/L), M6 (2 g/L), M7 (6.4 g/L), M8 (4.4 g/L), M9 (6.4 g/L) and M10 (3.96 g/L).

RESULTS
51
Figure 4.2: Screening of fermentation medium on the basis of L-lysine production by
wild B. flavum in 250ml Erlenmeyer shake flask (Media = M1, M2, M3, M4, M5, M6, M7, M8, M9, M10 and M11; Temperature = 37˚C; pH= 7.5; Agitation =
200 rpm, and Time of fermentation 48hrs)
0
1
2
3
4
5
6
7
8
9
1 2 3 4 5 6 7 8 9 10 11
Lysi
ne
(g/
L)
Media

RESULTS
52
4.3: Optimization of fermentation medium by using wild B. flavum
4.3.1: Effect of different substrates with incubation
Different agricultural wastes i.e.; wheat bran, rice polishing and molasses were
subjected for the selection of best carbon source as a substrate. Various concentrations (1 to
5%) of these substrates were investigated and it was found that from the various levels of
wheat bran, 4% gave the highest production of Lysine (6.6 g/L) after 72 hours of incubation.
Whereas rice polishing with different levels (1 to 5%) high titre of lysine (4.3 g/L) was
obtained with 3% of its concentration after 72 hours of incubation. After optimizing the
various concentrations of molasses, it was found that 4% molasses produced the highest
concentration of lysine (9.1 g/L) as shown in fig. 4.3.
Figure 4.3: Influence of different substrates (%) on Lysine production.
Error bars show the different percentages of Lysine produced with different (%) substrates
0
2
4
6
8
10
12
1 2 3 4 5
Lysi
ne
g/L
Substrate(w/v%)
wheat bran
rice polishing
molasses

RESULTS
53
0
2
4
6
8
10
12
25 30 35 40
Lys
ine
g/L
Temperature oC
4.3.2: Effect of temperature
Various degrees of temperature (25, 30, 35 & 40 oC) were used to optimize the
maximum lysine producing temperature from wild B. flavum with 4% molasses and 2%
inoculum. The maximum lysine (10.1 g/L) was produced at 30 oC as shown in (fig. 4.4). By
increasing temperature, the decrease of lysine titre was found.
Figure 4.4: Effect of various degrees of temperature on
Lysine production Error bars show the different percentages of Lysine produced at various
temperature

RESULTS
54
0
2
4
6
8
10
12
1 2 3 4 5
Lysi
ne
g/L
Inoculum size (v/v%)
4.3.3: Effect of inoculum size
Different sizes (1, 2, 3, 4 & 5%) of inoculum were used to find the optimum level for
maximum lysine production by using wild B. flavum with pre-optimized conditions. Fresh
inoculum size (3%) of 18 hours produced the maximum lysine (10.4 g/L) after that by
increasing the size of inoculum, the titre of lysine start decreasing as shown in (figure 4.5).
Figure 4.5: influence of inoculum size on Lysine production Error bars show the different percentages of Lysine produced at different inoculum
size

RESULTS
55
0
2
4
6
8
10
12
14
16
18
6.6 6.8 7 7.2 7.4
Lysi
ne
g/L
initial pH
4.3.4: Effect of initial pH
The effect of various levels of initial pH (6.6, 6.8, 7.0, 7.2 & 7.4) were investigated by
using 4% molasses and 3% inoculum at 30oC with wild B. flavum as fermenting agent. The
high production of lysine (16.06 g/L) was observed at pH 7.0. Further decrease of lysine was
found with increasing pH as shown in (fig. 4.6).
Figure 4.6: Effect of pH on Lysine production Error bars showed the different percentages of Lysine produced with increasing initial pH
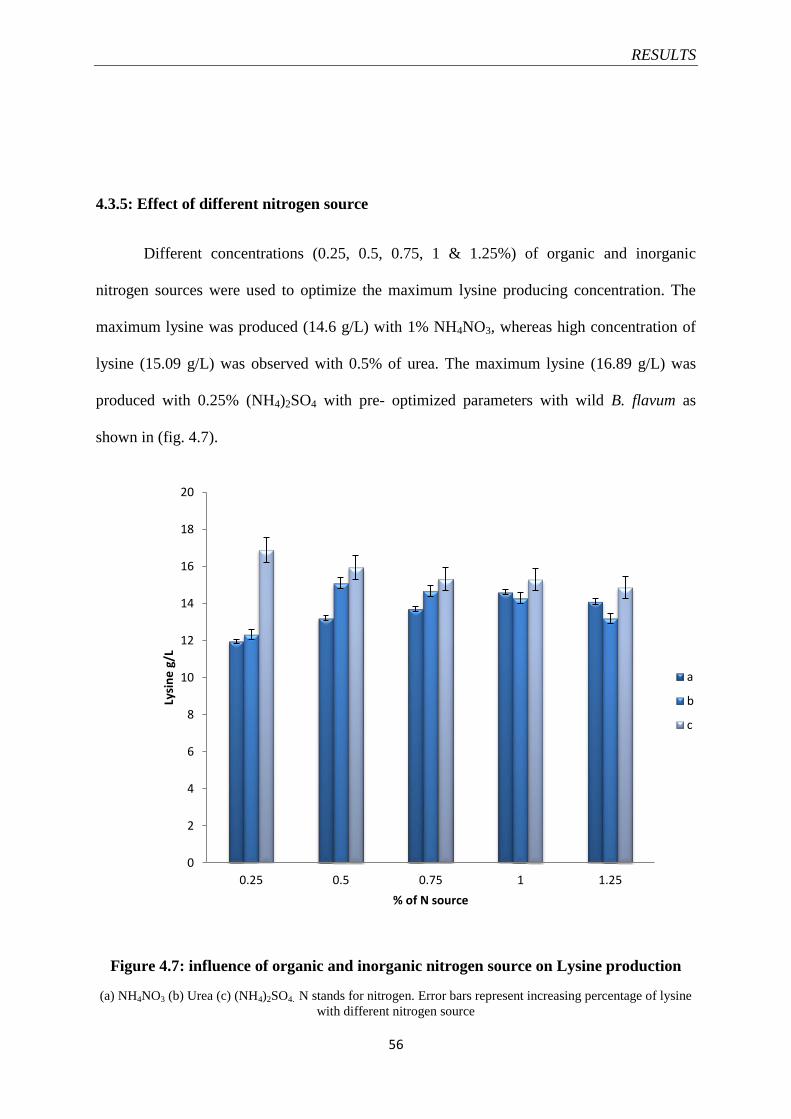
RESULTS
56
4.3.5: Effect of different nitrogen source
Different concentrations (0.25, 0.5, 0.75, 1 & 1.25%) of organic and inorganic
nitrogen sources were used to optimize the maximum lysine producing concentration. The
maximum lysine was produced (14.6 g/L) with 1% NH4NO3, whereas high concentration of
lysine (15.09 g/L) was observed with 0.5% of urea. The maximum lysine (16.89 g/L) was
produced with 0.25% (NH4)2SO4 with pre- optimized parameters with wild B. flavum as
shown in (fig. 4.7).
Figure 4.7: influence of organic and inorganic nitrogen source on Lysine production
(a) NH4NO3 (b) Urea (c) (NH4)2SO4. N stands for nitrogen. Error bars represent increasing percentage of lysine
with different nitrogen source
0
2
4
6
8
10
12
14
16
18
20
0.25 0.5 0.75 1 1.25
Lysi
ne
g/L
% of N source
a
b
c

RESULTS
57
4.3.6: Effect of different salt concentrations
Various concentrations (0.1, 0.2, 0.3, 0.4 & 0.5) of salts like MgSO4. 7H2O, NaCl and
KH2PO4. H2O were used to find the maximum lysine producing concentration by using wild
B. flavum with pre- optimized parameters as shown in (fig. 4.8). MgSO4. 7H2O with 0.4%
level produced the maximum lysine (17.4 g/L). The optimum concentration of NaCl (0.1%)
was found the optimum level to produce the high lysine titre (17.8 g/L). From various levels
of KH2PO4. H2O 0.2% was found to be optimum for the maximum lysine (18.08 g/L)
production.
Figure 4.8: Effect of different concentrations of salts on Lysine production
(a)MgSO4.7H2O (b) NaCl (c) KH2PO4.H2O. Error bars represent increasing percentage of Lysine during
optimization of different ionic salts concentrations
0
2
4
6
8
10
12
14
16
18
20
0.1 0.2 0.3 0.4 0.5
Lysi
ne
g/L
% of different salts
a
b
c

RESULTS
58
4.3.7: Effect of corn steep liquor
Corn steep liquor (CSL) with different concentrations (0.2, 0.4, 0.6, 0.8 & 1%) were
used to get the maximum lysine producing level by using wild B. flavum with pre- optimized
conditions. The maximum lysine (19.4 g/L) was observed by using 0.6% CSL. With the
increase of CSL concentrations lysine titre was decreased as shown in fig. 4.9.
Figure 4.9: Optimization of different percentages of CSL for Lysine hyper-production
18.6
18.7
18.8
18.9
19
19.1
19.2
19.3
19.4
19.5
0.2 0.4 0.6 0.8 1
Lysi
ne
g/L
% of CSL (v/v)

RESULTS
59
4.3.8: Effect of biotin concentration
Various concentrations (0.1, 0.2, 0.3, 0.4 & 0.5 mg/ 100mL) of biotin were used to get
the maximum lysine producing level with pre- optimized conditions by wild B. flavum. The
high concentration of lysine (19.5 g/L) was obtained by 0.4% of biotin and with high
increasing concentration of biotin the titre of lysine was decreased as shown in fig. 4.10.
0
5
10
15
20
25
0.1 0.2 0.3 0.4 0.5
Lysi
ne
(g/
L)
Biotin (mg/100mL)
Figure 4.10: Optimization of concentration of Biotin in (mg) per 100 mL for
hyper production of Lysine
Error bars represent the increasing percentage of Lysine with different concentration of Biotin

RESULTS
60
4.4: Strain improvement through Random Mutagenesis
B. flavum (wild culture) was exposed to various physical and chemical mutagens with
different time interval and achieved more than 90% kill (fig. 4.11 to 4.16). The survivors at
more than 90% kill were streaked on the minimal medium supplemented with L- homoserine,
threonine and S-(2-aminoethyl)-L-cysteine. Fifteen AEC resistant mutants and homoserine
auxotrophs were developed after different treatments. These mutants were named as per
mutagen exposure. These mutants were further maintained on LB medium and screened for
L-lysine production with pre-optimized condition with wild types culture. BFENU2
mutant
gave high yield (21.64±0.11 g/L) as compared to other fifteen mutants (Table 4.1). This strain
was further optimized and compare with wild types in all kinetic parameters.

RESULTS
61
Figure 4.11: Survival/ kill curve of B. flavum after UV irradiation
0
1
2
3
0
10
20
30
40
50
60
70
80
90
100
0 10 15 20 30 35 40
Mu
tan
t fr
eq
ue
ncy
% a
ge o
f su
rviv
ors
Exposure time (minutes)
Survivors

RESULTS
62
Figure 4.12: Survival/ kill curve of B. flavum after nitrous acid treatment
0
0.2
0.4
0.6
0.8
1
1.2
0
10
20
30
40
50
60
70
80
90
100
0 1 2 3 4 5 6 7 8 9 10
Mu
tan
t fr
equ
ency
% a
ge
of
surv
ivo
rs
Nitrous acid treatment time (minutes)
Survivors
Mutant frequency

RESULTS
63
Figure 4.13: Survival/ kill curve of B. flavum after Ethidium bromide treatment
0
0.2
0.4
0.6
0.8
1
1.2
0
10
20
30
40
50
60
70
80
90
100
0 5 10 15 20 25 30 35 40 45M
uta
nt fr
equ
ency
% a
ge
of
surv
ivo
rs
Ethidium bromide treatment time (minutes)
Survivors
Mutant frequency

RESULTS
64
Figure 4.14: Survival/ kill curve of B. flavum after EMS treatment
0
0.2
0.4
0.6
0.8
1
1.2
0
10
20
30
40
50
60
70
80
90
100
0 5 10 15 20 25 30 35 40 45
Mu
tan
t fr
equ
ency
% a
ge
of
surv
ivo
rs
EMS treatment time (minutes)
Survivors
Mutant frequency

RESULTS
65
Figure 4.15: Survival/ kill curve of B. flavum after exposure to gamma irradiations
0
0.2
0.4
0.6
0.8
1
1.2
0
10
20
30
40
50
60
70
80
90
100
0 2 5 7 10 12 15 20 25 30
Mu
tan
t fr
equ
ency
% a
ge
of
surv
ivo
rs
Time (minutes) of exposure to 80Gy γ-irradiation
Survivors
Mutant frequency

RESULTS
66
Figure 4.16: Survival/ kill curve of B. flavum after (ENU) treatment
0
1
2
3
0
10
20
30
40
50
60
70
80
90
100
0 10 15 20 30 35 40
Muta
nt
freq
uen
cy
% a
ge
of
surv
ivo
rs
Exposure time (minutes)
Survivors
Mutant frequency

RESULTS
67
Table 4.1: Screening of mutants for L-lysine production
Sr. # Homoserine
auxotroph
and AEC
resistant
mutant
Mutagen Lysine Yield
(g/L)
Residual glucose
(g/L)
Biomass
(g/L)
1 BFUV1
UV 20.99±0.09 2.44 0.1 18.8 0.2
2 BFUV2
UV
20.66±0.13 2.55 0.019 16.11 0.2
3 BFUV3
UV
19.17±0.11 2.38 0.015 20.3 0.15
4 BFUV4
UV
19.19±0.04 2.87 0.02 17.620.09
5 BFUV5
UV
19.79±0.11 2.64 0.019 16.01 0.2
6 BFHN1
Nitrous Acid 19.59±0.08 2.48 0.01 18.0 0.12
7 BFHN2
Nitrous Acid 19.29±0.12 2.57 0.019 15.11 0.2
8 BFEB1
Ethidium Bromide 18.07±0.03 2.66 0.1 17.8 0.22
9 BFEB2
Ethidium Bromide 19.19±0.08 2.46 0.11 18.6 0.12
10 BFEB3
Ethidium Bromide 20.69±0.09 2.55 0.019 16.11 0.2
11 BFEMS1
EMS 19.99±0.06 2.49 0.018 16.41 0.12
12 BFEMS2
EMS 19.77±0.11 2.54 0.017 15.01 0.12
13 BFEMS3
EMS 20.23±0.05 2.88 0.02 17.660.07
14 BFG1
Gamma Irradiation 20.11±0.09 2.77 0.02 16.680.09
15 BFENU1
ENU 21.34±0.04 3.23± 0.03 18.29±0.15
16 BFENU2
ENU 21.64±0.11 3.41±0.01 18.41±0.10
17 Wild (Control) ------ 19.59±0.13 2.88 0.014 17.3 0.13

RESULTS
68
4.5: Optimization of parameters for Lysine production by mutant (BFENU2
)
4.5.1: Growth curve of mutant
Mutant B. flavum (BFENU2
) was subjected to grow in 0.8 % nutrient broth (NB) to get
its growth curve. For this purpose one full loop of refreshed (BFENU2
) was inoculated in
sterilized NB and was kept on an orbital shaker at 120 rpm, 30 oC and pH 7. The OD of zero
hour inoculated broth was taken at 600 nm and after every 8th
hours of incubation. The OD at
zero hour was 0.066 and after next every 8th
hours OD increased up to 48 hours that showed
the high density (2.225) of growing organism. By increasing time from 48 to 56 hours, the
OD of the growing organism start decreasing showed OD of 1.985. The same decline was
observed by increasing the time and become almost same after 72 to 80 hours of incubation
as summarized in fig. 4.17.

RESULTS
69
Figure 4.17: Trend of mutant growth observed at 600 nm after every 8th
hour
0
0.5
1
1.5
2
2.5
0 8 16 24 32 40 48 56 64 72 80
OD
(6
00
) n
m
incubation time (h)

RESULTS
70
4.5.2: Effect of incubation period
During the optimization of (BFENU2
), organism was grown with all the pre-optimized
condition of wild B. flavum for a period of 120 hours to find the optimum incubation period
for maximum lysine production. The high lysine production (22.4533 g/L) was investigated
after 48 hours of incubation and decline of lysine production was observed by increasing the
incubation time as shown in fig. 4.18.
Figure 4.18: Optimization of incubation period for the production of Lysine from
mutant B. flavum with 4% (10 brix) molasses as a substrate and rest of basal medium
was same as that used for wild B. flavum at 30oC and 7.0± 0.2 pH.
0
5
10
15
20
25
24 48 72 96 120
Lysi
ne
(g/
L)
incubation period (hour)
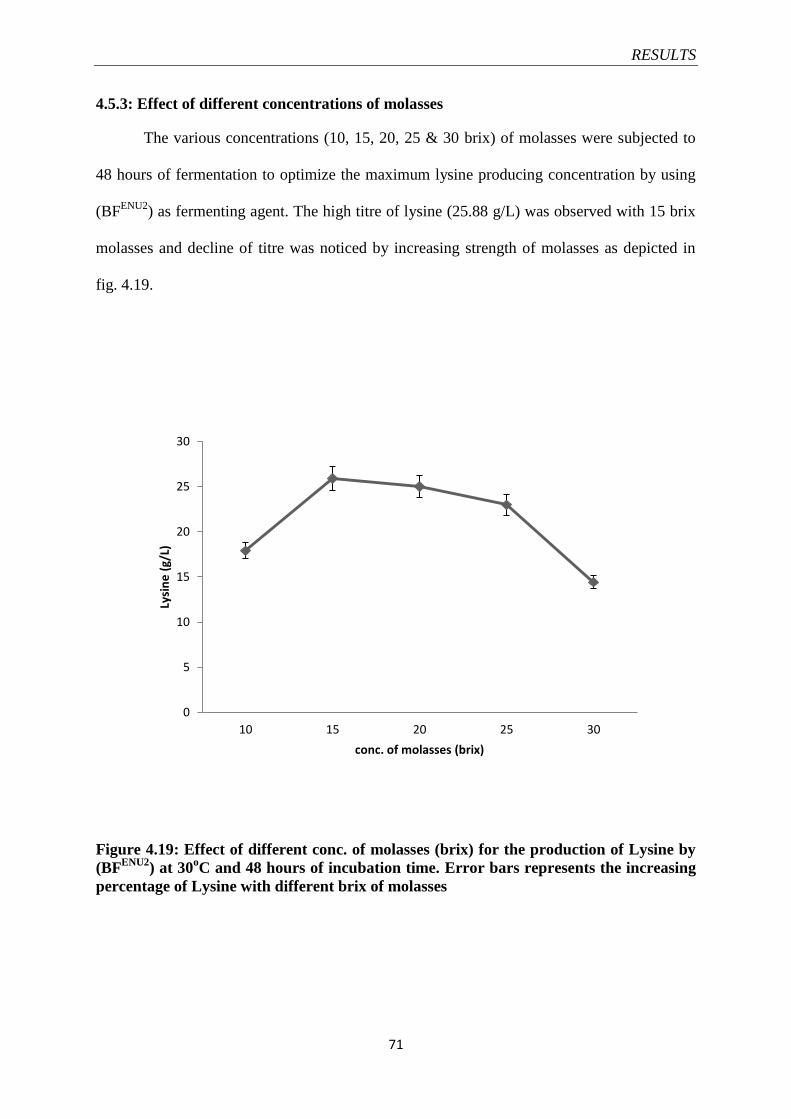
RESULTS
71
4.5.3: Effect of different concentrations of molasses
The various concentrations (10, 15, 20, 25 & 30 brix) of molasses were subjected to
48 hours of fermentation to optimize the maximum lysine producing concentration by using
(BFENU2
) as fermenting agent. The high titre of lysine (25.88 g/L) was observed with 15 brix
molasses and decline of titre was noticed by increasing strength of molasses as depicted in
fig. 4.19.
Figure 4.19: Effect of different conc. of molasses (brix) for the production of Lysine by
(BFENU2
) at 30oC and 48 hours of incubation time. Error bars represents the increasing
percentage of Lysine with different brix of molasses
0
5
10
15
20
25
30
10 15 20 25 30
Lysi
ne
(g/
L)
conc. of molasses (brix)

RESULTS
72
4.5.4: Influence of temperature
Various degrees of temperature (25, 30, 35 & 40 oC) were used for the fermentation
of 15 brix molasses by using mutant (BFENU2
) as fermenting agent. The maximum lysine
26.43 g was investigated at 30oC after 48 hours of incubations. The decrease of lysine titre
was observed by increasing temperature as shown in fig. 4.20.
Figure 4.20: Influence of different degrees of temperature for the production of lysine
from mutant B. flavum with molasses (15 brix) and 48 hours of incubation
0
5
10
15
20
25
30
25 30 35 40
Lysi
ne
(g/
L)
temperature (oC)

RESULTS
73
4.5.5: Effect of pH
The effect of different initial pH (6.6, 6.8, 7.0, 7.2 & 7.4) was observed with the final
pH of that fermentation medium at the end of 48 hours of incubation with 15 brix molasses
(BFENU2
) as fermenting agent. The results represent that maximum lysine was produced in
that fermentation medium with initial pH 7 and having final pH 6.9. By increasing the initial
pH of the fermentation medium the lysine level was decreased as shown in (fig. 4.21).
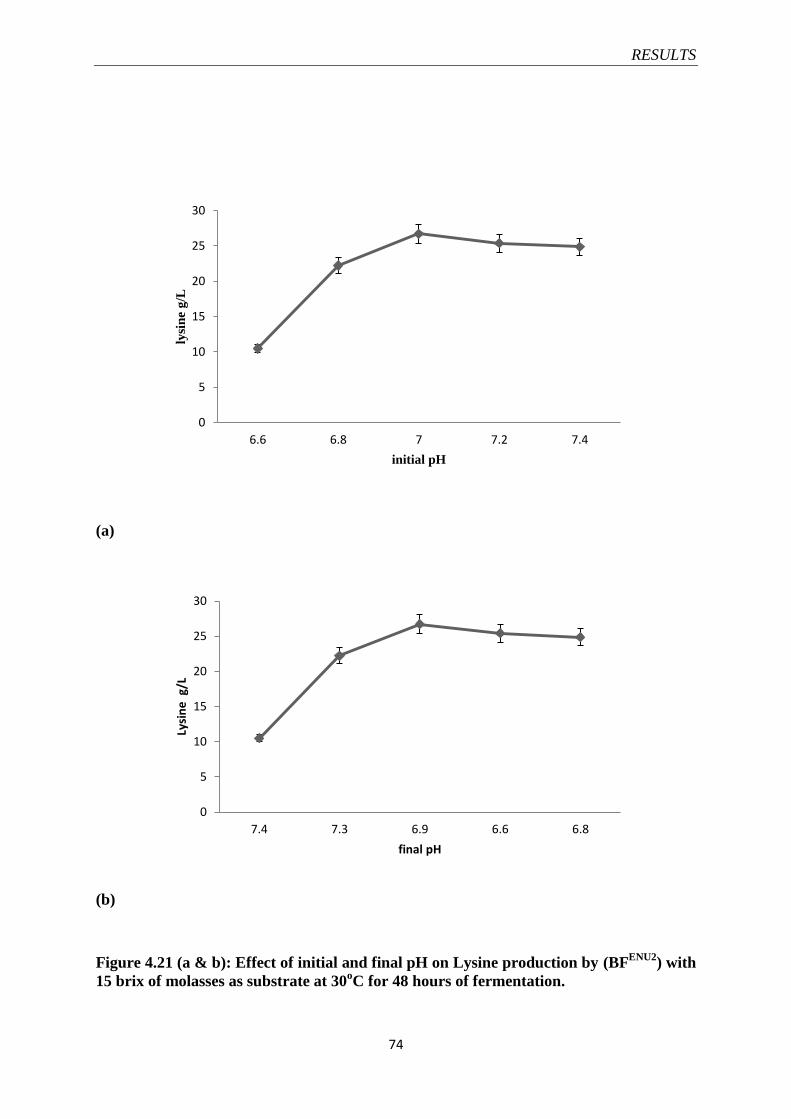
RESULTS
74
0
5
10
15
20
25
30
6.6 6.8 7 7.2 7.4
lysi
ne
g/L
initial pH
(a)
(b)
Figure 4.21 (a & b): Effect of initial and final pH on Lysine production by (BFENU2
) with
15 brix of molasses as substrate at 30oC for 48 hours of fermentation.
0
5
10
15
20
25
30
7.4 7.3 6.9 6.6 6.8
Lysi
ne
g/L
final pH

RESULTS
75
4.5.6: Effect of inoculum size
Various sizes (1, 2, 3, 4 & 5%) of inoculum were used to optimize the maximum
lysine producing size by using (BFENU2
) with pre- optimized conditions. The high lysine
(27.84 g/L) was observed with 4% inoculum of 18 hours and slight decrease of lysine titre
was noticed by increasing the size of inoculum from 4 to 5% as given in fig. 4.22.
Figure 4.22: Influence of various sizes of inoculum for hyper production of Lysine from
(BFENU2
) with 15 brix molasses as substrate for 48 hours of fermentation period at 30oC
and pH 7.
0
5
10
15
20
25
30
35
1 2 3 4 5
Lysi
ne
(g/
L)
inoculum size (%)
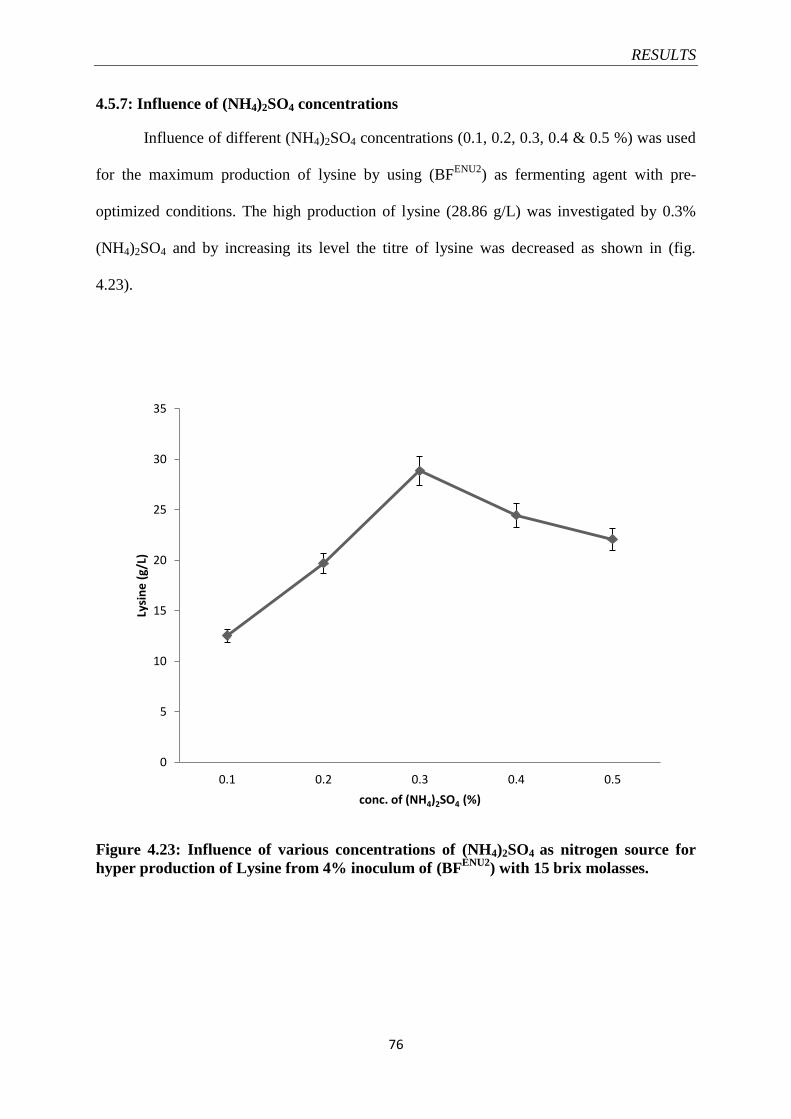
RESULTS
76
4.5.7: Influence of (NH4)2SO4 concentrations
Influence of different (NH4)2SO4 concentrations (0.1, 0.2, 0.3, 0.4 & 0.5 %) was used
for the maximum production of lysine by using (BFENU2
) as fermenting agent with pre-
optimized conditions. The high production of lysine (28.86 g/L) was investigated by 0.3%
(NH4)2SO4 and by increasing its level the titre of lysine was decreased as shown in (fig.
4.23).
Figure 4.23: Influence of various concentrations of (NH4)2SO4 as nitrogen source for
hyper production of Lysine from 4% inoculum of (BFENU2
) with 15 brix molasses.
0
5
10
15
20
25
30
35
0.1 0.2 0.3 0.4 0.5
Lysi
ne
(g/
L)
conc. of (NH4)2SO4 (%)

RESULTS
77
4.5.8: Effect of urea concentrations
Influence of different concentrations of urea (0.1, 0.2, 0.3, 0.4 & 0.5%) on the
production of lysine was investigated and 0.2% urea was found the optimum concentration
that produced maximum lysine (29.34 g/L). The decrease of lysine titre was observed by
increasing urea concentration with other pre- optimized fermentation medium by using
(BFENU2
) as shown in (fig. 4.24).
Figure 4.24: Effect of various concentrations of urea as organic neutral nitrogen source
for hyper production of Lysine from 4% inoculum of (BFENU2
) with 15 brix molasses.
0
5
10
15
20
25
30
35
0.1 0.2 0.3 0.4 0.5
Lysi
ne
(g/
L)
% of urea

RESULTS
78
4.5.9: Effect of CaCO3 concentration
Various concentrations (1, 2, 3, 4 & 5%) of CaCO3 were used to optimize the
maximum lysine producing concentration by using (BFENU2
) as fermenting agent with pre-
optimized conditions. The high lysine (29.84 g/L) was obtained with 2% CaCO3 as shown in
(fig. 4.25). Further increase of CaCO3 level slight decrease of lysine was observed.
0
5
10
15
20
25
30
35
1 2 3 4 5
Lysi
ne
(g/
L)
conc. of CaCO3 (%)
Figure 4.25: Effect of various concentrations of CaCO3 for hyper production of
Lysine from 4% inoculum of (BFENU2
) with 15 brix molasses

RESULTS
79
4.5.10: Inclusion of soya bean hydrolysate
Different concentrations of soya bean hydrolysate were used to get the maximum
lysine producing concentration by using (BFENU2
) with previously optimized conditions. The
high lysine level (31.2 g/L) was estimated with 0.5% soya bean hydrolysate and decline in
lysine titre was noticed by increasing soya bean concentration as shown in (fig. 4.26).
Figure 4.26: Influence of various concentrations of soybean hydrolysate for hyper
production of Lysine from 4%inoculum of (BFENU2
) with 15 brix molasses as substrate
29
29.5
30
30.5
31
31.5
0.25 0.5 0.75 1
Lysi
ne
(g/
L)
conc. of soybean hydrolysate (%)

RESULTS
80
4.5.11: Effect of tryptone
Various concentrations of tryptone were used to optimize maximum lysine producing
concentration by using (BFENU2
) with previously optimized conditions. Tryptone with 0.3%
level gave the high titre (33.92 g/L) of lysine and after increasing its concentration the titre of
lysine decreased as shown in (fig. 4.27).
Figure 4.27: Effect of various concentrations of tryptone for hyper production of Lysine
from 4% inoculum of (BFENU2
) with 15 brix molasses as substrate, 0.3% (NH4)2SO4,
0.2% urea, 2% CaCO3 and 0.5% soybean hydrolysate for 48 hours of fermentation
period at 30oC and pH 7.
30
30.5
31
31.5
32
32.5
33
33.5
34
34.5
0.1 0.2 0.3 0.4 0.5
Lysi
ne
(g/
L)
conc. of tryptone (%)

RESULTS
81
4.6: Scale up production in 7.5L glass vessel Fermenter
Large scale production of lysine was studied in 7.5 L glass vessel fermenter for both
mutant and wild B. flavum using molasses as a substrate. The fermentation was carried out
with all the pre- optimized basal media for both wild and mutant strain. The effect of
agitation, aeration, pH and inoculum size was only optimized during the scale up studies.
4.6.1: Effect of agitation
Effect of agitation (150 rpm-300rpm) was studied on the production of lysine by wild
B. flavum (BF) and mutant strain (BFENU2
) as summarized in fig. 4.28. Both strains showed
almost similar trend in lysine production with respect to agitation. Both strains gave lowest
yield of lysine at 150 rpm. At 150 rpm, wild (BF) gave maximum production of lysine (11.9
g/L) while mutant (BFENU2
) produced 19.5 g/L of lysine after 80 h of incubation. Increase in
lysine production was observed at 200 rpm by both wild (BF) and mutant (BFENU2
) with 17.1
g/L of lysine produced after 72 h of incubation and 22.6 g/L of lysine after 56 h of incubation
respectively. Maximum lysine production was observed at 250 rpm. At 250 rpm, lysine
production by wild (BF) and mutant (BFENU2
) increased up to 56 h of incubation with
maximum production of 18.3 g/L and 22.7 g/l given by wild (BF) and mutant (BFENU2
),
respectively after 56 h of incubation. Further increase in incubation time resulted in slight
decrease in the production of lysine and an increase in agitation beyond 250 rpm resulted in
decreased production of lysine by wild (BF) and mutant (BFENU2
). So agitation at 250 rpm
was selected for further studies.

RESULTS
82
Figure 4.28: effect of agitation in 7.5L fermenter on the production of L- lysine by wild
and mutant cultures of B. flavum
0
5
10
15
20
25
0 8 16 24 32 40 48 56 64 72 80
Lysi
ne
pro
du
ced
(g/
L)
Time of Incubation (h)
Lysine Produced by Mutant (g/L) at 150rpm Lysine Produced (g/L) by Mutant at 200rpm
Lysine Produced by Mutant (g/L) at 250rpm Lysine Produced by Mutant (g/L) at 300rpm
Lysine Produced by Wild (g/L) at 150rpm Lysine Produced (g/L) by Wild at 200rpm
Lysine Produced by Wild (g/L) at 250rpm Lysine Produced by Wild (g/L) at 300rpm

RESULTS
83
4.6.2: Effect of aeration
The effect of aeration (0.5-2.0 vvm) was studied on the production of lysine by wild
(BF) and mutant (BFENU2
) in fermenter as summarized in (fig. 4.29). Low yields of lysine
were obtained with wild BF (18.0 g/L) and mutant (BFENU2
) (19.5 g/L) at 0.5 vvm after 80 h
of fermentation. There was gradual increase in lysine production by wild (BF) and mutant
(BFENU2
) with an increase in aeration from 0.5-1.5 vvm. However, further increase in aeration
showed no increase in lysine production. At 1.5 and 2.0 vvm, lysine production by wild (BF)
increased with increase in fermentation time up to 64 h with 19.8 g/l of lysine produced.
However, no further increase in lysine production was observed with increase in fermentation
time. Similar trend in lysine production was also observed with mutant (BFENU2
). At 1.5 and
2.0 vvm, lysine production by mutant (BFENU2
) increased with fermentation time up to 48 h
with maximum production of lysine (25.7 g/l) maintained at 48-56 h of incubation. Further
increase in fermentation time resulted in slight decrease in lysine production that was
reported to be 25.4 g/L and 25.6 g/l. As there was no change in lysine production at 1.5 and
2.0 vvm, 1.5 vvm was selected for further parametric studies.

RESULTS
84
Figure 4.29: effect of aeration in 7.5L fermenter on the production of L- lysine by wild
and mutant cultures of B. flavum
0
5
10
15
20
25
30
0 8 16 24 32 40 48 56 64 72 80
Lysi
ne
pro
du
ced
(g/
L)
Time of Incubation (h)
Lysine Produced by Mutant (g/L) at 0.5vvm (L/L/M) Lysine Produced (g/L) by Mutant at 1.0vvm (L/L/M)
Lysine Produced by Mutant (g/L) at 1.5vvm (L/L/M) Lysine Produced by Mutant (g/L) at 2.0vvm (L/L/M)
Lysine Produced by Wild (g/L) at 0.5vvm (L/L/M) Lysine Produced (g/L) by Wild at 1.0vvm (L/L/M)
Lysine Produced by Wild (g/L) at 1.5vvm (L/L/M) Lysine Produced by Wild (g/L) at 2.0vvm (L/L/M)
RESULTS
85
4.6.3: Effect of pH
Initial pH of the media was adjusted at 7.0 before autoclave and fermentation was
carried out without controlling it and with control of pH at 7.0 with 5.0N NaOH and 1.0N
Acetic acid on the production of lysine by wild (BF) and mutant (BFENU2
) in stirred
fermenter. Both strains gave better production of lysine under controlled pH conditions.
Maximum production of lysine given by wild (BF) and mutant (BFENU2
) under controlled pH
conditions was 19.2 g/L and 30.6 g/L, respectively. Uncontrolled pH resulted in relatively
lower production with maximum production of 17.8 g/L and 27.7 g/L lysine obtained by wild
(BF) and mutant (BFENU2
), respectively after 58 h of incubation as shown in (fig. 4.30). So,
pH was controlled throughout the fermentation studies.

RESULTS
86
Figure 4.30: Effect of controlled and uncontrolled pH at 7.0 on the production of L-
lysine by wild and mutant cultures of B. flavum
0
5
10
15
20
25
30
35
0 8 16 24 32 40 48 56
Lysi
ne
pro
du
ced
(g/
L)
Time of Incubation (h)
Mutant at un-controlled pH Mutant at controlled pH
Wild at un-controlled pH Wild at controlled pH

RESULTS
87
4.6.4: Effect of inoculum size
Inoculum size of 4.0-10% was selected for the production of lysine by wild (BF) and
mutant (BFENU2
) in stirred fermenter. Change in inoculum size from 4.0-10% has no effect on
the production of lysine by wild (BF) and maximum production of lysine was found to be
20.8 g/L. In case of mutant (BFENU2
), lysine production increased from 30.6- 36.3 g/L with
increase in inoculum size from 4.0- 6.0%. However, further increase in inoculum size has no
significant effect on the production of L-lysine (33.6 g/L) as displayed in fig. 4.31.
Figure 4.31: Effect of inoculum size on the production of L-lysine by wild and mutant
cultures of B. flavum
0
5
10
15
20
25
30
35
40
0 8 16 24 32 40 48 56
Lysi
ne
pro
du
ced
(g/
L)
Time of Fermentation (h)
Mutant (4%) v/v Mutant (6%) v/v Mutant (8%) v/v Mutant (10%) v/v
Wild (4%) v/v Wild (6%) v/v Wild (8%) v/v Wild (10%) v/v

RESULTS
88
4.6.5: Kinetic studies
Wild (BF) and mutant (BFENU2
) were characterized in terms of residual sugars, cell
mass and lysine produced with respect to time as represented in fig. 4.32. Wild (BF) utilized
most of the sugar added with only 2% residual sugar obtained after 56 h of fermentation
while mutant (BFENU2
) utilized more sugar than the wild strain during the fermentation period
and only 1.4 % residual sugar was obtained after 56 h of fermentation. Regarding cell mass,
wild (BF) produced less cell mass (33.5 g/L) as compared to mutant (BFENU2
) that gave 45
g/L of cell mass after 56 h of fermentation. Lysine production by both wild (BF) and mutant
(BFENU2
) increased with an increase in fermentation time. However, wild (BF) gave lower
yield of lysine as compared to mutant (BFENU2
). Maximum lysine produced by wild (BF) was
found to be 20.2 g/L while mutant (BFENU2
) gave 36.5 g/L of lysine after 56 h of
fermentation.
Kinetic parameters showed in (table 4.2) that the wild (BF) and mutant (BFENU2
) have
almost same value for μ i.e., 0.5 and 0.49/ h, respectively while the values of other kinetic
parameters (QX, QS, QLys, YLys/S, YLys/X and qLys) were much higher for mutant (BFENU2
) as
compared to wild (BF).

RESULTS
89
Figure 4.32: Time course studies using wild and mutant culture of B. flavum for lysine
production under optimized conditions and medium. Data presented are mean values ±
SD of n=3 experiments
0
5
10
15
20
25
30
35
40
45
50
0
20
40
60
80
100
120
0 8 16 24 32 40 48 56
Lysi
ne
pro
du
ced
an
d C
ell
mas
s (g
/L)
Re
sid
ual
su
gar
(g/L
)
Time (h)
Residual Sugar (Mutant) Residual Sugar (Wild)
Lysine produced by Mutant Lysine produced by wild
Cell mass (mutant) Cell mass (wild)

RESULTS
90
Table 4.2: Comparison of kinetic parameters of wild and mutant culture of B. flavum in
7.5L fully controlled glass vessel bioreactors under optimized conditions
Sr.# Parameters Wild B. flavum Mutant B. flavum (BFENU2
)
1 μ (h
−1) 0.5±0.02 0.49±0.05
2 QX (g/L h
−1) 1.31±0.09 1.42±0.04
3 QS (g/L h
−1) 4.29±0.03 4.25±0.1
4 QLys (g/L h
−1) 0.44±0.02 1.05±0.11
5 YLys/S (g/g) 0.076±0.05 0.18±0.011
6 YLys/X (g/g) 0.38±0.02 0.89±0.03
7 qLys (g/g h
−1) 0.192±0.05 0.456±0.1
8 pH 7.0 7.0
9 Temperature 30
oC 30
oC
Each value is a mean value ± SD of n=3 experiments

RESULTS
91
4.7: Proximate analysis of fermented broth
Proximate analysis of fermented broth having lysine was carried out prior to its
evaluation on broiler chicks in terms of moisture, ash, ether extract, crude fiber, crude protein
(CP) and nitrogen free extract as shown in (table 4.3). The results showed that percentage of
(CP) was raised from 2.8 to 19.24 after fermentation of molasses with mutated (BFENU2
). The
ash content was increased to 12.2% in the fermented broth from untreated molasses. Fat
contents were raised from zero to 3% after fermentation. The percentages of moisture and
nitrogen free extract were 30.74 and 44.82 respectively in fermented broth. Crude fiber was
absent in treated and untreated molasses.
Table 4.3: Proximate analysis of fermented broth
Composition (%) Untreated-molasses Fermented broth
Moisture 68.9 30.74
Ash 7.98 12.2
Ether extract Nil 3
Crude fibre Nil Nil
Crude protein 2.8 19.24
Nitrogen free extract 70.62 44.82

RESULTS
92
4.8: Qualitative estimation of lysine from fermented broth
Qualitative estimation of lysine was performed by TLC. The spots appeared after
spraying with 0.2% ninhydrin showed the presence of lysine with other amino acids in the
fermented broth. The appearance of violet colour spot having same Rf value as that of spot of
standard lysine confirmed the presence of lysine in the broth as shown in fig. 4.33.
Figure 4.33: Thin layer chromatography (TLC) of fermented broth obtained after
fermentation of molasses as substrate with wild and mutant B. flavum

RESULTS
93
4.9: Down streaming of Lysine
4.9.1: Crystallization
The obtained after crystallization of concentrated NH3 fraction with equal volume of 95%
ethanol at 4oC was of pale yellow colour as shown in (fig. 4.34). The purified needle like
crystals were obtained when pale yellow crude crystals were heated with 5% active charcoal
and recrystallized 95% ethanol as shown in (fig. 4.35).
Figure 4.34: Pale yellow crude Crystals of L- Lysine
obtained after crystallization

RESULTS
94
Figure 4.35: Pure crystals of L- Lysine obtained after recrystallization of crude crystals
with 95% ethanol

RESULTS
95
4.10: Purity analysis and amino acid profiling
Percentage purity of produced lysine crystals was examined by using TLC technique. Deep
violet color spots of the sample were having the same Rf value as that of the standard lysine.
Furthermore, no other spots appeared except lysine spots (Fig. 4.36). This clearly indicated
that the lysine crystals obtained were of highly pure.
The fermented broth and the purified crystals were subjected to amino acid analyzer
for amino acid analysis. The fermented broth of both mutant and wild were analyzed for
lysine. All the chromatograms which were obtained after analysis showed the presence of
lysine in high concentration. The chromatogram shown in (fig. 4.37) of mutant (BFENU2
)
revealed the high peak of lysine with peak height 465 mV of after 55 minutes and showing
the retention time of 1 minute. The next most prominent amino acids were glutamic acid and
alanine with peaks height of 275mV and 270 mV respectively. The chromatogram given in
(fig. 4.38) obtained after analysis of broth by wild (BF) represented that this broth also have
the highest peak 390 mV of lysine after same time 55 minute. The broth of wild also has the
prominent peak of glutamic acid with peak height 348 mV and valine with peak height 290
mV. In addition to above amino acids trace amounts of methionine, cysteine, threonine,
serine, glycine, isoleucine, leucine, phenylalanine, histidine and arginine were also observed.
Whereas the chromatogram shown in (fig. 4.39) of produced lysine crystals
represented only a single sharp peak of lysine having height more than of 950 mV and no
other noticeable peak was observed showing the highest purity of the lysine crystals.

RESULTS
96
Figure 4.36: Thin layer chromatography of crystallized Lysine (sample) and standard
Lysine. Mobile Phase: chloroform, methanol and 17% ammonia (2: 2: 1), on the right side first three spots are of sample
Lysine and next two spots are of standard lysine

RESULTS
97
Fig
ure
4.3
7:
show
ing t
he
Am
ino a
cid
an
aly
sis
of
ferm
ente
d b
roth
of
mu
tan
t (B
FE
NU
2)

RESULTS
98
Fig
ure
4.3
8:
show
ing t
he
Am
ino a
cid
an
aly
sis
of
ferm
ente
d b
roth
of
wil
d (
BF
)

RESULTS
99
Fig
ure
4.3
9:
Am
ino a
cid
an
aly
sis
cryst
all
ine
Lysi
ne
by a
min
o a
cid
an
aly
ser

RESULTS
100
4.10.1: Amino acid profiling
The amino acid profile obtained after amino acid analysis of fermented broth by
mutant (BF2) showed the highest percentage of lysine (2.644%) with respect to other amino
acids as shown in (table 4.4). The next most prominent amino acid was glutamic acid
(0.795%) and alanine (0.505%). The percentages essential amino acids found were cysteine
(0.048), methionine (0.060), threonine (0.182), valine (0.287), isoleucine (0.286), leucine
(0.323), phenyl alanine (0.148) and histidine (0.200). The other non- essential amino acids
obtained were aspartic acid (0.414), serine (0.153), glycine (0.314) and arginine (0.178%).
The amino acid profile obtained after amino acid analysis of fermented broth by wild
(BF) showed the highest percentage of lysine (1.826%) with respect to other amino acids as
shown in (table 4.5). The next most prominent amino acid was glutamic acid (1.707%) and
aspartic acid (0.968%). The percentages essential amino acids found were cysteine (0.035%),
methionine (0.114%), threonine (0.277%), valine (0.481%), isoleucine (0.328%), leucine
(0.574%), phenyl alanine (0.287%) and histidine (0.180). The other non- essential amino
acids obtained were serine (0.312%), glycine (0.412%), alanine (0.407%) and arginine
(0.239%).

RESULTS
101
Table 4.4: Amino acid profile of fermented broth by mutant (FB2)
Sr.
No.
Amino acids FB2-A (%) FB2-B (%) Average (%)
1 Cystine 0.049 0.048 0.048
2 Methionine 0.063 0.056 0.060
3 M+C 0.112 0.104 0.108
4 Asp 0.413 0.416 0.414
5 Thr 0.182 0.183 0.182
6 Ser 0.155 0.152 0.153
7 Glu 0.798 0.793 0.795
8 Gly 0.327 0.300 0.314
9 Ala 0.502 0.508 0.505
10 Val 0.291 0.283 0.287
11 Ile 0.310 0.263 0.286
12 Leu 0.322 0.324 0.323
13 Phe 0.144 0.151 0.148
14 Hist 0.202 0.198 0.200
15 Lys 2.609 2.679 2.644
16 Amm 1.354 1.225 1.289
17 Arg 0.175 0.182 0.178
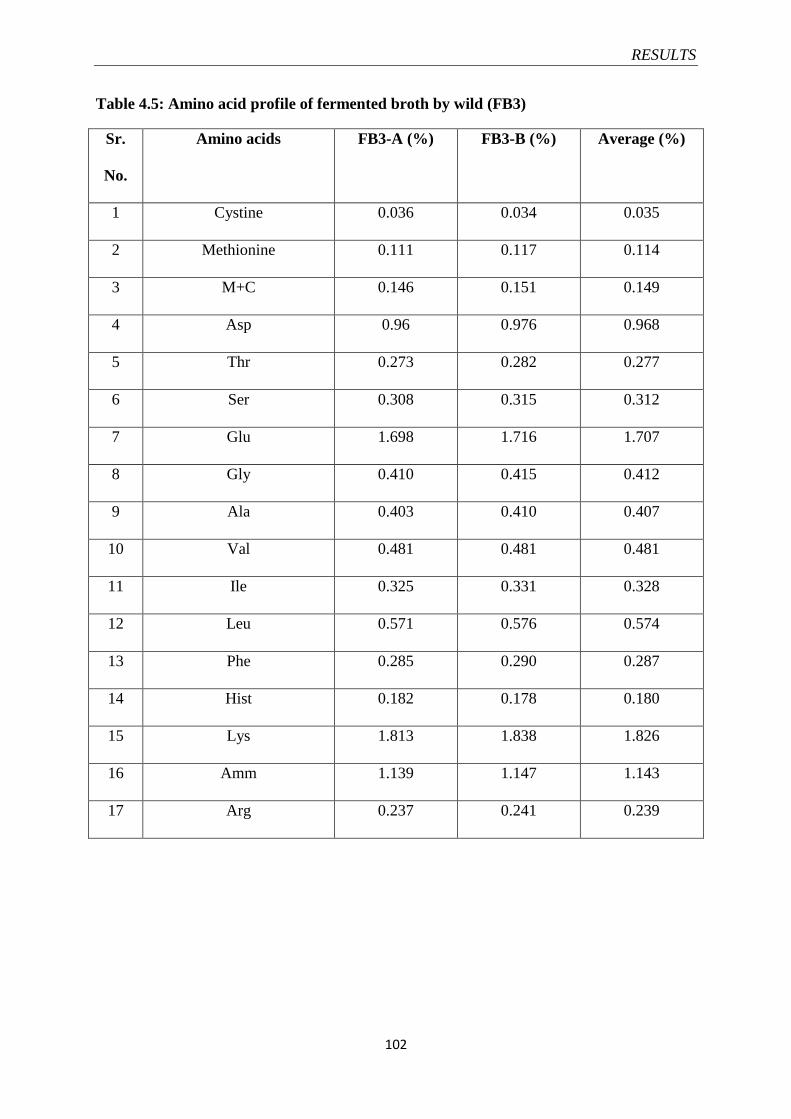
RESULTS
102
Table 4.5: Amino acid profile of fermented broth by wild (FB3)
Sr.
No.
Amino acids FB3-A (%) FB3-B (%) Average (%)
1 Cystine 0.036 0.034 0.035
2 Methionine 0.111 0.117 0.114
3 M+C 0.146 0.151 0.149
4 Asp 0.96 0.976 0.968
5 Thr 0.273 0.282 0.277
6 Ser 0.308 0.315 0.312
7 Glu 1.698 1.716 1.707
8 Gly 0.410 0.415 0.412
9 Ala 0.403 0.410 0.407
10 Val 0.481 0.481 0.481
11 Ile 0.325 0.331 0.328
12 Leu 0.571 0.576 0.574
13 Phe 0.285 0.290 0.287
14 Hist 0.182 0.178 0.180
15 Lys 1.813 1.838 1.826
16 Amm 1.139 1.147 1.143
17 Arg 0.237 0.241 0.239

RESULTS
103
4.11: Aflatoxin evaluation of produced lysine
Concentrated fermented broth of lysine was evaluated for the presence of toxins
(report is given in appendix XV). The sample contained negligible amounts of aflatoxin 1
(<0.1 ppb), aflatoxin B2 (<0.5 ppb), aflatoxin G1 (<0.1 ppb) and aflatoxin G2 (<0.5 ppb) as
shown in (table 4.6). Presence of aflatoxins in such trace amounts is considered safe for
animal and human consumption.
Table 4.6: Aflatoxin evaluation of produced lysine
Sr. No. Toxin Amount (ppb)
1 Aflatoxin B1 <0.1
2 Aflatoxin B2 <0.5
3 Aflatoxin G1 <0.1
4 Aflatoxin G2 <0.5

RESULTS
104
4.12: Biological evaluation of produced lysine
Biological evaluation of produced lysine on broiler chicks was performed in terms of
weight gain, feed consumed and feed conversion ratio for a period of five weeks. The
experiment was performed on overall 80 broilers chicks that were further randomly divided
into four units having 20 birds in each unit. Two rations (C& T) were prepared having all
same ingredients except ‘C’ have commercial lysine and ‘T’ have produced lysine in the form
of biomass. These two diets were randomly assigned to birds in such a way that there were
two replicates on each diet. During the trial on weekly basis average weight gain was
recorded for test and control broilers given in appendix XVI. The results of weight gain
showed that weight gain of test broilers was more as compared to control broilers. At the end
of the trial, the mean of weight gain (two replicates- 20 broilers in each) of test broilers was
found to be 29.4 kg whereas mean of weight gain (two replicates- 20 broiler in each) of the
control broilers (28.9 kg). Regarding the mean value of feed consumed, it was found that the
control broilers consumed more feed (72 kg) than the test broilers (71.17 kg) at the end of
five weeks. The mean value obtained from two replicates for feed conversion ratio (FCR)
was (2.46) for C broilers and (2.45) for T broilers.

RESULTS
105
4.12.1: Independent Sample t. test
An independent-samples t-test was conducted to compare the effect commercial lysine with
produced lysine on broiler chicks (in replicates) in terms of weight gain, feed intake and feed
conversion ratio (FCR) as given in table 4.8. The value ‘N’ showed the number of replicates
that was (3). There was a significant difference in the weight gain of test broilers (T) with
values (M= 29.4 kg, SD= 0.513) and weight gain of control broilers (C) with values (M=
28.9, SD= 0.40). The data obtained by the processing weight gain, feed intake and FCR for
‘t’ value represented no difference in values between C and T broilers as shown in table 4.10.
The value of significance (2- tailed) of weight gain was C (0.229) and T (0.233), feed intake
was C (0.248) and T (0.284), whereas sig. (2- tailed) of FCR was C (0.537) and T (0.537).
The p value was ≤ 0.05 for all the parameters to compare the level of significance for C and T
broilers.

RESULTS
106
Table 4.7: Independent Sample t. test on parameters observed after five weeks on
broiler chicks
Sr.
No.
parameters
Name
of
groups
Mean
(M)
N
SD
t
df
Sig.
(2 tailed)
p-
value
1
Weight
gain (Kg)
C
28.9
3
0.40
-1.420
4
0.229
≤ 0.05
T
29.4
3
0.513
-1.420
3.775
0.233
2
Feed
intake (Kg)
C
72
3
1.00
1.350
4
o.248
≤ 0.05
T
71.17
3
0.378
1.350
2.562
0.284
3
Feed
conversion
ratio
C
2.466
3
0.03
0.674
4
0.537
≤ 0.05
T
2.45
3
0.03
0.674
3.99
0.537

107
CHAPTER 5
DISCUSSION
5.1: Microorganism
Commercially lysine was produced by using coryneform bacteria particularly belong
to genus Corynebacterium or Brevibacterium and their species C. glutamicum, B. flavum and
B. lactofermentum. Different researchers successfully utilized these above strains to
manufacture lysine. Ali et al. (2009); Sattar et al. (2008); Naz et al (2001) used B. flavum as
fermenting agent during their studies. As these strains are industrially famous the reported
strain, Brevibacterium flavum (NRC- 207 F Rev. 2/78) as a fermenting agent was used in the
present study for lysine production through fermentation by utilizing agricultural wastes as
substrate. The classification and characteristic features of this strain are given in (appendices
I, II, III& IV). C. glutamicum was used by Nasab et al. (2007) and gained maximum yield of
48 g/L and Adnan et al. (2011) investigated lysine 23.57g/L with the organism B. linen.
Biotechnologists are continuously working to improve the strains to get maximum lysine
producing strains and they have also improved some strains through random mutagenesis.
Such as Rehman et al. 2012 improved their strain C. glutamicum by UV irradiation to got 18
mg/mL lysine. Javaid et al 2012 also improved their strain B. flavum by using various
mutagens and had improved lysine production 17.8 g/L in 7.5 L fermenter.
5.2: Screening of fermentation medium
For screening purpose on the basis of L-lysine production eleven different
fermentation media were examined as summarised in (fig. 4.2). From these diverse media
used, M11 (a locally designed) was found to the best suited for L-lysine production 7.6 g/L
after 48 hours of incubation at 30˚C in shake flask at 200 rpm. The modified Baullin medium

DISCUSSION
108
(M1) produced 2 g/L of L-lysine. In this medium the accessibility of other mineral
compounds is less therefore it produced less lysine as compared to other media. A good yield
of L-lysine 6.4 g/L was also perceived in each of medium M7 and M9. Oh et al. (1993) used
medium 7 and obtained 70 g/L of L-lysine from mutant strain of C. glutamicum in stirred
fermenter. Nasri et al. (1989) also employed a medium in 2 L fermenter with glucose and
ammonium sulphate gained 120 g/L of L-lysine after 120 hours of fermentation. Thus M11
which was locally designed contained (NH4)2SO4 as a chief nitrogen source along with other
organic nitrogenous sources such as peptone and yeast extract.
The potential of lysine production was virtually less by B. flavum as reported by
different researchers as discussed above but this gave a comparable lysine yield after
optimization of cultural conditions.
5.3: Optimization of Fermentation medium for wild B. flavum
As Pakistan is an agricultural land, hundred thousand tons of agricultural wastes are
produced annually that could be a good cheap source of energy and minerals for fermentation
(Ali et al. 2009). Different agricultural wastes like; wheat bran, rice polishing and molasses
were analysed as substrate to find the best lysine producing carbon source. Before these were
analysed for lysine production, proximate analysis of these substrates were carried out to
determine their contents in terms of moisture, ash, ether extract, crude fibre, crude protein
and nitrogen free extract given in appendix V. The rice polishing showed the highest Cp (7%)
as compared with wheat bran (6%) and molasses (2.8%). The proximate results showed that
Cp of untreated molasses was lowest compared with other substrate and NFE of molasses
showed the highest percentage (70.62%) as compared with other substrate. The results of
ether extract showed that rice polishing and wheat bran had fat contents whereas molasses

DISCUSSION
109
had no fat contents. The highest moisture contents (68.9%) were found in molasses as
compared with rice polishing and wheat bran.
Wheat bran (4%) gave the maximum yield (6.6 g/L) of lysine after 48 hours of
incubation, whereas 3% rice polishing and 4% molasses produced maximum lysine 4.5 g/L
and 9.1 g/L respectively after 72 hours of incubation period with wild B. flavum as
fermenting agent was found optimal for Lysine production at pH 7±0.2 (fig. 4.3). As the
concentrations of these were increased beyond the optimal level reduction in the lysine
concentration was observed. By comparing these three carbon sources, molasses was found to
be a best carbon source that yielded the highest lysine (9.1 g/L), therefore it was used as a
substrate for further optimization studies.
The above results are in line with Khan et al. (2006), who also found molasses as the
best agricultural waste for the production of essential amino acid lysine with fermentation by
C. glutamicum. The observations of Naz et al. (2001) have also supported the present results.
Lysine production with 4% molasses at pH 7 and 37oC by B. flavum recorded was 2.1 per
cent. Rao et al. (2011) reported 72 hours as a best fermentative period for lysine production
(45.34 g/L) at pH 7.5 and 30oC with 90g/L of glucose as substrate that period is in agreement
with present study findings. Sattar et al. (2008) reported maximum lysine production after 48
hours of incubation by using yeast sludge as substrate. They optimized the different
parameters with B. flavum and increased the percentage of yeast sludge from 1.54%- 4.78%.
Among all of the checked agricultural by-products as a substrate, molasses was found cheap
carbon source which contain 40-50% sucrose that was utilized by the organism for the
maximum production of lysine.
Metabolic activity of an organism is greatly affected by change of temperature.
Therefore to optimize suitable temperature, fermentation was carried out with 4% molasses

DISCUSSION
110
as substrate for 72 hours of incubation with various ranges of temperature. The results
showed that lysine production was significantly (P< 0.05) higher at 30oC as compare to all
other temperatures. Further increase in temperature resulted in decreased lysine production
(Fig. 4.4). The results of present study are in line with the work of Sthiannopkao et al. (2001),
that observed the maximum lysine production at 30oC during the study with three strains of
Coryneform bacteria during fermentation. Nakamaya et al. (1973) cultured Brevibacterium
and Corynebacterium auxotrophs on 20-40oC and reported maximum lysine (17- 39gL) at
30oC that also supported the present observation. The results of Shah et al. 2002; Nelofer et
al. 2008; Rao et al. (2011), showed that at 30oC, the metabolism of coryneform bacteria are
highly active for the production of enzymes and amino acids. Cultivation temperature used by
Javaid et al. (2012) was 32oC with mutated strain of B. flavum using glucose (3%), 8%
inoculum size and pH= 7.5. it was reported Lysine production 8.8g/L in shake flask and
17.8g/L in 7.5 L fermenter. Naz et al. (2001) reported maximum lysine (21.48 g/L)
production by B. flavum at 37oC, in contrast to present findings.
The amount of required product produced through fermentation is greatly affected by
the size of inoculum. The optimized inoculum size of 3% showed significantly (P< 0.05)
highest (10.4 g/L) lysine as shown in (fig. 4.5). Adnan et al. (2011) used 4% inoculum size
and obtained maximum production of lysine by using B. linens whereas Javaid et al. (2012)
used the inoculum size of 8% of B. flavum IIBUV2 to get the maximum lysine production.
The coryneform bacteria need ample supply of nitrogen for the maximum production
of Lysine as 19.16% nitrogen is present in lysine. Therefore the effect of different organic
and inorganic nitrogen sources like ammonium nitrate (NH4NO3), urea and ammonium
sulphate (NH4)2SO4 was studied for the production of lysine using wild B. flavum as
fermenting agent. From different concentration of ammonium sulphate, 0.25% was
significant (P< 0.05) as it produced 16.89 g/L lysine than any other concentration (Fig. 4.7).

DISCUSSION
111
The results of the present study are in line with Adnan et al. (2011), who optimized 0.65g
ammonium sulphate, 13.0g soybean meal with 0.4% inoculum size to get maximum
production of Lysine (23.57g/kg) through solid state fermentation. After increasing its
concentration the yield of Lysine did not increase, the same findings were also observed in
the present finding, but there was an increase of biomass concentration. Further it was
reported in his finding that combination of soybean meal and (NH4)2SO4 gave the higher
yield of lysine.
The results of Nasab et al. (2007) and Ekwealor and Obeta, (2007) also supported
that (NH4)2SO4 as a best inorganic nitrogen source with optimum concentration of 4% that
differ from present optimized concentration and findings of Adnan et al. (2011). This
difference may be due to the use of combination of different sources of nitrogen, as urea,
(NH4)2SO4 and corn steep liquor in this study. Among the different concentrations of urea,
0.5% gave the significantly (P< 0.05) higher lysine contents (Fig. 4.7). Mumtaz et al. (2000)
also used B. flavum for the fermentation of distillery sludge, with 1% urea, 6% molasses and
the biomass had 24.06% true protein. The concentrations of urea 5g/L was reported by Nasab
et al. (2007) that supported the optimized concentration of urea in present study. Statistical
analysis showed that concentration of NH4NO3, as a nitrogen source has no mark effect to
raised lysine production (Anastassiadis, 2007). Corn steep liquor is an agricultural by-product
of maize gluten which is a cheap and organic nitrogen source that rich in amino acids,
oligopeptides, vitamins and nucleotides (Hermann, 2003). With 0.6 % inclusion of corn steep
liquor, lysine concentration was reached to its maximum 19.4 g/L, which was statistically
proved as significant (P< 0.05) shown in (Fig. 4.9). The results of Naz et al. (2001) are in line
with the present results. They used 4% corn steep liquor and 4% molasses. The amino acid
profile revealed 21.48 mgs of lysine/g of molasses. The lysine contents was raised to 189 mg/

DISCUSSION
112
100mL reported by Mumtaz et al. (2000) with distillery sludge as substrate, molasses (6%),
corn steep liquor (3%) and urea (1%) by using B. flavum.
Various concentrations of salts were optimized for maximum lysine production at pH
7±0.2 and 30oC. The trend in the (Fig. 4.8) showed the optimized concentrations; 0.4% of
MgSO4.7H2O with lysine titre 17.4g/L and with 0.1% of NaCl maximum lysine (17.8g/L)
was produced. An increased (18.08 g/L) yield of Lysine was observed with 0.2%
KH2PO4.H2O. The concentrations of above inorganic salts were found to be statistically
significant (P< 0.05). The results obtained in this study with macro and micro nutrients are
supported by Athar et al. (2009). They used the strain Candidas utilis for the biomass
production and 0.75% CaCl2, 0.125 % MgSO4.7H2O and 0.45% KH2PO4.H2O was found
optimum for lysine production. Sen and Chatterjee, (1989) reported the effect of different
salts NaCl, KCl and MnCl2 on lysine production and observed maximum lysine concentration
with 0.1% NaCl, that also supported the present observation. The increased lysine
concentration with the optimization of ionic salts and vitamins was attributed by stimulation
of Lysine accumulation in the presence of these monovalent, bivalent metal ions and vitamins
(Ekwealor and Obeta, 2007; Ganguly and Banik, 2011).
Some ingredients of medium, when sterilized combined with ionic salts formed
complexes that remained insoluble in the medium. Therefore these important constituents
remained unavailable for microbial fermentation (Hermann, 2003) that’s why calcium
carbonate (CaCO3) was dry sterilized and biotin was syringe filtered (0.22 µm) also described
by Rehman et al. (2012). In the present study 4% CaCO3 gave significantly high titre (19.01
g/L) of Lysine. The medium composition used by Nasab et al (2007), contained 20 g/L
CaCO3, with different carbon sources for the production of Lysine through fermentation.
Similarly Liu et al. (1993), found 30 g/L CaCO3 as optimum for production of lysine. The
results of Shiio et al. (1982) also coincided with present optimized concentration of CaCO3,

DISCUSSION
113
50g/L CaCO3 was reported with 33-36g/L lysine by mutated homoserine and S-(2-
aminoethyl)-L-cysteine plus threonine auxotroph of B. flavum. Whereas Shah et al. (2002),
used different fermentation media having 2% CaCO3 with maximum Lysine (38, 33 and
28.5g/L) by mutated auxotroph of C. glutamicum. Furthermore, CaCO3 has a buffering action
in the medium and Ca+2
have the role in the stability of cell wall, cellular enzymes activation
and also regulated the cell functions (Ekwealor and Obeta, 2007).
The production of either glutamic acid or lysine, it was profoundly affected by the
concentration of biotin (Calik et al. 2001; Hermann, 2003). With 0.4 mg/100mL
concentration of biotin significantly (P< 0.05) high yield 19.45 g/L of lysine was obtained as
shown in (fig. 4.10). The present study was supported by Ekwealor and Obeta, (2007) those
discussed the importance of biotin for the lysine production, and observed the maximum
lysine production by Bacillus megaterium with 1 µg/100mL biotin. Tosaka et al. (1979) noted
the maximum lysine production by increasing biotin concentration from 5µg-50µg/100mL by
B. lactofermentum. Shiio et al. (1982) supported that lysine accumulation increased with
different concentrations of biotin by B. flavum as use of 30µg and 300µg/L biotin showed
Lysine concentration 32g/L and 31g/L respectively . An adequate percentage of biotin is
mandatory for the accumulation of lysine as described by Young and Chipley, (1984). It was
reported that in the presence of biotin cell up take more glucose than in its absence. The
mechanism of uptake more glucose was stimulated in the presence of biotin as it modified the
cell wall and created a charge barrier that regulate the excretion of more Lysine in
extracellular (Eggeling and Sahm, 2001). Sen and Chatterjee, (1989) also examined the role
of biotin in lysine production by B. lactofermentum ATCC 21086 and Micrococcus varians-
_2fa, respectively.

DISCUSSION
114
5.4: Random mutagenesis
After optimization of different fermentation parameters, it was concluded that wild
strains could not produce appreciable quantities of lysine. Cellular regulation was the main
cause of this finding and the impression of which has been well recognised (Nakayama,
1985). Therefore to enhance the lysine production, changes in metabolic pathways were
required. Thus to induce random mutation efforts were made. Actually the purpose was to get
rid of from feedback control mechanisms of using mutants through restrictive the
accumulation of feedback suppressing substances such as homoserine dependent mutants
were designed to carry successful lysine fermentation (Nakayama et al. 1961).
During different mutation studies sixteen homoserine auxotroph and AEC resistant
mutants were isolated as given in table 4.1. Five mutated strains were developed by UV
irradiation and out of them strain (BFUV1
) produced 20.99 g/L of lysine after 72 hours of
incubation in shake flask. Nitrous acid induced mutation produced two auxotrophic and
analogue resistant strains that produced the higher lysine 19.59 g/L by mutant (BFNH1
). The
treatment of EtBr developed high lysine produced strain (BFEB3
) that gave 20.69 g/L lysine
production. The EMS mutant strain (BFEMS3
) showed the high titre of lysine 20.23 g/L. The
lysine produced by mutant (BFG1
) exposed to gamma radiation yielded 20.11 g/L. ENU
induced mutant revealed the relatively highest yield of lysine in comparison with the rest of
strains. B. flavum (BFENU1
and BFENU2
) were able to produce 21.34 g/L and 21.64 g/L of
lysine. Therefore the high lysine producing strain (BFENU2
) was used for further optimization
of fermentation medium and for scale up studies.
Mutant strains that showed the hyper production of lysine are homoserine auxotrophs
that effectually lack the facility to produce homoserine that converts into threonine,
methionine, thus removing the feedback inhibition of enzyme aspartokinase (AK) by
threonine. They include homoserine dehydrogenase (HSD) and lysine analogue

DISCUSSION
115
resistant mutants. HSDleaky
mutants create an HSD that is less active for producing
homoserine that further not convert into threonine. Thus its quantity does not shut down AK
as its concentration is not sufficient. The advantage of the later mutants is that extra amino
acids do not requisite to be supplemented to growth media to brand up for their ample lack of
synthesis in HSD null mutants. Analogue resistant mutants inhibit the feedback suppression
effects of allosteric effectors. The analogues resist mutants were derived that are not resisted
by lysine. Such mutants were selected by incubating the mutagenized cultures in the presence
of the analogue. These are such strains that grow or resist in the presence of analogue and
their ability to produce lysine are screened. The rationale behind this approach is that wild-
type identifies the lysine analog 2-amino-ethyl-L-cysteine (AEC) as lysine. The enzyme is
inhibited as if lysine had accumulated in the cell and the cell fails to grow due to lysine
starvation. Analogue resistant mutants have AKs that do not recognize AEC as lysine; these
enzymes remain uninhibited, continue to make aspartyl-P and then lysine and the cells
continue to grow. Such mutants, since they no longer respond to intracellular lysine levels,
continue to synthesize lysine at high levels (Sano and Shiio, 1970).
5.5: Optimization of fermentation medium by mutated B. flavum
While optimizing substrate water ratio and incubation time for hyper- production of
Lysine using mutant B. flavum, growth curve of highest Lysine producing mutated strain
(BFENU2
) was plotted (Fig. 4.17). The plot showed the trend of different growth phases of
bacteria.
For hyper production of Lysine, mutated strain was incubated for 120 hours with 4%
(10 brix) pre-treated molasses as a substrate and rest of basal medium was same as that used
for wild B. flavum at 30oC and 7.0± 0.2 pH. During fermentation after every 24 hours sample
was estimated for produced Lysine. The results showed that significantly (P< 0.05) high yield

DISCUSSION
116
of Lysine 22.45 g/L was obtained after 48 hours and afterwards decline in Lysine titre was
observed shown in (Fig. 4.18). This showed the high metabolic activity and early decline of
growth phase than the wild B. flavum that showed maximum Lysine titre after 70 hours and
its concentration started decreasing as the incubation period prolonged. The decline of Lysine
titre could be associated with the decline of bacterial growth or depletion of nutrients from
the fermentation medium. Therefore optimum fermentation period for mutant and wild strain
was 48 and 72 hours respectively. It was concluded that mutated strain was better than wild
strain in terms that it produced more Lysine in less incubation period. Moreover this strain
would be industrially more attractive and economical as it produced maximum Lysine in less
fermentation time. For the optimization of other parameter this incubation period of 48 hours
was used to get the highest titre of Lysine.
The present results of optimization of incubation time was coincided with Mumtaz et
al. (2000) that reported 48 hours of incubation for fermentation to enhance Lysine contents
(189mg/ 100mL) of distillery sludge by using B. flavum as fermenting agent. Adnan et al.
(2011) also optimized incubation time of 48 hours for enhanced Lysine 23.57g/kg by solid
substrate fermentation by B. linens. While Rehman et al. (2012) investigated maximum
Lysine production (18mg/ 1mL) by UV- mutated C. glutamicum after 60 hours of incubation.
Metabolic flux was demonstrated by Wittmann and Becker (2007) after mutation. Three
strains of E. coli were developed, two strains gave maximum Lysine (14.97 & 13.39 g/L)
after 72 hours of incubation and third produced maximum lysine (13.88 g/L) after 48 hours of
incubation. The results of Javed et al. (2011) were different from present study. Mutant strain
of B. flavum was developed by using mutagen ENU and cultured organism to optimize
fermentation period and reported the highest yield 67.8 g/L after 24 hours. Ali et al. (2009)
demonstrated fermentation of yeast sludge with mutated B. flavum AJ/SA-315 enhanced the
lysine content from 1.59% to 3.71% with 72 hours of incubation period.

DISCUSSION
117
The substrate is the most important and basic requirement for microbial biosynthesis.
A cheap substrate with multiple nutrients other than as a good carbon source is ideal for
biotechnological processes. Molasses proved to be a best agricultural by-product that used in
present study as good carbon source. Out of various concentrations of molasses 15 brix was
found to be optimum used for hyper production of lysine by using mutant B. flavum. The
highest yield of Lysine 25.88 g/L was statistically found significantly higher (P< 0.05) as
shown in (Fig. 4.19). As the number of brix of molasses increased beyond 15 brix, the titre of
Lysine also decreased that could be the inhibition of Lysine synthesis by increased sugar
contents. Therefore, 15 brix of molasses were used to as optimum level in fermentation
medium by using mutant B. flavum as fermenting agent. Hydrolysed and un-hydrolysed sugar
contents (34% and 32% respectively) of pre-treated molasses were estimated. That showed
sugar content of 10- 12% in 15 brix molasses optimized for hyper production of molasses.
Industrially most favourable cheap substrate that was used for amino acid fermentation is
molasses (Ikeda, 2003). Molasses contain sucrose as main content and other sugar as minor
content are glucose, fructose, raffinose and some oligo or polysaccharides. Minerals found in
molasses are potassium, sodium, calcium and magnesium. Moreover amino acids, vitamins
and no fats contents made it an attractive cheap substrate (Chatterjee, 1998).
Mutant strain was incubated for different degrees of temperature to get best
favourable temperature for more secretion of Lysine by BFENU2
strain. It was found that
statistically significant (P< 0.05) Lysine titre 26.43 g/L was investigated at 30oC and decrease
in Lysine concentration was observed by increase of temperature (Fig. 4.20). The same
temperature 30oC was found optimum for high Lysine production of wild B. flavum. This
temperature was also favourable for the maximum growth of B. flavum as coryneform
bacteria grow well between 25- 40oC (Anastassiadis, 2007).

DISCUSSION
118
The above results are in line with Javed et al. (2011) that observed high titre of Lysine
at 30oC and justified that B. flavum as a mesophilic that grows with high enzyme activity at
moderate temperature 20- 40oC. The results of other researcher are also in line with the
present studies, they investigated maximum Lysine production at 30oC during batch
fermentation (Tada et al. 2000; Ohnishi et al. 2005; Gerova et al. 2011). While Ali et al.
(2009) reported 37oC as optimum temperature and Javaid et al. (2012) developed a UV
mutant B. flavum that produced high Lysine at 32 oC.
The growth of bacteria is sensitive to the change of pH and also influenced membrane
potential for secretion of lysine (Broer et al. 1993). Therefore, to get the highest growth with
good secretion of Lysine, various ranges (6.6, 6.8, 7.0, 7.2 & 7.4) of initial pH of
fermentation medium were investigated to get higher titre of Lysine. The higher titre 26.7 g/L
of Lysine was shown by mutated strain with pre-optimized conditions and initial pH =7.0 as
shown in (Fig. 4.21). The produced metabolites also affected the pH of the medium and
growth of the microbes, therefore the final pH of fermented broth at the end of fermentation
was also examined. Maintenance of pH between 6.9- 7.0 during the fermentation produced
highest lysine titre in the fermented medium.
The results of present studies are in line with Javed et al. (2011) noticed the maximum
Lysine production (69.5 g/L) at pH 7 in growth medium as compared to 58.1, 65.9 and 34.1
g/L lysine at pH 6.5, 7.5 and 8.0 respectively. Similar results were reported by Sattar et al.
(2008) the high titre of Lysine 34mg/ 100mL at pH 7 after 48 hours of incubation. The results
of Naz et al. (2001) were also in agreement with present study. While Rehman et al. (2012)
investigated 12.5 g/L of lysine at optimum value of pH 7.6 after 60 hours of incubation.
Vegetative growth of bacterium may be promoted at the cost of lysine production due
to competition for available nutrient (Reddy et al. 2008). Therefore, a number of inoculum

DISCUSSION
119
size (1, 2, 3, 4 & 5) were used to find the optimum inoculum size for hyper production of
Lysine from mutant B. flavum with 15 brix molasses as substrate for 48 hours of fermentation
period at 30oC and pH 7. The trend of produced Lysine showed that significantly (P< 0.05)
higher titre 27.84 g/L of Lysine was investigated with 4% of inoculum size shown in (fig.
4.22). The exponentially growing mutated B. flavum inoculum of 8 hours was used for hyper
production of Lysine having 0.6 OD at 600nm. While wild strain showed 0.6 OD at 600 nm
after 18 hours that showed the enhanced growth rate of mutated strain with early stationary
phase as compared to wild B. flavum. The present result of inoculum size was in agreement
with Adnan et al. (2011) while Javaid et al (2012) and Rehman et al. (2012) reported
maximum lysine production with 8% and 10% inoculum size respectively.
Since two amino groups (-NH2) are present in lysine molecule, therefore a constant
supply of nitrogen is required for the maximum Lysine biosynthesis. Different sources of
nitrogen like NH4NO3, NH4(SO4)2 and urea were tried for the production of lysine and
NH4(SO4)2 was found a best source for wild (B. flavum). When different concentrations (0.1,
0.2, 0.3, 0.4 & 0.5%) of it were investigated, the highest yield of lysine (28.86 g/L) was
obtained with 0.3% concentration of NH4(SO4)2 with significant level of P< 0.05 shown in
(Fig. 4.23). Whereas, wild strain utilized 0.25% of NH4(SO4)2 concentration with high titre of
Lysine 16.89 g/L shown in (Figure 4.8). The high concentration 0.3% of NH4(SO4)2 could be
attributed with the increased demand of nitrogen for high Lysine production by mutated B.
flavum. Urea being a neutral organic nitrogen source was also used for hyper production of
Lysine. The lysine production was significantly (P< 0.05) enhanced up to (29.34 g/L) with
optimum level of urea (0.2%) and all the other pre- optimized conditions as shown in (Fig.
4.24). Whereas Rehman et al (2012) revealed the optimum concentration of NH4(SO4)2 3 and
3.5% for lysine production from various basal media (FM3 and FM1 respectively). Although
Javaid et al. (2012) reported 0.1 % NH4(SO4)2 for maximum yield of lysine 8.8 g/L. The use

DISCUSSION
120
of different combinations of inorganic and organic nitrogen sources with various levels might
be the reason of difference in optimum concentrations of their findings with the present
study. As NH4(SO4)2 was found to be a best inorganic nitrogen source, urea also proved to be
a good organic ammonia supplier for the maximum production of lysine. Similarly the results
of Sattar et al. (2008) and Ali et al. (2009) are also in agreement with the present finding and
confirmed that urea; a low cost neutral fertilizer that does not increase the pH of fermentation
medium, supported maximum Lysine production.
CaCO3 was added in the fermentation medium not only as calcium source but also as
a buffer. From the numerous concentrations of CaCO3 2% resulted in maximum production
of lysine with 15 brix molasses as substrate, 0.3% (NH4)2SO4 and 0.2% urea for 48 hours of
fermentation by 4% mutant B. flavum at 30oC and pH 7. The trend of Lysine production in
(Fig. 4.25) showed that significantly (P< 0.05) higher titre (29.84 g/L) of Lysine was
estimated with 2% CaCO3. Whereas CaCO3 (4%) was found optimum for hyper production
of Lysine with wild B. flavum. Furthermore 2% CaCO3 was completely assimilated at the end
of fermentation with maximum titre of lysine. Same concentration of CaCO3 was described
by Shah et al. (2002) and Nelofer et al (2007) in their fermentative production of lysine.
Whereas Rehman et al. (2012) determined the maximum lysine (17.5 mg/mL) with 0.2% of
CaCO3.
Many industrial by products like cane molasses, corn starch hydrolysate, corn steap
liquor, soybean meal and soybean hydrolysate can be exploited not only as carbon and
nitrogen sources but it contains minerals and some amino acids in fermentation medium for
large scale production of lysine and thus fermented broth rich in lysine proved to be useful
for broiler feed. Moreover the presence of some essential nutrients required by the mutant for
its growth make it more attractive to use with optimum level. That is the reason soybean
hydrolysate was prepared and various concentrations (0.25, 0.5, 0.75 & 1%) were examined
DISCUSSION
121
with pre-optimized fermentation medium for hyper production of Lysine. The significantly
(P< 0.05) higher yield (31.2 g/L) of Lysine was achieved with 0.5% soybean hydrolysate
shown in (Fig. 4.26). These results supported the findings of Rehman et al. (2012) and Adnan
et al. (2011) that inclusion of these hydrolysates fruitfully enhanced the lysine titre. Sattar et
al. (2008) also added different percentages of protein hydrolysate of sesame meal to improve
the lysine production.
Tryptone is prepared by an enzymatic digestion of casein which serves as peptone and
tryptophan rich source for fermentation (Sezonov et al. 2007). The inclusion of various
concentrations (0.1, 0.2, 0.3, 0.4 & 0.5 %) of tryptone for hyper production of Lysine were
tested by using 4% inoculum of mutant B. flavum as fermenting agent with 15 brix molasses
as substrate, 0.3% (NH4)2SO4, 0.2% urea, 2% CaCO3 and 0.5% soybean hydrolysate for 48
hours of fermentation period at 30oC and pH 7 as shown in fig. 4.27. The high titre 33.92 g/L
of Lysine was estimated with 0.3% Tryptone and was found statistically significant at a level
of (P< 0.05). Tryptone 0.05% was also found as a significant nitrogen source by Sezonov et
al. (2007) for hyper production of β- amylase by Bacillus subtilis (DJ5). The over expression
of aspartokinase in C. glutamicum was investigated by Rastegari et al. (2013), used LB
medium in that study. It was reported that LB medium included with 1% bacterial tryptone,
5% yeast extract and 5% NaCl.
5.6: Estimation of produced Lysine
To estimate the unknown concentration of Lysine produced, a standard curve of
Lysine was drawn between different concentrations of Lysine (g/100mL) and (OD) of
reaction mixture at 545 nm following the spectrophotometric method of Chaves et al. (1988)
shown in (fig. 3.1). The OD of unknown sample was interpolated into the standard curve and
lysine concentration of the sample was calculated.
DISCUSSION
122
Identification of amino acids is extremely important for amino acid fermentation as
well as for evaluation of protein structure. Thin layer chromatography (TLC) is an easy and
frequently used technique for the detection and quantification of Lysine. The appearance of
violet colour spot having relative flow (Rf) value similar to that of standard lysine confirmed
the presence of lysine in the broth (Fig. 4.33). It showed the presence of Lysine in all the
samples of 120 hours of incubation, but the titre of lysine after 72 hours of incubation was not
increased as quantified by spectrophotometer. Spectrophotometric methods were used for the
quantification of Lysine from broth accurately, as in present study quantitative estimation of
lysine during the optimization was made by following Chaves et al. (1988). By this method
metabolites and vitamins produced during fermentation would not affect the complex
formation of Lysine with sodium nitroprusside. Lysine was estimated (17- 18 mg/ 1mL) by
Rehman et al. (2012), followed spectrophotometric method of Hsieh et al. (1995) by UV
mutated C. glutamicum. Rao et al. (2008) followed Chinard (1952) for quantitative assay of
Lysine (45.34 g/L). Nasab et al. (2007) estimated Lysine 48g/L after 96 hours of incubation
by TLC. Ekwealor and Obeta, (2005) also detected the produced lysine from fermented broth
by paper chromatography using different solvent composition for resolution of lysine and
quantitatively lysine measured by spectrophotometric method of Chinard (1952).
5.7: Large scale production of Lysine
Due to the increasing demand of Lysine for poultry feed sector in Pakistan, a prompt
action is awaiting for the establishment of Lysine producing industry locally. Therefore a
complete model was designed in this study which can be practically exploited. To get our
target, further scale up production was studied in Lab scale fermenter of 7.5 L by wild and
mutant B. flavum.

DISCUSSION
123
Lysine production was studied in stirred glass vessel fermenter (7.5L) with optimized
fermentation media of both wild and mutant. During scale up studies effect of agitation,
aeration, pH and inoculum size was studied on lysine production by both strains. Further
kinetic parameters were applied to study Lysine production with time, substrate utilization
and biomass production. Sample was collected after every 8 hours to determine the increase
in lysine production. The lysine was not observed in zero hour samples as bacterial cells were
in their lag phase and adapt themselves to growth conditions (Sassi et al. 1996; Druzina et al.
2011). The lysine production was started at just start of log phase after 8 hours, where micro-
organism exponentially grows and produces amino acids, enzymes and other metabolites. A
rapid raise of lysine was observed after 24- 32 hours with the promotion of exponential
phase. The raise of Lysine titre continued and after 48- 60 hours the maximum Lysine was
observed during the study. After 70 hours there was no further increase of lysine titre took
place. Probably there was depletion of essential nutrient and formation of inhibitory and
regulatory products as described by Javaid et al. (2012).
Effect of agitation (150 rpm-300rpm) was studied on the production of lysine by wild
B. flavum (BF) and mutant strain (BFENU2
) as illustrated in fig. 4.28. Both strains showed
almost similar trend in lysine production with respect to agitation. Both strains gave lowest
yield of lysine at 150 rpm. At this rate, wild (BF) gave maximum production of lysine (11.9
g/L) while mutant (BFENU2
) produced 19.5 g/L of lysine after 80 h of incubation. Increase in
lysine production was observed at 200 rpm by both wild (BF) and mutant (BFENU2
) with 17.1
g/L of lysine produced after 72 h of incubation and 22.6 g/L of lysine after 56 h of incubation
respectively. Maximum lysine production was observed 18.3 g/L at 250 rpm by wild (BF)
and 22.7 g/L by mutant (BFENU2
) after 56 h of incubation. Further increase in incubation time
resulted in slight decrease in the production of lysine and also increase in agitation beyond
DISCUSSION
124
250 rpm did not found fruitful for lysine production by wild (BF) and mutant (BFENU2
). So
agitation at 250 rpm was selected for further studies.
The effect of aeration (0.5-2.0 vvm) was studied on the production of lysine by wild
(BF) and mutant (BFENU2
) in fermenter as summarized in fig. 4.29. Low yields of lysine were
obtained with wild BF (18.0 g/L) and mutant (BFENU2
) (19.5 g/L) at 0.5 vvm after 80 h of
fermentation. There was gradual increase in lysine production by wild (BF) and mutant
(BFENU2
) with an increase in aeration from 0.5- 1.5 vvm. However, further increase in
aeration showed no increase in lysine production. At 1.5 and 2.0 vvm, lysine production by
wild (BF) increased with increase in fermentation time up to 64 h with 19.8 g/L of lysine
produced. However, no further increase in lysine production was observed with increase in
fermentation time. Similar trend in lysine production was also observed with mutant
(BFENU2
).
At 1.5 and 2.0 vvm, lysine production by mutant (BFENU2
)
increased with
fermentation time up to 48 h with maximum production of lysine (25.7 g/L) maintained at 48-
56 h of incubation. Further increase in fermentation time resulted in slight decrease in lysine
production 25.6 g/L was observed. As there was no change in lysine production at 1.5 and 2.0
vvm by both wild and mutated strain, therefore 1.5 vvm was selected as optimum for further
studies.
Initial pH of the medium was adjusted at 7.0 before autoclave and fermentation was
carried out without controlling it. At controlled pH 7.0 with 5.0N NaOH and 1.0N Acetic
acid on the production of lysine by wild (BF) and mutant (BFENU2
) in stirred fermenter. Both
strains gave better production of lysine under controlled pH conditions. Maximum production
of lysine was obtained by wild (BF) 19.2 g/L and mutant (BFENU2
) 30.6 g/L under controlled
pH. Uncontrolled pH resulted in relatively lower production with maximum production of
17.8 g/L and 27.7 g/L lysine obtained by wild (BF) and mutant (BFENU2
), respectively after

DISCUSSION
125
58 h of incubation as shown in fig. 4.30. Hence, pH was controlled throughout the
fermentation studies.
Inoculum size of 4.0-10% was selected for the production of lysine by wild (BF) and
mutant (BFENU2
) in stirred fermenter. Change in inoculum size from 4.0-10% did not effect
on the production of lysine by wild (BF) and maximum production of lysine was found to be
20.8 g/L. In case of mutant (BFENU2
), lysine production increased from 30.6- 36.3 g/L with
increase in inoculum size from 4.0- 6.0%. However, further increase in inoculum size did not
affect significantly on the production of L-lysine (33.6 g/L) as depicted in fig. 4.31.
The results of Kreutzer et al. (2001) and Bathe et al. (2004) are coincided with present
observation as they investigated agitation rate of 250 to 300 rpm for the production of lysine
in stirred fermenter. Javaid et al (2012) reported 17.8g/L of lysine from mutant B. flavum
after 120 h, 300 rpm and aeration of 4.0 vvm. Whereas Oh et al. (1993) and Liaw et al.
(2006) studied the bench scale fermentation with agitation speed 600 to 900 rpm and aeration
of 2.1 vvm. Shah et al. (2002) performed the large scale fermenter studies in 6L stirred tank
fermenter with 3L fermentation medium at 500 rpm, 1.5vvm aeration for 6 days at 7.5 level
of pH. It was reported 38, 33 and 28.5 g/L of Lysine with glucose, molasses and starch
hydrolysate as a carbon source. Fermenter scale studies was also reported by Nelofer et al
(2007), they observed 25.05g/L of lysine from cane molasses after 120 h of incubation,
agitation of 500 rpm and at 7.0 pH in 2L fermenter equipped automatic control of DO and
pH. Ahmed et al. (2013) investigated maximum lysine production after 40 h of incubation in
continuously stirred tank fermenter of 22L with 50% oxygen saturation at 35oC by B.
lactofermentum.
Wild (BF) and mutant (BFENU2
) were characterized in terms of residual sugars, cell
mass and lysine produced with respect to time as showed in fig. 4.32. Wild (BF) utilized most
of the sugar added with only 2% residual sugar obtained after 56 h of fermentation while

DISCUSSION
126
mutant (BFENU2
) utilized more sugar than the wild strain during the fermentation period and
only 1.4 % residual sugar was obtained after 56 h of fermentation. Regarding cell mass, wild
(BF) produced less cell mass (33.5 g/L) as compared to mutant (BFENU2
) that gave 45 g/L of
cell mass after 56 h of fermentation. Lysine production by both wild (BF) and mutant
(BFENU2
) increased with an increase in fermentation time. However, wild (BF) gave lower
yield of lysine as compared to mutant (BFENU2
). Maximum lysine produced by wild (BF) was
found to be 20.2 g/L while mutant (BFENU2
) gave 36.5 g/L of lysine after 56 h of
fermentation.
Comparison of kinetic parameters of wild and mutant culture of B. flavum in 7.5L
fully controlled glass vessel bioreactors under optimized conditions showed that the wild
(BF) and mutant (BFENU2
) have almost same value for μ i.e., 0.5 and 0.49/ h, respectively as
shown in (table 4.2). The biomass kinetic studies Qx (g/Lh-1
) of wild (BF) and mutant
(BFENU2
) showed higher biomass 1.42± 0.04 was produced by mutant as compared to wild
1.31±0.09, the result of substrate kinetics Qs ( g/L h-1
) indicated the maximum utilization of
substrate 4.25± 0.1 by mutant as compared by wild 4.29± 0.03. Kinetic parameter studies of
lysine Qlys (g/L h-1
) showed that higher lysine value (1.05± 0.11) by mutant as compared to
wild (0.44± 0.02). While the values of other kinetic parameters (YLys/S, YLys/X and qLys) were
much higher for mutant (BFENU2
) as compared to wild (BF) that indicated mutant strain was
kinetically more significant as compared to wild strain of B. flavum.
Nelofer et al. (2007) studied the kinetic parameters for substrate consumption and
product formation with growth. It was reported less substrate consumption Qs and more
lysine production relative to substrate utilization (Yp/s) by mutant as compared to wild.
Ahmed et al. (2013) studied the kinetic and thermodynamic parameters for lysine production
in shake flask and 22L fermenter and indicated the high kinetic values studied by
fermentation in 22L fermenter than in shake flask for maximum lysine production.

DISCUSSION
127
5.8: Recovery of Lysine from fermented Broth
After completion of culturing, Lysine can be recovered by conventional means ion
exchange resin, extraction with solvent, precipitation, adsorption and chromatography. Cation
exchangers provide an efficient and appropriate method for purification of Lysine from
fermented broth. The results of cation exchange resin are in line with Nakayama et al. (1973)
and Mark et al. (1989), they also packed the column with resin and loaded sample of pH (3-
3.5) with same protocols, but reported 2N NH4OH ( pH 12) to elute Lysine. The sodium
citrate buffers of increasing pH, from pH 3, pH 6 and tris HCl (pH 9-10) were used in present
study. Concentrated fermented broth of pH 2 was loaded on highly acidic ion exchange, to
bind all Lysine present in broth. The use of increasing pH buffers facilitated the elution of
acidic, neutral amino acids and to separate Lysine from other metabolites respectively. Lysine
was eluted with tris HCl (pH 9-10) as its isoelectric point is between 9- 10 pH, that ensured
its complete recovery (Zurawick, 1999). Same method of ion exchange resin was described
by Csapo et al. (2008) with increasing pH of elution buffers because at pH 2 all the amino
acids binds with resins with no chromatographic divisions, waiting for change in pH. The
comparison of ion exchange resin and HPLC was described regarding isoelectric points of
amino acids. Isoelectric point of an amino acid is the pH at which amino acid dispose no
electric charge. Crude crystals of lysine HCl were obtained which was of brown colour (fig.
4.34), the results of crystallization was in line with Su et al. (1990) which also decolourized it
with 0.5% activated charcoal and pale yellow crystals of Lysine (fig. 4.35), were obtained
with 95% ethanol. Lysine thus crystallized in this study was 62.5% pure while Su et al.
(1990), reported more purity (99.2%) in his study.
Identification of amino acids is extremely important for amino acid fermentation as
well as for evaluation of protein structure. TLC is an important authentic technique used for

DISCUSSION
128
the identification of amino acids. Different spraying reagents were used to visualize spots and
ninhydrin is one of them due to its high sensitivity (Laskar et al. 2001). Deep violet colour
spots with same Rf value as that of the standard and sample were observed after spraying with
0.2% ninhydrin in acetone. That clearly indicated that the lysine crystals obtained in this
study were of high purity as compared by the standard Lysine. Furthermore, there were no
other spots appeared except Lysine spots (fig. 4.36). This was also indicated that Lysine
produced in the study is almost pure Lysine. Nasab et al. (2007) also shown the presence of
Lysine in fermented broth by paper chromatography using solvent; n- butanol, acetic acid and
distilled water (2:2:1). Ekwealor and Obeta (2005) employed paper chromatography for the
detection of Lysine in fermented broth. Solvent systems used include n- butanol: acetic acid:
water (4:1:1, v/v) and phenol: water (5:1, v/v). Lysine and threonine was selectively
separated and quantitatively determined using TLC by Nabi and Khan (2003) from a mixture
of amino acids present in a commercially available drug.
Based on the observations, it was concluded that very high concentration of Lysine in
the form of Lysine crystals can be prepared. However the concentrated form of broth
containing 8% Lysine can be safely used in poultry rations as a source of Lysine. It is a
simple and cheap method for Lysine production which can be exploited on commercial scale
5.9: Amino acid analysis by amino acid analyzer
For amino acid analysis, fermented broth of wild and mutant strains, concentrated
fermented broth and the purified crystals were subjected to amino acid analyzer.
The chromatogram obtained after analysis of both wild and mutant strain represented
that the high resolution of amino acids and more peak height in mutant fermented broth while
comparing with wild chromatogram. The peak height of lysine in mutant broth was in
between 420- 430 mV whereas peak height of lysine in wild broth was in between 350- 360
mV as shown in (fig. 3.37 & 3.38). These heights were reciprocal to the percent of lysine
DISCUSSION
129
present in the broth that represented the high lysine contents in fermented broth of mutant
strain as compared to wild fermented broth. The peaks in chromatograms of both broths
observed at same retention time of 55 minutes that confirmed the presence of lysine in both
broths. Furthermore, the chromatogram showed the presence of other prominent amino acids
rather than lysine. The second most prominent peak was of glutamic acid that was present in
high concentration after lysine in fermented broth of wild and mutant B. flavum. This further
confirmed the reported findings of other researchers that coryneform bacteria are famous for
the production of lysine and glutamic acid (Niaz et al. 2009). But the peak height of glutamic
acid in fermented broth produced by wild strain was much higher than in mutant fermented
broth that represented the blockage of feedback inhibition in mutant as compared to wild
metabolic control of lysine production. The other peaks showed presence of many essential
and non- essential amino acid including; alanine, methionine, valine, glycine, cysteine,
aspartic acid, leucine, isoleucine, threonine, serine, tyrosine, phenyl alanine and arginine.
When the results (chromatogram) of amino acid analysis of produced lysine crystals
were examined (fig. 4.39), it was found that lysine peak was also appeared after 55 minutes
of retention time. In sample containing crystals, a single sharp peak of lysine was observed.
No other noticeable peak was observed showing the highest purity of the lysine crystals. The
peak height in crystal was increased near to 1000 mV that representing the high percent and
purity of lysine. However in concentrated fermented broth in addition to lysine peak, small
peaks of other amino acids like glutamic acid, aspartic acid were observed. In addition trace
amounts of methionine, cysteine, threonine, serine, glycine, alanine, valine, isoleucine,
leucine, phenylalanine, histidine and arginine were also observed.
The composition of amino acids present in fermented broths, were determined on
amino acid analyzer after fermentation by wild and mutant B. flavum. The amino acid profile
of fermented broth (wild) showed the high percent of lysine (1.826 %) with respect to other

DISCUSSION
130
amino acid as given in (table 4.4). Whereas, amino acid profile of mutant represented much
more concentration of lysine (2.644%) shown in table (4.5) confirmed that mutant strain have
more potential to produce lysine. The other essential amino acids were also found in good
yield according to profile.
The essential amino acid profile of yeast sludge before and after fermentation with
mutant B. flavum was presented by Ali et al. (2009). It was indicated the raise of lysine
contents 1.59 to 3.71 % before and after fermentation. The presence of other essential amino
acids in biomass protein was in support of present study that showed good lysine contents as
well as other essential amino acids for use in broiler feed. Sattar et al. (2008) also fermented
yeast sludge with B. flavum and reported the amino acid profile of produced biomass protein
before and after fermentation. The profile study revealed the enhancement of lysine percent
from 1.54 to 4.78 %. In the present study molasses were used as a good carbon source and
substrate produced sufficient amount of lysine after fermentation with wild and mutant B.
flavum that meet the requirement of livestock and poultry. While Mumtaz et al. (2000)
described twelve amino acids in profiling analysis of biomass protein by fermentation
distillery sludge. The lysine 4.78% was investigated in amino acid profiling with other
essential amino acids.
5.10: Aflatoxin evaluation
Aflatoxicosis causes fatal diseases in man and animals due to alfatoxin found in feed.
The total permissible aflatoxins level ranges from 0 to 50 parts per billion (ppb) with an
average of 20 ppb in animal feeds (Binder et al. 2007, Rodrigues and Naehrer 2012).
Moreover, the poultry industry also suffers greater economic loss than any of the livestock
industries because of their greater susceptibility to aflatoxin. Therefore produced lysine was
evaluated for aflatoxin at “Romer’s Lab Rawalpindi” before use in broilers feed as report is

DISCUSSION
131
given in (Appendix XV). It was found after report study that product have safe amount of
Aflatoxins (B & G) as given in table 4.6. Moreover the sample contained negligible amounts
of aflatoxin B1 (<0.1 ppb), aflatoxin B2 (<0.5 ppb), aflatoxin G1 (<0.1 ppb) and aflatoxin G2
(<0.5 ppb). Presence of aflatoxins in such trace amounts is considered safe for animal and
human consumption. Therefore the produced lysine was added in broiler feed in sufficient
amount required for broiler diet.
5.11: Biological evaluation of produced lysine
The presence of essential and non- essential amino acids in the biomass protein as
depicted by amino acid profile, vitamins, enzymes and minerals prove that concentrated
fermented broth would be a best source of lysine for broiler feed (Onu et al. 2010; Cu et al.
2012). Therefore concentrated fermented broth containing 8% lysine was supplemented in the
feed of broilers. At the end of fifth week, the average weight gained was 29.4 kg by test
broilers and 28.9 kg by control broilers. The total feed consumed at the end of five week by
test and control boiler was 71.17 kg and 72 kg respectively. Apparently more weight gained
by test broilers was observed than control broilers; this may be due to some unidentified
growth factors produced during fermentation of molasses. However the values of weight
gained by both groups of broilers were not significantly different. The FCR value of test
broilers (2.45) reflected the beneficial impact of supplemented lysine on test broilers and
FCR value of control broilers (2.46) depicted that both diets have equivalent effect on weight
gain with respect to feed intake. Furthermore, all the birds remained healthy during the
experimental trial. Moreover at the end of five weeks, the broiler evaluation data was
statistically studied by conducting an independent sample t. test as summarised in (table 4.8).
The statistical data in terms of weight gain, feed intake and FCR showed that there were no
significant (p> 0.05) difference between control and test broilers. This represented that lysine

DISCUSSION
132
produced by the fermentation of molasses by mutated BFENU2
was equally good as
commercial lysine.
Mateo and Conejos, (2009) also evaluated the protein quality of soybean meals from
different sources in broiler chicks fed on semi purified diets. Their calculated feed ingredients
include 0.9% lysine with rest of ingredients. They evaluated the broilers in terms of weight
gain, feed intake and protein efficiency ratio (PER). Bouyeh (2012) studied the effect of
excess use of lysine and methionine in broiler chicks’ feed and investigated that by increasing
lysine and methionine in excess of NRC recommendations improved immune system
functions, FCR, breast meat yield, abdominal fat deposition and carcass efficiency.
Fontanillas et al. (2001) also studied the performance and carcass quality of broiler chicks fed
on diet supplemented with lysine- HCl or Bio lysine (R) 60. They evaluated broilers in terms
of weight gain, feed intake and feed conversion and breast meat yield and found that the
nutritional efficacy of the lysine source Bio lysine 60 was equivalent to that of L- lysine-
HCl.
5.12: Postmortem of broiler chick
The postmortem report (appendix XVI) of broilers represented that all the internal
organs are of normal size and safe for public use.

DISCUSSION
133
5.13: Conclusion
All the proposed objectives in this study were achieved and a complete method of
lysine fermentation has been developed that was proved successful during broiler trial.
Moreover, in this method not only crude lysine was produced but also pure crystals were
obtained.

SUMMARY
134
CHAPTER 6
SUMMARY
Poultry and agriculture industry has a great role in the development of food sector in
Pakistan. Lysine required for poultry feed is imported in Pakistan to fulfil the desired dietary
needs. Present study was designed to produce maximum lysine by utilizing cheap sources to
save the foreign exchange. To achieve the goal of lysine production through fermentation, 11
different reported and locally designed media were initially analysed to screen the best lysine
producing medium. From those media, M11 formed the maximum lysine (7.6 g/L) with
respect to rest of media. To produce lysine locally different Physico-Chemical parameters
were optimized to have hyper-production of Lysine through fermentation by using B. flavum.
Different agricultural wastes were supplemented as carbon and nitrogen source in different
media. Out of the wheat bran, rice polishing and molasses, significantly high concentrations
of lysine (9.1 g/L) after 72 hours of incubation was observed with molasses (4%) with 3%
(v/v) inoculum size at 30oC. Among different nitrogen sources, 0.25% (NH4)2SO4 showed
significantly (P< 0.05) high yield of Lysine (16.89 g/L). Addition of different optimum levels
of ionic salts; 4% CaCO3, 0.4% MgSO4.7H2O, 0.1% NaCl and 0.2% KH2PO4 gave
significantly (P< 0.05) higher quantity of Lysine 18.08 g/L. Inclusion of 0.6% corn steep
liquor and 0.4 mg/100 mL biotin significantly (P< 0.05) raised the Lysine from 19.4 g/L –
19.45 g/L. Bacterial Strain was improved by random mutagenesis; physical mutagens (UV &
gamma irradiations) and chemical mutagens (Ethidium bromide, ethyl methyl suphonate,
nitrous acid and N- nitroso N- ethyl urea (ENU), for different time interval in order to obtain
more than 90% kill curve. Survivors after 90% kill was streaked on media plates
supplemented with, 0.1 mM homoserine and 0.1 mM threonine of auxotroph requirement and
10 mM of 2 (aminoethyl)- L- cysteine (AEC) of analogue resistant and the mutant

SUMMARY
135
frequencies were also calculated. Sixteen different AEC resistant mutants were developed
and screened for L-lysine production. The highest lysine producing strain (BFENU2
) was
screened with 21.64 g/L production by mutation treatment of (ENU) and further used for
optimization of medium. Molasses with 15 brix having 10- 12% sugar was found optimum
for lysine production (25.88g/L) with optimized period of 48 hours. The optimum
concentration of 0.3% NH4(SO4)2 and 0.2% urea was found which produced significantly
high concentration of Lysine (29.34 g/L). The inclusion of optimum soybean hydrolysate
(0.5%) and tryptone (0.3%) significantly enhance the titre of Lysine (33.92 g/L). Large scale
production of lysine was carried out in 7.5 L stirred glass vessel fermenter with wild and
mutant B. flavum using all pre- optimized conditions ( working volume 5 litre) for scale up
studies. Optimization of process parameters like agitation, aeration, pH and inoculum size in
fermenter showed that the maximum lysine (20.8 g/L) was produced at 250 rpm, 1.5 vvm
aeration, 6.0% inoculum under controlled pH conditions after 56 h of fermentation with wild
culture but mutant (BFENU2
) gave maximum yield of lysine 36.3 g/L under optimized
condition such as 250 rpm agitation, 1.5 vvm aeration and 6% inoculum with controlled pH
at 7.0. Kinetic parameters (QX, QS, QLys, YLys/S, YLys/X and qLys) were found to be much higher for
mutant (BFENU2
) as compared to wild B. flavum (BF) that showed that mutant strain was
kinetically more susceptible to produce lysine. Further Lysine was recovered from broth by
passing through ion exchange resin column, using elution buffer (tris-HCl, pH 9 or 5% NH3).
Crude brown crystals of lysine (40gm/500mL) were concentrated by evaporation (80˚C) of
fermented broth and recovered with 95% ethanol at 4oC. It was decolourized with 0.5%
activated charcoal, pale yellow pure crystals of Lysine (25 gm) were obtained with 95%
ethanol. The concentrated fermented broth having 8% lysine can be safely used in poultry
rations as a source of Lysine. Purity of produced lysine was confirmed by TLC and amino
acid analyzer. Amino acid profiling showed 1.826% Lysine in fermented broth by wild B.

SUMMARY
136
flavum and 2.644% by mutant strain (BFENU2
). Toxicity evaluation report showed that the
produced lysine is safe for consumption by broilers. Concentrated fermented broth having 8%
lysine in biomass was biological evaluated on broiler chicks. The results showed that broilers
fed on test feed consumed less feed, have more weight gain and low feed conversion ratio as
compared to those fed on control diet. Thus a cheap and practical bioprocess of lysine
production was concluded, that can be exploited commercially to save foreign exchange.

137
CHAPTER 7
LITERATURE CITED
Aazim M. 2013. Raising output and export of molasses. Dawn newspaper. Published at 1st
August.
Adnan A, Mushtaq Z, Syed Q, Shabbiri K. 2011. Optimization of fermentation parameters for the
production of L-lysine from Brevibacterium linens DSM 20158, using statistical approach.
J. World Appl. Sci. 13(5): 1132-1140.
Ahmed S, Ahmad F, Hashmi AS. 2010. Production of microbial biomass protein by sequential
culture fermentation of Arachniotus sp; and Candida utilis. Pakistan J. Bot. 42(2): 1225-
1234.
Ahmed S, Afzal M, Rajoka MI. 2013. Kinetic and Thermodynamic Characterization of Lysine
Production Process in Brevibacterium lactofermentum. J. Appl. Biochem. Biotechnol.
13(10): 169-173.
Aiba S, Humphrey AE, Millis NF. 1973. Biochem. Eng. 2nd
Ed. p. 92–127. New York: Academic
Press.
Ali S, Ahmed S, Sheikh MA, Hashmi AS. 2009. Lysine production by L- homoserine resistant
mutant of Brevibacterium flavum. J. Chem. Soc. Pakistan. 31(1): 97-102.
Ali S. PhD thesis. 2004. Lysine enrichmeny of distillery sludge its biological evaluation and
detoxification potential against AflatoxiinB1. University of Agriculture Faisalabad
Pakistan.
Ambreen, N, Hanif NQ, Khatoon S. 2006. Chemical composition of rice polishing from different
sources.Pakistan Vet. J. 26(4): 190-192.

LITERATURE CITED
138
Anastassiadis S. 2007. L- Lysine fermentation. Recent patents on Biotechnol. 1(1):11-24.
Anjum MA, Khan SH, Sahota AW. Sardar R. 2012. Assessment of Aflatoxin B1 in commercial
poultry feed and feeding ingredients. The J. Anim. Plant Sci. 22(2): 268-272.
AOAC. 1990. Official methods of analysis of Association of Official Analytical Chemists. 14th
Ed. Arlington Virginia, USA.
Athar M, Ahmed S, Hashmi AS. 2009. Bioconversion of beet pulp to microbial biomass protein
by Candida utilis. J. Chem. Soc. Pak. 31(1): 115-119.
Azin DA, Noroozi RF. 2001. Effect of chemicals on the improved gluconate productivity by
an Aspergillus niger strain. Appl. Biochem. Biotechnol. 61(3): 393-397.
Bathe B, Reynen C, Pfefferle W. 2004. L-lysine fermentation. WO04013340A2.
Bhalla TC, Sharma NN, Sharma M. 2006. Production of Metabolites, Industrial enzymes, Amino
acid, Organic acids, Antibiotics, Vitamins and Single Cell Proteins. Food indus. Microbiol.
Binder EM, Tan LM, Chin LJ, Handl J, Richard J. 2007. Worldwide occurrence of mycotoxins in
commodities, feeds and feed ingredients. Anim. Feed Sci. Technol. 137: 265-282.
Blombach B, Hans S, Bathe B, Eikmanns BJ. 2009. Acetohydroxyacid Synthase, a novel target
for improvement of L-lysine Production by Corynebcaterium glutamicum. Appl. Environ.
Microbiol. 75(2): 419-427.
Blombach B, Seibold GM. 2010. Carbohydrate metabolism in Corynebacterium and applications
for the metabolism engineering of L- lysine production strains. Appl. Microbiol.
Biotechnol. 86: 1313-1322.
Bouyeh M. 2012. Effect of Excess Lysine and Methionine on Immune system and Performance
of Broilers. Annals Biolog. Res. 3 (7): 3218-3224.

LITERATURE CITED
139
Broer S, Eggeling L, Kramer R. 1993. Strains of Corynebacteirum glutamicum with Different
Productivities May Have Different Lysine Excretion System. Appl. Environ. Microbiol.
59(1): 316-321.
Burkoski A, Kramer R. 2002. Bacterial amino acid transport proteins: occurrence, functions and
significance for biotechnological applications. Appl. Microbiol. Biotechnol. 58: 265-274.
Calik, G, F.Unlutabak F, Ozdamar TH. 2001. Product and by-product distributions in glutamic
acid fermentation by Brevibacterium flavum and effects of the oxygen transfer. Biochem.
Eng. J. 9: 91–101.
Carlton BC, Brown AJ. 1981. Gene mutation. In: Manual of methods for general bacteriology.
American Soc. Microbiol. p. 222-242.
Chatterjee M. 1998. Lysine production by Brevibacterium linens and its mutants: Activities and
regulation of enzymes of the lysine biosynthesis pathway. Folia Microbiol. 43(2): 141-
146.
Chaves MA, Akatuka SA, Auricciho MT. 1988. Determinacao da DL-Lisina Em Products
Farmaceticose Dieteticos. Rev. inst. Adolfo. Lutz. 48(1-2): 49-55.
Chinard FP. 1952. Photometric estimation of proline and ornithine. J. Biol. Chem. 199: 991-95.
Christensen S. 2011. Lysine functions [cited 2011 oct 27]. Availiable from: http://
www.livestrong.com/ article/ 375630.
Coello N, Brito L, Nonus M. 2000. Biosynthesis of L- lysine by Corynebacterium glutamicum
grown on fish silage. Biores. Technol. 73:221-225.
Coello N, Montiel E, Concepcion M, Christen P. 2002. Optimization of a culture medium
containing fish silage for L-lysine production by Corynebacterium glutamicum. Biores.
Technol. 85: 207-211.
LITERATURE CITED
140
Csapo J, Albert Cs, Loki K, Kiss ZsCs. 2008. Acta Univ. Sapientiae, Alimentaria. 1: 5-29.
Cu RKS, Acda SP, Agbisit EM, Jr, Carandang NF, Centeno JR, Merca FE. 2012. Efficacy of L-
Lysine Sulfate as supplement in Swine diets. Philippine J. Vet. Anim. Sci. 38 (1): 11-22.
Dhawan S, Dua M, Chishti AH, Hanspal M. 2003. Ankyrin peptide blocks falcipain-2-mediated
malaria parasite release from red blood cells. J Biol Chem 278: 30180-30186.
Druzina VB, Butorac A, Mrvcic J, Dragicevic TL, Tomas VS. 2011. Bacterial Stationary- Phase
evolution. Food Technol. Biotech. 49(1): 13-23.
Eggeling L, Sahm H. 1999. L- glutamate and L- lysine: Traditional products with impetuous
developments. Appl. Microbiol. Biotech. 52: 146-153.
Eggeling L, Sahm H. 2001. The cell wall barrier of Corynebacterium glutamicum and amino acid
efflux. J. Biosci. Bioeng. 92: 201-213.
Eggeling L. 2005. Export of amino acids and other solutes. Handbook of Corynebacterium
glutamicum. Eggeling L and Bott M (eds). Boca Raton, London New York CRC Press,
Taylor France Group. p. 187-214.
Ekwealor IA, Obeta JAN. 2005. Studies on lysine production by Bacillus megaterium. African J.
Biotechnol. 7(4): 633-638.
Ekwealor IA, Obeta JAN. 2006. Screening of UV-irradiated and S-2-aminoethyl-Lcysteine
resistant mutants of Bacillus megaterium for improved lysine accumulation. African J.
Biotechnol. 5(22): 2312-2314.
Ekwealor IA, Obeta JAN. 2007. Effect of vitamins and bivalent metals on lysine yield in Bacillus
megaterium. African J. Biotechnol. 6(11): 1348-1351.

LITERATURE CITED
141
Faurie R. Thommel J. 2003. Microbial Production of L-amino acids. Springer Verlag Berlin
Heidelberg, New York. p.2-7.
Fontanillas D, Hohler D, Mack S, Neme R, Rostagno HS. 2001. Performance and carcass quality
of broiler chickens fed diets supplemented either with Biolys (R) 60 or L-Lysine- HCl.
Brufau J. (ed.). Feed manufacturing in the Mediterranean region. Improving safety: From
feed to food. p. 177 -180.
Ganguly S, Banik AK. 2011. Role of complex nutrients on production of L- glutamic acid by a
mutant Micrococcus glutamicus AB100. Intern. J. Pharm. Bio- Sci. 2(3): 68-74.
Gerova M, Halgasova N, Ugorcakova J, Bukovska G. 2011. Endolysin of bacteriophage BFK2O:
evidence of a catalytic and a cell wall binding domain. FEMS Microbiol. Lett. 321: 83-91.
Gulber M, Jetten M, Lee SH, Sinskey AJ. 1994. Cloning of the pyruvate kinase gene (pyk) of
Corynebacterium glutamicum and site-specific inactivation of pyk in a lysine producing
Corynebacterium lactofermentum strain. Appl. Environ. Microbiol. 60(7): 2494-2500.
Gunji Y, Yasueda H. 2006. Enhancement of L- lysine production in methylotroph Methylophilus
methylotrophus by introducing a mutant LysE exporter. J. Biotechnol. 127: 1-13.
Gupta A, Das SK, Banik AK. 2012. Selection of suitable microorganism for microbial production
of biologically active form of lysine. Interna. J. Univers. Pharm. Life Sci. 2(1): 28-32.
Haas EM. 2006. Staying healthy with nutrition. 21 Century Edition, ISBN-13: 978-980.
Hassan EG, Alkareem AMA, Mustafa AMI. 2008. Effect of fermentation and particle size of
wheat bran on the antinutritional factors and bread quality. Pakistan J. Nutr. 7(4): 521-526
Hermann T. 2003. Industrial production of amino acids by coryneform bacteria. J. Biotechnol.
104: 155-172.
Hirose Y, Shibai H. 1980. Amino acid fermentation. Biotechnol. Bioengin. 22: 115-125.

LITERATURE CITED
142
Hsieh CL, Hsiung KP, Su JC. 1995. Determination of Lysine with Ninhydrin- Ferric Reagent.
Anal. Biochem. 224: 187-189.
Ikeda M, Nakagawa S. 2003. The Corynebacterium glutamicum genome: features and impacts on
biotechnological processes. Appl Microbiol Biotechnol. 62(2-3): 99-109.
Ikeda M. 2003. Amino acid production process. Adv. Biochem. Eng. Biotechnol. 79: 1-35.
Inamdar, S. (1994). Effect of pre-treatment of Molasses and post-treatment of fermented broth in
industrial production of Ethanol. J. Appl. Biochem. Biotech. 45(46): 181-187.
Ishikawa K, Murakoshi YT, Ohnishi F, Kondo K, Osumi T, Asano K. 2008. Medium composition
suitable for L-lysine production by Methylophilu smethylotrophus in fed-batch cultivation.
J. Biosci. Bioeng. 106(6): 574-579.
Javaid MM, Haq IU, Sohail MI, Bokhari SAI. 2012. Mutagenesis induced hyper-production of L-
Lysine in shake flask and fermentor by Brevibacterium flavum IIBUV2. Pakistan J. Bot.
44: 347-353.
Javed A, Jamil A, Zarchi SR. 2011. Optimization and hyper-expressed production of lysine
through chemical mutagenesis of Brevibacterium flavum by N-nitroso-N-ethylurea.
African .J. Microbiol. Res. 5(29): 5230-5238.
Joseph A, Tasker PR, Joseph K, Rao NN, Swaminathan M, Sanicarin AN, Screenvasan A,
Manyan S. 1962. Lysine supplementation in sesame oil. Ann. Biochem. 22: 113-117.
Kavita. 2003. Industrial Biotechnology. Forward by Dr. M. P. ARORA. A. I. T. B. S. Publishers,
India.
Kelle R, Hermann T, Bathe B. 2005. L- lysine production. In: Eggeling L, Bott M (eds).
Handbook of Cornyebacterium glutamicum. CRC Press, Taylor and Francis, Boca Raton.

LITERATURE CITED
143
Khan SH, Rasool G, Nadeem S. 2006. Bioconversion of cane molasses into amino acids. Pakistan
J. Agr. Sci. 43(3- 4): 156-161.
Kinoshita S, Udaka S, Shimmono M. 1957. Studies on the amino Acid fermentation. PartI.
Production ofL-glutamic acid by various microorganisms. J. Gen. Appl. Microbiol. 3: 193-
205.
Kircher M, Pfeerle W. 2001. The fermentative production of L- lysine as an animal feed additive.
Chemosphere. 43: 27-31.
Kiss RD, Stephanopoulus G. 1991. Metabolic control of L- Lysine fermentation by restrained
growth fed batch strategies. J. biotechnol. Proc. 7(6): 501-509.
Koffas M, Stephanopoulos G. 2005. Strain improvement by metabolic engineering: Lysine
production as a case study for systems biology. Curr. Opin. Biotechnol. 16: 361-366.
Kolossova A, Stroka J, Breidbach A, Kroeger K, Ambrosio M, Bouten K, Ulberth F. 2009.
Evaluation of the effect of Mycotoxin Binders in Animal Feed on the analytical
Kothari V. 2009. Biocatalytic Preparation of Amino Acids. Biotechnol. Books Delhi-110 035.
Published by: Biotech Books 1123/74; TriNagar, DELHI-110 035.
Kreutzer C, Hans S, Osnabruck RM, Mockel B, Pfeffere W, Eggeling L, Sahm H, Patek M. 2001.
L-lysine fermentation: US20016200785.
Kumagai H. 2000. Microbial production of amino acids in Japan. Adv. Biochem. Eng.
Biotechnol. 69: 71-85.
Kusunose C, Fujii T, Matsumoto H. (1999). Role of starch granules in controlling expansion of
dough during baking. Cereal chemist. 76(6): 920-924.
Laskar S, Sinhababu A, Hazra KM. 2001. A modified spray reagent for the detection of amino
acids on thin layer chromatography plates. Amino acids. 21: 201-204.

LITERATURE CITED
144
Leuchtenberger W, Huthmacher K, Drauz K. 2005. Biotechnological production of amino acids
and derivatives: current status and prospects. Appl. Microbiol. Biotechnol. 69: 1-8.
Leuchtenberger W. 1996. Amino Acid Technical Production and Use. Rehm, H.J. Reed, G.
Puhler A and stadler P. Biotechnol. 2nd
Ed. Wiley VCH Weinheim, Germany. p. 465-502.
Levesque R. 2007. SPSS Programming and Data Mangement. A Giude for SPSS and SAS Users,
fourth edition, SPSS Inc., Chicago III. ISBN 1- 56827- 390- 8.
Liaw HJ, Eddington J, Yang Y, Dancey R, Swisher S, Mao W. 2006. L-lysine fermentation.
US20066984512.
Liu YT. 1986. Studies on the fermentation production of Llysine. J. Bio. Sci. 114(1): 45-66.
Mahmood ZA. 1996. Production of L-lysine through fermentation. Thesis of PhD in pharmacy,
Department of Pharmaceutics, University of Karachi, Pakistan: 1-192.
Malothu R, Dowlathabad MR, Balanarasaiah T. 2012. Bioprocess Technology Development and
Convalescing Production of L-Lysine in Corynebacterium glutamicum. International
Conference on Chemical Engineering and its Applications, Bangkok, Thailand.
Malothu R, Singh M, Adarsh G, Rajak MA, Satyanarayana SV, Rao DM. 2012. Over expression
of aspartokinase gene in corynebacterium glutamicum for higher production levels of l-
lysine. Intern. J. Biol. Pharm. Res. 3(6): 758-761.
Mark D, Jaffari MD, Mahar JT, Bachert RL. 1989. Ion Exchange Recovery of L-Lysine.
US4835309.
Markham R. 1942. A steam distillation apparatus suitable for micro- Kjeldahl analysis. Biochem.
Journal. 36: 790-791.
Mateo CD, Conejos JRV. 2009. Evaluation of the Protein Quality of Soybean Meals from
Different Sources in Broiler Chicks Fed with Semi-Purified Diets. Philippine J. Sci.
138(2): 153-159.

LITERATURE CITED
145
Moriyoshi K, Masu M, Ishii T, Shigemoto R, Mizuno N, Nakanishi S. 1991 Molecular cloning
and characterization of the rat NMDA receptor. Nature. 354:31-37.
Mumtaz S, Sheikh MA, Iqbal T, Rehman K, Rashid S. 2000. Bioconversion of distillery sludge
(treated) to lysine and its biological evaluation. J. Agri. Biol. 2(4): 274-277.
Nabi S, Khan MA. 2003. Selective TLC separation of lysine and threonine in pharmaceutical
preparations. ACTA Chromatographica. 13: 161-171.
Nadeem S, Ikram A, Rana SM, Yaqoob N, Qureshi MJ, Shakoori AR. 2001. Enhanced L-Lysine
production by Escharicchia coli mutant WARN 30522 after MNNG treatment. J. Agri.
Biol. 3(4): 448-450.
Nakayama K, Kituda S, Kinoshita S. 1961. Studies on lysine fermentation: The control
mechanism of lysine accumulation by homoserine and threonine. J. Gen. Appl. Microbiol.
7: 145-154.
Nakayama K, Sagamihara, Araki K. 1973. Process for producing L- Lysine. US3708395.
Nakayama K. 1985. Lysine. In Moo- Young (Ed.). Comprehensive Biotechnol. Pergamon Press,
New York. 3: 607-620.
Nasab MN, Ansaris S, Montazer Z. 2007. Fermentative production of lysine by Corynebacterium
glutamicum from different carbon sources. J. Iran. Agr. Res. 26(1- 2): 99-105.
Nasri M, Dhuoib A, Zorguani F, Kria AH, Ellouz R. 1989. Production of L-lysine by using
immobilized living corynebacterium sp. Cells. Biotechnol. Let. 11: 780-865.
Naz S, Iqbal T, Sheikh MN, Shahid M, Ghaffar A. 2001. Effect of physiochemical treatment on
Brevibacterium flavum for production of lysine. J. Biol. Sci. 1(61): 507-510.

LITERATURE CITED
146
Nelofer R, Syed Q, Baig S, Nadeem M. 2007. L-lysine Production by the Homoserine
Auxotrophic Mutant of Corynebacterium glutamicum in Stirrer Fermenter. Pakistan J.
Zool. 39(3): 159-164.
Nelofer R, Syed Q, Nadeem M. 2008. Statistical optimization of process variable for L- Lysine
production by Corynebacterium glutamicum. Turk. J. Biochem. 33(2): 50-57.
Nelson DL, Lehninger AL, Cox MM. 2008. Principles of Biochemistry. 5th
Ed. W.H. Freeman
and Company, New York.
Niaz B, Nadeem S, Muzammil HM, Khan JA, Zahoor T. 2009. Optimization of Fermentation
Conditions for Enhanced Glutamic Acid Production by a Strain of Corynebacterium
glutamicum NIAB BNS-14. Pakistan J. Zool. 41(4): 261-267.
Oh JW, Kim SJ, Cho YJ, Park NH, Lee JH. 1993. L-lysine fermentation: US5268293.
Ohnishi J, Ikeda M. 2006. Comparisons of Potentials for L-Lysine Production among Different
Corynebacterium glutamicum Strains. Biosci. Biotechnol. Biochem. 70 (4): 1017-1020.
Ohnishi J, Katahira R, Mitsuhashi S. 2005. A novel gene mutation leading to increased lysine
production in Corynebacterium glutamicum. FEMS. Microbiol. Lett. 242: 265-274.
Onu PN, Ayo-Enwerm, MC, Ahaotu EO. 2010. Evaluation of Carcass characteristics and cost
effectiveness of Broiler Chicks fed synthetic Lysine and Methoinine supplemented
Soyabean-based diets. Intern. J. Sci. Natur. 1(1): 22-26.
Pellet PL, Ghosh S. 2004. Lysine fortification: past, present, and future. J. Food Nutri. Bull.
25(2): 107-113.
Peter P. 2010. Introduction to Molecular Biology. 1st Ed. Tata Mc Graw-Hill P. Ltd., New Delhi.
p. 153.

LITERATURE CITED
147
Pfefferle W, Mockel B, Bathe B, Marx A. 2003. Biotechnological manufacture of Lysine. Adv.
Biochem. Eng. Biotchnol. 79: 59-112.
Radmacher E, Eggeling L. 2007. The three tricarboxylate synthase activities of Corynebacterium
glutamicum and increase of L- lysine synthesis. Appl. Microbiol. Biotechnol. 76: 587-595.
Rambabu K. 2007. Textbook of Biochemistry. A.I.T.B.S. publishers, India Medical Publishers. p.
355.
Rao BS, Muralidhararao, Swamy AVN. 2011. Studies on Continuous Production Kinetics of L-
Lysine by Immobilized Corynebacterium glutamicum 13032. Middle-East J. Sc. Res. 7
(2): 235-240.
Rastegari H, Chiani M, Akbarzadeh A, Cheraghi S, Saffari Z, Mehrabi MR, Farhangi A,
Ghassemi S. 2013. Improvement in the Production of L-Lysine by Over-expression of
Aspartokinase (ASK) in C. glutamicum ATCC 21799. Trop. J. Pharm. Res. 12 (1): 51-56.
Rattray, P. F. and F. Fox (1997). Purification and Characterization of an Intracellular Esterase
from Brevibacterium linens ATCC 9174. Int. Dairy Journel. 7: 213-278.
Reddy MA, Villeneuva LM, Wang M, Lanting L, Natarajan R. 2008. Role of the lysine specific
demethylase 1 in the proimflammatory phenotype of vascular smooth muscle cells of
diabetic mice. Circ. Res. 103(6): 615-623.
Rehman HU, Hameed A, Ahmed S. 2012. Selection and Characterization of a Lysine Yielding
Mutant of Corynebacterium glutamicum – a Soil Isolate from Pakistan. Pak. Vet. J. 32(1):
20-24.
Rodney FB. 1993. Modern Experimental Biochemistry. 2nd
Ed. The Benjamin/ Cummings
Publishing Company, Inc. p. 234-238.

LITERATURE CITED
148
Rodrigues I, Naehrer K. 2012. A three- year survey on the worldwide occurrence of mycotoxins
in feedstuffs and feed. Toxins. 4: 663-675.
Rouy N, Yerres F. 1992. Fermentation process for producing Lysine Sulphate for Animal
Nutrition. US5133976.
Ruklisha M, Ionina R. 2000. Effect of Changes in the Cellular Energy State on Glucose Transport
Activity in Brevibacterium flavum. Proc. Biochem. 35: 841-848.
Sano K, Shiio I. 1970. Microbial production of L-lysine production by mutant resistant to S-(2-
aminoethyl)-L- cysteine. J. Gen. Appl. Microbiol. 16:373.
Sassi IH, Deschamps AM, Lebeaulth JM. 1996. Process Analysis of L-Lysine Fermentation with
Corynebacterium glutamicum under Different Oxygen and Carbon Dioxide Supplies and
Redox potentials. Proc. Biochem. 31(5): 493-497.
Sattar M, Ahmed S, Sheikh MA, Hashmi AS. 2008. Fermentation of yeast sludge with
Brevibacterium flavum to enhance lysine concentration. J. Chem. Soc. Pakistan. 30 (4):
642-648.
Sen SK, Chatterjee SP. 1989. Influence of B- Vitamins and trace elements on lysine production
by Micrococcus varians_2fa, Acta Biotechnol. 9: 63-67.
Sezonov G, Joseleau-Petit D, Ari RD. 2007. Escherichia coli Physiology in Luria- Bertani Broth.
J. Bacteriol. 189: 8746-8749.
Shafaghat H, Najafpour GD, Rezaei SP, Sharifzadeh M. 2010. Optimal growth of Saccharomyces
cerevisiae (PTCC 24860) on pretreated molasses for the ethanol production: the
application of the response surface methodology. J. Chem. Indus. & Chem. Eng. Quart. 16
(2): 199-206.

LITERATURE CITED
149
Shah AH, Hameed A, Ammad S, Khan GM. 2002. Improved microbial production of lysine by
developing a new auxotophic mutant of Corynebacterium glutamicum. Journal of
Biological Sciences. 5(1): 80-83.
Shah AH, Hameed A, Ammad S, Khan GM. 2002. Optimization of culture conditions for L-
lysine fermentation by Corynebacterium glutamicum. J. Biol. Sci. 2(3): 151-156.
Shah AH, Hameed A, Rehman SU, Jan AH. 2012. Nutritional and Mutational Aspects of Lysine
production by Corynebacterium glutamicum Auxotrophs. Pakistan J. Zool. 44(1): 141-149.
Shah AH, Khan AJ. 2008. Direct fermentative production of lysine (Review). J. Chem. Soc. Pak.
30(1): 158-164.
Shah AH. 1998. Studies on the Microbial Production of Lysine. Ph.D thesis. Quaid-i-Azam
University, Islamabad.
Sharaf AN, Abosereh, Abdalla NA, Latif SM, Mohamed HA, Salim RGS. 2009. Impact of Some
Genetic Treatments on the Probiotic Activities of Saccharomyces boulardii. Res J. Cell.
Mol. Biol. 3(1): 12-19.
Shih IL, Shen MH. 2006. Optimization of cell growth and poly (-lysine) production in batch and
fed-batch cultures by Streptomyces albulus IFO 14147. Proc. Biochem. 41: 1644-1649.
Shiio S, Ozaki H, Takeda KU. 1982. Production of Aspartic Acid and Lysine by Citrate Synthase
Mutants of Brevibacterium flavum. Agric. Biol. Chem. 46 (1): 101-107.
Sindelar G. Wendisch VF. 2007. Improving lysine production by Corynebacterium glutamicum
through NA microarray-based identification of novel target genes. J. Appl. Micro. Biotech.
76(3): 677-89.
Sinha S, Chakrabarty SL. 1977. Relative effectiveness of mutagens on amylase production in
Aspergillus wentii. Ind. J. Exp. Biol. 15(11): 1068-1070.

LITERATURE CITED
150
Sokalingam S, Raghunathun G, Soundrarajan N, Lee SG. 2012. A Study on the Effect of Surface
Lysine to Arginine Mutagenesis on Protein Stability and Structure Using Green
Fluorescent Protein. J. PLoS ONE. 7(7): e40410.
Sramkova Z, Gregova E, Sturdik E. 2009. Chemical composition and nutritional quality of wheat
grain. Acta Chimica Slovaca. 2(1): 115-138.
Sthiannopkao S, Danner H, Braun R. 2001. Use of Grass Sap as an Ingredient in Lysine
Production. Thammasat Int. J. Sci. Technol. 6: 3-4.
Stock R, Rice FBC. 1967. Chromatographic methods. 2nd
Ed. Published by Chapman & Hall
Limited. p. 170-200.
Su YC, Hwang MS, Huang HJ. 1990. Lysine production by Brevibacterium divaricatum NTU-2
and its recovery from the fermentation broth. Zhonghua Min Guo Wei Sheng Wu Ji Mian
Yi Xue Za Zhi. 23(3): 201-10.
Tada K, Kishimoto M, Omasa T, Katakura Y, Suga KI. 2000. L-Lysine Production by
Exponential Feeding of L-Threonine. J. Biosci. Bioeng. 90(6): 669-674.
Tanaka T, Nakamura Y, Asahi K, Shirashi T, Takahara K. 1978. Process for producing L- Lysine
by fermentation. US4123329A.
Thomsen MH, Bech D, Kiel P. 2004. Manufacturing of Stabilised Brown Juice for L-lysine
production from University Lab Scale over Pilot Scale to Industrial Production. Chem.
Biochem. Eng. Q. 18(1): 37-46.
Tome D, Bos C. 2007. Lysine Requirement through the Human Life Cycle. J. Nutr. 137: 1642S-
1645S.
Tosaka O, Morioka H, Takinami K. 1979. The role of biotin- dependent pyruvate carboxylase in
L-lysine production. Agric. Biol. Chem. 43: 1513-1519.

LITERATURE CITED
151
Tryfona T, Bustard MT. 2004. Fermentative production of lysine by Corynebacterium
glutamicum transmembrane transport and metabolic flux analysis. Proc. Biochem. 40: 499-
508.
Umerie SC, Ekleawor IA, Nwagbo IO. 2000. Lysine production by Bacillus Laterosporus from
various carbohydrates and seed meals. Biores. Technol. 75: 249-252.
Weinberger S, Gilvarg. 1970. Bacterial distribution of the use of succinyl and acetyl blocking
groups in diaminopimelate acid biosynthesis. J. Bacteriol: 323-324.
Wittmann C, Becker J. 2007. The L-Lysine Story: From Metabolic Pathways to Industrial
Production. J. microb. Monogr. 4(2): 1017-1023.
Yamaguchi K, Ishino, Aruki SK, Shirahata K. 1986. NMR studies of L-lysine fermentation with
corynebacterium glutamicum mutant. Agric. Boil. Chem. 50: 2453-59.
Yang C, Hua Q, Shimizu K. 2000. Energetics and carbon metabolism during growth of
microalgal cells under photoautotrophic, mixotrophic and cyclic light-autotrophic/dark-
heterotrophic conditions. Biochem. Engineer.J. 6: 87-102.
Young TK, Chipley JR. 1984. Role of biotin in the production of lysine by Brevibacterium
lactofermantum. Microbios. 40: 161-171.
Zurawick J. 1999. Separation of L-Lysine by Ion-Exchange Chromatography. M. Sc. thesis
(published). Deptt. of Eng., Univ. Tennessee, Knoxville.

CHAPTER 8
Appendix I
Table 8.1: classification of B. flavum
Organism Cellular organism
Type Eubacteria
Phylum Actinobacteria
Class Actinobacteridae
Order Actinomycetales
Family Brevibacteriaceae
Genus Brevibacterium
Specie flavum
(NCBI- Taxonomy: 92706)

Appendix II
Characteristic features of B. flavum
Organism was further identified morphologically and biochemically by performing
different tests. Morphological feature showed that the colonies of B. flavum are bulging and
off white in colour as shown in figure 4.1. Gram staining results indicated that these are gram
positive bacteria (figure 8.1) and their magnified view represent that they are isolated, single
cell bacilli having bulging ends showing the characteristic morphological features of
Coryneform bacteria as revealed in figure 8.2. Some chemical tests were also performed that
depicted that they gave catalase positive test by decomposing hydrogen peroxide as shown in
figure 8.3. Further morphological and biochemical characteristics of B. flavum that were
studied are summarised in table 8.1.
Figure 8.1: Gram positive B. flavum

Appendix III
Morphological features of Coryneform bacteria
Figure 8.2: Magnified picture showing single, isolated, bacilli having bulging ends
showing the characteristic morphological features of Coryneform bacteria
Figure 8.3: Catalase test positive, as B. flavum contains catalase for the decomposition of
hydrogen peroxide.

Appendix IV
Table 8.2: Morphological and Biochemical identification
Colony morphology Cell characteristics Biochemical characteristics
Size Appearance Colour Cell shape Gram’s
reaction
Catalase test Gelatine
liquefaction
test
Short Bulging Off-
white
Short rods
with bulging
ends
+ve reaction +ve +ve

Appendix V
Proximate analysis of substrates
Proximate analysis of agricultural wastes; wheat bran, rice polishing and molasses
was carried out and different composition of these substrates were examined in terms of
moisture, ash, ether extract, crude fibre, crude protein (Cp) and nitrogen free extract (NFE) as
shown in (table 4.1). The high moisture contents (68.9%) were present in molasses. Rice
polishing showed the high percentage of ash (12.4%), fat (8%) and crude protein (7%).
Wheat bran showed maximum crude fibre (11.65%). Ether extract and crude fibre were not
found in molasses.
Table 8.2: Proximate composition of substrates
Composition (%) Rice polishing Wheat bran Molasses
Moisture 7.3 8.5 68.9
Ash 12.4 5.72 7.98
Ether extract 8 4 NIL
Crude fibre 4 11.65 NIL
Crude protein 7 6 2.8
Nitrogen free extract 48.5 53.23 70.62

Appendix VI
Table 8.3: statistical analysis of different substrate used for lysine production by wild
BF
Molasses Rice polishing Wheat bran
df MS Sig. Df MS Sig. df MS Sig.
Between 4 6.129 0.000 4 5.992 0.000 4 15.2 0.000
Within 10 0.010 0.000 10 0.002 0.000 10 0.007 0.000
Level Mean SD LSD Level Mean SD LSD Level Mean SD LSD
1.0 5.8 0.10 0.08 1.0 0.87 0.01 0.037
1.0 2.03 0.06 .067
2.0 6.3 0.10 0.08 2.0 1.36 0.01 0.037
2.0 3.14 0.01 .067
3.0 6.6 0.10 0.08 3.0 4.5 0.1 0.037
3.0 6.30 0.10 .067
4.0 9.1 0.10 0.08 4.0 3.53 0.01 0.037
4.0 6.60 0.10 .067
5.0 5.5 0.10 0.08 5.0 1.85 0.001 0.037
5.0 2.10 0.10 .067

Appendix VII
Table 8.4: statistical analysis on the parameters used for fermentation by wild BF
MgSO4. 7H2O NaCl KH2PO4. H2O
df MS Sig. Df MS Sig. df MS Sig.
Between 4 5.59 0.000 4 49.749 0.000 4 2.289 0.000
within 10 0.004 0.000 10 0.01 0.000 10 0.01 0.000
Level Mean SD LSD Level Mean SD LSD Level Mean SD LSD
0.1 14.32 0.1 0.08 0.1 17.8 0.1 0.08 0.1 17.2 0.1 0.08
0.2 14.78 0.1 0.08 0.2 17.1 0.1 0.08 0.2 18.08 0.1 0.08
0.3 15.79 0.1 0.08 0.3 16.87 0.1 0.08 0.3 17.8 0.1 0.08
0.4 17.4 0.1 0.08 0.4 16.56 0.1 0.08 0.4 17.1 0.1 0.08
0.5 17.1 0.1 0.08 0.5 15.95 0.1 0.08 0.5 16.34 0.1 0.08

Appendix VIII
Table 8.5: statistical analysis of nitrogen sources of fermentation by wild BF
NH4NO3 Urea (NH4)2SO4
Df MS Sig. Df MS Sig. df MS Sig.
Between 4 6.385 0.000 4 28.254 0.000 4 53.259 0.000
Within 10 .008
0.000 10 .010
0.000 10 .010
0.000
Level Mean SD LSD Level Mean SD LSD Level Mean SD LSD
0.25 11.96 0.10 .073 0.25 12.33 0.10 0.08 0.25 16.89 0.10 0.08
0.50 13.2 0.01 .073 0.50 15.09 0.10 0.08 0.50 15.95 0.10 0.08
0.75 13.7 0.10 .073 0.75 14.68 0.10 0.08 0.75 15.32 0.10 0.08
1.0 14.6 0.10 .073 1.0 14.28 0.10 0.08 1.0 15.3 0.10 0.08
1.25 14.1 0.10 .073 1.25 13.2 0.10 0.08 1.25 14.87 0.10 0.08
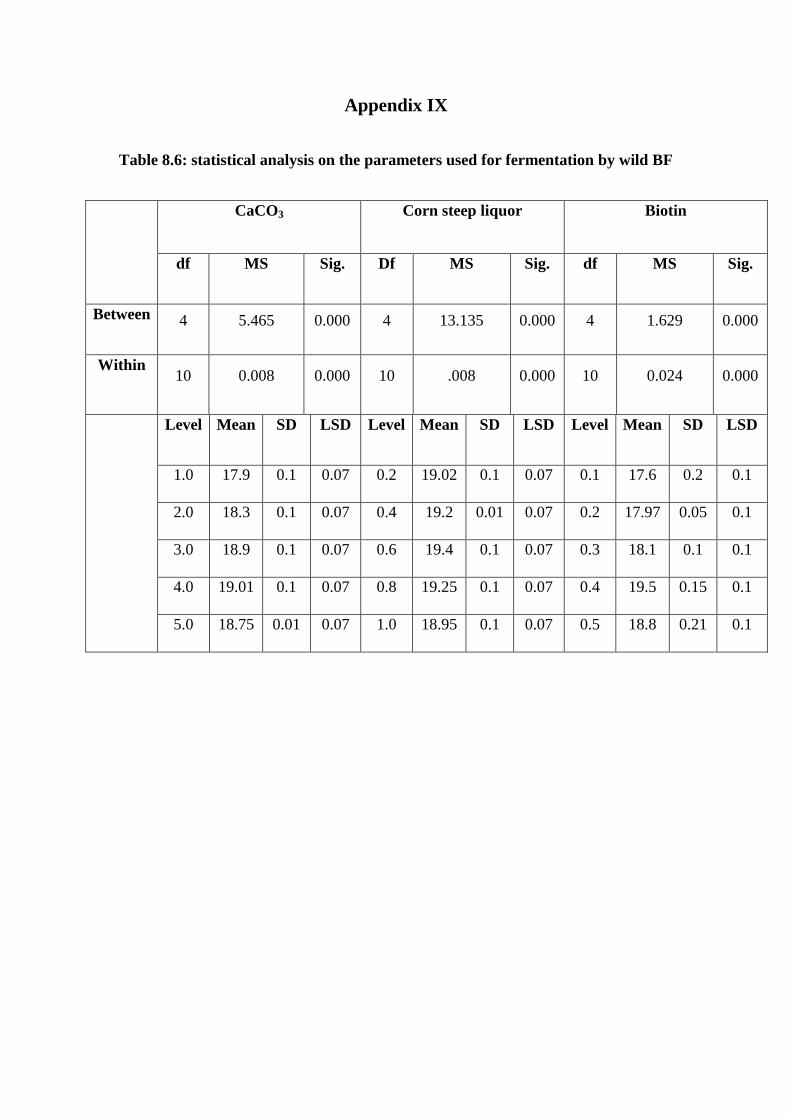
Appendix IX
Table 8.6: statistical analysis on the parameters used for fermentation by wild BF
CaCO3 Corn steep liquor Biotin
df MS Sig. Df MS Sig. df MS Sig.
Between 4 5.465 0.000 4 13.135 0.000 4 1.629 0.000
Within 10 0.008 0.000 10 .008 0.000 10 0.024 0.000
Level Mean SD LSD Level Mean SD LSD Level Mean SD LSD
1.0 17.9 0.1 0.07 0.2 19.02 0.1 0.07 0.1 17.6 0.2 0.1
2.0 18.3 0.1 0.07 0.4 19.2 0.01 0.07 0.2 17.97 0.05 0.1
3.0 18.9 0.1 0.07 0.6 19.4 0.1 0.07 0.3 18.1 0.1 0.1
4.0 19.01 0.1 0.07 0.8 19.25 0.1 0.07 0.4 19.5 0.15 0.1
5.0 18.75 0.01 0.07 1.0 18.95 0.1 0.07 0.5 18.8 0.21 0.1

Appendix X
Table 8.7: statistical analysis on the parameters used for fermentation by mutant
BFENU2
Molasses (NH4)2SO4 Urea
df MS Sig. Df MS Sig. df MS Sig.
Between 4 72.41 0.000 4 110.024 0.000 4 3.494 0.000
Within 10 0.505 0.000 10 0.053 0.000 10 .039 0.000
Level Mean SD LSD Level Mean SD LSD Level Mean SD LSD
10.00 17.90 1.08 0.58 0.10 12.54 0.02 0.187 0.10 26.42 .11 0.16
15.00 25.87 0.43 0.58 0.20 19.69 0.26 0.187 0.20 29.34 .34 0.16
20.00 25.00 0.26 0.58 0.30 28.86 0.15 0.187 0.30 28.56 .14 0.16
25.00 22.96 0.51 0.58 0.40 24.44 0.41 0.187 0.40 28.07 .04 0.16
30.00 14.40 0.92 0.58 0.50 22.07 0.02 0.187 0.50 27.80 .22 0.16

Appendix XI
Table 8.8: statistical analysis on the parameters used for fermentation by mutant
BFENU2
CaCO3 Soybean hydrolysate Tryptone
df MS Sig. Df MS Sig. df MS Sig.
Between 4 14.01 0.000 3 1.26 0.000 4 1.71 0.000
Within 10 0.02 0.000 8 0.001 0.000 10 0.02 0.000
Level Mean SD LSD Level Mean SD LSD Level Mean SD LSD
1.0 28.42 0.07 0.10 0.25 30.05 0.01 0.03 0.10 31.85 0.27 0.12
2.0 29.84 0.07 0.10 0.50 31.20 0.04 0.03 0.20 33.0 0.10 0.12
3.0 28.48 0.22 0.10 0.75 31.08 0.02 0.03 0.30 33.92 0.11 0.12
4.0 26.43 0.10 0.10 1.00 29.99 0.05 0.03 0.40 33.27 0.06 0.12
5.0 24.30 0.11 0.10 - - - - 0.50 32.82 0.07 0.12
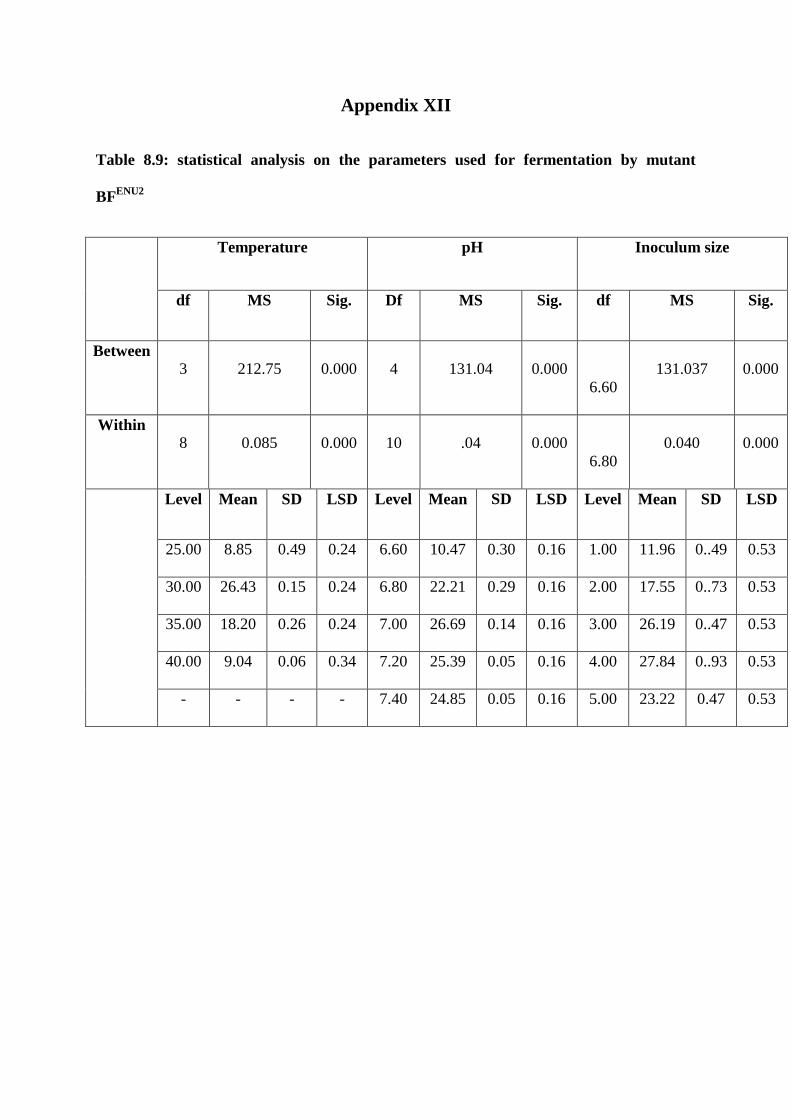
Appendix XII
Table 8.9: statistical analysis on the parameters used for fermentation by mutant
BFENU2
Temperature pH Inoculum size
df MS Sig. Df MS Sig. df MS Sig.
Between
3 212.75 0.000 4 131.04 0.000
6.60
131.037 0.000
Within
8 0.085 0.000 10 .04 0.000
6.80
0.040 0.000
Level Mean SD LSD Level Mean SD LSD Level Mean SD LSD
25.00 8.85 0.49 0.24 6.60 10.47 0.30 0.16 1.00 11.96 0..49 0.53
30.00 26.43 0.15 0.24 6.80 22.21 0.29 0.16 2.00 17.55 0..73 0.53
35.00 18.20 0.26 0.24 7.00 26.69 0.14 0.16 3.00 26.19 0..47 0.53
40.00 9.04 0.06 0.34 7.20 25.39 0.05 0.16 4.00 27.84 0..93 0.53
- - - - 7.40 24.85 0.05 0.16 5.00 23.22 0.47 0.53

Appendix XIII
Table 8.10: Feed composition of control and test broilers
Sr. no. Ingredients Quantity (Kg)
(control diet)
Quantity (Kg)
(test diet)
1 Maiz 30.60 30.60
2 Sunflower Meal
27.5%
6.45
6.45
3 Soyabean Meal 45 % 5.337 5.337
4 Poultry Meal 2.00 2.00
5 Fish Meal 53 % 0.500 0.500
6 Limestone 0.496 0.496
7 Canola Meal 1.25 1.25
8 MDCP 0.339
0.339
9 Lysine Sulphate 0.35
(commercial lysine)
0.35
(produced lysine by
fermentation)
10 Alimet 0.075 0.075
11 Phytaze 0.0025
0.0025
12 Salt 0.096 0.096
13 L Threonine 0.032 0.032
14 Supplement 0.100
0.100
15 Rape Sead Meal 2.500 2.500

Appendix XIV

Appendix XV

Appendix XVI
Table 8.11: Average weight gained (kg) by test and control broilers (each replica = 20
chicks) during the five weeks of Biological trial
Time (Weeks)
Week 1 Week 2 Week 3 Week 4 Week 5
Control Test Control Test Control Test Control Test Control Test
C1 C2 T1 T2 C1 C2 T1 T2 C1 C2 T1 T2 C1 C2 T1 T2 C1 C2 T1 T2
2.9 2.75 2.8 3.2 5.7 5.47 6 6.8 13 12.8 14.2 14.8 20.8 19 23 24 29 28.8 28.8 30
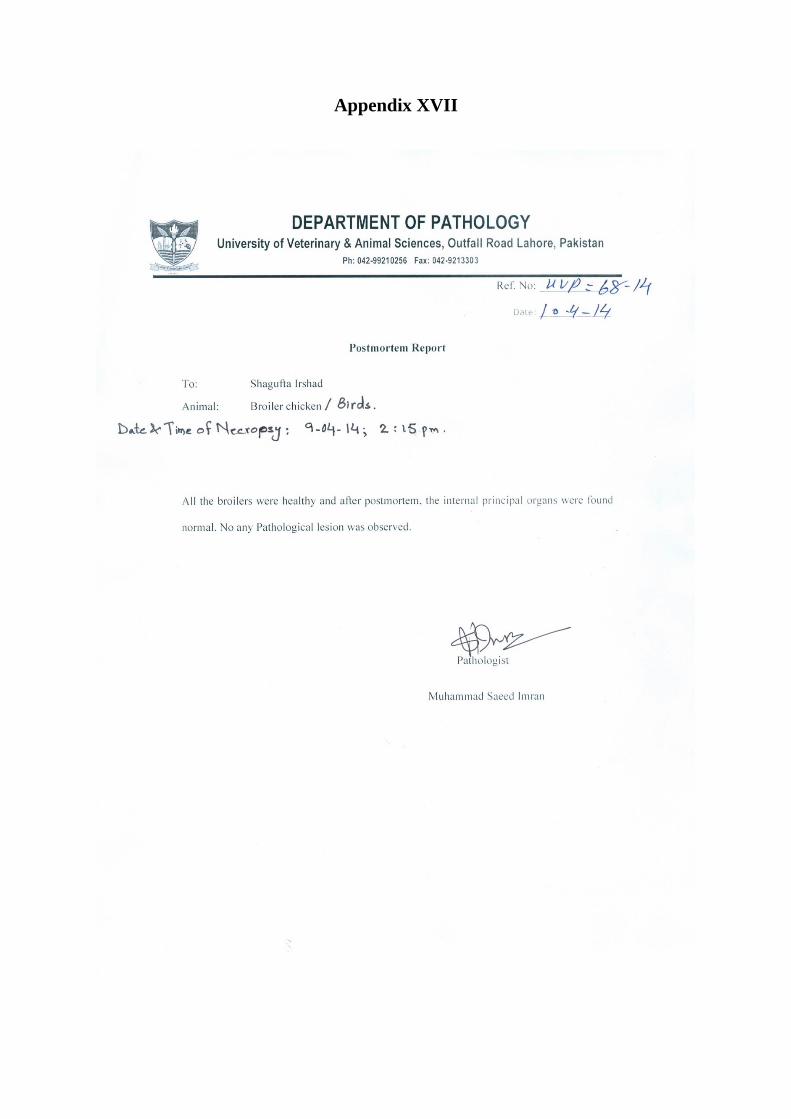
Appendix XVII