Embed Size (px)
Citation preview
PRSP
IMPLEMENTATION Progress Report
1st Quarter (Jul-Sept) FY 2003-04
PRSP SECRETARIAT Finance Division
Government of Pakistan
December 2003December 2003
Introduction This is the ninth quarterly report since the release of Interim Poverty
Reduction Strategy Paper (IPRSP) in November 2001, based on broad principles of
engendering growth, investment in human resource development, bringing improvement
in the governance, targeting the poor through public policy interventions and providing
safety nets to the vulnerable. The reform agenda unfolded in December 1999 set the
future direction that continued during the last four years. The elected government
inducted after the elections of October 2002 has shown its resolve to continue this
reform process. The strong political commitment has not only ensured the continuity of
reforms but has enabled institutionalization of the reform framework.
Macroeconomic Performance
2. After having achieved macroeconomic stability with fiscal deficit less than
(4.5 percent of the GDP) the target (4.6 percent of the GDP), current account surplus of
4.8 percent of GDP, national savings of above 20 percent, GDP to debt ratio of 90
percent ( 502 percent of total revenue) and GDP growth rate of 5.1 percent against the
target of 4.5 percent during FY03, the economy is poised for accelerated growth over
the medium term. At the end of the first quarter (July-September) of FY04, the foreign
exchange reserves reached to US $ 11.388 billion, home remittances were US $ 1.488
billion as against $ 1.655 billion during the corresponding period of the last year, inflow
of foreign direct investment was US $ 204.4 million, tax collection were on target (PRs
94.062 billion), and Karachi Stock Exchange Index reached 4027 points with a total
capitalization of PRs 876 billion. Exports grew by 14.65 percent and imports rose by
12.09 percent over the corresponding period of the last year. The growth in large scale
manufacturing for July-October 2003 was 14 percent. Weighted average lending rate
during the period was 7.58 percent and CPI was 1.78 percent.
PRSP Expenditures’ Range
3. Pursuant to extensive discussion with the World Bank and the Fund, the PRSP’s
expenditures range has been expanded to include spending on Law and Order,
Administration of Justice, and Village (rural) electrification because of their close nexus

with determinants of poverty as a result of dialogues with the grass root communities
through Rural Support Program Network and the Participatory Poverty Assessment
(PPA). With the inclusion of these sectors, PRSP expenditures would rise but it would
be compared with the previous year on comparable basis. It needs to be appreciated
that PRSP expenditures do not capture a large quantum of annual Public Sector
Development Program and current expenditures, both at the federal and provincial
levels; such as agriculture, highways, works, information technology,
telecommunications, higher education commission, women development, power sectors
etc. that directly or indirectly contribute to poverty reduction.
Progress About CWIQ and Full PRSP
4. The Government completed the consultative process for the full Poverty
Reduction Strategy Paper. The spadework for the Core Welfare Indicators
Questionnaire (CWIQ) pilot to capture intermediate indicators entered a critical phase. It
was expected that CWIQ pilot would be launched by early November 2003 and the full
PRSP finalized by end-December 2003. Reportedly, the provinces of NWFP, Punjab,
and Baluchistan have also completed Poverty Reduction Strategy Paper and were
pending approval by their respective Chief Ministers/governments. The PRSP of the
Sindh is expected to be forthcoming by end-December 2003 or January 2004. The full
PRSP would reflect regional perspectives as articulated in the Provincial draft PRSPs.
PRSP Spending
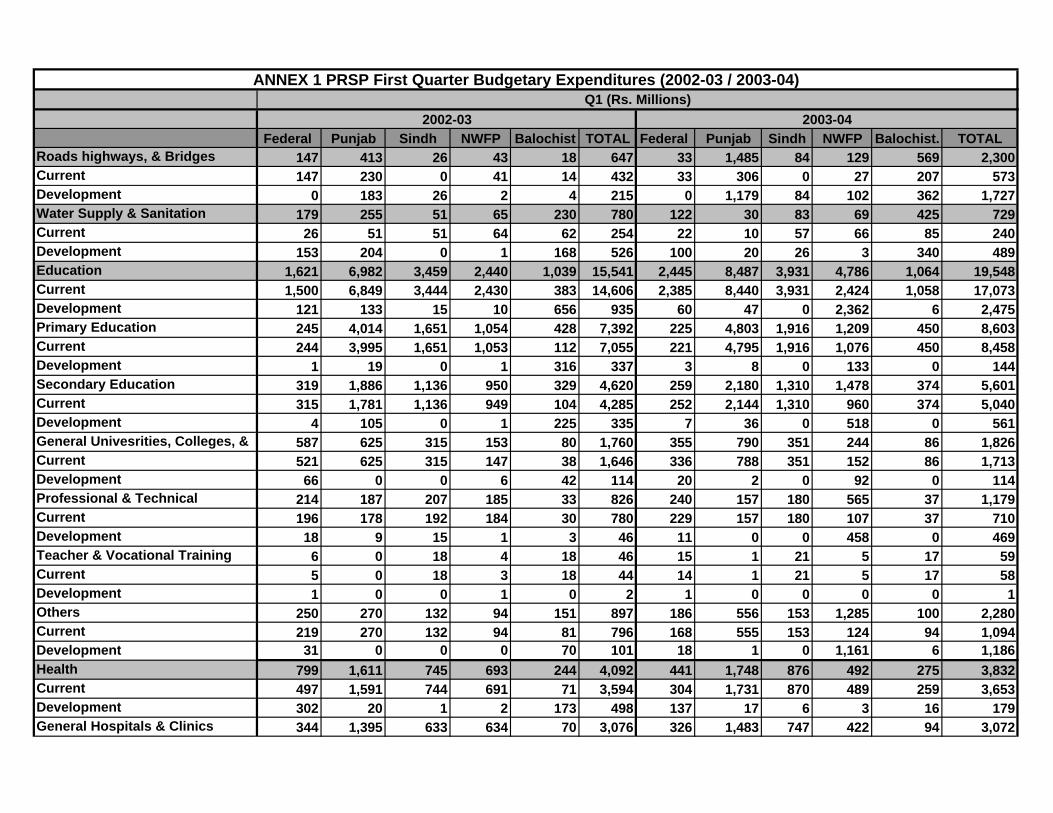
5. Based on June (Final) reconciled civil accounts, the PRSP expenditures with
extended range and scope during 2002-03 was Rs 208.840 billion as compared to Rs
167.280 billion in 2001-02 for the same sectors, an aggregate increase of 24.8 percent
(or 5.20 percent of GDP in FY03 as compared to 4.49 percent of GDP in FY02) against
Rs 158 billion reported during the June 2003 report. The PRSP expenditures during
the first quarter (July-September) of FY04 (Annex 1) were Rs 49.334 billion against
Rs 36.992 billion for the corresponding period of FY03, an increase of 33.4 percent. A
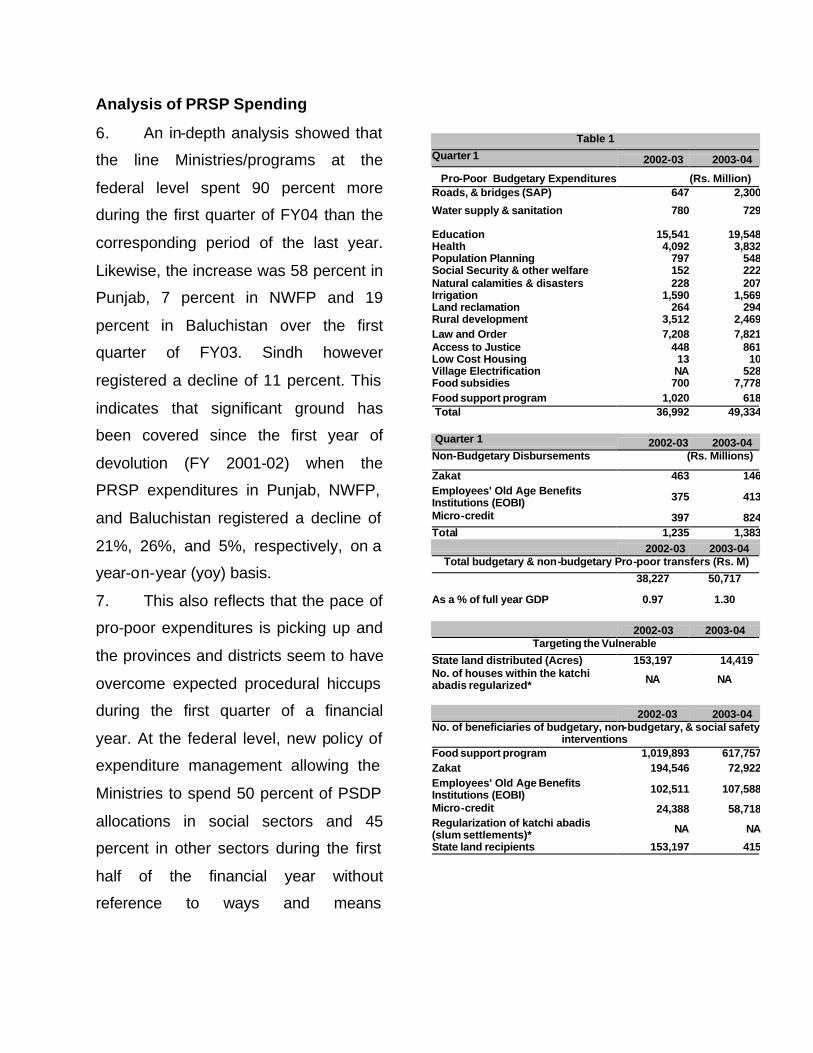
snapshot of these expenditures is indicated at Table 1.
Analysis of PRSP Spending
6. An in-depth analysis showed that
the line Ministries/programs at the
federal level spent 90 percent more
during the first quarter of FY04 than the
corresponding period of the last year.
Likewise, the increase was 58 percent in
Punjab, 7 percent in NWFP and 19
percent in Baluchistan over the first
quarter of FY03. Sindh however
registered a decline of 11 percent. This
indicates that significant ground has
been covered since the first year of
devolution (FY 2001-02) when the
PRSP expenditures in Punjab, NWFP,
and Baluchistan registered a decline of
21%, 26%, and 5%, respectively, on a
year-on-year (yoy) basis.
7. This also reflects that the pace of
pro-poor expenditures is picking up and
the provinces and districts seem to have
overcome expected procedural hiccups
during the first quarter of a financial
year. At the federal level, new policy of
expenditure management allowing the
Ministries to spend 50 percent of PSDP
allocations in social sectors and 45
percent in other sectors during the first
half of the financial year without
reference to ways and means
Table 1
Quarter 1 2002-03 2003-04
Pro-Poor Budgetary Expenditures (Rs. Million) Roads, & bridges (SAP) 647 2,300
Water supply & sanitation 780 729
Education 15,541 19,548Health 4,092 3,832Population Planning 797 548Social Security & other welfare 152 222Natural calamities & disasters 228 207Irrigation 1,590 1,569Land reclamation 264 294Rural development 3,512 2,469Law and Order 7,208 7,821Access to Justice 448 861Low Cost Housing 13 10Village Electrification NA 528Food subsidies 700 7,778Food support program 1,020 618 Total 36,992 49,334 Quarter 1 2002-03 2003-04 Non-Budgetary Disbursements (Rs. Millions)
Zakat 463 146Employees' Old Age Benefits Institutions (EOBI) 375 413
Micro-credit 397 824Total 1,235 1,383
2002-03 2003-04 Total budgetary & non-budgetary Pro-poor transfers (Rs. M)
38,227 50,717
As a % of full year GDP 0.97 1.30
2002-03 2003-04 Targeting the Vulnerable
State land distributed (Acres) 153,197 14,419 No. of houses within the katchi abadis regularized* NA NA
2002-03 2003-04
No. of beneficiaries of budgetary, non-budgetary, & social safety interventions
Food support program 1,019,893 617,757Zakat 194,546 72,922Employees' Old Age Benefits Institutions (EOBI) 102,511 107,588
Micro-credit 24,388 58,718Regularization of katchi abadis (slum settlements)* NA NA
State land recipients 153,197 415
position has started paying dividends in the form of substantial increase at the federal
level. Sectoral analysis exhibited increase in critical areas like 256 percent in roads and
bridges, 26 percent education, 46 percent in social security, 11 percent in land
reclamation, 9 percent in law and order, 92 percent in administration of justice, and
1011 percent in food subsidy. However, some of the important sectors have registered
decline such as 6.35 percent in health, 31.5 percent in population planning, 1.60
percent in irrigation, and 29.7 percent in rural development. The provinces have been
advised to gear up the pace of expenditures in the sectors that are lagging and keep
track to ensure meeting quarterly quantitative targets. It is expected that by the end of
second quarter, the position would be improved. It may be noted that water and
sanitation is now a completely devolved function to Tehsil Municipal Administration in all
district governments except city governments and expenditure is booked against
transfers to the local fund.
8. As the devolved financial management system is taking shape, the devolution
process is being consolidated, new operational snags are being addressed and the
administrative capacity of district governments is being augmented through increased
technical assistance, operational support, and training, it is expected that it would
increase effectiveness of the spending and improved service delivery. At the same time
a fast track approach would have to be adopted in ironing out issues of releases,
bookings, disbursements, and utilization -- between provincial, district, and Tehsil
governments – to ensure that pro-poor expenditures remain in line with the
government’s medium-term targets. These measures would have to be supplemented
by institutionalizing effecti ve monitoring and evaluation mechanisms to measure the
social impact of these outlays especially at the district level.
Non-Budgetary Disbursements and Social Safety Nets
8. The non-budgetary disbursements have also shown significant increase during
the first quarter of the current financial year, especially in respect of Employees Old-Age
Benefit and Micro-Credit.
9. The micro-credit disbursements through Pakistan Poverty Alleviation Fund
(PPAF), Khushali Bank (KB), and Agriculture Development Bank of Pakistan (ADBP) is
an important initiative aimed at stimulating income-generating investment, asset
creation, and income increase for the poor. Apart from setting a sizeable fund and a
well-capitalized bank, a regulatory framework has been developed enabling private
sector to set-up micro-finance institutions. The central bank has been given necessary
responsibility to oversee the licensing process and operations of these institutions. The
outreach of existing institutions in Pakistan is around 5% of the 6.6 million poor
household which is likely to expand in the future. During Q1-FY 2003-04, micro-credit
disbursements stood at Rs 824 million among 84,808 beneficiaries (Annex 5). This
disbursement is 165 percent higher than the last year, which is a welcome increase. It
indicates accelerated economic activities at the grass-root level, asset creation for the
poor, and income increase that would lead to reduction in poverty. This program is
enabling the poor, especially the rural poor, to diversify their income and employment
base.
10. Through recent initiatives such as Food Support Program (FSP) and land
transfers, the Government has significantly increased assistance to the vulnerable. As a
result, the number of beneficiaries under social safety transfers has been increasing
steadily in terms of coverage. Social safety transfers by the Government can be divided
into three broad categories: cash transfers, in-kind transfers, and public-works
programs.
(a) Cash transfers: The broad cash transfer mechanism providing social
protection to the vulnerable segments of society includes: transfers through
Zakat, Food Support Program (FSP), Employees’ Old Age Benefits
Institutions (EOBI), provincial social security institutions, and micro-credit
disbursements by Khushali Bank (KB), Pakistan Poverty Alleviation Fund
(PPAF) and the Agricultural Development Bank of Pakistan (ADBP). The
PRSP process envisages a strengthening and improved targeting of these
transfers to better align them with the overall objectives of eliminating poverty
and human deprivation.
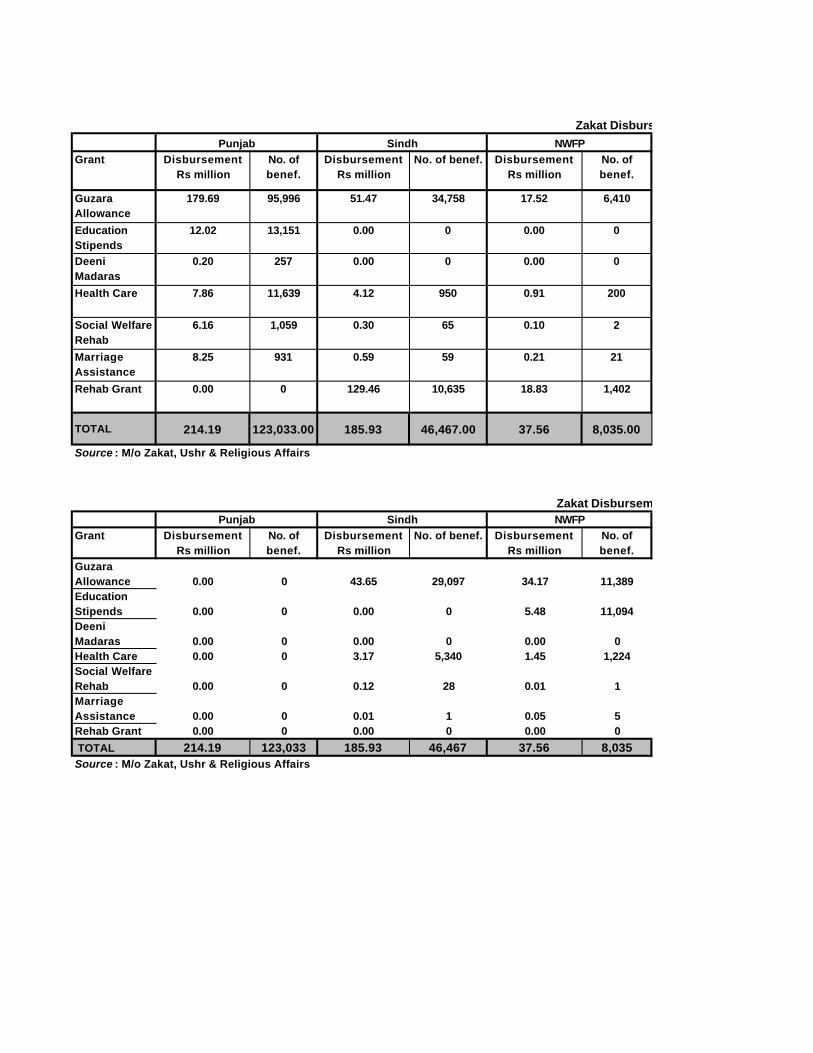
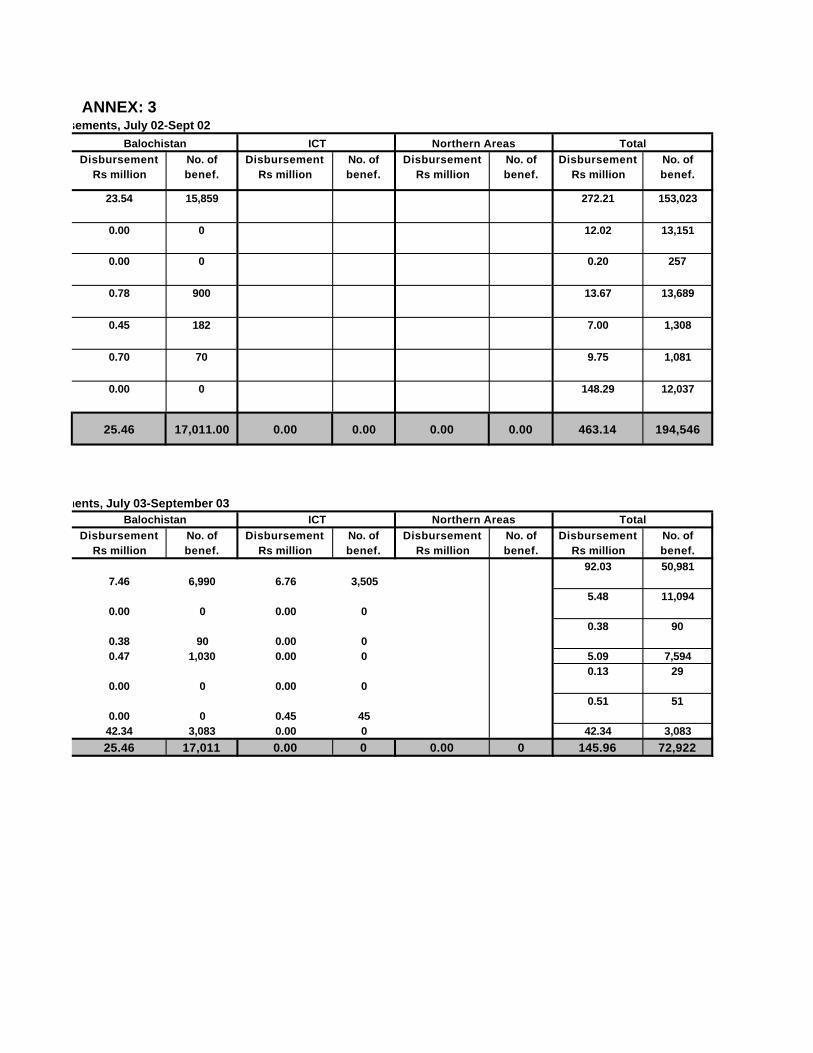
(i) Zakat. Zakat is a non-budgetary transfer that is raised through a
2.5% annual levy, on the value of fixed financial assets above a
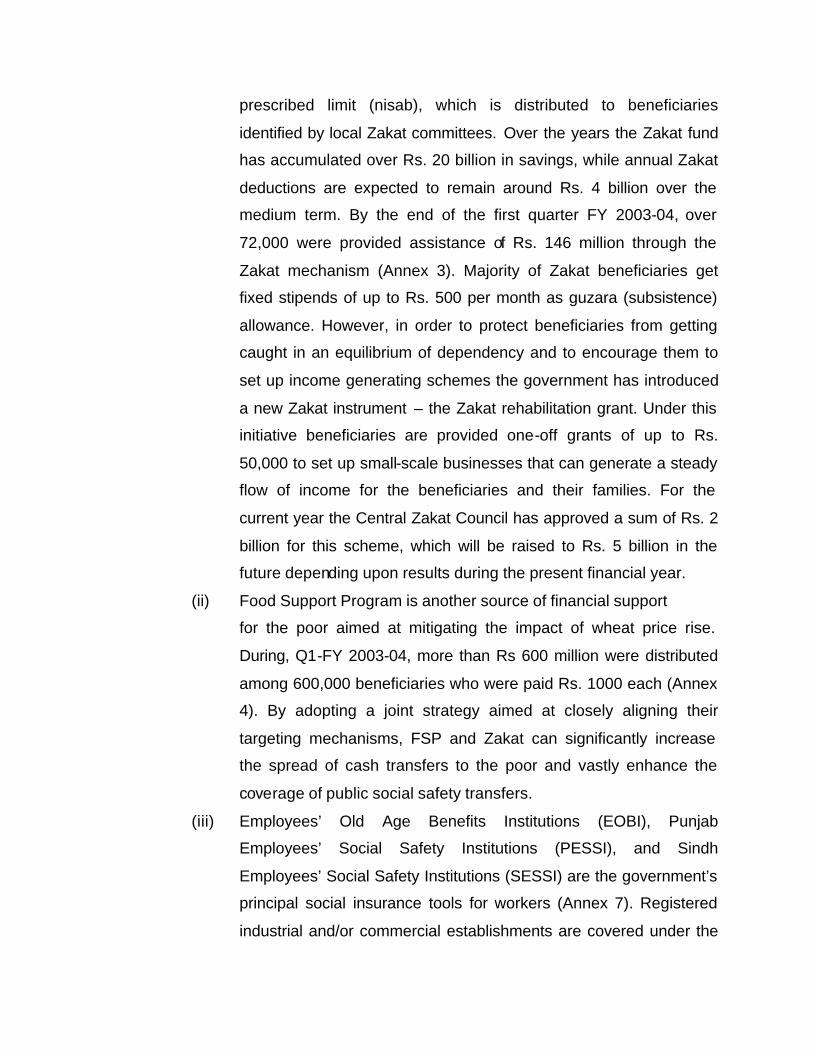
prescribed limit (nisab), which is distributed to beneficiaries
identified by local Zakat committees. Over the years the Zakat fund
has accumulated over Rs. 20 billion in savings, while annual Zakat
deductions are expected to remain around Rs. 4 billion over the
medium term. By the end of the first quarter FY 2003-04, over
72,000 were provided assistance of Rs. 146 million through the
Zakat mechanism (Annex 3). Majority of Zakat beneficiaries get
fixed stipends of up to Rs. 500 per month as guzara (subsistence)
allowance. However, in order to protect beneficiaries from getting
caught in an equilibrium of dependency and to encourage them to
set up income generating schemes the government has introduced
a new Zakat instrument – the Zakat rehabilitation grant. Under this
initiative beneficiaries are provided one-off grants of up to Rs.
50,000 to set up small-scale businesses that can generate a steady
flow of income for the beneficiaries and their families. For the
current year the Central Zakat Council has approved a sum of Rs. 2
billion for this scheme, which will be raised to Rs. 5 billion in the
future depending upon results during the present financial year.
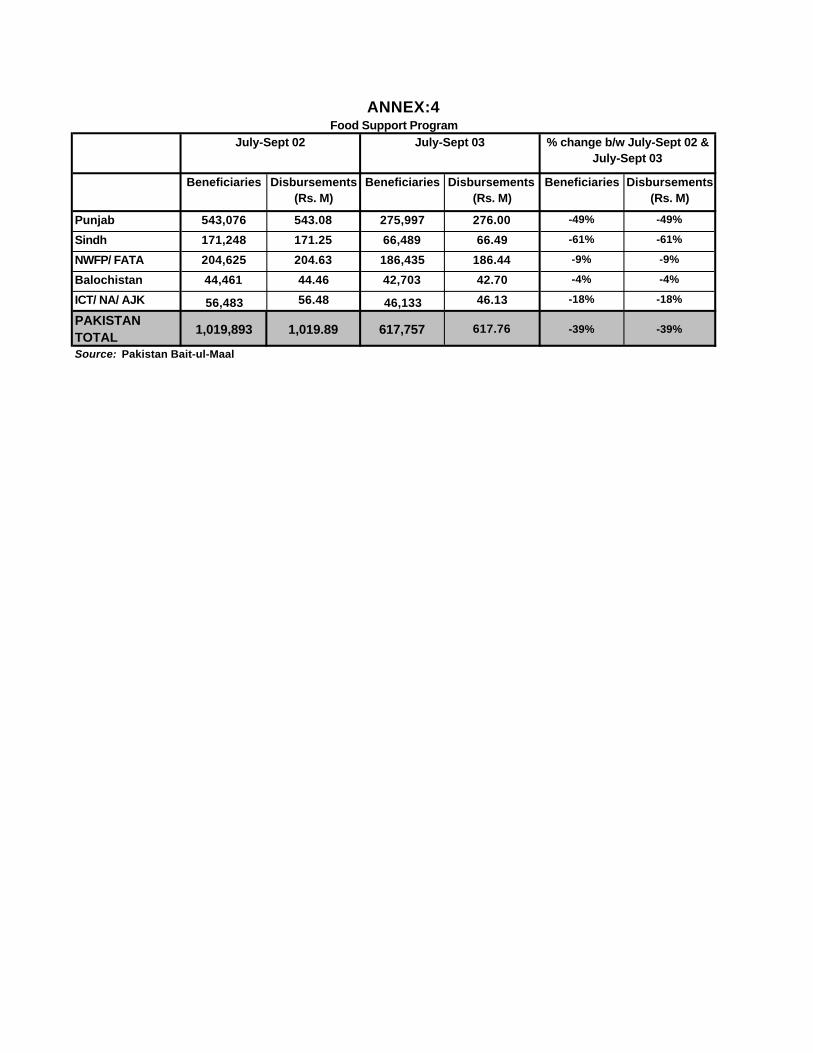
(ii) Food Support Program is another source of financial support
for the poor aimed at mitigating the impact of wheat price rise.
During, Q1-FY 2003-04, more than Rs 600 million were distributed
among 600,000 beneficiaries who were paid Rs. 1000 each (Annex
4). By adopting a joint strategy aimed at closely aligning their
targeting mechanisms, FSP and Zakat can significantly increase
the spread of cash transfers to the poor and vastly enhance the
coverage of public social safety transfers.
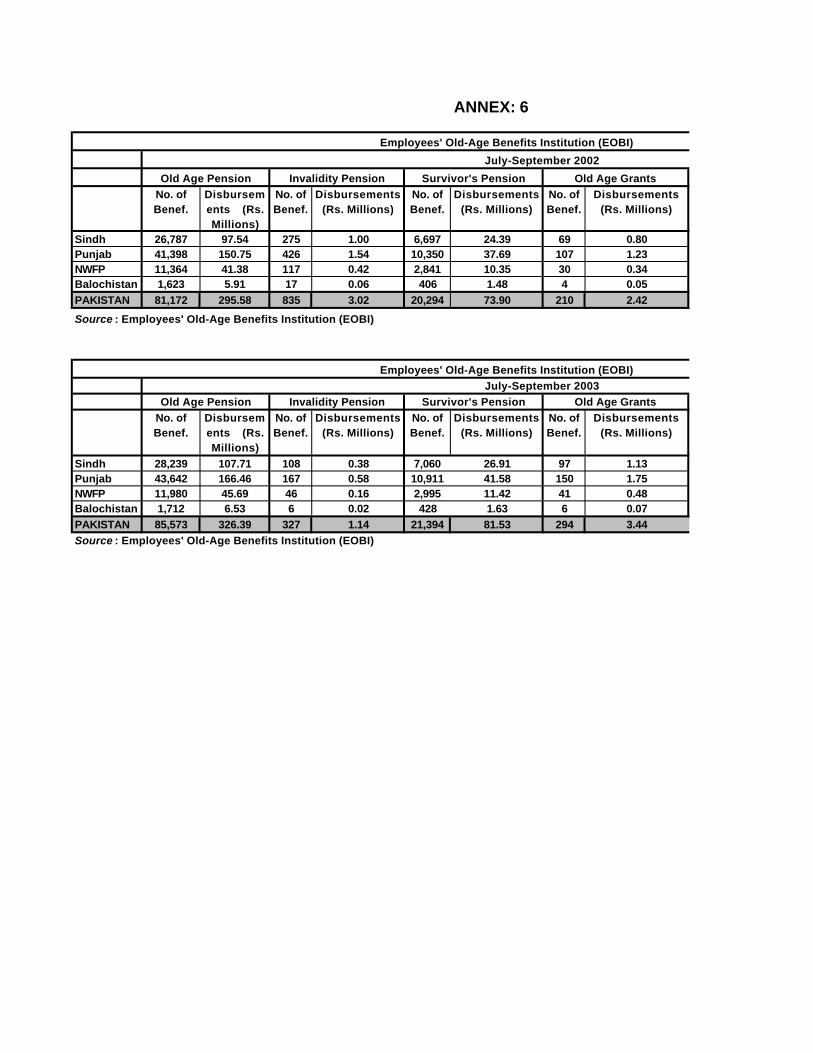
(iii) Employees’ Old Age Benefits Institutions (EOBI), Punjab
Employees’ Social Safety Institutions (PESSI), and Sindh
Employees’ Social Safety Institutions (SESSI) are the government’s
principal social insurance tools for workers (Annex 7). Registered
industrial and/or commercial establishments are covered under the
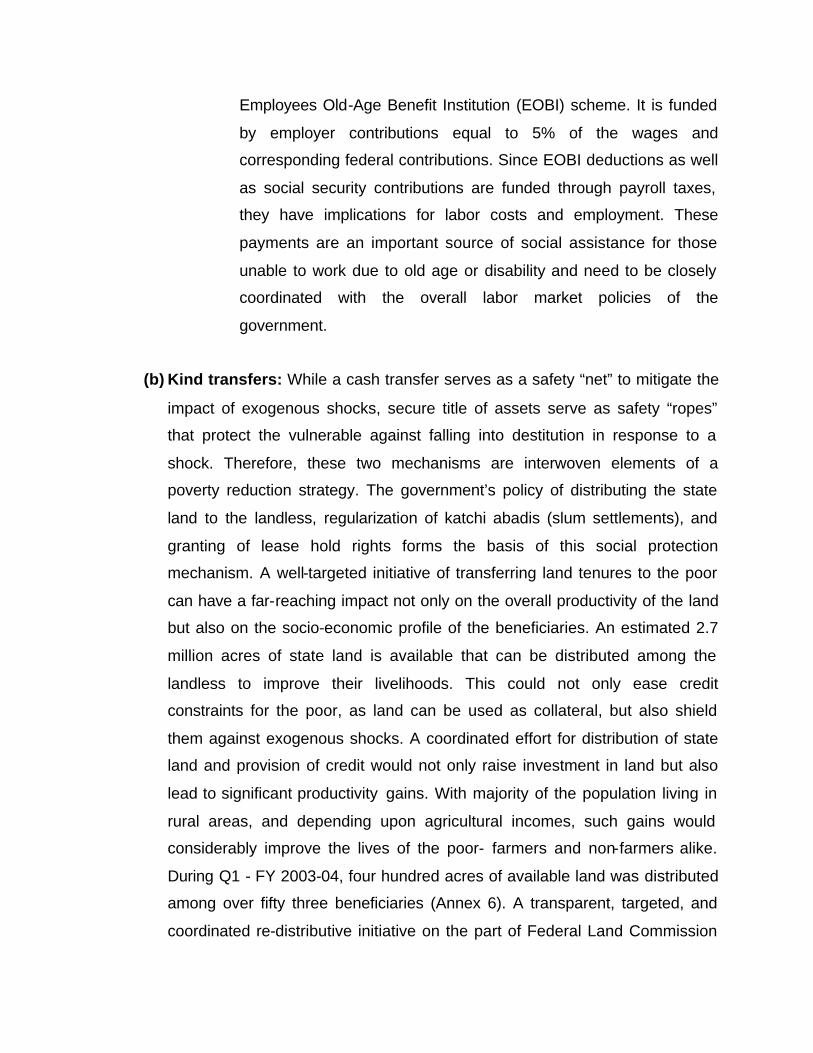
Employees Old-Age Benefit Institution (EOBI) scheme. It is funded
by employer contributions equal to 5% of the wages and
corresponding federal contributions. Since EOBI deductions as well
as social security contributions are funded through payroll taxes,
they have implications for labor costs and employment. These
payments are an important source of social assistance for those
unable to work due to old age or disability and need to be closely
coordinated with the overall labor market policies of the
government.
(b) Kind transfers: While a cash transfer serves as a safety “net” to mitigate the
impact of exogenous shocks, secure title of assets serve as safety “ropes”
that protect the vulnerable against falling into destitution in response to a
shock. Therefore, these two mechanisms are interwoven elements of a
poverty reduction strategy. The government’s policy of distributing the state
land to the landless, regularization of katchi abadis (slum settlements), and
granting of lease hold rights forms the basis of this social protection
mechanism. A well-targeted initiative of transferring land tenures to the poor
can have a far-reaching impact not only on the overall productivity of the land
but also on the socio-economic profile of the beneficiaries. An estimated 2.7
million acres of state land is available that can be distributed among the
landless to improve their livelihoods. This could not only ease credit
constraints for the poor, as land can be used as collateral, but also shield
them against exogenous shocks. A coordinated effort for distribution of state
land and provision of credit would not only raise investment in land but also
lead to significant productivity gains. With majority of the population living in
rural areas, and depending upon agricultural incomes, such gains would
considerably improve the lives of the poor- farmers and non-farmers alike.
During Q1 - FY 2003-04, four hundred acres of available land was distributed
among over fifty three beneficiaries (Annex 6). A transparent, targeted, and
coordinated re-distributive initiative on the part of Federal Land Commission
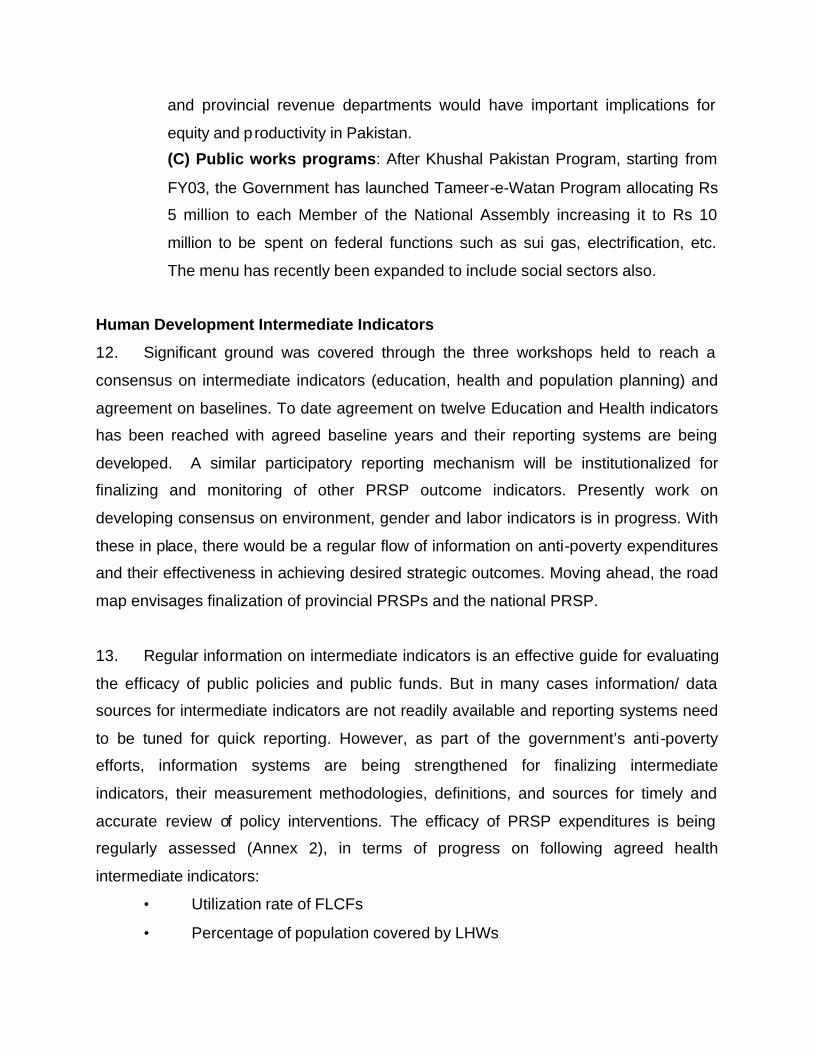
and provincial revenue departments would have important implications for
equity and productivity in Pakistan.
(C) Public works programs: After Khushal Pakistan Program, starting from
FY03, the Government has launched Tameer-e-Watan Program allocating Rs
5 million to each Member of the National Assembly increasing it to Rs 10
million to be spent on federal functions such as sui gas, electrification, etc.
The menu has recently been expanded to include social sectors also.
Human Development Intermediate Indicators
12. Significant ground was covered through the three workshops held to reach a
consensus on intermediate indicators (education, health and population planning) and
agreement on baselines. To date agreement on twelve Education and Health indicators
has been reached with agreed baseline years and their reporting systems are being
developed. A similar participatory reporting mechanism will be institutionalized for
finalizing and monitoring of other PRSP outcome indicators. Presently work on
developing consensus on environment, gender and labor indicators is in progress. With
these in place, there would be a regular flow of information on anti-poverty expenditures
and their effectiveness in achieving desired strategic outcomes. Moving ahead, the road
map envisages finalization of provincial PRSPs and the national PRSP.
13. Regular information on intermediate indicators is an effective guide for evaluating
the efficacy of public policies and public funds. But in many cases information/ data
sources for intermediate indicators are not readily available and reporting systems need
to be tuned for quick reporting. However, as part of the government’s anti-poverty
efforts, information systems are being strengthened for finalizing intermediate
indicators, their measurement methodologies, definitions, and sources for timely and
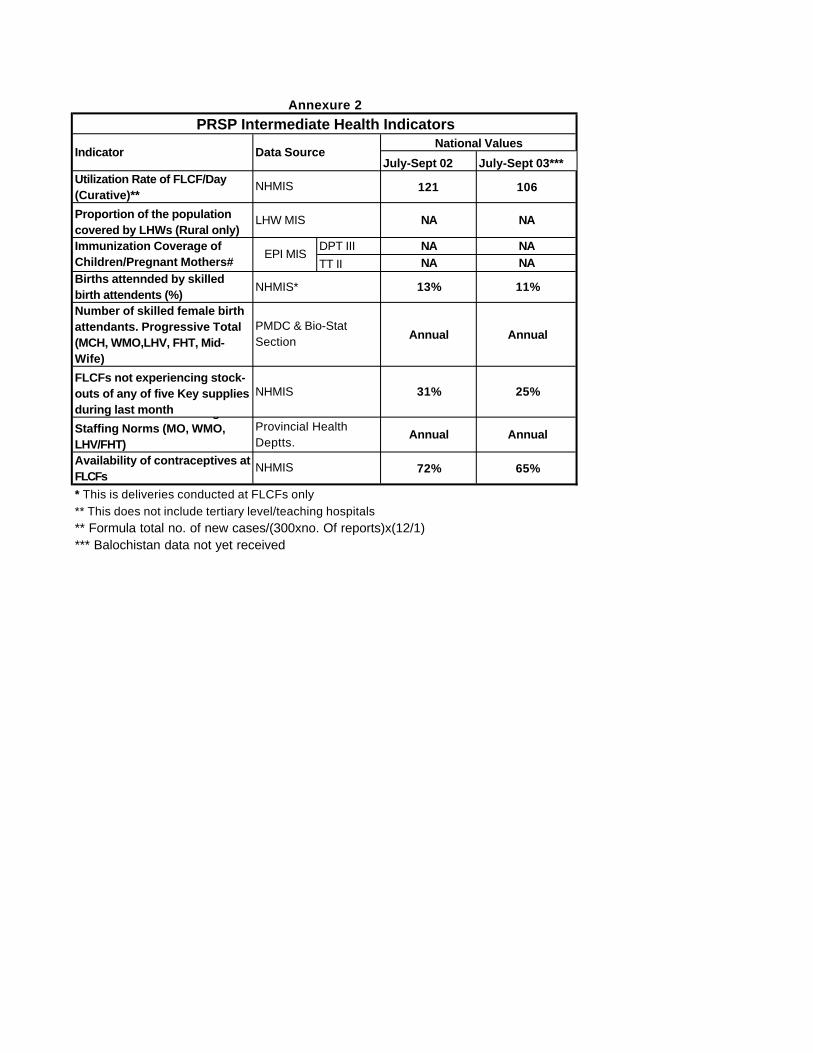
accurate review of policy interventions. The efficacy of PRSP expenditures is being
regularly assessed (Annex 2), in terms of progress on following agreed health
intermediate indicators:
• Utilization rate of FLCFs
• Percentage of population covered by LHWs
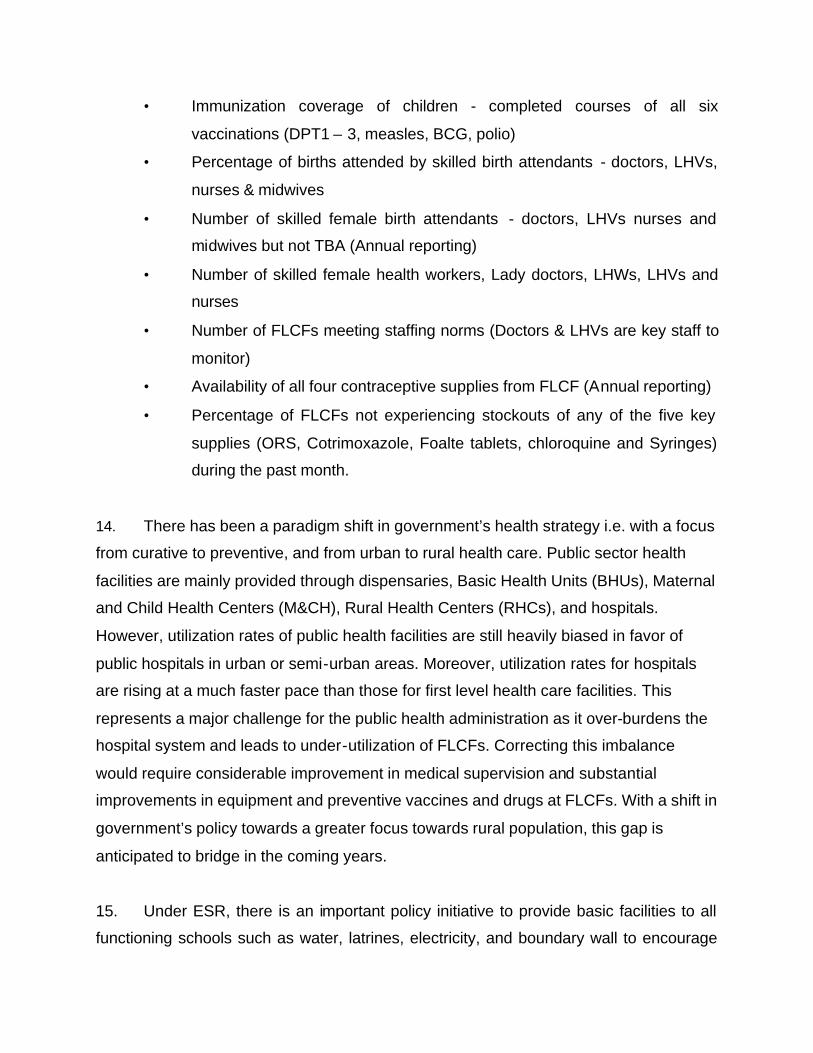
• Immunization coverage of children - completed courses of all six
vaccinations (DPT1 – 3, measles, BCG, polio)
• Percentage of births attended by skilled birth attendants - doctors, LHVs,
nurses & midwives
• Number of skilled female birth attendants - doctors, LHVs nurses and
midwives but not TBA (Annual reporting)
• Number of skilled female health workers, Lady doctors, LHWs, LHVs and
nurses
• Number of FLCFs meeting staffing norms (Doctors & LHVs are key staff to
monitor)
• Availability of all four contraceptive supplies from FLCF (Annual reporting)
• Percentage of FLCFs not experiencing stockouts of any of the five key
supplies (ORS, Cotrimoxazole, Foalte tablets, chloroquine and Syringes)
during the past month.
14. There has been a paradigm shift in government’s health strategy i.e. with a focus
from curative to preventive, and from urban to rural health care. Public sector health
facilities are mainly provided through dispensaries, Basic Health Units (BHUs), Maternal
and Child Health Centers (M&CH), Rural Health Centers (RHCs), and hospitals.
However, utilization rates of public health facilities are still heavily biased in favor of
public hospitals in urban or semi-urban areas. Moreover, utilization rates for hospitals
are rising at a much faster pace than those for first level health care facilities. This
represents a major challenge for the public health administration as it over-burdens the
hospital system and leads to under-utilization of FLCFs. Correcting this imbalance
would require considerable improvement in medical supervision and substantial
improvements in equipment and preventive vaccines and drugs at FLCFs. With a shift in
government’s policy towards a greater focus towards rural population, this gap is
anticipated to bridge in the coming years.
15. Under ESR, there is an important policy initiative to provide basic facilities to all
functioning schools such as water, latrines, electricity, and boundary wall to encourage
school enrolment especially among girls. At present the National Education
Management Information System (NEMIS), Ministry of Education, reports this
information on an annual basis. However, the government will work with the provincial
education departments and NEMIS to build a reporting system that will report progress
on these education sector indicators on a six-monthly basis. This will allow the
government to gauge progress in increasing the number of functional schools with
facilities including water, latrines, electricity, and boundary wall and thus remove
constraints that impede the demand for education especially for female enrolment.
CWIQ Survey
19. The Management Information Systems for Education and Health (EMIS and
HMIS) are key sources of information for intermediate indicators. However, the
Government will launch a full-scale CWIQ Survey to capture information for the 13
intermediate indicators at the district level. It will also act as third party validation for
NEMIS and HMIS.
Report of the Technical Committee
20. The Government constituted a Technical Committee under the chairmanship of
the Director, Pakistan Institute Development Economics with representatives from
public as well as private sector to look into the sample frame of Pakistan Integrated
Household Survey. The Committee after detailed deliberations concluded that the
sample frame is in order. However, there were non-sample errors and a need for
effective supervision at each stage of survey including post-enumeration validation
sample survey.
Federal Punjab Sindh NWFP Balochist TOTAL Federal Punjab Sindh NWFP Balochist. TOTALRoads highways, & Bridges 147 413 26 43 18 647 33 1,485 84 129 569 2,300Current 147 230 0 41 14 432 33 306 0 27 207 573Development 0 183 26 2 4 215 0 1,179 84 102 362 1,727Water Supply & Sanitation 179 255 51 65 230 780 122 30 83 69 425 729Current 26 51 51 64 62 254 22 10 57 66 85 240Development 153 204 0 1 168 526 100 20 26 3 340 489Education 1,621 6,982 3,459 2,440 1,039 15,541 2,445 8,487 3,931 4,786 1,064 19,548Current 1,500 6,849 3,444 2,430 383 14,606 2,385 8,440 3,931 2,424 1,058 17,073Development 121 133 15 10 656 935 60 47 0 2,362 6 2,475Primary Education 245 4,014 1,651 1,054 428 7,392 225 4,803 1,916 1,209 450 8,603Current 244 3,995 1,651 1,053 112 7,055 221 4,795 1,916 1,076 450 8,458Development 1 19 0 1 316 337 3 8 0 133 0 144Secondary Education 319 1,886 1,136 950 329 4,620 259 2,180 1,310 1,478 374 5,601Current 315 1,781 1,136 949 104 4,285 252 2,144 1,310 960 374 5,040Development 4 105 0 1 225 335 7 36 0 518 0 561General Univesrities, Colleges, & Institutes
587 625 315 153 80 1,760 355 790 351 244 86 1,826Current 521 625 315 147 38 1,646 336 788 351 152 86 1,713Development 66 0 0 6 42 114 20 2 0 92 0 114Professional & Technical Universities, Collegees &
214 187 207 185 33 826 240 157 180 565 37 1,179Current 196 178 192 184 30 780 229 157 180 107 37 710Development 18 9 15 1 3 46 11 0 0 458 0 469Teacher & Vocational Training 6 0 18 4 18 46 15 1 21 5 17 59Current 5 0 18 3 18 44 14 1 21 5 17 58Development 1 0 0 1 0 2 1 0 0 0 0 1Others 250 270 132 94 151 897 186 556 153 1,285 100 2,280Current 219 270 132 94 81 796 168 555 153 124 94 1,094Development 31 0 0 0 70 101 18 1 0 1,161 6 1,186Health 799 1,611 745 693 244 4,092 441 1,748 876 492 275 3,832Current 497 1,591 744 691 71 3,594 304 1,731 870 489 259 3,653Development 302 20 1 2 173 498 137 17 6 3 16 179General Hospitals & Clinics 344 1,395 633 634 70 3,076 326 1,483 747 422 94 3,072
ANNEX 1 PRSP First Quarter Budgetary Expenditures (2002-03 / 2003-04)Q1 (Rs. Millions)
2002-03 2003-04
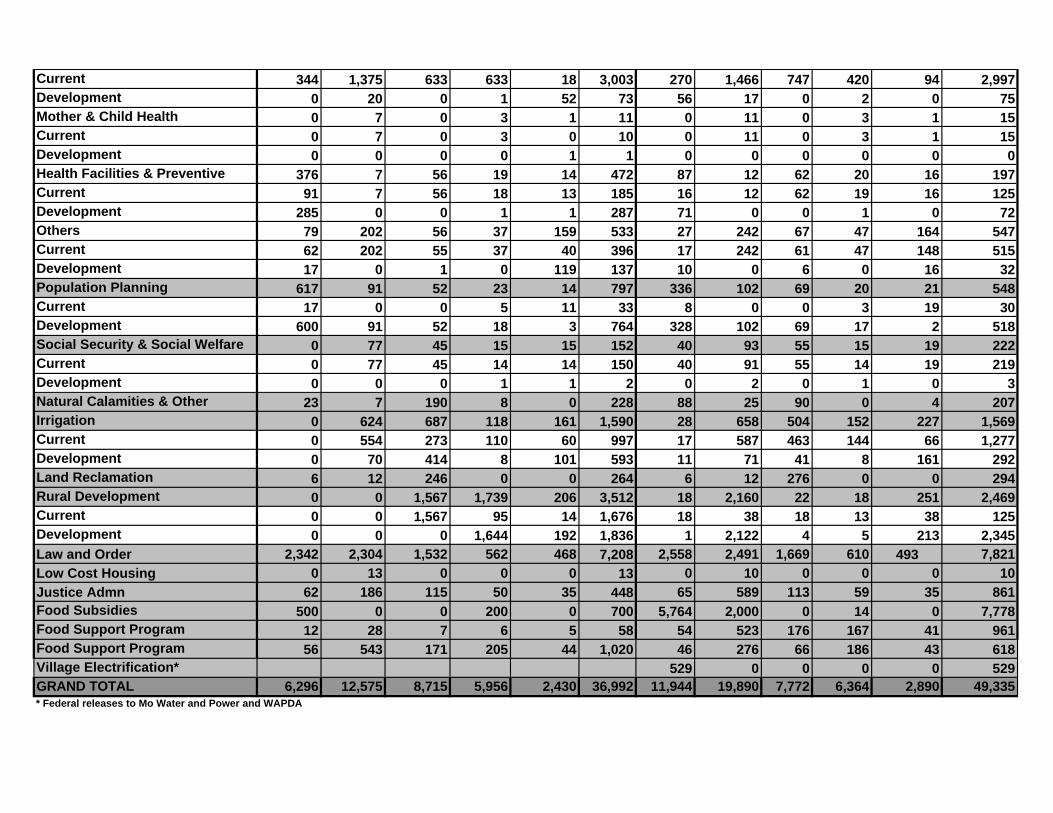
Current 344 1,375 633 633 18 3,003 270 1,466 747 420 94 2,997Development 0 20 0 1 52 73 56 17 0 2 0 75Mother & Child Health 0 7 0 3 1 11 0 11 0 3 1 15Current 0 7 0 3 0 10 0 11 0 3 1 15Development 0 0 0 0 1 1 0 0 0 0 0 0Health Facilities & Preventive Measures
376 7 56 19 14 472 87 12 62 20 16 197Current 91 7 56 18 13 185 16 12 62 19 16 125Development 285 0 0 1 1 287 71 0 0 1 0 72Others 79 202 56 37 159 533 27 242 67 47 164 547Current 62 202 55 37 40 396 17 242 61 47 148 515Development 17 0 1 0 119 137 10 0 6 0 16 32Population Planning 617 91 52 23 14 797 336 102 69 20 21 548Current 17 0 0 5 11 33 8 0 0 3 19 30Development 600 91 52 18 3 764 328 102 69 17 2 518Social Security & Social Welfare 0 77 45 15 15 152 40 93 55 15 19 222Current 0 77 45 14 14 150 40 91 55 14 19 219Development 0 0 0 1 1 2 0 2 0 1 0 3Natural Calamities & Other Disasters
23 7 190 8 0 228 88 25 90 0 4 207Irrigation 0 624 687 118 161 1,590 28 658 504 152 227 1,569Current 0 554 273 110 60 997 17 587 463 144 66 1,277Development 0 70 414 8 101 593 11 71 41 8 161 292Land Reclamation 6 12 246 0 0 264 6 12 276 0 0 294Rural Development 0 0 1,567 1,739 206 3,512 18 2,160 22 18 251 2,469Current 0 0 1,567 95 14 1,676 18 38 18 13 38 125Development 0 0 0 1,644 192 1,836 1 2,122 4 5 213 2,345Law and Order 2,342 2,304 1,532 562 468 7,208 2,558 2,491 1,669 610 493 7,821Low Cost Housing 0 13 0 0 0 13 0 10 0 0 0 10Justice Admn 62 186 115 50 35 448 65 589 113 59 35 861Food Subsidies 500 0 0 200 0 700 5,764 2,000 0 14 0 7,778Food Support Program 12 28 7 6 5 58 54 523 176 167 41 961Food Support Program 56 543 171 205 44 1,020 46 276 66 186 43 618Village Electrification* 529 0 0 0 0 529GRAND TOTAL 6,296 12,575 8,715 5,956 2,430 36,992 11,944 19,890 7,772 6,364 2,890 49,335* Federal releases to Mo Water and Power and WAPDA
July-Sept 02 July-Sept 03***Utilization Rate of FLCF/Day (Curative)**
121 106
Proportion of the population covered by LHWs (Rural only)
NA NA
DPT III NA NA
TT II NA NABirths attennded by skilled birth attendents (%)
13% 11%
Number of skilled female birth attendants. Progressive Total (MCH, WMO,LHV, FHT, Mid-Wife)
Annual Annual
FLCFs not experiencing stock-outs of any of five Key supplies during last month
31% 25%
Number of FLCFs meeting Staffing Norms (MO, WMO, LHV/FHT)
Annual Annual
Availability of contraceptives at FLCFs
72% 65%
* This is deliveries conducted at FLCFs only
** Formula total no. of new cases/(300xno. Of reports)x(12/1)*** Balochistan data not yet received
Annexure 2
PRSP Intermediate Health Indicators
Indicator Data SourceNational Values
NHMIS
LHW MIS
Immunization Coverage of Children/Pregnant Mothers#
EPI MIS
NHMIS
** This does not include tertiary level/teaching hospitals
NHMIS*
PMDC & Bio-Stat Section
NHMIS
Provincial Health Deptts.
Grant Disbursement Rs million
No. of benef.
Disbursement Rs million
No. of benef. Disbursement Rs million
No. of benef.
Guzara Allowance
179.69 95,996 51.47 34,758 17.52 6,410
Education Stipends
12.02 13,151 0.00 0 0.00 0
Deeni Madaras
0.20 257 0.00 0 0.00 0
Health Care 7.86 11,639 4.12 950 0.91 200
Social Welfare Rehab
6.16 1,059 0.30 65 0.10 2
Marriage Assistance
8.25 931 0.59 59 0.21 21
Rehab Grant 0.00 0 129.46 10,635 18.83 1,402
TOTAL 214.19 123,033.00 185.93 46,467.00 37.56 8,035.00
Grant Disbursement Rs million
No. of benef.
Disbursement Rs million
No. of benef. Disbursement Rs million
No. of benef.
Guzara Allowance 0.00 0 43.65 29,097 34.17 11,389Education Stipends 0.00 0 0.00 0 5.48 11,094Deeni Madaras 0.00 0 0.00 0 0.00 0Health Care 0.00 0 3.17 5,340 1.45 1,224Social Welfare Rehab 0.00 0 0.12 28 0.01 1Marriage Assistance 0.00 0 0.01 1 0.05 5Rehab Grant 0.00 0 0.00 0 0.00 0
TOTAL 214.19 123,033 185.93 46,467 37.56 8,035
Zakat Disbursements, July 02-Sept 02
Punjab Sindh NWFP
Source : M/o Zakat, Ushr & Religious Affairs
Zakat Disbursements, July 03-September 03Punjab Sindh NWFP
Source : M/o Zakat, Ushr & Religious Affairs
ANNEX: 3
Disbursement Rs million
No. of benef.
Disbursement Rs million
No. of benef.
Disbursement Rs million
No. of benef.
Disbursement Rs million
No. of benef.
23.54 15,859 272.21 153,023
0.00 0 12.02 13,151
0.00 0 0.20 257
0.78 900 13.67 13,689
0.45 182 7.00 1,308
0.70 70 9.75 1,081
0.00 0 148.29 12,037
25.46 17,011.00 0.00 0.00 0.00 0.00 463.14 194,546
Disbursement Rs million
No. of benef.
Disbursement Rs million
No. of benef.
Disbursement Rs million
No. of benef.
Disbursement Rs million
No. of benef.
7.46 6,990 6.76 3,50592.03 50,981
0.00 0 0.00 05.48 11,094
0.38 90 0.00 00.38 90
0.47 1,030 0.00 0 5.09 7,594
0.00 0 0.00 00.13 29
0.00 0 0.45 450.51 51
42.34 3,083 0.00 0 42.34 3,083
25.46 17,011 0.00 0 0.00 0 145.96 72,922
Zakat Disbursements, July 02-Sept 02
Balochistan ICT Northern Areas Total
Zakat Disbursements, July 03-September 03Balochistan ICT Northern Areas Total
ANNEX:4
Beneficiaries Disbursements (Rs. M)
Beneficiaries Disbursements (Rs. M)
Beneficiaries Disbursements (Rs. M)
Punjab 543,076 543.08 275,997 276.00 -49% -49%
Sindh 171,248 171.25 66,489 66.49 -61% -61%
NWFP/ FATA 204,625 204.63 186,435 186.44 -9% -9%
Balochistan 44,461 44.46 42,703 42.70 -4% -4%
ICT/ NA/ AJK 56,483 56.48 46,133 46.13 -18% -18%
PAKISTAN TOTAL
1,019,893 1,019.89 617,757 617.76 -39% -39%
Source: Pakistan Bait-ul-Maal
Food Support ProgramJuly-Sept 02 July-Sept 03 % change b/w July-Sept 02 &
July-Sept 03

ANNEX: 5
Borrowers Disbursement (Rs. M)
Borrowers Disbursement (Rs. M)
Borrowers Disbursement (Rs. M)
Borrowers
Punjab 288 6.65 8,170 78.48 10,881 91.42 19,339Sindh 49 0.97 7,232 71.58 3,548 29.81 10,829NWFP 170 4.06 885 8.62 4,968 41.74 6,023Balochistan 139 1.28 1,584 15.02 1,419 11.92 3,142AJK/FANA 37 0.92 1,078 10.71 2,839 23.85 3,954TOTAL 683 13.88 18,949 184.41 23,655 198.74 43,287Source : Agriculture Development Bank of Pakistan (ADBP), Khushali Bank, and Pakistan Poverty Alleviation Fund (PPAF)
Borrowers Disbursement (Rs. M)
Borrowers Disbursement (Rs. M)
Borrowers Disbursement (Rs. M)
Borrowers
Punjab 239 5.30 14,300 140.51 30,078 283.13 44,617Sindh 77 1.60 9,236 93.41 9,833 92.56 19,146NWFP 240 5.80 2,069 19.63 9,255 87.12 11,564Balochistan 32 0.80 408 4.24 4,049 38.11 4,489AJK/FANA 288 7.14 77 0.79 4,627 43.56 4,992TOTAL 876 20.63 26,090 258.58 57,842 544.48 84,808Source : Agriculture Development Bank of Pakistan (ADBP), Khushali Bank, and Pakistan Poverty Alleviation Fund (PPAF)
Micro Credit Disbursements, July-Sept 02ADBP Khushali Bank PPAF TOTAL
Micro Credit Disbursements, July-Sept 03ADBP Khushali Bank PPAF TOTAL
ANNEX: 6
No. of Benef.
Disbursements (Rs. Millions)
No. of Benef.
Disbursements (Rs. Millions)
No. of Benef.
Disbursements (Rs. Millions)
No. of Benef.
Disbursements (Rs. Millions)
Sindh 26,787 97.54 275 1.00 6,697 24.39 69 0.80Punjab 41,398 150.75 426 1.54 10,350 37.69 107 1.23NWFP 11,364 41.38 117 0.42 2,841 10.35 30 0.34Balochistan 1,623 5.91 17 0.06 406 1.48 4 0.05PAKISTAN 81,172 295.58 835 3.02 20,294 73.90 210 2.42
Source : Employees' Old-Age Benefits Institution (EOBI)
No. of Benef.
Disbursements (Rs. Millions)
No. of Benef.
Disbursements (Rs. Millions)
No. of Benef.
Disbursements (Rs. Millions)
No. of Benef.
Disbursements (Rs. Millions)
Sindh 28,239 107.71 108 0.38 7,060 26.91 97 1.13Punjab 43,642 166.46 167 0.58 10,911 41.58 150 1.75NWFP 11,980 45.69 46 0.16 2,995 11.42 41 0.48Balochistan 1,712 6.53 6 0.02 428 1.63 6 0.07PAKISTAN 85,573 326.39 327 1.14 21,394 81.53 294 3.44Source : Employees' Old-Age Benefits Institution (EOBI)
Employees' Old-Age Benefits Institution (EOBI)
July-September 2002
Old Age Pension Invalidity Pension Survivor's Pension Old Age Grants
Employees' Old-Age Benefits Institution (EOBI)July-September 2003
Old Age Pension Invalidity Pension Survivor's Pension Old Age Grants
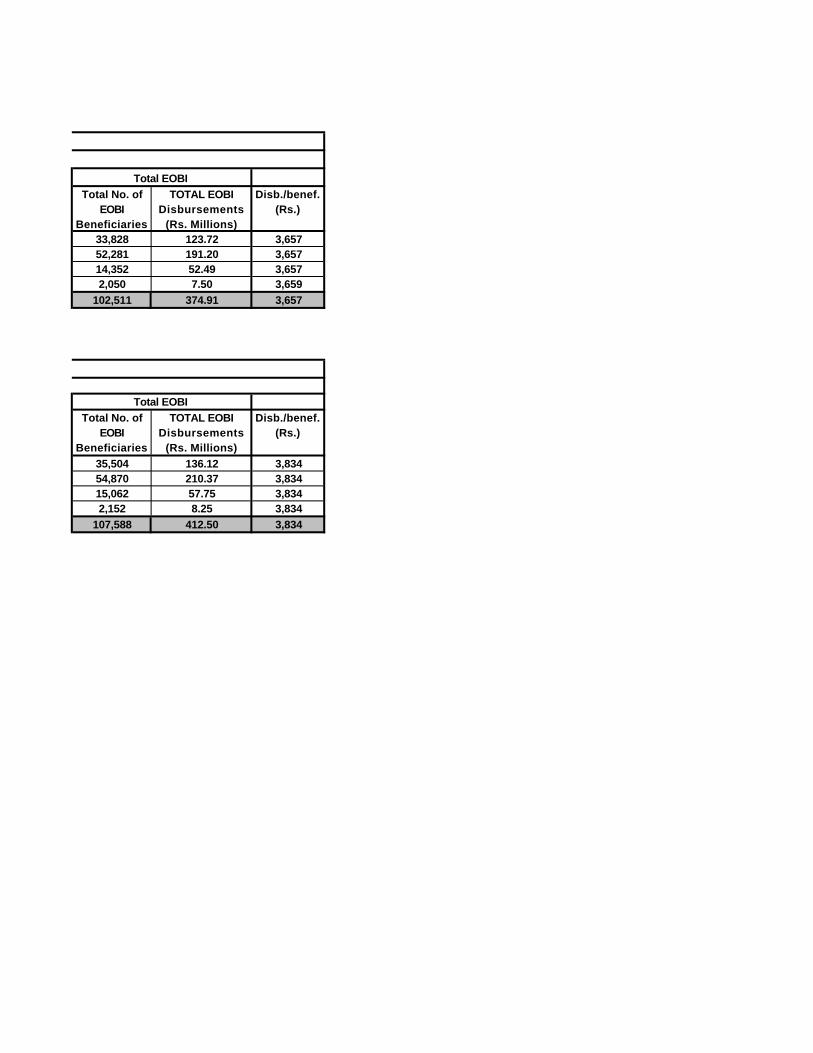
Total No. of EOBI
Beneficiaries
TOTAL EOBI Disbursements
(Rs. Millions)
Disb./benef. (Rs.)
33,828 123.72 3,65752,281 191.20 3,65714,352 52.49 3,6572,050 7.50 3,659
102,511 374.91 3,657
Total No. of EOBI
Beneficiaries
TOTAL EOBI Disbursements
(Rs. Millions)
Disb./benef. (Rs.)
35,504 136.12 3,83454,870 210.37 3,83415,062 57.75 3,8342,152 8.25 3,834
107,588 412.50 3,834
Total EOBI
Total EOBI
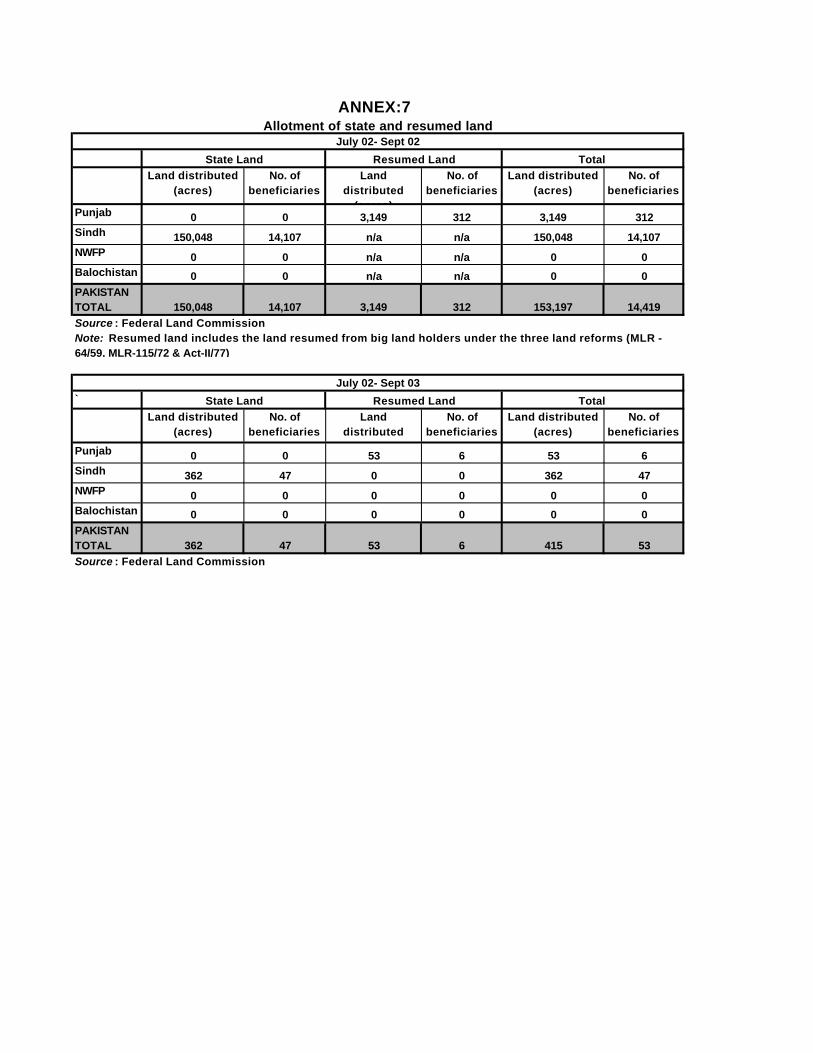
ANNEX:7
Land distributed (acres)
No. of beneficiaries
Land distributed
(acres)
No. of beneficiaries
Land distributed (acres)
No. of beneficiaries
Punjab 0 0 3,149 312 3,149 312Sindh 150,048 14,107 n/a n/a 150,048 14,107NWFP 0 0 n/a n/a 0 0Balochistan 0 0 n/a n/a 0 0PAKISTAN TOTAL 150,048 14,107 3,149 312 153,197 14,419Source : Federal Land Commission
`
Land distributed (acres)
No. of beneficiaries
Land distributed
(acres)
No. of beneficiaries
Land distributed (acres)
No. of beneficiaries
Punjab 0 0 53 6 53 6Sindh 362 47 0 0 362 47NWFP 0 0 0 0 0 0Balochistan 0 0 0 0 0 0PAKISTAN TOTAL 362 47 53 6 415 53Source : Federal Land Commission
Allotment of state and resumed landJuly 02- Sept 02
State Land Resumed Land Total
Note: Resumed land includes the land resumed from big land holders under the three land reforms (MLR -64/59, MLR-115/72 & Act-II/77)
July 02- Sept 03
State Land Resumed Land Total