Embed Size (px)
Citation preview

1
Prudhoe Bay Oil Production Optimization: Using Virtual
Intelligence Techniques, Stage One: Neural Model Building
Shahab D. Mohaghegh, West Virginia University
Lynda A. Hutchins, BP Exploration (Alaska), and Carl D. Sisk, BP Exploration
SPE 77659

2SPE 77659, Mohaghegh, Hutchins, Sisk
OUTLINE
OBJECTIVEBACKGROUNDBUSINESS MOTIVATIONINTRODUCTIONMETHODOLOGYCONCLUSIONSFUTURE WORK

3SPE 77659, Mohaghegh, Hutchins, Sisk
OBJECTIVE
The objective of this study is to develop a tool to assist engineers in maximizing total field oil production by optimizing the gas discharge rates and pressures at the separation facilities.

4SPE 77659, Mohaghegh, Hutchins, Sisk
BACKGROUND
Prudhoe Bay has approximately 800 producing wells flowing to eight remote, three-phase separation facilities (flow stations and gathering centers). High-pressure gas is discharged from these facilities into a cross–country pipeline system flowing to a central compression plant.

5SPE 77659, Mohaghegh, Hutchins, Sisk
BACKGROUND
34” and 60” high pressure gas lines
Simplified Overview of the Gas Transit Line System
Scale
2 Miles
To Gas Reinjection
GC2 GC1/GC1A
GC3
FS2FS1/FS1A
FS3
CGF/CCP
3-phase separation facilityCentral Gas Compression Plant

6SPE 77659, Mohaghegh, Hutchins, Sisk
BACKGROUND
Fuel gas supply (at the flow stations and gathering centers) and artificial lift gas supply for the lift gas compressors at GC1 are taken off the gas transit line upstream of the compression plant. This reduces the feed gas rate and pressure at the inlet to the compression plant.

7SPE 77659, Mohaghegh, Hutchins, Sisk
BACKGROUND
Gas feeding the central compression plant is processed to produce natural gas liquids and miscible injectant. Residue gas from the process is compressed further for reinjection into the reservoir to provide pressure support.

8SPE 77659, Mohaghegh, Hutchins, Sisk
BUSINESS MOTIVATIONAmbient temperature has a dominant effect on compressor efficiency and hence total gas handling capacity and subsequent oil production. 10 YEAR AVERAGE AMBIENT
1990-2000 & 2001, 2002 Averages
-60
-40
-20
0
20
40
60
80
100
Dec 31 Jan 30 Mar 01 Mar 31 Apr 30 May 30 Jun 29 Jul 29 Aug 28 Sep 27 Oct 27 Nov 26 Dec 26
1990-2001 AVE TEMP RANGE 01 AVE 02 AVE

9SPE 77659, Mohaghegh, Hutchins, Sisk
BUSINESS MOTIVATIONA significant reduction in gas handling capacity is observed at ambient temperatures above 0 oF.
Gas compression capacity is the major bottleneck to production at Prudhoe Bay and typically field oil rate will be maximized by preferentially producing the lowest GOR wells.

10SPE 77659, Mohaghegh, Hutchins, Sisk
BUSINESS MOTIVATION
As the ambient temperature increases from 0 and 40 oF, the maximum (or “marginal”) GOR in the field decreases from approximately 35,000 to 28,000 scf/stb. A temperature swing from 0 to 40 oF in one day equates to an approximate oil volume reduction of 40,000 bbls, or 1000 bopd per oF rise in temperature.

11SPE 77659, Mohaghegh, Hutchins, Sisk
BUSINESS MOTIVATION
The reduction in achievable oil rate, per degree Fahrenheit increase in temperature, increases with ambient temperature. This is due in part to the increase in slope of the curve of shipped gas versus temperature, and also to the reduction in limiting or “marginal” GOR as gas capacity decreases.

12SPE 77659, Mohaghegh, Hutchins, Sisk
BUSINESS MOTIVATION
The ability to optimize the facilities in response to ambient temperature swings, compressor failures or planned maintenance is a major business driver for this project. Proactive management of gas production also reduces unnecessary emissions.

13SPE 77659, Mohaghegh, Hutchins, Sisk
BUSINESS MOTIVATION
To maximize total oil rate under a variety of field conditions it is first necessary to understand the relationship between the inlet gas rate and pressure at the central compression plant, and the gas rates and discharge pressures into the gas transit line system at each of the separation facilities.

14SPE 77659, Mohaghegh, Hutchins, Sisk
BUSINESS MOTIVATION
Gas capacity constraints start to affect oil production at about 0 oF, with increasing impact as the temperature increases. The estimated benefit of this tool for optimizing oil rate during temperature swings and equipment maintenance is 1-2 MBOPD for 75% of the year.

15SPE 77659, Mohaghegh, Hutchins, Sisk
INTRODUCTIONAttempts were made to develop a deterministic model of the gas transit system using commercial pipeline modeling software. However, it was extremely difficult to obtain sufficient historical data to validate the model.Development of a neural network model was undertaken to determine if this approach would provide a robust description of the observed gas rates and pressures with less stringent data requirements.

16SPE 77659, Mohaghegh, Hutchins, Sisk
INTRODUCTION
For this initial test it was assumed that there was negligible hysteresis in the system. Initial results were very encouraging, suggesting that this is a valid approach, albeit limited to the data range used to train the model.

17SPE 77659, Mohaghegh, Hutchins, Sisk
METHODOLOGY
The methodology is divided into two sections.
1. Data collection2. Training and verification of neural network
models:Central Compression Plant Inlet ModelSeparation Facility Gas Discharge Models

18SPE 77659, Mohaghegh, Hutchins, Sisk
METHODOLOGYData Collection
The field data necessary to train the neural network models was carefully checked for consistency. To ensure the data represented consistent field conditions (e.g. similar compressor configurations) and did not include periods where there were major equipment failures or maintenance, the data had to be carefully filtered.Consequently, the final available dataset was more limited than had been anticipated and the initial neural network model is limited to a fairly narrow range of field conditions.

19SPE 77659, Mohaghegh, Hutchins, Sisk
METHODOLOGYData Collection
The data included: Gas rate and gas discharge pressure from each of the eight separation facilitiesFuel gas and lift gas supply ratesAverage hourly temperaturesInlet rate and pressure at the central gas compression plant.

20SPE 77659, Mohaghegh, Hutchins, Sisk
METHODOLOGY
Data CollectionThe objective of this study is to optimize the target gas rates at each of the separation facilities in order to maximize oil production from the field.Step One: build a representative model of the entire gas transit pipeline system.Step Two: build an intelligent optimization tool to find the best combination of rate and pressure for each facility to optimize gas production.

21SPE 77659, Mohaghegh, Hutchins, Sisk
METHODOLOGY
Data CollectionThe neural network model should have two main characteristics:
The model must accurately represent this complex dynamic system.The model must provide fast results (close to real-time) once the required information is presented.

22SPE 77659, Mohaghegh, Hutchins, Sisk
METHODOLOGYTemperature plays a key role in this operation. The data used to build the neural network model was averaged on an hourly basis.Data from a total of 46 days was represented in the data set. The data starts with the first day of the August and ends with the last day of September 2001.

23SPE 77659, Mohaghegh, Hutchins, Sisk
METHODOLOGYAverage Daily Temperature
20.00
25.00
30.00
35.00
40.00
45.00
50.00
55.00
8/1/20
018/3
/2001
8/5/20
018/7
/2001
8/9/20
018/1
1/200
18/1
3/200
18/1
5/200
18/1
7/200
18/1
9/200
18/2
1/200
18/2
3/200
18/2
5/200
18/2
7/200
18/2
9/200
18/3
1/200
19/2
/2001
9/4/20
019/6
/2001
9/8/20
019/1
0/200
19/1
2/200
19/1
4/200
19/1
6/200
19/1
8/200
19/2
0/200
19/2
2/200
19/2
4/200
19/2
6/200
19/2
8/200
1
Date
Ave
rage
Tem
p.

24SPE 77659, Mohaghegh, Hutchins, Sisk
METHODOLOGY
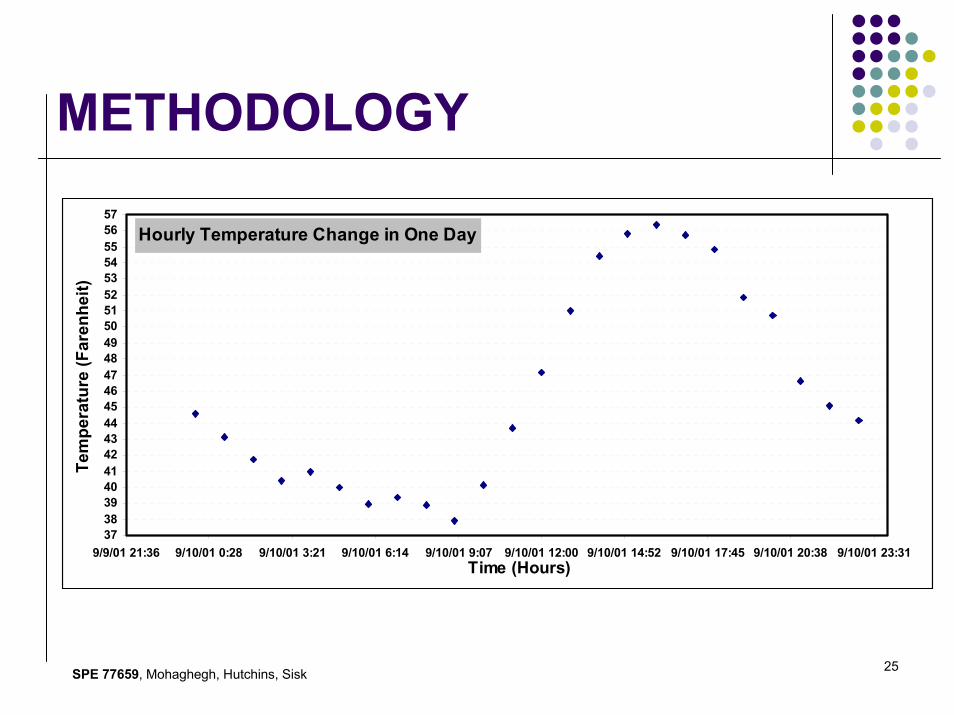
The average daily temperature may be misleading in demonstrating the temperature swings within a single day. The model will be dealing with average temperature on an hourly basis rather than a daily basis.
25SPE 77659, Mohaghegh, Hutchins, Sisk
METHODOLOGY
Hourly Temperature Change in One Day
373839404142434445464748495051525354555657
9/9/01 21:36 9/10/01 0:28 9/10/01 3:21 9/10/01 6:14 9/10/01 9:07 9/10/01 12:00 9/10/01 14:52 9/10/01 17:45 9/10/01 20:38 9/10/01 23:31Time (Hours)
Tem
pera
ture
(Far
enhe
it)

26SPE 77659, Mohaghegh, Hutchins, Sisk
METHODOLOGYCentral Compression Plant Inlet Model
Min Average Max Std. Dev.Am bient Tem peratur 20.23 35.85 57.33 6.44
Total Fuel Gas 38.92 46.61 53.46 2.79
Gas-Lift Gas at GC1 401.23 809.30 923.09 152.29
FS1 895.75 1,137.61 1,304.96 76.10FS2 428.09 704.69 769.89 63.35FS3 382.06 786.61 1,066.79 164.15FS1A 907.18 1,273.55 1,530.64 136.96GC1 456.85 964.30 1,127.55 214.05GC2 807.91 998.21 1,080.00 55.59GC3 490.54 1,011.01 1,131.89 112.28GC1A 944.00 1,353.91 1,438.83 73.24Feed Gas Rate to CCP 6,473.64 7,370.93 7,832.34 234.48
FS1 592.47 603.46 624.02 7.39FS2 563.67 626.76 650.03 11.43FS3 625.98 640.73 669.42 10.64FS1A 560.75 602.37 625.66 10.47GC1 574.95 611.38 634.87 11.54GC2 578.68 610.47 634.62 12.16GC3 581.66 600.94 622.99 9.66GC1A 572.04 601.64 627.60 13.20Inlet Pressure to CCP
536.03 559.82 588.60 10.81
GAS DISCHARGE RATES
GAS DISCHARGE PRESSURES
Ranges of the parameters that were used during the development of the network models

27SPE 77659, Mohaghegh, Hutchins, Sisk
METHODOLOGYCentral Compression Plant Inlet Model
The spread of the data for each of the neural network models (based on the average daily temperature)
52 51 50 49 48 47 46 45 44 43 42 41 40 39 38 37 36 35 34 33 32 31 30 29 28 27 26 25 24 23
Training
Calibration
Verification
Training
Calibration
Verification
Training
Calibration
Verification
Temperature Range in the Dataset
Net
wor
k #1
Net
wor
k #2
Net
wor
k #3

28SPE 77659, Mohaghegh, Hutchins, Sisk
METHODOLOGY

29SPE 77659, Mohaghegh, Hutchins, Sisk
METHODOLOGYCentral Compression Plant Inlet Model
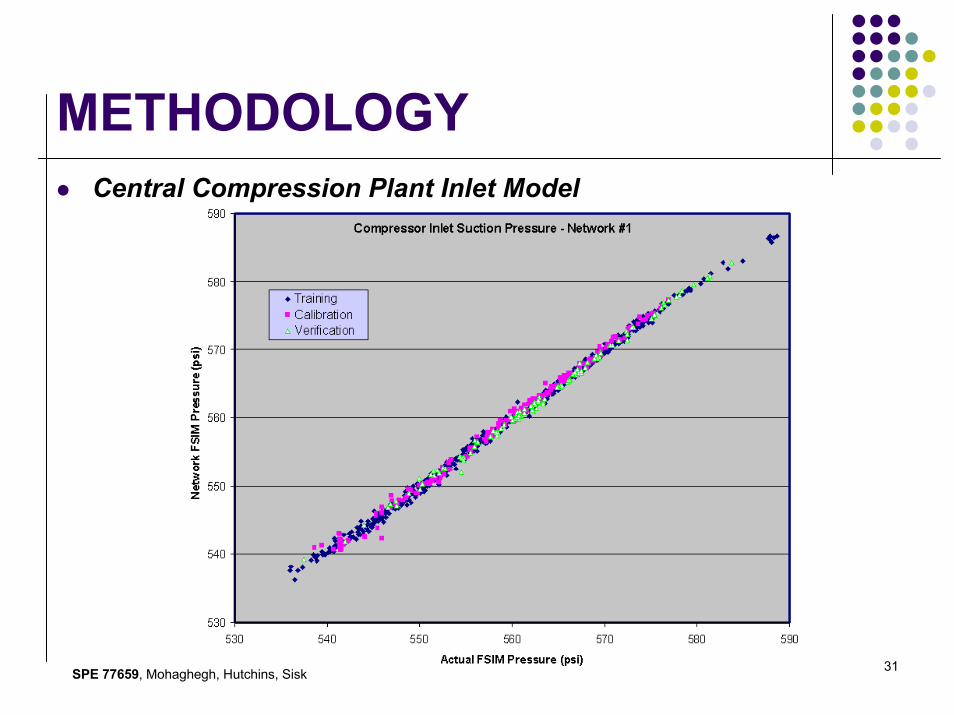
Output: Rate Pressure Rate Pressure Rate PressureCases: R squared: 0.9968 0.9975 0.9919 0.9959 0.9907 0.9958Cases: R squared: 0.9972 0.9987 0.9827 0.9943 0.6336 0.9742Cases: 645 143 94R squared: 0.996 0.9977 0.9862 0.992 0.9471 0.9924
103
Verification
660 210 118
Training Calibration
693 192
Network 1
Network 2
Network 3

30SPE 77659, Mohaghegh, Hutchins, Sisk
METHODOLOGYCentral Compression Plant Inlet Model
31SPE 77659, Mohaghegh, Hutchins, Sisk
METHODOLOGYCentral Compression Plant Inlet Model

32SPE 77659, Mohaghegh, Hutchins, Sisk
METHODOLOGYCentral Compression Plant Inlet Model

33SPE 77659, Mohaghegh, Hutchins, Sisk
METHODOLOGYCentral Compression Plant Inlet Model

34SPE 77659, Mohaghegh, Hutchins, Sisk
METHODOLOGYCentral Compression Plant Inlet Model

35SPE 77659, Mohaghegh, Hutchins, Sisk
METHODOLOGYCentral Compression Plant Inlet Model

36SPE 77659, Mohaghegh, Hutchins, Sisk
METHODOLOGY
Separation Facility Gas Discharge ModelsA second set of neural networks was developed to model the gas discharge rates and pressures at each of the eight separation facilities.

37SPE 77659, Mohaghegh, Hutchins, Sisk
METHODOLOGY
Separation Facility Gas Discharge ModelsSince this is a dynamic problem where rate and pressure at each of the facilities depends on the rate and pressure at each of the other facilities as well as the corresponding rate and pressure at the inlet to the Central Compression Plant, the network model built for each of the facilities serve as a pressure-rate check for the optimization process.

38SPE 77659, Mohaghegh, Hutchins, Sisk
METHODOLOGY
Separation Facility Gas Discharge ModelsThis is to ensure that the pressure rate combinations suggested by the optimization routine for each facility does not exceed the local gas capacity or pressure limits.

39SPE 77659, Mohaghegh, Hutchins, Sisk
METHODOLOGY
Separation Facility Gas Discharge Model
Training Calibration VerificationCases: 693 197 98R squared for FS1 0.952 0.938 0.922R squared for FS2 0.933 0.918 0.909R squared for FS3 0.983 0.966 0.975R squared for FS1A 0.948 0.948 0.938R squared for GC1 0.963 0.954 0.969R squared for GC2 0.907 0.911 0.906R squared for GC3 0.958 0.949 0.953R squared for GC1A 0.932 0.940 0.927

40SPE 77659, Mohaghegh, Hutchins, Sisk
METHODOLOGY
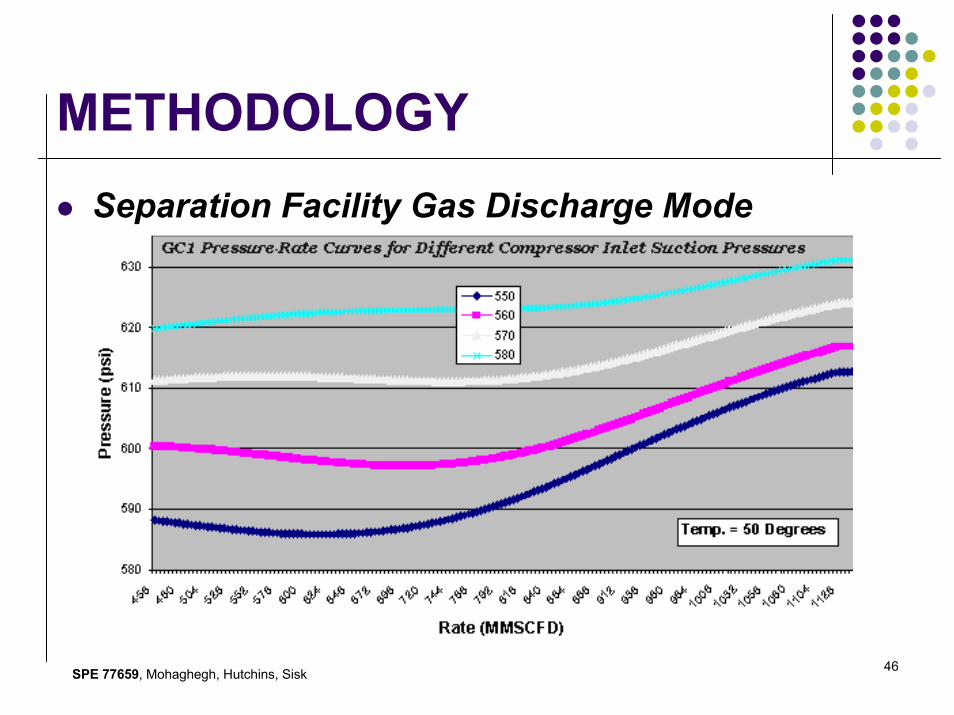
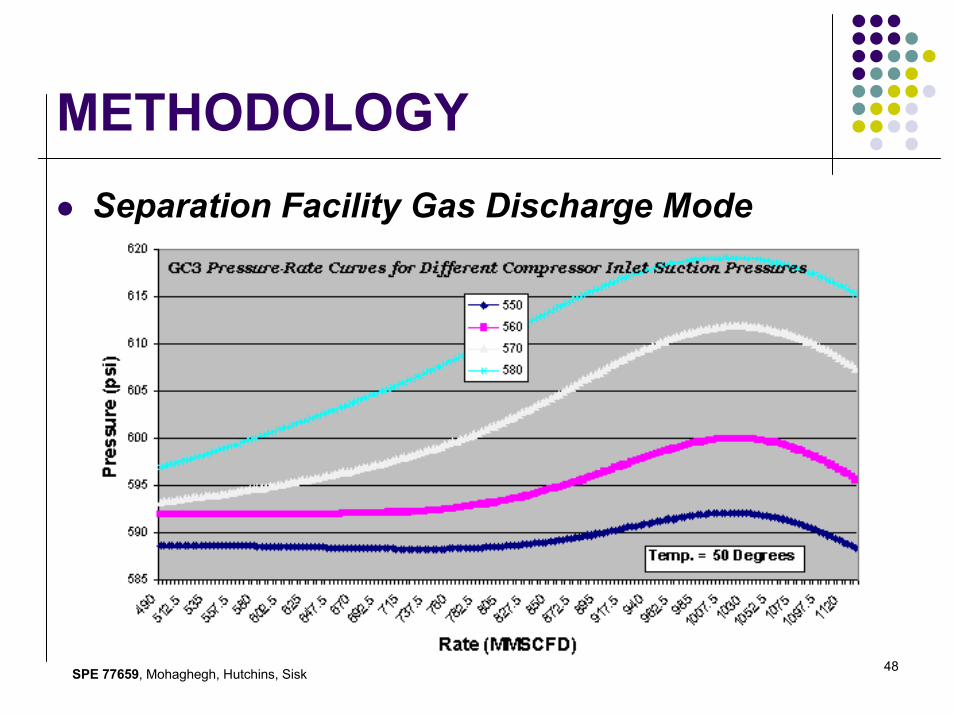
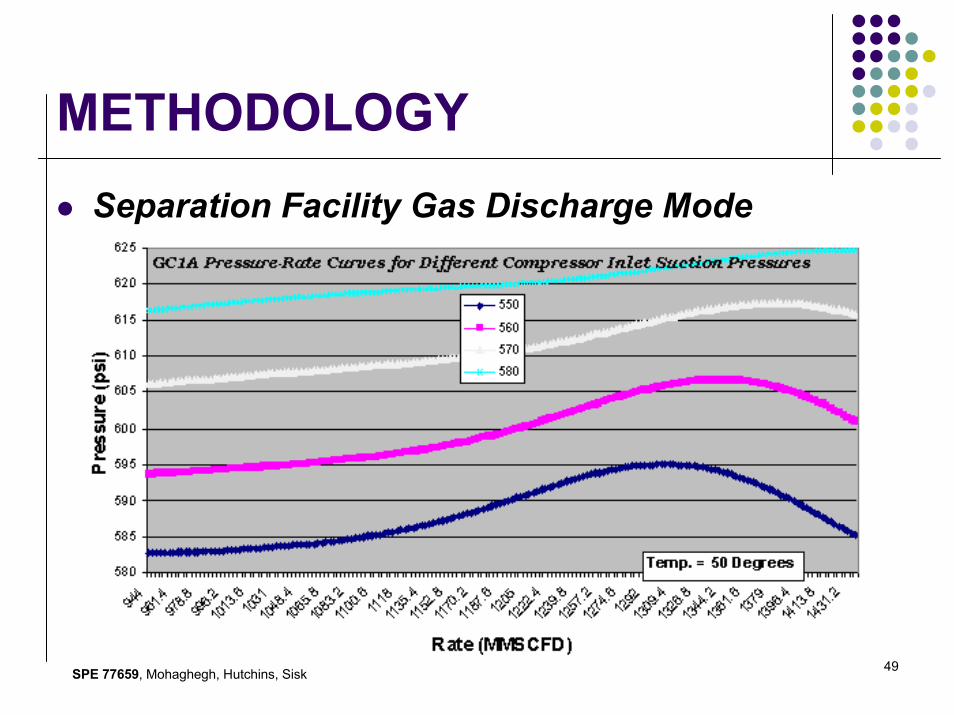
Separation Facility Gas Discharge ModelThese models are not built based on theoretical understanding of the system, rather by building representative functions that can approximate the data present in the dataset. The nature of the data being studied in this study is discrete. These snap shots in time do not cover all the possible situations that might occur

41SPE 77659, Mohaghegh, Hutchins, Sisk
METHODOLOGY
Separation Facility Gas Discharge ModelTherefore, in some instances it is possible that the data present in the data set does not fully represent all the possible cases. In such cases, one must expect to see an atypical behavior of a Pressure-Rate curve that may or may not fit our theoretical understanding of the process.

42SPE 77659, Mohaghegh, Hutchins, Sisk
METHODOLOGYSeparation Facility Gas Discharge Mode

43SPE 77659, Mohaghegh, Hutchins, Sisk
METHODOLOGYSeparation Facility Gas Discharge Mode

44SPE 77659, Mohaghegh, Hutchins, Sisk
METHODOLOGYSeparation Facility Gas Discharge Mode

45SPE 77659, Mohaghegh, Hutchins, Sisk
METHODOLOGYSeparation Facility Gas Discharge Mode
46SPE 77659, Mohaghegh, Hutchins, Sisk
METHODOLOGYSeparation Facility Gas Discharge Mode

47SPE 77659, Mohaghegh, Hutchins, Sisk
METHODOLOGYSeparation Facility Gas Discharge Mode
48SPE 77659, Mohaghegh, Hutchins, Sisk
METHODOLOGYSeparation Facility Gas Discharge Mode
49SPE 77659, Mohaghegh, Hutchins, Sisk
METHODOLOGYSeparation Facility Gas Discharge Mode

50SPE 77659, Mohaghegh, Hutchins, Sisk
CONCLUSIONS
It is possible to represent the gas transit line system at Prudhoe Bay by a group of neural network models. However, additional data is required to retrain the network models for larger range of conditions.

51SPE 77659, Mohaghegh, Hutchins, Sisk
FUTURE WORKA rigorous data collection process to obtain data for a broader range of conditions to retrain the network model.Validate a deterministic pipeline model of the gas transit line system, which has been built using commercial pipeline simulation software. Once validated, this model will be used to generate additional data to train the neural network models.This will allow a wider range of sensitivities to be performed to generate potential solutions to the optimization problem.

52SPE 77659, Mohaghegh, Hutchins, Sisk
ACKNOLEDGEMENTThe authors would like to thank the management of BP Exploration (Alaska) Inc., Phillips (Alaska) Inc. and Exxon Mobil Corporation for their support and for granting permission to publish the paper.We also thank Hal Tucker, Mike Bolkavatz, Richard Bailey, Bryn Stenhouse and Robert Rood for valuable discussions on the applicability of these techniques to Prudhoe Bay.