Embed Size (px)
Citation preview
PSC REF#:96889Public Service Commission of Wisconsin
RECEIVED: 06/27/08, 3:13:47 PM
Response of Wisconsin Power and Light Company
to The Wisconsin Department of Natural Resources
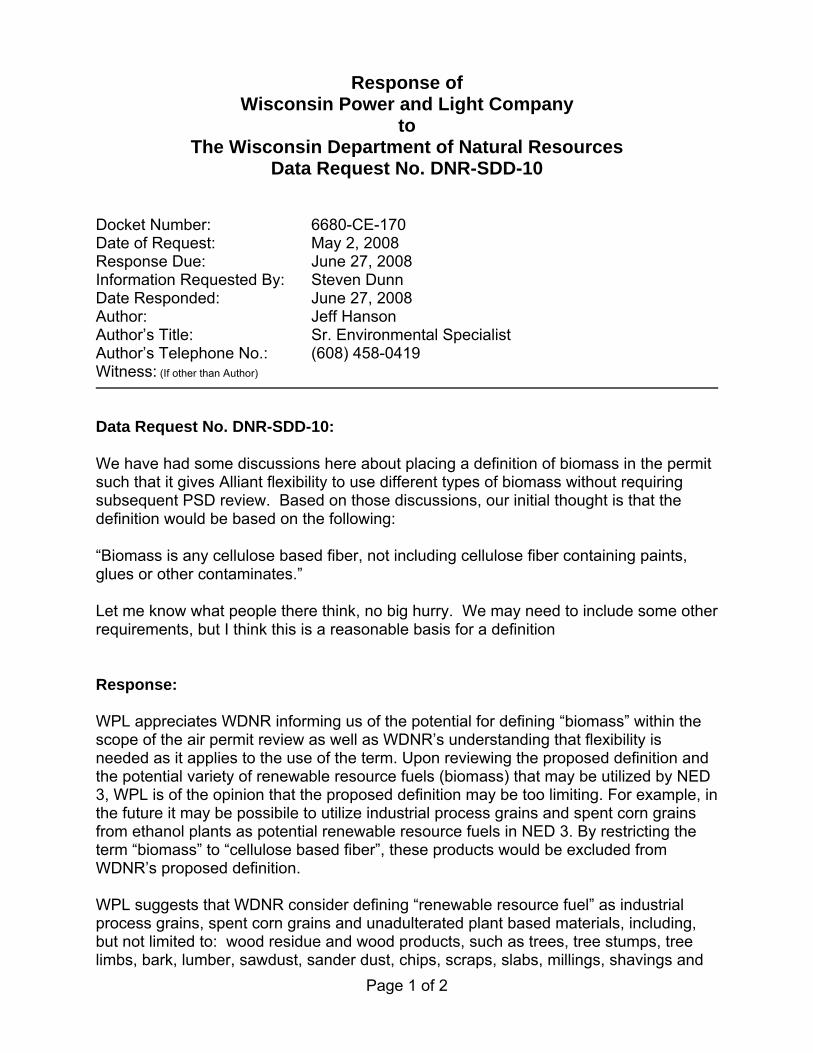
Data Request No. DNR-SDD-10 Docket Number: 6680-CE-170 Date of Request: May 2, 2008 Response Due: June 27, 2008 Information Requested By: Steven Dunn Date Responded: June 27, 2008 Author: Jeff Hanson Author’s Title: Sr. Environmental Specialist Author’s Telephone No.: (608) 458-0419 Witness: (If other than Author) Data Request No. DNR-SDD-10:
We have had some discussions here about placing a definition of biomass in the permit such that it gives Alliant flexibility to use different types of biomass without requiring subsequent PSD review. Based on those discussions, our initial thought is that the definition would be based on the following:
“Biomass is any cellulose based fiber, not including cellulose fiber containing paints, glues or other contaminates.”
Let me know what people there think, no big hurry. We may need to include some other requirements, but I think this is a reasonable basis for a definition
Response: WPL appreciates WDNR informing us of the potential for defining “biomass” within the scope of the air permit review as well as WDNR’s understanding that flexibility is needed as it applies to the use of the term. Upon reviewing the proposed definition and the potential variety of renewable resource fuels (biomass) that may be utilized by NED 3, WPL is of the opinion that the proposed definition may be too limiting. For example, in the future it may be possibile to utilize industrial process grains and spent corn grains from ethanol plants as potential renewable resource fuels in NED 3. By restricting the term “biomass” to “cellulose based fiber”, these products would be excluded from WDNR’s proposed definition. WPL suggests that WDNR consider defining “renewable resource fuel” as industrial process grains, spent corn grains and unadulterated plant based materials, including, but not limited to: wood residue and wood products, such as trees, tree stumps, tree limbs, bark, lumber, sawdust, sander dust, chips, scraps, slabs, millings, shavings and
Page 1 of 2
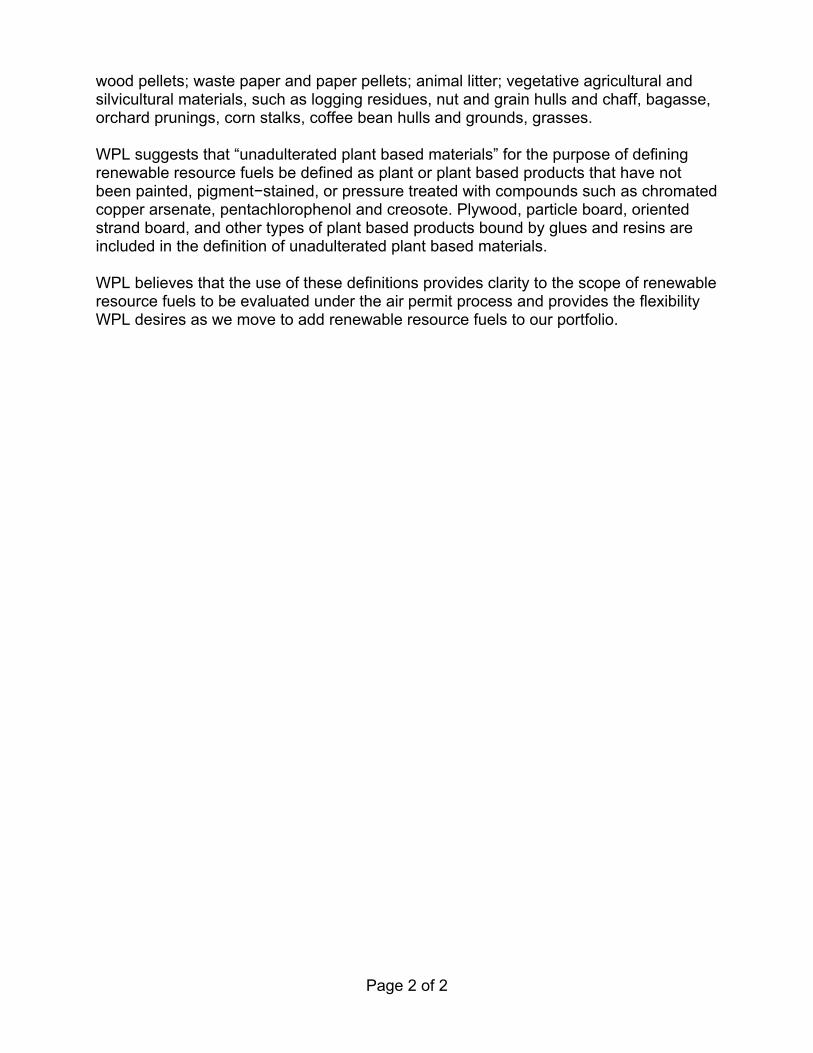
wood pellets; waste paper and paper pellets; animal litter; vegetative agricultural and silvicultural materials, such as logging residues, nut and grain hulls and chaff, bagasse, orchard prunings, corn stalks, coffee bean hulls and grounds, grasses. WPL suggests that “unadulterated plant based materials” for the purpose of defining renewable resource fuels be defined as plant or plant based products that have not been painted, pigment−stained, or pressure treated with compounds such as chromated copper arsenate, pentachlorophenol and creosote. Plywood, particle board, oriented strand board, and other types of plant based products bound by glues and resins are included in the definition of unadulterated plant based materials. WPL believes that the use of these definitions provides clarity to the scope of renewable resource fuels to be evaluated under the air permit process and provides the flexibility WPL desires as we move to add renewable resource fuels to our portfolio.
Page 2 of 2
Response of Wisconsin Power and Light Company
to The Wisconsin Department of Natural Resources
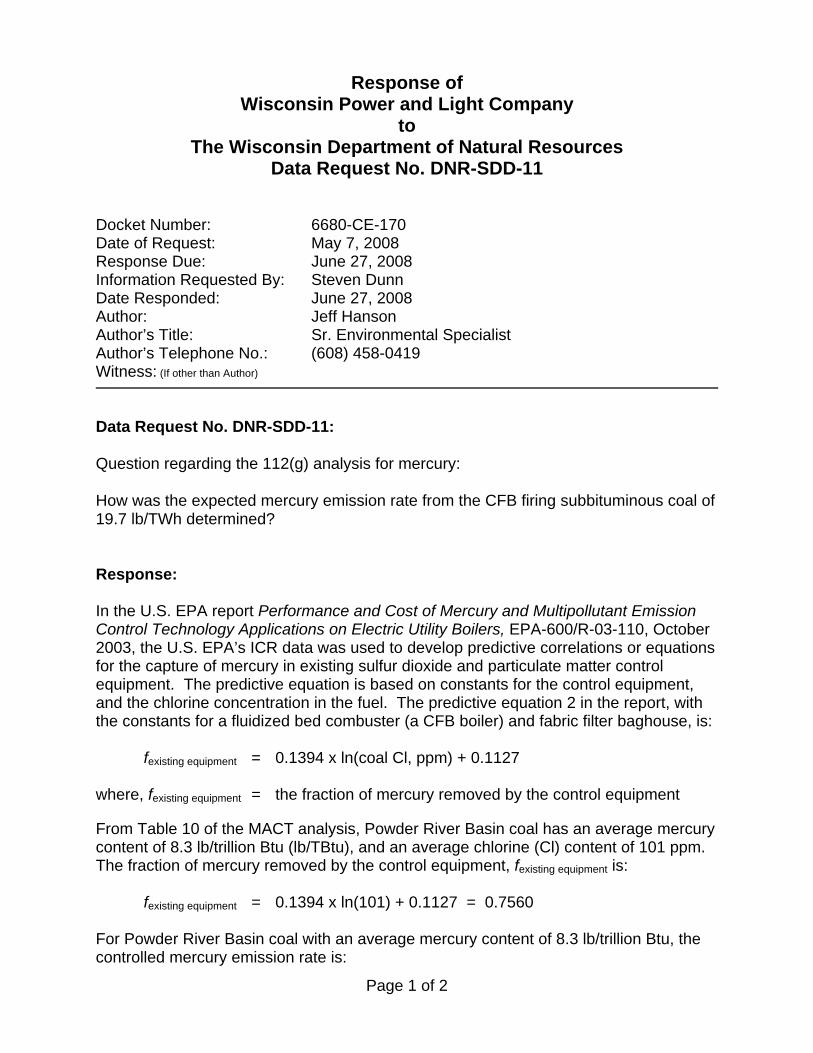
Data Request No. DNR-SDD-11 Docket Number: 6680-CE-170 Date of Request: May 7, 2008 Response Due: June 27, 2008 Information Requested By: Steven Dunn Date Responded: June 27, 2008 Author: Jeff Hanson Author’s Title: Sr. Environmental Specialist Author’s Telephone No.: (608) 458-0419 Witness: (If other than Author) Data Request No. DNR-SDD-11:
Question regarding the 112(g) analysis for mercury:
How was the expected mercury emission rate from the CFB firing subbituminous coal of 19.7 lb/TWh determined?
Response: In the U.S. EPA report Performance and Cost of Mercury and Multipollutant Emission Control Technology Applications on Electric Utility Boilers, EPA-600/R-03-110, October 2003, the U.S. EPA’s ICR data was used to develop predictive correlations or equations for the capture of mercury in existing sulfur dioxide and particulate matter control equipment. The predictive equation is based on constants for the control equipment, and the chlorine concentration in the fuel. The predictive equation 2 in the report, with the constants for a fluidized bed combuster (a CFB boiler) and fabric filter baghouse, is:
fexisting equipment = 0.1394 x ln(coal Cl, ppm) + 0.1127
where, fexisting equipment = the fraction of mercury removed by the control equipment
From Table 10 of the MACT analysis, Powder River Basin coal has an average mercury content of 8.3 lb/trillion Btu (lb/TBtu), and an average chlorine (Cl) content of 101 ppm. The fraction of mercury removed by the control equipment, fexisting equipment is:
fexisting equipment = 0.1394 x ln(101) + 0.1127 = 0.7560 For Powder River Basin coal with an average mercury content of 8.3 lb/trillion Btu, the controlled mercury emission rate is:
Page 1 of 2
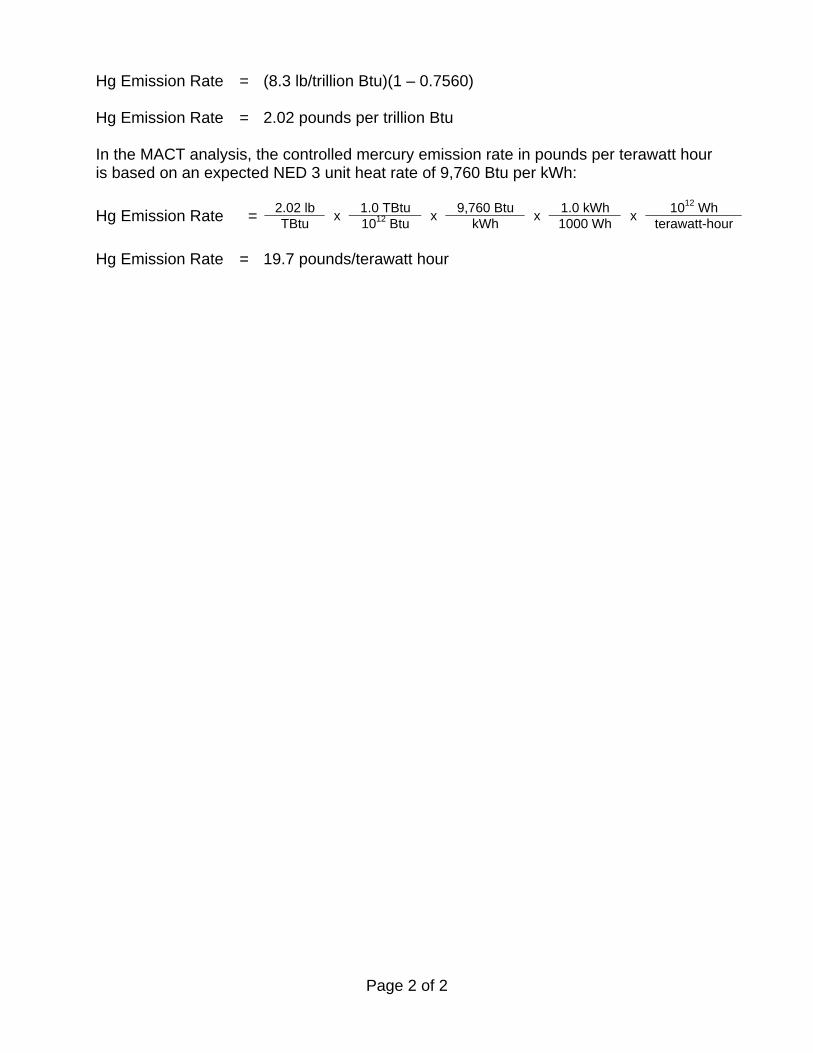
Hg Emission Rate = (8.3 lb/trillion Btu)(1 – 0.7560) Hg Emission Rate = 2.02 pounds per trillion Btu In the MACT analysis, the controlled mercury emission rate in pounds per terawatt hour is based on an expected NED 3 unit heat rate of 9,760 Btu per kWh:
2.02 lb 1.0 TBtu 9,760 Btu 1.0 kWh 1012 Wh Hg Emission Rate = TBtu x 1012 Btu x kWh x 1000 Wh x terawatt-hour Hg Emission Rate = 19.7 pounds/terawatt hour
Page 2 of 2
Response of Wisconsin Power and Light Company
to The Wisconsin Department of Natural Resources
Data Request No. DNR-SDD-12
Docket Number: 6680-CE-170 Date of Request: May 7, 2008 Response Due: June 27, 2008 Information Requested By: Steven Dunn Date Responded: June 27, 2008 Author: Jeff Hanson Author’s Title: Sr. Environmental Specialist Author’s Telephone No.: (608) 458-0419 Witness: (If other than Author) Data Request No. DNR-SDD-12:
Question regarding the 112(g) analysis for mercury:
Testing data from papers and EPA is provided in the application. Is there are other data available to Alliant through trade groups or other venues which is available for mercury emissions? Is there other data available to the consultants on the permit? If so, please provide, at a minimum, a summary of such data for the department to review. Also, what analysis was done to find such emission data (see bottom p. 41).
Response: Attached is a bibliography for the NED 3 MACT analysis. In addition to these specifically cited references in the MACT analysis, WPL used the following references for preparing this report: 1. Effect of NOx Control Processes on Mercury Speciation in Utility Flue Gas,
Richardson, C.; Machalek, T.; Miller, S.; Dene, C.; Chang, R., ISSN 1047-3289 J. Air & Waste Management Association, 52:941-947.
2. Performance and Cost of Mercury and Multipollutant Emission Control Technology Applications on Electric Utility Boilers, EPA-600/R-03-110, October 2003, page 14.
3. Evaluation of the Effect of SCR NOx Control Technology on Mercury Speciation, March, 2003, T. Feeley, III and L. Brickett, U.S. DOE, J. Murphy, SAI Corporation.
Page 1 of 7
4. Connecticut Clean Air Mercury Rule State Plan, October 29, 2007, Connecticut Department of Environmental Protection, Bureau of Air Management, Hartford, Connecticut.
5. State Of Connecticut, Department of Environmental Protection, Bureau Of Air Management, New Source Review Permit To Construct And Operate A Stationary Source for AES Thames, LLC, Permit Number 107-0010.
6. Testimony of Dr. Steve Benson, University of North Dakota, to the U.S. Senate Committee on Environment & Public Works, June 5, 2003, as included to data response CL1-23 within PSCW docket 6680-CE-170 for WPL’s CPCN filing associated with NED 3/COL 3.
WPL is in the process of developing the MACT analysis for the proposed Columbia Unit 3. As this analysis develops, other resources may be identified.
Page 2 of 7
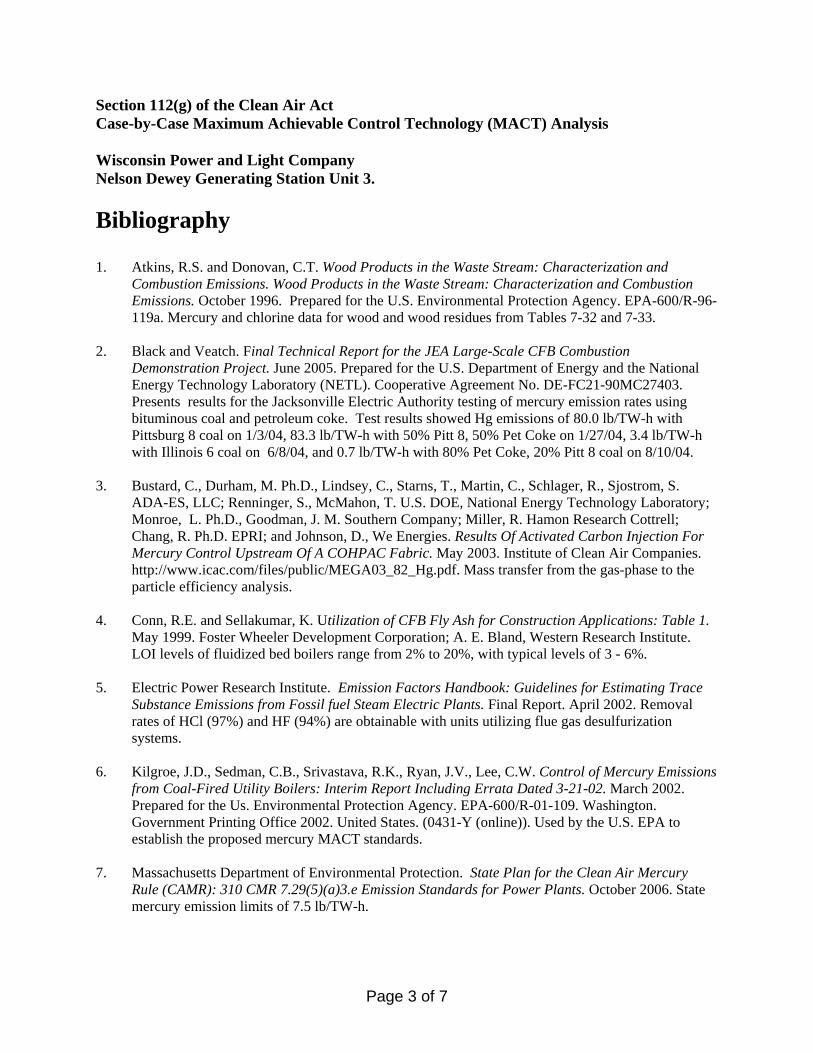
Section 112(g) of the Clean Air Act Case-by-Case Maximum Achievable Control Technology (MACT) Analysis Wisconsin Power and Light Company Nelson Dewey Generating Station Unit 3. Bibliography 1. Atkins, R.S. and Donovan, C.T. Wood Products in the Waste Stream: Characterization and
Combustion Emissions. Wood Products in the Waste Stream: Characterization and Combustion Emissions. October 1996. Prepared for the U.S. Environmental Protection Agency. EPA-600/R-96-119a. Mercury and chlorine data for wood and wood residues from Tables 7-32 and 7-33.
2. Black and Veatch. Final Technical Report for the JEA Large-Scale CFB Combustion
Demonstration Project. June 2005. Prepared for the U.S. Department of Energy and the National Energy Technology Laboratory (NETL). Cooperative Agreement No. DE-FC21-90MC27403. Presents results for the Jacksonville Electric Authority testing of mercury emission rates using bituminous coal and petroleum coke. Test results showed Hg emissions of 80.0 lb/TW-h with Pittsburg 8 coal on 1/3/04, 83.3 lb/TW-h with 50% Pitt 8, 50% Pet Coke on 1/27/04, 3.4 lb/TW-h with Illinois 6 coal on 6/8/04, and 0.7 lb/TW-h with 80% Pet Coke, 20% Pitt 8 coal on 8/10/04.
3. Bustard, C., Durham, M. Ph.D., Lindsey, C., Starns, T., Martin, C., Schlager, R., Sjostrom, S.
ADA-ES, LLC; Renninger, S., McMahon, T. U.S. DOE, National Energy Technology Laboratory; Monroe, L. Ph.D., Goodman, J. M. Southern Company; Miller, R. Hamon Research Cottrell; Chang, R. Ph.D. EPRI; and Johnson, D., We Energies. Results Of Activated Carbon Injection For Mercury Control Upstream Of A COHPAC Fabric. May 2003. Institute of Clean Air Companies. http://www.icac.com/files/public/MEGA03_82_Hg.pdf. Mass transfer from the gas-phase to the particle efficiency analysis.
4. Conn, R.E. and Sellakumar, K. Utilization of CFB Fly Ash for Construction Applications: Table 1.
May 1999. Foster Wheeler Development Corporation; A. E. Bland, Western Research Institute. LOI levels of fluidized bed boilers range from 2% to 20%, with typical levels of 3 - 6%.
5. Electric Power Research Institute. Emission Factors Handbook: Guidelines for Estimating Trace
Substance Emissions from Fossil fuel Steam Electric Plants. Final Report. April 2002. Removal rates of HCl (97%) and HF (94%) are obtainable with units utilizing flue gas desulfurization systems.
6. Kilgroe, J.D., Sedman, C.B., Srivastava, R.K., Ryan, J.V., Lee, C.W. Control of Mercury Emissions
from Coal-Fired Utility Boilers: Interim Report Including Errata Dated 3-21-02. March 2002. Prepared for the Us. Environmental Protection Agency. EPA-600/R-01-109. Washington. Government Printing Office 2002. United States. (0431-Y (online)). Used by the U.S. EPA to establish the proposed mercury MACT standards.
7. Massachusetts Department of Environmental Protection. State Plan for the Clean Air Mercury
Rule (CAMR): 310 CMR 7.29(5)(a)3.e Emission Standards for Power Plants. October 2006. State mercury emission limits of 7.5 lb/TW-h.
Page 3 of 7
8. Nelson, S. Jr., Landreth, R. Ph.D., Zhou, Q. Ph.D., and Miller, J. Accumulated Power-Plant Mercury-Removal Experience with Brominated PAC Injection. September 2004. Sorbent Technologies Corporation. PAC tests indicate mercury removal efficiencies of 70% to 95%.
9. New Jersey Department of Environmental Protection. Control and Prohibition of Mercury
Emissions: N.J.A.C. 7:27-27.7. December 2004. New Jersey Register. http://www.nj.gov/dep/rules/adoptions/mercury_rule7-27.pdf. State mercury emission limits of 6.6 lb/TW-h.
10. State of Wisconsin Natural Resources Board. Administrative Rule AM-32-05: NR 446 Revisions to
the State Mercury Rule Requirements. March 2008. Amendments to NR 466, Wis. Adm. Code stating that large coal-fired power plants must achieve a 90% reduction in mercury emissions, or limit mercury emissions to 0.0080 pounds per gigawatt-hour (8.0 lb/TW-h) by January 1, 2015.
11. Staudt, J.E. and Jozewicz, W. Performance and Cost of Mercury and Multipollutant Emission
Control Technology Applications on Electric Utility Boilers. October 2003. Prepared for the U.S. Environmental Protection Agency. EPA-600/R-03-110. Data used to develop mercury emission formulas.
12. The National Association of Clean Air Agencies. State Mercury Programs for Utilities. December
2007. http://www.4cleanair.org/Documents/StateTable.pdf Summary of state actions to reduce mercury emissions from coal-fired electric utility boilers.
13. U.S. Congress. Clean Air Act Amendments of 1990, Section 112. Washington. Government
Printing Office 1990. United States. (431-I-1). 14. U.S. Congress. Clean Air Act Amendments of 1990, Section 112(a)8. Washington. Government
Printing Office 1990. United States. (431-I-1). 15. U.S. Congress. Clean Air Act Amendments of 1990, Section 112(c). Washington. Government
Printing Office 1990. United States. (431-I-1). 16. U.S. Congress. Clean Air Act Amendments of 1990, Section 112(c)5. Washington. Government
Printing Office 1990. United States. (431-I-1). 17. U.S. Congress. Clean Air Act Amendments of 1990, Section 112(d)1. Washington. Government
Printing Office 1990. United States. (431-I-1). 18. U.S. Congress. Clean Air Act Amendments of 1990, Section 112(d)2. Washington. Government
Printing Office 1990. United States. (431-I-1). 19. U.S. Congress. Clean Air Act Amendments of 1990, Section 112(d)3. Washington. Government
Printing Office 1990. United States. (431-I-1). 20. U.S. Congress. Clean Air Act Amendments of 1990, Section 112(g)2. Washington. Government
Printing Office 1990. United States. (431-I-1). 21. U.S. Congress. Clean Air Act Amendments of 1990, Section 112(n). Washington. Government
Printing Office 1990. United States. (431-I-1).
Page 4 of 7
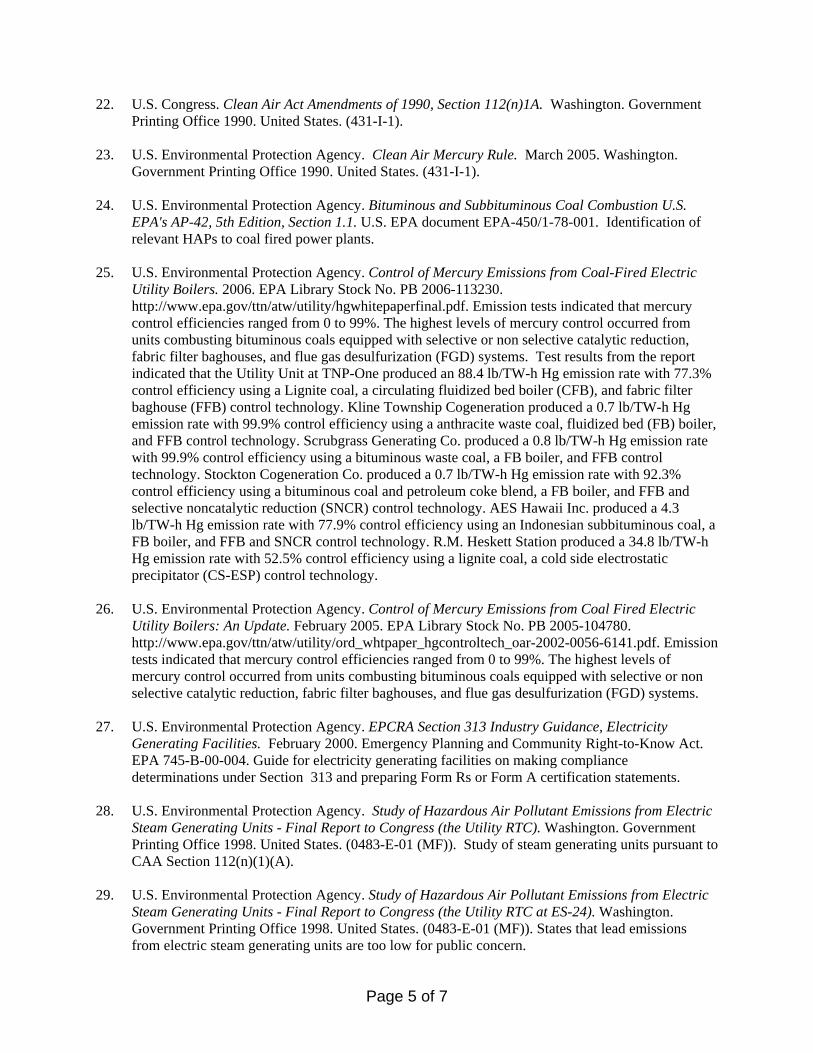
22. U.S. Congress. Clean Air Act Amendments of 1990, Section 112(n)1A. Washington. Government Printing Office 1990. United States. (431-I-1).
23. U.S. Environmental Protection Agency. Clean Air Mercury Rule. March 2005. Washington.
Government Printing Office 1990. United States. (431-I-1). 24. U.S. Environmental Protection Agency. Bituminous and Subbituminous Coal Combustion U.S.
EPA's AP-42, 5th Edition, Section 1.1. U.S. EPA document EPA-450/1-78-001. Identification of relevant HAPs to coal fired power plants.
25. U.S. Environmental Protection Agency. Control of Mercury Emissions from Coal-Fired Electric
Utility Boilers. 2006. EPA Library Stock No. PB 2006-113230. http://www.epa.gov/ttn/atw/utility/hgwhitepaperfinal.pdf. Emission tests indicated that mercury control efficiencies ranged from 0 to 99%. The highest levels of mercury control occurred from units combusting bituminous coals equipped with selective or non selective catalytic reduction, fabric filter baghouses, and flue gas desulfurization (FGD) systems. Test results from the report indicated that the Utility Unit at TNP-One produced an 88.4 lb/TW-h Hg emission rate with 77.3% control efficiency using a Lignite coal, a circulating fluidized bed boiler (CFB), and fabric filter baghouse (FFB) control technology. Kline Township Cogeneration produced a 0.7 lb/TW-h Hg emission rate with 99.9% control efficiency using a anthracite waste coal, fluidized bed (FB) boiler, and FFB control technology. Scrubgrass Generating Co. produced a 0.8 lb/TW-h Hg emission rate with 99.9% control efficiency using a bituminous waste coal, a FB boiler, and FFB control technology. Stockton Cogeneration Co. produced a 0.7 lb/TW-h Hg emission rate with 92.3% control efficiency using a bituminous coal and petroleum coke blend, a FB boiler, and FFB and selective noncatalytic reduction (SNCR) control technology. AES Hawaii Inc. produced a 4.3 lb/TW-h Hg emission rate with 77.9% control efficiency using an Indonesian subbituminous coal, a FB boiler, and FFB and SNCR control technology. R.M. Heskett Station produced a 34.8 lb/TW-h Hg emission rate with 52.5% control efficiency using a lignite coal, a cold side electrostatic precipitator (CS-ESP) control technology.
26. U.S. Environmental Protection Agency. Control of Mercury Emissions from Coal Fired Electric
Utility Boilers: An Update. February 2005. EPA Library Stock No. PB 2005-104780. http://www.epa.gov/ttn/atw/utility/ord_whtpaper_hgcontroltech_oar-2002-0056-6141.pdf. Emission tests indicated that mercury control efficiencies ranged from 0 to 99%. The highest levels of mercury control occurred from units combusting bituminous coals equipped with selective or non selective catalytic reduction, fabric filter baghouses, and flue gas desulfurization (FGD) systems.
27. U.S. Environmental Protection Agency. EPCRA Section 313 Industry Guidance, Electricity
Generating Facilities. February 2000. Emergency Planning and Community Right-to-Know Act. EPA 745-B-00-004. Guide for electricity generating facilities on making compliance determinations under Section 313 and preparing Form Rs or Form A certification statements.
28. U.S. Environmental Protection Agency. Study of Hazardous Air Pollutant Emissions from Electric
Steam Generating Units - Final Report to Congress (the Utility RTC). Washington. Government Printing Office 1998. United States. (0483-E-01 (MF)). Study of steam generating units pursuant to CAA Section 112(n)(1)(A).
29. U.S. Environmental Protection Agency. Study of Hazardous Air Pollutant Emissions from Electric
Steam Generating Units - Final Report to Congress (the Utility RTC at ES-24). Washington. Government Printing Office 1998. United States. (0483-E-01 (MF)). States that lead emissions from electric steam generating units are too low for public concern.
Page 5 of 7
30. U.S. Environmental Protection Agency. Study of Hazardous Air Pollutant Emissions from Electric Steam Generating Units - Final Report to Congress (the Utility RTC at ES-27). Washington. Government Printing Office 1998. United States. (0483-E-01 (MF)). Reports on mercury emissions from electric steam generating units.
31. U.S. Environmental Protection Agency. U.S. EPA’s National Coal-Fired Utility Projects
Spreadsheet. RBLC database. March 2008. Summary of recent mercury emission limits for circulating fluidized bed coal-fired boilers.
32. U.S. Federal Register. Hazardous Air Pollutants: Regulations Governing Constructed or
Reconstructed Major Sources, 40 CFR § 60.45Da(a)1. Under Environmental Protection Agency. June 1999. Volume 64. No. 125. Pg. 35029-35032.
33. U.S. Federal Register. Hazardous Air Pollutants: Regulations Governing Constructed or
Reconstructed Major Sources, 40 CFR § 60.45Da(a)2. Under Environmental Protection Agency. June 1999. Volume 64. No. 125. Pg. 35029-35032.
34. U.S. Federal Register. Hazardous Air Pollutants: Regulations Governing Constructed or
Reconstructed Major Sources, 40 CFR § 60.45Da(a)4. Under Environmental Protection Agency. June 1999. Volume 64. No. 125. Pg. 35029-35032.
35. U.S. Federal Register. Hazardous Air Pollutants: Regulations Governing Constructed or
Reconstructed Major Sources, 40 CFR § 60.45Da(a)5. Under Environmental Protection Agency. June 1999. Volume 64. No. 125. Pg. 35029-35032.
36. U.S. Federal Register. Hazardous Air Pollutants: Regulations Governing Constructed or
Reconstructed Major Sources, 40 CFR § 63.40(c). Under Environmental Protection Agency. June 1999. Volume 64. No. 125. Pg. 35029-35032.
37. U.S. Federal Register. Hazardous Air Pollutants: Regulations Governing Constructed or
Reconstructed Major Sources, 40 CFR § 63.41. Under Environmental Protection Agency. June 1999. Volume 64. No. 125. Pg. 35029-35032.
38. U.S. Federal Register. Hazardous Air Pollutants: Regulations Governing Constructed or
Reconstructed Major Sources, 40 CFR § 63.43(d). Under Environmental Protection Agency. June 1999. Volume 64. No. 125. Pg. 35029-35032.
39. U.S. Federal Register. Hazardous Air Pollutants: Regulations Governing Constructed or
Reconstructed Major Sources, 40 CFR § 63.43(d)1. Under Environmental Protection Agency. June 1999. Volume 64. No. 125. Pg. 35029-35032.
40. U.S. Federal Register. Hazardous Air Pollutants: Regulations Governing Constructed or
Reconstructed Major Sources, 40 CFR § 63.43(e).Under Environmental Protection Agency. June 1999. Volume 64. No. 125. Pg. 35029-35032.
41. U.S. Federal Register. National Emission Standards for Hazardous Air Pollutants for Industrial,
Commercial, and Institutional Boilers and Process Heaters. Under Environmental Protection Agency. September 2004. Volume 69. No. 176. Pg. 55218.
Page 6 of 7
42. U.S. Federal Register. National Emission Standards for Hazardous Air Pollutants: Revision of Source Category List Under Section 112 of the Clean Air Act. Under Environmental Protection Agency. February 2002. Volume 67. No. 29. Pg. 6521, 6524.
43. U.S. Federal Register. Proposed National Emission Standards for Hazardous Air Pollutants; and,
in the Alternative, Proposed Standards of Performance for New and Existing Stationary Sources: Electric Utility Steam Generating Units. Under Environmental Protection Agency. January 2004. Volume 69. No. 20. Pg. 4652.
44. U.S. Federal Register. Proposed National Emission Standards for Hazardous Air Pollutants; and,
in the Alternative, Proposed Standards of Performance for New and Existing Stationary Sources: Electric Utility Steam Generating Units. Under Environmental Protection Agency. January 2004. Volume 69. No. 20. Pg. 4660.
45. U.S. Federal Register. Regulatory Finding on the Emissions of Hazardous Air Pollutants From
Electric Utility Steam Generating Units. Under Environmental Protection Agency. December 2000. Volume 65. No. 245. Pg. 79825, 79827.
46. U.S. Federal Register. Revision of December 2000 Regulatory Finding on the Emissions of
Hazardous Air Pollutants From Electric Utility Steam Generating Units and the Removal of Coal- and Oil-Fired Electric Utility Steam Generating Units From the Section 112(c) List. Under Environmental Protection Agency. March 2005. Volume 70. No. 59. Pg. 15994.
47. U.S. Federal Register. Standards of Performance for New and Existing Stationary Sources: Electric
Utility Steam Generating Units. Under Environmental Protection Agency. May 2005. Volume 70. No. 95. Pg. 28606.
48. Washington D.C. Circuit Court. New Jersey v. EPA, 517 F.3d 574 (2008). Calls for the reevaluation
of the Clean Air Mercury Rule. 49. Wisconsin Department of Natural Resources. Chapter NR 446.05(1) Mercury emission limits for
new or modified sources. September 2004. Wisconsin Administrative Register. No. 585. 50. Wisconsin Department of Natural Resources. Chapter NR 446.05(2) Mercury emission limits for
new or modified sources. September 2004. Wisconsin Administrative Register. No. 585..
Page 7 of 7
Response of Wisconsin Power and Light Company
to The Wisconsin Department of Natural Resources
Data Request No. DNR-SDD-13 Docket Number: 6680-CE-170 Date of Request: May 7, 2008 Response Due: June 27, 2008 Information Requested By: Steven Dunn Date Responded: June 27, 2008 Author: Jeff Hanson Author’s Title: Sr. Environmental Specialist Author’s Telephone No.: (608) 458-0419 Witness: (If other than Author) Data Request No. DNR-SDD-13:
Question regarding the 112(g) analysis for mercury:
Proposed limits: It is unlikely that the Department will place in the permit that this is "LAER" for mercury emissions
Response: Since the Lowest Achievable Emission Rate ("LAER") is not currently an applicable requirement for mercury, WPL understands the DNR's current position on this issue. However, WPL reserves the right to raise this issue later as part of the permit issuance process should applicable requirements change.
Page 1 of 1
Response of Wisconsin Power and Light Company
to The Wisconsin Department of Natural Resources
Data Request No. DNR-SDD-14 Docket Number: 6680-CE-170 Date of Request: May 7, 2008 Response Due: June 27, 2008 Information Requested By: Steven Dunn Date Responded: June 27, 2008 Author: Jeff Hanson Author’s Title: Sr. Environmental Specialist Author’s Telephone No.: (608) 458-0419 Witness: (If other than Author) Data Request No. DNR-SDD-14:
Question regarding the 112(g) analysis for mercury:
The optimization study does not seem to account for the possibility that a more stringent limitation than that proposed in the permit could be achieved through the addition of PAC and/or other types of sorbents. It seems to the Department that if lower rates than those in the permit can be achieved through this optimization, they should be required to be met and the unit not allowed to operate without the best controls in place The Department requests an amended optimization plan that allows for this lower emission rates to become MACT based on the study.
Response: As WPL stated in the mercury MACT analysis, the technology for the control of mercury emissions is still developing, and the measurement of mercury emissions still has substantial uncertainties. This is why WPL has proposed an optimization study to confirm the achievable emission rates for these proposed control technologies consistent with the air permits issued to Weston 4 and We Energies Elm Road Generation Station (Permit 03-RV-248, 10/14/04 and Permit 03-RV-166, 1/14/04 respectively). The proposed MACT requirements for mercury were developed using the prescribed process pursuant to 40 C.F.R. § 63.43(d) and, if approved, will be established within the air permit. If the optimization study concludes that more restrictive MACT requirements could be demonstrated on a long term basis, then WPL is willing to propose more restrictive MACT requirements as permit revisions. However, if the optimization study concludes that the proposed limits are not achievable on a long term basis, then WPL will need to request permit revisions to the MACT requirements that NED 3 will be able to demonstrate compliance with on a long term basis.
Page 1 of 1
Response of Wisconsin Power and Light Company
to The Wisconsin Department of Natural Resources
Data Request No. DNR-SDD-15 Docket Number: 6680-CE-170 Date of Request: May 7, 2008 Response Due: June 27, 2008 Information Requested By: Steven Dunn Date Responded: June 27, 2008 Author: Jeff Hanson Author’s Title: Sr. Environmental Specialist Author’s Telephone No.: (608) 458-0419 Witness: (If other than Author) Data Request No. DNR-SDD-15:
Question regarding the 112(g) analysis for mercury:
Optimization study - The plan seems to call for only one mercury specific control technology to be evaluated (use of the word the). Is this the intent? If so, why should only one technology be evaluated?
Response: Yes, this is the intent. The mercury MACT analysis concluded that there is currently only one technically feasible mercury specific control technology – mercury sorbent injection. Other mercury control technologies such as mercury oxidation catalysts are not commercially available and demonstrated in practice on full scale utility units. Please note that while WPL has concluded in the MACT analysis that there is only one technically feasible mercury specific control technology for NED 3 – mercury sorbent injection – WPL does believe that the sorbent used to control mercury is likely to change between now and commercial operations, and in all likelihood, improve in terms of oxidation efficiency with time. Therefore, WPL believes that the optimization study will include the evaluation of mercury sorbents available commercially at the time of the study to determine the most suitable sorbent for NED 3.
Page 1 of 1
Response of Wisconsin Power and Light Company
to The Wisconsin Department of Natural Resources
Data Request No. DNR-SDD-16 Docket Number: 6680-CE-170 Date of Request: May 7, 2008 Response Due: June 27, 2008 Information Requested By: Steven Dunn Date Responded: June 27, 2008 Author: Jeff Hanson Author’s Title: Sr. Environmental Specialist Author’s Telephone No.: (608) 458-0419 Witness: (If other than Author) Data Request No. DNR-SDD-16:
Question regarding the 112(g) analysis for mercury:
What would be the impact of using SCR to control NOx in place of the SNCR proposed by Alliant on mercury emissions? Response: As noted in the NOx BACT review, the only technically feasible NOx control system using SCR technology for a CFB boiler would be a tail-gas SCR installed downstream of the FGD system and fabric filter baghouse. Such technology has not been applied in industry and it is uncertain if NOx control would be any better than SNCR control. In a tail gas SCR configuration, there would be no sulfur dioxide or particulate matter control systems located downstream. Even though an SCR catalyst may enhance oxidation of elemental mercury still present in the exhaust gas stream, there would be no pollution control systems downstream of the tail-gas SCR to capture any ensuing oxidized mercury.
Page 1 of 1
Response of Wisconsin Power and Light Company
to The Wisconsin Department of Natural Resources
Data Request No. DNR-SDD-17 Docket Number: 6680-CE-170 Date of Request: May 8, 2008 Response Due: June 27, 2008 Information Requested By: Steven Dunn Date Responded: June 27, 2008 Author: Jeff Hanson Author’s Title: Sr. Environmental Specialist Author’s Telephone No.: (608)458-0419 Witness: (If other than Author) Data Request No. DNR-SDD-17:
Question regarding the 4/30 response document:
Concerning the use of limestone injection to control SO2. Is the injection of limestone necessary for CFB boiler operation? There is discussion in the mercury 112(g) submittal about requiring large amounts of limestone to control SO2 emissions (p.41 of the submittal). What is the impact of using less limestone, allowing for a higher SO2 rate from the boiler, on the choice of add-on SO2 control technology and on mercury emission limitations and control technologies?
Response:
WPL has evaluated these questions under the assumption that WDNR is concerned about the increased amount of mercury brought into the CFB boiler in the form of both fuel and limestone contributions. It is noted that, to date, WPL has used conservative estimates for mercury content in limestone from a very small subset of available data and that further assessment by WPL and its consultants is underway. While injection of limestone into the CFB boiler is not strictly necessary for a CFB to combust fuel, the choice of limestone as the preferred fluidizing media has become an inherent design concept for CFB boiler technology through the development work of the US Department of Energy Clean Coal Technology program because limestone has been shown to be the most effective alternative to date at removing high percentages of sulfur compounds from the CFB boiler exhaust. Limestone will decompose at approximately 1,650 OF (approximate combustion temperature at bed) to form calcium oxide and carbon dioxide. The calcium oxide reacts with gaseous sulfur dioxide to form solid calcium sulfate particles that mix with ash. When even higher SO2 emission control efficiencies are required, as is the case for
Page 1 of 3
the current proposed limits in the air permit application, the effectiveness of limestone injected into the boiler is further augmented via a polishing scrubber and hydrated lime sorbent as the control strategy of choice, as has been proposed for NED3.
When low sulfur fuels such as subbituminous coal are used, very high calcium to sulfur (Ca/S) ratios and very low SO2 emission rates can be achieved with little or no addition of hydrated lime in the polishing scrubber, relying instead upon the carryover of flyash and limestone into the scrubber and the scrubbing potential of these materials after they have been captured on the downstream fabric filter media and “recycled”. If limestone is eliminated from use in the CFB boiler and a wet FGD system were to be considered, admittedly an extreme alternative, the emission control system would require fabric filtration prior to scrubbing,. Even with the use of some other fluidizing media, the carryover of particulate matter would be detrimental to a wet FGD without prior filtration. Wet FGD systems with uncontrolled SO2 emission rates typical of those found with boilers firing subbituminous coals have long-term demonstrated emission control efficiencies of slightly less than 96 percent.1 The resulting SO2 emission rate would be comparable to the rate proposed by WPL by way of the CFB and polishing FGD.
With respect to mercury emissions, CFB technology utilizing a fabric filter baghouse for control of particulate emissions has been shown to emit less mercury per unit of heat input than other coal fired combustion technologies used in the electric utility industry. While reducing the amount of limestone utilized by the CFB to control SO2 emissions may reduce the amount of mercury added to the emissions stream, additional mercury could be added to the emissions stream in the polishing FGD due to potentially higher levels of lime necessary to meet the SO2 limitation. The one identified data point for emission control efficiencies for mercury from power plants using CFB technology firing subbituminous coals (AES Hawaii) indicates a native capture of 77.9 percent for a system employing fabric filtration and SNCR control technologies.2 This native mercury control efficiency is among the highest achieved by units firing subbituminous coal. Further emission control of mercury for NED 3 can be achieved by the mercury sorbent injection system proposed in the case-by-case MACT analysis. Since WPL has proposed a 90% reduction in mercury emissions exiting the CFB boiler as a component of its mercury MACT, changing the amount of limestone added to the CFB boiler may not impact this proposal, however additional lime added to the polishing FGD could make it more difficult to meet this proposed MACT emission reduction. For medium to high sulfur fuels (bituminous coals and petroleum coke for example), a reduction in the overall control efficiency for sulfur dioxide would occur if the amount of limestone injected in the boiler were suppressed and the ability of the FGD system was depended upon to compensate for said change. Though the data
1 Prevention of Significant Deterioration Construction Permit Application (Revision 1) Volume 2 of 2; of the Nelson Dewey Generating Station NED 3 Project; Grant County, Wisconsin; Figure 2-3; February 2008 2 Section 112(g) of the Clean Air Act Case‐by‐Case Maximum Achievable Control Technology (MACT) Analysis; Nelson Dewey Generating Station Unit 3. Wisconsin Power and Light Company Nelson Dewey Generating Station; April, 2008
Page 2 of 3
is not entirely conclusive, there is some suggestion that increasing the CA/S ratio in a CFB boiler can substantially reduce emissions of mercury.3 This information appears consistent with findings from the USEPA that mercury emissions from CFB boilers tend to be lower than for other utility boilers. 4 The interactions between the various operating conditions (limestone injection rates, fuel types, etc.) and the ability of the CFB, fabric filter and dry FGD to simultaneously control NOx, SO2 and mercury are extremely complex. This complexity underscores the need for the optimization study proposed by WPL to address impacts on the various emission rates resulting from operational changes. In addition to WPL's continued evaluation of the impacts of fuel blends on resulting emissions and controls thereof, WPL is also confirming that recent decisions to co-burn 20% renewable resource fuels within five years of NED 3 reaching COD will not change any conclusions in its BACT analyses. Thus, WPL is in the process of reevaluating its existing SO2 BACT analysis to:
(i) confirm whether increasing renewable resource co-burn to 20 percent within five years after NED 3 reaches COD will impact existing conclusions;
(ii) confirm whether different estimates of mercury content in limestone should be used than what is currently used in the existing analysis;
(iii) evaluate the impact of using less limestone on the choice of add-on SO2 control technology, on mercury emission limitations and control technologies, and;
(iv) evaluate whether increasing the co-burn to 20 percent will have any impact on these questions.
The results of this reevaluation will be submitted to the DNR as an amendment to the current NED 3 PSD Construction Permit Application.
3 Emissions from a Circulating and a Stationary Fluid Bed Combustor: A Comparison; B. Leckner and L.E. Amand; Chalmers University of Technology; department of Energy Conversion, Goteborg, Sweden; Proceedings of the 1987 International Conference on Fluidized Bed Combustion, Boston, May 3 – 7, 1987 (Table 3) 4 Section 112(g) of the Clean Air Act Case‐by‐Case Maximum Achievable Control Technology (MACT) Analysis; Nelson Dewey Generating Station Unit 3. Wisconsin Power and Light Company Nelson Dewey Generating Station; April, 2008 (page iii)
Page 3 of 3
Response of Wisconsin Power and Light Company
to The Wisconsin Department of Natural Resources
Data Request No. DNR-SDD-18 Docket Number: 6680-CE-170 Date of Request: May 8, 2008 Response Due: June 27, 2008 Information Requested By: Steven Dunn Date Responded: June 27, 2008 Author: Jeff Hanson Author’s Title: Sr. Environmental Specialist Author’s Telephone No.: (608) 458-0419 Witness: (If other than Author) Data Request No. DNR-SDD-18:
Question regarding the 4/30 response document:
The Department would like to see the inputs and outputs from the cost models used. The department is also interested in discussing the cost figures provided by Burns and McDonnell in more detail.
Response:
WPL, Burns & McDonnell and WDNR discussed the cost data used in the February 2008 BACT analysis on May 22, 2008. The following information is provided in response to that discussion. Basis of WPL BACT cost estimates are a combination of the results of an EPA program CUECost (Version 1 available at http://www.epa.gov/ttncatc1/products.html), Burns & McDonnell experience with recent projects and vendor papers. The version of CUECost that is utilized by Burns & McDonnell has been modified to correct certain mistakes found in the original programming. The inputs were adjusted to reflect the conditions specific to NED3 and today’s market conditions. Below is a summary of the factors input to CUECost that have the greatest significance and a discussion of how costs not available from CUECost were developed.
Basic Information Common for all Equipment Include:
Unit size: 3,200 MBtu/hr Total Air: 118% Air Heater Leakage 10%
Page 1 of 3
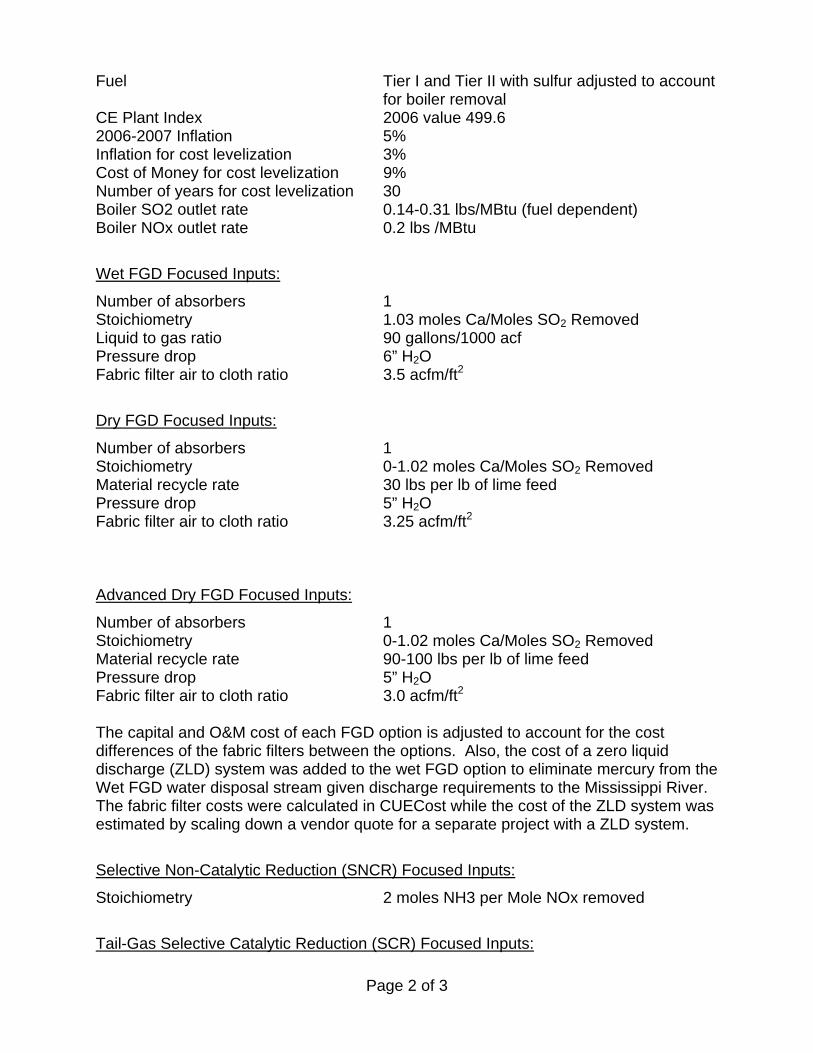
Fuel Tier I and Tier II with sulfur adjusted to account for boiler removal
CE Plant Index 2006 value 499.6 2006-2007 Inflation 5% Inflation for cost levelization 3% Cost of Money for cost levelization 9% Number of years for cost levelization 30 Boiler SO2 outlet rate 0.14-0.31 lbs/MBtu (fuel dependent) Boiler NOx outlet rate 0.2 lbs /MBtu
Wet FGD Focused Inputs:
Number of absorbers 1 Stoichiometry 1.03 moles Ca/Moles SO2 Removed Liquid to gas ratio 90 gallons/1000 acf Pressure drop 6” H2O Fabric filter air to cloth ratio 3.5 acfm/ft2
Dry FGD Focused Inputs:
Number of absorbers 1 Stoichiometry 0-1.02 moles Ca/Moles SO2 Removed Material recycle rate 30 lbs per lb of lime feed Pressure drop 5” H2O Fabric filter air to cloth ratio 3.25 acfm/ft2
Advanced Dry FGD Focused Inputs:
Number of absorbers 1 Stoichiometry 0-1.02 moles Ca/Moles SO2 Removed Material recycle rate 90-100 lbs per lb of lime feed Pressure drop 5” H2O Fabric filter air to cloth ratio 3.0 acfm/ft2 The capital and O&M cost of each FGD option is adjusted to account for the cost differences of the fabric filters between the options. Also, the cost of a zero liquid discharge (ZLD) system was added to the wet FGD option to eliminate mercury from the Wet FGD water disposal stream given discharge requirements to the Mississippi River. The fabric filter costs were calculated in CUECost while the cost of the ZLD system was estimated by scaling down a vendor quote for a separate project with a ZLD system.
Selective Non-Catalytic Reduction (SNCR) Focused Inputs:
Stoichiometry 2 moles NH3 per Mole NOx removed
Tail-Gas Selective Catalytic Reduction (SCR) Focused Inputs:
Page 2 of 3
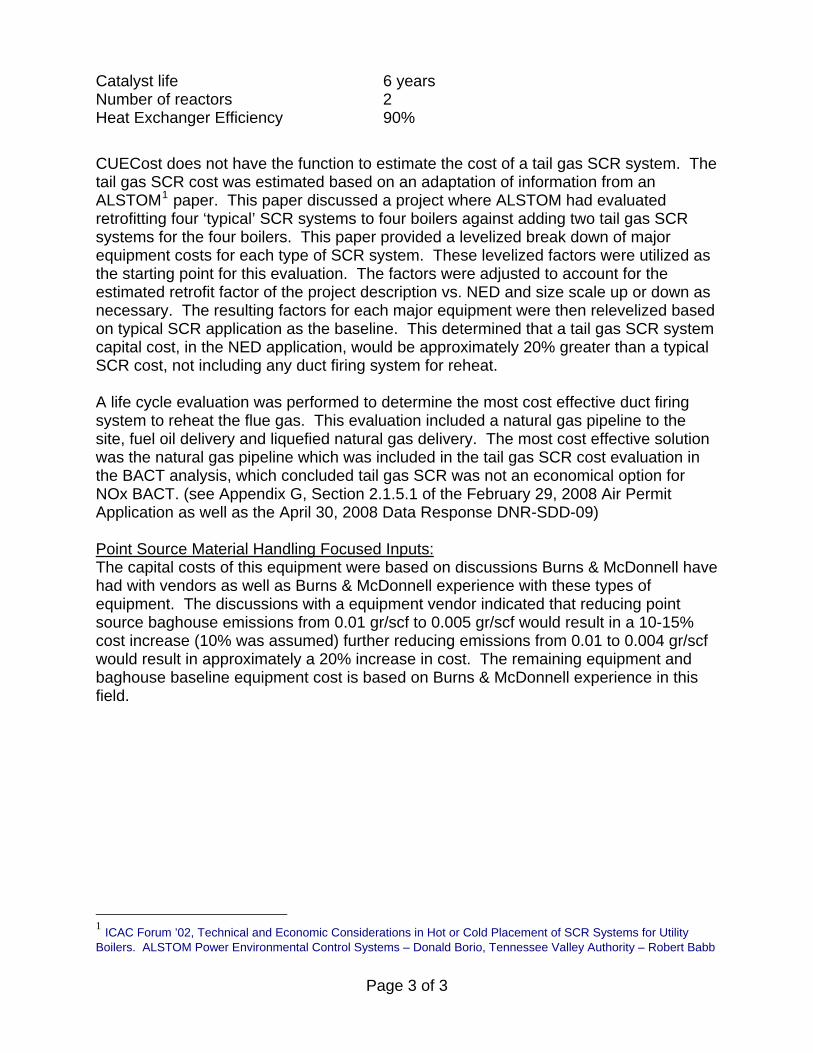
Catalyst life 6 years Number of reactors 2 Heat Exchanger Efficiency 90%
CUECost does not have the function to estimate the cost of a tail gas SCR system. The tail gas SCR cost was estimated based on an adaptation of information from an ALSTOM1 paper. This paper discussed a project where ALSTOM had evaluated retrofitting four ‘typical’ SCR systems to four boilers against adding two tail gas SCR systems for the four boilers. This paper provided a levelized break down of major equipment costs for each type of SCR system. These levelized factors were utilized as the starting point for this evaluation. The factors were adjusted to account for the estimated retrofit factor of the project description vs. NED and size scale up or down as necessary. The resulting factors for each major equipment were then relevelized based on typical SCR application as the baseline. This determined that a tail gas SCR system capital cost, in the NED application, would be approximately 20% greater than a typical SCR cost, not including any duct firing system for reheat. A life cycle evaluation was performed to determine the most cost effective duct firing system to reheat the flue gas. This evaluation included a natural gas pipeline to the site, fuel oil delivery and liquefied natural gas delivery. The most cost effective solution was the natural gas pipeline which was included in the tail gas SCR cost evaluation in the BACT analysis, which concluded tail gas SCR was not an economical option for NOx BACT. (see Appendix G, Section 2.1.5.1 of the February 29, 2008 Air Permit Application as well as the April 30, 2008 Data Response DNR-SDD-09) Point Source Material Handling Focused Inputs: The capital costs of this equipment were based on discussions Burns & McDonnell have had with vendors as well as Burns & McDonnell experience with these types of equipment. The discussions with a equipment vendor indicated that reducing point source baghouse emissions from 0.01 gr/scf to 0.005 gr/scf would result in a 10-15% cost increase (10% was assumed) further reducing emissions from 0.01 to 0.004 gr/scf would result in approximately a 20% increase in cost. The remaining equipment and baghouse baseline equipment cost is based on Burns & McDonnell experience in this field.
1 ICAC Forum ’02, Technical and Economic Considerations in Hot or Cold Placement of SCR Systems for Utility Boilers. ALSTOM Power Environmental Control Systems – Donald Borio, Tennessee Valley Authority – Robert Babb
Page 3 of 3
Response of Wisconsin Power and Light Company
to The Wisconsin Department of Natural Resources
Data Request No. DNR-SDD-19 Docket Number: 6680-CE-170 Date of Request: May 8, 2008 Response Due: June 27, 2008 Information Requested By: Steven Dunn Date Responded: June 27, 2008 Author: Jeff Hanson Author’s Title: Sr. Environmental Specialist Author’s Telephone No.: (608) 458-0419 Witness: (If other than Author) Data Request No. DNR-SDD-19:
Question regarding the 4/30 response document:
It seems we may need a meeting to discuss limestone injection versus SO2 and NOx emission rates, the cost of such injection and the impact of such injection on the selection of add-on controls. Please let me know when such a meeting could be arranged.
Response: Representatives of WPL and WDNR met to discuss the limestone injection impact on SO2/NOx emission rates as well as its impact on mercury emissions on May 28, 2008. The discussion during this meeting clarified the data being requested of WPL by WDNR in regard to Data Requests DNR-SDD-16 and DNR-SDD-17.
Page 1 of 1