Embed Size (px)
Citation preview
JOURNAL OF BACTERIOLOGY, Feb. 2002, p. 1140–1154 Vol. 184, No. 40021-9193/02/$04.00�0 DOI: 10.1128/JB.184.4.1140–1154.2002Copyright © 2002, American Society for Microbiology. All Rights Reserved.
Pseudomonas aeruginosa Displays Multiple Phenotypes duringDevelopment as a Biofilm
Karin Sauer,1 Anne K. Camper,1 Garth D. Ehrlich,2 J. William Costerton,1 and David G. Davies3*Center for Biofilm Engineering, Montana State University-Bozeman, Bozeman, Montana1; Allegheny Singer Research Institute,
Pittsburgh, Pennsylvania2; and Department of Biological Sciences, State University of New York at Binghamton,Binghamton, New York3
Received 27 September 2001/Accepted 12 November 2001
Complementary approaches were employed to characterize transitional episodes in Pseudomonas aeruginosabiofilm development using direct observation and whole-cell protein analysis. Microscopy and in situ reportergene analysis were used to directly observe changes in biofilm physiology and to act as signposts to standardizeprotein collection for two-dimensional electrophoretic analysis and protein identification in chemostat andcontinuous-culture biofilm-grown populations. Using these approaches, we characterized five stages of biofilmdevelopment: (i) reversible attachment, (ii) irreversible attachment, (iii) maturation-1, (iv) maturation-2, and(v) dispersion. Biofilm cells were shown to change regulation of motility, alginate production, and quorumsensing during the process of development. The average difference in detectable protein regulation betweeneach of the five stages of development was 35% (approximately 525 proteins). When planktonic cells werecompared with maturation-2 stage biofilm cells, more than 800 proteins were shown to have a sixfold or greaterchange in expression level (over 50% of the proteome). This difference was higher than when planktonic P.aeruginosa were compared with planktonic cultures of Pseudomonas putida. Las quorum sensing was shown toplay no role in early biofilm development but was important in later stages. Biofilm cells in the dispersion stagewere more similar to planktonic bacteria than to maturation-2 stage bacteria. These results demonstrate thatP. aeruginosa displays multiple phenotypes during biofilm development and that knowledge of stage-specificphysiology may be important in detecting and controlling biofilm growth.
Recent investigations have been directed at determining thedegree to which gene regulation during biofilm developmentcontrols the switch from planktonic to attached growth. Brözeland coworkers monitored changes in global gene expressionpatterns in attached Pseudomonas aeruginosa cells and foundmore than 11 proteins whose levels were altered during variousstages of attachment (6). Genevaux and colleagues screened alibrary of Tn10 insertion mutants of Escherichia coli with al-tered adhesion abilities (18). Fifty adhesion-deficient mutantswere isolated which showed less than 40% attachment com-pared to the wild type, and 22 mutants were found with anattachment of 40 to 75% compared to the wild type. Themajority of these mutants were affected in motility. Prigent-Combaret and coworkers (42) carried out a screen in E. coliK-12 similar to that of Genevaux and revealed major changesin the patterns of gene expression during the switch fromplanktonic to attached growth. They found attachment-depen-dent regulation of gene expression in 38% of the generatedlacZ gene fusions (out of 446 clones). More recently, it hasbeen shown that in Pseudomonas putida, more than 30 genesand 40 gene products were altered within 6 h following attach-ment (47).
These results indicate that physiological changes in the tran-sition from planktonic to attached cells are profound and un-doubtedly complex. In addition, these results demonstrate thatbiofilm bacteria are physiologically different from planktonic
bacteria, but much work is still needed to completely charac-terize the developmental process of biofilm formation. One ofthe stepping stones in achieving this goal is to characterize thecomplete suite of physiological changes that occur during tran-sitional episodes in biofilm development, from initial attach-ment through detachment and reentry into planktonic growth.
While the reports above focus on initial attachment, thepresent study analyzed the physiological changes experiencedby P. aeruginosa during all stages of biofilm development. Ourstrategy was to characterize transitional episodes in biofilmdevelopment through direct observation by microscopy, eval-uating biofilm morphology, matrix polymer production, andactivation of quorum sensing-regulated genes. Knowledge ofthe onset of physiological characteristics specific to each phasewas used to determine the sampling times for protein analysesby two-dimensional gel electrophoresis. These analyses wereperformed by coordinating protein sampling with the onset ofbiofilm-specific characteristics such as activation of quorumsensing-regulated genes. Activation of quorum sensing wasconfirmed on the protein level by comparing protein patternsof P. aeruginosa strain PAO1 to the P. aeruginosa LasI mutantstrain PAO-JP1, a strain deficient in production of the lasquorum-sensing signal molecule 3O-C12-HSL (36). The studyindicated that P. aeruginosa displays multiple phenotypes withdistinct physiological characteristics (structural and metabolicchanges) that can be correlated to the episodes of biofilmdevelopment.
MATERIALS AND METHODS
Bacterial strains and media. The microorganisms used in this study are listedin Table 1. All planktonic cultures of P. aeruginosa and P. putida were grown at
* Corresponding author. Mailing address: Department of BiologicalSciences, State University of New York at Binghamton, Vestal Park-way, Binghamton, NY 13902. Phone: (607) 777-6211. Fax: (607) 777-6521. E-mail: [email protected].
1140
on August 25, 2019 by guest
http://jb.asm.org/
Dow
nloaded from
room temperature in glass chemostats (300 ml; flow rate 1.7 ml min�1) inminimal medium containing (per liter of H2O) 2.56 g of Na2HPO4, 2.08 g ofKH2PO4, 1.0 g of NH4Cl, 0.132 g of CaCl2 · 2H2O, 0.5 g of MgSO4 · 7H2O,0.1 mg of CuSO4 · 5H2O, 0.1 mg of ZnSO4 · H2O, 0.1 mg of FeSO4 · 7H2O, and0.004 mg of MnCl2 · 4H2O (pH 7.0). Glutamic acid (130 mg/liter) was used as thesole carbon source. The residence time of P. aeruginosa cells in the chemostatwas 170 min, in comparison to the doubling time (td) of 140 min in suspension.
Microscopic analysis. A continuous-culture once-through flow cell was con-figured to observe the growth and development of biofilms attached to a glasssubstratum. The flow cell was constructed of polycarbonate containing a cham-ber 1.0 mm by 1.4 cm by 4.0 cm capped with a glass cover slip. Sterile minimalmedium was pumped from a 10-liter vessel through silicone tubing to the flowcell using a Masterflex 8-roller-head peristaltic pump at a flow rate of 0.13 mlmin�1. Flow through the chamber was laminar, with a Reynolds number of 0.17,having a fluid residence time of 4.3 min. Medium leaving the flow cell wasdischarged to an effluent reservoir via silicone tubing. The entire system wasclosed to the outside environment but maintained in equilibrium with atmo-spheric pressure by a 0.2-�m-pore-size gas-permeable filter fitted to each vessel.
Log-phase P. aeruginosa (approximately 108 CFU/ml) were inoculated as a3.0-ml slug dose through a septum 4 cm upstream from the flow cell underflowing conditions. Cells attached to the inner surface of the glass cover slip wereviewed by transmitted light or epi-UV illumination using an Olympus BX60microscope and a 100� magnification A100PL objective lens or a 50� magni-fication ULWD MSPlan long working distance Olympus objective lens. Allimages were captured using a Magnafire cooled three-chip charge-coupled de-vice (CCD) camera (Optronics Inc., Galena, Calif.) and stored as separate digitalfiles for subsequent retrieval and analysis.
P. aeruginosa were grown in the flow cell for up to 12 days. Previous work inour laboratories has shown P. aeruginosa to develop steady-state biofilms follow-ing a continuous culture period of 7 to 9 days. Steady state is defined by nochange in effluent cell counts (CFU) resulting from detached biofilm cells; insteady state, growth of the biofilm is balanced by detachment. Individual cellclusters were examined during the course of each experiment and assigned gridcoordinates, which were reexamined periodically during the course of the exper-iments. Size measurements were taken of random cell clusters by locating thecluster nearest to a randomly selected microscope stage coordinate. Each cellcluster was measured to determine its height by focusing from the substratumthrough to the apex of the cluster, and its width by measurement at the base ofthe cell cluster using a stage micrometer. Cell clusters were defined as cellsembedded within an exopolysaccharide matrix attached to the substratum andlacking motility; void areas within cell clusters were determined by the observa-tion of free-swimming bacteria within a space inside a cell cluster.
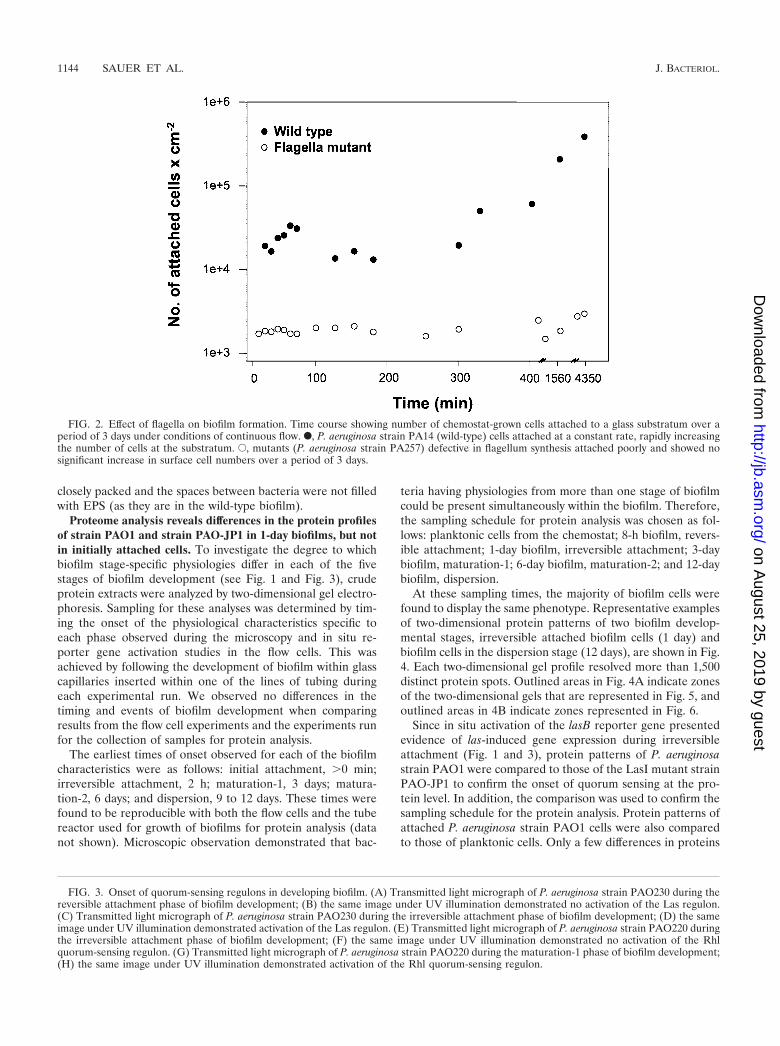
Effect of flagella on biofilm development. Cultures of the nonmotile P. aerugi-nosa strain PA257 (carrying a mutation in flgK [32]) and the parental P. aerugi-nosa strain PA14 were analyzed for their ability to attach to a glass substratumby continuously pumping cells from a chemostat at 0.13 ml min�1 through a flowcell (described above). Direct counts of total cells attached to 1.2 mm2 of theglass surface were taken at intervals for up to 3 days and recorded. Experimentswere run in duplicate for the wild type and quadruplicate for the mutant.
Activation of lasB and rhlA during biofilm development. To determine thetiming of activation of the quorum-sensing regulons Las and Rhl, cultures of P.aeruginosa strain PAO220 and strain PAO230 were grown in minimal medium inflow cells (as described for microscopy above). Activity of �-galactosidase wasmeasured following the addition of 0.04 g of methlyumbelliferyl �-D-galactopy-ranoside, dissolved in N,N-dimethylformamide, per ml to the influent medium
reservoir. Expression of the lacZ reporter was visualized by examination underlong-wave UV excitation according to the method of Davies et al. (10, 12). Allsamples were analyzed using a UV exposure time of 800 ms, and cells wereilluminated only during the period of data collection (15-min intervals for thefirst 3 h and 30-min intervals for the remainder of the analysis period). Activationof the lasB and rhlA genes was checked in continuous cultures used for proteinanalysis (see below) in order to coordinate timing of sampling with the onset ofthese regulons.
Alginate determination by alcian blue staining. In order to observe the pres-ence and location of exopolysaccharide (EPS) produced by P. aeruginosa strainPAO1 carrying pRP9-1 and the LasI mutant strain PAO-JP1 carrying pRP9-1,cells constitutive for green fluorescent protein (GFP) production were grown asbiofilms in the flow cell described above. GFP fluorescence under blue lightexcitation indicated the presence of cells within the biofilm. Alcian blue (0.2g/liter) was added to the flow cell, and GFP fluorescence images of cell clusterswere reexamined under transmitted light to detect alcian blue-stained EPS.Digital images were acquired and examined to evaluate the relationship betweencell position and EPS location.
Biofilm growth for protein determinations. The interior surfaces of siliconetubing were used to cultivate biofilms for protein sampling. A continuous-flowreactor designed for these experiments was configured with oxygen-permeabletubing within which the biofilms were cultivated. The tubing had a regular ge-ometry throughout (size 15; Masterflex) with an internal volume of 25 ml (tubinglength, 1 m). This system was chosen to reduce heterogeneities that could affectbiofilm physiology while allowing sufficient biomass development to allow a min-imum of 500 �g of crude protein extract per tube. Medium was pumped throughthe tubing via a Masterflex 8-roller-head pump to a closed effluent medium res-ervoir. The assembled system was sterilized by autoclaving prior to inoculation.
Cultures of P. aeruginosa were grown in chemostats prior to the inoculation ofthe silicone tubing by syringe injection. Seven milliliters of a chemostat-grownculture of P. aeruginosa was injected through the tubing wall and into the lumenand allowed to attach for 1 h before the flow of minimal medium (0.4 ml/min)was initiated. The residence time in the tubing was 62.5 min (less than thedoubling time of P. aeruginosa in suspension), allowing only attached organismsto be retained within the tubing. A glass capillary having a square cross sectionwas inserted at the midpoint of one silicone tube during each experiment andused for an in-line microscopic evaluation of the onset of biofilm morphology asdescribed above. Sampling schedules for all protein analyses were based onresults from these observations. After various times (up to 12 days), biofilm cellswere harvested from the interior surface by pinching the tube along its entirelength, resulting in extrusion of the cell material from the lumen. The resultingcell paste was collected on ice. Prior to sampling, the bulk liquid was purged fromthe tubing to prevent interference from detached cells.
Determination of protein yields. To determine if P. aeruginosa was able toyield sufficient protein for analysis by two-dimensional polyacrylamide gel elec-trophoresis (PAGE) and subsequent mass spectrometry, planktonic P. aerugi-nosa cells were exposed to the interior surfaces of silicone tubing for 60 min,followed by the flow of fresh minimal medium. At various time points, theattached cells were harvested from the interior surface of silicone tubing and theprotein yield was determined. Only a minimal increase in protein concentrationwas observed for a period of 4 to 6 h, followed by an increase in protein yieldafter this period (data not shown). The average biofilm protein yield harvestedafter 3 days of biofilm growth from one silicone tube was 3 mg, which increasedto 10 mg after 6 days. A slight increase in protein yield was observed between 6and 12 days of biofilm growth (data not shown).
Preparation of crude protein extract. Chemostat- and biofilm-grown P. aerugi-nosa and P. putida cells were washed immediately after sampling by centrifuga-tion at 12,000 � g for 10 min at 4°C and resuspended in TE buffer (10 mMTris-HCl, 1 mM EDTA, pH 8.0), containing 0.3 mg of phenylmethylsulfonylfluoride/ml (Boehringer Mannheim, Indianapolis, Ind.). All cell samples werelysed by sonication on ice using six 10-s bursts at 4 W (Cole Parmer Instr. Co.,Vernon Hills, Ill.) and stored at �20°C until used for protein determination. Celldebris and unbroken cells were removed from all samples by centrifugation at30,600 � g, 30 min, 4°C. Total protein concentration was determined by themodified method of Lowry et al. (40) using reagents from Sigma. Bovine serumalbumin was used as the standard. Experiments for each time point were re-peated at least five times.
Two-dimensional gel electrophoresis. Two-dimensional gel electrophoresiswas conducted according to the principles of O’Farrell (29) as outlined by Görget al. (19) and as described in detail in Sauer and Camper (47) using a DALTvertical two-dimensional gel system from Amersham Pharmacia (Piscataway,N.J.). Two-dimensional gels were stained with Coomassie as described in Sauerand Camper (47) or with silver nitrate (3). Two-dimensional gels were repeated
TABLE 1. Bacterial strains and plasmids used in this study
Strain orplasmid
Relevantcharacteristics Phenotype Source or
reference
P. aeruginosaPAO1 Wild type Wild type B. H. HollowayPAO-JP1 lasI::tet LasI� Pearson et al. (36)PAO230 lasB::lacZ Wild-type PAO1 H. P. SchweizerPAO220 rhlA::lacZ Wild-type PAO1 H. P. SchweizerPA14 Wild type Wild type O’Toole and Kolter (32)PA257 flgK::tet FlgK�, nonmotile O’Toole and Kolter (32)
P. putidaATCC 39168 Wild type Wild type Sauer and Camper (47)
PlasmidspRP9-1 GFP Constitutive GFP
expressionDavies et al. (9)
VOL. 184, 2002 MULTIPLE P. AERUGINOSA BIOFILM PHENOTYPES 1141
on August 25, 2019 by guest
http://jb.asm.org/
Dow
nloaded from
for each growth condition independently at least three times to confirm thereproducibility of the protein pattern under planktonic and attached growthconditions. Only differences in protein spots that were reproduced three timesare described here.
Two-dimensional gel analysis. The software Melanie 3.0 from Genebio (Ge-neva, Switzerland) was used for two-dimensional gel analysis. Spot sizes wereanalyzed and compared using volume%. The similarities of protein profiles weredetermined using scatter plot graphics on pairs of protein spots that were foundin two or more gels. Regression analysis and correlation coefficients between gelswere then generated (see Fig. 8A). The relationship between two-dimensionalgels is given by the linear dependence between the values of pairs of protein spotsfrom one gel against the values in the other gel (Fig. 8A). The linear dependenceis defined as the best-fit straight line through the pair values. The slope of the lineand its offset define the fit. The correlation coefficient gives an approximation ofthe goodness of fit. For example, a linear dependence of 1.0 with a correlation of1.0 indicates that all paired spot values are identical in two gels, while a lineardependence of 1.2 with a correlation of 0.95 indicates that there is a 95% chancethat paired values are 20% higher in one gel. The two-dimensional gel compar-isons and scatter plot analyses were carried out for both silver- and Coomassie-stained two-dimensional gels. All Coomassie and silver-stained two-dimensionalgels were analyzed in duplicate for each time point.
Sample preparation for MS. Protein spots of interest were excised from thegel, reduced, carboxymethylated, and digested in situ with trypsin as described byWilms et al. (54) and Shevchenko et al. (48). After digestion overnight at 37°C,samples were centrifuged, and an aliquot of the supernatant was taken foranalysis by matrix-assisted laser desorption ionization-time of flight (MALDI-TOF)-mass spectrometry (MS). The peptide solution was mixed with an equalvolume of saturated a-cyano-4-hydroxy cinnamic acid and applied to a sampletemplate of a MALDI-MS (Voyager EP; Perspective Biosystems, Foster City,Calif.). Data were obtained using the following parameters: linear mode, 25 kVaccelerating voltage, 95% grid voltage, and 50 ns delay. Angiotensin and insulinwere used as internal standards. Peptide mass fingerprints were searched usingthe programs ProFound at http://129.85.19.192/profound-bin/WebProFound.exeand Protein Prospector MS-FIT (http://prospector.ucsf.edu). Partial enzymaticcleavages leaving one cleavage site, carboxymethylation of cysteine, and acety-lation of protein N terminus were considered in these searches. Sample prepa-ration and MS analysis were performed by the Protein Core facility at ColumbiaUniversity (New York, N.Y.).
RESULTS
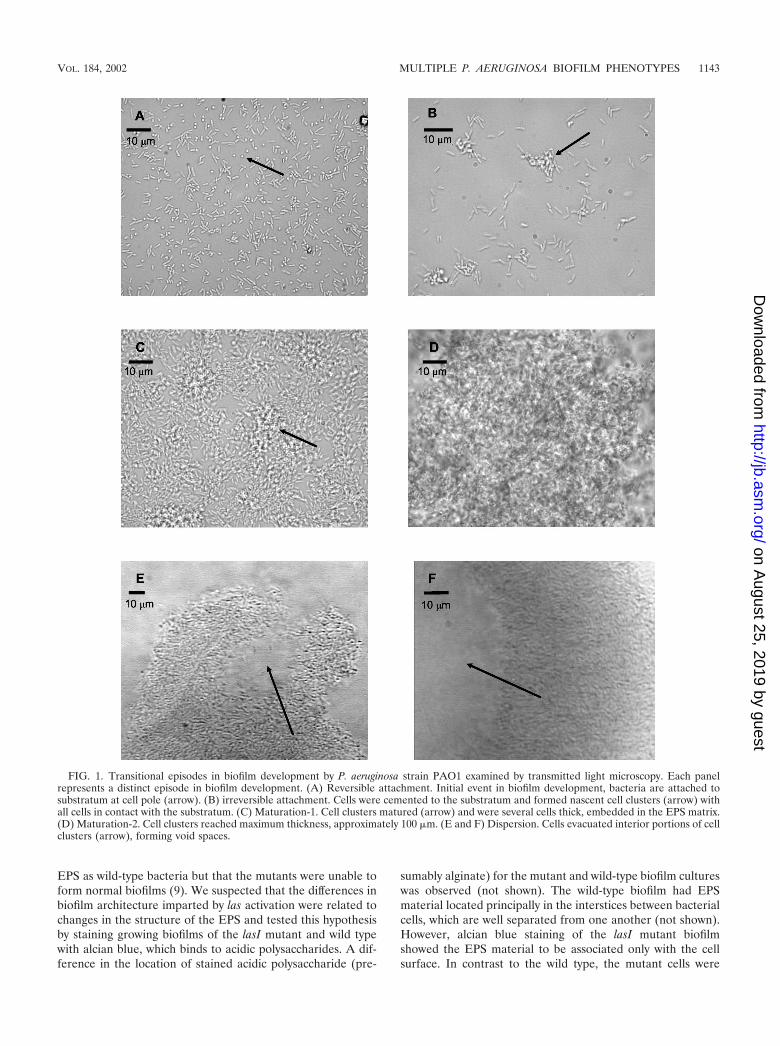
Characterization of biofilm developmental cycle. Biofilms ofP. aeruginosa strain PAO1 were grown in continuous cultureattached to glass in a flow cell fixed to a microscope stage andviewed continuously over the course of 12 days. Five distinctstages of development could be detected in this manner, eachhaving reproducible characteristics (Fig. 1). During initial at-tachment, planktonic bacteria contacted the glass substratum,some via the cell pole, and became transiently fixed (Fig. 1A).The initial attachment was reversible, since some cells wereobserved to detach during this developmental stage or wereobserved to attach only briefly (not shown).
Under continuous biofilm culture conditions, the involve-ment of flagella in attachment to a glass surface was supportedby the observation that some cells rotated about their polaraxis while fixed to a spot on the glass surface (not shown). Totest the importance of flagella on attachment to a glass surfacein continuous flow, the attachment efficiency of the nonmotileP. aeruginosa strain PA257 (carrying a mutation in flgK) wascompared to that of the parental strain PA14. Figure 2 showsthat the flagellar mutant was unable to significantly increase innumbers at the glass surface of a flow cell compared to theflagellated wild type. Within the first 8 h the wild type andmutant increased in numbers at the glass surface by 6.3 � 104
cells per cm2 and 3.3 � 102 cells per cm2, respectively. Over thecourse of 3 days, the mutant increased by an average of 9.7 �102 cells per cm2, while the parental strain increased in density
to more than 4 � 105 cells per cm2. Although the increase incell numbers was likely due to some growth at the glass surface,the differences were more likely due to the importance offlagella in the initial attachment phase of these organisms.Following the initial attachment, all cells that were able toremain at the surface were found to be attached via the side ofthe cell (see transition indicated by Fig. 1A and 1B). Thenonflagellated mutant was observed to attach to the glass sur-face only along the side of the cell (not shown).
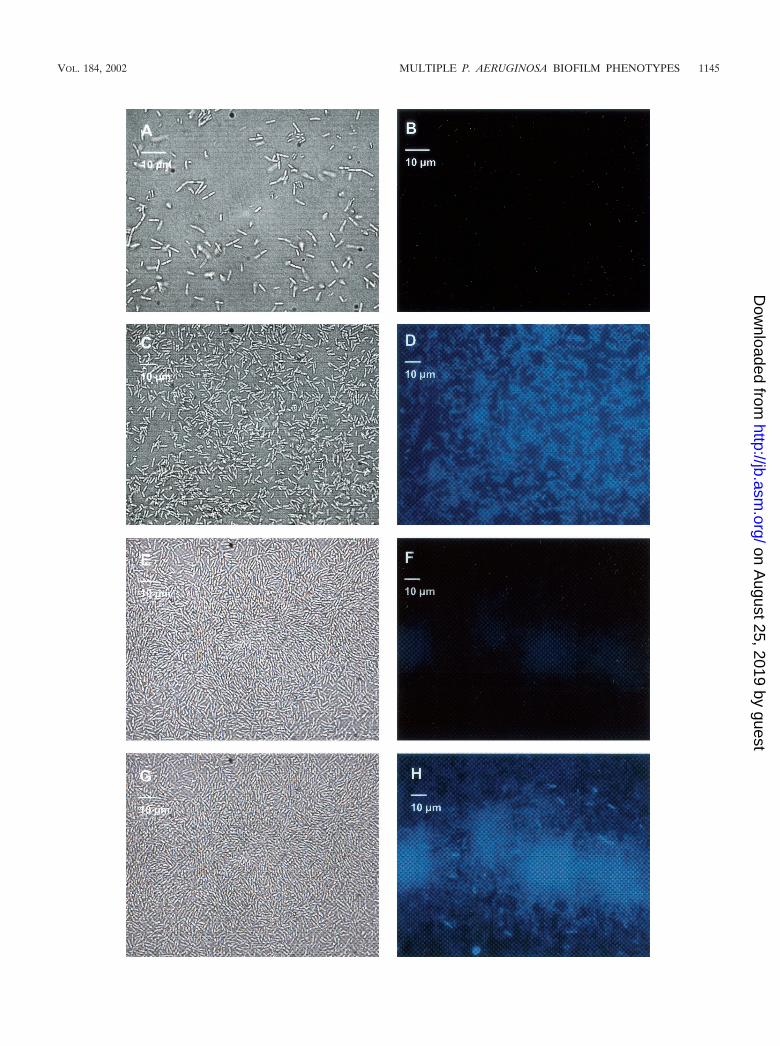
The second stage of development, irreversible attachment,was observed to occur when cell clusters commenced theirdevelopment, as visualized by multiple cells in contact with oneanother and the substratum (Fig. 1B). During the second stageof development, motility ceased in attached cells, as observedmicroscopically (not shown). Furthermore, the Las quorum-sensing system became active, as determined by onset of re-porter activity for the lasB gene (Fig. 3A to D). The lasB genehas been shown to be responsive to induction by PAI-1 auto-inducer (38). The cell clusters which were formed during thisbiofilm developmental stage remained attached to the substra-tum through to the last stage of biofilm development (9 to 12days of incubation).
The third stage of development was observed when cellclusters became progressively layered (Fig. 1C). This was de-fined as the point in time at which cell clusters are thicker than10 �m (not shown). In addition, this maturation-1 stage isaccompanied by the activation of the Rhl quorum-sensing sys-tem. Activation of the Rhl quorum-sensing system was deter-mined by the onset of reporter activity for the rhlA gene (seeFig. 3E to H), which was shown by Pearson et al. to be inducedby the PAI-2 autoinducer (37).
As defined by Davies et al. (9) the penultimate stage inbiofilm development is reached when cell clusters attain theirmaximum average thickness at approximately 100 �m. In thereactor system used for the current study, this stage, charac-terized as maturation-2 (see Fig. 1D), was shown to occur after6 days of growth. During maturation-2, cells within clusterswere observed microscopically to be nonmotile, the cell clus-ters reach their maximum dimensions, the majority of the cellsare segregated within cell clusters, and clusters are displacedfrom the glass surface.
After 9 days, cell clusters were observed to undergo alter-ations in their structure due to the dispersion of bacteria fromtheir interior portions (Fig. 1E and F). These bacteria weremotile and were observed to swim away from the inner por-tions of the cell cluster through openings in the cluster andenter the bulk liquid. Figure 1E is an image of a cell clustertaken from the side (grown on the transverse wall of the flowcell), showing the opening through which the bacteria wereobserved to evacuate the cluster center. Bacteria remainingwithin the void space were motile. The ability of bacteria toswim freely within the void spaces as observed by microscopyindicated the absence of dense polymer or other gel-like ma-terial in the void space. Figure 1F shows the wall of a cellcluster after a complete dispersion event, where the remainingbacteria in the wall of the cell clusters are nonmotile.
Role of Las quorum sensing in biofilm development. It hasbeen observed previously that P. aeruginosa strain PAO1 de-fective in Las quorum sensing produced similar quantities of
1142 SAUER ET AL. J. BACTERIOL.
on August 25, 2019 by guest
http://jb.asm.org/
Dow
nloaded from
EPS as wild-type bacteria but that the mutants were unable toform normal biofilms (9). We suspected that the differences inbiofilm architecture imparted by las activation were related tochanges in the structure of the EPS and tested this hypothesisby staining growing biofilms of the lasI mutant and wild typewith alcian blue, which binds to acidic polysaccharides. A dif-ference in the location of stained acidic polysaccharide (pre-
sumably alginate) for the mutant and wild-type biofilm cultureswas observed (not shown). The wild-type biofilm had EPSmaterial located principally in the interstices between bacterialcells, which are well separated from one another (not shown).However, alcian blue staining of the lasI mutant biofilmshowed the EPS material to be associated only with the cellsurface. In contrast to the wild type, the mutant cells were
FIG. 1. Transitional episodes in biofilm development by P. aeruginosa strain PAO1 examined by transmitted light microscopy. Each panelrepresents a distinct episode in biofilm development. (A) Reversible attachment. Initial event in biofilm development, bacteria are attached tosubstratum at cell pole (arrow). (B) irreversible attachment. Cells were cemented to the substratum and formed nascent cell clusters (arrow) withall cells in contact with the substratum. (C) Maturation-1. Cell clusters matured (arrow) and were several cells thick, embedded in the EPS matrix.(D) Maturation-2. Cell clusters reached maximum thickness, approximately 100 �m. (E and F) Dispersion. Cells evacuated interior portions of cellclusters (arrow), forming void spaces.
VOL. 184, 2002 MULTIPLE P. AERUGINOSA BIOFILM PHENOTYPES 1143
on August 25, 2019 by guest
http://jb.asm.org/
Dow
nloaded from
closely packed and the spaces between bacteria were not filledwith EPS (as they are in the wild-type biofilm).
Proteome analysis reveals differences in the protein profilesof strain PAO1 and strain PAO-JP1 in 1-day biofilms, but notin initially attached cells. To investigate the degree to whichbiofilm stage-specific physiologies differ in each of the fivestages of biofilm development (see Fig. 1 and Fig. 3), crudeprotein extracts were analyzed by two-dimensional gel electro-phoresis. Sampling for these analyses was determined by tim-ing the onset of the physiological characteristics specific toeach phase observed during the microscopy and in situ re-porter gene activation studies in the flow cells. This wasachieved by following the development of biofilm within glasscapillaries inserted within one of the lines of tubing duringeach experimental run. We observed no differences in thetiming and events of biofilm development when comparingresults from the flow cell experiments and the experiments runfor the collection of samples for protein analysis.
The earliest times of onset observed for each of the biofilmcharacteristics were as follows: initial attachment, �0 min;irreversible attachment, 2 h; maturation-1, 3 days; matura-tion-2, 6 days; and dispersion, 9 to 12 days. These times werefound to be reproducible with both the flow cells and the tubereactor used for growth of biofilms for protein analysis (datanot shown). Microscopic observation demonstrated that bac-
teria having physiologies from more than one stage of biofilmcould be present simultaneously within the biofilm. Therefore,the sampling schedule for protein analysis was chosen as fol-lows: planktonic cells from the chemostat; 8-h biofilm, revers-ible attachment; 1-day biofilm, irreversible attachment; 3-daybiofilm, maturation-1; 6-day biofilm, maturation-2; and 12-daybiofilm, dispersion.
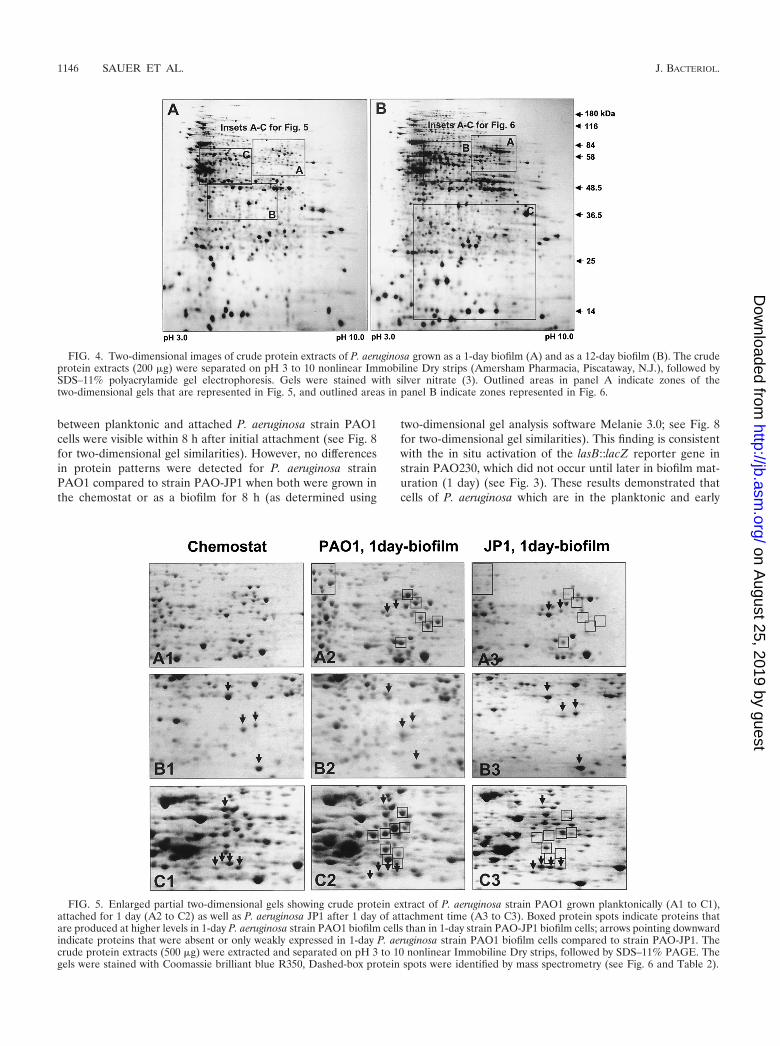
At these sampling times, the majority of biofilm cells werefound to display the same phenotype. Representative examplesof two-dimensional protein patterns of two biofilm develop-mental stages, irreversible attached biofilm cells (1 day) andbiofilm cells in the dispersion stage (12 days), are shown in Fig.4. Each two-dimensional gel profile resolved more than 1,500distinct protein spots. Outlined areas in Fig. 4A indicate zonesof the two-dimensional gels that are represented in Fig. 5, andoutlined areas in 4B indicate zones represented in Fig. 6.
Since in situ activation of the lasB reporter gene presentedevidence of las-induced gene expression during irreversibleattachment (Fig. 1 and 3), protein patterns of P. aeruginosastrain PAO1 were compared to those of the LasI mutant strainPAO-JP1 to confirm the onset of quorum sensing at the pro-tein level. In addition, the comparison was used to confirm thesampling schedule for the protein analysis. Protein patterns ofattached P. aeruginosa strain PAO1 cells were also comparedto those of planktonic cells. Only a few differences in proteins
FIG. 2. Effect of flagella on biofilm formation. Time course showing number of chemostat-grown cells attached to a glass substratum over aperiod of 3 days under conditions of continuous flow. F, P. aeruginosa strain PA14 (wild-type) cells attached at a constant rate, rapidly increasingthe number of cells at the substratum. E, mutants (P. aeruginosa strain PA257) defective in flagellum synthesis attached poorly and showed nosignificant increase in surface cell numbers over a period of 3 days.
FIG. 3. Onset of quorum-sensing regulons in developing biofilm. (A) Transmitted light micrograph of P. aeruginosa strain PAO230 during thereversible attachment phase of biofilm development; (B) the same image under UV illumination demonstrated no activation of the Las regulon.(C) Transmitted light micrograph of P. aeruginosa strain PAO230 during the irreversible attachment phase of biofilm development; (D) the sameimage under UV illumination demonstrated activation of the Las regulon. (E) Transmitted light micrograph of P. aeruginosa strain PAO220 duringthe irreversible attachment phase of biofilm development; (F) the same image under UV illumination demonstrated no activation of the Rhlquorum-sensing regulon. (G) Transmitted light micrograph of P. aeruginosa strain PAO220 during the maturation-1 phase of biofilm development;(H) the same image under UV illumination demonstrated activation of the Rhl quorum-sensing regulon.
1144 SAUER ET AL. J. BACTERIOL.
on August 25, 2019 by guest
http://jb.asm.org/
Dow
nloaded from
VOL. 184, 2002 MULTIPLE P. AERUGINOSA BIOFILM PHENOTYPES 1145
on August 25, 2019 by guest
http://jb.asm.org/
Dow
nloaded from
between planktonic and attached P. aeruginosa strain PAO1cells were visible within 8 h after initial attachment (see Fig. 8for two-dimensional gel similarities). However, no differencesin protein patterns were detected for P. aeruginosa strainPAO1 compared to strain PAO-JP1 when both were grown inthe chemostat or as a biofilm for 8 h (as determined using
two-dimensional gel analysis software Melanie 3.0; see Fig. 8for two-dimensional gel similarities). This finding is consistentwith the in situ activation of the lasB::lacZ reporter gene instrain PAO230, which did not occur until later in biofilm mat-uration (1 day) (see Fig. 3). These results demonstrated thatcells of P. aeruginosa which are in the planktonic and early
FIG. 4. Two-dimensional images of crude protein extracts of P. aeruginosa grown as a 1-day biofilm (A) and as a 12-day biofilm (B). The crudeprotein extracts (200 �g) were separated on pH 3 to 10 nonlinear Immobiline Dry strips (Amersham Pharmacia, Piscataway, N.J.), followed bySDS–11% polyacrylamide gel electrophoresis. Gels were stained with silver nitrate (3). Outlined areas in panel A indicate zones of thetwo-dimensional gels that are represented in Fig. 5, and outlined areas in panel B indicate zones represented in Fig. 6.
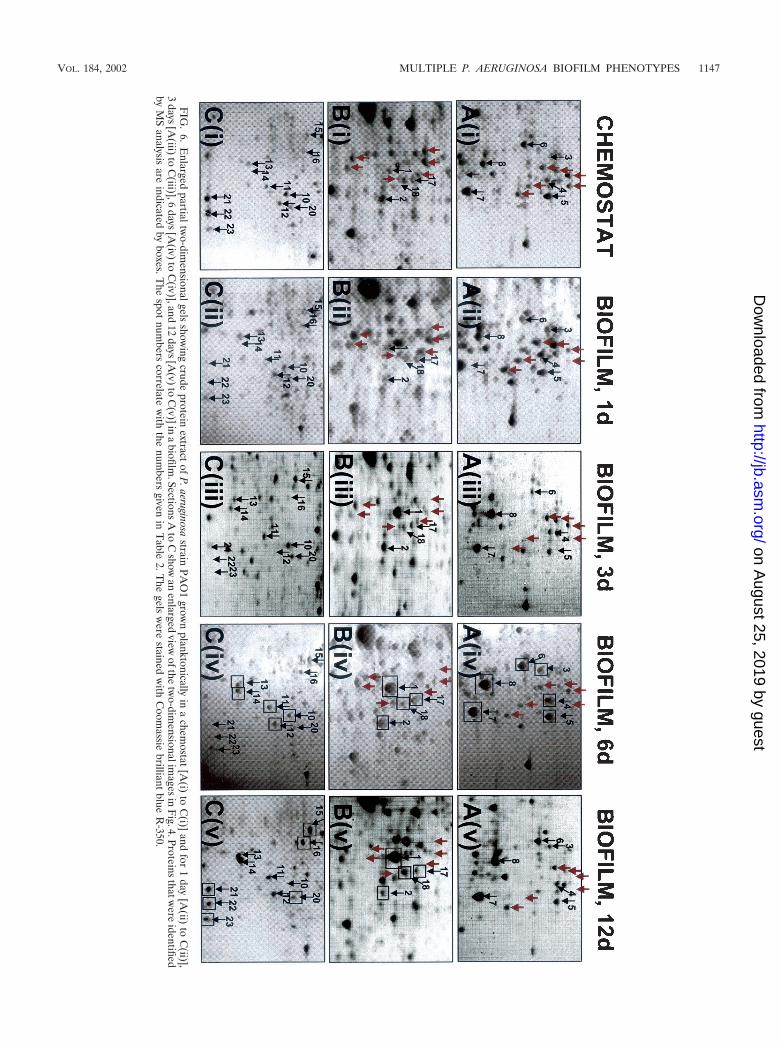
FIG. 5. Enlarged partial two-dimensional gels showing crude protein extract of P. aeruginosa strain PAO1 grown planktonically (A1 to C1),attached for 1 day (A2 to C2) as well as P. aeruginosa JP1 after 1 day of attachment time (A3 to C3). Boxed protein spots indicate proteins thatare produced at higher levels in 1-day P. aeruginosa strain PAO1 biofilm cells than in 1-day strain PAO-JP1 biofilm cells; arrows pointing downwardindicate proteins that were absent or only weakly expressed in 1-day P. aeruginosa strain PAO1 biofilm cells compared to strain PAO-JP1. Thecrude protein extracts (500 �g) were extracted and separated on pH 3 to 10 nonlinear Immobiline Dry strips, followed by SDS–11% PAGE. Thegels were stained with Coomassie brilliant blue R350, Dashed-box protein spots were identified by mass spectrometry (see Fig. 6 and Table 2).
1146 SAUER ET AL. J. BACTERIOL.
on August 25, 2019 by guest
http://jb.asm.org/
Dow
nloaded from
FIG
.6.
Enlarged
partialtwo-dim
ensionalgelsshow
ingcrude
proteinextract
ofP
.aeruginosastrain
PAO
1grow
nplanktonically
ina
chemostat
[A(i)
toC
(i)]and
for1
day[A
(ii)to
C(ii)],
3days
[A(iii)
toC
(iii)],6days
[A(iv)
toC
(iv)],and12
days[A
(v)to
C(v)]in
abiofilm
.SectionsA
toC
showan
enlargedview
ofthetw
o-dimensionalim
agesin
Fig.4.Proteins
thatwere
identifiedby
MS
analysisare
indicatedby
boxes.The
spotnum
berscorrelate
with
thenum
bersgiven
inT
able2.T
hegels
were
stainedw
ithC
oomassie
brilliantblue
R-350.
VOL. 184, 2002 MULTIPLE P. AERUGINOSA BIOFILM PHENOTYPES 1147
on August 25, 2019 by guest
http://jb.asm.org/
Dow
nloaded from
attachment stage did not display substantially different physi-ologies. It also demonstrates that quorum sensing does notappear to have an influence on this transitional stage of biofilmdevelopment.
In contrast, computer-assisted comparison between 1-daybiofilm protein patterns for P. aeruginosa strain PAO1 andstrain PAO-JP1 demonstrated differential expression of atleast 50 protein spots (Fig. 5). This difference in protein pat-terns occurred after the Las quorum-sensing system had beenactivated in irreversibly attached cells (Fig. 3A). The resultsalso confirmed the sampling schedule for protein analysis.
Several proteins were expressed at higher levels in P. aerugi-nosa strain PAO1 biofilm cells than in strain PAO-JP1 afterthe same attachment time. These proteins are indicated byboxes in Fig. 5. Some of these protein spots were present in theprotein profiles of planktonic cells and P. aeruginosa strainPAO1 biofilm cells but absent in P. aeruginosa strain PAO-JP1biofilm cells. In contrast, examples of protein spots that wereabsent or only weakly expressed in 1-day PAO1 biofilm cellsbut present in 1-day PAO-JP1 biofilm cells are indicated bydownward-pointing arrows.
Interestingly, the protein patterns of PAO-JP1 biofilm cellswere more similar to planktonic cells than to 1-day PAO1biofilm cells (not shown). Proteins that were expressed athigher levels in P. aeruginosa strain PAO-JP1 were usually alsoexpressed at higher levels in planktonic cultures compared to1-day PAO1 biofilm cells. We also detected quorum-sensing-independent but probably surface-induced differential expres-sion of proteins. Using the two-dimensional gel analysis soft-ware, we were able to identify 57 unique protein spots in 1-daybiofilm protein patterns for both strains PAO1 and PAO-JP1that were absent in the planktonic protein pattern and 48protein spots that were unique for planktonic growth (e.g., seetop of Fig. 5, enlarged sections A1 to A3).
Protein MS analysis indicates increased levels of aminoacid biosynthetic proteins, membrane proteins, and oxidative
stress response proteins. Crude protein extracts obtained fromP. aeruginosa strain PAO1 grown in a chemostat or attached tosilicone tubing for 8 h or 1, 6, 9, and 12 days were analyzed bytwo-dimensional gel electrophoresis. Comparison of proteinpatterns of planktonic and biofilm cells after various attach-ment times revealed differential protein expression dependingon the stage of biofilm development. These alterations in theprotein patterns were visible as early as 8 h after initial attach-ment (not shown).
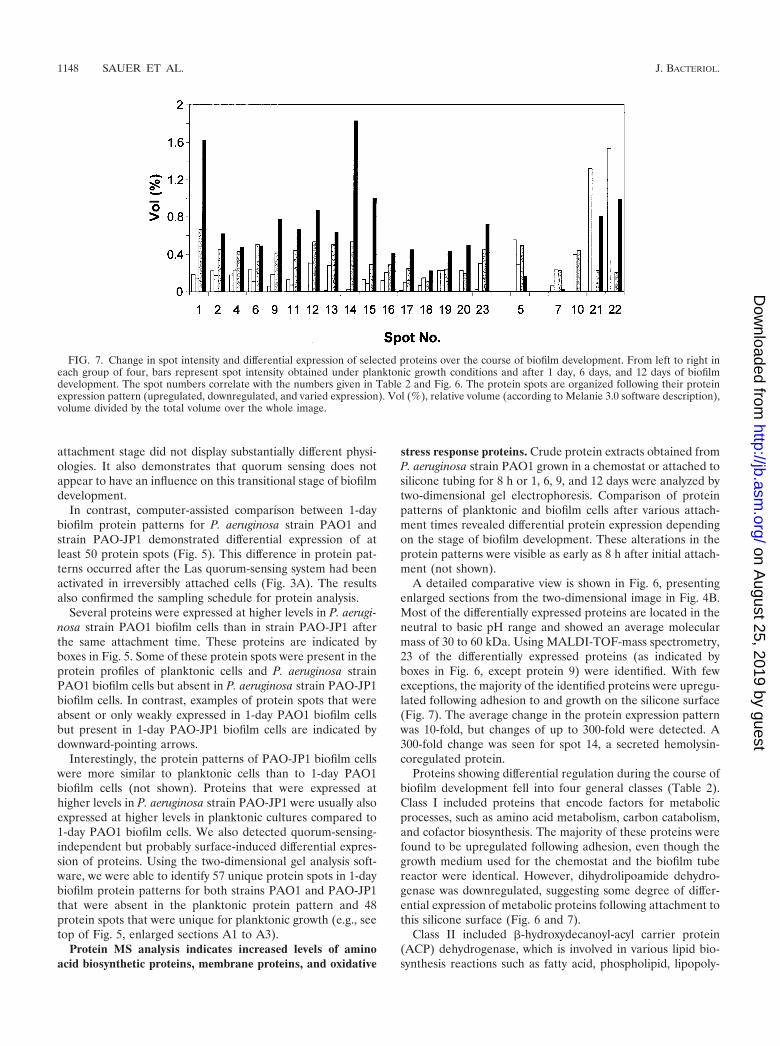
A detailed comparative view is shown in Fig. 6, presentingenlarged sections from the two-dimensional image in Fig. 4B.Most of the differentially expressed proteins are located in theneutral to basic pH range and showed an average molecularmass of 30 to 60 kDa. Using MALDI-TOF-mass spectrometry,23 of the differentially expressed proteins (as indicated byboxes in Fig. 6, except protein 9) were identified. With fewexceptions, the majority of the identified proteins were upregu-lated following adhesion to and growth on the silicone surface(Fig. 7). The average change in the protein expression patternwas 10-fold, but changes of up to 300-fold were detected. A300-fold change was seen for spot 14, a secreted hemolysin-coregulated protein.
Proteins showing differential regulation during the course ofbiofilm development fell into four general classes (Table 2).Class I included proteins that encode factors for metabolicprocesses, such as amino acid metabolism, carbon catabolism,and cofactor biosynthesis. The majority of these proteins werefound to be upregulated following adhesion, even though thegrowth medium used for the chemostat and the biofilm tubereactor were identical. However, dihydrolipoamide dehydro-genase was downregulated, suggesting some degree of differ-ential expression of metabolic proteins following attachment tothis silicone surface (Fig. 6 and 7).
Class II included �-hydroxydecanoyl-acyl carrier protein(ACP) dehydrogenase, which is involved in various lipid bio-synthesis reactions such as fatty acid, phospholipid, lipopoly-
FIG. 7. Change in spot intensity and differential expression of selected proteins over the course of biofilm development. From left to right ineach group of four, bars represent spot intensity obtained under planktonic growth conditions and after 1 day, 6 days, and 12 days of biofilmdevelopment. The spot numbers correlate with the numbers given in Table 2 and Fig. 6. The protein spots are organized following their proteinexpression pattern (upregulated, downregulated, and varied expression). Vol (%), relative volume (according to Melanie 3.0 software description),volume divided by the total volume over the whole image.
1148 SAUER ET AL. J. BACTERIOL.
on August 25, 2019 by guest
http://jb.asm.org/
Dow
nloaded from
saccharide, and acyl homoserine lactone (AHL) biosynthesis.Class III contained membrane proteins primarily involved inmolecular transport, such as the bacterial extracellular solute-binding proteins (50) and porin E1 (OprE), which forms asmall channel in the outer membrane (34). The membraneproteins were found to be upregulated following adhesion (Fig.6 and 7).
Class IV included proteins involved in adaptation and pro-tection. With the exception of the probable ribosomal proteinL25, the proteins falling into this class, such as alkyl hy-droxyperoxide reductase subunit C and superoxide dismutase,were elevated in expression following adhesion (Fig. 6 and 7).Other proteins found to be upregulated following adhesionwere two hypothetical proteins. Differential expression wasfound for the helix-destabilizing protein of bacteriophage Pf1,which was found to be downregulated following attachmentand upregulated in mature biofilms (Fig. 6 and 7). Unidentifiedproteins showing differential expression following adhesionwere also visible (see Fig. 4 and Fig. 6 for comparison).
Multiple stages in the physiology of biofilm bacteria exist, asrevealed by analysis of two-dimensional protein patterns. Asvisible from Fig. 5 and 7, the protein patterns that were ob-tained from different stages of biofilm development were pro-foundly different. To analyze these differences, scatter plotanalysis was used to evaluate similarities in protein spot inten-
sities (Fig. 8A). A detailed description of scatter plot analysisis given in the Materials and Methods section.
By comparing protein profiles of replicate two-dimensionalgels of chemostat-grown planktonic cells, the scatter plot anal-ysis revealed a linear dependence of 0.99 and a correlation of0.94 (Fig. 8B). These results indicated that most paired-spotvalues are identical between replicates and that very little ex-perimental variation existed due to protein extraction, solubi-lization, sample loading, or staining. Similar results were ob-tained when gels of initially attached P. aeruginosa strain PAO1cells (tube, 8 h) were compared to planktonic P. aeruginosastrain PAO1 cells or initially attached P. aeruginosa strainPAO-JP1 cells (Fig. 8). The high identity between the proteinprofiles of the two strains confirmed that during reversibleinitial attachment, the protein profiles are not influenced byquorum sensing.
When protein patterns of more mature P. aeruginosa strainPAO1 biofilms were compared to those of planktonic cells, thelinear dependence as well as the correlation coefficient de-creased (Fig. 8B). The greatest difference was observed whenprotein patterns of chemostat-grown and 6-day biofilm cellswere compared (Fig. 8B), demonstrating a linear dependenceof 0.4 and a correlation of 0.52. This finding indicated thatalmost all paired values are 60% higher in 6-day biofilm cellsthan in planktonic cells and that the similarity between these
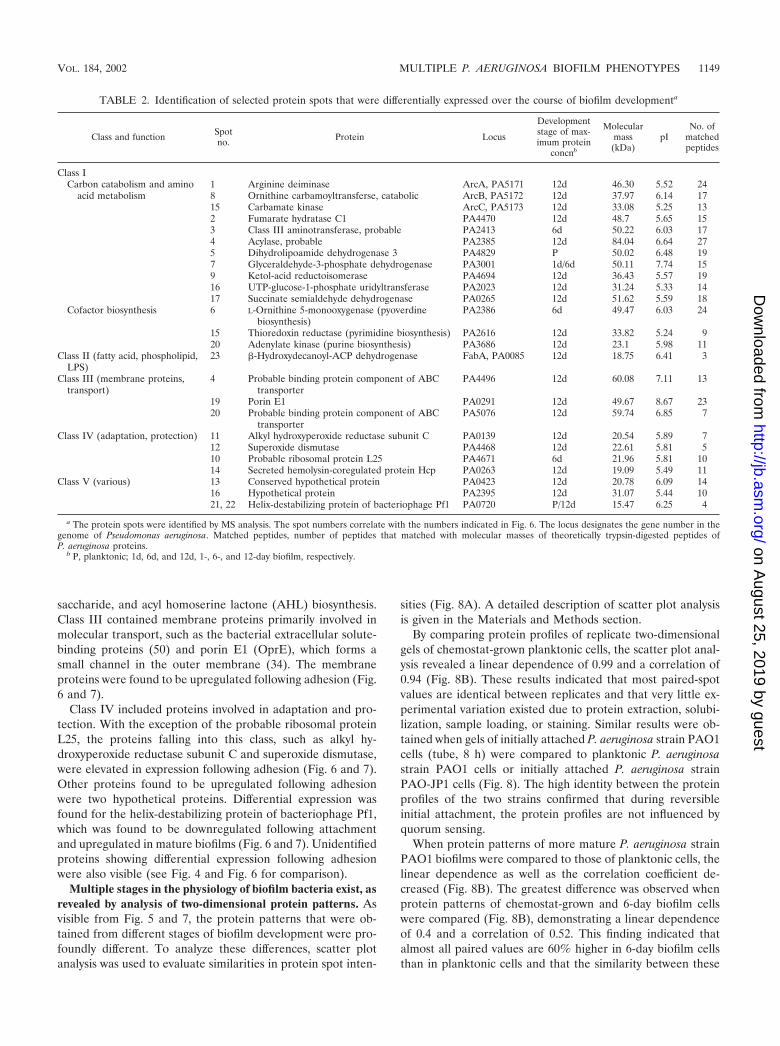
TABLE 2. Identification of selected protein spots that were differentially expressed over the course of biofilm developmenta
Class and function Spotno. Protein Locus
Developmentstage of max-imum protein
concnb
Molecularmass
(kDa)pI
No. ofmatchedpeptides
Class ICarbon catabolism and amino
acid metabolism1 Arginine deiminase ArcA, PA5171 12d 46.30 5.52 248 Ornithine carbamoyltransferse, catabolic ArcB, PA5172 12d 37.97 6.14 1715 Carbamate kinase ArcC, PA5173 12d 33.08 5.25 132 Fumarate hydratase C1 PA4470 12d 48.7 5.65 153 Class III aminotransferase, probable PA2413 6d 50.22 6.03 174 Acylase, probable PA2385 12d 84.04 6.64 275 Dihydrolipoamide dehydrogenase 3 PA4829 P 50.02 6.48 197 Glyceraldehyde-3-phosphate dehydrogenase PA3001 1d/6d 50.11 7.74 159 Ketol-acid reductoisomerase PA4694 12d 36.43 5.57 1916 UTP-glucose-1-phosphate uridyltransferase PA2023 12d 31.24 5.33 1417 Succinate semialdehyde dehydrogenase PA0265 12d 51.62 5.59 18
Cofactor biosynthesis 6 L-Ornithine 5-monooxygenase (pyoverdinebiosynthesis)
PA2386 6d 49.47 6.03 24
15 Thioredoxin reductase (pyrimidine biosynthesis) PA2616 12d 33.82 5.24 920 Adenylate kinase (purine biosynthesis) PA3686 12d 23.1 5.98 11
Class II (fatty acid, phospholipid,LPS)
23 �-Hydroxydecanoyl-ACP dehydrogenase FabA, PA0085 12d 18.75 6.41 3
Class III (membrane proteins,transport)
4 Probable binding protein component of ABCtransporter
PA4496 12d 60.08 7.11 13
19 Porin E1 PA0291 12d 49.67 8.67 2320 Probable binding protein component of ABC
transporterPA5076 12d 59.74 6.85 7
Class IV (adaptation, protection) 11 Alkyl hydroxyperoxide reductase subunit C PA0139 12d 20.54 5.89 712 Superoxide dismutase PA4468 12d 22.61 5.81 510 Probable ribosomal protein L25 PA4671 6d 21.96 5.81 1014 Secreted hemolysin-coregulated protein Hcp PA0263 12d 19.09 5.49 11
Class V (various) 13 Conserved hypothetical protein PA0423 12d 20.78 6.09 1416 Hypothetical protein PA2395 12d 31.07 5.44 1021, 22 Helix-destabilizing protein of bacteriophage Pf1 PA0720 P/12d 15.47 6.25 4
a The protein spots were identified by MS analysis. The spot numbers correlate with the numbers indicated in Fig. 6. The locus designates the gene number in thegenome of Pseudomonas aeruginosa. Matched peptides, number of peptides that matched with molecular masses of theoretically trypsin-digested peptides ofP. aeruginosa proteins.
b P, planktonic; 1d, 6d, and 12d, 1-, 6-, and 12-day biofilm, respectively.
VOL. 184, 2002 MULTIPLE P. AERUGINOSA BIOFILM PHENOTYPES 1149
on August 25, 2019 by guest
http://jb.asm.org/
Dow
nloaded from
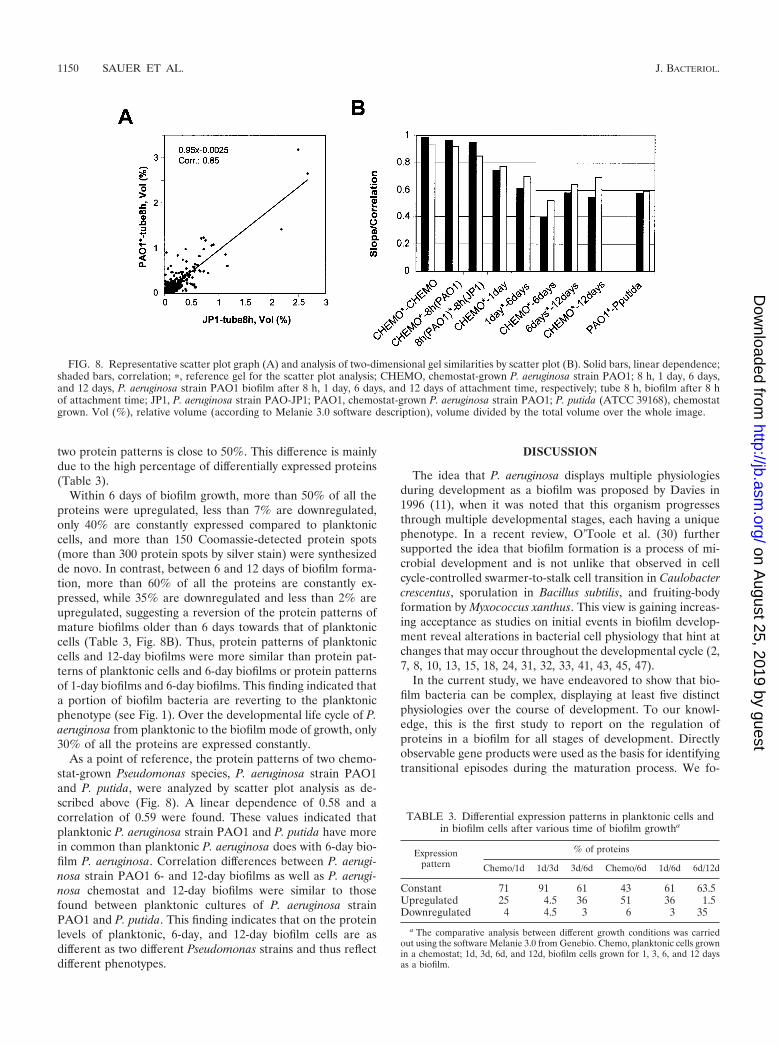
two protein patterns is close to 50%. This difference is mainlydue to the high percentage of differentially expressed proteins(Table 3).
Within 6 days of biofilm growth, more than 50% of all theproteins were upregulated, less than 7% are downregulated,only 40% are constantly expressed compared to planktoniccells, and more than 150 Coomassie-detected protein spots(more than 300 protein spots by silver stain) were synthesizedde novo. In contrast, between 6 and 12 days of biofilm forma-tion, more than 60% of all the proteins are constantly ex-pressed, while 35% are downregulated and less than 2% areupregulated, suggesting a reversion of the protein patterns ofmature biofilms older than 6 days towards that of planktoniccells (Table 3, Fig. 8B). Thus, protein patterns of planktoniccells and 12-day biofilms were more similar than protein pat-terns of planktonic cells and 6-day biofilms or protein patternsof 1-day biofilms and 6-day biofilms. This finding indicated thata portion of biofilm bacteria are reverting to the planktonicphenotype (see Fig. 1). Over the developmental life cycle of P.aeruginosa from planktonic to the biofilm mode of growth, only30% of all the proteins are expressed constantly.
As a point of reference, the protein patterns of two chemo-stat-grown Pseudomonas species, P. aeruginosa strain PAO1and P. putida, were analyzed by scatter plot analysis as de-scribed above (Fig. 8). A linear dependence of 0.58 and acorrelation of 0.59 were found. These values indicated thatplanktonic P. aeruginosa strain PAO1 and P. putida have morein common than planktonic P. aeruginosa does with 6-day bio-film P. aeruginosa. Correlation differences between P. aerugi-nosa strain PAO1 6- and 12-day biofilms as well as P. aerugi-nosa chemostat and 12-day biofilms were similar to thosefound between planktonic cultures of P. aeruginosa strainPAO1 and P. putida. This finding indicates that on the proteinlevels of planktonic, 6-day, and 12-day biofilm cells are asdifferent as two different Pseudomonas strains and thus reflectdifferent phenotypes.
DISCUSSION
The idea that P. aeruginosa displays multiple physiologiesduring development as a biofilm was proposed by Davies in1996 (11), when it was noted that this organism progressesthrough multiple developmental stages, each having a uniquephenotype. In a recent review, O’Toole et al. (30) furthersupported the idea that biofilm formation is a process of mi-crobial development and is not unlike that observed in cellcycle-controlled swarmer-to-stalk cell transition in Caulobactercrescentus, sporulation in Bacillus subtilis, and fruiting-bodyformation by Myxococcus xanthus. This view is gaining increas-ing acceptance as studies on initial events in biofilm develop-ment reveal alterations in bacterial cell physiology that hint atchanges that may occur throughout the developmental cycle (2,7, 8, 10, 13, 15, 18, 24, 31, 32, 33, 41, 43, 45, 47).
In the current study, we have endeavored to show that bio-film bacteria can be complex, displaying at least five distinctphysiologies over the course of development. To our knowl-edge, this is the first study to report on the regulation ofproteins in a biofilm for all stages of development. Directlyobservable gene products were used as the basis for identifyingtransitional episodes during the maturation process. We fo-
FIG. 8. Representative scatter plot graph (A) and analysis of two-dimensional gel similarities by scatter plot (B). Solid bars, linear dependence;shaded bars, correlation; �, reference gel for the scatter plot analysis; CHEMO, chemostat-grown P. aeruginosa strain PAO1; 8 h, 1 day, 6 days,and 12 days, P. aeruginosa strain PAO1 biofilm after 8 h, 1 day, 6 days, and 12 days of attachment time, respectively; tube 8 h, biofilm after 8 hof attachment time; JP1, P. aeruginosa strain PAO-JP1; PAO1, chemostat-grown P. aeruginosa strain PAO1; P. putida (ATCC 39168), chemostatgrown. Vol (%), relative volume (according to Melanie 3.0 software description), volume divided by the total volume over the whole image.
TABLE 3. Differential expression patterns in planktonic cells andin biofilm cells after various time of biofilm growtha
Expressionpattern
% of proteins
Chemo/1d 1d/3d 3d/6d Chemo/6d 1d/6d 6d/12d
Constant 71 91 61 43 61 63.5Upregulated 25 4.5 36 51 36 1.5Downregulated 4 4.5 3 6 3 35
a The comparative analysis between different growth conditions was carriedout using the software Melanie 3.0 from Genebio. Chemo, planktonic cells grownin a chemostat; 1d, 3d, 6d, and 12d, biofilm cells grown for 1, 3, 6, and 12 daysas a biofilm.
1150 SAUER ET AL. J. BACTERIOL.
on August 25, 2019 by guest
http://jb.asm.org/
Dow
nloaded from
cused on the expression of proteins that are unique at differentstages of development by using internal markers involved inbiofilm growth, such as activation of lasB. These markers wereused as signposts to standardize biofilm collection points andensure reproducibility for protein analyses.
Biofilms were grown in continuous-culture reactors (biofilmtube reactors) designed to reduce the impact of microenviron-ments on biofilm physiology and to provide large biomassyields necessary for two-dimensional PAGE analysis. Thesetube reactors were run at flow rates that washed out planktoniccells in less than one generation time. The wild-type P. aerugi-nosa strain PAO1 was used to characterize normal biofilmdevelopment, and results from the mutants were compared tothis baseline information.
Direct observation of biofilm development revealed quanti-fiable transitional events which indicated significant episodesin the development of a bacterial biofilm population. Takentogether, these were used to conveniently partition biofilmdevelopment into five distinct stages: (i) reversible attachment,(ii) irreversible attachment, (iii) maturation-1, (iv) matura-tion-2, and (v) dispersion. The developmental life cycle comesfull circle when dispersed biofilm cells revert to the planktonicmode of growth. Bacteria within each of the stages of biofilmdevelopment are generally believed to be physiologically dis-tinct from cells in other stages of development, but in a maturebiofilm all stages of development may be present to somedegree at the same time. Differences in biofilm developmentalstages with respect to protein analysis and direct microscopicobservation are summarized in Table 4. Changes in proteinprofiles are presumed to be directly related to phenotypicadaptations; some of these phenotypes were targeted for ob-servation in flow cells. These results revealed a sequence ofdevelopmental episodes in biofilm growth demonstrating pro-found phenotypic alteration not generally attributed to bacteria.
The initial event in biofilm development occurs when con-tact is made between the surface of the cell and an interface.Using nonmotile mutants, a significant decrease in attachmentefficiency compared to flagellated cultures was observed.Therefore, the presence of flagella during the planktonic phaseof the biofilm growth cycle appears to enhance reversible at-tachment. A similar observation was made previously byO’Toole and colleagues for biofilms grown under static biofilm
culture conditions. The authors demonstrated the importanceof flagellar motility by comparing attachment of a motile and anonmotile P. aeruginosa over time to PVC plastic under staticbiofilm culture conditions in the well of a microtiter dish (32).While the wild-type P. aeruginosa strain PA14 formed a dis-persed monolayer under these growth conditions, only a fewcells of the nonmotile P. aeruginosa strain PA257 (carrying amutation in flgK) attached to the PVC plastic (32).
In continuous flow, irreversible attachment is indicated bythe activation of the las regulon and commenced cell clusterdevelopment. As observed by microscopy, motility ceased dur-ing this developmental stage, possibly due to the loss of fla-gella. A similar observation was made for P. putida, wheresubtractive hybridization and immunoblot analyses indicated aswitch from flagellar to type IV pilus-based twitching motilityafter attachment (47). Interestingly, biofilm developmentalstages of the nonmotile P. aeruginosa strain PA257 precedednormally (not shown). In static biofilm systems, this develop-mental stage is indicated by the progressive formation of adenser monolayer of cells (as determined by discontinuouslyviewing small PVC plastic tabs that were previously incubatedin microtiter dishes over time [32]). The formation of a densemonolayer was probably due to both growth at the PVC sur-face and continued attachment, since the static biofilm systemwas in a batch system. Within 7 h after initial attachment to thePVC plastic surface, the monolayer in the microtiter dish be-came punctuated with cell clusters (referred to by O’Toole andKolter as microcolonies) that were 3 to 5 layers of cells thick(32). Other developmental stages using the static biofilm sys-tem were not described.
Microscopic analysis of biofilm development also suggestedthe importance of motility for the dispersion stage. Cells evac-uating cell clusters showed motility, as observed by microscopy,while cells remaining in the walls of cell clusters were nonmo-tile (see Fig. 1). This finding implies that the flagella functionin transport and initiation of cell-to-surface interactions andalso in detachment from the biofilm. Similar observations usingimmunoblot analyses for flagellin were made for P. putidabiofilm development (47).
Following reversible attachment, bacteria were able to alterthe regulation of a number of genes which influenced theprotein patterns derived from two-dimensional gel analysis.
TABLE 4. Phenotypic characteristics of biofilm development
Biofilm stage Characteristics observed under the microscope Protein profile
Planktonic Motility Difference compared to reversibly attached cellsReversible attachment Contact with surface via cell pole, transiently
fixed to substratumNo difference between PAO1 and PAO-JP1; indication
of differentially surface-induced gene expression(quorum sensing independent)
Irreversible attachment Reorientation to longitudinal cell axis, cell clusterdevelopment, nonmotile, lasB activation
50 proteins different between PAO1 and PAO-JP1:surface-induced regulation of �100 proteins
Maturation-1 Layered cells in clusters, cluster thickness �10�m rhlA activation
Profound difference in protein pattern compared toplanktonic cells
Maturation-2 Maximum cell cluster development, clusterthickness up to 100 �m, majority of cellsdisplaced from substratum
Greatest difference in protein pattern compared toplanktonic cells; protein pattern significantly differentfrom maturation-1 stage; de novo synthesis of morethan 100 proteins 50% of protein spots upregulatedcompared to planktonic cells
Dispersion Alteration in cell cluster structure motile andnonmotile bacteria observed, formation ofpores and channels, dispersion
Greater similarity to planktonic cells than tomaturation-2 biofilm cells; 35% of proteins spotsdownregulated compared to mature biofilm cells
VOL. 184, 2002 MULTIPLE P. AERUGINOSA BIOFILM PHENOTYPES 1151
on August 25, 2019 by guest
http://jb.asm.org/
Dow
nloaded from
Among these are the genes that respond to Las quorum-sens-ing regulation. This has been demonstrated previously (49),where activation of the lasB gene was shown to occur within24 h of initial attachment. Observations by microscopy dem-onstrated that the onset of lasB activity is correlated with theonset of initial development of biofilm cell clusters. Proteinanalysis revealed a change in the regulation of more than 50spots, indicating a profound difference in physiology betweenreversibly and irreversibly attached cells (see reference 53 forquorum-sensing-regulated genes).
One protein responsive to regulation by quorum sensing wasidentified as L-ornithine 5-monooxygenase, a key enzyme inpyoverdine biosynthesis (36, 53). A second protein responsiveto quorum sensing was identified as �-hydroxydecanoyl-ACPdehydrogenase, an enzyme that is part of the Fab pathway. Theacyl-ACPs derived from the Fab pathway play central roles inbiosynthetic pathways that depend on acyl transfer reactionsand have been proposed to be acyl donors for the synthesis ofacylated homoserine lactones (25, 51). Furthermore, analysisof protein patterns of irreversibly attached (1-day) and plank-tonic cells revealed the presence of quorum-sensing-indepen-dent but probably surface-induced differential expression ofproteins.
Fifty-seven unique protein spots were identified in 1-daybiofilm protein patterns for both P. aeruginosa strain PAO1and strain PAO-JP1 that were absent in planktonic proteinpatterns, and 48 protein spots that were unique for planktonicgrowth were identified. These results imply that quorum sens-ing accounts for only a portion of the total number of geneswhose regulation is altered during this stage of biofilm devel-opment and that the physiological change in attached bacteriais not due solely to induction by PAI-1 quorum sensing auto-inducer (47). The implication of this result is that undiscoveredbiofilm regulons probably exist.
The next stage in biofilm development was maturation-1. Atthis stage, the second quorum-sensing regulon (rhlA) wasshown to become active. During maturation-1, 36% of theapproximately 1,500 genes detectable by two-dimensionalPAGE analysis were shown to be upregulated, while only 3%were downregulated. This number exceeds what would be pre-dicted for Rhl quorum sensing alone, and it hints that otherundiscovered regulatory mechanisms are at work. Among theproteins showing significant upregulation during this stage ofdevelopment are the Arc proteins, which are linked to anaer-obic processes. This implies that during the maturation-1 stageof development, the biofilm becomes oxygen limited at least inselect zones (presumably at or near the substratum). It is alsoduring maturation-1 that evidence of matrix polymer produc-tion is detectable by alcian blue staining. Comparison of P.aeruginosa strain PAO-JP1 with the wild type showed that theLas quorum-sensing system is involved in the development ofcell clusters (9). The change in architecture of the biofilm atthis stage may influence the production of many of the proteinsobserved to differ in concentration during maturation-1.
The biofilm reaches its maximum thickness during the mat-uration-2 stage of development. This is also the point at whichbiofilm bacteria are profoundly different from planktonic bac-teria with respect to the number of differentially expressedproteins. More than 50% of all detectable proteins undergochanges in regulation between planktonic growth and matura-
tion-2 stage growth, with the majority being upregulated. Pre-sumably, a large portion of the population is experiencinganaerobic or reduced oxygen conditions during this stage. Sig-nificantly, maturation-2 proteins are substantially differentfrom maturation-1 proteins, with 39% of the total detectablecomplement (approximately 585 proteins) experiencing a six-fold or greater change in regulation. For comparative analysis,protein spots were considered significantly different if theydisplayed a sixfold or greater difference in volume as detectedby the Melanie-3 software. Therefore, the numbers presentedare minimal values for differences in protein concentrations forall proteins detected.
The final stage in the development of a biofilm is the dis-persion stage. During this stage, bacteria within cell clusterscan be seen to actively swim away from the interior portions ofcell clusters, leaving behind structures that appear shell-like,with a hollow center and walls of nonmotile bacteria. Presum-ably, this dispersion process allows cells to swim back into thebulk liquid to gain better access to nutrients while at the sametime allowing better access to nutrients for the cells that re-main in the biofilm. Interestingly, the protein patterns fordispersion stage biofilms are actually closer to the patternsobserved for planktonic bacteria than for maturation-2 stagecells. It is also worth noting that the transition to dispersionphase is the only episode in biofilm development where moreproteins were downregulated than upregulated. Many of thebacteria that contributed to the protein samples and proteinprofiles in the dispersion stage may have been in a transitionfrom a biofilm to a planktonic phenotype.
Of the proteins detected by two-dimensional gel electro-phoresis, 23 that showed large changes in regulation at differ-ent time points during biofilm development were identifiedusing MALDI-TOF-MS analysis. Among these are proteinsinvolved in resistance to oxidative damage, EPS production,and aerobic and anaerobic metabolism. A similar finding wasmade by Prigent-Combaret and coworkers for E. coli K-12biofilm cells (42). The authors demonstrated that biofilm for-mation triggered the differential expression of genes involvedin EPS production, osmolarity, oxygen limitation, cell-to-cellsignaling, and motility (42).
Certain of the proteins identified in the current study hadbeen shown to be expressed in P. aeruginosa biofilm cells iso-lated from cystic fibrosis (CF) patients (20). These proteinsincluded dihydrolipoamide dehydrogenase 3, ornithine car-bamoyltransferse (ArcB), the ribosomal protein L25, superox-ide dismutase (SodB), and alkyl hydroxyperoxide reductase,with SodB being produced only in the nonmucoid P. aeruginosaCF isolate and alkyl hydroxyperoxide reductase produced inboth mucoid and nonmucoid isolates (20). Our finding andthat by Hanna et al. (20) of increased superoxide dismutaseproduction in biofilms contrasts with other reports which donot show evidence of transcription for this gene or presence ofthe protein (5, 17, 22).
Interestingly, the SodA concentration has been reported byHassett et al. to be increased in alginate-producing bacteria(23). We detected an increase in the concentration of UTP-glucose-1-phosphate uridyltransferase in biofilm cells. This en-zyme is involved in central intermediary metabolism, catalyzingthe interconversions of pentose and glucuronate. The activityof this enzyme was shown to be necessary for exopolymer
1152 SAUER ET AL. J. BACTERIOL.
on August 25, 2019 by guest
http://jb.asm.org/
Dow
nloaded from
production in Lactobacillus casei CRL 87 and Streptococcusthermophilus (4, 14, 28) and may be active in the biosynthesis ofbiofilm matrix material in P. aeruginosa.
Evidence for changes in carbon and energy metabolism aregiven by the finding that proteins involved in amino acid me-tabolism and the tricarboxylic acid cycle, including succinatesemialdehyde dehydrogenase, fumarate hydratase C1, andglyceraldehyde-3-phosphate dehydrogenase, were produced athigher levels in mature and late-stage biofilms. Our finding ofincreased glyceraldehyde-3-phosphate dehydrogenase levels isin contrast to a recent report by Whiteley and colleagues,where the gene for this enzyme was found to be downregulatedfourfold in 5-day-old P. aeruginosa biofilm cells (52). While themajority of metabolic proteins were upregulated, dihydrolipo-amide dehydrogenase 3 was downregulated following attach-ment. Dihydrolipoamide dehydrogenase is a flavoprotein com-ponent of multienzyme complexes catalyzing the oxidativedecarboxylation of �-ketoacids in the Krebs cycle.
Interestingly, proteins involved in amino acid metabolism,including the proteins ArcA, ArcB, and ArcC were found to beupregulated following attachment. This arcCDAB operon en-codes the enzymes of the arginine deiminase pathway in P.aeruginosa and was shown to be regulated by ANR, an ana-logue of Escherichia coli FNR, and by the regulatory proteinArgR, a helper to the anaerobic regulatory protein ANR (1,26). ANR is necessary for denitrification, arginine deiminaseactivity, and cyanide production by P. aeruginosa under condi-tions of oxygen limitation (1). That the biofilm cells were de-prived of oxygen is supported by the finding that the membraneprotein E1 (OprE), an anaerobically induced porin under thecontrol of sigma 54 (55), was also upregulated following at-tachment. Interestingly, the proteins for the arginine deimi-nase pathway were found to be downregulated in P. putida 6 hfollowing initial attachment and upregulated again in laterstages (47).
Besides the outer membrane protein E1, two other compo-nents of outer membrane proteins were found to be upregu-lated in mature biofilms. These two binding protein compo-nents of the ABC transporter belong to the family ofextracellular solute-binding proteins of bacteria that serve aschemoreceptors, recognition constituents of transport systems,and initiators of signal transduction pathways (50). Eightclasses of solute-binding proteins are known, with PA4496, anABC transporter for small molecules such as dipeptides, be-longing to cluster 5. Cluster 5 includes proteins that are specificfor the transport of dipeptides, oligopeptides, and nickel.PA5076, a putative glutamine transporter, belongs to class 3.Class 3 includes proteins that are specific for histidine, lysine-arginine-ornithine, glutamine, octopine, nopaline, and basicamino acids.
Recently, two members of class 3 solute binding proteinshave been characterized on the basis of adhesin function ratherthan involvement in solute uptake. These are the collagenbinding protein Cnb from Lactobacilllus reuteri (44) and thePEB1 adhesin from Campylobacter jejuni (39). The function ofouter membrane proteins and ABC transporter as adhesins isconsistent with earlier reports showing that these cell compo-nents have a substantial influence on attachment (16, 27, 42,47). Attachment to abiotic surfaces was shown in Escherichiacoli to cause major changes in outer membrane protein com-
position (35). Using two-dimensional gel analysis of purifiedouter membrane proteins, Otto and coworkers demonstratedincreased levels for 17 outer membrane proteins and decreasedprotein levels for 15. Proteins found to have a large decrease inconcentration following attachment were identified as OmpA,OmpX, TolC, and the lipoprotein Slp.
While we were able to detect outer membrane proteins bytwo-dimensional PAGE, we were unable to detect proteinsfrom the inner membrane. This was probably due to the higherhydrophobicity of inner membrane proteins resulting in poorsolubilization during sample preparation and isoelectric focus-ing (21). In addition, the analysis of membrane proteins fromtotal cell extracts by two-dimensional gel electrophoresis maybe hampered by other components such as lipids, which mayinterfere with solubilization in the rehydration buffer (45).
In this work, we have characterized five stages of biofilmdevelopment, each with a distinct protein pattern and observ-able phenotype, and each different from planktonic bacteria.The changes detected in the protein patterns between biofilmdevelopmental stages were greater than anticipated (see ref-erence 52 for comparison) and suggest that the P. aeruginosabiofilm growth cycle is both complex and highly regulated. Therevelation that changes in protein regulation at each stage ofbiofilm development were as profound as the differences ob-served for different (but related) species at the same stage ofbiofilm development has important implications for designingrational and effective methods for biofilm detection and con-trol. The discovery of regulatory systems responsible for keytransitional episodes in biofilm development will be an impor-tant step in achieving this goal.
ACKNOWLEDGMENTS
We gratefully acknowledge the technical assistance of HenningSeedorf from Montana State University–Bozeman and Kristin Daviesfrom the State University of New York at Binghamton. We are alsograteful to M. Parsek, H. P. Schweizer, J. Pearson, and G. A. O’Toolefor assistance in providing strains.
This work was supported by a grant from the Research Foundationof the State of New York, through cooperative agreements DC04173-01and DC02148 between the National Institutes of Health and AlleghenySinger Research Institute, through cooperative agreement EEC-897039 between the National Science Foundation and Montana StateUniversity, by the industrial partners of the Center for Biofilm Engi-neering, and by the Deutsche Forschungsgemeinschaft.
REFERENCES
1. Arai, H., T. Kodama, and Y. Igarashi. 1997. Cascade regulation of the twoCRP/FNR-related transcriptional regulators (ANR and DNR) and the deni-trification enzymes in Pseudomonas aeruginosa. Mol. Microbiol. 25:1141–1148.
2. Belas, R., M. Simon, and M. Silverman. 1986. Regulation of lateral flagellagene transcription in Vibrio parahaemolyticus. J. Bacteriol. 167:210–218.
3. Blum, H., H. Beier, and H. J. Gross. 1987. Improved silver staining of plantproteins, RNA and DNA in polyacrylamide gels. Electrophoresis 8:93–99.
4. Boels, I. C., A. Ramos, M. Kleerebezem, and W. M. de Vos. 2001. Functionalanalysis of the Lactococcus lactis galU and galE genes and their impact onsugar nucleotide and exopolysaccharide biosynthesis. Appl. Environ. Micro-biol. 67:3033–3040.
5. Bollinger, N., D. J. Hassett, B. H. Iglewski, J. W. Costerton, and T. R.McDermott. 2001. Gene expression in Pseudomonas aeruginosa: evidence ofiron override effects on quorum sensing and biofilm-specific gene regulation.J. Bacteriol. 183:1990–1996.
6. Brõzel, V. S., G. M. Strydom, and T. E. E. Cloete. 1995. A method for thestudy of de novo protein synthesis in Pseudomonas aeruginosa after attach-ment. Biofouling 8:195–210.
7. Dagastino, L., A. E. Goodman, and K. C. Marshall. 1991. Physiologicalresponses induced in bacteria adhering to surfaces. Biofouling 4:113–119.
VOL. 184, 2002 MULTIPLE P. AERUGINOSA BIOFILM PHENOTYPES 1153
on August 25, 2019 by guest
http://jb.asm.org/
Dow
nloaded from
8. Dalton, H. M., and P. E. March. 1998. Molecular genetics of bacterialattachment and biofouling. Biotechnology 9:252–255.
9. Davies, D. G., M. R. Parsek, J. P. Pearson, B. H. Iglewski, J. W. Costerton,and E. P. Greenberg. 1998. The involvement of cell-to-cell signals in thedevelopment of a bacterial biofilm. Science 280:295–298.
10. Davies, D. G., and G. G. Geesey. 1995. Regulation of the alginate biosyn-thesis gene algC in Pseudomonas aeruginosa during biofilm development incontinuous culture. Appl. Environ. Microbiol. 61:860–867.
11. Davies, D. G. 1996. Regulation of alginate biosynthesis in Pseudomonasaeruginosa biofilms. Ph.D. thesis. Montana State University-Bozeman, Boze-man, Mont.
12. Davies, D. G., A. M. Charabarty, and G. G. Geesey. 1993. Exopolysaccharideproduction in biofilms: substratum activation of alginate gene expression byPseudomonas aeruginosa. Appl. Environ. Microbiol. 59:1181–1186.
13. DeFlaun, M. F., S. R. Oppenheimer, S. Streger, C. W. Condee, and M.Fletcher. 1999. Alterations in adhesion, transport, and membrane charac-teristics in an adhesion-deficient pseudomonad. Appl. Environ. Microbiol.65:759–765.
14. Degeest, B., F. Vaningelgem, A. P. Laws, and, L. De Vuyst. 2001. UDP-N-acetylglucosamine 4-epimerase activity indicates the presence of N-acetyl-galactosamine in exopolysaccharides of Streptococcus thermophilus strains.Appl. Environ. Microbiol. 67:3976–3984.
15. Dekkers, L. C., A. J. van der Bij, I. H. Mulders, C. C. Phoelich, R. A.Wentwoord, D. C. Glandorf, C. A. Wijffelman, and B. J. Lugtenberg. 1998.Role of the O-antigen of lipopolysaccharide, and possible roles of growthrate and of NADH:ubiquinone oxidoreductase (nuo) in competitive tomatoroot-tip colonization by Pseudomonas fluorescens WCS365. Mol. Plant-Mi-crobe Interact. 11:763–771.
16. Espinosa-Urgel, M., A. Salido, and J. L. Ramos. 2000. Genetic analysis offunctions involved in adhesion of Pseudomonas putida to seeds. J. Bacteriol.182:2363–2369.
17. Frederick, J. R., J. G. Elkins, N. Bollinger, D. J. Hassett, and T. R. McDer-mott. 2001. Factors affecting catalase expression in Pseudomonas aeruginosabiofilms and planktonic cells. Appl. Environ. Microbiol. 67:1375–1379.
18. Genevaux, P., P. Bauda, M. S. DuBow, and B. Oudega. 1999. Identificationof Tn10 insertions in the rfaG, rfaP, and galU genes involved in lipopolysac-charide core biosynthesis that affect Escherichia coli adhesion. Arch. Micro-biol. 172:1–8.
19. Görg, A., C. Obermaier, G. Boguth, A. Harder, B. Scheibe, R. Wildgruber,and W. Weiss. 2000. The current state of two-dimensional electrophoresiswith immobilized pH gradients. Electrophoresis 6:1037–1053.
20. Hanna, S. L., N. E. Sherman, M. T. Kinter, and J. B. Goldberg. 2000.Comparison of proteins expressed by Pseudomonas aeruginosa strains rep-resenting initial and chronic isolates from a cystic fibrosis patient: an analysisby two-dimensional gel electrophoresis and capillary column liquid chroma-tography-tandem mass spectrometry. Microbiology 146:2495–2508.
21. Harry, J. L., M. R. Wilkins, B. R. Herbert, N. H. Packer, A. A. Gooley, andK. L. Williams. 2000. Proteomics: capacity versus utility. Electrophoresis6:1071–1081.
22. Hassett, D. J., J. F. Ma, J. G. Elkins, T. R. McDermott, U. A. Ochsner, S. E.West, C. T. Huang, J. Fredericks, S. Burnett, P. S. Stewart, G. McFeters, L.Passador, and B. H. Iglewski. 1999. Quorum sensing in Pseudomonas aerugi-nosa controls expression of catalase and superoxide dismutase genes andmediates biofilm susceptibility to hydrogen peroxide. Mol. Microbiol. 34:1082–1093.
23. Hassett, D. J., W. A. Woodruff, D. J. Wozniak, M. L. Vasil, M. S. Cohen, andD. E. Ohman. 1993. Cloning and characterization of the Pseudomonas aerugi-nosa sodA and sodB genes encoding manganese- and iron-cofactored super-oxide dismutase: demonstration of increased manganese superoxide dis-mutase activity in alginate-producing bacteria. J. Bacteriol. 175:7658–7665.
24. Korber, D. R., J. R Lawrence, M. J. Hendry, and D. E. Caldwell. 1993.Analysis of spatial variability within mot� and mot� Pseudomonas fluores-cens biofilms using representative elements. Biofouling 7:339–358.
25. Kutchma, A. J., T. T. Hoang, and H. P. Schweizer. 1999. Characterization ofa Pseudomonas aeruginosa fatty acid biosynthetic gene cluster: purification ofacyl carrier protein (ACP) and malonyl-coenzyme A:ACP transacylase(FabD). J. Bacteriol. 181:5498–5504.
26. Lu, C. D., H. Winteler, A. Abdelal, and D. Haas. 1999. The ArgR regulatoryprotein, a helper to the anaerobic regulator ANR during transcriptionalactivation of the arcD promoter in Pseudomonas aeruginosa. J. Bacteriol.181:2459–2464.
27. Matthysse, A. G., H. A. Yarnall, and N. Young. 1996. Requirement for geneswith homology to ABC transport systems for attachment and virulence ofAgrobacterium tumefaciens. J. Bacteriol. 178:5302–5308.
28. Mozzi, F., G. Rollan, G. S. de Giori, and G. Font de Valdez. 2001. Effect ofgalactose and glucose on the exopolysaccharide production and the activitiesof biosynthetic enzymes in Lactobacillus casei CRL 87. J. Appl. Microbiol.91:160–167.
29. O’Farrell, P. H. 1975. High resolution two-dimensional electrophoresis ofproteins. J. Biol. Chem. 250:4007–4021.
30. O’Toole, G. A., H. B. Kaplan, and R. Kolter. 2000. Biofilm formation asmicrobial development. Annu. Rev. Microbiol. 54:49–79.
31. O’Toole, G. A., K. A. Gibbs, P. W. Hager, P. V. Phibbs, Jr., and R. Kolter.2000. The global carbon metabolism regulator Crc is a component of a signaltransduction pathway required for biofilm development by Pseudomonasaeruginosa. J. Bacteriol. 182:425–431.
32. O’Toole, G. A., and R. Kolter. 1998. Flagellar and twitching motility arenecessary for Pseudomonas aeruginosa biofilm development. Mol. Microbiol.30:295–304.
33. O’Toole, G. A., and R. Kolter. 1998. Initiation of biofilm formation inPseudomonas fluorescens WCS365 proceeds via multiple, convergent signal-ling pathways: a genetic analysis. Mol. Microbiol. 28:419–461.
34. Obara, M., and T. Nakae. 1992. Porin of Pseudomonas aeruginosa forms lowconductance ion channel in planar lipid bilayers. Biochem. Biophys. Res.Commun. 186:645–651.
35. Otto, K., J. Norbeck, T. Larsson, K. A. Karlsson, and M. Hermansson. 2001.Adhesion of type 1-fimbriated Escherichia coli to abiotic surfaces leads toaltered composition of outer membrane proteins. J. Bacteriol. 183:2445–2453.
36. Pearson, J. P., E. C. Pesci, and B. H. Iglewski. 1997. Roles of Pseudomonasaeruginosa las and rhl quorum-sensing systems in control of elastase andrhamnolipid biosynthesis genes. J. Bacteriol. 179:5756–5767.
37. Pearson, J. P., L. Passador, B. H. Iglewski, and E. P. Greenberg. 1995. Asecond N-acylhomoserine lactone signal produced by Pseudomonas aerugi-nosa. Proc. Natl. Acad. Sci. USA 92:1490–1494.
38. Pearson, J. P., K. M. Gray, L. Passador, K. D. Tucker, A. Eberhard, B. H.Iglewski, and E. P. Greenberg. 1994. Structure of the autoinducer requiredfor expression of Pseudomonas aeruginosa virulence genes. Proc. Natl. Acad.Sci. USA 91:197–201.
39. Pei, Z., C. Burucoa, B. Grignon, S. Baqar, X. Z. Huang, D. J. Kopecko, A. L.Bourgeois, J. L. Fauchere, and M. J. Blaser. 1998. Mutation in the peb1Alocus of Campylobacter jejuni reduces interactions with epithelial cells andintestinal colonization of mice. Infect. Immun. 66:938–943.
40. Peterson, G. L. 1977. A simplification of the protein assay method of Lowryet al. which is more generally applicable. Anal. Biochem. 83:346–356.
41. Pratt, L., A, and R. Kolter. 1998. Genetic analysis of Escherichia coli biofilmformation: roles of flagella, motility, chemotaxis and type I pili. Mol. Micro-biol. 30:285–293.
42. Prigent-Combaret, C., O. Vidal, C. Dorel, and P. Lejeune. 1999. Abioticsurface sensing and biofilm-dependent regulation of gene expression inEscherichia coli. J. Bacteriol. 181:5993–6002.
43. Rodriguez-Herva, J. J., D. Reniero, E. Galli, and J. L. Ramos. 1999. Cellenvelope mutants of Pseudomonas putida: physiological characterization andanalysis of their ability to survive in soil. Environ. Microbiol. 1:479–488.
44. Roos, S., P. Aleljung, N. Robert, B. Lee, T. Wadstrom, M. Lindberg, and H.Jonsson. 1996. A collagen binding protein from Lactobacillus reuteri is partof an ABC transporter system? FEMS Microbiol. Lett. 144:33–38.
45. Santoni, V., M. Molloy, and T. Rabilloud. 2000. Membrane proteins andproteomics: un amour impossible? Electrophoresis 21:1054–1070.
46. Santos, R., M. E. Callow, and T. R. Bott. 1991. The structure of Pseudomonasfluorescens biofilms in contact with flowing systems. Biofouling 4:319–336.
47. Sauer, K., and A. K. Camper. 2001. Characterization of phenotypic changesin Pseudomonas putida in response to surface-associated growth. J. Bacteriol.183:6579–6589.
48. Shevchenko, A., M. Wilm, O. Vorm, and M. Mann. 1996. Mass spectrometricsequencing of proteins silver-stained polyacrylamide gels. Anal. Chem. 68:850–858.
49. Singh, P. K., A. L. Schaefer, M. R. Parsek, T. O. Moninger, M. J. Welsh, andE. P. Greenberg. 2000. Quorum-sensing signals indicate that cystic fibrosislungs are infected with bacterial biofilms. Nature 407:762–764.
50. Tam, R., and M. H. Saier, Jr. 1993. Structural, functional, and evolutionaryrelationships among extracellular solute-binding receptors of bacteria. Mi-crobiol. Rev. 57:320–346.
51. Val, D. L., and J. E. Cronan. 1998. In vivo evidence that S-adenosylmethi-onine and fatty acid synthesis intermediates are the substrates for the LuxIfamily of autoinducer synthases. J. Bacteriol. 180:2644–2651.
52. Whiteley, M., M. G. Bangera, R. E. Bumgarner, M. R. Parsek, G. M. Teitzel,S. Lory, and E. P. Greenberg. 2001. Gene expression in Pseudomonas aerugi-nosa biofilms. Nature 413:860–864.
53. Whiteley, M., K. M. Lee, and E. P. Greenberg. 1999. Identification of genescontrolled by quorum sensing in Pseudomonas aeruginosa. Proc. Natl. Acad.Sci. USA 96:13904–13909.
54. Wilm, M., A. Shevchenko, T. Houthaeve, S. Breit, L. Schweigerer, T. Fotsis,and M. Mann. 1996. Femtomole sequencing of proteins from polyacrylamidegels by nano-electrospray mass spectrometry. Nature 379:466–469.
55. Yamano, Y., T. Nishikawa, and Y. Komatsu. 1993. Cloning and nucleotidesequence of anaerobically induced porin protein E1 (OprE) of Pseudomonasaeruginosa PAO1. Mol. Microbiol. 8:993–1004.
1154 SAUER ET AL. J. BACTERIOL.
on August 25, 2019 by guest
http://jb.asm.org/
Dow
nloaded from