Embed Size (px)
Citation preview
PSM/RtI Formal Evaluation
Level 2 at Middle School
Curriculum Based Assessment
Objectives
Define and discuss the following tools used in Responsiveness to Instruction:– Curriculum-based Assessment and Norms– Baseline data, Goals and Aimlines, Progress
Monitoring– Graphing data– Decision-making rules– Revisions of Hypotheses/Interventions (Level 2
e)
Curriculum Based Assessment (CBA)
Data collection tools derived directly from the curriculum that student is expected to learn
Curriculum Based Assessment (CBA)
CBM is believed to reduce the gap between assessment and instruction
Aides teachers in improving instruction Improved communication Higher level of sensitivity Administration time is shorter More cost effective
To Use CBAs in RtI: Normative Data is Required
Why do we do it? How is it useful?– To provide comparison data on skill levels of
students with the same curriculum and demographics of our county
When or how often do we do it?– Every 5 years
How do we do it?– Stratified Random Sample– Fall, Winter and Spring Windows
ACADEMICS
Reading, Math and Written Language Probes; e.g., CBAs
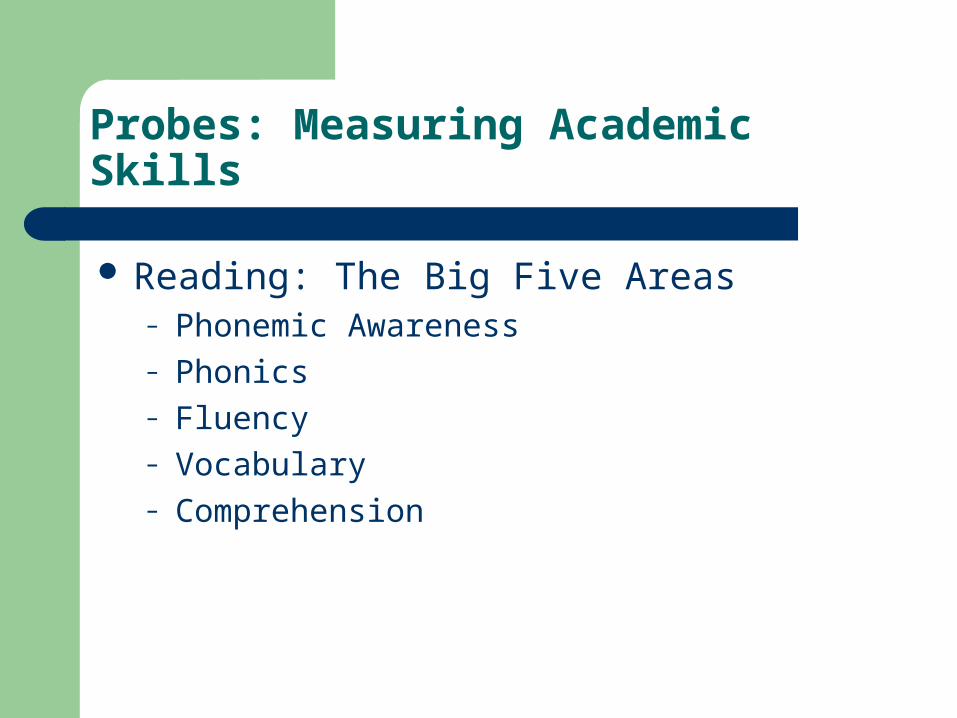
Probes: Measuring Academic Skills
Reading: The Big Five Areas– Phonemic Awareness– Phonics– Fluency– Vocabulary– Comprehension
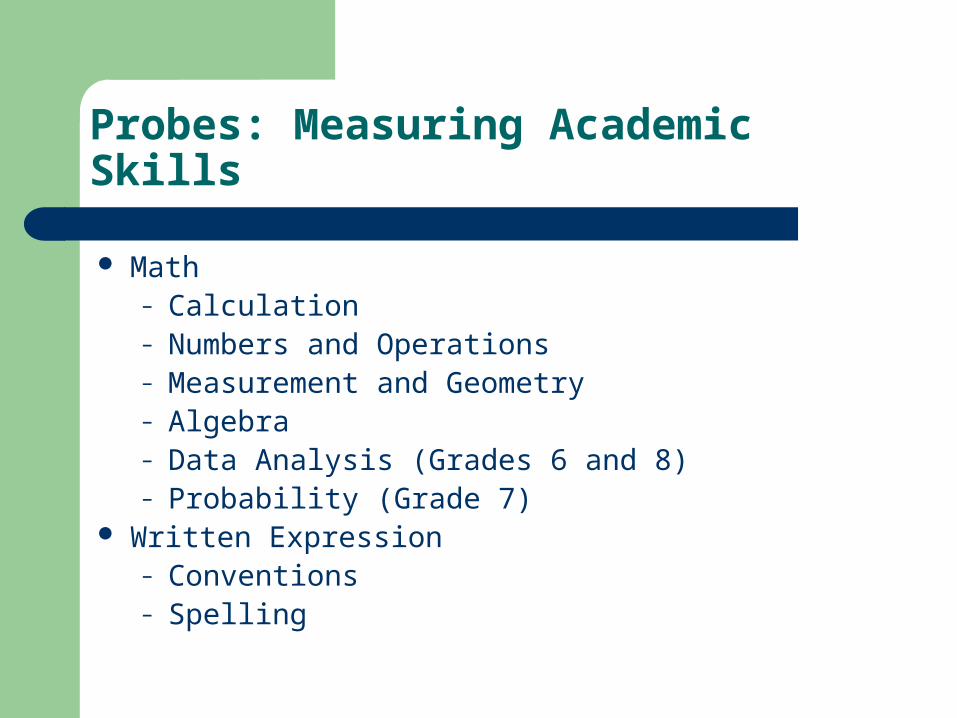
Probes: Measuring Academic Skills
Math– Calculation– Numbers and Operations– Measurement and Geometry– Algebra– Data Analysis (Grades 6 and 8)– Probability (Grade 7)
Written Expression– Conventions– Spelling
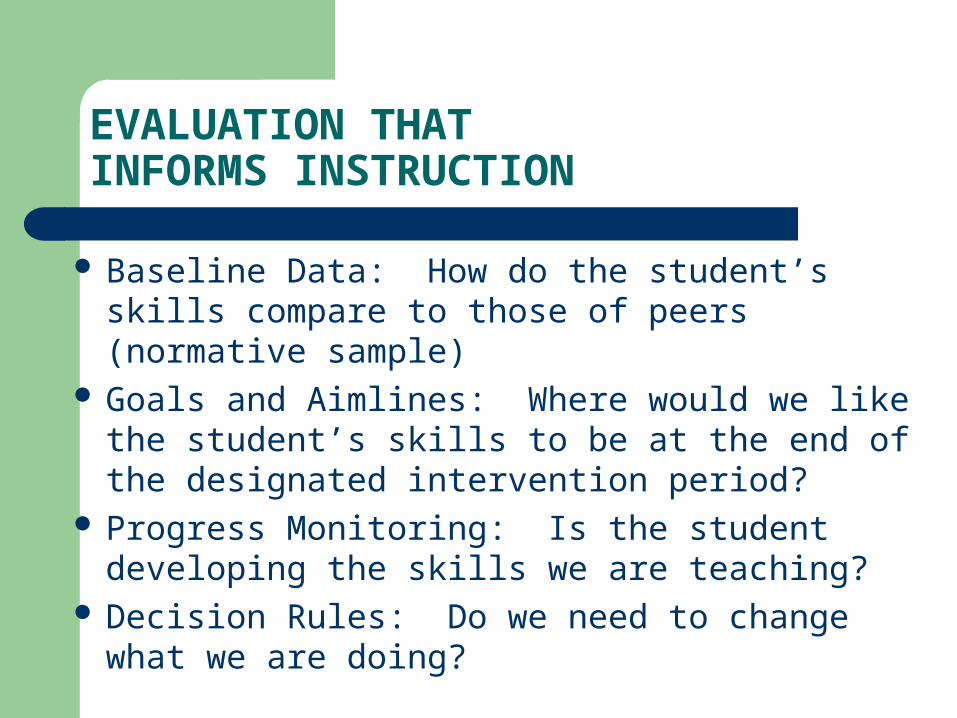
EVALUATION THATINFORMS INSTRUCTION
Baseline Data: How do the student’s skills compare to those of peers (normative sample)
Goals and Aimlines: Where would we like the student’s skills to be at the end of the designated intervention period?
Progress Monitoring: Is the student developing the skills we are teaching?
Decision Rules: Do we need to change what we are doing?
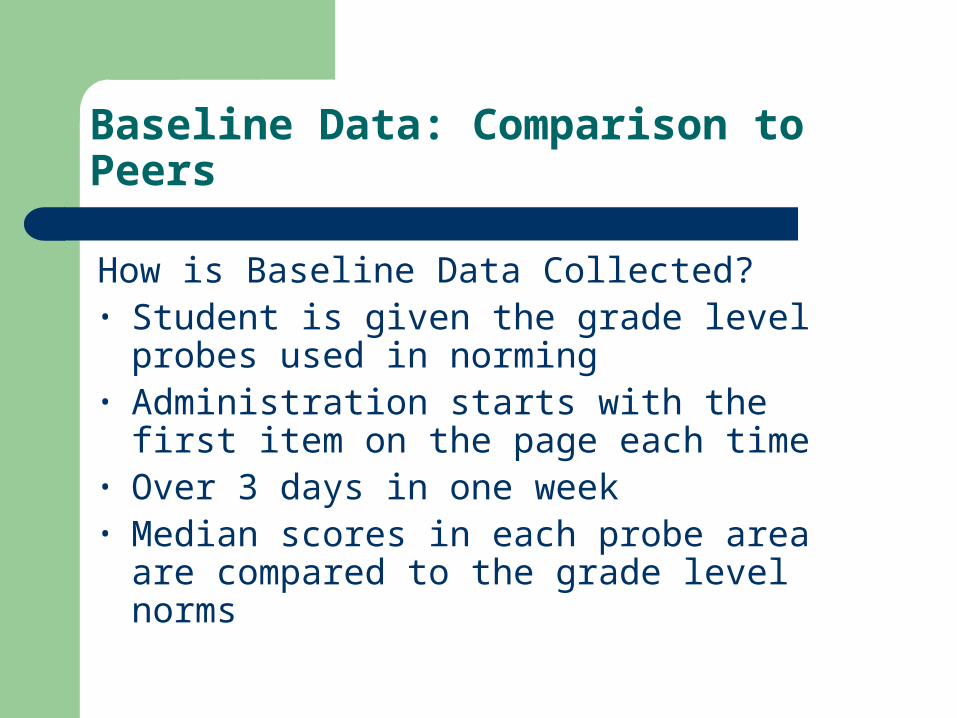
Baseline Data: Comparison to Peers
How is Baseline Data Collected? • Student is given the grade level probes used
in norming• Administration starts with the first item on the
page each time• Over 3 days in one week• Median scores in each probe area are
compared to the grade level norms
Determining Where to Intervene
Skills of student compared to peers
Lowest level skills (the building blocks)
Back Sampling and Diagnostic Assessment
Back Sampling– If the student’s skills in the lowest skill areas on
grade level are weak, then baseline data is collected on the probes for the previous grade level to inform instruction.
Diagnostic Assessment– Can be completed by reviewing actual skills in an
area. Ex. Which sounds/blends/digraphs does the student know? Which math facts are known?
Skills: Discrete or Complex
Discrete Skills are generally taught by practice and over learning. These might include as phonemic awareness, blends, sight recognition, fluency, math calculation, etc.
Complex Skill Sets required a combination of skills to perform. These might include fluency, vocabulary, reading comprehension, math concepts, written expression, etc
Fluency: Discrete or Complex?
Fluency might be considered– Complex if it is the highest level skill on which the
staff are intervening with the student because the student is still working on building blocks or prerequisite skills such as phonological awareness, phonics and/or sight words
– Discrete if it is the lowest level skill on which the staff are intervening because the requisite skills are there, but the student needs practice for speed
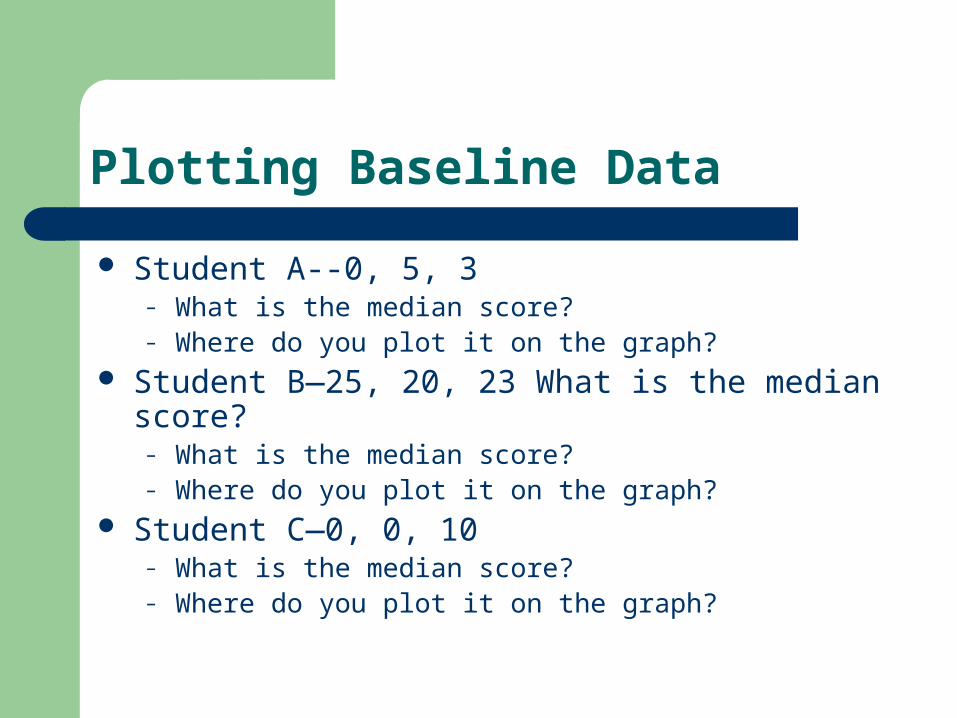
Plotting Baseline Data
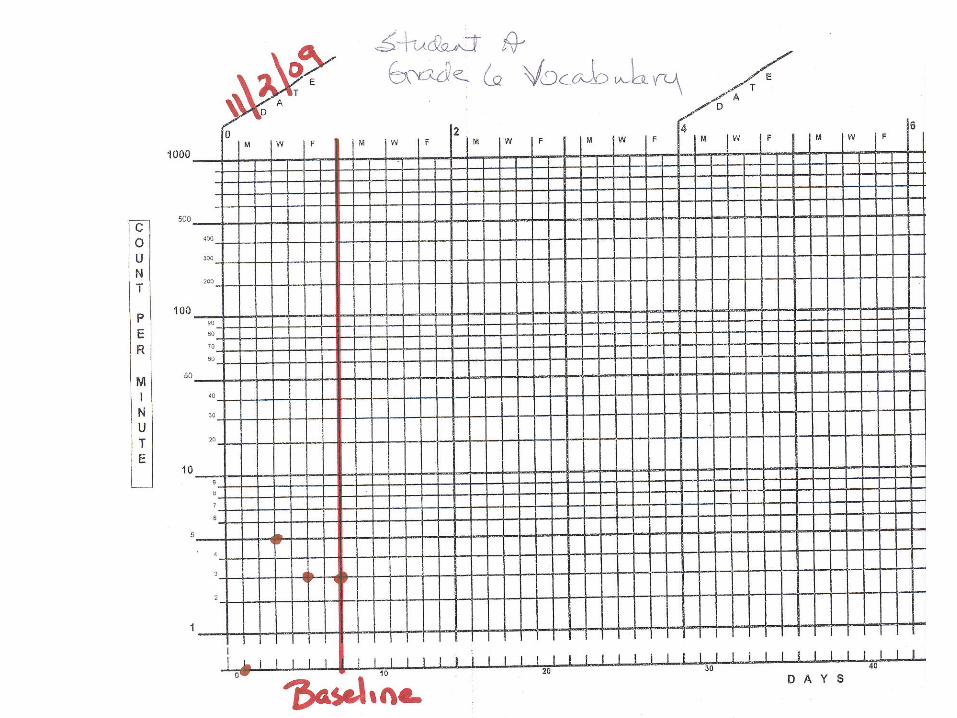
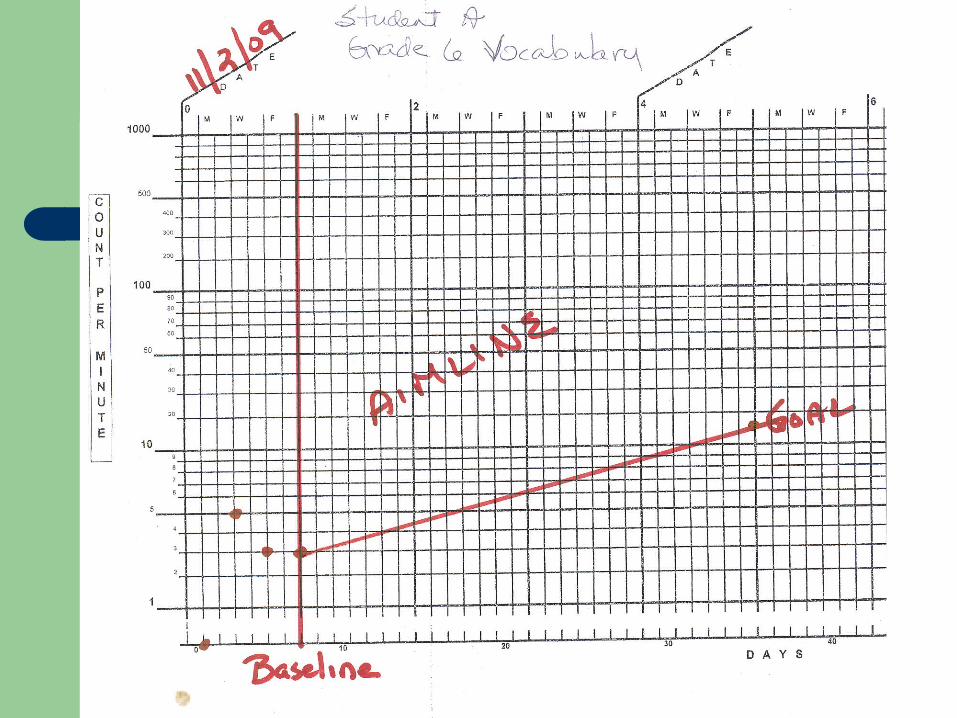
Student A--0, 5, 3– What is the median score?– Where do you plot it on the graph?
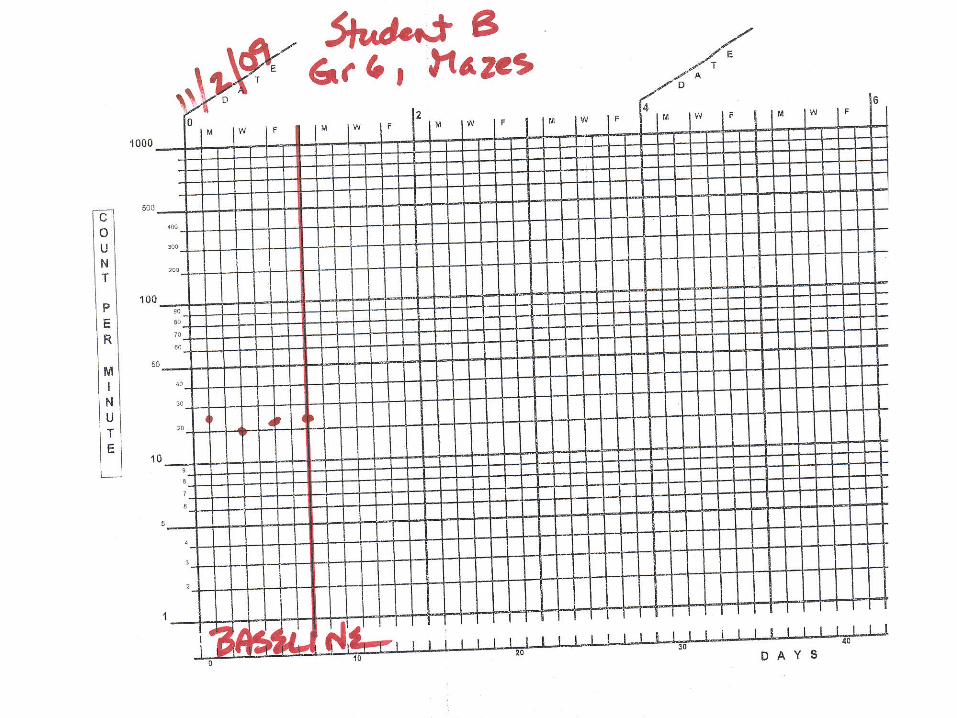
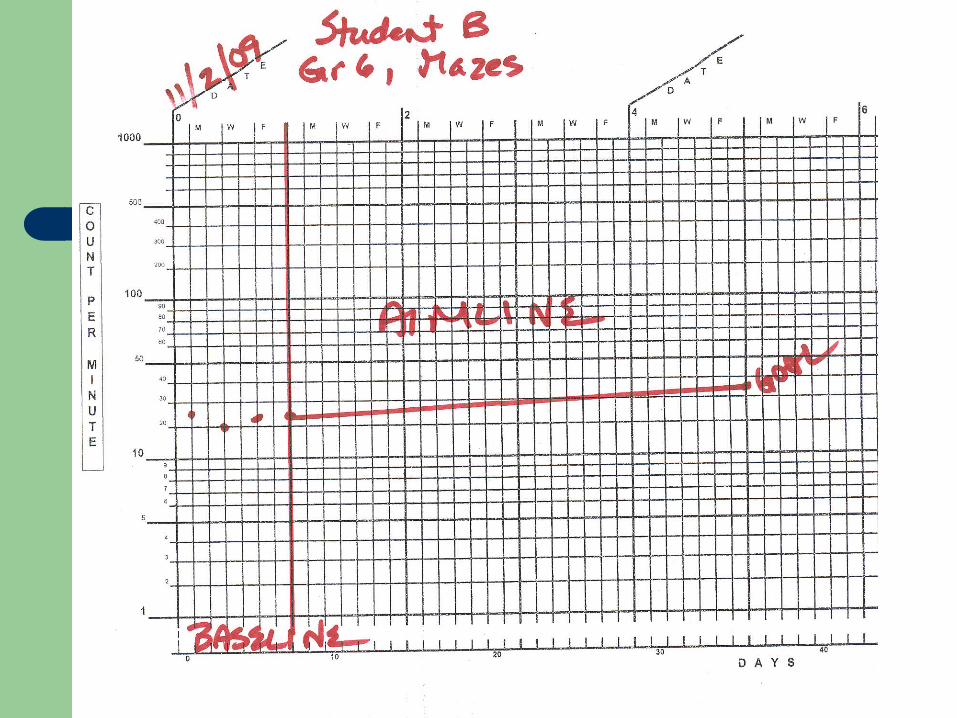
Student B—25, 20, 23 What is the median score?– What is the median score?– Where do you plot it on the graph?
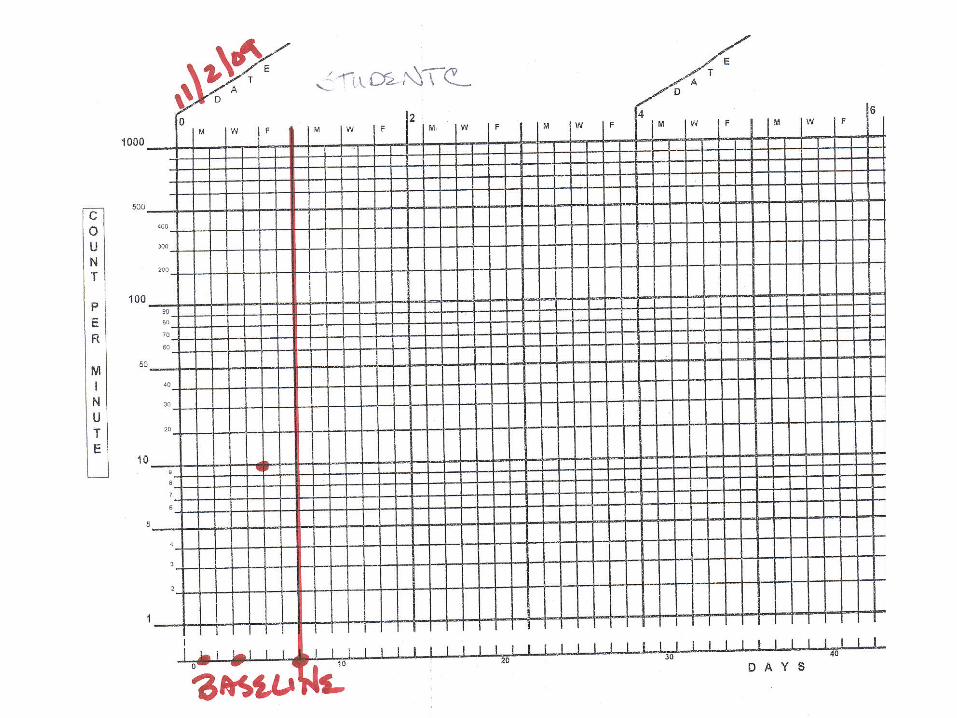
Student C—0, 0, 10– What is the median score?– Where do you plot it on the graph?
Goals: What should we use?
Where would we like the student’s skills to beat the end of the designated interventionperiod? Considerations:• Is the skill a building block to higher level
skills?• Is the skill discrete or complex? • Is it likely to take more or less time and/or
intensity to bring the skills up to proficiency?
Types of Goals
1. District (NHCS) Norms
2. District Behavior Standards
3. Growth Rates• NHCS Data - Can be done for any skill, any
grade level for which norm data is available
4. Class Norms
5. Minimum Celeration Finder
1. Using District Norms
Goals are selected from the norms tables by grade level. The norms tables are located in the Special Education and Related Services manual on the web.
Often the 25th percentile is chosen, but there are times when that is too ambitious for a student and the 13th is used instead.
Goals be selected by the date of the end point of the intervention. Example: If the baseline data was from the week of 10/26/09 (Fall Norms) but the goal is set for 6 weeks later (12/7/09), the goal should be selected from the Winter Norms.
2. NHCS Behavior Standards:
Will be addressed in a workshop in March
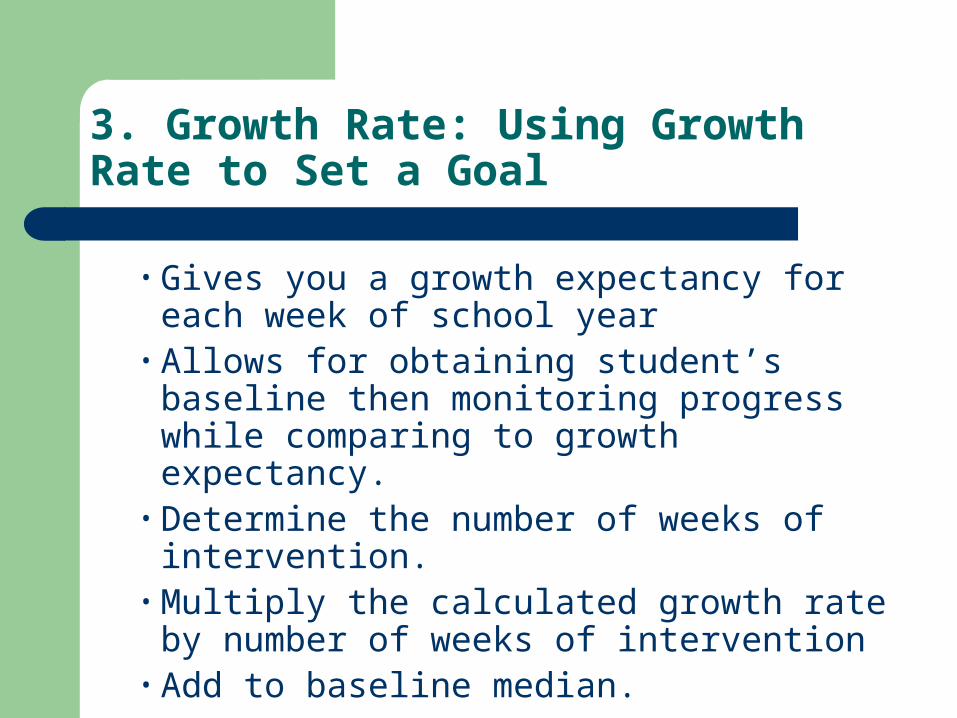
3. Growth Rate: Using Growth Rate to Set a Goal
• Gives you a growth expectancy for each week of school year
• Allows for obtaining student’s baseline then monitoring progress while comparing to growth expectancy.
• Determine the number of weeks of intervention.
• Multiply the calculated growth rate by number of weeks of intervention
• Add to baseline median.
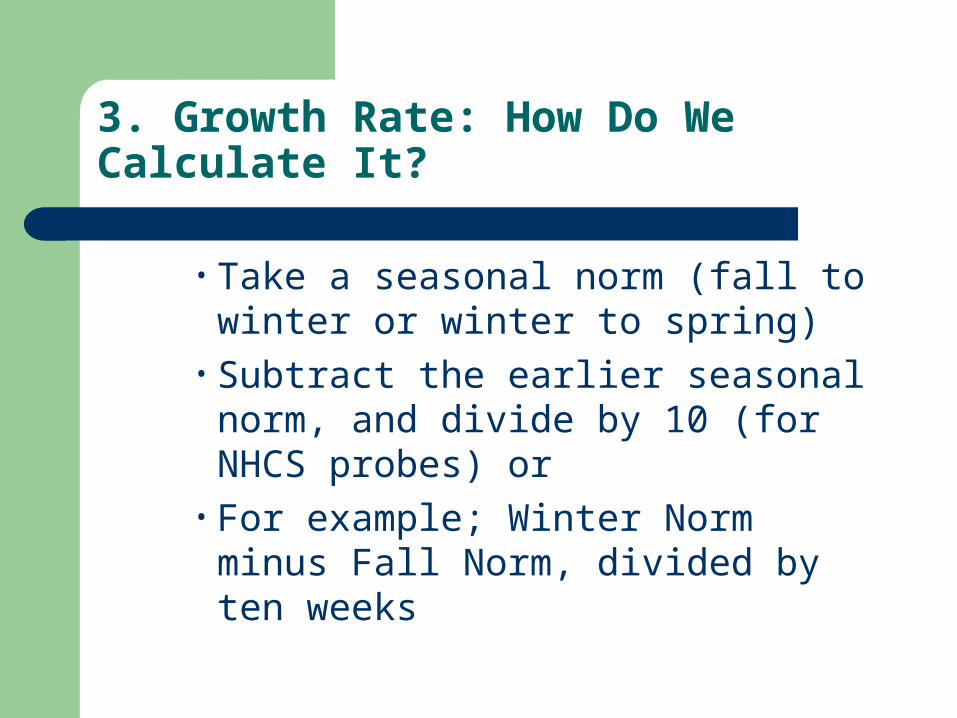
3. Growth Rate: How Do We Calculate It?
• Take a seasonal norm (fall to winter or winter to spring)
• Subtract the earlier seasonal norm, and divide by 10 (for NHCS probes) or
• For example; Winter Norm minus Fall Norm, divided by ten weeks
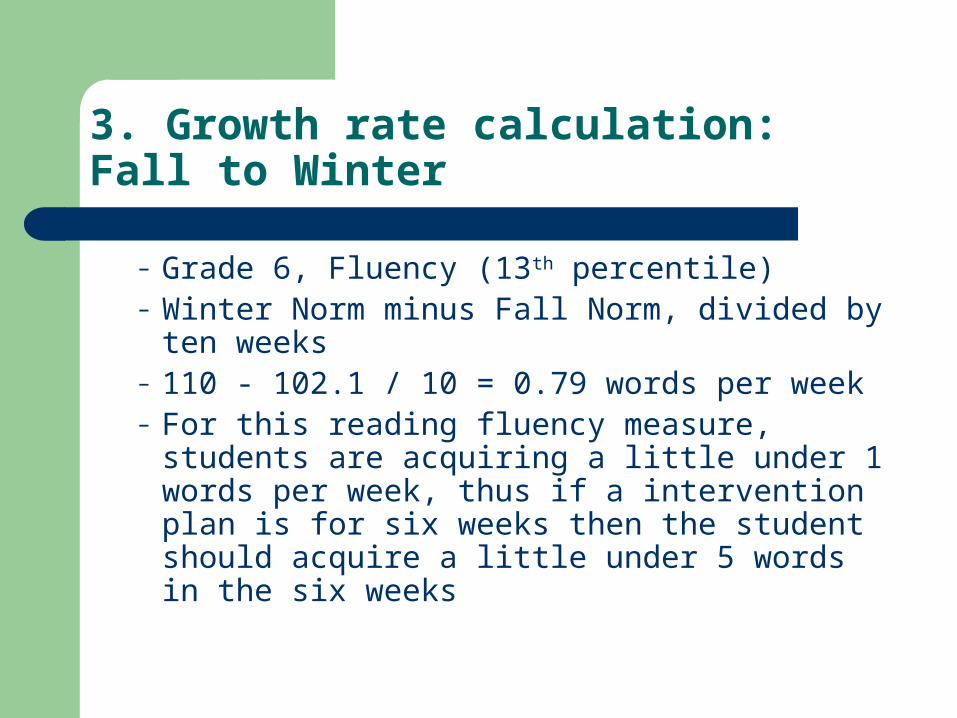
3. Growth rate calculation: Fall to Winter
– Grade 6, Fluency (13th percentile)– Winter Norm minus Fall Norm, divided by
ten weeks– 110 - 102.1 / 10 = 0.79 words per week – For this reading fluency measure, students
are acquiring a little under 1 words per week, thus if a intervention plan is for six weeks then the student should acquire a little under 5 words in the six weeks
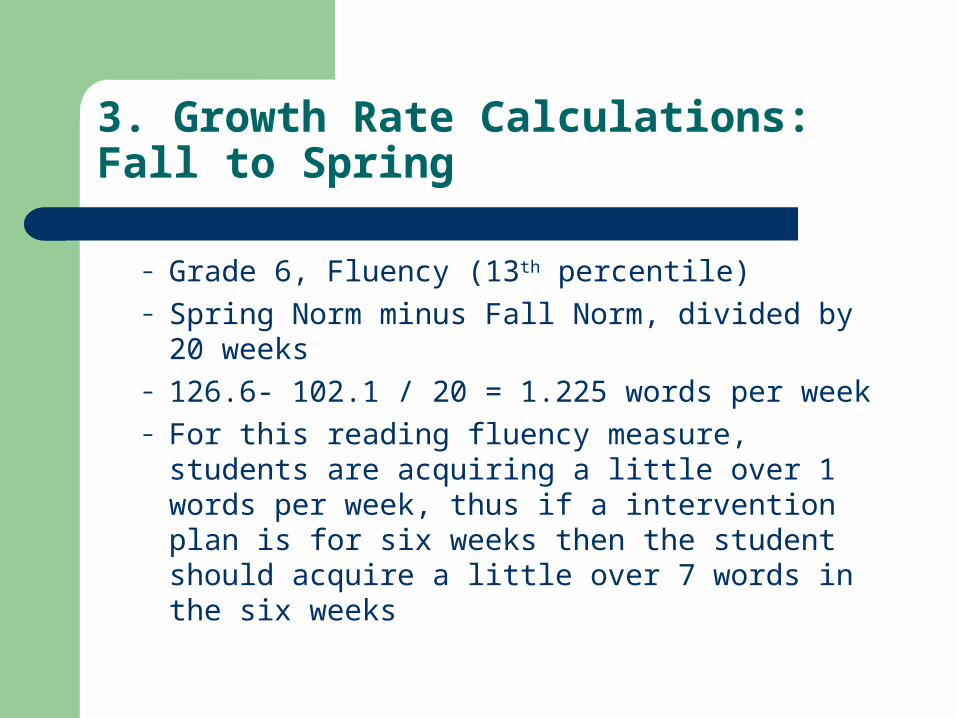
3. Growth Rate Calculations: Fall to Spring
– Grade 6, Fluency (13th percentile)– Spring Norm minus Fall Norm, divided by 20
weeks– 126.6- 102.1 / 20 = 1.225 words per week – For this reading fluency measure, students are
acquiring a little over 1 words per week, thus if a intervention plan is for six weeks then the student should acquire a little over 7 words in the six weeks
4. Classroom Norms: Why?
You may choose to norm a class or grade level on a probe that was not used for state or local norming. Most likely when probes from previous grade levels need to be used to determine entitlement.
To do class or grade level norms, the school must:– Give the probe(s) to the entire group,– Administer each probe 3 times in a week.
You will probably want to do this Fall, Winter and Spring.
4. Classroom Norms: How do you get one?
To do class or grade level norms, the school must:– Give the chosen probe(s) to a sample that is
representative of the school populationIn a school with heterogeneous grouping, the
student’s classroom will doIn a school with homogeneous grouping you
may have to balance out the student’s classroom with another or even norm the entire grade
– Administer each probe 3 times in a week.
4. Classroom Norms: How do you get one?
Once you have the class or grade level data– Add all the students’ scores for all 3 days
together.– Compute the Mean score by dividing by the
total of the students’ scores by the total number of probe administrations. Ex. 3 administrations with 25 students
would equal a divisor of 75. You may want to do a mean for more than one
season: Fall and Winter, Winter and Spring
4. Using Classroom Norms
Setting Goals: – Class or Grade Level Mean– Minimum Celeration Finder
Determining Whether a Student’s Skills are Discrepant After Intervention:– Divide the class or grade level Mean by the
Median of the Student’s last 3 data points.– Class Mean ÷ Student’s Median ≥ 2
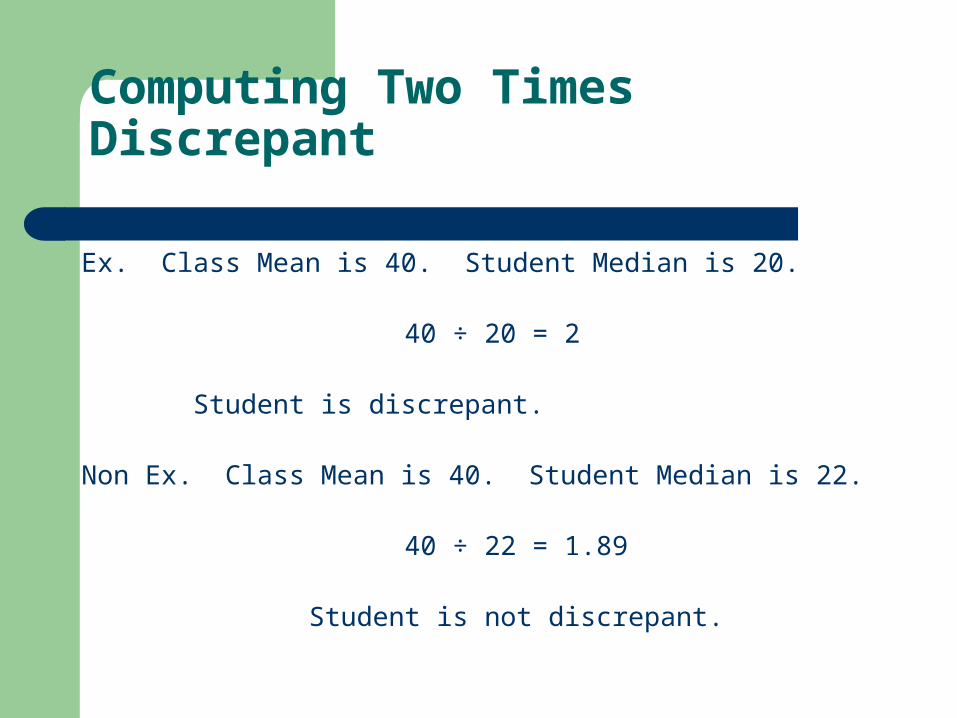
Computing Two Times Discrepant
Ex. Class Mean is 40. Student Median is 20. 40 ÷ 20 = 2
Student is discrepant.
Non Ex. Class Mean is 40. Student Median is 22.
40 ÷ 22 = 1.89
Student is not discrepant.
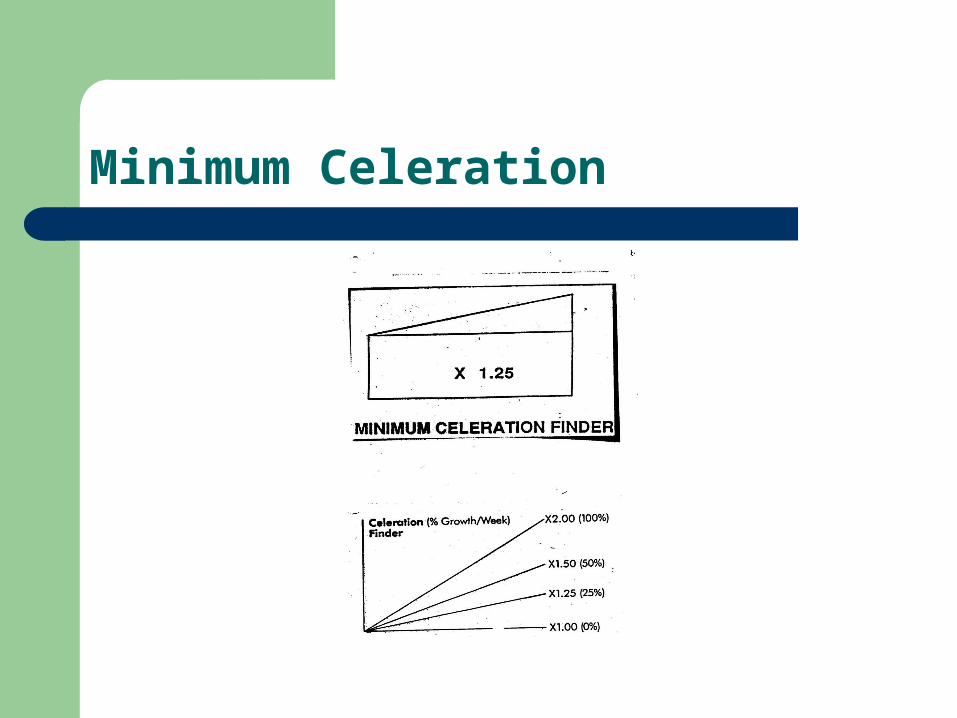
5. Minimum Celeration Finder
Celeration rates from the Precision Teaching program can be used for goal setting consideration
The lines on the overlay indicate different celeration slopes or rates of progress
Depending on how ambitious the team wants the goal to be different rates of progress can be used
Minimum Celeration
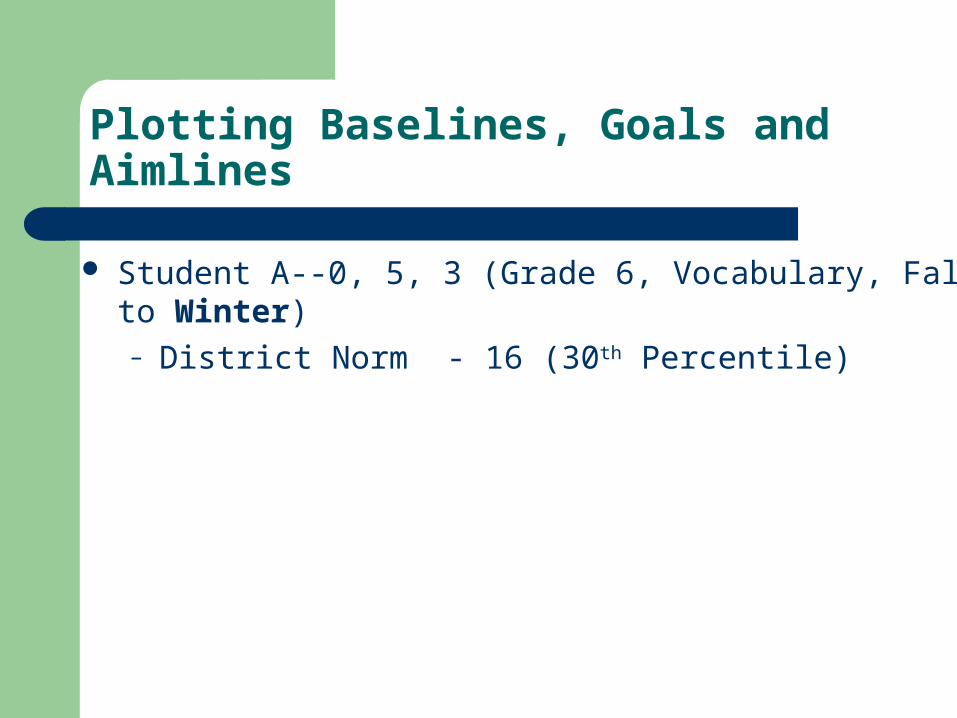
Plotting Baselines, Goals and Aimlines
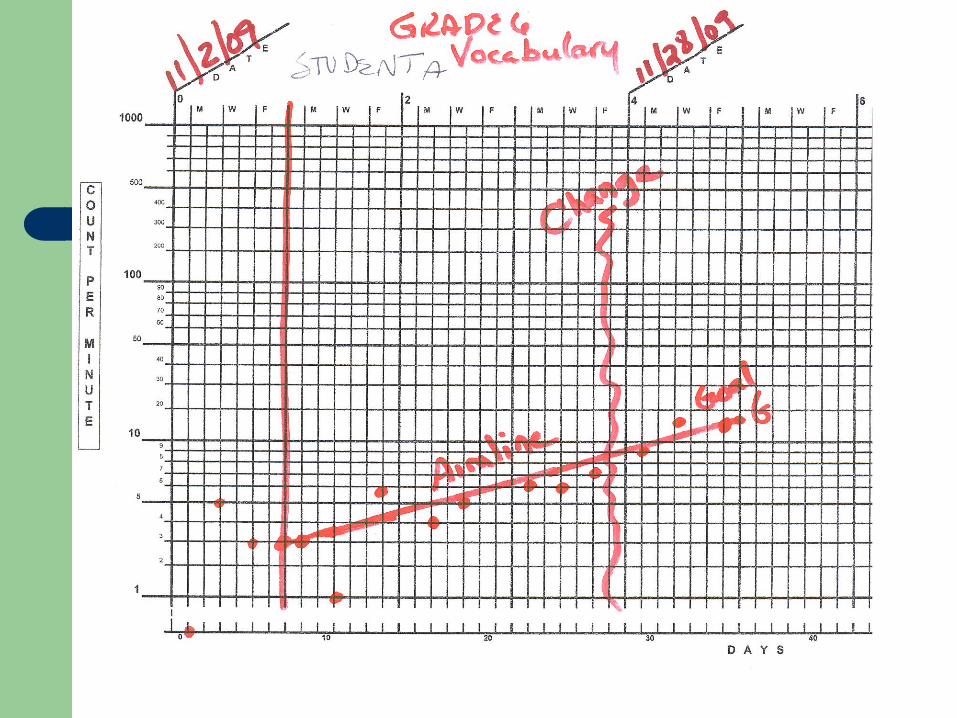
Student A--0, 5, 3 (Grade 6, Vocabulary, Fall to Winter)– District Norm - 16 (30th Percentile)
Plotting Baselines, Goals and Aimlines
Student B— 25, 20, 23 (Grade 6, Reading Mazes, Winter to Spring)– District Norm - 35 (30th Percentile)
Progress Monitoring: Why?
Time and cost efficient Sensitive to changes over short periods of
time Frequent and repeated data collection
(dependent upon student’s level/tier) and analysis of student performance
Use data to inform instruction in specific skills.
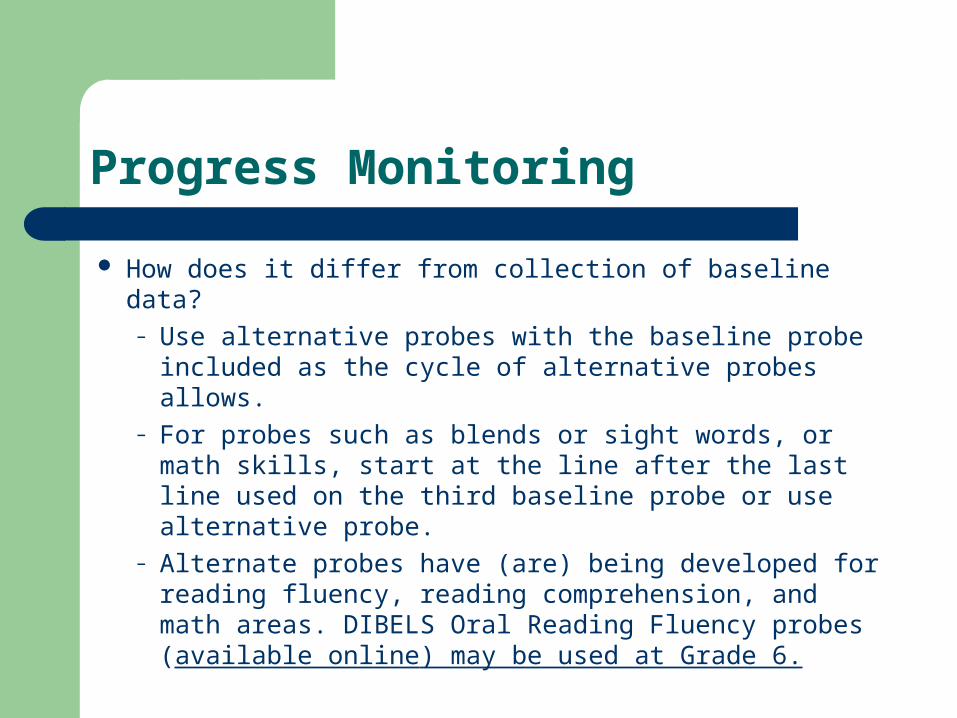
Progress Monitoring
How does it differ from collection of baseline data?– Use alternative probes with the baseline probe
included as the cycle of alternative probes allows.– For probes such as blends or sight words, or math
skills, start at the line after the last line used on the third baseline probe or use alternative probe.
– Alternate probes have (are) being developed for reading fluency, reading comprehension, and math areas. DIBELS Oral Reading Fluency probes (available online) may be used at Grade 6.
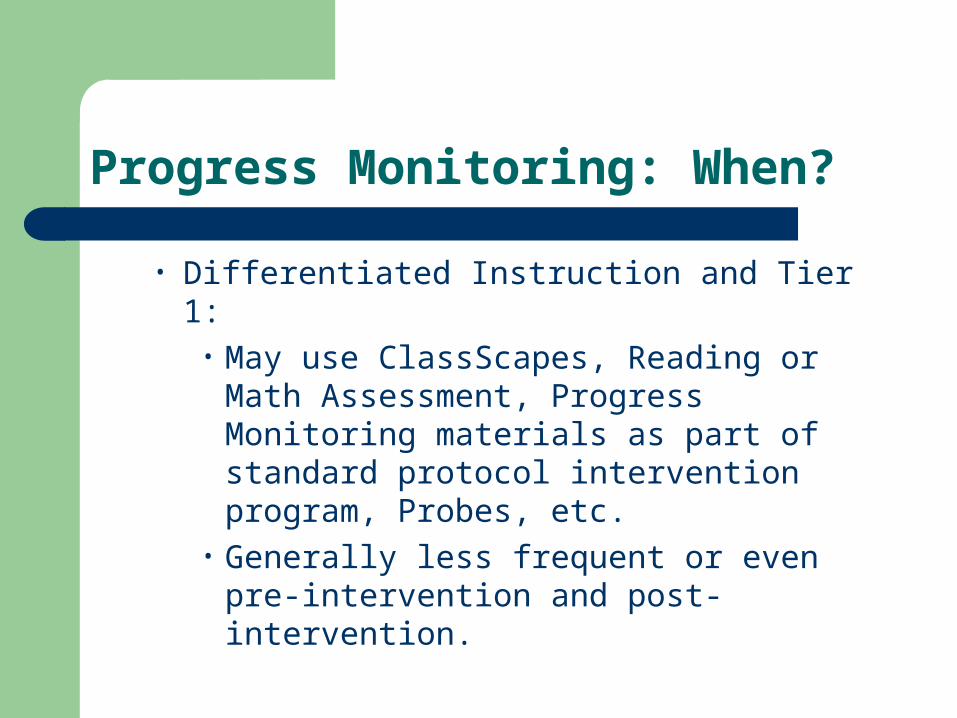
Progress Monitoring: When?
• Differentiated Instruction and Tier 1: • May use ClassScapes, Reading or Math
Assessment, Progress Monitoring materials as part of standard protocol intervention program, Probes, etc.
• Generally less frequent or even pre-intervention and post-intervention.
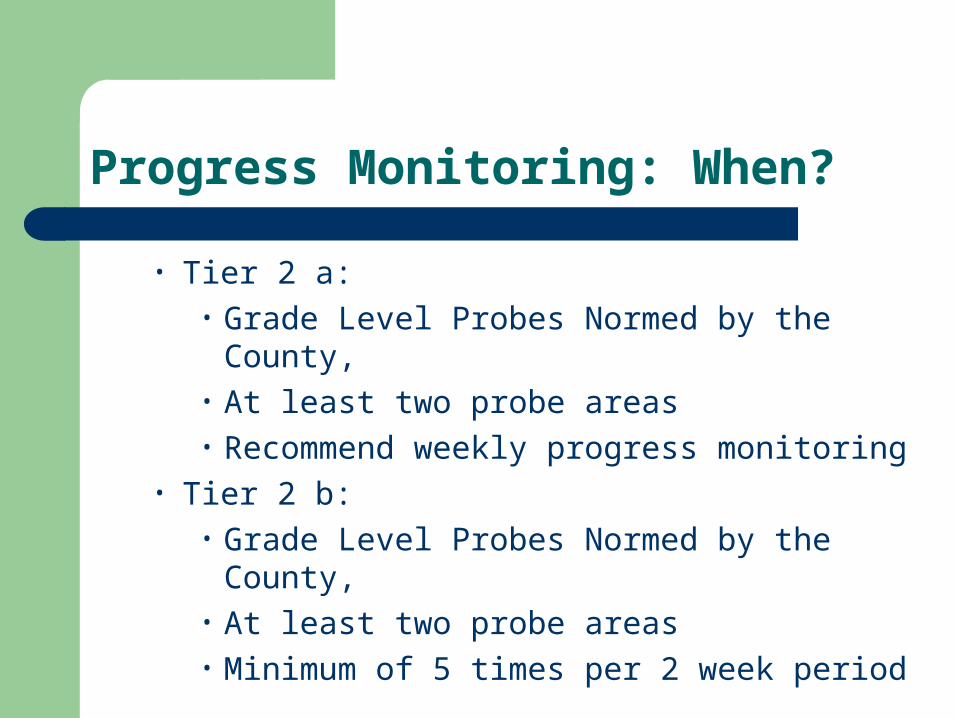
Progress Monitoring: When?
• Tier 2 a: • Grade Level Probes Normed by the County, • At least two probe areas • Recommend weekly progress monitoring
• Tier 2 b:• Grade Level Probes Normed by the County, • At least two probe areas • Minimum of 5 times per 2 week period
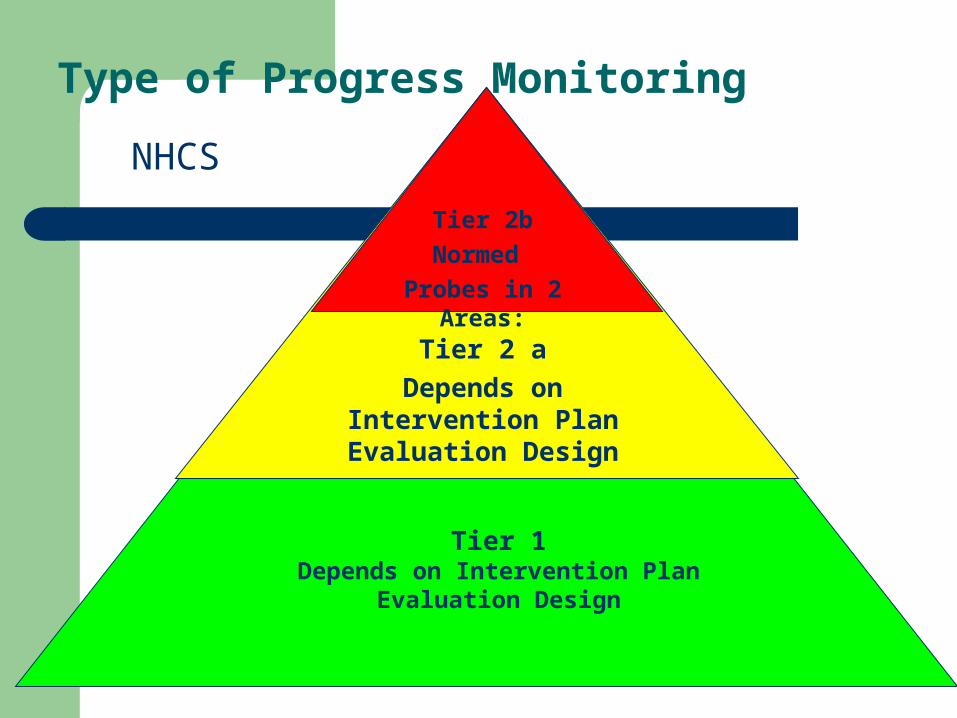
Type of Progress Monitoring
NHCS
Tier 1Depends on Intervention Plan
Evaluation Design
Tier 2 aDepends on
Intervention Plan Evaluation Design
Tier 2bNormed
Probes in 2 Areas:

Frequency of Progress Monitoring
NHCS
Tier 1Depends on Intervention Plan
Evaluation Design
Tier 2 aDepends on
Intervention Plan Evaluation Design
Tier 2bEvery Other Day

REVISIONS OF HYPOTHESES/INTERVENTIONS
How do we know when to change the intervention?
REVISIONS OF HYPOTHESES/INTERVENTIONS
How do we know when to change the intervention?
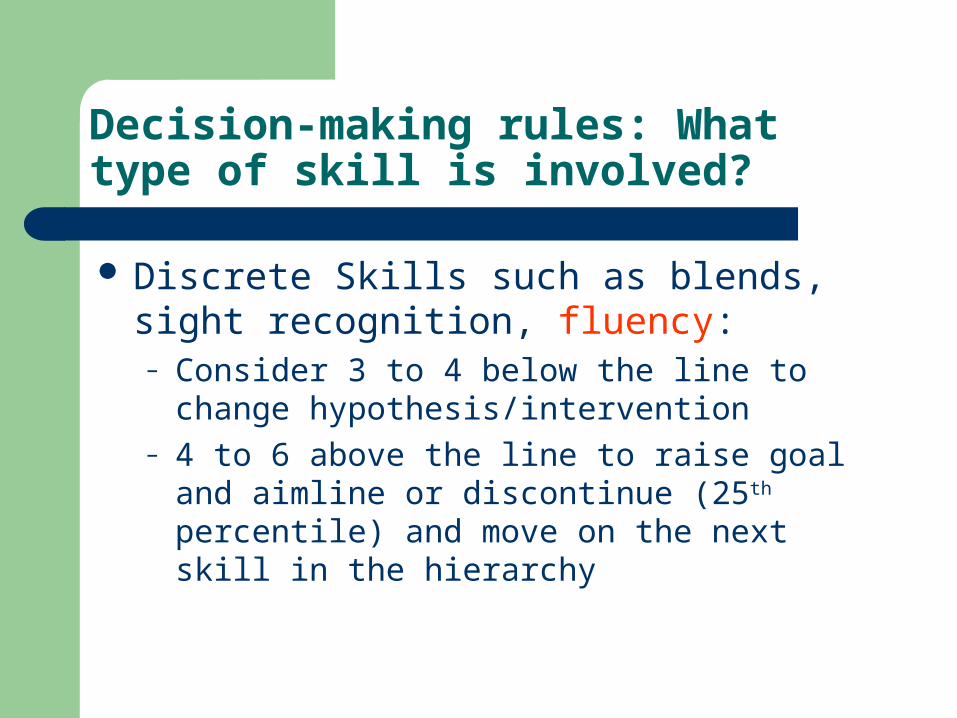
Decision-making rules: What type of skill is involved?
Discrete Skills such as blends, sight recognition, fluency:– Consider 3 to 4 below the line to change
hypothesis/intervention– 4 to 6 above the line to raise goal and aimline or
discontinue (25th percentile) and move on the next skill in the hierarchy
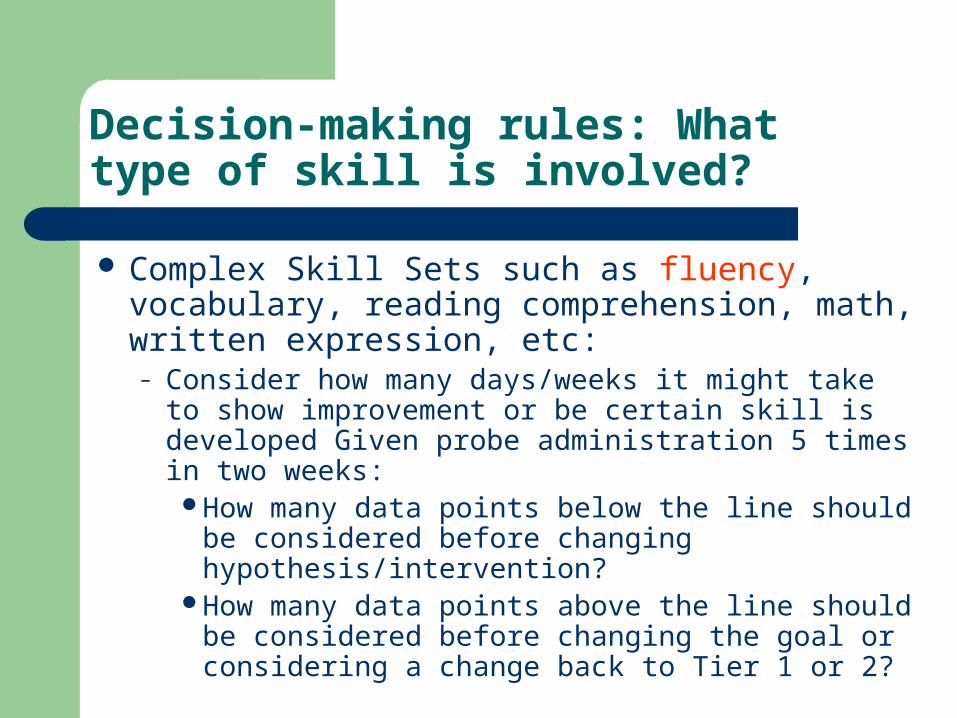
Decision-making rules: What type of skill is involved?
Complex Skill Sets such as fluency, vocabulary, reading comprehension, math, written expression, etc:– Consider how many days/weeks it might take to
show improvement or be certain skill is developed Given probe administration 5 times in two weeks:
How many data points below the line should be considered before changing hypothesis/intervention?
How many data points above the line should be considered before changing the goal or considering a change back to Tier 1 or 2?
REVISIONS OF HYPOTHESES/INTERVENTIONS
How do you know what to change?
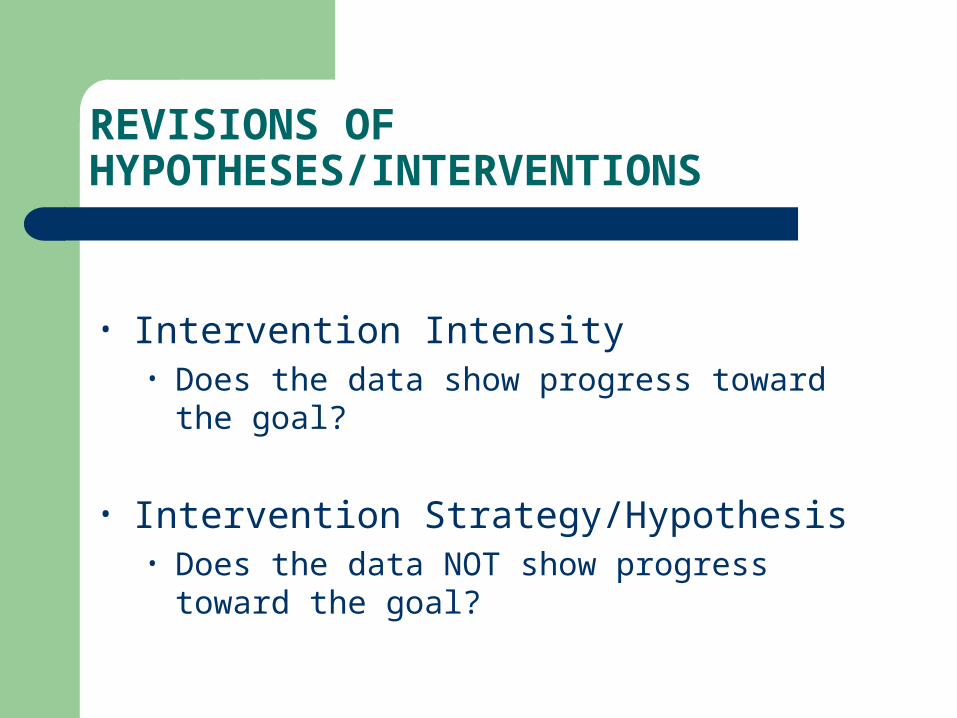
REVISIONS OF HYPOTHESES/INTERVENTIONS
• Intervention Intensity• Does the data show progress toward the goal?
• Intervention Strategy/Hypothesis• Does the data NOT show progress toward the
goal?
Graphing Progress Monitoring and Revisions of Hypotheses/Interventions
Level 2e
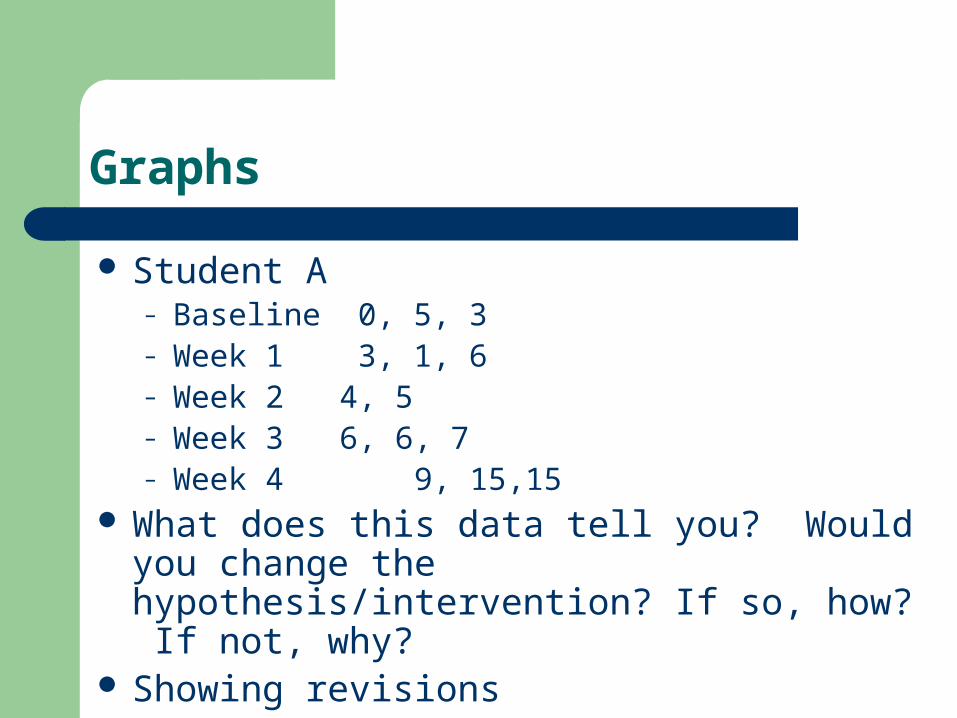
Graphs
Student A– Baseline 0, 5, 3– Week 1 3, 1, 6– Week 2 4, 5– Week 3 6, 6, 7– Week 4 9, 15,15
What does this data tell you? Would you change the hypothesis/intervention? If so, how? If not, why?
Showing revisions
Graphs: Progress Monitoring
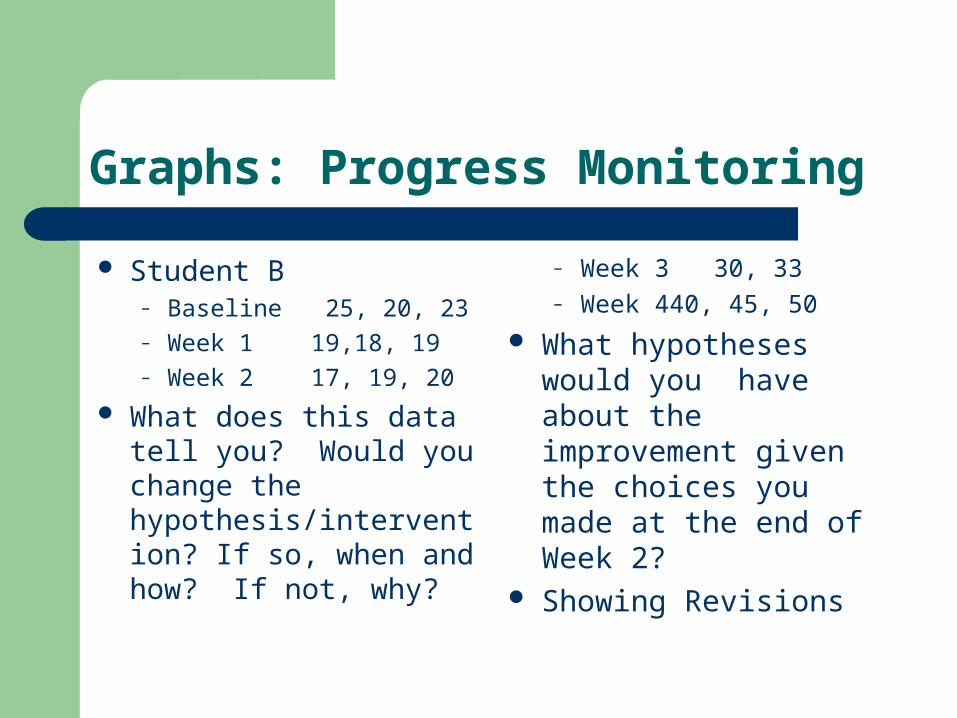
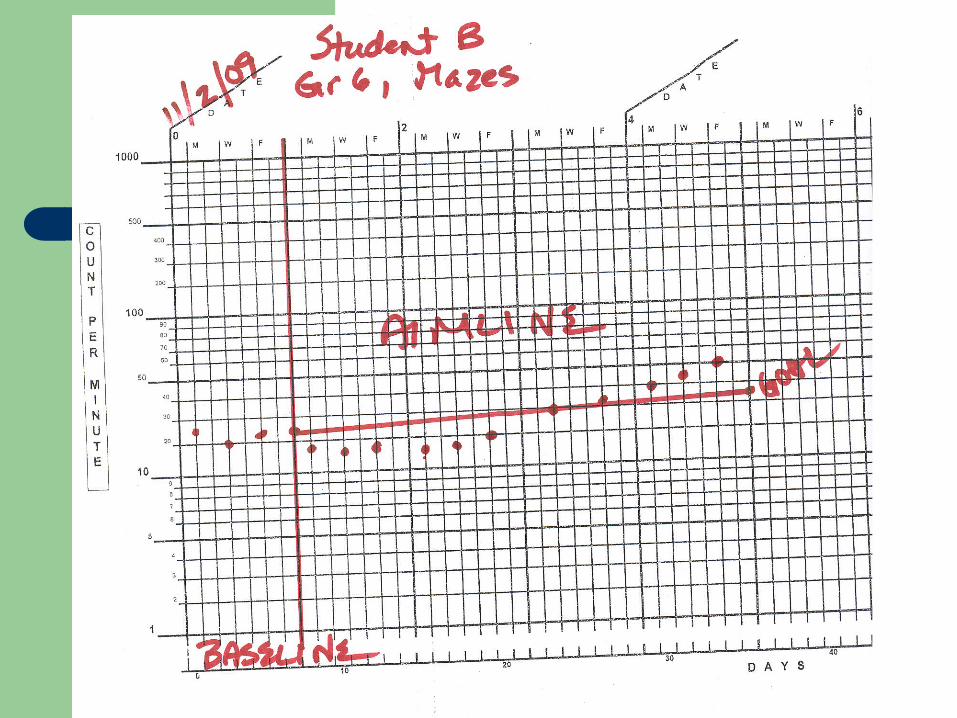
Student B– Baseline 25, 20, 23 – Week 1 19,18, 19– Week 2 17, 19, 20
What does this data tell you? Would you change the hypothesis/intervention? If so, when and how? If not, why?
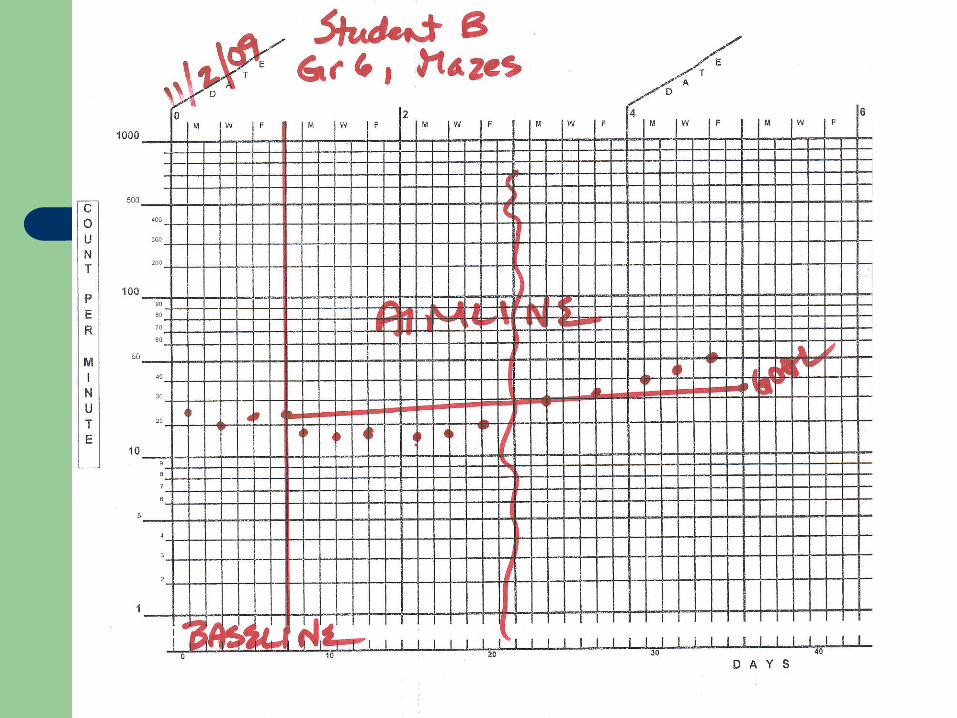
– Week 3 30, 33– Week 4 40, 45, 50
What hypotheses would you have about the improvement given the choices you made at the end of Week 2?
Showing Revisions
Growth Rate: Computing the Growth Rate for an Individual Student
Median of Last 3 Data Points minus Median Score at Baseline
Divide by the number of weeks of intervention. Do not count weeks when intervention was not
delivered or monitored at all: Vacation, Illness or Weather-related
Student A: 15 – 3 divided by 4 = 3 wds/wk Student B: 45 – 23 divided by 4 = 5.5 wds/wk
Trendlines
Another Measure of Growth Rate
Trend lines: How Do They Show Growth?
Line that you draw through a series of data points that represents the student’s actual rate of progress
If the trend line slope is flatter than the aimline, then adjust intervention
If the trend line slope is steeper than the aimline then adjust goal or area of intervention
If the slopes are the same make no change.
Trend Line Procedures: Can be done in Excel
- Draw a horizontal line through median of first half of data – form an intersection with vertical line
– Draw a horizontal line through median of second half of data – form an intersection with vertical line
– Connect the two intersections– Make your decision, is it the same
decision?
Trend Lines and Entitlement Criteria
Used to determine how long it will be before the student’s skills are likely to be proficient– Required for Behavior Entitlement– Can be used for Academics as well
Alternatives
– In academics, can add student’s current growth rate to the median of the last 3 data points to determine how many weeks it will take the student to meet proficiency standards.
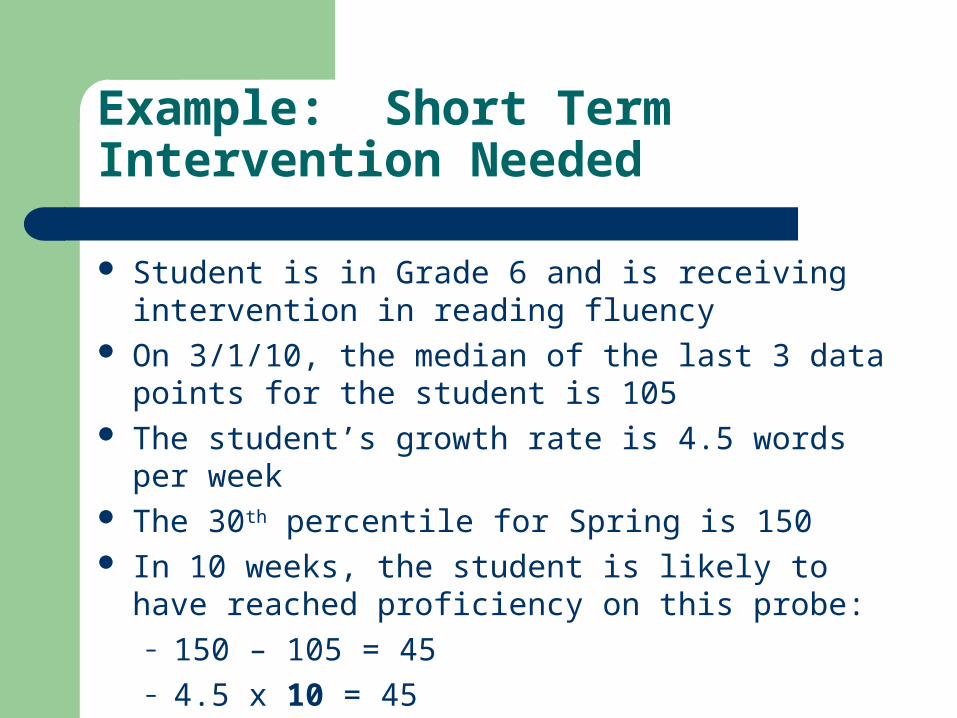
Example: Short Term Intervention Needed
Student is in Grade 6 and is receiving intervention in reading fluency
On 3/1/10, the median of the last 3 data points for the student is 105
The student’s growth rate is 4.5 words per week The 30th percentile for Spring is 150 In 10 weeks, the student is likely to have reached
proficiency on this probe:– 150 – 105 = 45– 4.5 x 10 = 45
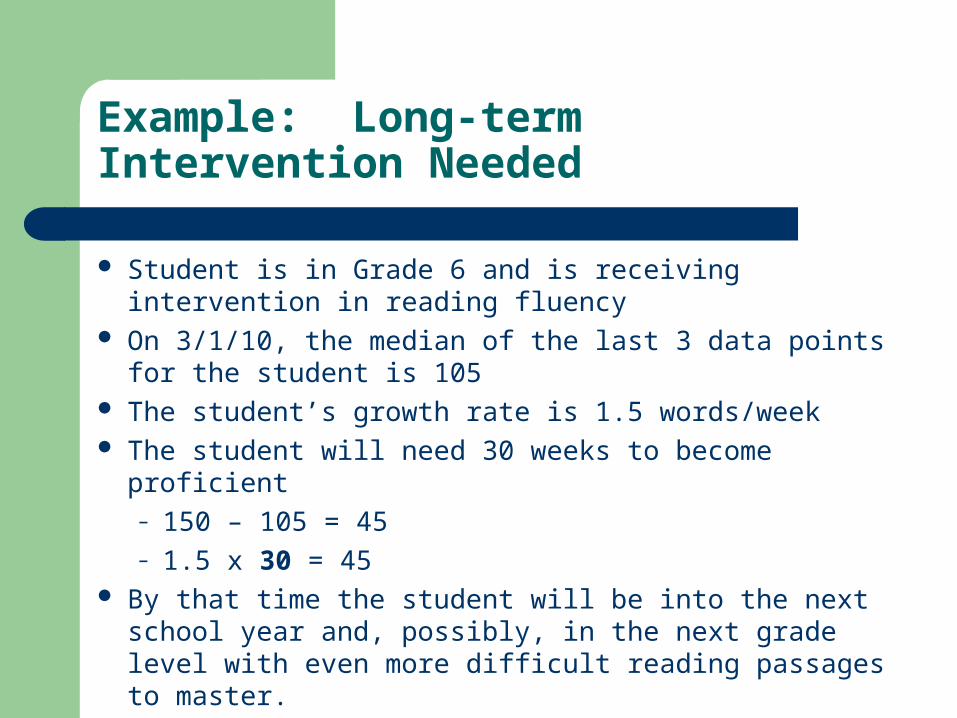
Example: Long-term Intervention Needed
Student is in Grade 6 and is receiving intervention in reading fluency
On 3/1/10, the median of the last 3 data points for the student is 105
The student’s growth rate is 1.5 words/week The student will need 30 weeks to become proficient
– 150 – 105 = 45– 1.5 x 30 = 45
By that time the student will be into the next school year and, possibly, in the next grade level with even more difficult reading passages to master.
WHAT DOES THE DATA SHOW?
Comparison to peers, e.g. normative data– Is the student above or below the 13th,
25th/30th or 50th percentile for academics– Has the student met behavior goals?

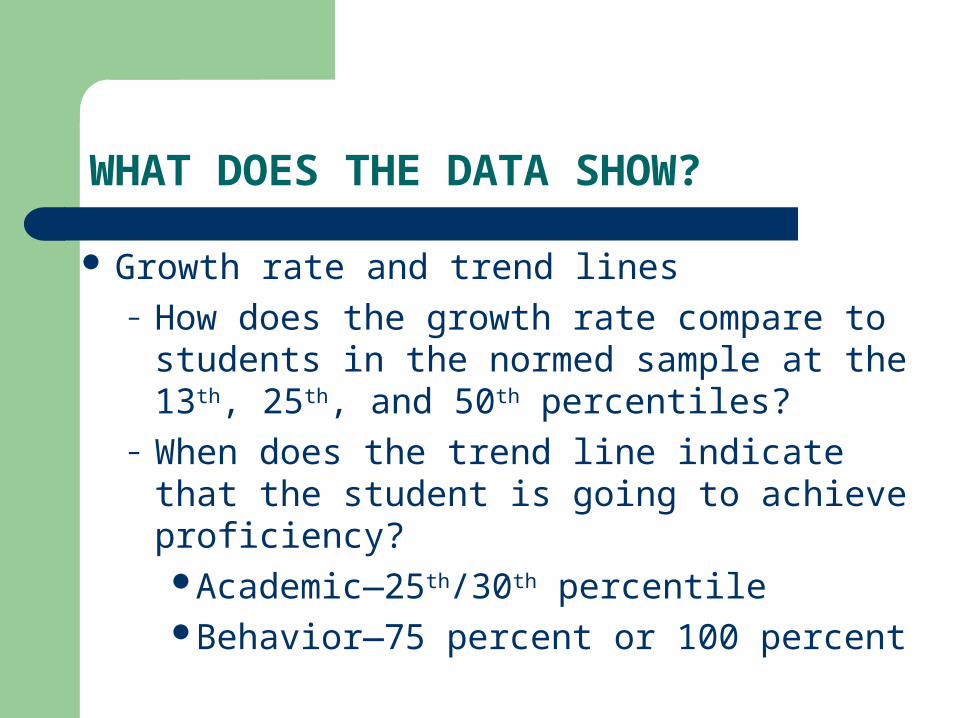
WHAT DOES THE DATA SHOW?
Growth rate and trend lines– How does the growth rate compare to students in the
normed sample at the 13th, 25th, and 50th percentiles?– When does the trend line indicate that the student is
going to achieve proficiency?Academic—25th/30th percentileBehavior—75 percent or 100 percent
WHAT DOES THE DATA SHOW?
Growth rate and trend lines– How does the growth rate compare to
students in the normed sample at the 13th, 25th, and 50th percentiles?
– When does the trend line indicate that the student is going to achieve proficiency?Academic—25th/30th percentileBehavior—75 percent or 100 percent
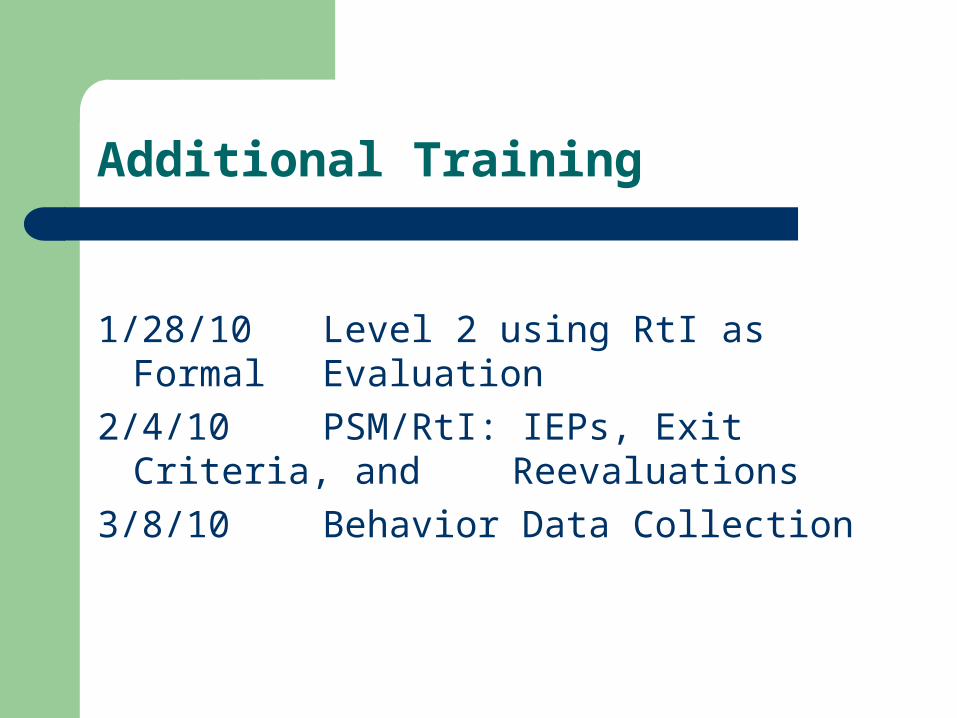
Additional Training
1/28/10 Level 2 using RtI as Formal Evaluation
2/4/10 PSM/RtI: IEPs, Exit Criteria, and Reevaluations
3/8/10 Behavior Data Collection
Nancy Kreykenbohm, Ph.D.
Coordinator, PSM/RtI Program
School Psychologist Level III
Email: [email protected]
Phone: 910-616-3382


![Response to Intervention (RtI) Handbook and RtI Resources · 2016-12-09 · OASD RtI Handbook [2] Response to Intervention (RtI) Overview Core Principles of RtI RtI is grounded in](https://img.pdfslide.net/doc/110x75/5f04175d7e708231d40c46b9/response-to-intervention-rti-handbook-and-rti-resources-2016-12-09-oasd-rti.jpg)