Embed Size (px)
Citation preview
PSY 1950Nonparametric Statistics
November 24, 2008
Skeptics at the Pub:Twins, Telepathy, and Smut
Samuel T. MoultonNovember 24, 2008
“Most of these developments have this feature in common, that the distribution functions of the various stochastic variables which enter into their problems are assumed to be of known functional form, and the theories of estimation and of testing hypotheses are theories of estimation of and of testing hypotheses about, one or more parameters… the knowledge of which would completely determine the various distribution functions involved. We shall refer to this situation… as the parametric case, and denote the opposite case, where the functional forms of the distributions are unknown, as the non-parametric case.”
– Jacob Wolfowitz (1942)
Parametric versus Nonparametric
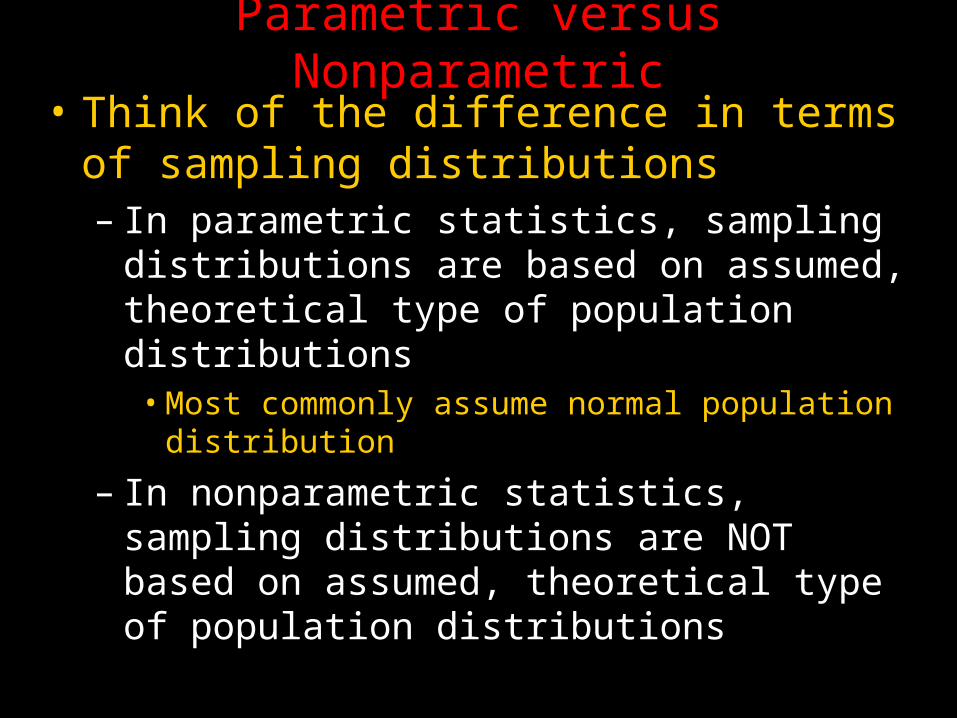
• Think of the difference in terms of sampling distributions– In parametric statistics, sampling distributions are based on assumed, theoretical type of population distributions•Most commonly assume normal population distribution
– In nonparametric statistics, sampling distributions are NOT based on assumed, theoretical type of population distributions
Example: Parametric Approach
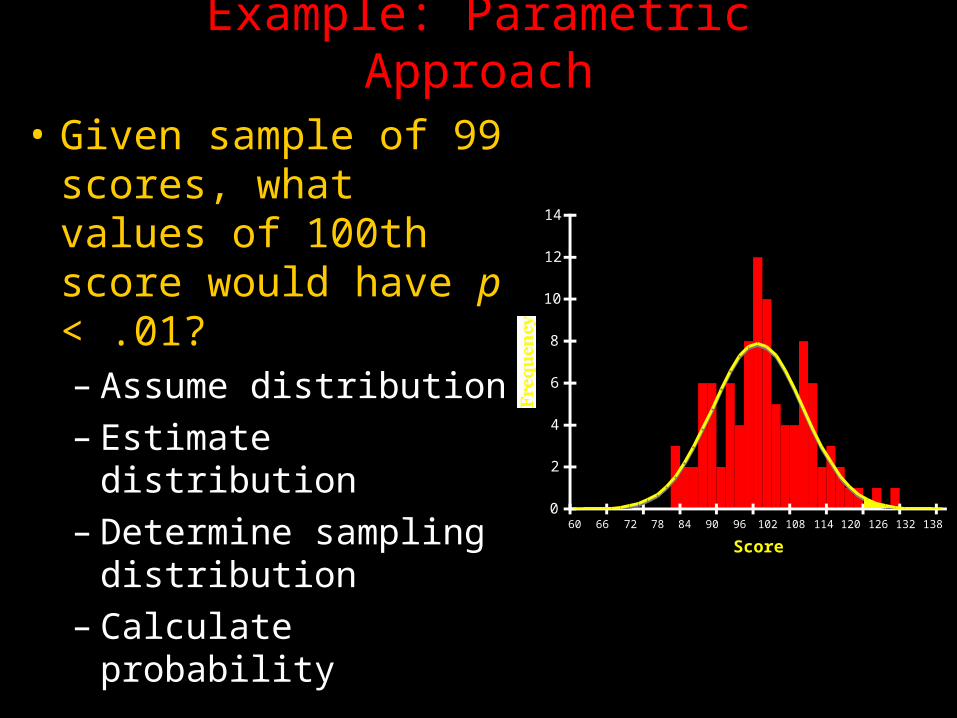
• Given sample of 99 scores, what values of 100th score would have p < .01?– Assume distribution
– Estimate distribution
– Determine sampling distribution
– Calculate probability
0
2
4
6
8
10
12
14
60 66 72 78 84 90 96 102 108 114 120 126 132 138
Score
Frequency
0
2
4
6
8
10
12
14
60 66 72 78 84 90 96 102 108 114 120 126 132 138
Score
Frequency
Example: Nonparametric Approach
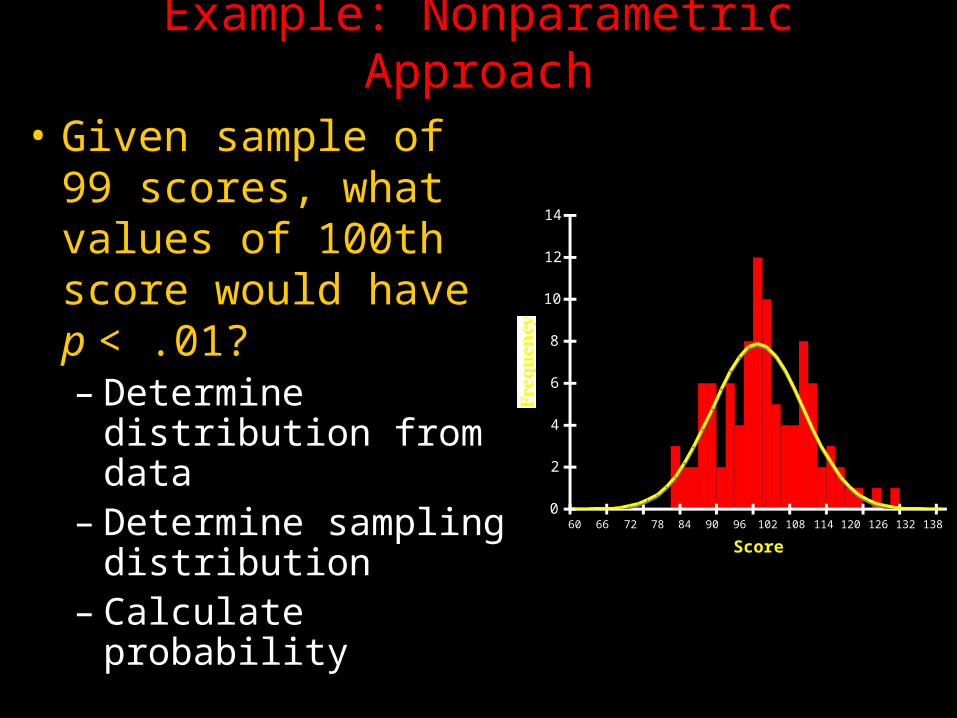
• Given sample of 99 scores, what values of 100th score would have p < .01?– Determine distribution from data
– Determine sampling distribution
– Calculate probability
0
2
4
6
8
10
12
14
60 66 72 78 84 90 96 102 108 114 120 126 132 138
Score
Frequency
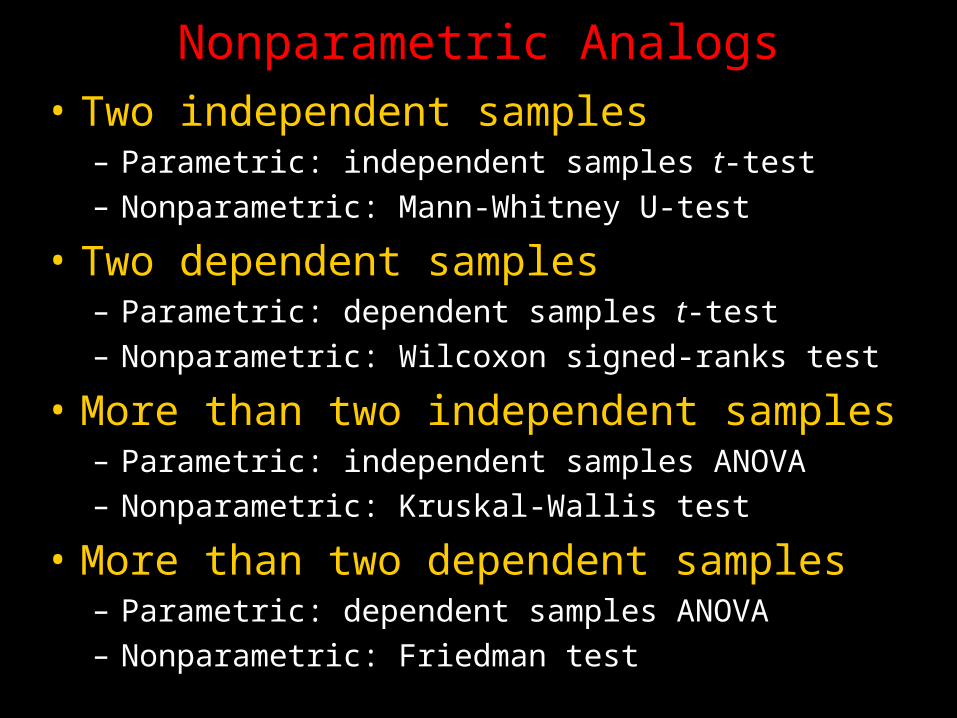
Nonparametric Analogs• Two independent samples
– Parametric: independent samples t-test– Nonparametric: Mann-Whitney U-test
• Two dependent samples– Parametric: dependent samples t-test– Nonparametric: Wilcoxon signed-ranks test
• More than two independent samples– Parametric: independent samples ANOVA– Nonparametric: Kruskal-Wallis test
• More than two dependent samples– Parametric: dependent samples ANOVA– Nonparametric: Friedman test
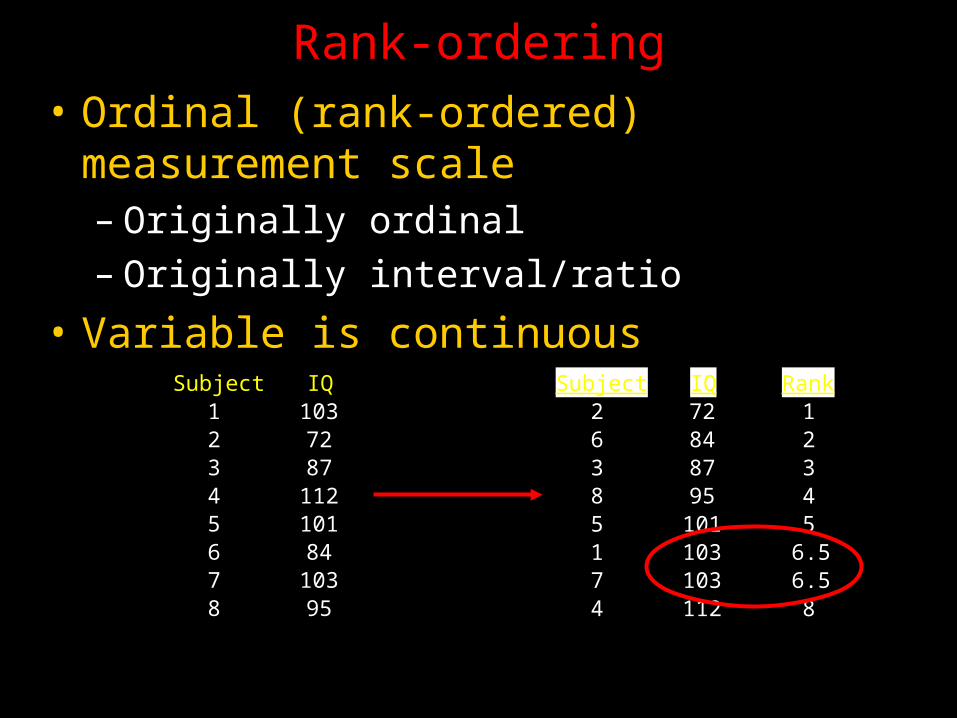
Rank-ordering• Ordinal (rank-ordered) measurement scale– Originally ordinal– Originally interval/ratio
• Variable is continuousSubject IQ
1 1032 723 874 1125 1016 847 1038 95
Subject IQ Rank2 72 16 84 23 87 38 95 45 101 51 103 6.57 103 6.54 112 8
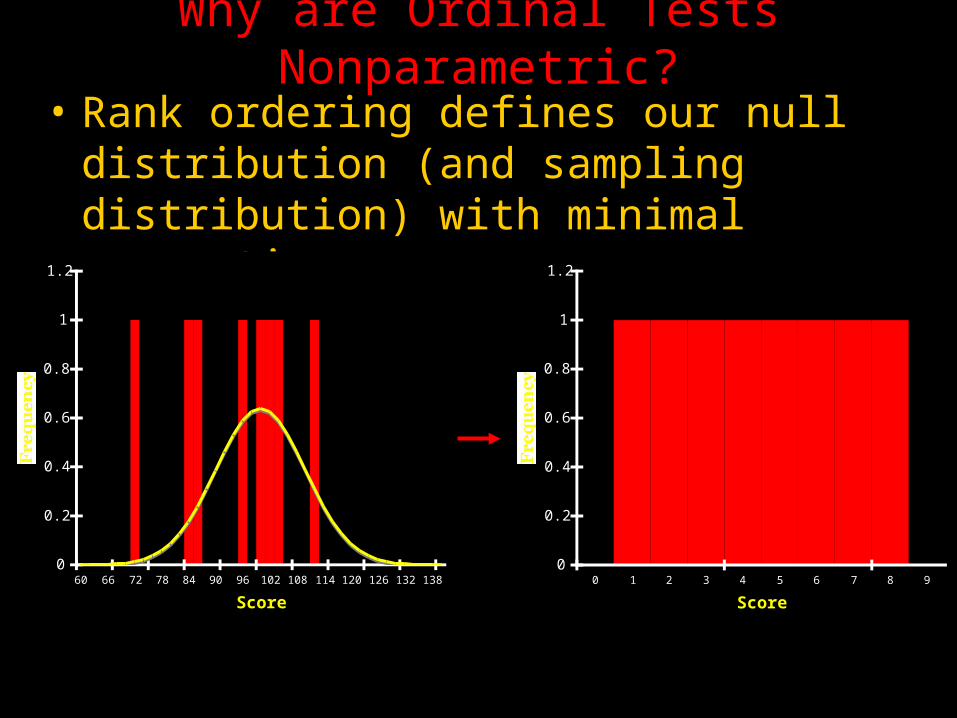
Why are Ordinal Tests Nonparametric?
• Rank ordering defines our null distribution (and sampling distribution) with minimal assumptions
0
0.2
0.4
0.6
0.8
1
1.2
60 66 72 78 84 90 96 102 108 114 120 126 132 138
Score
Frequency
0
0.2
0.4
0.6
0.8
1
1.2
0 1 2 3 4 5 6 7 8 9
Score
Frequency
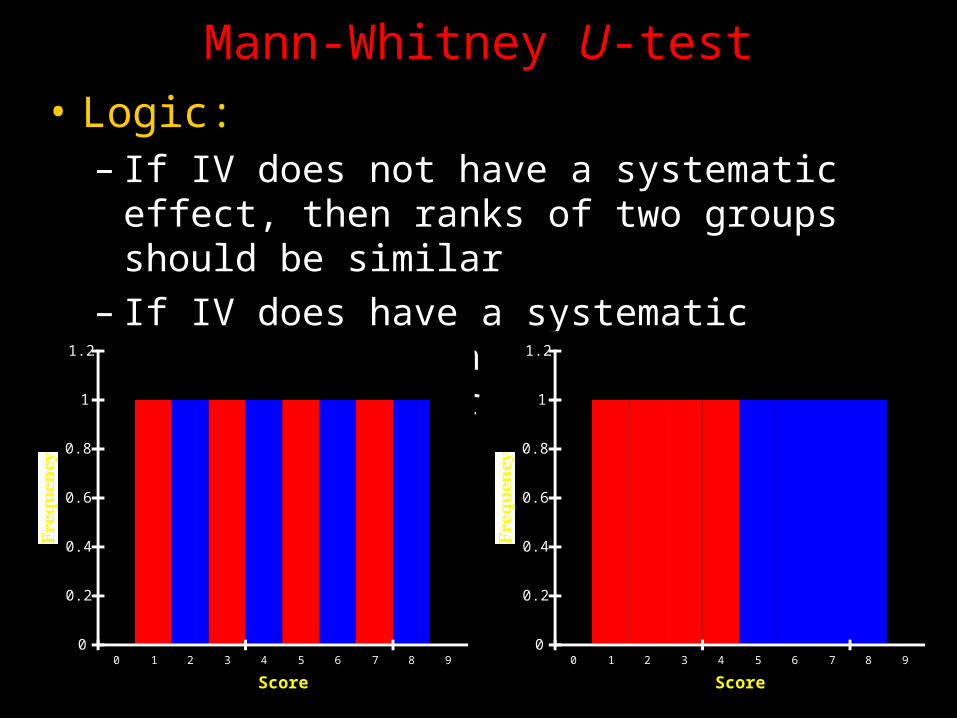
Mann-Whitney U-test• Logic:
– If IV does not have a systematic effect, then ranks of two groups should be similar
– If IV does have a systematic effect, then ranks of two groups should be different
0
0.2
0.4
0.6
0.8
1
1.2
0 1 2 3 4 5 6 7 8 9
Score
Frequency
0
0.2
0.4
0.6
0.8
1
1.2
0 1 2 3 4 5 6 7 8 9
Score
Frequency
• To quantify similarity/difference:– Collapse across group and rank-order
– Give each subject a “point” for outranking a subject from the other group
– For each group*, add up the points– Test statistic is the lowest group score
• To calculate significance, compare obtained test statistic to distribution of all possible test statistics– Use U table or SPSS– When n > 20, distribution is approximately normal
Mann-Whitney U-test
QuickTime™ and aTIFF (Uncompressed) decompressor
are needed to see this picture.
QuickTime™ and aTIFF (Uncompressed) decompressor
are needed to see this picture.
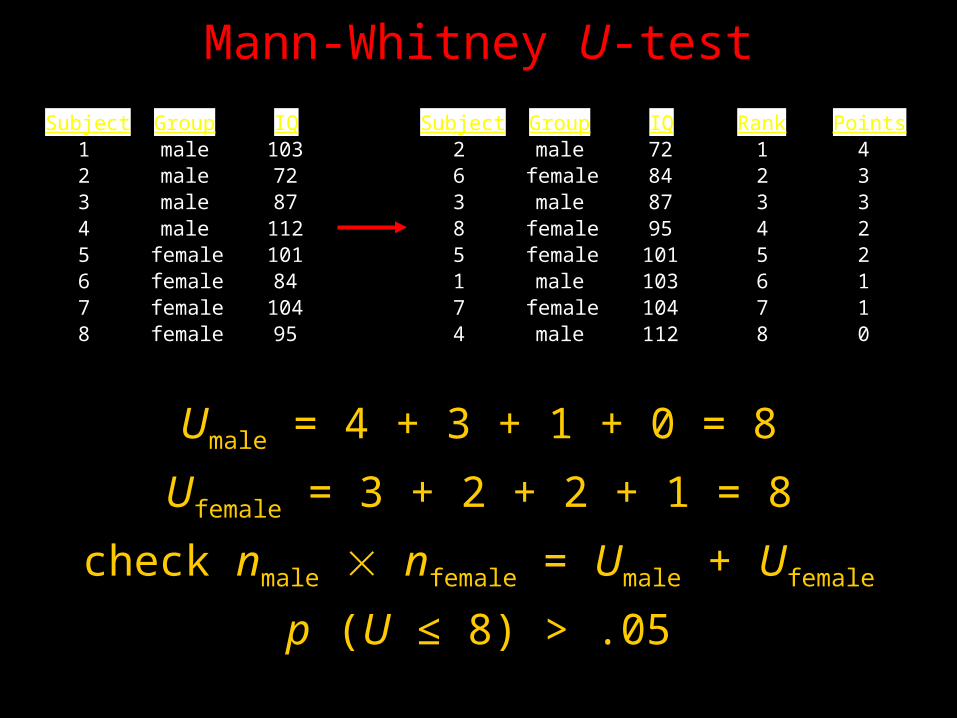
Mann-Whitney U-test
Subject Group IQ1 male 1032 male 723 male 874 male 1125 female 1016 female 847 female 1048 female 95
Subject Group IQ Rank Points2 male 72 1 46 female 84 2 33 male 87 3 38 female 95 4 25 female 101 5 21 male 103 6 17 female 104 7 14 male 112 8 0
Umale = 4 + 3 + 1 + 0 = 8
Ufemale = 3 + 2 + 2 + 1 = 8
check nmale nfemale = Umale + Ufemale
p (U ≤ 8) > .05
Wilcoxon Signed-Ranks Test• Analogous to dependent-measures t-test
• Rank-order difference scores, group by positive/negative
• Logic:– If IV does not have a systematic effect, the positive/negative rankings should be similar
– If IV does have a systematic effect, the positive/negative rankings should be different
QuickTime™ and aTIFF (Uncompressed) decompressor
are needed to see this picture.
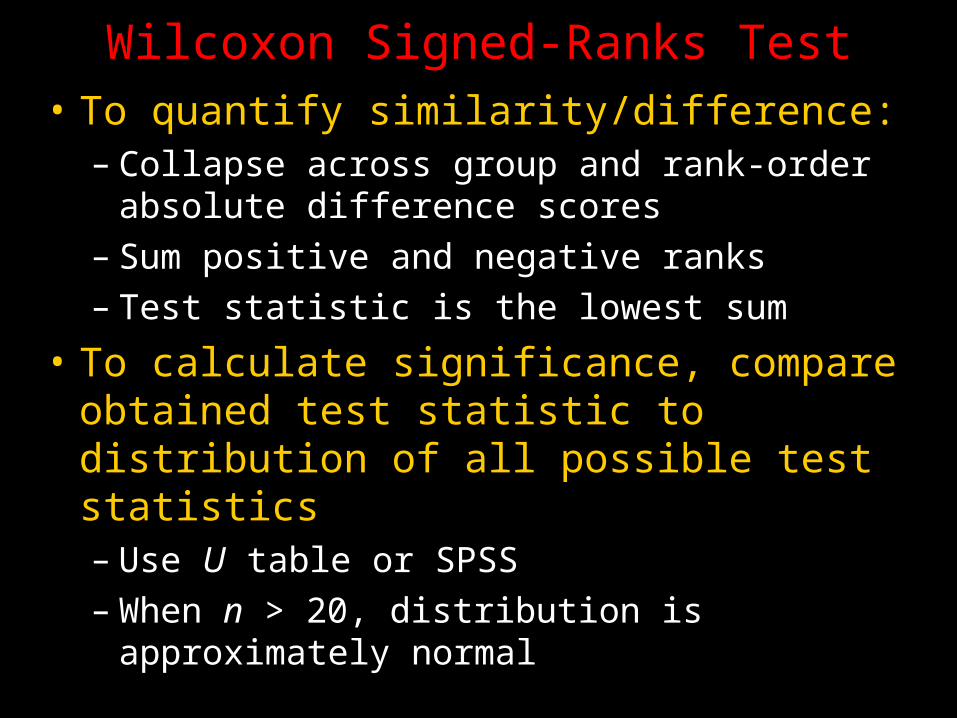
• To quantify similarity/difference:– Collapse across group and rank-order absolute difference scores
– Sum positive and negative ranks– Test statistic is the lowest sum
• To calculate significance, compare obtained test statistic to distribution of all possible test statistics– Use U table or SPSS– When n > 20, distribution is approximately normal
Wilcoxon Signed-Ranks Test
Wilcoxon Signed-Ranks Test
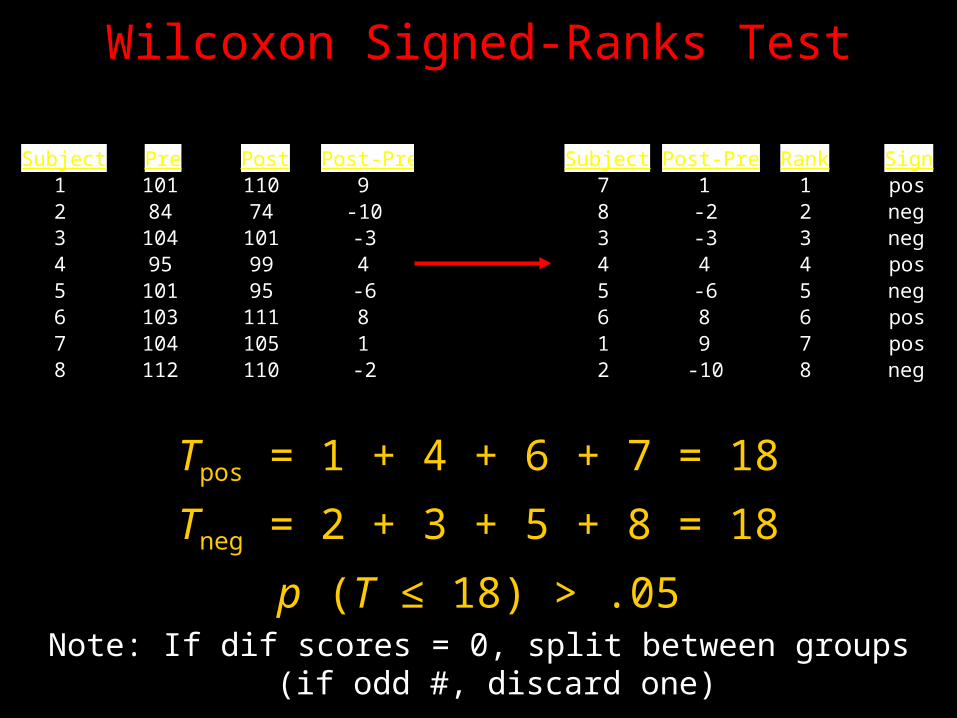
Tpos = 1 + 4 + 6 + 7 = 18
Tneg = 2 + 3 + 5 + 8 = 18
p (T ≤ 18) > .05Note: If dif scores = 0, split between groups
(if odd #, discard one)
Subject Pre Post Post-Pre1 101 110 92 84 74 -103 104 101 -34 95 99 45 101 95 -66 103 111 87 104 105 18 112 110 -2
Subject Post-Pre Rank Sign7 1 1 pos8 -2 2 neg3 -3 3 neg4 4 4 pos5 -6 5 neg6 8 6 pos1 9 7 pos2 -10 8 neg
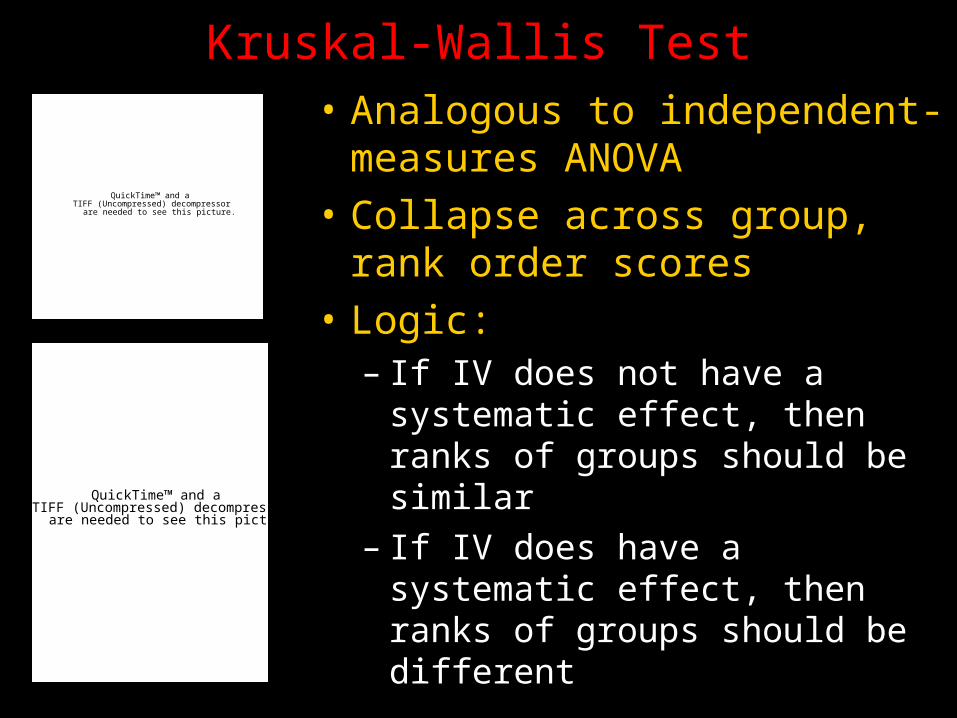
Kruskal-Wallis Test• Analogous to independent-measures ANOVA
• Collapse across group, rank order scores
• Logic:– If IV does not have a systematic effect, then ranks of groups should be similar
– If IV does have a systematic effect, then ranks of groups should be different
QuickTime™ and aTIFF (Uncompressed) decompressor
are needed to see this picture.
QuickTime™ and aTIFF (Uncompressed) decompressor
are needed to see this picture.
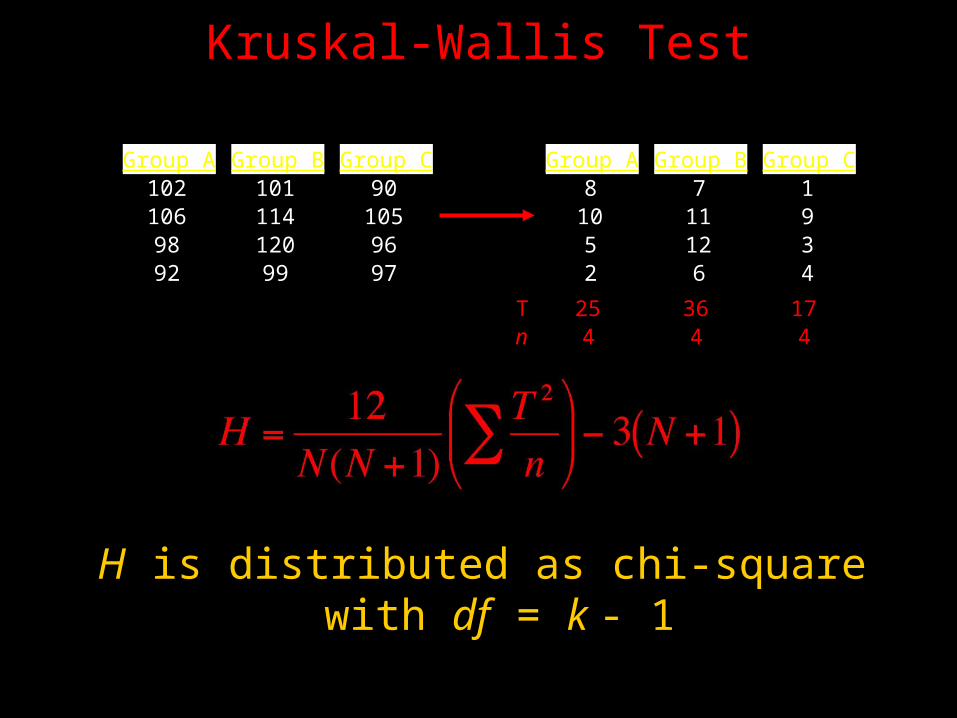
Kruskal-Wallis Test
H is distributed as chi-square with df = k - 1
Group A Group B Group C102 101 90106 114 10598 120 9692 99 97
Group A Group B Group C8 7 1
10 11 95 12 32 6 4
T 25 36 17n 4 4 4
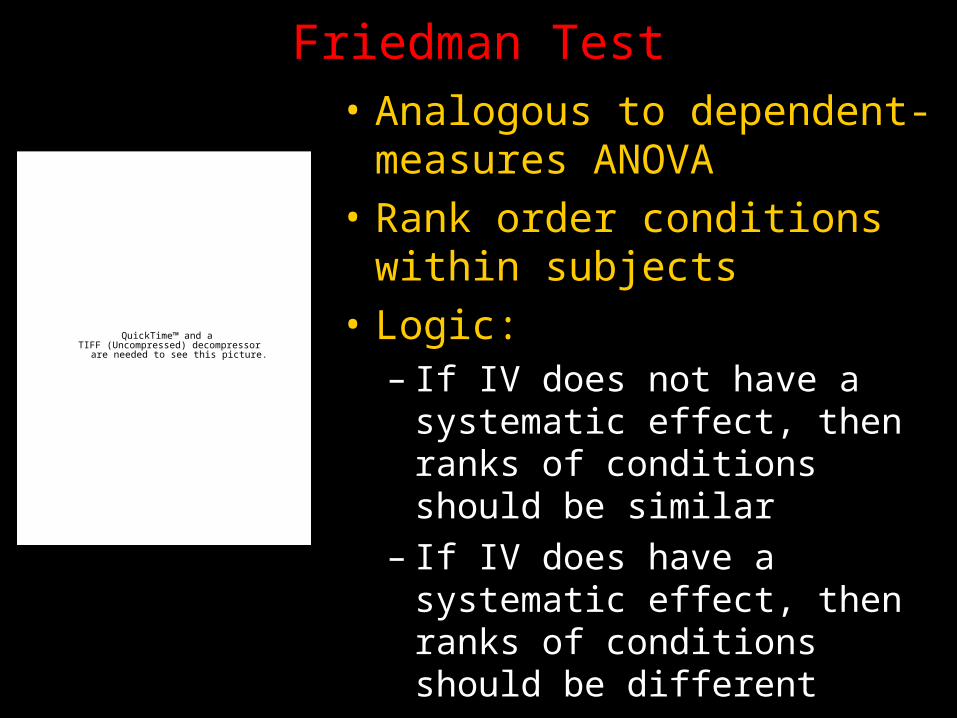
Friedman Test• Analogous to dependent-measures ANOVA
• Rank order conditions within subjects
• Logic:– If IV does not have a systematic effect, then ranks of conditions should be similar
– If IV does have a systematic effect, then ranks of conditions should be different
QuickTime™ and aTIFF (Uncompressed) decompressor
are needed to see this picture.
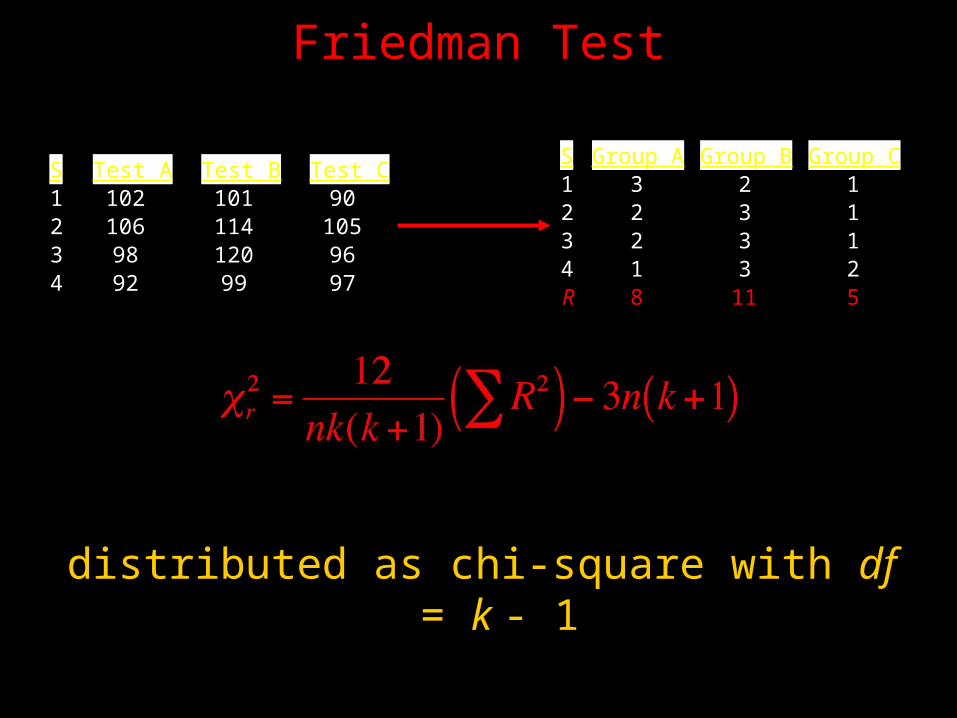
Friedman Test
distributed as chi-square with df = k - 1
S Test A Test B Test C1 102 101 902 106 114 1053 98 120 964 92 99 97
S Group A Group B Group C1 3 2 12 2 3 13 2 3 14 1 3 2R 8 11 5
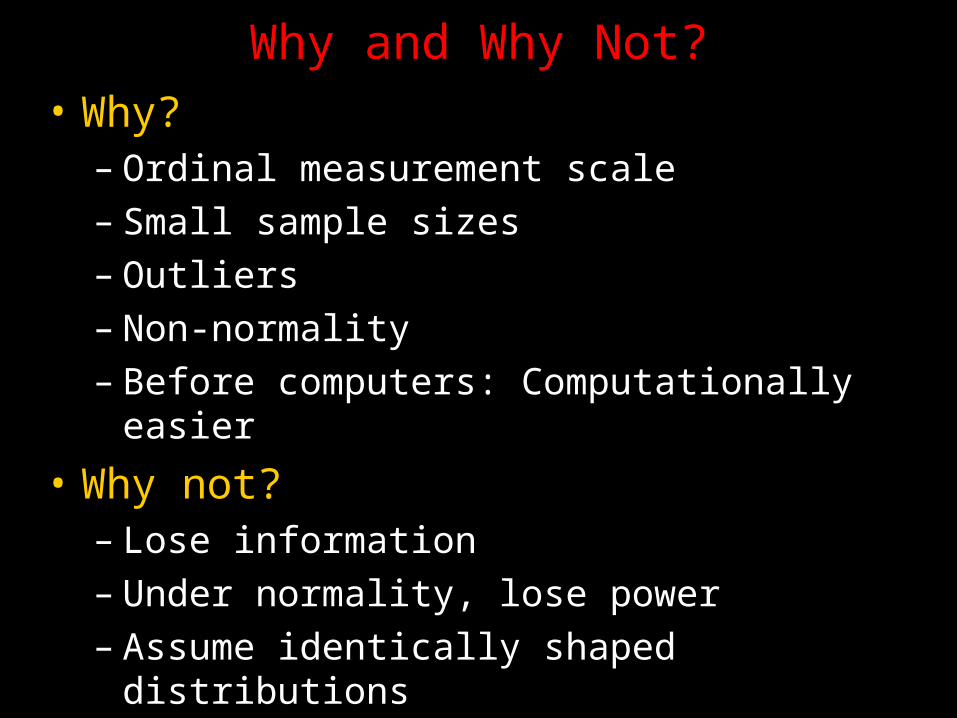
Why and Why Not?• Why?
– Ordinal measurement scale– Small sample sizes– Outliers– Non-normality– Before computers: Computationally easier
• Why not?– Lose information– Under normality, lose power – Assume identically shaped distributions
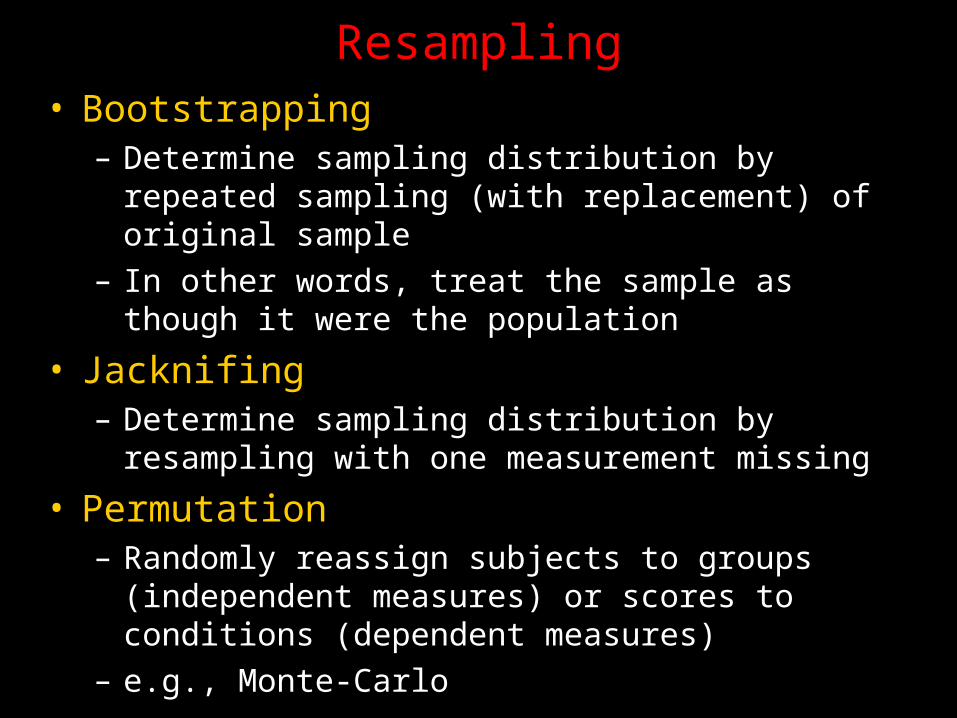
Resampling• Bootstrapping
– Determine sampling distribution by repeated sampling (with replacement) of original sample
– In other words, treat the sample as though it were the population
• Jacknifing– Determine sampling distribution by resampling with one measurement missing
• Permutation– Randomly reassign subjects to groups (independent measures) or scores to conditions (dependent measures)
– e.g., Monte-Carlo
![CSCU Psychology Transfer Pathway - ct Pathway Documents.2017.… · 41 PSY 205, 206, 207 (Adolesc Dev) PSY 363 (Adol Psy) [PSY Elective #2] 42 PSY 208 (Adult Dev) PSY 364 (Adult Dev)](https://img.pdfslide.net/doc/110x75/5fd698b16564d4287628efd2/cscu-psychology-transfer-pathway-ct-pathway-documents2017-41-psy-205-206.jpg)