Embed Size (px)
Citation preview

XXXX
Psychoacoustic Characterization of Propagation Effectsin Virtual EnvironmentsATUL RUNGTA, SARAH RUST, NICOLAS MORALES, University of North Carolina at Chapel HillROBERTA KLATZKY, Carnegie Mellon UniversityMING LIN and DINESH MANOCHA, University of North Carolina at Chapel Hill
As sound propagation algorithms become faster and more accurate, the question arises as to whether the additional effortsto improve fidelity actually offer perceptual benefits over existing techniques. Could environmental sound effects go the way ofmusic, where lower-fidelity compressed versions are actually favored by listeners? Here we address this issue with two acousticphenomena that are known to have perceptual effects on humans and that, accordingly, might be expected to heighten theirexperience with simulated environments. We present two studies comparing listeners’ perceptual response to both accurate andapproximate algorithms simulating two key acoustic effects: diffraction and reverberation. For each effect, we evaluate whetherincreased numerical accuracy of a propagation algorithm translates into increased perceptual differentiation in interactivevirtual environments. Our results suggest that auditory perception does benefit from the increased accuracy, with subjectsshowing better perceptual differentiation when experiencing the more accurate rendering method: The diffraction experimentshows a more linearly decaying sound field (with respect to the diffraction angle) for the accurate diffraction method, while thereverberation experiment shows that more accurate reverberation, after modest user experience, results in near-logarithmicresponse to increasing room volume.
CCS Concepts: •Computing methodologies→ Simulation evaluation;
Additional Key Words and Phrases: Auditory Perception, Virtual Environments/Reality
1. INTRODUCTION
Sound plays a vital role in increasing the degree of realism in virtual environment (VE) systems [Be-gault et al. 1994; Larsson et al. 2002] and other interactive applications such as video games. Thisobservation has motivated the development of different sound propagation methods that are used tosimulate how sound waves, emitted from a source, travel through an environment and interact withthe objects before reaching a listener. These methods are used to model well-known acoustic phe-nomena such as diffraction, reverberation (comprising early reflections and late reverberation), andscattering. At a broad level, sound propagation methods are categorized into geometric [Krokstadet al. 1968; Borish 1984; Allen and Berkley 1979] and wave-based [Zienkiewicz 2005; Yee et al. 1966;Cheng and Cheng 2005] algorithms. While these computational techniques have been studied for manydecades in different fields, only recent advancements in terms of new algorithms and fast hardwarehave enabled the development of interactive propagation systems that are useful for VE. These includeinteractive geometric methods based on ray tracing and beam tracing [Schissler et al. 2014; Tsingoset al. 2001; Taylor et al. 2009; Funkhouser et al. 2004] that can simulate approximate diffraction, earlyreflections, and high-order late reverberation. Furthermore, advancements in computational acousticssolvers [Mehra et al. 2013; Raghuvanshi et al. 2009; Webb and Gray 2013; Mehra et al. 2015] havemade it possible to compute highly accurate solutions to the wave equation for large domains, andthereby perform interactive sound propagation.
Given the recent developments in interactive sound propagation algorithms, it is imperative to eval-uate their perceptual effectiveness. Psychoacoustics researchers have focused on evaluating the per-ceptual effects of many of these acoustic phenomena and many important results have been published
ACM Transactions on Applied Perception, Vol. V, No. N, Article XXXX, Publication date: XXXX 2016.

XXXX:2 •
on how different propagation phenomena affect our perception of the environment [Fastl and Zwicker2007]. Most of these studies were conducted in either real-world environments or in very simple vir-tual environments that could only simulate only limited acoustic effects. The advent of interactive andaccurate sound propagation techniques makes the task of perceptually evaluating these phenomenasimpler and less expensive.
In this paper, we mainly focus on two of the aforementioned phenomena: diffraction and late re-verberation (hereafter referred to as reverberation). Early reflections were not considered here, asthey are easy to simulate and have been widely studied in the literature [Haas 1951; Djelani andBlauert 2001]. Reverberation is also a well-studied phenomenon in psychoacoustics and enhances im-mersion [Kuttruff 2007]. Despite this, one of its fundamental effects, namely, to convey the size of theenvironment, remains relatively unexamined. Reverberation is typically approximated using artificialfilters, and such filters are widely used in computer games and VE [Jot and Chaigne 1991]. There-fore, we evaluate the reverberation computed in a physically accurate manner using an interactive,state-of-the-art geometric propagation system to a pre-computed (Schroeder-type) filter and evaluatetheir relative effectiveness in telling us the size of an environment. Perceptual effects of diffraction, al-though important [Torres et al. 2001a], are seldom evaluated in virtual environments primarily due tothe complexity of modeling diffraction. Most interactive geometric sound propagation systems approx-imate edge diffraction based on Uniform Theory of Diffraction (UTD) [Tsingos et al. 2001]. Therefore,we evaluate the perceptual performance of diffraction effects computed using UTD with a numericallyaccurate solver that directly solves the wave equation. We report two separate comparative studies toevaluate whether increased numerical accuracy of sound propagation translates to perceptual differen-tiation.
In our diffraction study, we construct a virtual test scene similar to [Kawai 1981] and perform apsychoacoustical evaluation. We evaluate the diffracted sound field around an obstacle by placing sub-jects along a semi-circle for the two methods: UTD and wave-based. The subjects are asked to ratethe perceived loudness for different positions along the semi-circle. Our results show that wave-baseddiffraction results in a diffracted field that decays nearly linearly with an increasing diffraction angle,as compared to the UTD-based diffraction, which shows erratic behavior.
Prior psychoacoustics studies in reverberation normally focus on evaluating how the human re-sponse to the environment varies with the changing reverberation parameters (e.g., RT60). Our studybuilds upon these evaluations and seeks to compare the effectiveness of two competing methods tomodel reverberation: Schroeder parametric filter and physically-accurate path tracing. We use free-magnitude estimation to compute the magnitude of the internal responsiveness of the subjects to thechange in the physical dimensions of the environment and thereby, its reverberation characteristics.Our results show poor size discrimination for both the methods but show increasing discriminationability for the physically accurate one as the subjects become more familiar with the task.
The rest of the paper is organized as follows. In Section 2, we give a brief overview of the two acousticeffects and the corresponding techniques and algorithms used in the study to model them and theirevaluation. Sections 3 and 4 describe the two studies, including their designs and procedures. Section5 offers a discussion on our observed results for the two studies. In Section 6 we discuss our conclusion,limitations, and the future work.
2. BACKGROUND
In this section, we give a brief overview of the two sound phenomena, the methods used to model them,and the related work in psychoacoustic evaluation of these phenomena.ACM Transactions on Applied Perception, Vol. V, No. N, Article XXXX, Publication date: XXXX 2016.

• XXXX:3
2.1 Diffraction
Diffraction refers to the bending of a wave around an obstacle when the obstacle’s dimensions arecomparable to the wavelength of the wave. Diffraction helps a listener hear sounds not in the line-of-sight and is observed in everyday life [Tsingos et al. 2001]. Diffraction is explained through thewave equation; hence wave-based methods emulate it automatically. Geometric methods, on the otherhand, assume rectilinear propagation of sound. As these methods do not account for the bending ofsound rays around an obstacle, this effect must be incorporated separately. Doing so is difficult andcomputationally expensive, which is why most virtual environments avoid incorporating diffractioneven though the theories for approximating its effects have existed for decades [Biot and Tolstoy1957; Kouyoumjian and Pathak 1974]. With the advent of better algorithms and fast hardware, real-time diffraction is now used for interactive geometric propagation [Tsingos et al. 2001; Schissler et al.2014].
2.2 Reverberation
Reverberation forms the later part of the impulse response(IR) within closed environments. It is causedby successive reflections or ‘echoes’ as they diminish in intensity. Reverberation forms a critical partof the acoustics of an environment and directly correlates with the size and the clarity of sound in theenvironment. For these reasons, reverberation plays a very important role in architectural acoustics,especially while constructing auditoriums and concert-halls. This has led to considerable research incharacterizing reverberation, and a number of parameters such as the reverberation time (RT60) andclarity index (C50 and C80) have been formulated [Kuttruff 2007]. We concern ourselves with RT60 inthis study. RT60 is defined as the time it takes for the sound to decay by 60dB.
Given the importance of reverberation to architectural/room acoustics, and complexity of simulat-ing it from physical principles, empirical methodologies have been developed to artificially simulatereverberation in virtual acoustics such as digital and convolution reverberators. These reverberatorsare parametrized using a number of values, the most important of which is the RT60. We use a digitalSchroeder filter for our evaluation as these filters are the most common form of digital reverberatorsin use today. A well-known empirical formula used to estimate RT60 is Sabine’s equation, which givesthe relationship between the RT60 of a room, its volume, and the total absorption by:
RT60 ≈ 0.1611sm−1 V
Sa, (1)
where V is the total volume of the room in m3, S is total surface area in m2, a is the average absorptioncoefficient of the room surfaces, and Sa is the total absorption in sabins. Another more accurate wayto estimate the RT60 of a room is to look at the room’s impulse response (RIR) and directly computethe time it took for the sound to decay by 60 dB as specified in ISO 3382-1:2009. This method involvesa reverse cumulative trapezoidal integration to estimate the decay of the impulse response and usinga linear least-squares fit to estimate the slope between 0 dB and -60 dB. This is the method we used tocompute the RT60 for our digital reverberator.
2.3 Geometric Acoustics
Geometric acoustics methods work under the assumption that the wavelength of sound is much smaller(i.e., higher frequency) than the objects in the scene. This assumption allows these methods to as-sume that sound waves travel in straight lines and thereby use ray tracing [Vorlander 1989; Krokstadet al. 1968; Taylor et al. 2012; Schissler and Manocha 2016] and its variants such as beam trac-ing [Funkhouser et al. 2004] and frustum tracing [Lauterbach et al. 2007; Chandak et al. 2008] .
ACM Transactions on Applied Perception, Vol. V, No. N, Article XXXX, Publication date: XXXX 2016.
XXXX:4 •
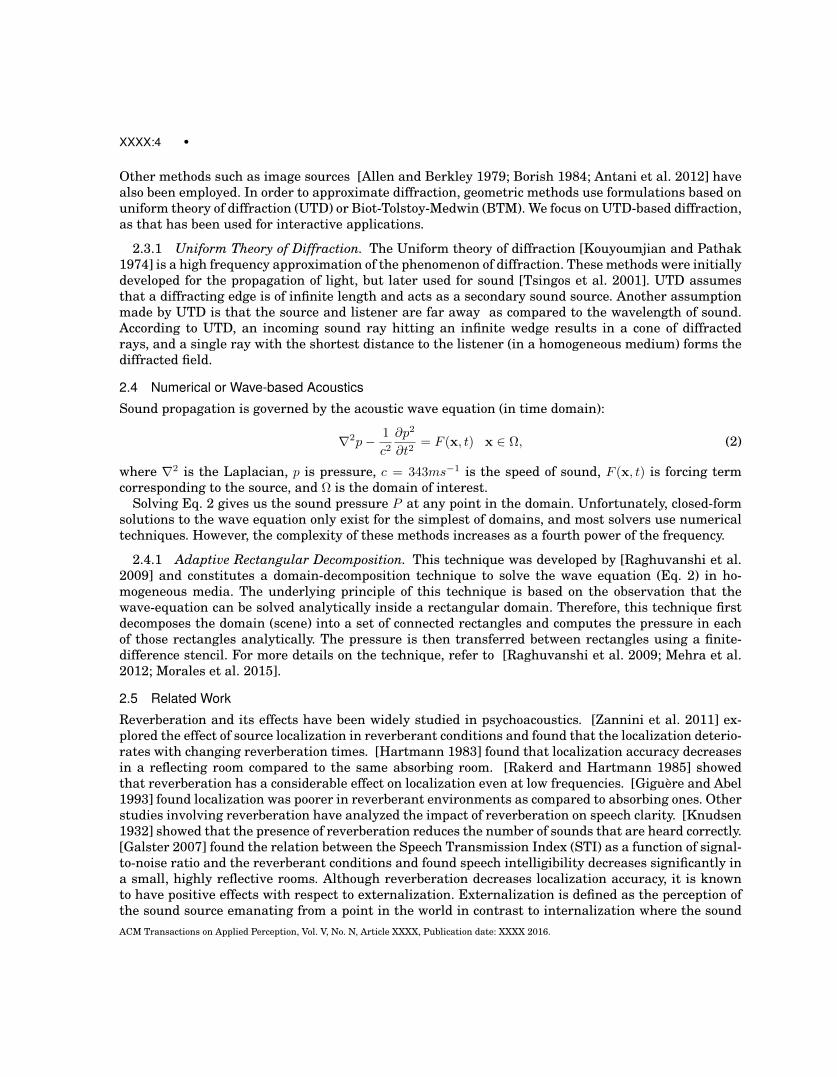
Other methods such as image sources [Allen and Berkley 1979; Borish 1984; Antani et al. 2012] havealso been employed. In order to approximate diffraction, geometric methods use formulations based onuniform theory of diffraction (UTD) or Biot-Tolstoy-Medwin (BTM). We focus on UTD-based diffraction,as that has been used for interactive applications.
2.3.1 Uniform Theory of Diffraction. The Uniform theory of diffraction [Kouyoumjian and Pathak1974] is a high frequency approximation of the phenomenon of diffraction. These methods were initiallydeveloped for the propagation of light, but later used for sound [Tsingos et al. 2001]. UTD assumesthat a diffracting edge is of infinite length and acts as a secondary sound source. Another assumptionmade by UTD is that the source and listener are far away as compared to the wavelength of sound.According to UTD, an incoming sound ray hitting an infinite wedge results in a cone of diffractedrays, and a single ray with the shortest distance to the listener (in a homogeneous medium) forms thediffracted field.
2.4 Numerical or Wave-based Acoustics
Sound propagation is governed by the acoustic wave equation (in time domain):
∇2p− 1
c2∂p2
∂t2= F (x, t) x ∈ Ω, (2)
where ∇2 is the Laplacian, p is pressure, c = 343ms−1 is the speed of sound, F (x, t) is forcing termcorresponding to the source, and Ω is the domain of interest.
Solving Eq. 2 gives us the sound pressure P at any point in the domain. Unfortunately, closed-formsolutions to the wave equation only exist for the simplest of domains, and most solvers use numericaltechniques. However, the complexity of these methods increases as a fourth power of the frequency.
2.4.1 Adaptive Rectangular Decomposition. This technique was developed by [Raghuvanshi et al.2009] and constitutes a domain-decomposition technique to solve the wave equation (Eq. 2) in ho-mogeneous media. The underlying principle of this technique is based on the observation that thewave-equation can be solved analytically inside a rectangular domain. Therefore, this technique firstdecomposes the domain (scene) into a set of connected rectangles and computes the pressure in eachof those rectangles analytically. The pressure is then transferred between rectangles using a finite-difference stencil. For more details on the technique, refer to [Raghuvanshi et al. 2009; Mehra et al.2012; Morales et al. 2015].
2.5 Related Work
Reverberation and its effects have been widely studied in psychoacoustics. [Zannini et al. 2011] ex-plored the effect of source localization in reverberant conditions and found that the localization deterio-rates with changing reverberation times. [Hartmann 1983] found that localization accuracy decreasesin a reflecting room compared to the same absorbing room. [Rakerd and Hartmann 1985] showedthat reverberation has a considerable effect on localization even at low frequencies. [Giguere and Abel1993] found localization was poorer in reverberant environments as compared to absorbing ones. Otherstudies involving reverberation have analyzed the impact of reverberation on speech clarity. [Knudsen1932] showed that the presence of reverberation reduces the number of sounds that are heard correctly.[Galster 2007] found the relation between the Speech Transmission Index (STI) as a function of signal-to-noise ratio and the reverberant conditions and found speech intelligibility decreases significantly ina small, highly reflective rooms. Although reverberation decreases localization accuracy, it is knownto have positive effects with respect to externalization. Externalization is defined as the perception ofthe sound source emanating from a point in the world in contrast to internalization where the soundACM Transactions on Applied Perception, Vol. V, No. N, Article XXXX, Publication date: XXXX 2016.

• XXXX:5
appears to be emanating from within one’s own head. [Begault 1992] conducted studies that showedthat spatial reverberation increased externalization. Our reverberation experiment borrows from thiswork in that we too use synthetic reverberation and construct impulse responses as they did in theirwork. Another important perceptual effect of reverberation is that of size estimation. [Hameed et al.2004] conducted studies to assess the effect of two reverberation parameters: the reverberation timeRT60 and the direct-to-reverberant energy ratio (D/R) ratio and found that RT60 is the most impor-tant parameter in room size estimation. [Cabrera et al. 2005] performed experiments using real andvirtual rooms and investigated the role of various parameters including the reverberation time. Theyfound reverberation strongly affects the room size perception. [Pop and Cabrera 2005] tested the rela-tionship between acoustical characteristics of a room and its perceived size for three real rooms. Theyfound that a negative relation between sound level and room size.
Most studies on diffraction have been numerical in nature [Kawai 1981; Chu et al. 2007]. Few psy-choacoustical studies have been performed on diffraction. [Torres et al. 2001a] conducted a studyinvestigating the audibility of diffracted sound for a simple open geometry and found that diffractedsound is audible in non-shadow regions. [Torres et al. 2001b] concluded that reflected-diffracted com-binations are significant and audible even for minute spectral changes. [Torres and Kleiner 1998]performed listening tests to compute the audibility of edge diffraction in a stage house and found thatfirst order diffraction is significantly more audible than second order diffraction. [Mehra et al. 2015]conducted experiments to evaluate the subject localization performance using wave-based and geomet-ric propagation and found that diffraction played a part in helping the subjects localize faster. However,this study did not consider diffraction as a separate phenomenon from other acoustic effects.
In this paper, we consider the psychoacoustical evaluation of diffraction and reverberation in avirtual environment. In the case of diffraction, we consider how the diffracted sound field changeswith respect to the diffraction angle for two methods of diffraction: UTD-based and wave-based. In thecase of reverberation, we consider how two competing methods of rendering late reverberation performwith respect to the size estimation of various rooms of increasing volumes. Although reverberationand its associated perceptual effects have been studied, size estimation remains relatively unexplored,motivating us to consider this particular phenomenon in our experiments.
3. EXPERIMENT 1: DIFFRACTION STUDY
3.1 Participants
Sixteen subjects participated in this study with informed consent. The ages ranged from 22 to 28(Mean = 24.6 with SD = 1.4, 2 females and 14 males). The participants were recruited from the staffand students at a university campus. All participants reported normal hearing.
3.2 Apparatus
The setup consisted of a Dell T7600 workstation with the sound delivered through a pair of Beyerdy-namic DT990 PRO headphones. The subjects wore a blindfold. The software consisted of in-house codeto auralize precomputed IRs. All code was written in C++.
3.3 Stimuli
The source consisted of a pre-recorded sound of a ringing bell. Since diffraction is a frequency-dependent phenomenon and more prominent at low frequencies, the bell clip was low-pass filteredwith a cut-off frequency of 300 Hz. The choice of frequency range was motivated by two considerations:
—The edge-diffraction phenomenon is most prominent in the 20 Hz - 350 Hz range. [Torres et al.2001a]
ACM Transactions on Applied Perception, Vol. V, No. N, Article XXXX, Publication date: XXXX 2016.

XXXX:6 •
Fig. 1. The figure shows the setting used for characterizing diffraction. The obstacle was 0.5m x 0.5m. The solid barrier preventsthe sound from reaching the listener from behind the obstacle. The barrier and the obstacle are fully absorptive to prevent anyreflections and making sure only the diffracted sound reached the listener. The figure is not drawn to scale for better viewing ofthe experimental setup.
—The loudness characteristic of sound is least complex (near linear) with respect to frequency in thefrequency range chosen by us. (see Fig. 2)
The subjects were placed at a radius of 5m from the sound source along a semi-circle in our virtualscene covering two orders of diffraction as shown in Fig 1. The scene was an open scene making sureno reflected sound reached the subjects. The semi-circle was sampled at 10 giving 18 positions plusone for the direct sound region for a total of 19 positions. Each trial consisted of the subject beingplaced at one these 19 positions randomly with the audio either auralized using the UTD-based orthe wave-based diffraction, the order of which was also randomized. The impulse response for each ofACM Transactions on Applied Perception, Vol. V, No. N, Article XXXX, Publication date: XXXX 2016.

• XXXX:7
these 19 positions and the two methods of diffraction were pre-computed and stored on file. The stimuliconsisted of 38 combinations (19 positions x 2 diffraction types) of convolved source and IR signals.
Fig. 2. ISO equal-loudness contours with frequency in Hz.
3.4 Design and Procedure
We designed a virtual environment to ensure only the diffracted sound reached the subject. The envi-ronment was effectively open, the ground was perfectly absorptive, and the source was not kept in theline-of-sight.(Fig.1). Ideally, we would need to have an infinitely high obstacle and an infinitely longbarrier as shown in Fig. 1 to make sure that the sound reaching the listener is the one that diffractsaround the lateral plane of the obstacle. Otherwise, the sound would diffract around the top of theobstacle and the edge of the barrier. These dimensions can obviously not be achieved in practice and inorder to simulate an open environment with seemingly infinite features, we enclosed the scene witha perfectly absorptive box. The box was 100m x 12m x 100m.
Another advantage of having an enclosure on the scene is that it acts as an infinitely far awayregion for wave-based methods. Wave-based methods inherently cannot handle open scenes and needan artificial boundary to act as infinity. In order to make sure this artificial infinity doesn’t reflectback into the scene, an absorbing boundary condition called Perfectly Matched Layer (PML) [Berenger1994] is used at the boundaries. In order to add the PML boundary, the aforementioned bounding boxis enclosed within a slightly bigger bounding box. The space between these boxes acts as the absorbinglayer.
This makes the environment effectively open with respect to sound propagation and would give thesame result as in a truly open, similar environment. Moreover, the environment also ensured that
ACM Transactions on Applied Perception, Vol. V, No. N, Article XXXX, Publication date: XXXX 2016.
XXXX:8 •
computing the propagated sound field with a wave-based propagation system was computationallytractable.
The barrier was added to one side of the cuboid to ensure that no sound could reach the subject fromthe other side. (Fig.1). The barrier, too, was perfectly absorbing to avoid spurious reflections in thescene. We tested up to two orders of diffraction. It should be noted that the concept of diffraction ‘order’does not apply to wave-based methods but does in the case of geometric methods. An order of diffractionis defined as the number of edges sound has to diffract around in order to reach the listener. Typically,the cost of geometric diffraction methods such as UTD increases exponentially with increasing order.
This was a within-subject study with the same participants for each method of diffraction. Thesubjects wore a blindfold and the audio was monaural sound delivered using headphones. The headorientation was kept fixed with the subjects facing the source as we were only interested in the per-ceived loudness measure. The absence of variable head orientation meant that we could disregard thespatial dimensions of the head and hence no spatial or binaural rendering was done. Before startingthe experiments, subjects were played a sample of the sound source to make sure they were familiarwith it.
A total of 16 participants took part in each group. For each of the 19 positions, the subjects wereasked to rate the loudness of the sound heard on an arbitrary, non-physical scale ranging from 1-20. The loudness scale was explained before the start of the experiment. The extrema of the scalewere compared to a verbal standard: 1 was the loudness of a falling leaf while 20 was the loudness ofsomeone shouting nearby. The sounds for the two methods were level-matched by matching the rootmean square (RMS) of the signals in the direct sound region.
A block consisted of 38 trials(19 positions x 2 diffraction methods). There were three blocks persubject, giving a total of 114 readings. The virtual placement of the subjects was controlled by theexperimenters, who pressed a key that placed the subjects at a random position along the semi-circleand randomly chose one of two diffraction methods. The subjects were allowed to take as many breaksas needed. Subjects took an average of 25-30 minutes for the entire experiment.
Please refer to the uploaded video mentioned under the title (https://www.youtube.com/watch?v=9Ye2hrDxz0) for details on the experimental design and setup.
3.5 Results
To equate use of the scale for analysis, each subject’s ratings were averaged over the three blocks,normalized by the subject’s mean score (over all listener positions and diffraction methods), and thenscaled by the grand-mean. The results are shown in Fig. 3, which shows the average values with thestandard errors for different listener positions around the obstacle for the two methods of diffraction.As can be seen in the figure, the decay trend for the wave-based diffraction is more uniform than theUTD-based one, which shows substantial variation in the perceived loudness.
The significance of these trends was confirmed by a two-way, repeated measures ANOVA with factorsdiffraction method and position. It showed a significant 2-way interaction: F(18,270) = 48.64, p < 0.001,indicating variations in the positional response across the two methods.
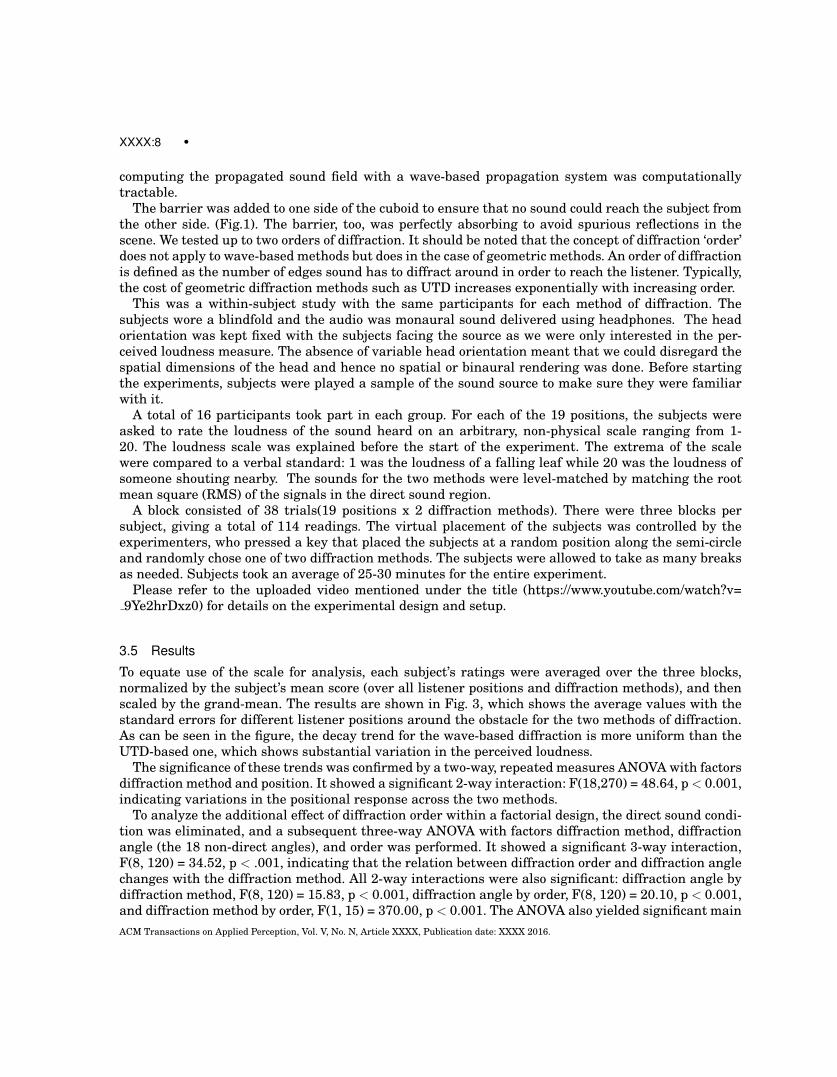
To analyze the additional effect of diffraction order within a factorial design, the direct sound condi-tion was eliminated, and a subsequent three-way ANOVA with factors diffraction method, diffractionangle (the 18 non-direct angles), and order was performed. It showed a significant 3-way interaction,F(8, 120) = 34.52, p < .001, indicating that the relation between diffraction order and diffraction anglechanges with the diffraction method. All 2-way interactions were also significant: diffraction angle bydiffraction method, F(8, 120) = 15.83, p < 0.001, diffraction angle by order, F(8, 120) = 20.10, p < 0.001,and diffraction method by order, F(1, 15) = 370.00, p < 0.001. The ANOVA also yielded significant mainACM Transactions on Applied Perception, Vol. V, No. N, Article XXXX, Publication date: XXXX 2016.

• XXXX:9
Fig. 3. Mean subject ratings for different positions along a semi-circle for two methods of diffraction, plus one direct soundregion. The cross-hatches show the between-subjects standard deviation of the responses. The upper figure shows the results forthe UTD-based diffraction while the lower one shows results for wave-based diffraction. Wave-based diffraction shows a stronglylinear decay while the UTD-based diffraction shows considerable deviation from linear decay.
effects for diffraction angle F(8,120) = 288.99, p < 0.001 and diffraction order F(1, 15) = 672.54, p <0.001.
4. EXPERIMENT 2: REVERBERATION STUDY
4.1 Participants
Twelve subjects took part in this study, all males. The ages ranged from 18 to 23 (Mean = 21 with SD= 1.5). All reported normal hearing. The participants were recruited from the staff and students at auniversity campus.
ACM Transactions on Applied Perception, Vol. V, No. N, Article XXXX, Publication date: XXXX 2016.

XXXX:10 •
Fig. 4. The reverberation experiment setup consisted of seven cubes of increasing dimension three of which are shown here.The listener path length in all the cubes was the same.
4.2 Apparatus and Stimuli
The setup consisted of a MacBook Pro laptop with the sound delivered through a pair of BeyerdynamicDT990 PRO headphones. The subjects were blindfolded.
Since reverberation forms the later part of the impulse response of a room, the initial part of theIR has to be remain consistent across the two cases to isolate reverberation as the only variable. Inorder to make sure that only the reverberation part of the impulse response is compared, we use thesame system based on [Schissler et al. 2014] to perform our task. This allows us to make sure that theearly part of the IR is constant for both cases. In the first case, the IR is computed as is, without anymodification corresponding to computing the reverberation using full impulse response. In the secondcase, we disable the physically computed reverberation and use a Schroeder-type filter [Schroeder1962] to compute the reverberation and add it to the final IR. The materials of the rooms were chosento be gypsum board for all the surfaces including the ceiling and the floor. This was done becausegypsum boards are commonly used in wall-paneling and hence would retain the subjects’ familiaritywith everyday environments. The sound source was a male voice.
Reverberation filters must be hand-tuned by setting the RT60 and Direct-to-reverberant (D/R) ratioin order to get the reverberation for an environment. Typically, these parameters are set by the audiodesigner based on his/her perception of what the environment would sound like. In order to removethis subjectivity, we decided to compute the parameters from the actual room parameters. The impulseresponse for each of the rooms was obtained and the parameters were estimated from the responseas explained in Section 2. Subjective ratings of room size were obtained using the method of free-magnitude estimation.
The stimuli consisted of seven cubes of increasing dimensions (100m3 − 1600m3 in increments of250m3) for each of the two reverberation conditions(Fig. 4). The sound source was placed near thecenter of the room slightly to the right. The subjects were allowed to move along a fixed path on thefloor in order to hear the sound at different positions and get an average estimate of the reverberationin the room.
4.3 Design and Procedure
This was a within-subject study with the same participants for both methods of reverberation. Thesubjects wore a blindfold and headphones. The sound was rendered in stereo using the standard stereopanning technique. Even in the case of this experiment, the subjects’ head orientation was fixed andACM Transactions on Applied Perception, Vol. V, No. N, Article XXXX, Publication date: XXXX 2016.

• XXXX:11
they were always facing straight ahead. And although, HRTF-based binaural rendering is known toincrease the elevation localization accuracy, in the absence of variable head orientation and fixedsource position, binaural auralization was considered redundant and simple stereo-based renderingwas deemed sufficient. Hence, panning-based stereo rendering was employed.
Before starting the study, the blindfolded subjects were played examples of sound originating in asmall sized room and a large sized one. This was done so that the subjects could get an idea aboutthe reverberation characteristics of the two ends of the room size spectrum and scale their internalresponse accordingly. They then underwent a training round in which each of the rooms were playedin random order with one of the two reverberation methods. This was done in order to let the subjectscome up with their own scale for scaling the room size. It is important to clarify that the subjects werenot asked to judge the size of the room in m3, instead, they were asked to give a dimensionless numberrepresenting how large they thought the rooms were.
Each subject rated the complete set of 7 rooms x 2 reverberation conditions with the order of therooms randomized, on each of three separate blocks, giving a total of 42 measurements per subject (7rooms x 2 reverberation conditions x 3 blocks). The subjects always started at the same initial position(relative to the room) and were asked to use one key on the keyboard to move forward and another tomove backward. The subjects’ head orientation was fixed and they always looked straight ahead. Onreaching the end of the translating distance in the virtual room on either side, they were notified bythe experimenter and asked to move in the opposite direction. The walking distance was kept constantirrespective of the size of the room, so that the subjects could not get a sense of the room size by thedistance walked. The subjects were allowed to take as many breaks as needed. The average durationof the experiment was one hour. No fatigue was reported.
Please refer to the uploaded video mentioned under the title (https://www.youtube.com/watch?v=9Ye2hrDxz0) for details on the experimental design and setup.
4.4 Results
To analyze the data, we first normalized it for each subject to account for the different scales adoptedby the different subjects [Zwislocki and Goodman 1980]. This was done by first taking the mean ofthe subjects’ scores for the three trial rounds. Then, each subject’s mean score was computed over allthe seven rooms and the two reverberation conditions. This mean was used to normalize the scores.Finally, the normalized scores were scaled by the grand mean over all subjects to give a sense of thescale used.
Fig. 5 shows the average magnitudes for each of the seven rooms for the two reverberation conditionsacross different blocks.
The 3-way ANOVA with reverberation method, room size, and block showed three significant effects:First, there was a main effect of room size, F(6,66) = 2.63, p = 0.025, indicating that overall, participantsdid differentiate reverberant quality. Second, the interaction between room size with reverberationmethod was significant, F(6,66) = 4.01, p = 0.003, indicating that room size had different effects on thetwo reverberation methods , and finally, room size interacted with block, F(2,22) = 4.029, p = 0.034,indicating a change in room size perception with experience making the judgments. The interactioninvolving method led us to examine the two reverberation methods separately.
A 2-way ANOVA for the reverberation filter with trial block and room size failed to show any sig-nificance for block, F(2,22) = 0.794, p = 0.466, room size, F(6,66) = 0.759, p = 0.605, or room size byblock, F(12,132) = 0.77, p = 0.678, thus indicating that neither the room size nor the trial block mat-tered. Essentially, the subjects were unable to discriminate different room sizes and did not show anyimprovement even when the experiment was repeated across blocks.(see Fig. 5)
ACM Transactions on Applied Perception, Vol. V, No. N, Article XXXX, Publication date: XXXX 2016.

XXXX:12 •
Fig. 5. The average subjective magnitude given by the subjects for the two reverberation conditions across the three blocks oftrials. The IR-based reverberation starts doing better as the experiment progresses and starts showing a logarithmic relation be-tween the volume of the room and perceived reverberant intensity (Purple dotted line in Block 3 is the log fit). The reverberationfilter shows no such learning effect.
ACM Transactions on Applied Perception, Vol. V, No. N, Article XXXX, Publication date: XXXX 2016.

• XXXX:13
1 2 3 4 5 6 7 8 9 10 11 12 13 14 15 16 17 18 19
Diffraction angle
3
2
1
0
1
2
3
4
Resi
duals
Residuals for the simple linear regression
UTD
Wave-based
Fig. 6. The residual error from the simple linear regression for both diffraction methods. As is clearly evident, UTD-baseddiffraction shows high error when trying to fit its response to a straight line as compared to the wave-based method. The X-axisrepresents the 19 equi-spaced diffraction angles ranging from 0 to 180
In contrast, the same 2-way ANOVA for the reverberation computed using full impulse responseshowed significance for block, F(2,22) = 5.08, p = 0.016, and room size, F(6,66) = 5.855, p < 0.001.Although room size did not significantly interact with block, F(12,132) = 0.709, p = 0.741 (Fig. 5), it isclear that the changes with experience were confined to the smaller room sizes. A log fit to the block 3mean data accounts for a substantial amount of the variance in the means across room size (91.5%).Thus, after two blocks of practice with the full impulse response method, subjects were differentiatingthe intensity of reverberation in an approximately logarithmic relation to room volume. Such compres-sive scaling of perceptual dimensions is commonly found, and the logarithmic relation is known asFechners law [Wolfe et al. 2014]
5. ANALYSIS
5.1 Diffraction Study
In any VE the sound field should not appear discontinuous to the listeners as that could break presence.Fig. 3 shows how the sound field was perceived by the subjects in the two cases. A simple linear-regression fit further solidifies the notion: The coefficient-of-determination, R2
UTD evaluates to 0.91whereas R2
Wave = 0.98 for the same set of diffraction angles relative to the source.The high R2 values for both diffraction methods indicate that the subject responses for both the
methods at least approximate a linearly-decreasing trend in terms of perceived loudness. While this isthe expected trend for perceived loudness in such a setting as shown by our experiment, the UTD-based
ACM Transactions on Applied Perception, Vol. V, No. N, Article XXXX, Publication date: XXXX 2016.

XXXX:14 •
1 2 3
Block
0.0
0.2
0.4
0.6
0.8
1.0
R^
2
Coefficient of determination vs. blockReverb. TypeReverberation Filter
Impulse Response
Fig. 7. The value of R2 for the reverberation types across all the three trial blocks.
diffraction shows substantially more deviation from linear. In contrast, the wave-based diffraction ishighly linear in its trend. Fig. 6 shows how amenable each of the methods is to a linear model fitting.
Based on these results, it can be concluded that UTD-based diffraction is a reasonable diffractionmodel perceptually and for applications where some discontinuity in the sound field is acceptable (e.g.,games). In addition, UTD serves as a relatively inexpensive means to get reasonably good diffractedsound. On the other hand, applications where presence should not be affected by abruptly changingsound fields should use wave-based methods.
5.2 Reverberation Study
It is well-known that volume estimation is a complex phenomenon, and the trends in the data forsize scaling from reverberant cues reflect this, in showing that people are relatively insensitive tothese cues. We would expect to see a monotonically increasing trend in both cases. The full impulseresponse shows this characteristic, in that the subjective magnitude for the full impulse responseshows an increasing trend over the smaller room sizes, but this trend quickly saturates. However, thesubjects seem to learn to scale with this technique over the course of the experiment. The scaling byreverberation filter, on the other hand tends to vary in a non-systematic manner with increasing roomsize and shows high inter-subject variability as well.
Based on the log-linear regression model as a prediction of listener responses, the reverberationfilter consistently performs poorly in rendering a sense of room volume, while the physically accuratereverberation method improves with user experience. Fig. 7 shows how the value of R2 varies with theblock: reverberation filter performs poorly across the three blocks, indicating it doesn’t lend itself to anyACM Transactions on Applied Perception, Vol. V, No. N, Article XXXX, Publication date: XXXX 2016.

• XXXX:15
meaningful relation between the perceived reverberation intensity and the volume of the environment.Accurate reverberation, on the other hand, starts showing improvement with R2
(IR)B3= 0.92 for the
third block, indicating the logarithmic relation between volume and reverberation intensity becomesmore prominent as subjects start to learn judging the volume based only on the sound cues alone.
Although, the data indicate that untrained listeners are not particularly good at judging the size ofan environment, it appears using full impulse response offers some benefit in the way of consistencyand seems to offer much superior discriminatory ability in room size perception as the subjects becometrained. [Hameed et al. 2004] pointed out that subjects tend to only use the RT60 in room size percep-tion and if fidelity with respect to this phenomenon is desired, the absorption coefficient of the roomcan be adjusted to get the proper relationship to the volume of the space.
We would like to point out that the reason we used a restricted scale for the diffraction experimentwhile using a free magnitude estimation for the reverberation was because in case of the diffractionexperiment we were interested in very specific points of discrepancy in the two methods, whereas incase of reverberation, we wanted to trace out the magnitude estimation function. We find that in thelatter case, people are insensitive to the manipulations once we get away from the extreme low end.
6. CONCLUSIONS, LIMITATIONS, AND FUTURE WORK
In this paper we have presented two user studies to evaluate the perceptual merits of accurate andapproximate interactive sound propagation algorithms. To the best of our knowledge, the diffractionstudy is the first of its kind in evaluating the perceived smoothness of the diffracted field for differentmethods; while the reverberation study evaluates the ability to provide accurate space cues for differ-ent methods. The study results show that accurate sound propagation algorithms offer an increasedperceptual differentiation capability, exemplified by the reverberation study. Although, the subjectswere not able to differentiate the volumes of the rooms very well, the accurate reverberation methodresulted in a significantly better discriminatory capability compared to the reverberation filter.
The regression fits offer a concise and numerical value that encapsulate the perceptual differenti-ation capabilities of the algorithms and serve as simple metrics to evaluate the performance of thesemethods. We expect these metrics will serve as a means to let users decide which algorithms to usespecific to their requirements. Currently, the R2 values offer a very high-level view of the algorithmsand may not present an accurate picture for all scenarios. This can easily be the case if the wave-baseddiffraction had an unacceptably high peak at particular listener position(s), but still lent itself to abetter linear fit than UTD. We believe that our choice of these metrics can be made more robust tosuch anomalies by using more sophisticated statistical models, as part of future work.
We would also like to point out that the environments in both experiments were kept relativelysimple, so that the approximate algorithms could work to their full potential. Normally, reverberationfilters are tuned with respect to simple cubical environments, and it is known that the performanceof UTD-based diffraction degrades substantially with an increasing number of diffraction edges. So,in a way, these experiments also represent the best case scenario for the performance of the approx-imate algorithms. Since most VEs are going to be significantly more complicated, these approximatealgorithms should be expected to perform below the level established in our experiments. Furtheranalyses are needed to quantify the effects of room shape and interior features on performance of thealgorithms. However, the number of potential geometric variations, combined with the range of vari-ables that might be used to measure performance, makes determining the ecological validity of thesemethods a much more challenging research problem.
The studies, too, can be extended in multiple ways: It would be interesting to vary the spectral con-tent of the source in the diffraction experiment, since diffraction is a frequency dependent phenomenonand evaluate the subjects’ responses. The subject’s distance from the source can also be varied and eval-
ACM Transactions on Applied Perception, Vol. V, No. N, Article XXXX, Publication date: XXXX 2016.

XXXX:16 •
uated. The reverberation experiment could be verified by constructing real world rooms and using anactual sound source to verify the logarithmic relation of subjects’ responses to changing room size.
7. ACKNOWLEDGEMENT
The authors would like to thank Carl Schissler, Alok Meshram, Ravish Mehra, and Jennifer Baulierfor valuable insights and help at various stages of the project. The authors would also like to thank thesubjects who took part in the user studies. The work was supported in part by NSF grants 1320644,1456299, and 1518630.
REFERENCES
ALLEN, J. B., AND BERKLEY, D. A. 1979. Image method for efficiently simulating small-room acoustics. The Journal of theAcoustical Society of America 65, 4, 943–950.
ANTANI, L., CHANDAK, A., TAYLOR, M., AND MANOCHA, D. 2012. Efficient finite-edge diffraction using conservative from-region visibility. Applied Acoustics 73, 3, 218–233.
BEGAULT, D. R., ET AL. 1994. 3-D sound for virtual reality and multimedia, vol. 955. Citeseer.BEGAULT, D. R. 1992. Perceptual effects of synthetic reverberation on three-dimensional audio systems. Journal of the Audio
Engineering Society 40, 11, 895–904.BERENGER, J.-P. 1994. A perfectly matched layer for the absorption of electromagnetic waves. Journal of computational physics
114, 2, 185–200.BIOT, M. A., AND TOLSTOY, I. 1957. Formulation of wave propagation in infinite media by normal coordinates with an
application to diffraction. The Journal of the Acoustical Society of America 29, 3, 381–391.BORISH, J. 1984. Extension of the image model to arbitrary polyhedra. The Journal of the Acoustical Society of America 75, 6,
1827–1836.CABRERA, D., JEONG, D., KWAK, H. J., KIM, J.-Y., AND DUCKJIN-GU, J. 2005. Auditory room size perception for modeled and
measured rooms. In Internoise, the 2005 Congress and Exposition on Noise Control Engineering, Rio de Janeiro, Brazil, 7-10August 2005, Citeseer.
CHANDAK, A., LAUTERBACH, C., TAYLOR, M., REN, Z., AND MANOCHA, D. 2008. Ad-frustum: Adaptive frustum tracing forinteractive sound propagation. Visualization and Computer Graphics, IEEE Transactions on 14, 6, 1707–1722.
CHENG, A. H.-D., AND CHENG, D. T. 2005. Heritage and early history of the boundary element method. Engineering Analysiswith Boundary Elements 29, 3, 268–302.
CHU, D., STANTON, T. K., AND PIERCE, A. D. 2007. Higher-order acoustic diffraction by edges of finite thickness. The Journalof the Acoustical Society of America 122, 6, 3177–3194.
DJELANI, T., AND BLAUERT, J. 2001. Investigations into the build-up and breakdown of the precedence effect. Acta Acusticaunited with Acustica 87, 2, 253–261.
FASTL, H., AND ZWICKER, E. 2007. Psychoacoustics: Facts and models, vol. 22. Springer Science & Business Media.FUNKHOUSER, T., TSINGOS, N., CARLBOM, I., ELKO, G., SONDHI, M., WEST, J. E., PINGALI, G., MIN, P., AND NGAN, A.
2004. A beam tracing method for interactive architectural acoustics. The Journal of the Acoustical Society of America 115, 2,739–756.
GALSTER, J. A. 2007. The Effect of Room Volume on Speech Recognition in Enclosures with Similar Mean Reverberation Time.PhD thesis, Vanderbilt University.
GIGUERE, C., AND ABEL, S. M. 1993. Sound localization: Effects of reverberation time, speaker array, stimulus frequency, andstimulus rise/decay. The Journal of the Acoustical Society of America 94, 2, 769–776.
HAAS, H. 1951. Uber den einfluβ eines einfachechos auf die horsamkeit von sprache. Acta Acustica united with Acustica 1, 2,49–58.
HAMEED, S., PAKARINEN, J., VALDE, K., AND PULKKI, V. 2004. Psychoacoustic cues in room size perception. In AudioEngineering Society Convention 116, Audio Engineering Society.
HARTMANN, W. M. 1983. Localization of sound in rooms. The Journal of the Acoustical Society of America 74, 5, 1380–1391.JOT, J.-M., AND CHAIGNE, A. 1991. Digital delay networks for designing artificial reverberators. In Audio Engineering Society
Convention 90, Audio Engineering Society.KAWAI, T. 1981. Sound diffraction by a many-sided barrier or pillar. Journal of Sound and Vibration 79, 2, 229–242.KNUDSEN, V. O. 1932. Architectural acoustics.
ACM Transactions on Applied Perception, Vol. V, No. N, Article XXXX, Publication date: XXXX 2016.

• XXXX:17
KOUYOUMJIAN, R. G., AND PATHAK, P. H. 1974. A uniform geometrical theory of diffraction for an edge in a perfectly conduct-ing surface. Proceedings of the IEEE 62, 11, 1448–1461.
KROKSTAD, A., STROM, S., AND SØRSDAL, S. 1968. Calculating the acoustical room response by the use of a ray tracingtechnique. Journal of Sound and Vibration 8, 1, 118–125.
KUTTRUFF, H. 2007. Acoustics: An Introduction. CRC Press.LARSSON, P., VASTFJALL, D., AND KLEINER, M. 2002. Better presence and performance in virtual environments by improved
binaural sound rendering. In Audio Engineering Society Conference: 22nd International Conference: Virtual, Synthetic, andEntertainment Audio, Audio Engineering Society.
LAUTERBACH, C., CHANDAK, A., AND MANOCHA, D. 2007. Interactive sound rendering in complex and dynamic scenes usingfrustum tracing. Visualization and Computer Graphics, IEEE Transactions on 13, 6, 1672–1679.
MEHRA, R., RAGHUVANSHI, N., SAVIOJA, L., LIN, M. C., AND MANOCHA, D. 2012. An efficient gpu-based time domain solverfor the acoustic wave equation. Applied Acoustics 73, 2, 83–94.
MEHRA, R., RAGHUVANSHI, N., ANTANI, L., CHANDAK, A., CURTIS, S., AND MANOCHA, D. 2013. Wave-based sound propa-gation in large open scenes using an equivalent source formulation. ACM Transactions on Graphics (TOG) 32, 2, 19.
MEHRA, R., RUNGTA, A., GOLAS, A., LIN, M., AND MANOCHA, D. 2015. Wave: Interactive wave-based sound propagation forvirtual environments. Visualization and Computer Graphics, IEEE Transactions on 21, 4, 434–442.
MORALES, N., MEHRA, R., AND MANOCHA, D. 2015. A parallel time-domain wave simulator based on rectangular decomposi-tion for distributed memory architectures. Applied Acoustics 97, 104–114.
POP, C. B., AND CABRERA, D. 2005. Auditory room size perception for real rooms. In Proceedings of the Australian AcousticalSociety Conference.
RAGHUVANSHI, N., NARAIN, R., AND LIN, M. C. 2009. Efficient and accurate sound propagation using adaptive rectangulardecomposition. Visualization and Computer Graphics, IEEE Transactions on 15, 5, 789–801.
RAKERD, B., AND HARTMANN, W. 1985. Localization of sound in rooms, ii: The effects of a single reflecting surface. The Journalof the Acoustical Society of America 78, 2, 524–533.
SCHISSLER, C., AND MANOCHA, D. 2016. Adaptive impulse response modeling for interactive sound propagation. In Proceed-ings of the 20th ACM SIGGRAPH Symposium on Interactive 3D Graphics and Games, ACM, 71–78.
SCHISSLER, C., MEHRA, R., AND MANOCHA, D. 2014. High-order diffraction and diffuse reflections for interactive soundpropagation in large environments. ACM Transactions on Graphics (TOG) 33, 4, 39.
SCHROEDER, M. R. 1962. Natural sounding artificial reverberation. Journal of the Audio Engineering Society 10, 3, 219–223.TAYLOR, M. T., CHANDAK, A., ANTANI, L., AND MANOCHA, D. 2009. Resound: interactive sound rendering for dynamic virtual
environments. In Proceedings of the 17th ACM international conference on Multimedia, ACM, 271–280.TAYLOR, M., CHANDAK, A., MO, Q., LAUTERBACH, C., SCHISSLER, C., AND MANOCHA, D. 2012. Guided multiview ray tracing
for fast auralization. Visualization and Computer Graphics, IEEE Transactions on 18, 11, 1797–1810.TORRES, R. R., AND KLEINER, M. 1998. Audibility of edge diffraction in auralization of a stage house. The Journal of the
Acoustical Society of America 103, 5, 2789–2789.TORRES, R. R., SVENSSON, U. P., AND KLEINER, M. 2001. Computation of edge diffraction for more accurate room acoustics
auralization. The Journal of the Acoustical Society of America 109, 2, 600–610.TORRES, R., KLEINER, M., SVENSSON, U., AND DALENBACK, B. 2001. Edge diffraction and surface scattering in auralization.
CAMPFIRE, 3.TSINGOS, N., FUNKHOUSER, T., NGAN, A., AND CARLBOM, I. 2001. Modeling acoustics in virtual environments using the
uniform theory of diffraction. In Proceedings of the 28th annual conference on Computer graphics and interactive techniques,ACM, 545–552.
VORLANDER, M. 1989. Simulation of the transient and steady-state sound propagation in rooms using a new combined ray-tracing/image-source algorithm. The Journal of the Acoustical Society of America 86, 1, 172–178.
WEBB, C., AND GRAY, A. 2013. Large-scale virtual acoustics simulation at audio rates using three dimensional finite differencetime domain and multiple graphics processing units. In Proceedings of Meetings on Acoustics, vol. 19, Acoustical Society ofAmerica, 070092.
WOLFE, J., LEVI, D., KLUENDER, K., BARTOSHUK, L., HERZ, R., KLATZKY, R., LEDERMAN, S., AND MERFELD, D. 2014.Sensation and Perception (4th ed.). Sinauer associates, inc.
YEE, K. S., ET AL. 1966. Numerical solution of initial boundary value problems involving maxwells equations in isotropicmedia. IEEE Trans. Antennas Propag 14, 3, 302–307.
ZANNINI, C. M., PARISI, R., AND UNCINI, A. 2011. Binaural sound source localization in the presence of reverberation. InDigital Signal Processing (DSP), 2011 17th International Conference on, IEEE, 1–6.
ACM Transactions on Applied Perception, Vol. V, No. N, Article XXXX, Publication date: XXXX 2016.

XXXX:18 •
ZIENKIEWICZ, O. C. 2005. The finite element method for fluid dynamics. PhD thesis, University of Wales.ZWISLOCKI, J., AND GOODMAN, D. 1980. Absolute scaling of sensory magnitudes: A validation. Perception & Psychophysics 28,
1, 28–38.
ACM Transactions on Applied Perception, Vol. V, No. N, Article XXXX, Publication date: XXXX 2016.