Embed Size (px)
Citation preview
Psychological Effects of Classroom Noise onEarly Childhood Teachers
Leonid Grebennikov and Mark WigginsUniversity of Western Sydney
Abstract
The aim of this research was to examine the relationship between exposure toclassroom noise and the psychological well-being of full-time teaching staff in 14preschool settings located across Western Sydney. The participants comprised 25teachers, each of whom was administered a range of instruments. The resultsindicated that 40% of teachers were subjected to daily or peak noise exposures beyondthe maximum permissible levels according to the Australian Occupational Health andSafety (OH&S) standard. Further, the unique contribution of daily noise dose receivedby the staff to the prediction of their vocational strain, interpersonal strain, anddefensive functioning was evident through multiple regression analyses. It wasconcluded that vocational strain amongst preschool teachers may be related, in part,to a combination of elevated daily doses of noise, and years of teaching experience.
Introduction
A number of contemporary studies concerning noise in early childhood educationalsettings have established its detrimental effects on both students and teaching staff(e.g., Baxter 2000, Maxwell & Evans 1999, Nelson & Soli 2000, Sorkin 2000).Understandably most of these projects have focused on children, as they are morevulnerable to long-term health, psychological, and educational impairments createdby classroom noise than are adults (Evans & Lepore 1993, Evans & Maxwell 1997,Nelson & Soli 2000). However, McLaren and Dickinson (2002) have found thatexposure to noise is also a problem amongst early childhood teachers with 30% beingexposed to noise in excess of the maximum permissible level under New Zealandstandards.
•35The Australian Educational Researcher, Volume 33, Number 3, December 2006
The Australian standard for exposure to noise in the occupational environment isconsistent with that enacted in New Zealand: An average of 85 decibels (dB) for aneight-hour day, and 140 dB for peak noise level. Comparable common noise sourcesfalling within the range of 85-140 decibels are: A handsaw – 85; A subway – 90-110;A rock concert – 110-120; Noisy squeeze toys – 135; An ambulance siren – 140. It isimportant to note that these levels specify maximum permissible exposure within theworkplace. Repeated exposure to lower levels of noise may also cause hearingdamage over the longer term (American Speech-Language-Hearing Association 2004,National Code of Practice for Noise Management and Protection of Hearing at Work2000).
In addition to the physical damage caused by exposure to excessive noise, continuedexposure has been associated with elevated levels of stress, high anxiety, increasedannoyance, depression, and fatigue (Doherty 1999, Evans & Johnson 2000, Glass &Singer 1972, Kalveram 2000, Kryter 1994). Stress, in turn, has been observed ascontributing to a number of psychosomatic conditions, including asthma, digestivetract disorders, heart diseases, migraines, chest and back pain (Bacon et al. 1994,Barsky 1988, Doherty 1999, Donoghue & Siegel 1994, Galloway, Panckurst, Boswell,Boswell & Green 1984b, Maddi & Kobasa 1984, Romanova & Grebennikov 1996,Wilder & Plutchik 1984). Hans Selye, whose research first demonstrated that thecontinuing presence of stressors modified the immune system, labelled theseconditions “diseases of adaptation” (Selye 1956). Unsurprisingly, stress has beenshown to disrupt both workers’ performance (Evans & Johnson 2000) and their jobsatisfaction (Galloway, Panckurst, Boswell, Boswell & Green 1984a).
While teaching, in general, is currently considered a very stressful occupation (Finlay-Jones 1986, Hodge, Jupp & Taylor 1994, Jarvis 2002, Pithers & Fogarty 1995, Smith,Brice, Collins, Matthews & McNamara 2000, Wilhelm, Dewhurst-Savellis & Parker2000), an analysis of the literature reveals that little or no attention has beenspecifically directed towards early childhood teachers’ stress and its sources.Anecdotal evidence appears to suggest that much of employee “burnout” andturnover in the Australian early childhood workforce can be attributed, at least in part,to job strains and the nature of the working environment. For example, workingconditions and the intensity of the workplace were cited by the respondents to a NewSouth Wales (NSW) Childcare Workers’ survey as their second most significantconcern following wages (Warrilow, Fisher, Cummings, Sumsion & Beckett 2002).Many teachers appear worried about the impact of noise on their hearing, as theyoften report going home with “ringing ears”. Indeed, school boards are becomingincreasingly concerned about the relationship between noise and the performance ofboth teachers and their students.
36 •
LEONID GREBENNIKOV AND MARK WIGGINS

It is reasonable to assume that the relationship between classroom noise and teachers’stress is a complex interaction of factors (including, for example, teaching experienceor age), rather than a single causal link. If this is the case, then it is important toinvestigate whether and, to what extent, these factors contribute to employees’perception of stress in the targeted industry sector.
Since noise in early childhood settings is a potentially continuous stressor, and thereis little opportunity to mitigate either the sources of noise or its impact, teachers haveto reconcile themselves to it if they wish to remain within the industry. We supposedthat a so-called “buffer” or “ostrich” psychological adaptation strategy would bemainly in use. This strategy implies the creation of a mental “barrier” between theindividual and the stressful environment to prevent the full effects of the stressorbeing experienced. The perceptual defence mechanism of denial is one possiblepsychological technique to implement this strategy (e.g., Conte & Apter 1995, Plutchik1995, Plutchik, Kellerman & Conte 1979). Denial is presumed to assist an individualavoid awareness of unwelcome reality and, in this sense, it is likely to be used to“block out” both recognition of being under stress and the awareness of its source.Plutchik, Kellerman, & Conte (1979) found an interesting difference between denialand other defence mechanisms. The use of denial correlated negatively withperceived stress and anxiety, while all other defence mechanisms showed positivecorrelations with stress. Therefore, on the one hand, the stressful environment canenhance the use of denial alongside other defence mechanisms. On the other hand,denial is the only defence with a “back action”, such that it can considerably dampenone’s conscious perception of the stressor (Evans & Johnson 2000, Plutchik,Kellerman & Conte 1979). On the basis of this perspective, two models wereproposed for evaluation. First, we sought to test whether the set of the objectivevariables: Noise exposure, age, and length of service plus denial contributed to aprediction of perceived stress. It was expected that denial would be negatively relatedto self-reported measures of stress, while the objective variables would be positivelyrelated to the stress parameters. Second, we tested the combination of the objectivevariables and stress measures as the basis of a prediction of the overall use of defencemechanisms.
In summary, the present research was designed to examine: (1) The level ofoccupational noise, to which early childhood teachers are exposed, and (2)employees’ perceived stress and the defence strategies they implement, if any, tomanage the situation. Our principal concern was to examine an under-studied groupof professionals at potential risk, with a focus on their exposure to noise,psychological well-being, and possible exposure-outcome relationship. It washypothesized that a statistically significant, positive linear relationship would beevident between the level of noise to which early childhood teachers were exposed
•37
PSYCHOLOGICAL EFFECTS OF CLASSROOM NOISE
and their scores on various psychological measures, including personal strain, chronicand recent distress, and the use of defence mechanisms.
Method
Participants Data were collected from 25 full-time teaching staff located at 14 preschools acrossWestern Sydney and operated under the auspices of the New South WalesDepartment of Education and Training. Full-time employees were selected for testing,since it was assumed that this group would experience noise over relatively longerperiods than other staff (McLaren & Dickinson 2002). All the participants were female.Their mean age was 42.7 years (SD = 9.7), and they had accumulated an average of13.9 years (SD = 8.5) of teaching experience. The student to teacher ratios were 10:1for 16 participants (64%), 11:1 for two participants (8%), and 12:1 for sevenparticipants (28%).
Noise Assessment The initial stage of the study involved an assessment of the daily noise exposure forfull-time teaching staff members, taken as an average eight-hour equivalent soundpressure level, and peak sound pressure level. The ambient noise level wasmonitored using a high-quality personal sound exposure meter “Casella”, model CEL-310/K1, which is designed to meet the standards of the National Code of Practice(2000). The data collected included:
• The average sound pressure level throughout a trial period;
• An eight-hour equivalent sound level (i.e. average level throughout a trial periodprojected over eight hours);
• The dose% (the amount of actual exposure relative to the amount of allowableexposure for which 100% and above are hazardous);
• The peak sound pressure exceedence; and
• Event and time history.
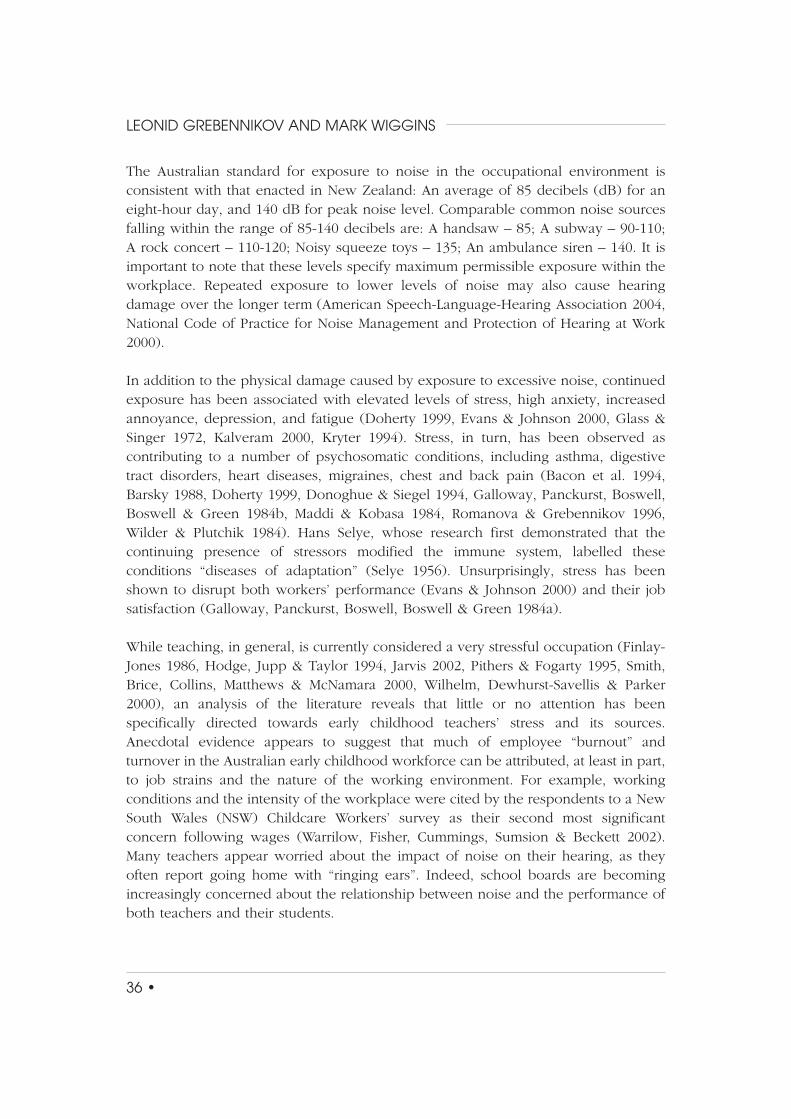
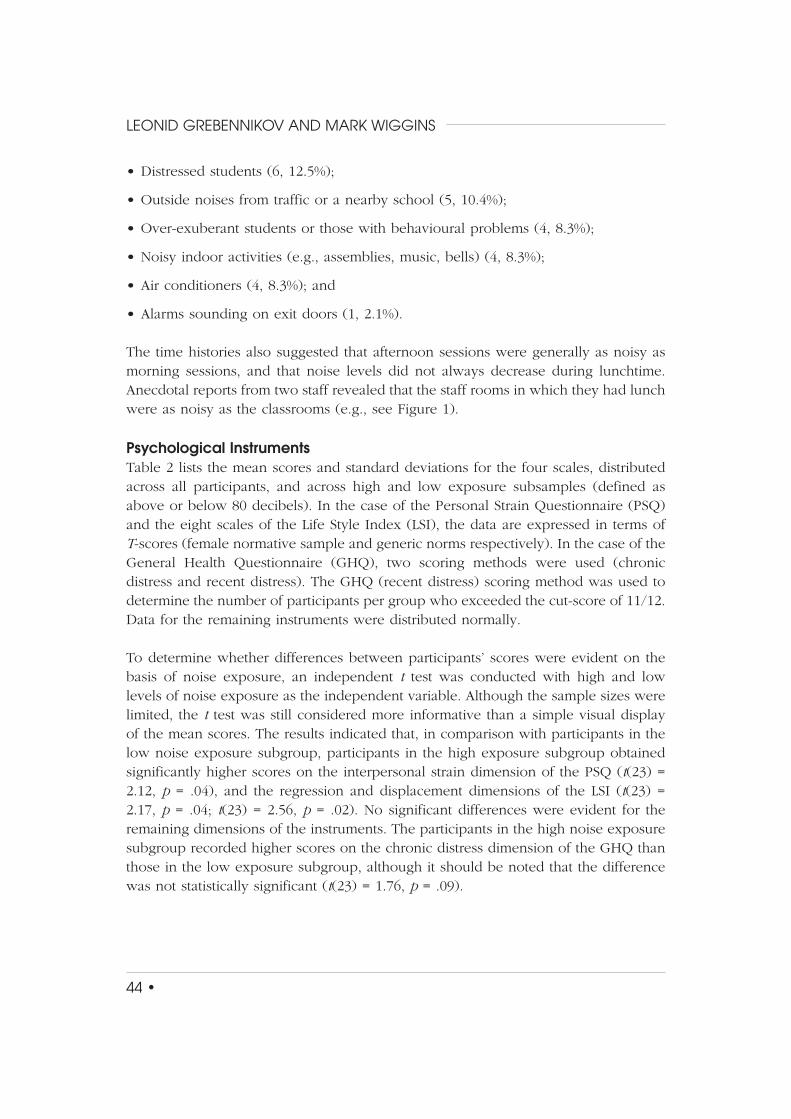
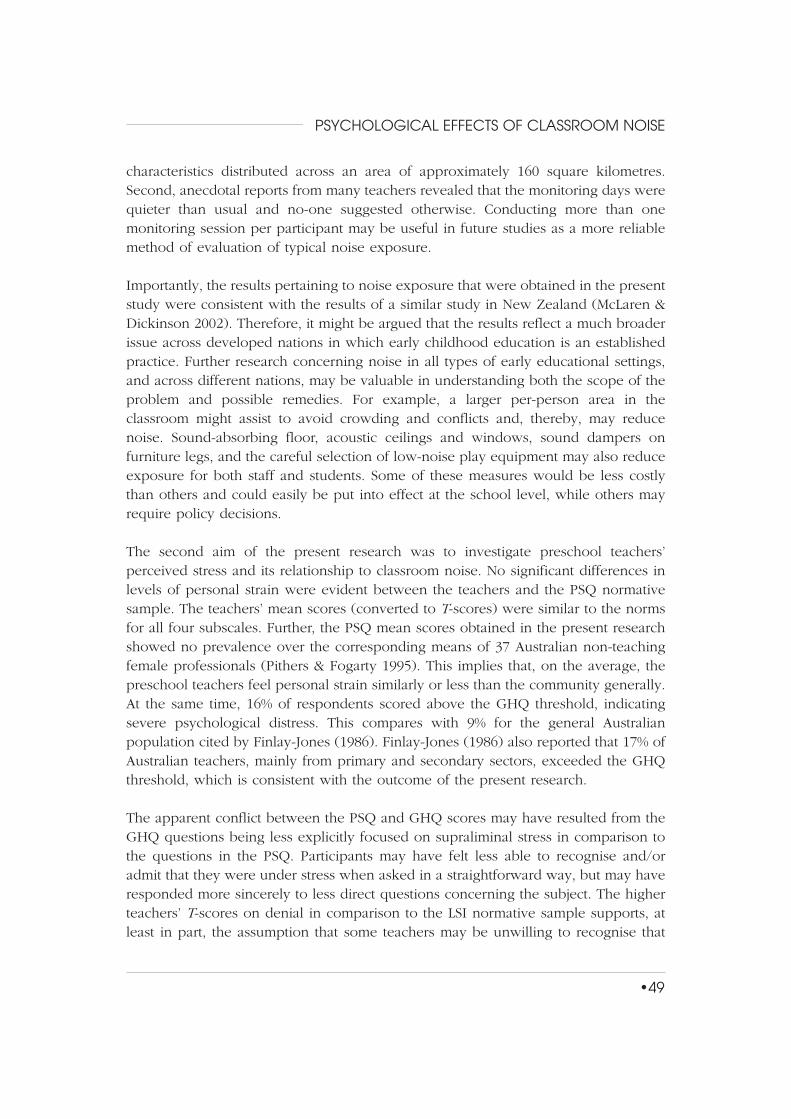
The estimation of noise level, projected over eight hours, was used as it standardizedthe exposure received by participants during the approximately six hours of actualworking time, assuming that the remainder of the eight-hour reference period wasquiet. This enabled comparisons between individual exposure rates and with theOH&S eight-hour standard (see Figure1).
38 •
LEONID GREBENNIKOV AND MARK WIGGINS
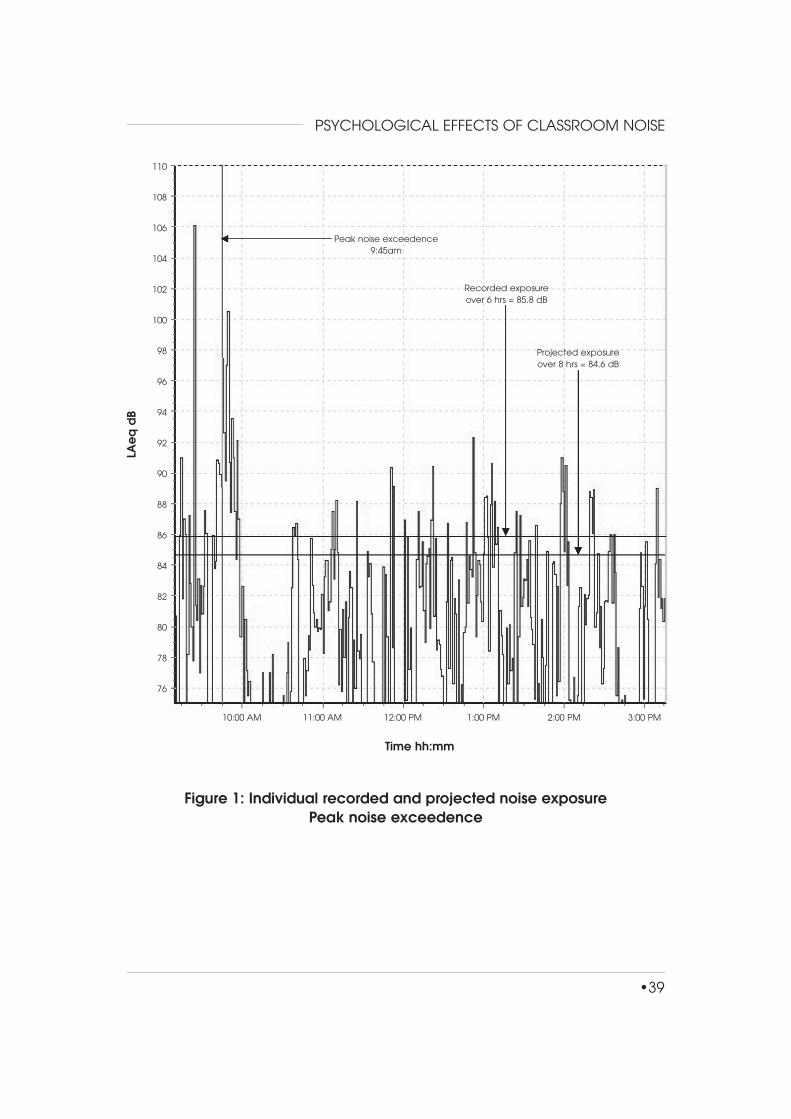
Figure 1: Individual recorded and projected noise exposurePeak noise exceedence
•39
PSYCHOLOGICAL EFFECTS OF CLASSROOM NOISE
110
108
106
104
102
100
98
96
94
92
90
88
86
84
82
80
78
76
10:00 AM 11:00 AM 12:00 PM 1:00 PM 2:00 PM 3:00 PM
Time hh:mm
LAe
q d
B
Peak noise exceedence9:45am
Recorded exposureover 6 hrs = 85.8 dB
Projected exposureover 8 hrs = 84.6 dB

Instruments The second stage of the study involved the distribution of a series of psychologicalinstruments, including the Personal Strain Questionnaire (PSQ), which was a part ofthe Occupational Stress Inventory revised edition (Osipow 1998); the General HealthQuestionnaire (GHQ-60) (Goldberg & Williams 1991); and the Life Style Index (LSI)defence mechanisms test (Plutchik, Kellerman & Conte 1979).
The PSQ consists of four subscales. According to Osipow (1998), the vocational strainscale assesses job attitudes and perceived performance; the psychological strain scaleassesses the degree of one’s psychological adjustment and mood problems; theinterpersonal strain scale assesses the extent to which interpersonal relationships aredisrupted; and the physical strain scale assesses worries about one’s health and poorself-care habits. Each scale contains 10 items. A five-point (1-5) Likert-style scale isused by respondents to rate their level of agreement with a given statement(rarely/never, occasionally, often, usually, most of the time). Normative data obtainedfrom samples of 364 female and 619 male adults is available as T-scores with a meanof 50 and a standard deviation of 10. A mean value for Cronbach’s alpha of .94 isreported for this instrument.
The GHQ-60 is an unscaled, single-score screening test that focuses on emotionaldistress and social dysfunction. Goldberg and Williams (1991) suggest that thesedimensions should be examined through an emergence of various minor somaticsymptoms and changes in social behaviour. The questionnaire contains 60 items,which respondents are asked to rate, using a four-point scale, as applying to theirperception of their current condition (better than usual, same as usual, worse thanusual, much worse than usual). Three types of scoring can be used to interpret thescale: Likert (0-1-2-3), GHQ (0-0-1-1), understood as a recent distress score, andCGHQ (0-1-1-1) for negative items and (0-0-1-1) for positive items, understood as achronic distress score. The thresholds identifying respondents with severepsychological distress not only vary with the scoring method, but also acrosspopulations. The GHQ and CGHQ scoring methods were employed in the presentresearch. The GHQ scoring method was selected because it had been used in variousstudies reporting a stable cut-score of 11/12 (Goldberg and Williams 1991). A score >12 identified individuals who were likely to have experienced distress of late. TheCGHQ scoring method was used, as it tends to produce a less skewed distribution.This is useful for parametric analyses and, as some studies have shown, it also tendsto increase sensitivity of the instrument (Goldberg & Williams 1991, Finlay-Jones1986).
The LSI defence mechanisms measure was developed on the basis of psychoanalytictheory and empirical research (Conte & Apter 1995, Plutchik, Kellerman & Conte
40 •
LEONID GREBENNIKOV AND MARK WIGGINS

1979). Its 97 items are grouped into eight scales: compensation (includingidentification and fantasy), denial, displacement, intellectualisation (includingsublimation, undoing, and rationalization), projection, reaction formation, regression(including acting out), and repression (including isolation and introjection). Eachscale contains from 10 to 14 items describing feelings, ideas, and behaviours that arepresumed to represent the eight defence mechanisms. For each item, respondents areasked to indicate whether it is usually true for them by checking “Yes” (1) or “No”(0)”. A total score on the use of defences can also be calculated. Normative dataderived from a sample of 147 adults is available as both percentiles and T-scores witha mean of 50 and a standard deviation of 15. The variation in Cronbach’s alphas forthe scales (range = .30 to .86) the authors explain by the fact that some scales are, bydesign, multidimensional as are the defences they represent. In order to combineseveral concepts or clusters of items into a single scale a certain amount of internalconsistency for that scale had to be sacrificed.
The three standardized self-report instruments represent methodologically differentapproaches to the assessment of perceived stress. While the PSQ items are mainlyunambiguous statements relating to feelings and behaviour under stress (“I makeerrors or mistakes at my work”; “Lately I am easily irritated”; “I have troubles fallingand staying asleep”), the GHQ and LSI items are less explicit. Respondents are notalways consciously aware that they are under stress. For example, Evans & Johnson(2000) have found that individuals in noisy settings do not necessarily report greaterlevels of stress than those in relatively quiet settings, while physiological tests suggestthat there is a stress-related response.
In comparison to the PSQ, the GHQ tends to focus, to a greater extent, on somaticsymptoms associated with psychological disturbance (“Have you recently beengetting a feeling of tightness or pressure in your head?”; “Have you recently beensweating a lot?”). Scores on a shortened version of GHQ have been predicted byteachers’ distress and job dissatisfaction (Galloway et al. 1984a, Finlay-Jones 1986).
If stress is constant and it is not possible for a person to exercise control over it, thereis evidence to suggest that they need excessive recourse to psychological mechanismsto ward off unacceptable feelings (Conte & Apter 1995, Doherty 1999, Evans &Johnson 2000, Plutchik 1995). Items of the LSI test are constructed allowing for thefact that “most individuals can report their own feelings and can describe behaviourthat reflects their own ego defences, even though they cannot interpret the dynamicmeanings of such behaviour” (Plutchik, Kellerman & Conte 1979, p.236). (Forexample, “I am free of prejudice”, representing denial; “I believe people will takeadvantage of you if you are not careful”, representing projection; “I get irritable whenI don’t get attention”, representing regression.)
•41
PSYCHOLOGICAL EFFECTS OF CLASSROOM NOISE
Participants also completed a background data sheet that, apart from the demographicdetails, contained a multiple-response, open-ended question concerning the mainsources of noise in their classroom(s). The respondents were not asked to rate thesesources.
ProcedureThe preschools were visited to monitor participants’ noise exposure, to keep a log torelate the data to actual sounds and activities, and to administer the questionnaires.Measurements of noise exposure were conducted by fitting a personal soundexposure meter (dose badge) to staff members for the duration of their working day.Staff noise exposures were automatically logged by these means starting from 8.45-9.00am when direct supervision began, throughout morning sessions (9.00am to11.30am), lunch breaks, afternoon sessions (12.30pm to 3.00pm), and ending atapproximately 3.15pm when all students were picked up. This totalled 5-5.5 contacthours and about 6 hours of monitoring time overall. The monitoring was conductedon regular, ordinary days in the absence of any special events or outings, and thequestionnaires were administered out of hours. All responses were treatedconfidentially.
Results
Noise ExposureOf the 25 preschool teaching staff monitored, the highest individual noise exposurelevels were 85.0, 85.1, 85.8, and 86.1 dB during the six-hour workday. These valueswere projected over eight hours, assuming that the remainder of the eight-hourreference period was quiet, and resulted in daily equivalent exposures of 84.1, 84.2,84.6, and 85.3 dB respectively. Thus, one teacher exceeded the Australian OH&S limitof 85 dB and three staff approached this limit. These exposures corresponded to 70-103% of the noise dose that is considered harmful. Nine staff recorded peak noise ratesthat exceeded the maximum permissible level of 140 dB for peak noise. In total, 10 ofthe staff evaluated were subjected to noise beyond the maximum acceptable levelsunder Australian standards. Twenty-three teachers were subjected to daily noiseexposure over 75 dB. In the process of data screening, it was found that the peak noiserecorded by the badge was, in some cases, an artifact due to knocking the microphone.Consequently, we disregarded five of the fourteen peak noise cases where the datawere inconsistent with the nature of the activities being observed or recorded at thetime. The other nine cases were considered accurate reflections of the actual noisebeing experienced at the time, for example, while a staff member was comforting adistressed student screaming close to the ear of the teacher (see Figure 1).
42 •
LEONID GREBENNIKOV AND MARK WIGGINS
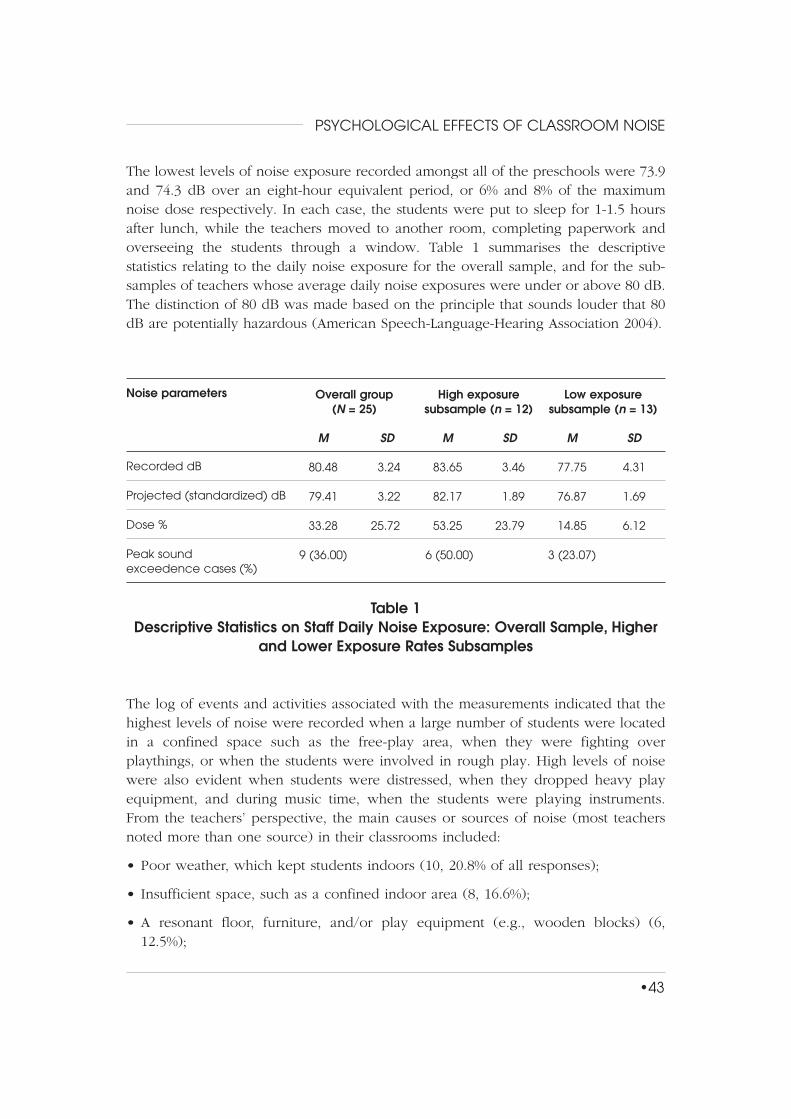
The lowest levels of noise exposure recorded amongst all of the preschools were 73.9and 74.3 dB over an eight-hour equivalent period, or 6% and 8% of the maximumnoise dose respectively. In each case, the students were put to sleep for 1-1.5 hoursafter lunch, while the teachers moved to another room, completing paperwork andoverseeing the students through a window. Table 1 summarises the descriptivestatistics relating to the daily noise exposure for the overall sample, and for the sub-samples of teachers whose average daily noise exposures were under or above 80 dB.The distinction of 80 dB was made based on the principle that sounds louder that 80dB are potentially hazardous (American Speech-Language-Hearing Association 2004).
Table 1Descriptive Statistics on Staff Daily Noise Exposure: Overall Sample, Higher
and Lower Exposure Rates Subsamples
The log of events and activities associated with the measurements indicated that thehighest levels of noise were recorded when a large number of students were locatedin a confined space such as the free-play area, when they were fighting overplaythings, or when the students were involved in rough play. High levels of noisewere also evident when students were distressed, when they dropped heavy playequipment, and during music time, when the students were playing instruments.From the teachers’ perspective, the main causes or sources of noise (most teachersnoted more than one source) in their classrooms included:
• Poor weather, which kept students indoors (10, 20.8% of all responses);
• Insufficient space, such as a confined indoor area (8, 16.6%);
• A resonant floor, furniture, and/or play equipment (e.g., wooden blocks) (6,12.5%);
•43
PSYCHOLOGICAL EFFECTS OF CLASSROOM NOISE
Overall group(N = 25)
High exposuresubsample (n = 12)
Low exposuresubsample (n = 13)
Noise parameters
Recorded dB
Projected (standardized) dB
Dose %
Peak soundexceedence cases (%)
SD
3.24
3.22
25.72
SD
3.46
1.89
23.79
SD
4.31
1.69
6.12
M
80.48
79.41
33.28
9 (36.00)
M
83.65
82.17
53.25
6 (50.00)
M
77.75
76.87
14.85
3 (23.07)
• Distressed students (6, 12.5%);
• Outside noises from traffic or a nearby school (5, 10.4%);
• Over-exuberant students or those with behavioural problems (4, 8.3%);
• Noisy indoor activities (e.g., assemblies, music, bells) (4, 8.3%);
• Air conditioners (4, 8.3%); and
• Alarms sounding on exit doors (1, 2.1%).
The time histories also suggested that afternoon sessions were generally as noisy asmorning sessions, and that noise levels did not always decrease during lunchtime.Anecdotal reports from two staff revealed that the staff rooms in which they had lunchwere as noisy as the classrooms (e.g., see Figure 1).
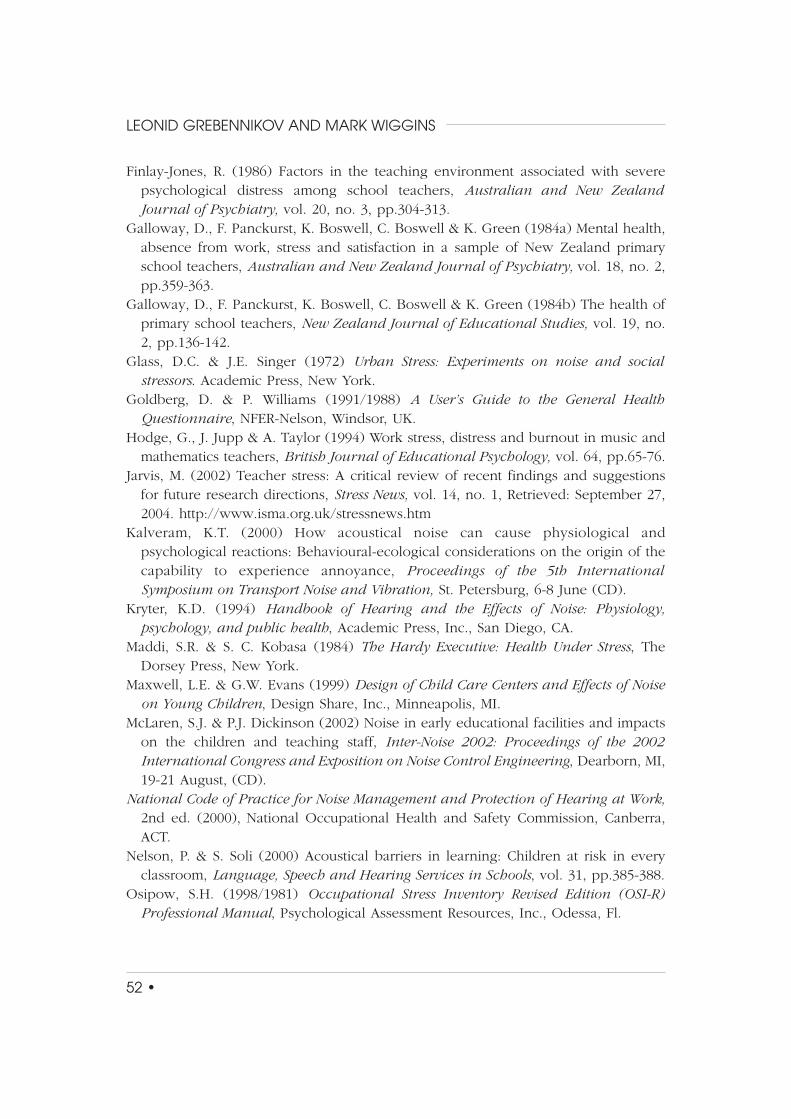
Psychological InstrumentsTable 2 lists the mean scores and standard deviations for the four scales, distributedacross all participants, and across high and low exposure subsamples (defined asabove or below 80 decibels). In the case of the Personal Strain Questionnaire (PSQ)and the eight scales of the Life Style Index (LSI), the data are expressed in terms ofT-scores (female normative sample and generic norms respectively). In the case of theGeneral Health Questionnaire (GHQ), two scoring methods were used (chronicdistress and recent distress). The GHQ (recent distress) scoring method was used todetermine the number of participants per group who exceeded the cut-score of 11/12.Data for the remaining instruments were distributed normally.
To determine whether differences between participants’ scores were evident on thebasis of noise exposure, an independent t test was conducted with high and lowlevels of noise exposure as the independent variable. Although the sample sizes werelimited, the t test was still considered more informative than a simple visual displayof the mean scores. The results indicated that, in comparison with participants in thelow noise exposure subgroup, participants in the high exposure subgroup obtainedsignificantly higher scores on the interpersonal strain dimension of the PSQ (t(23) =2.12, p = .04), and the regression and displacement dimensions of the LSI (t(23) =2.17, p = .04; t(23) = 2.56, p = .02). No significant differences were evident for theremaining dimensions of the instruments. The participants in the high noise exposuresubgroup recorded higher scores on the chronic distress dimension of the GHQ thanthose in the low exposure subgroup, although it should be noted that the differencewas not statistically significant (t(23) = 1.76, p = .09).
44 •
LEONID GREBENNIKOV AND MARK WIGGINS
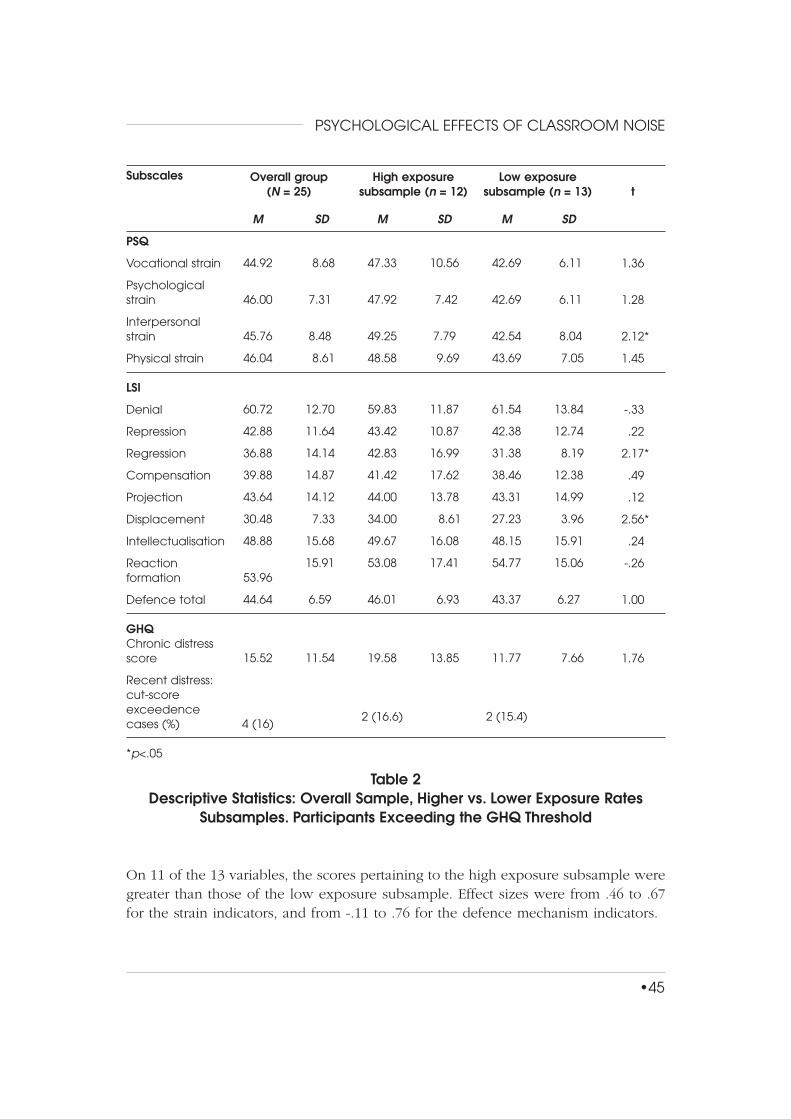
Table 2 Descriptive Statistics: Overall Sample, Higher vs. Lower Exposure Rates
Subsamples. Participants Exceeding the GHQ Threshold
On 11 of the 13 variables, the scores pertaining to the high exposure subsample weregreater than those of the low exposure subsample. Effect sizes were from .46 to .67for the strain indicators, and from -.11 to .76 for the defence mechanism indicators.
•45
PSYCHOLOGICAL EFFECTS OF CLASSROOM NOISE
Overall group(N = 25)
High exposuresubsample (n = 12)
Low exposuresubsample (n = 13)
Subscales
PSQ
Vocational strain
Psychologicalstrain
Interpersonalstrain
Physical strain
LSI
Denial
Repression
Regression
Compensation
Projection
Displacement
Intellectualisation
Reactionformation
Defence total
GHQChronic distressscore
Recent distress:cut-scoreexceedencecases (%)
*p<.05
SD
8.68
7.31
8.48
8.61
12.70
11.64
14.14
14.87
14.12
7.33
15.68
15.91
6.59
11.54
SD
10.56
7.42
7.79
9.69
11.87
10.87
16.99
17.62
13.78
8.61
16.08
17.41
6.93
13.85
SD
6.11
6.11
8.04
7.05
13.84
12.74
8.19
12.38
14.99
3.96
15.91
15.06
6.27
7.66
M
44.92
46.00
45.76
46.04
60.72
42.88
36.88
39.88
43.64
30.48
48.88
53.96
44.64
15.52
4 (16)
M
47.33
47.92
49.25
48.58
59.83
43.42
42.83
41.42
44.00
34.00
49.67
53.08
46.01
19.58
2 (16.6)
M
42.69
42.69
42.54
43.69
61.54
42.38
31.38
38.46
43.31
27.23
48.15
54.77
43.37
11.77
2 (15.4)
t
1.36
1.28
2.12*
1.45
-.33
.22
2.17*
.49
.12
2.56*
.24
-.26
1.00
1.76
46 •
LEONID GREBENNIKOV AND MARK WIGGINSTa
ble
3C
orr
ela
tions
of A
ll St
udy
Varia
ble
s
Varia
ble
1.N
oise
do
se
2.A
ge
3.Te
ac
hin
g
exp
erie
nc
e
4.V
oc
atio
na
l str
ain
5.P
syc
ho
log
ica
l str
ain
6.In
terp
ers
on
al s
tra
in
7.P
hysic
al s
tra
in
8.C
hro
nic
dist
ress
9.D
en
ial
10.
Re
pre
ssio
n
11.
Re
gre
ssio
n
12.
Co
mp
en
satio
n
13.
Pro
jec
tion
14.
Disp
lac
em
en
t
15.
Inte
llec
tua
lisa
tion
16.
Re
ac
tion
form
atio
n
17.
De
fen
ce
to
tal
* p<
.05.
**p
<.0
1.
1 – -.22
-.13 .3
5
.31
51**
.13
.31
-.13 .1
3
.54*
*
.13
.07
.45*
.11
.00
.30
2 – .68*
*
.09
.23
-.16
-.05 .1
7
-.11 .0
6
-.25
-.16
-.00
-.15 .0
4
.24
-.08
3 – .32
.25
-.10
-.01 .2
8
-.27 .0
7
-.23
-.28 .0
1
.01
-.35 .3
0
-.19
4 –
51**
.66*
*
.43*
.66*
*
-.24 .2
6
.41*
.16
.20
.27
-.24
.38
.29
5 – .55*
*
.51*
*
.67*
*
-.04 .0
2
.50*
.23
.21
.31
-.13 .1
3
.29
6 – .59*
*
.65*
*
.03
-.11 .6
0**
.24
.04
.45*
-.16 .1
9
.29
7 – .82*
*
-.11
-.01 .6
2**
.59*
*
.43*
.61*
*
.19
.17
.61*
*
8 – -.25
.13
.57*
*
.40*
.46*
.66*
*
.03
.33
.56*
*
9 – .11
-.07
-.01
-.25
-.22
-.06
-.09 .1
0
10 – -.18
-.08 .1
9
-.18
-.03 .3
1
.29
11 – .61*
*
.36
.71*
*
.14
.05
.63*
*
12 – .41*
.60*
*
.43*
-.21 .6
8**
13 – .56*
*
.16
.31
.69*
*
14 – .23
.10
.65*
*
15 – .01
.51*
*
16 –
.41*

Effect size for the chronic distress indicator was substantial at .70. However, all scoresof both groups were within normal limits. Overall group T-scores on the PSQsubscales did not reveal any differences between the teachers and the normativesample, all being between 44.9T and 46.0T. Four (16%) of all participants exceededthe GHQ threshold indicating serious psychological distress. The LSI results comparedwith the norm group whose means would be around 50T, showed that theparticipants in the present study scored higher on denial 60.7T (effect size of .71) andconsiderably lower than the norm on displacement 30.4 T (effect size of -1.30).
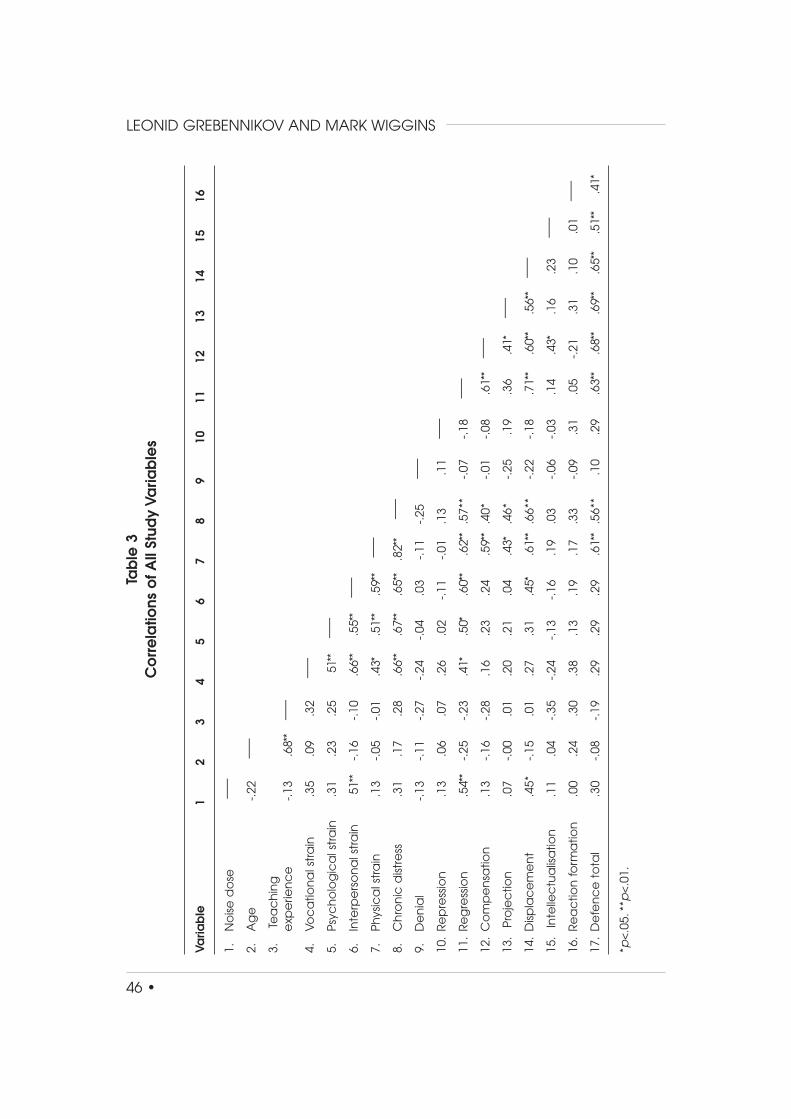
Pearson product-moment correlations between the scores on the 13 dependentvariables, daily noise dose, age of participants, and years of work experience usingalpha levels of .01 and .05 are shown in Table 3. Statistically significant positivecorrelations were evident between noise dose and interpersonal strain (r(23) = .51, p< .01), the defences of regression (r(23) = .54, p < .01) and displacement (r(23) = .45,p < .05). Age and teaching experience did not relate significantly to any variablesexcept to each other, and all measures of perceived stress correlated significantly witheach other. Physical strain and chronic distress also correlated positively andsignificantly with four out of eight defence mechanisms: Regression, compensation,projection and displacement, and with the use of defences overall. The defencemechanisms of denial, repression, intellectualisation and reaction formation failed toreach significance in relation to either of stress measures, with denial being the onlydefence relating negatively to all stress measures except interpersonal strain.
To test whether the stress parameters could be influenced by various possiblyexplanatory variables, we regressed each stress measure on noise exposure, age,length of service, and denial, using a stepwise procedure. This strategy was designedto remove “weak” candidate predictors from the models and identify “stronger”predictors, if any existed. Due to the limited sample size, two predictor variables at atime were tested for their effect on each response variable consecutively. Table 4 liststhose stress measures which appeared to significantly relate to the predictors:Vocational strain and interpersonal strain. The best prediction of vocational strain wasachieved by the combination of noise dose and teaching experience. Noise doseemerged as the only significant predictor of interpersonal strain. Neither denial norage contributed to the prediction of the stress measures.
An analogical stepwise procedure was used to relate the overall use of defencemechanisms to the objective variables and the measures of perceived stress. The bestsets of predictor variables were selected with the order of stepping specified by theprocedure. The results indicated that the combination of physical strain and noisedose accounted for 42% of the variance in the total use of defence mechanisms (SeeTable 4). Age, vocational strain, interpersonal strain, psychological strain, and chronic
•47
PSYCHOLOGICAL EFFECTS OF CLASSROOM NOISE
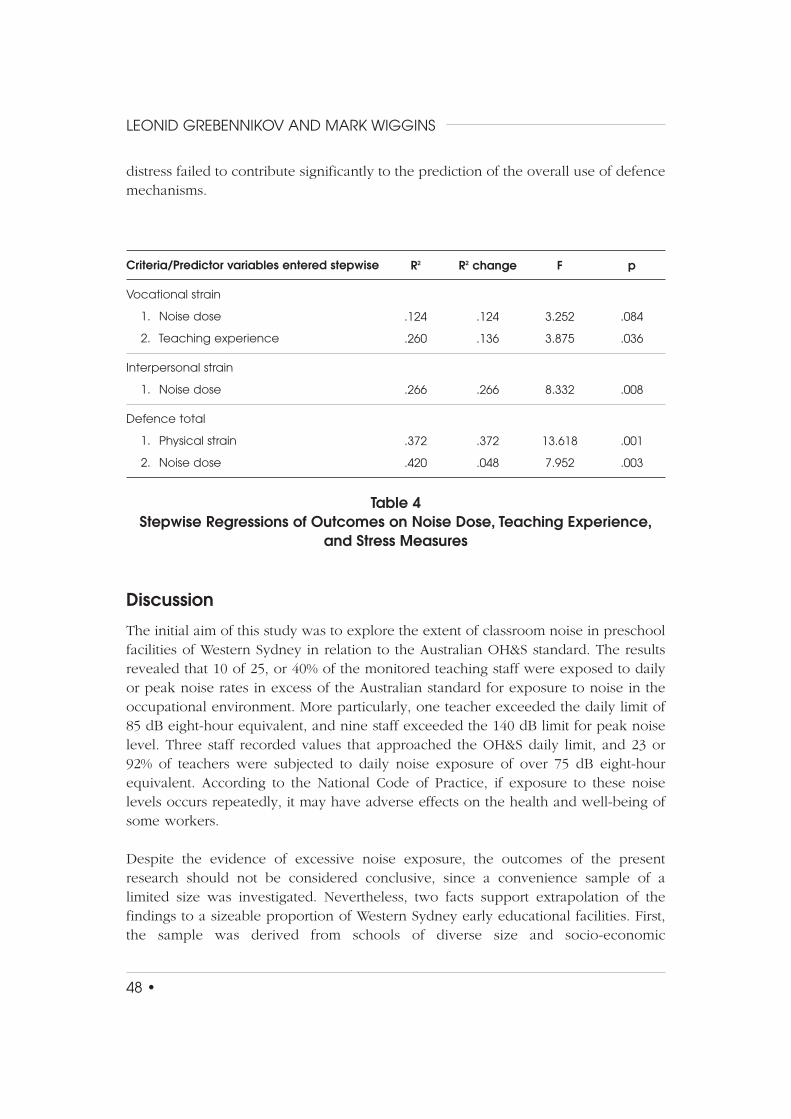
distress failed to contribute significantly to the prediction of the overall use of defencemechanisms.
Table 4 Stepwise Regressions of Outcomes on Noise Dose, Teaching Experience,
and Stress Measures
Discussion
The initial aim of this study was to explore the extent of classroom noise in preschoolfacilities of Western Sydney in relation to the Australian OH&S standard. The resultsrevealed that 10 of 25, or 40% of the monitored teaching staff were exposed to dailyor peak noise rates in excess of the Australian standard for exposure to noise in theoccupational environment. More particularly, one teacher exceeded the daily limit of85 dB eight-hour equivalent, and nine staff exceeded the 140 dB limit for peak noiselevel. Three staff recorded values that approached the OH&S daily limit, and 23 or92% of teachers were subjected to daily noise exposure of over 75 dB eight-hourequivalent. According to the National Code of Practice, if exposure to these noiselevels occurs repeatedly, it may have adverse effects on the health and well-being ofsome workers.
Despite the evidence of excessive noise exposure, the outcomes of the presentresearch should not be considered conclusive, since a convenience sample of alimited size was investigated. Nevertheless, two facts support extrapolation of thefindings to a sizeable proportion of Western Sydney early educational facilities. First,the sample was derived from schools of diverse size and socio-economic
48 •
LEONID GREBENNIKOV AND MARK WIGGINS
R2
.124
.260
.266
.372
.420
R2 change
.124
.136
.266
.372
.048
F
3.252
3.875
8.332
13.618
7.952
p
.084
.036
.008
.001
.003
Criteria/Predictor variables entered stepwise
Vocational strain
1. Noise dose
2. Teaching experience
Interpersonal strain
1. Noise dose
Defence total
1. Physical strain
2. Noise dose
characteristics distributed across an area of approximately 160 square kilometres.Second, anecdotal reports from many teachers revealed that the monitoring days werequieter than usual and no-one suggested otherwise. Conducting more than onemonitoring session per participant may be useful in future studies as a more reliablemethod of evaluation of typical noise exposure.
Importantly, the results pertaining to noise exposure that were obtained in the presentstudy were consistent with the results of a similar study in New Zealand (McLaren &Dickinson 2002). Therefore, it might be argued that the results reflect a much broaderissue across developed nations in which early childhood education is an establishedpractice. Further research concerning noise in all types of early educational settings,and across different nations, may be valuable in understanding both the scope of theproblem and possible remedies. For example, a larger per-person area in theclassroom might assist to avoid crowding and conflicts and, thereby, may reducenoise. Sound-absorbing floor, acoustic ceilings and windows, sound dampers onfurniture legs, and the careful selection of low-noise play equipment may also reduceexposure for both staff and students. Some of these measures would be less costlythan others and could easily be put into effect at the school level, while others mayrequire policy decisions.
The second aim of the present research was to investigate preschool teachers’perceived stress and its relationship to classroom noise. No significant differences inlevels of personal strain were evident between the teachers and the PSQ normativesample. The teachers’ mean scores (converted to T-scores) were similar to the normsfor all four subscales. Further, the PSQ mean scores obtained in the present researchshowed no prevalence over the corresponding means of 37 Australian non-teachingfemale professionals (Pithers & Fogarty 1995). This implies that, on the average, thepreschool teachers feel personal strain similarly or less than the community generally.At the same time, 16% of respondents scored above the GHQ threshold, indicatingsevere psychological distress. This compares with 9% for the general Australianpopulation cited by Finlay-Jones (1986). Finlay-Jones (1986) also reported that 17% ofAustralian teachers, mainly from primary and secondary sectors, exceeded the GHQthreshold, which is consistent with the outcome of the present research.
The apparent conflict between the PSQ and GHQ scores may have resulted from theGHQ questions being less explicitly focused on supraliminal stress in comparison tothe questions in the PSQ. Participants may have felt less able to recognise and/oradmit that they were under stress when asked in a straightforward way, but may haveresponded more sincerely to less direct questions concerning the subject. The higherteachers’ T-scores on denial in comparison to the LSI normative sample supports, atleast in part, the assumption that some teachers may be unwilling to recognise that
•49
PSYCHOLOGICAL EFFECTS OF CLASSROOM NOISE
they are under stress. In other words, they may use denial to a greater extent tocontrol their perception of stress. Contrary to expectations, denial did not show asignificant moderating effect on any of the stress measures. Nevertheless, it was theonly variable of all of the defence mechanisms in which a negative correlation wasevident with the majority of stress parameters.
On 11 of the 13 dependent variables, the scores of the high exposure subsample weregreater than those of the low exposure subsample. Effect sizes indicated that thestrain measures showed larger deviations between groups than most of the defencemeasures. Effect sizes may also suggest that the use of particular defence mechanismsunder elevated exposure to noise vary considerably across people, while theirperception of strain reliably increases with the higher exposure rate. Even though allscores of both subgroups were within normal limits, the results of multiple regressionanalyses indicated that the level of daily noise dose predicted subjective perceptionsof vocational strain, interpersonal strain, and overall defensive functioning.
These findings partially confirm the hypothesized relationship between the level ofpreschool teachers’ exposure to classroom noise and their perceived stress.Specifically, statistically significant positive relationship was evident between thedoses of noise to which staff were subjected and the level of interpersonal strain,understood as a disruption in interpersonal relationships and a tendency to withdrawfrom the social environment. Poor job satisfaction, attitudes, and performance, asattributes of vocational strain, are significantly associated with higher levels ofclassroom noise, in combination with longer periods of professional teaching. Theincrease in noise dose also appears to be associated with regression anddisplacement. These defence mechanisms imply tendencies to retreat under stress toearlier or more immature patterns of behaviour, such as crying, displaying temper, orblaming; and/or to discharge pent-up anger on irrelevant objects or people, includingoneself. The last interpretation, however, may not be a valid representationconsidering the fact that both the high exposure and the low exposure subsamplesscored well below the norm on displacement. In general terms, the differencesbetween the high and low exposure subsamples on all defence mechanisms but oneand on their total score suggest that teachers, who are exposed to relatively highernoise doses, may be more likely to be required to develop stress coping strategies.
It is important to note that noise dose emerged as the second most significantpredictor of total defensive functioning following physical strain. Therefore, it wouldappear that the combination of the tiring job and classroom noise may aggravateteachers’ worries about their physical well-being. This may explain, to some extent,the relatively greater recourse to psychological defence mechanisms.
50 •
LEONID GREBENNIKOV AND MARK WIGGINS

The results of this study should be interpreted with caution due to a number oflimitations, not least of which is the small sample size. The small size andconvenience character of the sample limited the research power and may haveimpacted the reliability of the outcomes. Further, the data on noise were obtained bymeans of a single monitoring session per participant during one school term, and thusmay not reflect typical exposure. Finally, only one type of early educational facilities,allegedly the “quietest” one, was investigated. Nevertheless, the research hasgenerated important pilot data suggesting a possible association between noise inpreschool settings and stress perceived by the teachers. The outcomes provide thebasis for a broader study to understand and manage classroom noise as an integralissue in early childhood education. This may include regular monitoring of teachingstaff in all types of early educational settings, and further investigation of all aspectsof noise in these facilities including per-person space in the classroom, the design ofpremises, furniture, ventilation, heating, and some educational trends.
References
American Speech – Language – Hearing Association (2004) Noise, Retrieved:December 10, 2004. http://www.asha.org/public/hearing/disorders/noise.htm
Bacon, N.M., S.F. Bacon, J.H. Atkinson, M.A. Slater, T.L. Patterson, I. Grant & S.R.Garfin (1994) Somatization symptoms in chronic low back pain patients,Psychosomatic Medicine, vol. 56, pp.118-127.
Barsky, A.J. (1988) Worried Sick, Little Brown, Boston. Baxter, R.A. (2000) Environmental Factors in Children Behaviours in Early Childhood
Settings, Unpublished doctoral dissertation, University of Newcastle, Australia.Conte, H.R. & A. Apter (1995) The life style index: A self-report measure of ego-
defences, in H.R. Conte & R. Plutchik, eds., Ego Defences: Theory andmeasurement, pp.179-201, John Wiley, New York.
Doherty, G.W. (1999) Disaster work and stress, Proceedings of the Rocky MountainRegion Disaster Mental Health Conference, Laramie, Wyoming, 11-14 February,Retrieved: May 3, 2004. http://www.angelfire.com/biz/odoc/disasterstress.html
Donoghue, P. & M. Siegel (1994) Sick and Tired of Feeling Sick and Tired: Living withinvisible chronic illness, Norton Press, New York.
Evans G.W. & D. Johnson (2000) Stress and open office noise, Journal of AppliedPsychology, vol. 85, no. 5, pp.779-783.
Evans, G.W. & S.J. Lepore (1993) Nonauditory effects of noise on children: A criticalreview, Children’s Environments, vol. 10, no. 1, pp.31-51.
Evans, G.W. & L.E. Maxwell (1997) Chronic noise exposure and reading deficits: Themediating effects of language acquisition, Environment and Behavior, vol. 29, no.5, pp.638-656.
•51
PSYCHOLOGICAL EFFECTS OF CLASSROOM NOISE
Finlay-Jones, R. (1986) Factors in the teaching environment associated with severepsychological distress among school teachers, Australian and New ZealandJournal of Psychiatry, vol. 20, no. 3, pp.304-313.
Galloway, D., F. Panckurst, K. Boswell, C. Boswell & K. Green (1984a) Mental health,absence from work, stress and satisfaction in a sample of New Zealand primaryschool teachers, Australian and New Zealand Journal of Psychiatry, vol. 18, no. 2,pp.359-363.
Galloway, D., F. Panckurst, K. Boswell, C. Boswell & K. Green (1984b) The health ofprimary school teachers, New Zealand Journal of Educational Studies, vol. 19, no.2, pp.136-142.
Glass, D.C. & J.E. Singer (1972) Urban Stress: Experiments on noise and socialstressors. Academic Press, New York.
Goldberg, D. & P. Williams (1991/1988) A User’s Guide to the General HealthQuestionnaire, NFER-Nelson, Windsor, UK.
Hodge, G., J. Jupp & A. Taylor (1994) Work stress, distress and burnout in music andmathematics teachers, British Journal of Educational Psychology, vol. 64, pp.65-76.
Jarvis, M. (2002) Teacher stress: A critical review of recent findings and suggestionsfor future research directions, Stress News, vol. 14, no. 1, Retrieved: September 27,2004. http://www.isma.org.uk/stressnews.htm
Kalveram, K.T. (2000) How acoustical noise can cause physiological andpsychological reactions: Behavioural-ecological considerations on the origin of thecapability to experience annoyance, Proceedings of the 5th InternationalSymposium on Transport Noise and Vibration, St. Petersburg, 6-8 June (CD).
Kryter, K.D. (1994) Handbook of Hearing and the Effects of Noise: Physiology,psychology, and public health, Academic Press, Inc., San Diego, CA.
Maddi, S.R. & S. C. Kobasa (1984) The Hardy Executive: Health Under Stress, TheDorsey Press, New York.
Maxwell, L.E. & G.W. Evans (1999) Design of Child Care Centers and Effects of Noiseon Young Children, Design Share, Inc., Minneapolis, MI.
McLaren, S.J. & P.J. Dickinson (2002) Noise in early educational facilities and impactson the children and teaching staff, Inter-Noise 2002: Proceedings of the 2002International Congress and Exposition on Noise Control Engineering, Dearborn, MI,19-21 August, (CD).
National Code of Practice for Noise Management and Protection of Hearing at Work,2nd ed. (2000), National Occupational Health and Safety Commission, Canberra,ACT.
Nelson, P. & S. Soli (2000) Acoustical barriers in learning: Children at risk in everyclassroom, Language, Speech and Hearing Services in Schools, vol. 31, pp.385-388.
Osipow, S.H. (1998/1981) Occupational Stress Inventory Revised Edition (OSI-R)Professional Manual, Psychological Assessment Resources, Inc., Odessa, Fl.
52 •
LEONID GREBENNIKOV AND MARK WIGGINS

Pithers. R. & G. Fogarty (1995) Symposium on teacher stress: Occupational stress amongvocational teachers, British Journal of Educational Psychology, vol. 65, pp.3-14.
Plutchik, R., H. Kellerman & H.R. Conte (1979) A structural theory of ego defencesand emotions, in C.E. Izard, ed., Emotions in Personality and Psychopathology,pp.229-257, Plenum Press, New York.
Plutchik, R. (1995) A theory of ego defences, in H.R. Conte & R. Plutchik, eds., EgoDefences: Theory and Measurement, pp.13-37, John Wiley, New York.
Romanova, E. & L. Grebennikov (1996) The Ego Defence Mechanisms: Genesis,functioning, assessment, Talant, Moscow.
Selye, H. (1956) The Stress of Life, McGraw-Hill Book Co., New York. Smith, A., C. Brice, A. Collins, V. Matthews & R. McNamara (2000) The Scale of
Occupational Stress: A further analysis of the impact of demographic factors andtype of job (Health & Safety Executive contract research report No. 311/2000), HSEBooks, Sudbury, UK.
Sorkin, D. (2000) The classroom acoustical environment and Americans withdisabilities act, Language, Speech and Hearing Services in Schools, vol. 31, pp.356-361.
Warrilow, P., K. Fisher, K. Cummings, J. Sumsion & C. Beckett (2002) Early ChildhoodTeachers and Qualified Staff: A Report prepared for the NSW Department ofCommunity Services, Office of Childcare, University of New South Wales, SocialPolicy Research Centre, Sydney.
Wilder, J.F. & R. Plutchik (1984) Stress and psychiatry, in H.I. Kaplan & B.J. Sadock,eds., Comprehensive Textbook on Psychiatry: Vol. 2, 4th ed., pp.1198-1203, Williamsand Wilkins, Baltimore.
Wilhelm, K, J. Dewhurst-Savellis & G. Parker (2000) Teacher stress? An analysis ofwhy teachers leave and why they stay, Teachers and Teaching: Theory andPractice, vol. 6, no. 3, pp.292-304.
•53
PSYCHOLOGICAL EFFECTS OF CLASSROOM NOISE

54 •