Embed Size (px)
Citation preview
Psychometric Principles in Student Assessment
CSE Technical Report 583
Robert J. MislevyCRESST/University of Maryland
Mark R. Wilson, University of California at Berkeley
Kadriye Ercikan, University of British Columbia
Naomi Chudowsky, National Research Council
December 2002
Center for the Study of EvaluationNational Center for Research on Evaluation,
Standards, and Student TestingGraduate School of Education & Information Studies
University of California, Los AngelesLos Angeles, CA 90095-1522
(310) 206-1532

Project 3.6 Study Group Activity on Cognitive ValidityRobert J. Mislevy, Project Director CRESST/University of Maryland
Copyright © 2002 The Regents of the University of California
The work reported herein was supported under the Educational Research and Development CentersProgram, PR/Award Number R305B960002, as administered by the Office of Educational Researchand Improvement, U.S. Department of Education.
The findings and opinions expressed in this report do not reflect the positions or policies of theNational Institute on Student Achievement, Curriculum, and Assessment, the Office of EducationalResearch and Improvement, or the U.S. Department of Education.
3
PSYCHOMETRIC PRINCIPLES IN STUDENT ASSESSMENT1
Robert J. Mislevy
CRESST/University of Maryland
Mark R. Wilson
University of California at Berkeley
Kadriye Ercikan
University of British Columbia
Naomi Chudowsky
National Research Council
Abstract
In educational assessment, we observe what students say, do, or in a few particularcircumstances make, and attempt to infer what they know, can do, or haveaccomplished more generally. Some links in the chain of inference depend on statisticalmodels and probability-based reasoning, and it is with these links that terms such asvalidity, reliability, and comparability are typically associated—psychometric
principles, as it were. Familiar formulas and procedures from test theory provideworking definitions and practical tools for addressing these more broadly applicablequalities of the chains of argument from observations to inferences about students, asthey apply to familiar methods of gathering and using assessment data. This reporthas four objectives: It offers a framework for the evidentiary arguments that groundassessments, examines where psychometric principles fit in this framework, shows howfamiliar formulas apply these ideas to familiar forms of assessment, and looks aheadto extending the same principles to new kinds of assessments.
1 We are grateful for the suggestions of section editors George Madaus and Marguerite Clarke on anearlier version. The first author received support under the Educational Research and DevelopmentCenters Program, PR/Award Number R305B60002, as administered by the Office of EducationalResearch and Improvement, U.S. Department of Education. The second author received support fromthe National Science Foundation under grant No. ESI-9910154.

4
[V]alidity, reliability, comparability, and fairness are not just measurement issues, butsocial values that have meaning and force outside of measurement whereverevaluative judgments and decisions are made.
Messick, 1994, p. 2.
Overview
What are psychometric principles? Why are they important? How do weattain them? We address these questions from the perspective of assessment asevidentiary reasoning; that is, how we draw inferences about what studentsknow, can do, or understand, as more broadly construed from the handful ofparticular things they say, do, or make in an assessment setting. Messick (1989),Kane (1992), and Cronbach and Meehl (1955) show the deep insights that can begained from examining validity from such a perspective. We aim to extend theapproach to additional psychometric principles and bring out connections withassessment design and probability-based reasoning.
Seen through this lens, validity, reliability, comparability, and fairness (as i nthe quote from Messick, above) are properties of an argument—not formulas,models, or statistics per se. We’ll do two things, then, before we even introducestatistical models. We’ll look more closely at the nature of evidentiaryarguments in assessment, paying special attention to the role of standardization.And we’ll describe a framework that structures the evidentiary argument in agiven assessment, based on an evidence-centered design framework (Mislevy,Steinberg, & Almond, in press). In this way we may come to appreciatepsychometric principles without tripping over psychometric details.
Of course in practice we do use models, formulas, and statistics to examinethe degree to which an assessment argument possesses the salutarycharacteristics of validity, reliability, comparability, and fairness. So this reportdoes have to consider how these principles are addressed when one usesparticular measurement models to draw particular inferences, with particulardata, for particular purposes. To this end, we describe the role of probability-basedreasoning in the evidentiary argument, using classical test theory to illustrateideas. We then survey some widely used psychometric models, such as itemresponse theory and generalizability analysis, focusing on how each is used toaddress psychometric principles in different circumstances. We can’t provide a
5
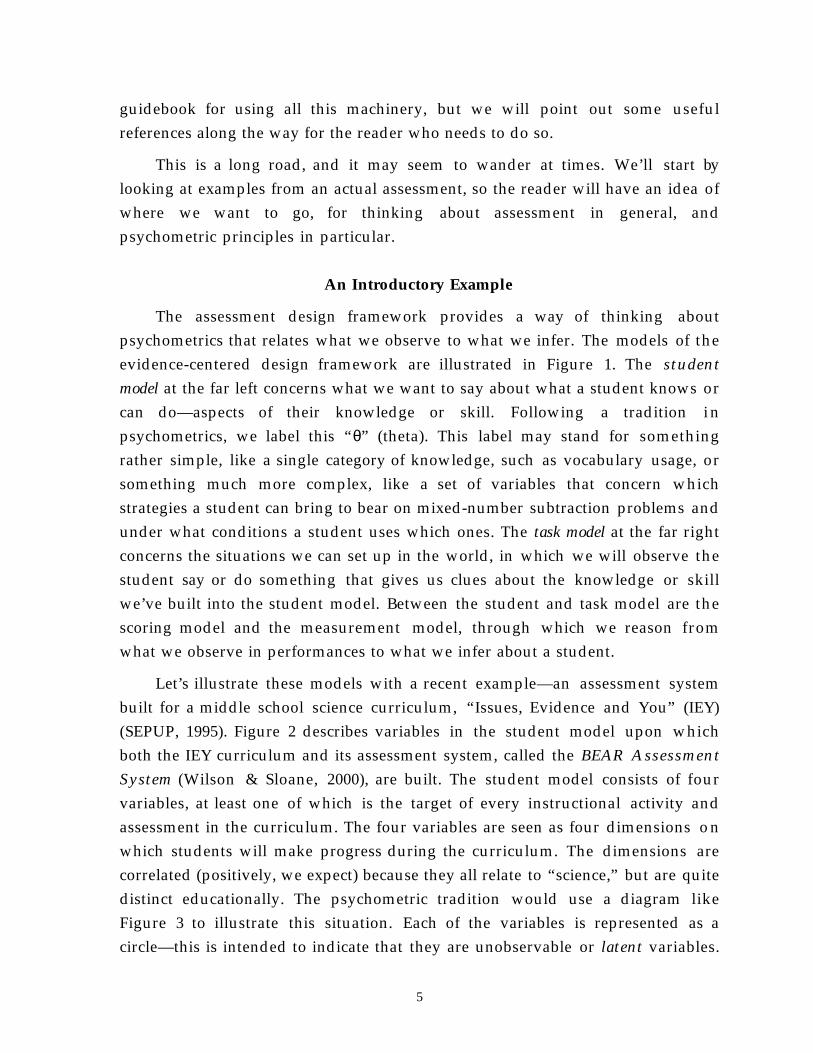
guidebook for using all this machinery, but we will point out some usefulreferences along the way for the reader who needs to do so.
This is a long road, and it may seem to wander at times. We’ll start bylooking at examples from an actual assessment, so the reader will have an idea ofwhere we want to go, for thinking about assessment in general, andpsychometric principles in particular.
An Introductory Example
The assessment design framework provides a way of thinking aboutpsychometrics that relates what we observe to what we infer. The models of theevidence-centered design framework are illustrated in Figure 1. The student
model at the far left concerns what we want to say about what a student knows orcan do—aspects of their knowledge or skill. Following a tradition i npsychometrics, we label this “θ” (theta). This label may stand for somethingrather simple, like a single category of knowledge, such as vocabulary usage, orsomething much more complex, like a set of variables that concern whichstrategies a student can bring to bear on mixed-number subtraction problems andunder what conditions a student uses which ones. The task model at the far rightconcerns the situations we can set up in the world, in which we will observe thestudent say or do something that gives us clues about the knowledge or skillwe’ve built into the student model. Between the student and task model are thescoring model and the measurement model, through which we reason fromwhat we observe in performances to what we infer about a student.
Let’s illustrate these models with a recent example—an assessment systembuilt for a middle school science curriculum, “Issues, Evidence and You” (IEY)(SEPUP, 1995). Figure 2 describes variables in the student model upon whichboth the IEY curriculum and its assessment system, called the BEAR Assessment
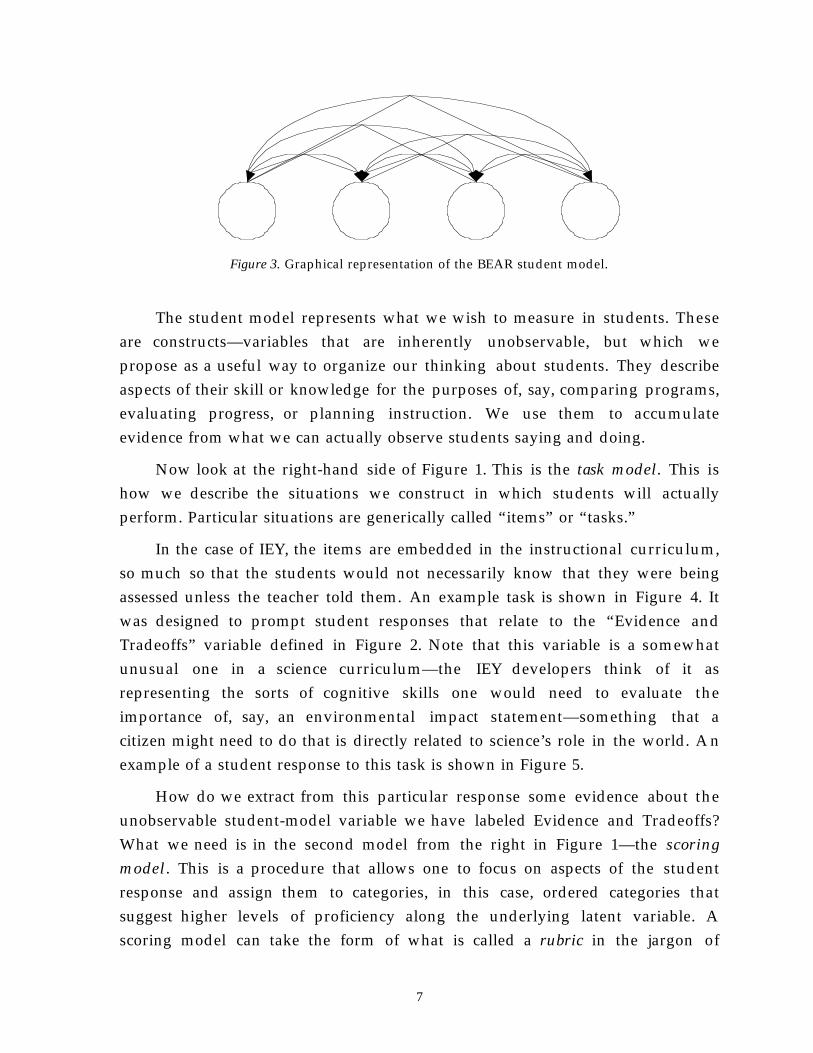
System (Wilson & Sloane, 2000), are built. The student model consists of fourvariables, at least one of which is the target of every instructional activity andassessment in the curriculum. The four variables are seen as four dimensions onwhich students will make progress during the curriculum. The dimensions arecorrelated (positively, we expect) because they all relate to “science,” but are quitedistinct educationally. The psychometric tradition would use a diagram likeFigure 3 to illustrate this situation. Each of the variables is represented as acircle—this is intended to indicate that they are unobservable or latent variables.

6
They are connected by curving lines—this is intended to indicate that they arenot necessarily causally related to one another (at least as far as we are modelingthat relationship), but they are associated. (Usually we use a correlationcoefficient to express that association.)
Student Model
θ1
Evidence Model(s)
Measurement
Model
Scoring
Model
X1
Task Model(s)
1. xxxxxxxx 2. xxxxxx xx
3. xxxxxxxx 4. xxxxxx xx
5. xxxxxxxx 6. xxxxxx xx
7. xxxxxxxx 8. xxxxxx xx
θ3
θ4
θ5
θ2
θ3
θ4
θ5X2
X1
X2
Figure 1. General form of the assessment design models.
Understanding Concepts (U)—Understanding scientific concepts (suchas properties and interactions of materials, energy, or thresholds) inorder to apply the relevant scientific concepts to the solution ofproblems. This variable is the IEY version of the traditional “sciencecontent,” although this content is not just “factoids.”Designing and Conducting Investigations (I)—Designing a scientificexperiment; carrying through a complete scientific investigation;performing laboratory procedures to collect data; recording andorganizing data; and analyzing and interpreting results of anexperiment. This variable is the IEY version of the traditional “scienceprocess.”Evidence and Tradeoffs (E)—Identifying objective scientific evidence,as well as evaluating the advantages and disadvantages of differentpossible solutions to a problem based on the available evidence.Communicating Scientific Information (C)—Organizing andpresenting results in a way that is free of technical errors and effectivelycommunicates with the chosen audience.
Figure 2. The variables in the student model for the BEAR “Issues, Evidence, and You”example.
7
Figure 3. Graphical representation of the BEAR student model.
The student model represents what we wish to measure in students. Theseare constructs—variables that are inherently unobservable, but which wepropose as a useful way to organize our thinking about students. They describeaspects of their skill or knowledge for the purposes of, say, comparing programs,evaluating progress, or planning instruction. We use them to accumulateevidence from what we can actually observe students saying and doing.
Now look at the right-hand side of Figure 1. This is the task model . This ishow we describe the situations we construct in which students will actuallyperform. Particular situations are generically called “items” or “tasks.”
In the case of IEY, the items are embedded in the instructional curriculum,so much so that the students would not necessarily know that they were beingassessed unless the teacher told them. An example task is shown in Figure 4. Itwas designed to prompt student responses that relate to the “Evidence andTradeoffs” variable defined in Figure 2. Note that this variable is a somewhatunusual one in a science curriculum—the IEY developers think of it asrepresenting the sorts of cognitive skills one would need to evaluate theimportance of, say, an environmental impact statement—something that acitizen might need to do that is directly related to science’s role in the world. A nexample of a student response to this task is shown in Figure 5.
How do we extract from this particular response some evidence about theunobservable student-model variable we have labeled Evidence and Tradeoffs?What we need is in the second model from the right in Figure 1—the scoring
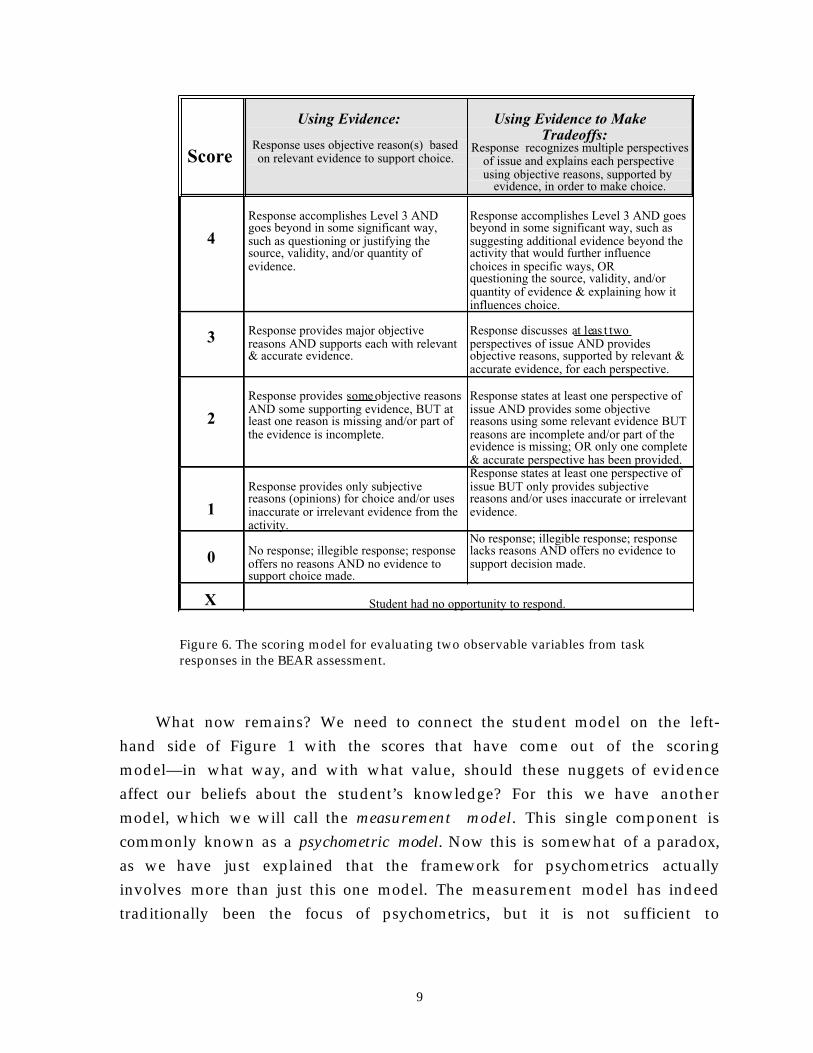
model . This is a procedure that allows one to focus on aspects of the studentresponse and assign them to categories, in this case, ordered categories thatsuggest higher levels of proficiency along the underlying latent variable. Ascoring model can take the form of what is called a rubric in the jargon of

8
assessment, and in IEY does take that form (although it is called a scoring guide).The rubric for the Evidence and Tradeoffs variable is shown in Figure 6. Itenables a teacher or a student to recognize and evaluate two distinct aspects ofresponses to the questions related to the Evidence and Tradeoffs variable. Inaddition to the rubric, scorers have exemplars of student work available to them,complete with adjudicated scores and explanation of the scores. They also have amethod (called assessment moderation) for training people to use the rubric. Allthese elements together constitute the scoring model. So, what we put in to thescoring model is a student’s performance; what we get out is one or more scoresfor each task, and thus a set of scores for a set of tasks.
2. You are a public health official who works in the Water Department. Yoursupervisor has asked you to respond to the public's concern about waterchlorination at the next City Council meeting. Prepare a written responseexplaining the issues raised in the newspaper articles. Be sure to discuss theadvantages and disadvantages of chlorinating drinking water in yourresponse, and then explain your recommendation about whether the watershould be chlorinated.
Figure 4. An example of a task directive from the BEAR assessment.
“As an edjucated employee of the Grizzelyville water company, I am wellaware of the controversy surrounding the topic of the chlorination of ourdrinking water. I have read the two articals regarding the pro’s and cons ofchlorinated water. I have made an informed decision based on the evidencepresented the articals entitled “The Peru Story” and “700 Extra People Maybet Cancer in the US.” It is my recommendation that our towns water bechlorin treated. The risks of infecting our citizens with a bacterial diseeasesuch as cholera would be inevitable if we drink nontreated water. Our townshould learn from the country of Peru. The artical “The Peru Story” readsthousands of inocent people die of cholera epidemic. In just months 3,500people were killed and more infected with the diease. On the other hand i fwe do in fact chlorine treat our drinking water a risk is posed. An increase inbladder and rectal cancer is directly related to drinking chlorinated water.Specifically 700 more people in the US may get cancer. However, thecholera risk far outweighs the cancer risk for 2 very important reasons. Manymore people will be effected by cholera where as the chance of one of ourcitizens getting cancer due to the water would be very minimal. Also cholerais a spreading diease where as cancer is not. If our town was infected withcholera we could pass it on to millions of others. And so, after carefulconsideration it is my opion that the citizens of Grizzelyville drink chlorinetreated water.”
Figure 5. An example of a student response from the BEAR assessment.
9
Score
Using Evidence:
Response uses objective reason(s) based
on relevant evidence to support choice.
Using Evidence to MakeTradeoffs:
Response recognizes multiple perspectives
of issue and explains each perspective
using objective reasons, supported byevidence, in order to make choice.
4
Response accomplishes Level 3 ANDgoes beyond in some significant way,
such as questioning or justifying thesource, validity, and/or quantity of
evidence.
Response accomplishes Level 3 AND goesbeyond in some significant way, such as
suggesting additional evidence beyond theactivity that would further influence
choices in specific ways, ORquestioning the source, validity, and/or
quantity of evidence & explaining how it
influences choice.
3 Response provides major objective
reasons AND supports each with relevant& accurate evidence.
Response discusses at leas t two
perspectives of issue AND providesobjective reasons, supported by relevant &
accurate evidence, for each perspective.
2
Response provides some objective reasons
AND some supporting evidence, BUT atleast one reason is missing and/or part of
the evidence is incomplete.
Response states at least one perspective of
issue AND provides some objectivereasons using some relevant evidence BUT
reasons are incomplete and/or part of theevidence is missing; OR only one complete
& accurate perspective has been provided.
1
Response provides only subjectivereasons (opinions) for choice and/or uses
inaccurate or irrelevant evidence from the
activity.
Response states at least one perspective of
issue BUT only provides subjectivereasons and/or uses inaccurate or irrelevant
evidence.
0 No response; illegible response; response
offers no reasons AND no evidence tosupport choice made.
No response; illegible response; responselacks reasons AND offers no evidence to
support decision made.
X Student had no opportunity to respond.
Figure 6. The scoring model for evaluating two observable variables from taskresponses in the BEAR assessment.
What now remains? We need to connect the student model on the left-hand side of Figure 1 with the scores that have come out of the scoringmodel—in what way, and with what value, should these nuggets of evidenceaffect our beliefs about the student’s knowledge? For this we have anothermodel, which we will call the measurement model . This single component iscommonly known as a psychometric model. Now this is somewhat of a paradox,as we have just explained that the framework for psychometrics actuallyinvolves more than just this one model. The measurement model has indeedtraditionally been the focus of psychometrics, but it is not sufficient to

10
understand psychometric principles. The complete set of elements, the fullevidentiary argument, must be addressed.
Figure 7 shows the relationships in the measurement model for the sampleIEY task. Here the student model (first shown in Figure 3) has been augmentedwith a set of boxes. The boxes are intended to indicate that they are observablerather than latent, and these are in fact the scores from the scoring model for thistask. They are connected to the Evidence and Tradeoffs student-model variablewith straight lines, meant to indicate a causal (though probabilistic) relationshipbetween the variable and the observed scores, and the causality is posited to runfrom the student-model variables to the scores. Said another way, what thestudent knows and can do, as represented by the variables of the student model,determines how likely it is that the students will make right answers rather thanwrong ones, carry out sound inquiry rather than founder, and so on, in eachparticular task they encounter. In this example, both observable variables areposited to depend on the same aspect of knowledge, namely Evidence andTradeoffs. A different task could have more or fewer observables, and eachwould depend on one or more student-model variables, all in accordance withwhat knowledge and skill the task is designed to evoke.
Figure 7. Graphical representation of the measurement model for theBEAR sample task linked to the BEAR student model.
UsingEvidence
UsingEvidence to
MakeTradeoffs

11
It is important for us to note that the student model in this example (indeedin most psychometric applications) is not proposed as a realistic explanation ofthe thinking that takes place when a student works through a problem. It is apiece of machinery we use to accumulate information across tasks, in a languageand at a level of detail we think suits the purpose of the assessment (for a morecomplete perspective on this, see Pirolli & Wilson, 1998). Without question, it isselective and simplified. But it ought to be consistent with what we know abouthow students acquire and use knowledge, and it ought to be consistent with whatwe see students say and do. This is where psychometric principles come in.
What do psychometric principles mean in IEY? Validity concerns whetherthe tasks actually do give sound evidence about the knowledge and skills thestudent-model variables are supposed to measure, namely, the five IEY progressvariables. Or are there plausible alternative explanations for good or poorperformance? Reliability concerns how much we learn about the students, i nterms of these variables, from the performances we observe. Comparability
concerns whether what we say about students, based on estimates of theirstudent-model variables, has a consistent meaning even if students have takendifferent tasks, or been assessed at different times or under different conditions.Fairness asks whether we have been responsible in checking important factsabout students and examining characteristics of task model variables that wouldinvalidate the inferences that test scores would ordinarily suggest.
Psychometric Principles and Evidentiary Arguments
We have seen through a quick example how assessment can be viewed asevidentiary arguments, and that psychometric principles can be viewed asdesirable properties of those arguments. Let’s go back to the beginning anddevelop this line of reasoning more carefully.
Educational Assessment as Evidentiary Argument2
Inference is reasoning from what we know and what we observe toexplanations, conclusions, or predictions. Rarely do we have the luxury ofreasoning with certainty; the information we work with is typically incomplete,
2 We are indebted to Prof. David Schum for our understanding of evidentiary reasoning, such as it is.This first part of this section draws on Schum (1987, 1994) and Kadane and Schum (1996).
12
inconclusive or amenable to more than one explanation. The very first questionin an evidentiary problem is, “evidence about what?” Data become evidence i nsome analytic problems only when we have established their relevance to someconjecture we are considering. And this task of establishing the relevance of dataand its weight as evidence depends on the chain of reasoning we construct fromthe evidence to those conjectures.
Both conjectures and an understanding of what constitutes evidence aboutthem arise from the concepts and relationships of the field under consideration.We’ll use the term substantive to refer to these content- or theory-based aspectsof reasoning within a domain, in contrast to structural aspects such as logicalstructures and statistical models. In medicine, for example, physicians framediagnostic hypotheses in terms of what they know about the nature of diseasesand the signs and symptoms that result from various disease states. The data arepatients’ symptoms and physical test results, from which physicians reason backto likely disease states. In history, hypotheses concern what happened and why.Letters, documents, and artifacts are the data the historian must fit into a largerpicture of what is known and what is supposed.
Philosopher Stephen Toulmin (1958) provided terminology for talkingabout how we use substantive theories and accumulated experience (say, aboutalgebra and how kids learn it) to reason from particular data (Joe’s solutions) to aparticular claim (what Joe understands about algebra). Figure 8 outlines thestructure of a simple argument. The claim is a proposition we wish to supportwith data. The arrow represents inference, which is justified by a warrant, or ageneralization that justifies the inference from the particular data to theparticular claim. Theory and experience provide backing for the warrant. In anyparticular case, we reason back through the warrant, so we may need to qualifyour conclusions because there are alternative explanations for the data.
In practice, of course, an argument and its constituent claims, data,warrants, backing, and alternative explanations will be more complex thanFigure 8. An argument usually consists of many propositions and data elements,involves chains of reasoning, and often contains dependencies among claimsand various pieces of data. This is the case in assessment.

13
Sue can use specificsto illustrate a descriptionof a fictional character.
Sue s essay usesthree incidents toillustrate Hamlet sindecisiveness.
Students who know howto use writing techniques willdo so in an assignment thatcalls for them.
The past three terms,students understandings ofthe use of techniques in in-depth interviews havecorresponded with theirperformances in theiressays.
The student has notactually produced the work.
since
soonaccount
of
unless
supports
Sue s essay is verysimilar to the characterdescription in the Cliff Notesguide to Hamlet.
Claim:
Warrant:Alternative Hypothesis:
Backing: Data: Rebuttal data:
Figure 8. A Toulmin Diagram for a simple assessment situation.
In educational assessments, the data are the particular things students say,do, or create in a handful of particular situations—written essays, correct andincorrect marks on answer sheets, presentations of projects, or explanations oftheir problem solutions. Usually our interest lies not so much in theseparticulars, but in the clues they hold about what students understand moregenerally. We can only connect the two through a chain of inferences. Somelinks depend on our beliefs about the nature of knowledge and learning. What isimportant for students to know, and how do they display that knowledge? Otherlinks depend on things we know about students from other sources. Do theyhave enough experience with a computer to use it as a tool to solve aninteractive physics problem, or will it be so unfamiliar as to hinder their work?Some links use probabilistic models to communicate uncertainty, because we canadminister only a few tasks or because we use evaluations from raters who don’talways agree. Details differ, but a chain of reasoning must underlie an assessmentof any kind, from classroom quizzes and standardized achievement tests, tocoached practice systems and computerized tutoring programs, to the informalconversations students have with teachers as they work through experiments.

14
The Case for Standardization
Evidence rarely comes without a price. An obvious factor in the total cost ofan evidentiary argument is the expense of gathering the data, but figuring outwhat data to gather and how to make sense of it can also cost dearly. In legalcases, these latter tasks are usually carried out after the fact. Because each case isunique, at least parts of the argument must be uniquely fashioned. Marshallingevidence and constructing arguments in the O.J. Simpson case took more than ayear and cost millions of dollars, to prosecution and defense alike.
If we foresee that the same kinds of data will be required for similarpurposes on many occasions, we can achieve efficiencies by developing standardprocedures both for gathering the data and reasoning from it (Schum, 1994, p.137). A well-designed protocol for gathering data addresses important issues in itsinterpretation, such as making sure the right kinds and right amounts of data areobtained, and heading off likely or pernicious alternative explanations.Following standard procedures for gathering biological materials from crimescenes, for example, helps investigators avoid contaminating samples and allowsthem to keep track of everything that happens to them from collection to testing.Further, merely confirming that they’ve followed the protocols immediatelycommunicates to others that these important issues have been recognized anddealt with responsibly.
A major way that large-scale assessment is made practicable in education isby thinking these issues through up front—laying out the argument for whatdata to gather and why, from each of the many students that will be assessed. Thedetails of the data will vary from one student to another, and so will the claims.But the same kind of data will be gathered for each student; the same kind ofclaim will be made, and, most importantly, the same argument structure will beused in each instance. This strategy offers great efficiencies, but it admits thepossibility of cases that do not accord with the common argument. Therefore,establishing the credentials of the argument in an assessment that is used withmany students entails the two distinct responsibilities listed below. We shall seethat investigating them and characterizing the degree to which they hold can bedescribed in terms of psychometric principles.
• Establishing the credentials of the evidence in the common argument.This is where efficiency is gained. To the extent that the same argument
15
structure holds for all the students it will be used with, the specializationto any particular student inherits the backing that has been marshaledfor the general form. We will discuss below how the common argumentis framed. Both rational analyses and large-scale statistical analyses canbe used to test the argument’s fidelity at this macro level. These tasks canbe arduous, and they can never really be considered complete, becausewe could always refine the argument or test additional alternativehypotheses (Messick, 1989). The point is, though, that this effort does notincrease in proportion to the number of examinees who are assessed.
• Detecting individuals for whom the common argument does not ho ld .Inevitably, the theories, the generalizations, the empirical grounding forthe common argument will not hold for some students. The usual dataarrive, but the usual inference does not follow—even if the commonargument does support validity and reliability in the main. Theseinstances call for additional data or different arguments, often on a moreexpensive case-by-case basis. An assessment system that is both efficientand conscientious will minimize the frequency with which thesesituations occur but routinely and inexpensively draw attention to themwhen they do.
It is worth emphasizing that the standardization we are discussing hereconcerns the structure of the argument, not necessarily the form of the data.Some may think that this form of standardization is only possible with so-calledobjective item forms such as multiple-choice items. Few large-scale assessmentsare more open-ended than the Advanced Placement Studio Art portfolioassessment (Myford & Mislevy, 1995); students have an almost unfettered choiceof media, themes, and styles. But the AP program provides a great deal ofinformation about the qualities students need to display in their work, what theyneed to assemble as work products, and how raters will evaluate them. Thisstructure allows for a common argument, heads off alternative explanationsabout unclear evaluation standards in the hundreds of AP Studio Art classroomsacross the country, and, most happily, helps the students come to understand thenature of good work in the field (Wolf, Bixby, Glenn, & Gardner, 1991).
Psychometric Principles as Properties of Arguments
Seeing assessment as argument from limited evidence is a starting point forunderstanding psychometric principles.
Validity. Validity is paramount among psychometric principles, for validityspeaks directly to the extent to which a claim about a student, based on
16
assessment data from that student, is justified (Cronbach, 1989; Messick, 1989).Establishing validity entails making the warrant explicit, examining the networkof beliefs and theories on which it relies, and testing its strength and credibilitythrough various sources of backing. It requires determining conditions thatweaken the warrant, exploring alternative explanations for good or poorperformance, and feeding them back into the system to reduce inferential errors.
In the introductory example, we saw that assessment is meant to getevidence about students’ status with respect to a construct, some particularaspect(s) of knowledge, skill, or ability—in that case, the IEY variables. Cronbachand Meehl (1955) said “construct validation is involved whenever a test is to beinterpreted as a measure of some attribute or quality is not operationallydefined”—that is, when there is a claim about a person based on observations,not merely a statement about those particular observations in and of themselves.Earlier work on validity distinguished a number of varieties of validity, such ascontent validity, predictive validity, convergent and divergent validity, and wewill say a bit more about these later. But the current view, as the Standards for
Educational and Psychological Testing (American Educational ResearchAssociation, American Psychological Association, and National Council ofMeasurement in Education, 1999) asserts, is that validity is a unitary concept.Ostensibly, different kinds of validity are better viewed as merely different linesof argument and different kinds of evidence for a single kind of validity. If youinsist on a label for it, it would have to be construct validity.
Embretson (1983) distinguishes between validity arguments that concernwhy data gathered in a certain way ought to provide evidence about the targetedskill knowledge, and those that investigate relationships of resulting scores withother variables to support the case. These are, respectively, arguments about“construct representation” and arguments from “nomothetic span.” Writing i n1983, Embretson noted that validation studies relied mainly on nomotheticarguments, using scores from assessments in their final form or close to it. Theconstruction of those tests, however, was guided mainly by specifications foritem format and content, rather than by theoretical arguments or empiricalstudies regarding construct representation. The “cognitive revolution” in thelatter third of the 20th century provided both scientific respectability and practicaltools for designing construct meaning into tests from the beginning (Embretson).The value of both lines of argument is appreciated today, with validation

17
procedures based on nomothetic span tending to be more mature and thosebased on construct representation still evolving.
Reliability. Reliability concerns the adequacy of the data to support a claim,presuming the appropriateness of the warrant and the satisfactory elimination ofalternative hypotheses. Even if the reasoning is sound, there may not be enoughinformation in the data to support the claim. Later we will see how reliability isexpressed quantitatively when probability-based measurement models areemployed. We can mention now, though, that the procedures by which data aregathered can involve multiple steps or features that each affect the evidentiaryvalue of data. Depending on Jim’s rating of Sue’s essay rather than evaluating itourselves adds a step of reasoning to the chain, introducing the need to establishan additional warrant, examine alternative explanations, and assess the value ofthe resulting data.
How can we gauge the adequacy of evidence? Brennan (2000/in press)writes that the idea of repeating the measurement process has played a centralrole in characterizing an assessment’s reliability since the work of Spearman(1904)—much as it does in physical sciences. If you weigh a stone 10 times and geta slightly different answer each time, the variation among the measurements is agood index of the uncertainty associated with that measurement procedure.However, it is less straightforward to know just what repeating themeasurement procedure means if the procedure has several steps that could eachbe done differently (different occasions, different task, different raters), or if someof the steps can’t be repeated at all (if a person learns something by workingthrough a task, a second attempt isn’t measuring the same level of knowledge).We will see that the history of reliability is one of figuring out how tocharacterize the value of evidence in increasingly wider ranges of assessmentsituations.
Comparability. Comparability concerns the common occurrence that thespecifics of data collection differ for different students, or for the same students atdifferent times. Differing conditions raise alternative hypotheses when we needto compare students with one another or against common standards, or whenwe want to track students’ progress over time. Are there systematic differences i nthe conclusions we would draw when we observe responses to Test Form A asopposed to Test Form B, for example? Or from a computerized adaptive testinstead of the paper-and-pencil version? Or if we use a rating based on two

18
judges, as opposed to the average of two, or the consensus of three? We mustthen extend the warrant to deal with these variations, and we must includethem as alternative explanations of differences in students’ scores.
Comparability overlaps with reliability, as both raise questions of howevidence obtained through one application of a data-gathering procedure mightdiffer from evidence obtained through another application. The issue isreliability when we consider the two measures interchangeable—which is used isa matter of indifference to the examinee and assessor alike. Although we expectthe results to differ somewhat, we don’t know if one is more accurate than theother, whether one is biased toward higher values, or if they will illuminatedifferent aspects of knowledge. The same evidentiary argument holds for bothmeasures, and the obtained differences are what constitute classicalmeasurement error. The issue is comparability when we expect systematicdifferences of any of these types, but wish to compare results obtained from thetwo distinct processes nevertheless. A more complex evidentiary argument isrequired. It must address the way that observations from the two processes beardifferent relationships to the construct we want to measure, and it must indicatehow to take these differences into account in our inferences.
Fairness. Fairness is a term that encompasses more territory than we canaddress in this report. Many of its senses concern social, political, and educationalperspectives on the uses to which assessment results inform (Willingham &Cole, 1997)—legitimate questions all, which would exist even if the chain ofreasoning from observations to constructs contained no uncertainty whatsoever.Like Wiley (1991), we focus our attention here on construct meaning rather thanuse or consequences, and consider aspects of fairness that bear directly on thisportion of the evidentiary argument.
Fairness in this sense concerns alternative explanations of assessmentperformances in light of other characteristics of students that we could andshould take into account. Ideally, the same warrant backs inferences about manystudents, reasoning from their particular data to a claim about what eachindividually knows or can do. This is never quite truly the case in practice, forfactors such as language background, instructional background, and familiaritywith representations surely influence performance. When the same argument isto be applied with many students, considerations of fairness require us toexamine the impact of such factors on performance and identify the ranges of
19
their values beyond which the common warrant can no longer be justified.Drawing the usual inference from the usual data for a student who lies outsidethis range leads to inferential errors. If they are errors we should have foreseenand avoided, they are unfair. Ways of avoiding such errors are using additionalknowledge about students to condition our interpretation of what we observeunder the same procedures and gathering data from different students i ndifferent ways, such as providing accommodations or allowing students tochoose among ways of providing data (and accepting the responsibility asassessors to establish the comparability of data so obtained!).
A Framework for Assessment Design
This section lays out a schema for the evidentiary argument that underlieseducational assessments, incorporating both its substantive and statistical aspects.It is based on the “evidence-centered” framework for assessment designillustrated in Mislevy, Steinberg, and Almond (in press) and Mislevy, Steinberg,Breyer, Almond, and Johnson (1999; in press). We’ll use it presently to examinepsychometric principles from a more technical perspective. The frameworkformalizes another quotation from Messick:
A construct-centered approach [to assessment design] would begin by asking whatcomplex of knowledge, skills, or other attribute should be assessed, presumably becausethey are tied to explicit or implicit objectives of instruction or are otherwise valued bysociety. Next, what behaviors or performances should reveal those constructs, andwhat tasks or situations should elicit those behaviors? Thus, the nature of the constructguides the selection or construction of relevant tasks as well as the rationaldevelopment of construct-based scoring criteria and rubrics (Messick, 1994, p. 16).
Figure 1, presented back in the introductory example, depicts elements andrelationships that must be present, at least implicitly, and coordinated, at leastfunctionally, in any assessment that has evolved to effectively serve someinferential function. Making this structure explicit helps an evaluatorunderstand how to first gather, then reason from, data that bear on whatstudents know and can do.
In brief, the student model specifies the variables in terms of which we wishto characterize students. Task models are schemas for ways to get data thatprovide evidence about them. Two components, which are links in the chain ofreasoning from students’ work to their knowledge and skill: The scoring
20
component of the evidence model contains procedures for extracting the salientfeatures of student’s performances in task situations—i.e., observablevariables—and the measurement component contains machinery for updatingbeliefs about student-model variables in light of this information. These modelsare discussed in more detail below. Taken together, they make explicit theevidentiary grounding of an assessment, and they guide the choice andconstruction of particular tasks, rubrics, statistical models, and so on. A noperational assessment will generally have one student model, which maycontain many variables, but may use several task and evidence models toprovide data of different forms or with different rationales.
The Student Model: What Complex of Knowledge, Skills, or Other Attributes
Should Be Assessed?
The values of student-model variables represent selected aspects of theinfinite configurations of skill and knowledge real students have, based on atheory or a set of beliefs about skill and knowledge in the domain. Thesevariables are the vehicle through which we determine student progress, makedecisions, or plan instruction for students. The number and nature of thestudent-model variables depend on the purpose of an assessment. A singlevariable characterizing overall proficiency in algebra might suffice in anassessment meant only to support a pass/fail decision; a coached practice systemto help students develop the same proficiency might require a finer grainedstudent model, to monitor how a student is doing on particular aspects of skilland knowledge for which we can offer feedback. When the purpose is programevaluation, the student-model variables should reflect hypothesized ways i nwhich a program may enjoy more or less success, or promote students’ learningin some ways as opposed to others.
In the standard argument, then, a claim about what a student knows, can
do, or has accomplished is expressed in terms of values of student-model
variables. Substantive concerns about the desired outcomes of instruction, say, orthe focus of a program evaluation, will suggest what the student-model variablesmight be, and give substantive meaning to the values of student-modelvariables. The student model provides a language for expressing claims aboutstudents, restricted and simplified to be sure, but one that is amenable toprobability-based reasoning for drawing inferences and characterizing beliefs. A
21
following section will explain how we can express what we know about a givenstudent’s values for these variables in terms of a probability distribution, whichcan be updated as new evidence arrives.
Task Models: What Tasks or Situations Should Elicit Those Behaviors?
A task model provides a framework for constructing and describing thesituations in which examinees act. We use the term “task” in the sense proposedby Haertel and Wiley (1993), to refer to a “goal-directed human activity to bepursued in a specified manner, context, or circumstance.” A task can thus be anopen-ended problem in a computerized simulation, a long-term project such as aterm paper, a language-proficiency interview, or a familiar multiple-choice orshort-answer question.
A task model specifies the environment in which the student will say, do,or produce something; for example, characteristics of stimulus material,instructions, help, tools, and so on. It also specifies the work product, or the formin which what the student says, does, or produces will be captured. But again it issubstantive theory and experience that determine the kinds of situations that canevoke behaviors that provide clues about the targeted knowledge and skill, andthe forms in which those clues can be expressed and captured.
To create a particular task, an assessment designer has explicitly orimplicitly assigned specific values to task model variables, provided materialsthat suit the specifications there given, and set the conditions that are required tointeract with the student. A task thus describes particular circumstances meant toprovide the examinee an opportunity to act in ways that produce evidence aboutwhat they know or can do more generally. For a particular task, the values of its
task model variables constitute data for the evidentiary argument, characterizing
the situation in which the student is saying, doing, or making something.
It is useful to distinguish task models from the scoring models discussed i nthe next section, as the latter concern what to attend to in the resultingperformance and how to evaluate what we see. Distinct and possibly quitedifferent evaluation rules could be applied to the same work product from agiven task. Distinct and possibly quite different student models, designed to servedifferent purposes or derived from different conceptions of proficiency, could beinformed by performances on the same tasks. The substantive arguments for the
22
evidentiary value of behavior in the task situation will overlap in these cases,but the specifics of the claims and thus the specifics of the statistical links in thechain of reasoning will differ.
Evidence Models: What Behaviors or Performances Should Reveal the Student
Constructs, and What Is the Connection?
An evidence model lays out the part of the evidentiary argument thatconcerns reasoning from the observations in a given task situation to revisingbeliefs about student-model variables. Figure 1 shows there are two parts to theevidence model.
The scoring component contains “evidence rules” for extracting the salientfeatures of whatever the student says, does, or creates in the task situation—i.e.,the “work product” that is represented by the jumble of shapes in the rectangle atthe far right of the evidence model. A work product is a unique humanproduction, perhaps as simple as a response to a multiple-choice item, or ascomplex as repeated cycles of treating and evaluating patients in a medicalsimulation. The squares coming out of the work product represent “observablevariables,” or evaluative summaries of what the assessment designer hasdetermined are the key aspects of the performance (as captured in one or morework products) to serve the assessment’s purpose. Different aspects could becaptured for different purposes. For example, a short impromptu speech containsinformation about a student’s subject matter knowledge, presentationcapabilities, or English language proficiency; any of these, or any combination,could be the basis of one or more observable variables. As a facet of fairness,however, the student should be informed of which aspects of the performanceare being evaluated and by what criteria. For students failing to understand howtheir work will be scored is an alternative hypothesis for poor performance wecan and should avoid.
Scoring rules map unique performances into a common interpretativeframework, thus laying out what is important in a performance. These rules canbe as simple as determining whether the response to a multiple-choice item iscorrect, or as complex as an expert’s holistic evaluation of multiple aspects of anunconstrained patient-management solution. They can be automated, demandhuman judgment, or require both in combination. Values of the observable

23
variables describe properties of the particular things a student says, does, o r
makes. As such, they constitute data about what the student knows, can do, o r
has accomplished as more generally construed in the standard argument.
It is important to note that substantive concerns drive the definition ofobservable variables. Statistical analyses can be used to refine definitions,compare alternatives, or improve data-gathering procedures, again looking forpatterns that call a scoring rule into question. But it is the conception of what toobserve that concerns validity directly and raises questions of alternativeexplanations that bear on comparability and fairness.
The measurement component of the Evidence Model tells how theobservable variables depend, in probabilistic terms, on student-model variables,another essential link in the evidentiary argument. This is the foundation forthe reasoning that is needed to synthesize evidence across multiple tasks or fromdifferent performances. Figure 1 shows how the observables are modeled asdepending on some subset of the student-model variables. The familiar modelsfrom test theory that we discuss in a following section, including classical testtheory and item response theory, are examples. We can adapt these ideas to suitthe nature of the student model and observable variables in any givenapplication (Almond & Mislevy, 1999). Again, substantive considerations mustunderlie why these posited relationships should hold; the measurement modelformalizes the patterns they imply.
It is a defining characteristic of psychometrics to model observable variablesas probabilistic functions of unobservable student variables. The measurementmodel is almost always a probability model. The probability-based frameworkmodel may extend to the scoring model as well, as when judgments are requiredto ascertain the values of observable variables from complex performances.Questions of accuracy, agreement, leniency, and optimal design arise, and can beaddressed with a measurement model that addresses the rating link as well asthe synthesis link in the chain of reasoning. The generalizability and ratermodels discussed below are examples of this.

24
Psychometric Principles and Probability-Based Reasoning
The Role of Probability-Based Reasoning in the Assessment
This section looks more closely at what is perhaps the most distinctivecharacteristic of psychometrics, namely, the use of statistical models.Measurement models are a particular form of reasoning from evidence; theyprovide explicit, formal rules for how to integrate the many pieces ofinformation that may be relevant to a particular inference about what studentsknow and can do. Statistical modeling, probability-based reasoning moregenerally, is an approach to solving the problem of “reverse reasoning” througha warrant, from particular data to a particular claim. Just how can we reasonfrom data to claim for a particular student, using a measurement modelestablished for general circumstances—usually far less than certain, typicallywith qualifications, perhaps requiring side conditions we don’t know aresatisfied? How can we synthesize the evidentiary value of multiple observations,perhaps from different sources, which are often in conflict?
The essential idea is to approximate the important substantive relationshipsin some real-world problem in terms of relationships among variables in aprobability model. A simplified picture of the real-world situation results. Auseful model does not explain all the details of actual data, but it does capture thesignificant patterns among them. What is important is that in the space of themodel, the machinery of probability-based reasoning indicates exactly howreverse reasoning is to be carried out (specifically, through Bayes theorem) andhow different kinds and amounts of data should affect our beliefs. The trick is tobuild a probability model that both captures the important real-world patternsand suits the purposes of the problem at hand.
Measurement models concern the relationships between students’knowledge and their behavior. A student is modeled in terms of variables (θ)that represent the facets of skill or knowledge that suit the purpose of theassessment, and the data (X) are values of variables that characterize aspects ofthe observable behavior. We posit that the student-model variables account forobservable variables in the following sense: We don’t know exactly what anystudent will do on a particular task, but for people with any given value of θ ,there is a probability distribution of possible values of X, say p(X|θ). This is a
25
mathematical expression of what we might expect to see in data, given anypossible values of student-model variables. The way is open for reversereasoning, from observed X’s to likely θ’s, as long as different values of θ producedifferent probability distributions for X. We don’t know the values of thestudent-model variables in practice; we observe “noisy” data presumed to havebeen determined by them, and through the probability model reason back towhat their values are likely to be.
Choosing to manage information and uncertainty with probability-basedreasoning, with its numerical expressions of belief in terms of probabilitydistributions, does not constrain one to any particular forms of evidence orpsychological frameworks. That is, it says nothing about the number or nature ofelements of X, or about the character of the performances, or about theconditions under which performances are produced. And it says nothing aboutthe number or nature of elements of θ, such as whether they are number valuesin a differential psychology model, production-rule mastery in a cognitivemodel, or tendencies to use resources effectively in a situative model. Inparticular, using probability-based reasoning does not commit us to long tests,discrete tasks, or large samples of students. For example, probability-based modelshave been found useful in modeling patterns of judges’ ratings in the previouslymentioned Advanced Placement Portfolio Art assessment (Myford & Mislevy,1995), about as open-ended as large-scale, high-stakes educational assessmentsget, and in modeling individual students’ use of production rules in a tutoringsystem for solving physics problems (Martin & vanLehn, 1995).
Now a measurement model in any case is not intended to account for everydetail of data; it is only meant to approximate the important patterns. Thestatistical concept of conditional independence formalizes the workingassumption that if the values of the student-model variables were known, therewould be no further information in the details. The fact that every detail of astudent’s responses could in principle contain information about what theyknow or how they are thinking underscores the constructive and purposivenature of modeling. We use a model at a given grainsize or with certain kinds ofvariables not because we think that is somehow ”true,” but rather because itadequately expresses the patterns in the data in light of the purpose of theassessment. Adequacy in a given application depends on validity, reliability,comparability, and fairness in ways we shall discuss further, but characterized i n

26
ways and demanded in degrees that depend on that application: the purpose ofthe assessment, the resources that are available, and the constraints that must beaccommodated. We might model the same troubleshooting performances i nterms of individual problem steps for an intelligent tutoring system in terms ofgeneral areas of strength and weakness for a diagnostic assessment, and simply i nterms of overall success rate for a pass/fail certification test.
Never fully believing the statistical model we are reasoning through, webear the responsibility of assessing model fit, in terms of both persons and items.We must examine the ways and the extent to which the real data depart from thepatterns in the data, calling our attention to failures of conditionalindependence—places where our simplifying assumptions miss relationshipsthat are surely systematic, and possibly important, in the data. Findingsubstantial misfit causes us to re-examine the arguments that tell us what toobserve and how to evaluate it.
Probability-Based Reasoning in Classical Test Theory
This section illustrates the ideas from the preceding discussion in thecontext of Classical Test Theory (CTT). In CTT, the student model is representedas a single continuous unobservable variable, the true score θ. The measurementmodel simply tells us to think of an observed score X as the true score plus anerror term. If a CTT measurement model were used in the BEAR example, itwould address the sum of the student scores on a set of assessment tasks as theobserved score.
Figure 9 pictures the situation, in a case that concerns Sue’s (unobservable)true score and her three observed scores on parallel forms of the same test; thatis, they are equivalent measures of the same construct and have the same meansand variances. The probability distribution p(θ) expresses our belief about Sue’s θ before we observe her test scores, the X’s. The conditional distributions p(Xj|θ)3
indicate the probabilities of observing different values of Xj if θ took any givenparticular value. Modeling the distribution of each Xj to depend on θ but not theother X’s is an instance of conditional independence; more formally, we write
3 p(Xj|θ) is the probability density function for the random variable Xj, given that θ is fixed at aspecified value.

27
p(X1,X2,X3|θ) = p(X1|θ) p(X2|θ) p(X3|θ). Under CTT we may obtain a form for thep(Xj|θ)s by proposing that
Xj = θ + Ej, (1)
where Ej is an “error” term, normally distributed with a mean of zero and a
variance of 2
Eσ .4 Thus Xj|θ ~ N(θ, Eσ ). This statistical structure quantifies the
patterns that the substantive arguments express qualitatively in a way that tellsus exactly how to carry out reverse reasoning for particular cases. If p(θ) expressesbelief about Sue’s θ prior to observing her responses, belief posterior to learningthem is denoted as p(θ|x1,x2,x3) and is calculated by Bayes theorem as
p(θ|x1,x2,x3) ∝ p(θ) p(x1|θ) p(x2|θ) p(x3|θ).
(The lowercase x’s here denote particular values of X’s.)
θ
X1 X2 X3
p(θ)
p(X1|θ)
p(X2|θ)
p(X3|θ)
Figure 9. Statistical representation forclassical test theory.
4 Strictly speaking, CTT does not address the full distributions of true and observed scores, onlymeans, variances, and covariances. But we want to illustrate probability-based reasoning andreview CTT at the same time. Assuming normality for θ and E is the easiest way to do this, sincethe first two moments are sufficient for normal distributions.

28
Figure 10 gives the numerical details for a hypothetical example, calculatedwith a variation of an important early result called Kelley’s formula forestimating true scores (Kelley, 1927). Suppose that from a large number ofstudents like Sue we’ve estimated that the measurement error variance is
2
Eσ =25, and for the population of students, θ follows a normal distribution with
mean 50 and standard deviation 10. We now observe Sue’s three scores, whichtake the values 70, 75, and 85. We see that the posterior distribution for Sue’s θ isa normal distribution with mean 74.6 and standard deviation 2.8.
Figure 10. A numerical example using classical test theory.

29
The additional backing that was used to bring the probability model into theevidentiary argument was an analysis of data from students like Sue. Spearman’s(1904) seminal insight was that if their structure is set up in the right way,5 it ispossible to estimate the quantitative features of relationships like this, amongboth variables that could be observed and others which by their nature never canbe. The index of measurement accuracy in CTT is the reliability coefficient ρ,which is the proportion of variance in observed scores in a population of interestthat is attributable to true scores as opposed to the total variance, which iscomposed of true score variance and noise. It is defined as follows:
,22
2
Eσσσρ
θ
θ
+= (2)
where 2
θσ is the variance of true score in the population of examinees and 2
Eσ is
the variance of the error components—neither of which is directly observable!With a bit of algebra, though, Spearman demonstrated that if Equation 1 holds,correlations among pairs of X’s will approximate ρ. We may then estimate thecontributions of true score and error, or
2
θσ and 2
Eσ , as proportions ρ and (1-ρ)
respectively of the observed score variance. The intuitively plausible notion isthat correlations among exchangeable measures of the same construct tell ushow much to trust comparisons among examinees from a single measurement.(As an index of measurement accuracy, however, ρ suffers from its dependenceon the variation among examinees’ true scores as well as on the measurementerror variance of the test. For a group of examinees with no true-score variance,the reliability coefficient is zero no matter how much evidence a test providesabout each of them. We’ll see how item response theory extends the idea ofmeasurement accuracy.)
What’s more, patterns among the observables can be so contrary to thosethe model would predict that we suspect the model isn’t right. Sue’s values of 70,75, and 85 are not identical, but neither are they surprising as a set of scores(Figure 10 calculates a chi-squared index of fit for Sue). Some students havehigher scores than Sue. Some have lower scores. But the amount of variation
5 In statistical terms, if the parameters are identified. Conditional independence is key, because CIrelationships enable us to make multiple observations that are assumed to depend on the sameunobserved variables in ways we can model. This generalizes the concept of replication tha tgrounds reliability analysis.

30
within a typical student’s set of scores is in this neighborhood. But Richard’sthree scores of 70, 75, and 10 are surprising. His high fit statistic (a chi-square of105 with 2 degrees of freedom) says his pattern is very unlikely from parallel testswith an error variance of 25 (less than one in a billion). Richard’s responses areso discordant with a statistical model that expresses patterns under the standardargument that we suspect that the standard argument does not apply. We mustgo beyond the standard argument to understand what has happened, to facts thestandard data do not convey. Our first clue is that his third score is particularlydifferent from both the other two and from the prior distribution.
Classical test theory’s simple model for examinee characteristics sufficeswhen one is just interested in a single aspect of student achievement, tests areonly considered as a whole, and all students take tests that are identical orpractically so. But the assumptions of CTT have generated a vastarmamentarium of concepts and tools that help the practitioner examine theextent to which psychometric principles are being attained in situations whenthe assumptions are adequate. These tools include reliability indices that can becalculated from multiple items in a single test, formulas for errors of measuringindividual students, strategies for selecting optimal composites of tests, formulasfor approximating how long a test should be to reach a required accuracy, andmethods for equating tests. The practitioner working in situations that CTTencompasses will find a wealth of useful formulas and techniques in Gulliksen’s(1950/1987) classic text.
The Advantages of Using Probability-Based Reasoning in Assessment
Because of its history, the very term psychometrics connotes a fusion of theinferential logic underlying Spearman’s reasoning with his psychology (traitpsychology, in particular with intelligence as an inherited and stablecharacteristic) and his data-gathering methods (many short, “objectively-scored,”largely decontextualized tasks). The connection, while historically grounded, islogically spurious, however. For the kinds of problems that CTT grew to solveare not just Spearman’s problems, but ones that ought to concern anybody who isresponsible for making decisions about students, evaluating the effects ofinstruction, or spending scarce educational resources—whether or notSpearman’s psychology or methodology are relevant to the problem at hand.

31
And indeed, the course of development of test theory over the past centuryhas been to continually extend the range of problems to which this inferentialapproach can be applied—to claims cast in terms of behavioral, cognitive, orsituative psychology6; to data that may be embedded in context, requiresophisticated evaluations, or address multiple interrelated aspects of complexactivities. We will look at some of these developments in the next section. But itis at a higher level of abstraction that psychometric principles are bestunderstood, even though it is with particular models and indices that they areinvestigated in practice.
When it comes to examining psychometric properties, embedding theassessment argument in a probability model offers the following advantages.
1. Using the calculus of probability-based reasoning, once we ascertain thevalues of the variables in the data, we can express our beliefs about thelikely values of the student estimates in terms of probabilitydistributions—given that the model is both generally credible (#3 below)and applicable to the case at hand (#4 below).
2. The machinery of probability-based reasoning is rich enough to handlemany recurring challenges in assessment, such as synthesizinginformation across multiple tasks, characterizing the evidentiaryimportance of elements or assemblages of data, assessing comparabilityacross different bodies of evidence, and exploring the implications ofjudgment, including different numbers and configurations of raters.
3. Global model-criticism techniques allow us to not only fit models todata, but to determine where and how the data do not accord well withthe models. Substantive considerations suggest the structure of theevidentiary argument; statistical analyses of ensuing data through thelens of a mathematical model help us assess whether the argumentmatches up with what we actually see in the world. For instance,detecting an unexpected interaction between performance on an itemand students’ cultural backgrounds alerts us to an alternate explanationof poor performance. We are then moved to improve the data gatheringmethods, constrain the range of use, or rethink the substantiveargument.
4. Local model-criticism techniques allow us to monitor the operation ofthe reverse-reasoning step for individual students even after theargument, data-collection methods, and statistical model are up andrunning. Patterns of observations that are unlikely under the commonargument can be flagged (e.g., Richard’s high chi-square value), thus
6 See Greeno, Collins, and Resnick (1996) for an overview of these three perspectives on learningand knowing, and discussion of their implications for instruction and assessment.
32
avoiding certain unsupportable inferences and drawing attention tothose cases that call for additional exploration.
Implications for Psychometric Principles
Validity. Some of the historical “flavors” of validity are statistical in nature.Predictive validity is the degree to which scores in selection tests correlate withfuture performance. Convergent validity looks for high correlations of a test’sscores with other sources of evidence about the targeted knowledge and skills,while divergent validity looks for low correlations with evidence aboutirrelevant factors (Campbell & Fiske, 1959). Concurrent validity examinescorrelations with other tests presumed to provide evidence about the same orsimilar knowledge and skills.
The idea is that substantive considerations that justify an assessment’sconception and construction can be put to empirical tests. In each of the casesmentioned above, relationships are posited among observable phenomena thatwould hold if the substantive argument were correct, and see if in fact they do;that is, exploring the nomothetic net. These are all potential sources of backingfor arguments for interpreting and using test results, and they are at the sametime explorations of plausible alternative explanations.
Consider, for example, assessments meant to support decisions aboutwhether a student has attained some criterion of performance (Ercikan & Julian,2001; Hambleton & Slater, 1997). These decisions, typically reported as proficiencyor performance level scores, which are increasingly being considered to be usefulin communicating assessment results to students, parents and the public as wellas for evaluation of programs, involve classification of examinee performance toa set of proficiency levels. Rarely do the tasks on such a test exhaust the full rangeof performances and situations users are interested in. Examining the validity ofa proficiency test from this nomothetic-net perspective would involve seeingwhether students who do well on that test also perform well in more extensiveassessment, obtain high ratings from teachers or employers, or succeed i nsubsequent training or job performance.
Statistical analyses of these kinds have always been important after the fact,as significance-focused validity studies informed, constrained, and evaluated theuse of a test—but they rarely prompted more than minor modifications to itscontents. Rather, Embretson (1998) notes, substantive considerations have

33
traditionally driven assessment construction. Neither of two meaning-focusedlines of justification that were considered forms of validity used probability-basedreasoning. They were content validity, which concerned the nature and mix ofitems in a test, and face validity, which is what a test appears to be measuring onthe surface, especially to nontechnical audiences. We will see in our discussionof item response theory how statistical machinery is increasingly being used i nthe exploration of construct representation as well in after-the-fact validitystudies.
Reliability. Reliability, historically, was used to quantify the amount ofvariation in test scores that reflected “true” differences among students, asopposed to noise (Equation 2). The correlations between parallel tests forms weused in classical test theory are one way to estimate reliability in this sense.Internal consistency among test items, as gauged by the KR-20 formula (Kuder &Richardson, 1937) or Cronbach’s (1951) Alpha coefficient, is another. Acontemporary view sees reliability as the evidentiary value that a given realizedor prospective body of data would provide for a claim—more specifically, theamount of information for revising belief about an inference involving student-model variables, be it an estimate for a given student, a comparison amongstudents, or a determination of whether a student has attained some criterion ofperformance.
A wide variety of specific indices or parameters can be used to characterizeevidentiary value. Carrying out a measurement procedure two or more timeswith supposedly equivalent alternative tasks and raters will not only ground anestimate of its accuracy, as in Spearman’s original procedures, but it demonstratesconvincingly that there is some uncertainty to deal with in the first place(Brennan, 2000/in press). The KR-20 and Cronbach’s alpha apply the idea ofreplication to tests that consist of multiple items, by treating subsets of the itemsas repeated measures. These CTT indices of reliability appropriately characterizethe amount of evidence for comparing students in a particular population withone another, but not necessarily for comparing them against a fixed standard, orfor comparisons in other populations, or for purposes of evaluating schools orinstructional programs. In this sense, CTT indices of reliability are tied toparticular populations and inferences.
Since reasoning about reliability takes place in the realm of themeasurement model (assuming that it is both correct and appropriate), it is

34
possible to approximate the evidentiary value of not only the data in hand, butthe value of similar data gathered in somewhat different ways. Under CTT, theSpearman-Brown formula (Brown, 1910; Spearman, 1910) can be used toapproximate the reliability coefficient that would result from doubling the lengthof a test:
ρρρ
+=
1
2double . (3)
That is, if ρ is the reliability of the original test, then ρdouble is the reliability ofan otherwise comparable test with twice as many items. Empirical checks haveshown that these predictions can hold up quite well—but not if the additionalitems differ as to their content or difficulty, or if the new test is long enough tofatigue students. In these cases, the real-world counterparts of the modeledrelationships are stretched so far that the results of reasoning through the modelfail.
Extending this thinking to a wider range of inferences, generalizabilitytheory (Cronbach, Gleser, Nanda, & Rajaratnam, 1972) permits predictions forthe accuracy of similar tests with different numbers and configurations of raters,items, and so on. And once the parameters of tasks have been estimated underan item response theory (IRT) model, one can even assemble tests item by itemto individual examinees on the fly, to maximize the accuracy with which each isassessed. (Later we’ll point to some “how-to” references for g-theory and IRT.)
Typical measures of accuracy used in CTT are not sufficient for examiningaccuracy of the decisions concerning criterion of performance discussed above. InCTT framework, the classification accuracy is defined as the extent to whichclassification of students based on their observed test scores agree with thosebased on their true scores (Traub & Rowley, 1980). One of the two commonlyused measures of classification accuracy is a simple measure of agreement, p0 ,
defined as
∑=
=L
lll
pp1
0 ,
where pll represents the proportion of examinees who were classified into thesame proficiency level (l=2,..,5) according to their true score and observed score.The second is Cohen’s κ coefficient (Cohen, 1960). This statistic is similar to the

35
proportion agreement p0 , except that it is corrected for the agreement which isdue to chance. The coefficient is defined as
ppp
c
c
−−=
1
0κ ,
where
pppl
L
llc .
1.
∑=
= .
The accuracy of classifications based on test scores is critically dependent onmeasurement accuracy at the cut-score points (Ercikan & Julian, 2001; Hambleton& Slater, 1997). Even though higher measurement accuracy tends to implyhigher classification accuracy, higher reliability such as one indicated by KR-20 orCoefficient alpha does not imply higher classification accuracy. These measuresprovide an overall indication of measurement accuracy provided by the test forall examinees, however, they do not provide information about themeasurement accuracy provided at the cut-scores. Therefore, they are notsufficient indicators of accuracy of classification decisions made based on testperformance.
On the other hand, measurement accuracy is expected to vary for differentscore ranges resulting in variation in classification accuracy. This points to aserious limitation of interpretability of single indices that are intended torepresent classification accuracy of a test, given a set of cut-scores. Ercikan &Julian’s (2001) study found that the classification accuracy can be dramaticallydifferent for examinees at different ability levels. Their results demonstrated thatcomparing classification accuracy across tests could be deceptive, sinceclassification accuracy may be higher for one test for certain score ranges andlower for others. Based on these limitations of interpretability of classificationaccuracy for different score ranges, these authors recommend that classificationaccuracy be reported separately for different score ranges.
Comparability. Comparability, it will be recalled, concerns the equivalenceof inference when different bodies of data are gathered to compare students, or toassess change from the same students at different points in time. Within astatistical framework, we can build models that address quantitative aspects ofquestions such as these: Do the different bodies of data have such different

36
properties as evidence as to jeopardize the inferences? Are conclusions aboutstudents’ knowledge biased in one direction or another when different data aregathered? Is there more or less weight for various claims under the differentalternatives?
A time-honored way of establishing comparability has been creating paralleltest forms. A common rationale is developed to create collections of tasks which,taken together, can be argued to provide data about the same targeted skills andknowledge—differing, it is hoped, only in incidentals that do not accumulate:defining a knowledge-by-skills matrix, for example, writing items in each cell,and constructing tests by selecting the same numbers of tasks from each cell forevery test form. The same substantive backing thus grounds all the forms.
But it would be premature to presume that equal scores from these testsconstitute equivalent evidence about students’ knowledge. Despite care in theirconstruction, possible differences between the tests as to difficulty or amount ofinformation must be considered as an alternative explanation for differingperformances among students. Empirical studies and statistical analyses enter thepicture at this point, in the form of equating studies (Petersen, Kolen, & Hoover,1989). Finding that similar groups of students systematically perform better onForm A than on Form B confirms the alternative explanation. Adjusting scoresfor Form B upward to match the resulting distributions addresses this concern,refines the chain of reasoning to take form differences into account whendrawing claims about students, and enters the compendium of backing for theassessment system as a whole. Below we shall see that IRT extends comparabilityarguments to test forms that differ in difficulty and accuracy, if they can satisfythe requirements of a more ambitious statistical model.
Fairness. The meaning-focused sense of fairness we have chosen tohighlight concerns a claim that would follow from the common argument, butwould be called into question by an alternative explanation sparked by otherinformation we could and should have taken into account. When we extend thediscussion of fairness to statistical models, we find macro-level and micro-levelstrategies to address this concern.
Macro-level strategies of fairness fall within the broad category of what theassessment literature calls validity studies, and are investigations in thenomothetic net. They address broad patterns in test data, at the level of

37
arguments or alternative explanations in the common arguments that are usedwith many students. Suppose the plan for the assessment is to use data (say, essayresponses) to back a claim about a student’s knowledge (e.g., the student can backup opinions with examples) through an argument (e.g., students in a pretest whoare known to be able to do this in their first language are observed to do so i nessays that ask for them to), without regard to a background factor (such as astudent’s first language). The idea is to gather, from a group of students, data thatinclude their test performances but also include information about their firstlanguage and higher quality validation data about the claim (e.g., interviews i nthe students’ native languages). The empirical question is whether inferencesfrom the usual data to the claim (independently evidenced by the validity data)differ systematically with first language. In particular, are there students who canback arguments with specifics in their native language but fail to do so on theessay test because of language difficulties? If so, the door is open to distortedinferences about argumentation skills for limited English speakers, if oneproceeds from the usual data through the usual argument, disregarding languageproficiency.
What can we do when the answer is “yes”? Possibilities include improvingthe data collected for all students, taking their first language into account whenreasoning from data to claim (recognizing the language difficulties can accountfor poor performance even when the skill of interest is present), and pre-identifying students whose limited language proficiencies are likely to lead toflawed inferences about the targeted knowledge. In this last instance, additionalor different data could be used for these students, such as an interview or anessay in their primary language.
These issues are particularly important in assessments used for makingconsequential proficiency-based decisions, in ways related to the points we raisedconcerning the validity of such tests. Unfair decisions are rendered if (a)alternative valid means of gathering data for evaluating proficiency yield resultsthat differ systematically from the standard assessment, and (b) the reason can betraced to requirements for knowledge or skills (e.g., proficiency with the Englishlanguage) that are not central to the knowledge or skill that is at issue (e.g.,constructing and backing an argument).
The same kinds of investigations can be carried out with individual tasks aswell as with assessments as a whole. One variation on this theme can be used
38
with assessments that are composed of several tasks, to determine whetherindividual tasks interact with first language in atypical ways. These are calledstudies of DIF, or differential item functioning (Holland & Wainer, 1993).
Statistical tools can also be used to implement micro-level strategies to callattention to cases in which a routine application of the standard argument couldproduce a distorted and possibly unfair inference. The common argumentprovides a warrant to reason from data to claim, with attendant caveats forunfairness associated with factors (such as first language) that have been dealtwith at the macro level. But the argument may not hold for some individualstudents for other reasons, which have not yet been dealt with at the macrolevel, and perhaps could not have been anticipated at all. Measurement modelscharacterize patterns in students’ data that are typical if the general argumentholds. Patterns that are unlikely can signal that the argument may not apply witha given student on a given assessment occasion. Under IRT, for example,“student misfit” indices take high values for students who miss items that aregenerally easy while correctly answering ones that are generally hard (Levine &Drasgow, 1982.)
Some Other Widely Used Measurement Models
The tools of classical test theory have been continually extended and refinedin the time since Spearman, to the extensive toolkit by Gulliksen (1950/1987),and to the sophisticated theoretical framework laid out in Lord and Novick(1968). Lord and Novick aptly titled their volume Statistical Theories of Mental
Test Scores, underscoring their focus on the probabilistic reasoning aspects in themeasurement-model links of the assessment argument—not the purposes, notthe substantive aspects, not the evaluation rules that produce the data. Modelsthat extend the same fundamental reasoning for this portion of assessmentarguments to wider varieties of data and student models include generalizabilitytheory, item response theory, latent class models, and multivariate models.
Each of these extensions offers more options for characterizing students andcollecting data in a way that can be embedding in a probability model. Themodels do not concern themselves directly with substantive aspects of anassessment argument, but substantive considerations often have much to sayabout how one should think about students’ knowledge, and what observationsshould contain evidence about it. The more measurement models that are
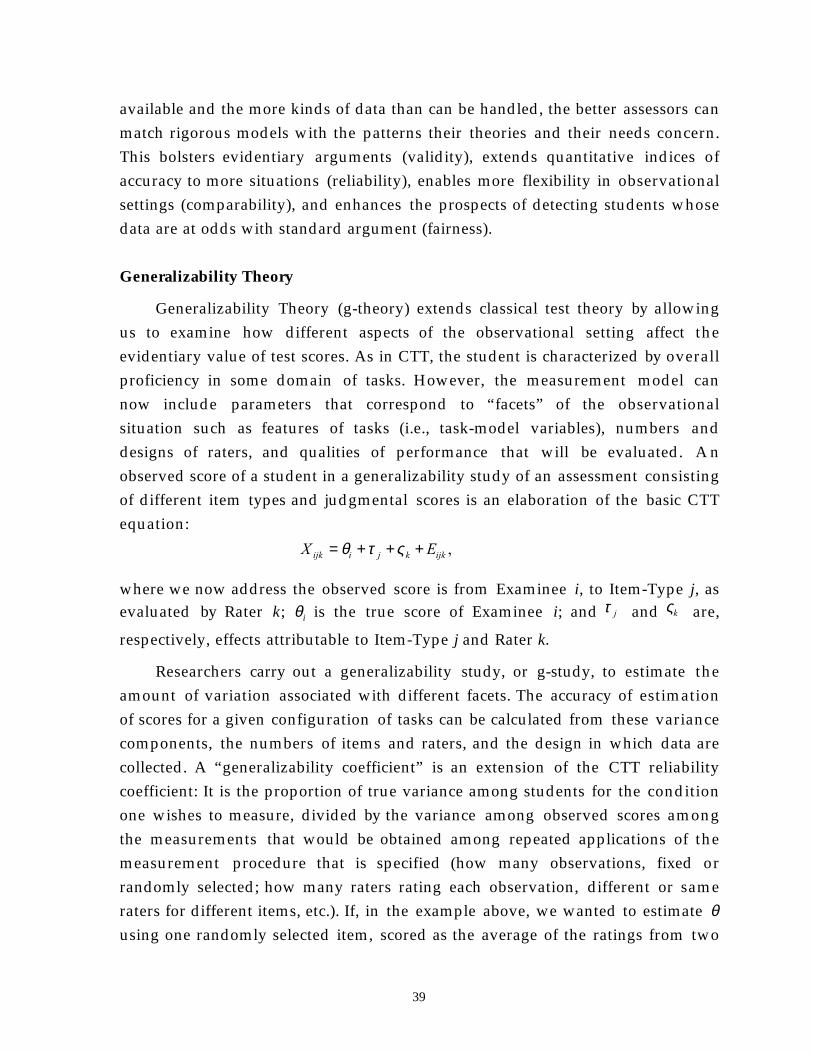
39
available and the more kinds of data than can be handled, the better assessors canmatch rigorous models with the patterns their theories and their needs concern.This bolsters evidentiary arguments (validity), extends quantitative indices ofaccuracy to more situations (reliability), enables more flexibility in observationalsettings (comparability), and enhances the prospects of detecting students whosedata are at odds with standard argument (fairness).
Generalizability Theory
Generalizability Theory (g-theory) extends classical test theory by allowingus to examine how different aspects of the observational setting affect theevidentiary value of test scores. As in CTT, the student is characterized by overallproficiency in some domain of tasks. However, the measurement model cannow include parameters that correspond to “facets” of the observationalsituation such as features of tasks (i.e., task-model variables), numbers anddesigns of raters, and qualities of performance that will be evaluated. A nobserved score of a student in a generalizability study of an assessment consistingof different item types and judgmental scores is an elaboration of the basic CTTequation:
,ijkkjiijk EX +++= ςτθ
where we now address the observed score is from Examinee i, to Item-Type j, asevaluated by Rater k; θi is the true score of Examinee i; and jτ and kς are,
respectively, effects attributable to Item-Type j and Rater k.
Researchers carry out a generalizability study, or g-study, to estimate theamount of variation associated with different facets. The accuracy of estimationof scores for a given configuration of tasks can be calculated from these variancecomponents, the numbers of items and raters, and the design in which data arecollected. A “generalizability coefficient” is an extension of the CTT reliabilitycoefficient: It is the proportion of true variance among students for the conditionone wishes to measure, divided by the variance among observed scores amongthe measurements that would be obtained among repeated applications of themeasurement procedure that is specified (how many observations, fixed orrandomly selected; how many raters rating each observation, different or sameraters for different items, etc.). If, in the example above, we wanted to estimate θusing one randomly selected item, scored as the average of the ratings from two

40
randomly selected raters, the coefficient of generalizability, denoted here as α ,would be calculated as follows:
( ) ,2
2222
2
Eσσσσσα
ςτθ
θ
+++=
where 2
θσ , 2
τσ , 2
ςσ , and 2
Eσ are variance coefficients for examinees, item-types,
raters, and error respectively.
The information resulting from a generalizability study can thus guidedecisions about how to design procedures for making observations; for example,what design for assigning raters to performances, how many tasks and raters, andwhether to average across raters, tasks, etc. In the BEAR Assessment System, a g-study could be carried out to see which type of assessment, embedded tasks orlink items, resulted in more reliable scores. It could also be used to examinewhether teachers were as consistent as external raters.
G-theory offers two important practical advantages over CTT: First,generalizability models allow us to characterize how the particulars of theevaluation rules and task model variables affect the value of the evidence wegain about the student for various inferences. Second, this information isexpressed in terms that allow us to project these evidentiary-valueconsiderations to designs we have not actually used, but which could beconstructed from elements similar to the ones we have observed. G-theory thusprovides far-reaching extensions of the Spearman-Brown formula (Equation 3)for exploring issues of reliability and comparability in a broader array of data-collection designs than CTT can.
Generalizability theory was developed by Professor Lee Cronbach and hiscolleagues, and their monograph, The Dependability of Behavioral
Measurements (Cronbach et al., 1972), remains a valuable source of informationand insight. More recent sources, such as Shavelson and Webb (1991) andBrennan (1983), provide the practitioner with friendlier notation and examplesto build on.
Item Response Theory (IRT)
Classical test theory and generalizability theory share a serious shortcoming:measures of examinees are confounded with the characteristics of test items. It is
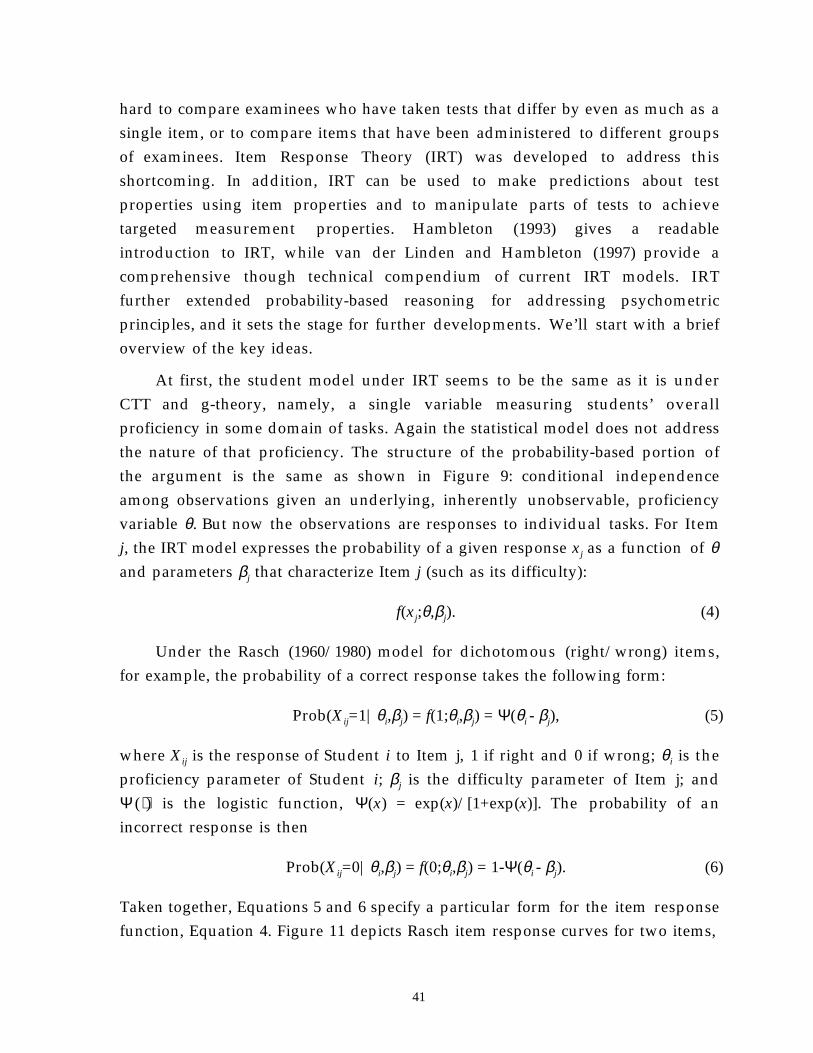
41
hard to compare examinees who have taken tests that differ by even as much as asingle item, or to compare items that have been administered to different groupsof examinees. Item Response Theory (IRT) was developed to address thisshortcoming. In addition, IRT can be used to make predictions about testproperties using item properties and to manipulate parts of tests to achievetargeted measurement properties. Hambleton (1993) gives a readableintroduction to IRT, while van der Linden and Hambleton (1997) provide acomprehensive though technical compendium of current IRT models. IRTfurther extended probability-based reasoning for addressing psychometricprinciples, and it sets the stage for further developments. We’ll start with a briefoverview of the key ideas.
At first, the student model under IRT seems to be the same as it is underCTT and g-theory, namely, a single variable measuring students’ overallproficiency in some domain of tasks. Again the statistical model does not addressthe nature of that proficiency. The structure of the probability-based portion ofthe argument is the same as shown in Figure 9: conditional independenceamong observations given an underlying, inherently unobservable, proficiencyvariable θ. But now the observations are responses to individual tasks. For Itemj, the IRT model expresses the probability of a given response xj as a function of θand parameters βj that characterize Item j (such as its difficulty):
f(xj;θ,βj). (4)
Under the Rasch (1960/1980) model for dichotomous (right/wrong) items,for example, the probability of a correct response takes the following form:
Prob(Xij=1|θi,βj) = f(1;θi,βj) = Ψ(θi - βj), (5)
where Xij is the response of Student i to Item j, 1 if right and 0 if wrong; θi is theproficiency parameter of Student i; βj is the difficulty parameter of Item j; andΨ (⋅) is the logistic function, Ψ(x) = exp(x)/[1+exp(x)]. The probability of anincorrect response is then
Prob(Xij=0|θi,βj) = f(0;θi,βj) = 1-Ψ(θi - βj). (6)
Taken together, Equations 5 and 6 specify a particular form for the item responsefunction, Equation 4. Figure 11 depicts Rasch item response curves for two items,
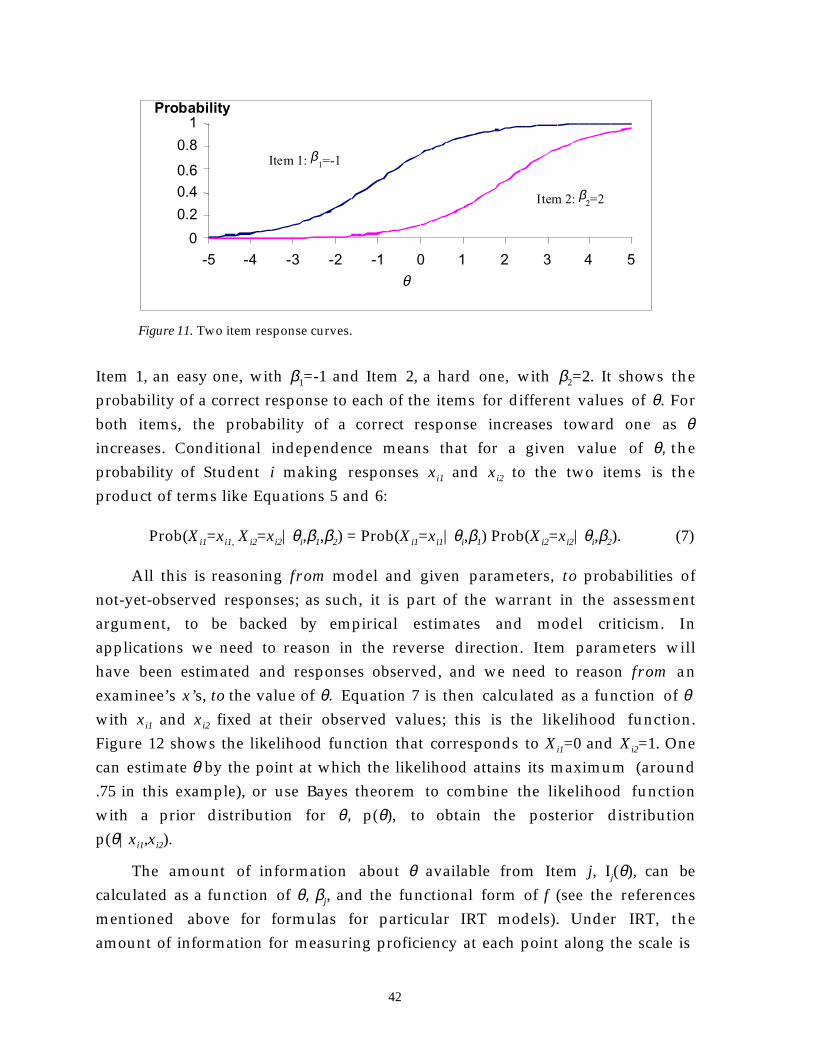
42
0
0.2
0.40.6
0.8
1
-5 -4 -3 -2 -1 0 1 2 3 4 5θ
Probability
Item 1: β1=-1
Item 2: β2=2
Figure 11. Two item response curves.
Item 1, an easy one, with β1=-1 and Item 2, a hard one, with β2=2. It shows theprobability of a correct response to each of the items for different values of θ. Forboth items, the probability of a correct response increases toward one as θincreases. Conditional independence means that for a given value of θ, theprobability of Student i making responses xi1 and xi2 to the two items is theproduct of terms like Equations 5 and 6:
Prob(Xi1=xi1, Xi2=xi2|θi,β1,β2) = Prob(Xi1=xi1|θi,β1) Prob(Xi2=xi2|θi,β2). (7)
All this is reasoning from model and given parameters, to probabilities ofnot-yet-observed responses; as such, it is part of the warrant in the assessmentargument, to be backed by empirical estimates and model criticism. Inapplications we need to reason in the reverse direction. Item parameters willhave been estimated and responses observed, and we need to reason from anexaminee’s x’s, to the value of θ. Equation 7 is then calculated as a function of θ with xi1 and xi2 fixed at their observed values; this is the likelihood function.Figure 12 shows the likelihood function that corresponds to Xi1=0 and Xi2=1. Onecan estimate θ by the point at which the likelihood attains its maximum (around.75 in this example), or use Bayes theorem to combine the likelihood functionwith a prior distribution for θ, p(θ), to obtain the posterior distributionp(θ|xi1,xi2).
The amount of information about θ available from Item j, Ij(θ), can becalculated as a function of θ, βj, and the functional form of f (see the referencesmentioned above for formulas for particular IRT models). Under IRT, theamount of information for measuring proficiency at each point along the scale is
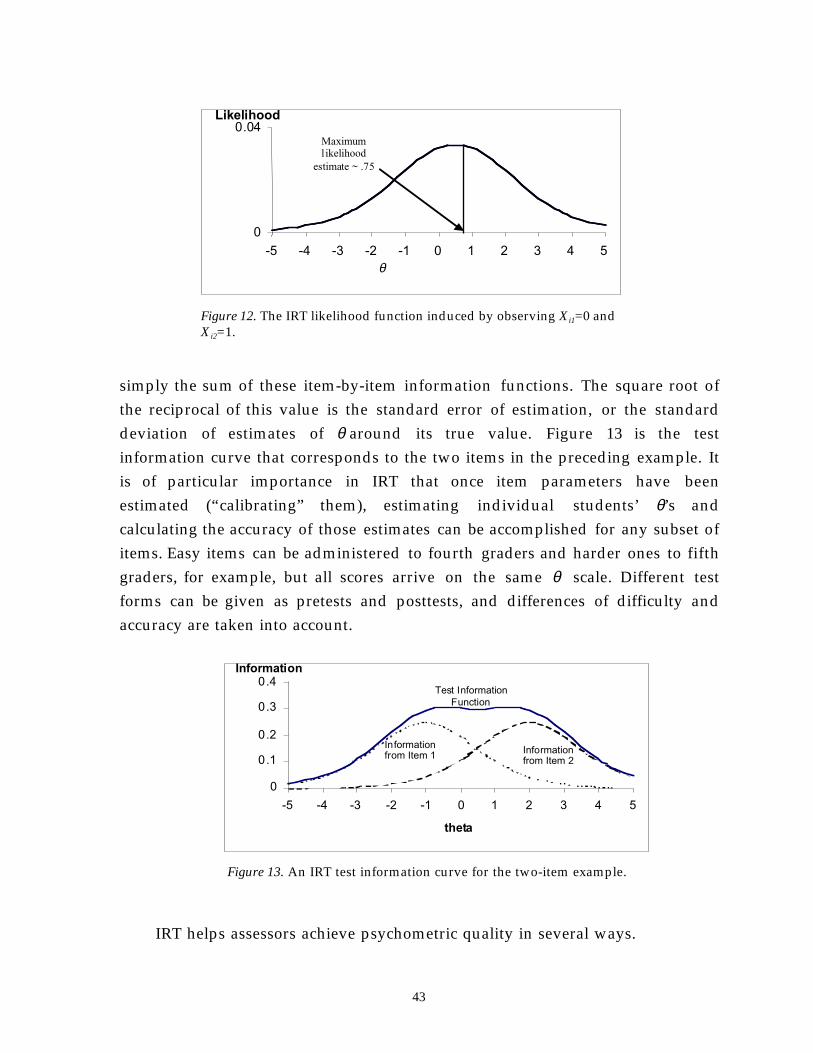
43
Figure 12. The IRT likelihood function induced by observing Xi1=0 andXi2=1.
simply the sum of these item-by-item information functions. The square root ofthe reciprocal of this value is the standard error of estimation, or the standarddeviation of estimates of θ around its true value. Figure 13 is the testinformation curve that corresponds to the two items in the preceding example. Itis of particular importance in IRT that once item parameters have beenestimated (“calibrating” them), estimating individual students’ θ’s andcalculating the accuracy of those estimates can be accomplished for any subset ofitems. Easy items can be administered to fourth graders and harder ones to fifthgraders, for example, but all scores arrive on the same θ scale. Different testforms can be given as pretests and posttests, and differences of difficulty andaccuracy are taken into account.
0
0.1
0.2
0.3
0.4
-5 -4 -3 -2 -1 0 1 2 3 4 5
theta
Information
Test InformationFunction
Informationfrom Item 1 Information
from Item 2
Figure 13. An IRT test information curve for the two-item example.
IRT helps assessors achieve psychometric quality in several ways.
0
0.04
-5 -4 -3 -2 -1 0 1 2 3 4 5θ
Likelihood
Maximum
likelihood
estimate ~ .75

44
Concerning validity. The statistical framework indicates the patterns ofobservable responses that would occur in data if it were actually the case that asingle underlying proficiency did account for all the systematic variation amongstudents and items. All the tools of model criticism from five centuries ofprobability-based reasoning can be brought to bear to assess how well an IRTmodel fits a given data set, and where it breaks down, now item by item, studentby student. The IRT model does not address the substance of the tasks, but byhighlighting tasks that are operating differently than others, or proving harder oreasier than expected, it helps test designers improve their work.
Concerning reliability. Once item parameters have been estimated, aresearcher can gauge the precision of measurement that would result fromdifferent configurations of tasks. Precision of estimation can be gauged uniquelyfor any matchup between a person and a set of items. We are no longer bound tomeasures of reliability that are tied to specific populations and fixed test forms.
Concerning comparability. IRT offers strategies beyond the reach of CTT andg-theory for assembling tests that “measure the same thing.” These strategiescapitalize on the above-mentioned capability to predetermine the precision ofestimation from different sets of items at different levels of θ. Tests that provideoptimal measurement for mastery decisions can be designed, for example, as cantests that provide targeted amounts of precision at specified levels of proficiency(van der Linden, 1998). Large content domains can be covered in educationalsurveys by giving each student only a sample of the tasks, yet using IRT to mapall performances onto the same scale. The National Assessment of EducationalProgress, for example, has made good use of the efficiencies of this item samplingin conjunction with reporting based on IRT (Messick, Beaton, & Lord, 1983).Tests can even be assembled on the fly in light of a student’s previous responsesas assessment proceeds, a technique called adaptive testing (see Wainer et al.,2000, for practical advice on constructing computerized adaptive tests).
Concerning fairness. An approach called “differential item functioning”(DIF) analysis, based on IRT and related methods, has enabled both researchersand large-scale assessors to routinely and rigorously test for a particular kind ofunfairness (e.g., Holland and Thayer, 1988; Lord, 1980). The idea is that a testscore, such as a number-correct or an IRT θ estimate, is a summary over a largenumber of item responses, and a comparison of students at the level of scoresimplies that they are similarly comparable across the domain being assessed. But

45
what if some of the given items are systematically harder for students from agroup defined by cultural or educational background, for reasons that are notrelated to the knowledge or skill that is meant to be measured? This is DIF, and itcan be formally represented in a model containing interaction terms for items bygroups by overall proficiency—an interaction whose presence can threaten scoremeaning and distort comparisons across groups. A finding of significant DIF canimply that the observation framework needs to be modified, or if the DIF iscommon to many items, that the construct-representation argument isoversimplified.
DIF methods have been used in examining differential response patternsfor gender and ethnic groups for the last two decades and for language groupsmore recently. They are now being used to investigate whether different groupsof examinees of approximately the same ability appear to be using differingcognitive processes to respond to test items. Such uses include examiningwhether differential difficulty levels are due to differential cognitive processes,language differences (Ercikan, 1998), solution strategies and instructionalmethods (Lane, Wang, Magone, 1996), and skills required by the test that are notuniformly distributed across examinees (O’Neil and McPeek, 1993).
Extensions of IRT
We have just seen how IRT extends statistical modeling beyond theconstraints of classical test theory and generalizability theory. The simpleelements in the basic equation of IRT (Equation 4) can be elaborated in severalways, each time expanding the range of assessment situations to whichprobability-based reasoning can be applied in the pursuit of psychometricprinciples.
Multiple-category responses. Whereas IRT was originally developed withdichotomous (right/wrong) test items, researchers have extended the machineryto observations that are coded in multiple categories. This is particularly usefulfor performance assessment tasks that are evaluated by raters on, say, 0-5 scales.Samejima (1969) carried out pioneering work in this regard. Thissen andSteinberg (1986) explain the mathematics of the extension and provide a usefultaxonomy of multiple-category IRT models, and Wright and Masters (1982) offera readable introduction to their use.
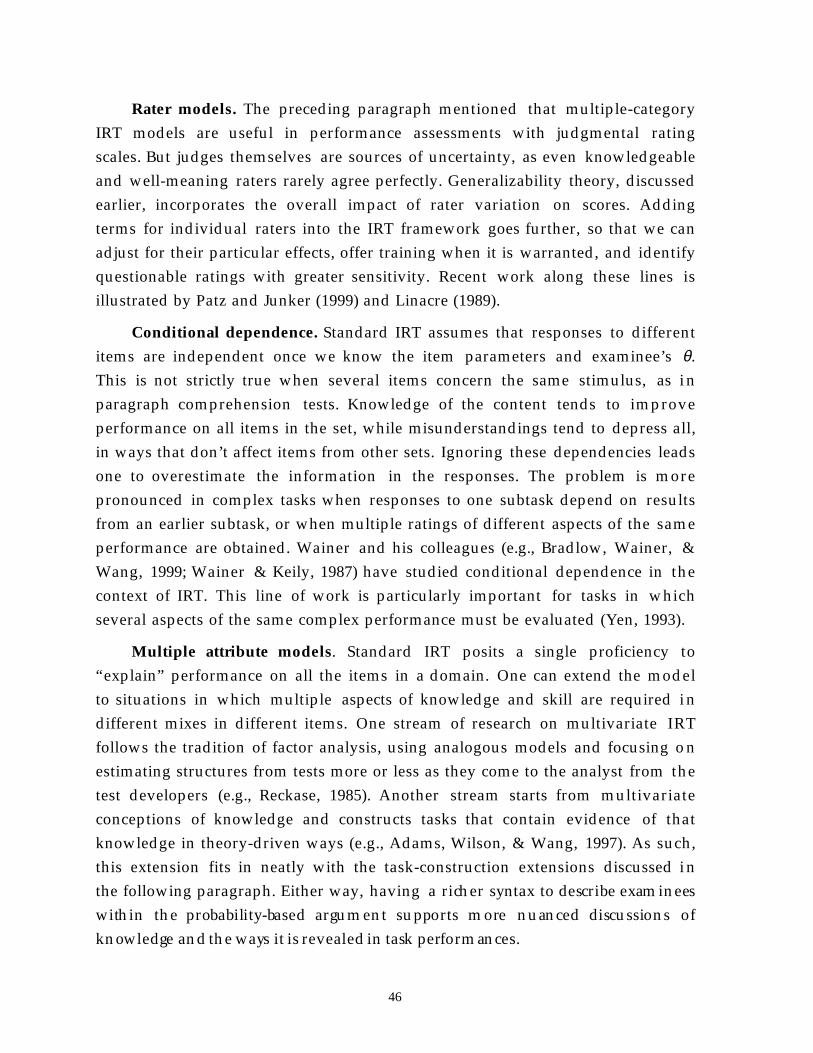
46
Rater models. The preceding paragraph mentioned that multiple-categoryIRT models are useful in performance assessments with judgmental ratingscales. But judges themselves are sources of uncertainty, as even knowledgeableand well-meaning raters rarely agree perfectly. Generalizability theory, discussedearlier, incorporates the overall impact of rater variation on scores. Addingterms for individual raters into the IRT framework goes further, so that we canadjust for their particular effects, offer training when it is warranted, and identifyquestionable ratings with greater sensitivity. Recent work along these lines isillustrated by Patz and Junker (1999) and Linacre (1989).
Conditional dependence. Standard IRT assumes that responses to differentitems are independent once we know the item parameters and examinee’s θ.This is not strictly true when several items concern the same stimulus, as i nparagraph comprehension tests. Knowledge of the content tends to improveperformance on all items in the set, while misunderstandings tend to depress all,in ways that don’t affect items from other sets. Ignoring these dependencies leadsone to overestimate the information in the responses. The problem is morepronounced in complex tasks when responses to one subtask depend on resultsfrom an earlier subtask, or when multiple ratings of different aspects of the sameperformance are obtained. Wainer and his colleagues (e.g., Bradlow, Wainer, &Wang, 1999; Wainer & Keily, 1987) have studied conditional dependence in thecontext of IRT. This line of work is particularly important for tasks in whichseveral aspects of the same complex performance must be evaluated (Yen, 1993).
Multiple attribute models. Standard IRT posits a single proficiency to“explain” performance on all the items in a domain. One can extend the modelto situations in which multiple aspects of knowledge and skill are required i ndifferent mixes in different items. One stream of research on multivariate IRTfollows the tradition of factor analysis, using analogous models and focusing onestimating structures from tests more or less as they come to the analyst from thetest developers (e.g., Reckase, 1985). Another stream starts from multivariateconceptions of knowledge and constructs tasks that contain evidence of thatknowledge in theory-driven ways (e.g., Adams, Wilson, & Wang, 1997). As such,this extension fits in neatly with the task-construction extensions discussed i nthe following paragraph. Either way, having a richer syntax to describe examineeswithin the probability-based argument supports more nuanced discussions ofknowledge and the ways it is revealed in task performances.
47
Incorporating item features into the model. Embretson (1983) not onlyargued for paying greater attention to construct representation in test design, sheargued for how to do it: incorporate task model variables into the statisticalmodel, and make explicit the ways that features of tasks impact examinees’performance. A signal article in this regard was Fischer’s (1973) linear logistic testmodel, or LLTM. The LLTM is a simple extension of the Rasch model shownearlier in Equation 5, with the further requirement that each item difficultyparameter β is the sum of effects that depend on the features of that particularitem:
where hk is the contribution to item difficulty from Feature k, and qjk is the extentto which Feature k is represented in Item j. Some of the substantiveconsiderations that drive task design can thus be embedded in the statisticalmodel, and the tools of probability-based reasoning are available to examine howwell they hold up in practice (validity), how they affect measurement precision(reliability), how they can be varied while maintaining a focus on targetedknowledge (comparability), and whether some items prove hard or easy forunintended reasons (fairness). Embretson (1998) walks through a detailedexample of test design, psychometric modeling, and construct validation fromthis point of view. Additional contributions along these lines can be found in thework of Tatsuoka (1990), Falmagne and Doignon (1988), Pirolli and Wilson(1998), and DiBello, Stout, and Roussos (1995).
Progress on Other Fronts
The steady extension of probability-based tools to wider ranges ofassessment uses has not been limited to IRT. In this section, we will mentionsome other important lines of development and point to work that is bringingthese many lines of progress into the same methodological framework.
Latent class models. Research on learning suggests that knowledge and skillsin some domains could be characterized as discrete states (e.g., the “productionrule” models John Anderson uses in his intelligent tutoringsystems—Anderson, Boyle, & Corbett, 1990). Latent class models characterize anexaminee as a member of one of a number of classes, rather than as a position on

48
a continuous scale (Dayton, 1999; Haertel, 1989; Lazarsfeld, 1950). The classesthemselves can be considered ordered or unordered. The key idea is that studentsin different classes have different probabilities of responding in designated waysin assessment settings, depending on their values of the knowledge and skillvariables that define the classes. When this is what theory suggests and purposerequires, using a latent class model offers the possibility of a more validinterpretation of assessment data. The probability-based framework of latent classmodeling again enables us to rigorously test this hypothesis, and to characterizethe accuracy with which observed responses identify students with classes.Reliability in latent class models is therefore expressed in terms of correctclassification rates.
Models for other kinds of data. All of the machinery of IRT, including theextensions to multivariate student models, raters, and task features, can beapplied to data other than just dichotomous and multiple-category observations.Less research and fewer applications appear in the literature, but the ideas can befound for counts (Rasch, 1960/1980), continuous variables (Samejima, 1973), andbehavior observations such as incidence and duration (Rogosa & Ghandour,1991).
Models that address interrelationships among variables. The developmentsin measurement models we have discussed encompass wider ranges of studentmodels, observations, and task features, all increasing the fidelity of probability-based models to real-world situations. This contributes to improved constructrepresentation. Progress on methods to study nomothetic span has taken place aswell. Important examples include structural equations models and hierarchicalmodels. Structural equations models (e.g., Jöreskog & Sörbom, 1979) incorporatetheoretical relationships among variables and simultaneously takemeasurement error into account, so that complex hypotheses can be posed andtested coherently. Hierarchical models (e.g., Bryk & Raudenbush, 1992)incorporate the ways that students are clustered in classrooms, classrooms withinschools, and schools within higher levels of organization, to better sort out thewithin- and across-level effects that correspond to a wide variety of instructional,organizational, and policy issues, and growth and change. Clearer specificationsand coherent statistical models of the relationships among variable helpresearchers frame and critique “nomothetic net” validity arguments.
49
Progress in statistical methodology. One kind of scientific breakthrough is torecognize situations previously handled with different models, differenttheories, or different methods as special cases of a single approach. Thepreviously mentioned models and accompanying computer programs forstructural equations and hierarchical analyses qualify. Both have significantlyadvanced statistical investigations in the social sciences, validity studies amongthem, and made formerly esoteric analyses more widely available.Developments taking place today in statistical computing are beginning torevolutionize psychometric analysis in a similar way.
Those developments comprise resampling-based estimation, full Bayesiananalysis, and modular construction of statistical models (Gelman, Carlin, Stern,and Rubin, 1995). The idea is this. The difficulty of managing evidence leadsmost substantive researchers to work within known and manageable families ofanalytic models; that is, ones with known properties, available procedures, andfamiliar exemplars. All of the psychometric models discussed above followedtheir own paths of evolution, each over the years generating its own language,its own computer programs, and its own community of practitioners. Moderncomputing approaches, such as Markov Chain Monte Carlo estimation, providea general approach to construct and fit such models with more flexibility, and seeall as variations on a common theme. In the same conceptual framework andwith the same estimation approach, we can carry out probability-based reasoningwith all of the models we have discussed.
Moreover, we can mix and match components of these models, and createnew ones, to produce models that correspond to assessment designs motivatedby theory and purpose. This approach stands in contrast to the compromises i ntheory and methods that result when we have to gather data to meet theconstraints of specific models and specialized computer programs. The freewarecomputer program BUGS (Spiegelhalter, Thomas, & Gilks, 1995) exemplifies thisbuilding-block approach. These developments are softening the boundariesbetween researchers who study psychometric modeling and those who addressthe substantive aspects of assessment. A more thoughtful integration ofsubstantive and statistical lines of evidentiary arguments in assessment willfurther the understanding and the attainment of psychometric principles.
50
Conclusion
These are days of rapid change in assessment.7 Advances in cognitivepsychology deepen our understanding of how students gain and use knowledge(National Research Council, 1999). Advances in technology make it possible tocapture more complex performances in assessment settings, by including, forexample, simulation, interactivity, collaboration, and constructed response(Bennett, 2001). Yet as forms of assessment evolve, two themes endure: theimportance of psychometric principles as guarantors of social values, and theirrealization through sound evidentiary arguments.
We have seen that the quality of assessment depends on the quality of theevidentiary argument, and how substance, statistics, and purpose must be woventogether throughout the argument. A conceptual framework, such as theassessment design models of Figure 1, helps experts from different fieldsintegrate their diverse work to achieve this end (Mislevy, Steinberg, Almond,Haertel, and Penuel, in press). Questions will persist, as to “How do wesynthesize evidence from disparate sources?” “How much evidence do wehave?” “Does it tell us what we think it does?” and “Are the inferencesappropriate for each student?” The perspectives and the methodologies thatunderlie psychometric principles—validity, reliability, comparability, andfairness—provide formal tools to address these questions, in whatever specificforms they arise.
7 Knowing What Students Know (National Research Council, 2001), a report by the Committee onthe Foundations of Assessment, surveys these developments.

51
References
Adams, R., Wilson, M. R., & Wang, W.-C. (1997). The multidimensional randomcoefficients multinomial logit model. Applied Psychological Measurement,21, 1-23.
Almond, R. G., & Mislevy, R. J. (1999). Graphical models and computerizedadaptive testing. Applied Psychological Measurement.
American Educational Research Association, American PsychologicalAssociation, & National Council on Measurement in Education. (1999).Standards for educational and psychological testing. Washington, DC:American Educational Research Association.
Anderson, J. R., Boyle, C. F., & Corbett, A. T. (1990). Cognitive modeling andintelligent tutoring. Artificial Intelligence, 42, 7-49.
Bennett, R. E. (2001). How the Internet will help large-scale assessment reinventitself. Education Policy Analysis, 9(5).
Bradlow, E. T., Wainer, H., & Wang, X. (1999). A Bayesian random effects modelfor testlets. Psychometrika, 64, 153-168.
Brennan, R. L. (1983). The elements of generalizability theory. Iowa City, IA:American College Testing Program.
Brennan, R. L. (2000/in press). An essay on the history and future of reliabilityfrom the perspective of replications. Paper presented at the Annual Meetingof the National Council on Measurement in Education, New Orleans, April2000. To appear in the Journal of Educational Measurement.
Brown, W. (1910). Some experimental results in the correlation of mentalabilities. British Journal of Psychology, 3, 296-322.
Bryk, A. S., & Raudenbush, S. (1992). Hierarchical linear models: Applicationsand data analysis methods. Newbury Park: Sage Publications.
Campbell, D. T., & Fiske, D. W. (1959). Convergent and discriminant validationby the multitrait-multimethod matrix. Psychological Bulletin, 56, 81-105.
Cohen, J. A. (1960). A coefficient of agreement for nominal scales. Educationaland Psychological Measurement, 20, 37-46.
Cronbach, L. J. (1951). Coefficient alpha and the internal structure of tests.Psychometrika, 17, 297-334.
52
Cronbach, L. J. (1989). Construct validation after thirty years. In R. L. Linn (Ed.),Intelligence: Measurement, theory, and public policy (pp. 147-171). Urbana,IL: University of Illinois Press.
Cronbach, L. J., Gleser, G. C., Nanda, H., & Rajaratnam, N. (1972). T h edependability of behavioral measurements: Theory of generalizability forscores and profiles. New York: Wiley.
Cronbach, L. J., & Meehl, P. E. (1955). Construct validity in psychological tests.Psychological Bulletin, 52, 281-302.
Dayton, C. M. (1999). Latent class scaling analysis. Thousand Oaks, CA: SagePublications.
Dibello, L. V., Stout, W. F., & Roussos, L. A. (1995). Unifiedcognitive/psychometric diagnostic assessment likelihood basedclassification techniques. In P. Nichols, S. Chipman, & R. Brennan (Eds.),Cognitively diagnostic assessment (pp. 361-389). Hillsdale, NJ: Erlbaum.
Embretson, S. (1983). Construct validity: Construct representation versusnomothetic span. Psychological Bulletin, 93, 179-197.
Embretson, S. E. (1998). A cognitive design systems approach to generating validtests: Application to abstract reasoning. Psychological Methods, 3, 380-396.
Ercikan, K. (1998). Translation effects in international assessments. InternationalJournal of Educational Research, 29, 543-553.
Ercikan, K., & Julian, M. (2001). Classification accuracy of assigning studentperformance to proficiency levels: Guidelines for assessment design.Applied Measurement in Education, 15, 269-294.
Falmagne, J.-C., & Doignon, J.-P. (1988). A class of stochastic procedures for theassessment of knowledge. British Journal of Mathematical and StatisticalPsychology, 41, 1-23.
Fischer, G. H. (1973). The linear logistic test model as an instrument i neducational research. Acta Psychologica, 37, 359-374.
Gelman, A., Carlin, J., Stern, H., and Rubin, D. B. (1995). Bayesian data analysis.London: Chapman and Hall.
Greeno, J. G., Collins, A. M., & Resnick, L. B. (1996). Cognition and learning. In D.C. Berliner and R. C. Calfee (Eds.), Handbook of educational psychology (pp.15-146). New York: MacMillan.
Gulliksen, H. (1987). Theory of mental tests. Hillsdale, NJ: Erlbaum. (Originalwork published 1950)

53
Haertel, E. H. (1989). Using restricted latent class models to map the skillstructure of achievement test items. Journal of Educational Measurement,26, 301-321.
Haertel, E. H., & Wiley, D. E. (1993). Representations of ability structures:Implications for testing. In N. Frederiksen, R. J. Mislevy, and I. I. Bejar(Eds.), Test theory for a new generation of tests. Hillsdale, NJ: Erlbaum.
Hambleton, R. J. (1993). Principles and selected applications of item responsetheory. In R. L. Linn (Ed.), Educational measurement (3rd ed., pp. 147-200).Phoenix, AZ: American Council on Education/Oryx Press.
Hambleton, R. K., & Slater, S. C. (1997). Reliability of credentialing examinationsand the impact of scoring models and standard-setting policies. AppliedMeasurement in Education, 10, 19-39.
Holland, P. W., & Thayer, D. T. (1988). Differential item performance and theMantel-Haenzsel procedures. In H. Wainer and H. I. Braun (Eds.), Testvalidity (pp. 129-145). Hillsdale, NJ: Erlbaum.
Holland, P. W., & Wainer, H. (1993). Differential item functioning. Hillsdale, NJ:Erlbaum.
Jöreskog, K. G., & Sörbom, D. (1979). Advances in factor analysis and structuralequation models. Cambridge, MA: Abt Books.
Kadane, J. B., & Schum, D. A. (1996). A probabilistic analysis of the Sacco a n dVanzetti evidence. New York: Wiley.
Kane, M. T. (1992). An argument-based approach to validity. PsychologicalBulletin, 112, 527-535.
Kelley, T. L. (1927). Interpretation of Educational Measurements. New York:World Book.
Kuder, G. F., & Richardson, M. W. (1937). The theory of estimation of testreliability. Psychometrika, 2, 151-160.
Lane, W., Wang., N., & Magone, M. (1996). Gender-related differential itemfunctioning on a middle-school mathematics performance assessment.Educational measurement: Issues and practice, 15(4), 21-27; 31.
Lazarsfeld, P. F. (1950). The logical and mathematical foundation of latentstructure analysis. In S. A. Stouffer, L. Guttman, E. A. Suchman, P. R.Lazarsfeld, S. A. Star, and J. A Clausen (Eds.), Measurement and prediction(pp. 362-412). Princeton, NJ: Princeton University Press.

54
Levine, M., & Drasgow, F. (1982). Appropriateness measurement: Review,critique, and validating studies. British Journal of Mathematical a n dStatistical Psychology, 35, 42-56.
Linacre, J. M. (1989). Many faceted Rasch measurement. Chicago: MESA Press.
Lord, F. M. (1980). Applications of item response theory to practical testingproblems. Hillsdale, NJ: Erlbaum.
Lord, R. M., & Novick, M. R. (1968). Statistical theories of mental test scores.Reading, MA: Addison-Wesley.
Martin, J. & VanLehn, K. (1995). A Bayesian approach to cognitive assessment. InP. Nichols, S. Chipman & R. L. Brennan (Eds.), Cognitively DiagnosticAssessment (pp. 141-165). Hillsdale, NJ: Erlbaum.
Messick, S. (1989). Validity. In R. L. Linn (Ed.), Educational measurement (3rd ed.,pp. 13-103). New York: American Council on Education/Macmillan.
Messick, S. (1994). The interplay of evidence and consequences in the validationof performance assessments. Education Researcher, 32(2), 13-23.
Messick, S., Beaton, A. E., & Lord, F. M. (1983). National Assessment ofEducational Progress reconsidered: A new design for a new era. NAEPReport 83-1. Princeton, NJ: National Assessment of Educational Progress.
Mislevy, R. J., Steinberg, L. S., & Almond, R. G. (in press). On the roles of taskmodel variables in assessment design. To appear in S. Irvine & P. Kyllonen(Eds.), Generating items for cognitive tests: Theory and practice. Hillsdale,NJ: Erlbaum.
Mislevy, R. J., Steinberg, L. S., Almond, R. G., Haertel, G., & Penuel, W. (in press).Leverage points for improving educational assessment. In B. Means & G.Haertel (Eds.), Evaluating the effects of technology in education. Hillsdale,NJ: Erlbaum.
Mislevy, R. J., Steinberg, L. S., Breyer, F. J., Almond, R. G., & Johnson, L. (1999). Acognitive task analysis, with implications for designing a simulation-basedassessment system. Computers and Human Behavior, 15, 335-374.
Mislevy, R. J., Steinberg, L. S., Breyer, F. J., Almond, R. G., & Johnson, L. (inpress). Making sense of data from complex assessment. AppliedMeasurement in Education.
Myford, C. M., & Mislevy, R. J. (1995). Monitoring and improving a portfolioassessment system (Center for Performance Assessment Research Report).Princeton, NJ: Educational Testing Service.
55
Bransford, J. D., Brown, A. L., and Cocking, R. R. (Eds.). (1999). How people learn:Brain, mind, experience, and school. Committee on Developments in theScience of Learning, Commission on Behavioral and Social Sciences andEducation, National Research Council. Washington, DC: National AcademyPress.
Committee on the Foundations of Assessment. Pellegrino, J., Chudowsky, N.,and Glaser, R., (Eds.). (2001). Knowing what students know: The science a n ddesign of educational assessment. National Research Council. Washington,DC: National Academy Press.
O’Neil, K. A., & McPeek, W. M. (1993). Item and test characteristics that areassociated with differential item functioning. In P. W. Holland, & H.Wainer (Eds.), Differential item functioning. (pp. 255-276). Hillsdale, NJ:Erlbaum.
Patz, R. J., & Junker, B. W. (1999). Applications and extensions of MCMC in IRT:Multiple item types, missing data, and rated responses. Journal o fEducational and Behavioral Statistics, 24(4), 342-366.
Petersen, N. S., Kolen, M. J., & Hoover, H. D. (1989). Scaling, norming, andequating. In R. L. Linn (Ed.), Educational measurement (3rd ed., pp. 221-262).New York: American Council on Education/Macmillan.
Pirolli, P., & Wilson, M. (1998). A theory of the measurement of knowledgecontent, access, and learning. Psychological Review 105(1), 58-82.
Rasch, G. (1960/1980). Probabilistic models for some intelligence and attainmenttests. Copenhagen: Danish Institute for Educational Research/Chicago:University of Chicago Press (reprint).
Reckase, M. (1985). The difficulty of test items that measure more than oneability. Applied Psychological Measurement, 9, 401-412.
Rogosa, D. R., & Ghandour, G. A. (1991). Statistical models for behavioralobservations (with discussion). Journal of Educational Statistics, 16, 157-252.
Samejima, F. (1969). Estimation of latent ability using a response pattern ofgraded scores. Psychometrika Monograph No. 17, 34 (4, Pt. 2).
Samejima, F. (1973). Homogeneous case of the continuous response level.Psychometrika, 38, 203-219.
Schum, D. A. (1987). Evidence and inference for the intelligence analyst.Lanham, MD: University Press of America.
56
Schum, D. A. (1994). The evidential foundations of probabilistic reasoning. NewYork: Wiley.
SEPUP (1995). Issues, evidence, and you: Teacher’s guide. Berkeley: LawrenceHall of Science.
Shavelson, R. J., & Webb, N. W. (1991). Generalizability theory: A primer.Newbury Park, CA: Sage Publications.
Spearman, C. (1904). The proof and measurement of association between twothings. American Journal of Psychology, 15, 72-101.
Spearman, C. (1910). Correlation calculated with faulty data. British Journal o fPsychology, 3, 271-295.
Spiegelhalter, D. J., Thomas, A., Best, N. G., & Gilks, W. R. (1995). BUGS:Bayesian inference using Gibbs sampling, Version 0.50. Cambridge: MRCBiostatistics Unit.
Tatsuoka, K. K. (1990). Toward an integration of item response theory andcognitive error diagnosis. In N. Frederiksen, R. Glaser, A. Lesgold, & M. G.Shafto (Eds.), Diagnostic monitoring of skill and knowledge acquisition (pp.453-488). Hillsdale, NJ: Erlbaum.
Thissen, D., & Steinberg, L. (1986). A taxonomy of item response models.Psychometrika, 51, 567-77.
Toulmin, S. (1958). The uses of argument. Cambridge, England: University Press.
Traub, R. E., & Rowley, G. L. (1980). Reliability of test scores and decisions.Applied Psychological Measurement, 4, 517-545.
van der Linden, W. J. (1998). Optimal test assembly. Applied PsychologicalMeasurement, 22, 195-202.
van der Linden, W. J., & Hambleton, R. K. (1997). Handbook of modern i t e mresponse theory. New York: Springer.
Wainer, H., Dorans, N. J., Flaugher, R., Green, B. F., Mislevy, R. J., Steinberg, L.,et al. (2000). Computerized adaptive testing: A primer (2nd ed.). Hillsdale,NJ: Erlbaum.
Wainer, H., & Keily, G. L. (1987). Item clusters and computerized adaptivetesting: A case for testlets. Journal of Educational Measurement, 24, 195-201.
Wiley, D. E. (1991). Test validity and invalidity reconsidered. In R. E. Snow & D.E. Wiley (Eds.), Improving inquiry in social science (pp. 75-107). Hillsdale,NJ: Erlbaum.
57
Willingham, W. W., & Cole, N. S. (1997). Gender and fair assessment. Mahwah,NJ: Erlbaum.
Wilson, M., & Sloane, K. (2000). From principles to practice: An embeddedassessment system. Applied Measurement in Education, 13(2), 181-208.
Wolf, D., Bixby, J., Glenn, J., & Gardner, H. (1991). To use their minds well:Investigating new forms of student assessment. In G. Grant (Ed.), Review o fEducational Research, Vol. 17 (pp. 31-74). Washington, DC: AmericanEducational Research Association.
Wright, B. D., & Masters, G. N. (1982). Rating scale analysis. Chicago: MESA Press.
Yen, W. M. (1993). Scaling performance assessments: Strategies for managinglocal item dependence. Journal of Educational Measurement, 30, 187-213.