Embed Size (px)
Citation preview

Psychophysiological responses to affective stimuliin high, moderate, and low socialized students
Item Type text; Dissertation-Reproduction (electronic)
Authors Dikman, Ziya
Publisher The University of Arizona.
Rights Copyright © is held by the author. Digital access to this materialis made possible by the University Libraries, University of Arizona.Further transmission, reproduction or presentation (such aspublic display or performance) of protected items is prohibitedexcept with permission of the author.
Download date 22/05/2018 16:16:40
Link to Item http://hdl.handle.net/10150/280347
PSYCHOPHYSIOLOGICAL RESPONSES TO AFFECTIVE STIMULI
IN HIGH, MODERATE, AND LOW SOCIALIZED STUDENTS.
by
Ziya Vedat Dikman
A Dissertation Submitted to the Faculty of the
DEPARTMENT OF PSYCHOLOGY
In Partial Fulfillment of the Requirements
For the Degree of
DOCTOR OF PHILOSOPHY
In the Graduate College
THE UNIVERSITY OF ARIZONA
2 0 0 3

UMI Number: 3106979
INFORMATION TO USERS
The quality of this reproduction is dependent upon the quality of the copy
submitted. Broken or indistinct print, colored or poor quality illustrations and
photographs, print bleed-through, substandard margins, and improper
alignment can adversely affect reproduction.
In the unlikely event that the author did not send a complete manuscript
and there are missing pages, these will be noted. Also, if unauthorized
copyright material had to be removed, a note will indicate the deletion.
UMI UMI Microform 3106979
Copyright 2004 by ProQuest Information and Learning Company.
All rights reserved. This microform edition is protected against
unauthorized copying under Title 17, United States Code.
ProQuest Information and Learning Company 300 North Zeeb Road
P.O. Box 1346 Ann Arbor, Ml 48106-1346
9
THE UNIVERSITY OF ARIZONA ® GRADUATE COLLEGE
As members of the Final Examination Committee, we certify that we have
read the dissertation prepared by Ziya Vedat Dikman
entitled PSYCHOPHYSIOLOGICAL RESPONSES TO AFFECTIVE STIMULI
IN HIGH, MODERATE, AND LOW SOCIALIZED STUDENTS.
and recommend that it be accepted as fulfilling the dissertation
nnCTOR OF PHTT.osnPHY
HMol. Date f// Date'' • / i
Final approval and acceptance of this dissertation is contingent upon the candidate's submission of the final copy of the dissertation to the Graduate College.
I hereby certify that I have read this dissertation prepared under my direction and recommend that it be accepted as fulfilling the dissertation requirement.
Dissertation Director Date
3
STATEMENT BY AUTHOR
This dissertation has been submitted in partial fulfillment of requirements
for an advanced degree at The University of Arizona and is deposited in the University
Library to be made available to borrowers under rules of the Library.
permission, provided that accurate acknowledgment of source is made. Requests for
permission for extended quotation from or reproduction of this manuscript in whole or in
part may be granted by. the head of the major department or the Dean of the Graduate
College when in his or her judgment the proposed use of the material is in the interests of
scholarship. In all other instances, however, permission must be obtained from the
author.
Brief quotations from this dissertation are allowable without special
SIGNED:
4
ACKNOWLEDGEMENTS
I wish to thank my friends, family, and faculty mentors for their invaluable
assistance in helping me to prepare this document. Thanks to my mother and father for
moving to the US when I was but 9 months old - my German is so terrible that I
undoubtedly wouldn't have amounted to much had we stayed there (as if I've amounted
to anything so far). Thank you father for helping me see the world differently than most
and for hating the idea of me becoming a psychologist so much that I was left with no
other option than to walk this path. Thanks to my brother, Sabri, for being a case study in
"low socialized" behavior as a teen and then going on to teach me that people do change.
Thanks to my friend David Schnyer for being the most supportive buddy any person
could ever hope to know.
My gratitude for the time and efforts put forth by my early mentors, Dick
Bootzin and Gary Schwartz. They helped me transition from undergraduate lab-rat to
graduate lab-rat: no small feat. Thanks to A1 Kaszniak, Geoff Ahern, and Anne Herring
for patiently teaching me about the nature of the brain and about what it is to be a
Neuropsychologist. Finally, I can find no way to express the depth and breadth of my
gratitude to John J.B. Allen. You are a teacher sans equal.
What a long strange trip it has been - may the trip only get stranger and
more interesting with each step.
5
DEDICATION
For Selim Dikman, M.D. - my father and hero.
TABLE OF CONTENTS
ABSTRACT
PSYCHOPHYSIOLOGICAL RESPONSES TO AFFECTIVE
STIMULI IN HIGH, MODERATE AND LOW SOCIALIZED
STUDENTS
The selective psychophysiology of psychopathy and low socialization 10
The cortical psychophysiology of emotion 15
The present investigation 17
METHOD 21
Participants 21
Procedure 22
EMG Data Reduction and Processing 25
EEG Data Reduction and Processing 26
Startle Probe-Locked ERPs 27
Picture-Locked ERPs 27
RESULTS 30
Questionnaire Data 30
Behavioral Data 31
Startle Probe: Startle Blink EMG data 33
Startle Probe: ERPs 34
Picture-Locked ERPs 38
DISCUSSION 45
7
TABLE OF CONTENTS - CONTINUED
Replication of previous research 45
Socialization and its relationship to affective processing 49
Summary 54
APPENDIX A: TABLES 56
APPENDIX B; FIGURES 58
REFERENCES 79
8
ABSTRACT
Psychophysiological responses (e.g. startle blink magnitude and ERPs)
have demonstrated sensitivity to individual differences in humans (e.g. Patrick, Bradley,
& Lang, 1993), as well as discriminating between the valence and arousal qualities of
affective stimuli such as photographs depicting varying emotional content. The present
study examines startle blink responses and event-related potential (ERP) measures in
students, selected based on their level of socialization, as they viewed 54 slides that fell
into one of three affective categories (pleasant, neutral, unpleasant). Results supported a
slightly modified version of a theory suggesting that attentional processes are modified
by the affective environment (Cuthbert et al, (2000)). Results did not support hypotheses
predicting that low socialized individuals would respond to affective stimuli in much the
same way as true psychopaths do.
9
PSYCHOPHYSIOLOGICAL RESPONSES TO AFFECTIVE STIMULI IN HIGH,
MODERATE AND LOW SOCIALIZED STUDENTS
The manner by which human beings process affective information is of
vital importance to their ability to survive in a wide variety of environments. Within the
field of research on emotion, two broad categories of influence have emerged: appetitive
and aversive motivations. These motivations provide the discriminative basis for many
of the most basic, necessary, and common decisions that are made by humans and other
animals. The fundamental importance of such processing is self evident; fight and flight
decisions are made in response to fear evoking (aversive) stimuli. Approach decisions
are made in response to stimuli holding out the promise of biologically rewarding
(appetitive) opportunities.
It therefore follows that an alteration in the ability to process affective
information may negatively impact an individual's ability to thrive or even survive in his
or her environment. These alterations would be likely to predispose individuals to make
poor choices, which might be observable across the lifespan of an individual as an
increase in the rate of biological, psychological, or social problems experienced by the
individual. It is therefore plausible to consider that a systematically observed increase in
the rate of biological, psychological, or social problems in a group of individuals with
similar characteristics may be due to problems in the manner by which they process
affective stimuli.
The construct of psychopathy, a severe personality disorder, fits the above
model. Perhaps the most fundamental deficit, as described by Cleckley (1976), entails a
10
dissociation between the literal understanding of emotional information and the ability to
utilize ox feel the deeper, non-linguistic properties of affective information. A growing
body of evidence is providing support for this dissociation. However, emotional
processing per se, in psychopaths or normal populations has not been the focus of a great
deal of attention, possibly because of methodological and conceptual limitations.
However, as the state-of-the-art advances, these limitations are slowly being overcome
and more substantive examinations of emotional processes are possible.
An initial attempt to summarize the literature describing affective and
related cognitive processing deficits in psychopaths and low socialized groups will be
followed by an examination of psychophysiological differences between psychopaths
(and the related, broader category including the low socialized) and non-psychopaths is
provided in the following section. After this, a description of recent work examining
central nervous system measures of affective processing is described, followed by
discussion of a relatively new and underutilized psychophysiological method. After
summarizing the methodological approach for the present study, specific hypotheses
formulated in response to the existing literature shall be offered.
The selective psychophysiology of psychopathy and low socialization
The experimental literature examining the psychophysiology of affective
processes in psychopaths has largely utilized two different methodologies: event related
potentials (ERPs) in response to affective words, and examinations of peripheral
psychophysiology in response to affective pictures. This literature is further constrained
by many authors' focus particular theories of attention and hemispheric lateralization that
11
often lead to conceptually perplexing interpretations of exceedingly complex
experiments. Although newer methodologies and theories are beginning to be developed,
little empirical work has been published.
Several commonly-measured components of the ERP are believed to vary
as a function of attention. The N1 and P3 components have both been measured in
samples of psychopaths. Jutai and Hare (1983) examined the N1 component of the ERP
in both selective and passive attention tasks in high and low psychopathy iimiates. They
found no between-group differences in N1 amplitude when participants merely listened
to 60 dB tones. When participants were playing a video game and told to ignore the same
tones as irrelevant, the high-psychopathy group produced smaller Nls during the first
trial than the low psychopathy group. This was interpreted by the authors to reflect the
inability of the low psychopathy group to immediately ignore task-irrelevant stimuli.
Similar attentional effects were observed by Raine and Venables (1987) in an
examination of the CNV, Nl, and P3 in antisocial adolescents while they completed a
cued, reaction time task. The authors report finding P3 amplitudes to the warning
stimulus in the antisocial adolescents that were twice as large than those produced by the
prosocial comparison group. The authors interpret these data as "reflecting a heightened
ability to selectively attend to events of interest" (p36).
In a follow-up experiment, Raine and Venables (1988) examined P3 in
Psychopathy Check List (PCL; Hare, Harpur, Hakstian, Forth, Hart, and Newman, 1990)-
assessed prisoners in a simple oddball task. The authors report that they defined their
groups on a median split of PCL scores (but do not report group means). Like their
12
earlier work, Raine and Venables also report finding greatly increased P3 amplitude at
parietal scalp sites in psychopaths.
Examinations of psychopaths' ability to process affective information are,
in general, more conceptually straightforward. Day and Wong (1996) examined
hemispheric asymmetries in the processing of emotional words and faces in
institutionalized psychopaths and nonpsychopaths. They report that negatively-valenced
words presented to the right hemisphere were processed more quickly and accurately than
when they were presented to the left hemisphere in nonpsychopaths. This advantage of
the right hemisphere in processing the unpleasant stimuli was not observed in the
psychopaths, a finding that the authors interpret as reflecting a deficit in the ability of
psychopaths to experience the significance of negative emotions. They suggest that the
psychopaths were forced to rely on left-hemispheric, language-based processing of these
words. Interestingly, they were not able to demonstrate similar laterality effects when
presenting posed human faces expressing basic emotions as stimuli.
Foulds, McAllister, and Foulds (1988) examined electrodermal activity in
high, moderately and low socialized male, Scottish students. They attempted to replicate
earlier findings (Waid, 1983) that examined the relationship between socialization and
electrodermal responsivity to noise bursts. They also wanted to make comparisons
between low socialized men and psychopaths by examining other electrodermal measures
that have been reported to be atypical in psychopaths (including resting electrodermal
levels, non-specific electrodermal responses, and increases in electrodermal activity in
anticipation of a noise stimulus). The authors were able to demonstrate some support for
13
the notion that the low socialized group produced fewer spontaneous electrodermal
responses, decreased responses to moderate intensity noises (akin to startle probes), and a
decrease in anticipatory skin conductance level. These findings largely paralleled earlier
reports by Hare, Frazelle, and Cox (1978) that demonstrated similar findings in
psychopaths.
Patrick, Bradley, and Lang (1993) examined eye blink magnitude in
response to an acoustic startle in male psychopaths, nonpsychopaths, and a mixed group
while participants viewed pleasant, neutral, and unpleasant slides. They found that blink
magnitude did not demonstrate a linear relationship with valence in psychopaths as it
does in nonpsychopaths where the eye blink reflex is greatest in the presence of
negatively-valenced stimuli and smallest in the presence of positively-valenced stimuli.
A closer inspection of their data revealed that psychopaths high in emotional detachment
(factor 1 of the Psychopathy Checklist) demonstrated a quadratic function (e.g. inverted
"V") where blink magnitude was smallest when emotionally detached psychopaths
viewed arousing (highly pleasant or unpleasant) stimuli. Despite differences in
physiological responses, the psychopaths examined in this study did not demonstrate
difference in self-reported pleasantness or arousal as compared to the comparison group.
Recently, Sutton, Vitale, and Newman (2002) extended the work of Patrick
et al (1993) by examining eyeblink reflex magnitude in three different groups of
incarcerated women. Sutton et al largely replicated Patrick et al's observation that low
anxious psychopaths do not augment startle blink responses when viewing unpleasant
stimuli. They also provided some evidence to suggest that the startle blink differences
14
between psychopaths and non-psychopaths, (apparent when the probes are administered 2
seconds after picture onset), disappear after an additional 2.5 seconds of picture viewing.
The authors suggest that this may reflect a delay in psychopaths' emotional responses,
and not a deficit per se.
Examinations of event-related potentials in the low socialized individuals
or psychopaths have largely focused on group differences in the processing of words
(affective or otherwise). A recent examination of the Error-related negativity (ERN)
produced by low socialized students during conditions of punishment or reward
supported much of the behavioral literature, by demonstrating approached-related
increases and withdrawal-related decrease in the low socialized sample (Dikman & Allen,
2000). Low socialized students produced higher amplitude response-locked potentials to
the errors they made (ERNs) when they were being rewarded than when they were being
punished as compared to high socialized participants whose ERNs did not differ by
condition.
When taken together this small set of data suggests that both ERP measures
(e.g. N1 and P3) and autonomic measures (e.g. startle-blink reflex) are measures that
have been proven to be sensitive to difference between psychopathic and
nonpsychopathic samples. Examinations by Patrick et al. (1993), Sutton et al. (2002) and
Dikman and Allen (2000) provide initial evidence of a deficit in withdrawal-related
responses and/or an augmentation of approach-related behavior in low socialized or
psychopathic samples.
15
The cortical psychophysiology of emotion
The presence of a widely-accepted and well-normed set of emotional
stimuli has enhanced the ability of scientists to examine emotional processes in humans.
The International Affective Picture System (lAPS; Center for the Study of Emotion and
Attention, 1996) is a large set of digitized and slide-media photographs that has been
published with standardized ratings of valence and arousal for each slide. Numerous
empirical reports utilizing this stimulus set have been published. Relevant research is
described below
Schupp, Cuthbert, Bradley, Birbaumer and Lang (1997) examined the
relationship of startle probe induced eye blink magnitudes to P3s while students viewed
photographs that varied on dimensions of affective valence and arousal. Consistent with
prior reports, they found that startle-probe-elicited eye blink amplitude varied with the
affective valence of the stimuli (i.e. pleasantness). They also report that startle-probe-
elicited P3 amplitude varied with the rated arousal of the pictures that participants were
viewing when startled; while viewing affectively arousing photographs participants
produced smaller P3s to the startle probe. The authors suggest a straightforward path
linking P3 to arousal via attentional mechanisms. The authors, based on several lines of
research indicate that emotionally arousing stimuli are likely to draw more attentional
resources than neutral or non-arousing stimuli. P3 amplitude increases with increasing
attention to target stimuli (Donchin, 1981), and as such the authors argue that the
decrease in P3 amplitude to the startle probe while viewing arousing stimuli reflects
increased attention to the arousing and more salient photographs.
16
Cuthbert, Schupp, Bradley, McManis, and Lang (1998) conducted a follow
up study to test these ideas by manipulating attention and probe tone. They argued that
decreased P3 amplitude to arousing stimuli should still be observed when a non-startling
probe was presented during picture viewing. They also provided different instructions to
two groups of participants, either drawing attention to probes or instructing participants
to ignore probes. Cuthbert et. al. report that the P3 amplitude to probe stimuli decreased
regardless of tone type (startling or non-startling) or instruction set (attend or ignore
probe) when participants were viewing arousing stimuli. Importantly, no main effect of
task on P3 amplitude was observed, suggesting that this manipulation did not alter the
relationship between content type and startle-locked P3 amplitude. The authors interpret
these findings as supporting their earlier assertion that emotionally arousing stimuli draw
more attentional resources than non-arousing stimuli, and that affective stimuli are
processed automatically. Finally, the authors examined another measure of arousal and
stimulus intensity, the N1 component of the ERP. They report finding that N1 amplitude
increased to attended startle probes (but not to non-startling probes or unattended probes)
when participants were viewing unpleasant stimuli. The authors suggest that this may
reflect a mechanism by which neural systems enhance the apparent intensity of
potentially dangerous stimuli.
Picture-locked brain potentials have also been recorded by the Lang group
(Cuthbert, Schupp, Bradley, Birbaumer, & Lang, 2000). They analyzed slide-locked
ERPs to pleasant, unpleasant, and neutral slides and found that the ERP amplitude varied
consistently as a function of valance or arousal depending on the time window being
17
analyzed at midline cortical cites (Fz, Cz, Pz). In the 200 to 300 and 300 to 400 ms bins
pleasant pictures produced a more positive waveform than either unpleasant or neutral
photos. Beginning with the 400 to 700 ms window the ERP distinguishes between
pleasant, unpleasant, and neutral stimuli (listed in order of decreasing amplitude of the
waveform). During a 5 second long window, beginning 1000 ms after stimulus onset, a
large positive slow-wave is present in the ERFs presented by Cuthbert et al. This slow-
wave, unlike earlier components, is reported to be sensitive to the arousal dimension of
the stimulus, producing nearly overlapping waveforms for pleasant and unpleasant
pictures, and a significantly more negative waveform for neutral photos. The authors
conclude that this is consistent with their theory that arousing stimuli are likely to draw
more attention and cortical processing than non-arousing stimuli.
The present investigation
The present investigation implemented a procedure very similar to that of
Cuthbert et al. (2000). The ERFs of low socialized students were compared to students
who were classified as either moderately or highly socialized. The low socialized group
is a widely accepted and easily obtained analog group to stand in the place of true
psychopaths, whose inclusion in this study would require resources that are not currently
available. Although the use of an analog group limits the external validity it does provide
a convenient and appropriate sample for this preliminary investigation.
In the present study, attention to a startle probe tone was manipulated in a
between-groups fashion in an effort to extend the N1 effect observed by Cuthbert et al.
(1998) to a sample of low socialized participants. As noted above, N1 differences have
18
been observed in groups of psychopaths and provide a different measure of attention than
the P3. A personal communication with Dr. Bruce Cuthbert (2000) suggested that the
inclusion of this task would not produce any consistent differences in the ERPs produced
in response to the affective slides.
At least one study (Day & Wong, 1996) failed to find effects of non-word
stimuli in psychopaths, and a great many more published reports have focused solely on
the verbal (dis)abilities of psychopaths. Patrick, Bradley, and Lang (1993) and Sutton,
Vitale, and Newman (2002) were able to demonstrate autonomic (startle blink)
differences between emotionally detached psychopaths and more empathetic psychopaths
via presentations of emotional slides. To date, no published reports of CNS differences
in psychopathic or low socialized samples to emotional slides (i.e. tasks that do not use
words as stimuli) have been found in the existing literature. As such, the hypotheses
suggested below are one-step farther removed from the empirical literature than is
perhaps prudent, but the general consistency of reports in the literature provides a
promising block of support from which to develop the following assertions.
Several hypotheses were formed based on the evidence cited above. It was
expected that the low socialized students, like psychopaths, would demonstrate an
increase in appetitive motivations and a decrease in defensive reactions. One
manifestation of this was the expectation that eye blink magnitude in the low socialized
group was not expected to demonstrate the normal pattern of augmented blink magnitude
while viewing negatively-valenced pictures. Instead it was expected that this group
19
would demonstrate a diminished startle blink reflex when viewing unpleasant images
relative to the more highly socialized groups.
With regards to CNS measures related to evaluation of the startle probe, it
was predicted that low socialized participants would produce smaller P3 amplitudes to
startle probes when viewing pleasant stimuli than when viewing unpleasant or neutral
stimuli. Following the findings of Schupp et al (1997), who demonstrated reduced P3
amplitude to startle probes presented during arousing photos in an unselected sample, it
was hypothesized that the low socialized participants in the present sample would
demonstrate greater approach tendencies (allocate more attentional resources) to
pleasantly arousing photos than to unpleasant or neutral stimuli.
Cuthbert et all (1998) reported that attended probes presented during
unpleasant photos produced greater N1 amplitudes than unattended, unpleasant probes,
couching this finding in a belief that the increased N1 reflected an enhancement of
apparent intensity of this class of stimuli. For the present sample, it was predicted that
when viewing unpleasant photographs, moderately socialized and high socialized
participants that were directed to attend to probe stimuli would produce larger amplitude
Nls to probes, but that the low socialized participants would not demonstrate this effect.
It was believed that the low socialized participants, in a fashion similar to psychopaths,
would not respond as strongly to negatively-valenced probes, thus producing smaller Nls
than the more highly socialized groups.
It was also expected that an examination of the picture-locked (as opposed
to the startle probe locked) ERPs would differ between the low socialized and the other
20
two groups. As Cuthbert et al. (2000) report, these picture-locked ERPs can index
valance or arousal depending on the time frame of the ERP being examined. With the
belief that the low socialized group would devote additional evaluative resources to
pleasant stimuli (relative to the more highly socialized groups) it was posited that the low
socialized group would demonstrate a greater differentiation between pleasant pictures
and unpleasant and neutral pictures during the 200-400ms window, i.e. that they would
produce the widest differences between these conditions.
Cuthbert et al. (2000) report that the window of the picture-locked ERP
extending from 400 to 700ms discriminated between all three valences. When examining
the window between 400 and 700 ms it was expected that low socialized participants
would continue to produce more positive waveforms to pleasant stimuli and would not
begin to produce differences between the unpleasant and neutral waveforms that were
predicted to occur in the other two groups.
Cuthbert et all (2000) also report that the positive slow wave produced
during the final 5 seconds of stimulus evaluation yielded larger amplitude waves in
response to arousing stimuli than in response to non-arousing stimuli. Thus, it was
expected that the low socialized group would demonstrate a pattern of ERPs that reflects
a more positive slow wave during the continued processing of pleasant stimuli as
compared to the other groups, again demonstrating a stronger approach motivation.
Finally, it was also expected that the low socialized group would have a more negative-
going slow wave when they were viewing the unpleasant pictures as compared to the
other groups as they would not find this set of stimuli as arousing as did the other groups.
21
METHOD
Participants
Introductory psychology students completed the 54-item Socialization scale
of the California Psychological Inventory (CPI-So) during two consecutive semesters, as
part of course-required mass testing. The completed questionnaires from 1138 males
were scored and three groups of potential participants were selected based on their scores.
To select subjects for the two extreme groups (low and high socialized subjects) those
men with the most extreme scores were contacted and asked to participate before those
with less extreme scores. Moderately socialized participants were selected from those
individuals whose scores fell within 2 points of the mean of the distribution, based on
distributions of the CPI scores from prior semesters. Based on these criteria subjects for
the low socialized group were selected from the lowest 8.0% of the distribution, subjects
for the moderately socialized group were selected from the middle 23.37% of the
distribution, and high socialized subjects were selected from the highest 9.4% of the
distribution (see Figure 1). Actual CPI-So scores for the groups ranged as follows: lows
from 10 to 24, moderates from 33 to 36, and highs from 43 to 49. ANOVA confirmed
that the three groups differed in their CPI-So scores, F(2, 62)= 681.34,/x.OOl. The mean
CPI-SO score for students in the low-socialized groups was 19.5 with a standard
deviation of 3.5, placing them in the same range as that of male prison iimiates (with a
mean of 22.78 as reported by Gough, 1994). The mean CPI-SO score for the moderately
socialized group was 34.14 (.96). The mean score for those classified as high socialized
was 45.27 (1.69). The mean for all CPI-SO scores was 34.03 with a standard deviation of
22
6.51, which can be compared to the mean socialization score reported by Gough for
Catholic priests of 33.63.
A total of 72 men agreed to participate in the study after being contacted by
phone and asked to participate in "an investigation of the brain's response to pictures."
Of these 72 participants, the data from 7 were dropped from the final data set due to
technical difficulties during the physiological recordings. The final data set included 22
high socialized, 22 low socialized, and 21 moderately socialized men\ Mean age for the
sample was 19.1 years and did not vary by group.
Procedure
Upon arrival at the lab, informed consent was secured from each
participant, after which they completed a standardized set of six self-report inventories^.
Participants were then prepared for physiological recording. After preparing the skin
with an abrasive soap and alcohol, tin electrodes were placed on the nasion, the left and
right mastoids, and on each participants cheek ~ 10% of the inion-nasion distance below
the pupil of each eye (the left and right vertical electrooculograms - LVEOG and
RVEOG respectively). Two electrodes were placed over the right Orbicularis oculi
muscle in a bipolar montage, approximately 1 cm inferior to the outer can thus of the left
^ These figures represent the group sizes for the data set that examined event-related potentials to affective pictures (not probes). Group sizes differed (were smaller) for the analyses of EMG startle-blinks and ERPs to startle probes. Group sizes for these analyses are provided later in the text.
The scales were: A medical information questionnaire, Levinsen's Self-Reported Psychopathy Scale (LSRP), State-Trait Anxiety, The Behavioral Inhibition/Behavioral Activation Scale, an Obsessive/Compulsive scale, and the Toronto Alexythimia Scale. These data are not reported here.
23
eye (OEMG). A standardized electrode cap was placed and 26 scalp sites were prepared
for physiological recording (Fpl, Fpz, Fp2, F7, F3, Fz, F4, F8, T3, C3, Cz, C4, T4, T5,
P3, Pz, P4, T6, 01, Oz, 02, FTCl, FTC2, POl, P02, CPl, and CP2). A standard
conductive gel was used in conjunction with mild abrasion to reduce impedances at all
sites to less than 5 Kohms.
All sites (with the exception of the bipolar montage at OEMG) were
referenced to the left mastoid during the recording. Neuroscan 4 software and Neuroscan
Synamps were used to record EEG and EMG data. Online recording for all sites was
conducted with a gain set to 150, low pass filtered at 200 Hz, and were left unfiltered vis-
a-vis a high pass filter (i.e. DC mode). Additionally, the EMG signals were filtered with
a high pass filter at IHz. All signals were digitized at and at 1000 Hz during the task.
Finally, two silver-silver chloride electrodes were placed on the index and middle finger
of each participant's left hand to allow measurement of skin conductance responses
(SCR). These signals were amplified and recorded with a Biopac amplifier and
associated Acknowledge software.
After being prepared for physiological recording participants were moved
to a sound-attenuated testing room and instructed to sit in a comfortable chair
approximately one meter from a 19-inch PC monitor. Resting eyes-open and eyes-closed
EEG was recorded from each participant for four minutes prior to the onset of the task.
Participants then received written and spoken, digitized instructions detailing the nature
of the experimental task and their responses to stimuli. All participants were instructed
how to use a keyboard to make valence and arousal ratings using a computerized version
24
of the Self-Assessment Manikin (SAM; Lang 1980). One practice slide from each of the
three valence categories was presented following the instructions to insure that
participants understood the use of the SAM.
Participants from each socialization group were randomly assigned to
either a group that was told to attend to startle probes presented during the pictures (ATT)
or to ignore the probes (IGN). Group ATT was told to attend to auditory startle probes
(ATT) that would intermittently be heard while viewing a picture and be prepared to
make a same/different judgment to a second probe that would be heard after the slide had
disappeared. Group IGN was also told that they would be hearing startle probes while
viewing the pictures and shortly after the pictures disappeared, however this group was
told to ignore these probes and they were not required to make a same/different judgment
following the second probe.
Startle probes were presented on 50% of all trials of each valence category.
Two slides sets containing the same pictures were developed to control for potential slide
by probe interactions. Two startle probes were created from 95db white noise bursts with
instantaneous rise and fall times. One probe consisted of full spectrum white noise
(Probe A), while the other had a narrow-band notch (50hz) of noise filtered out to
produce a probe that could be identified as being different than the full-spectrum sound
(Probe B). Each probe was presented an equal number of times during the presentation
of the pictures.
Each participant viewed 18 pictures from each of the three valence
categories. Pictures were chosen based on established normative valence and arousal
25
ratings to maximize valence differences between all three categories while minimizing
arousal differences between positively and negatively-valenced slides^. Presentation of
the pictures was randomized such that slides from one valence category would not be
presented more that two times in a row or more than twice in any series of six images.
Pictures were presented for a total of six seconds. Startle probes were presented at a
random time in a window extending from 1500ms after slide onset to 1000ms prior to the
offset. After all probed trials, a second tone was presented to the participant 1000ms
after picture offset. The same probe was played after 50% of probed trials, i.e. one half
of the same/different judgments were correctly answered as "same". Following the
presentation of the second tone on probed trials or 1000ms after picture offset on
unprobed trials, each participant was required to make valence and arousal ratings with
the SAM. After making these ratings an 8-second delay preceded the presentation of the
next slide. Participants were given a short break after viewing one half of the slides.
EMG Data Reduction and Processing
EEG and EMG data were recorded in the same digital file. EMG data were
then culled from the file and processed separately. EMG data recorded from the
Obicularis Oculi were high-pass filtered at 15hz and rectified. The continuously recorded
signals were then segmented into 1750ms epochs with a 750ms pre-stimulus baseline.
These data were then baselined on the mean activity during the pre-stimulus portion of
Standardized ratings from male participants only were used to select slides. The following slide numbers were included: 2080, 2120, 2190, 2200, 3000, 3010, 3080, 3100, 3130, 3150, 3170, 3530, 4180, 4210, 4250, 4290, 4310, 4650, 4660, 4680, 5500, 6200, 6230, 6243, 6250, 6313, 6350, 6370, 6510, 7000, 7010, 7020, 7050, 7080, 7090, 7100, 7110, 7130, 7150, 7160, 7170, 7175, 7180, 7200, 7330, 7350, 7500, 8030, 8080, 8200, 8400, 8501, 8510, 9040.
26
the data. In order to determine the search window for the startle-blink peak grand
average waveforms were calculated across subjects and valence conditions. Based on
these data, a search window extending from 30 to 130 ms post-stimulus was opened as a
search window. Peak voltages were obtained for each valence category and within-
subjects z-scores were calculated based on these peak data.
In an effort to eliminate subjects who didn't respond to the startle probes
each participant's data were averaged by valence condition. Area measures were
obtained for each subject by condition in the 100ms window defined above, as well as
from a 100ms window beginning 100ms prior to stimulus onset. Subjects were
eliminated when any of the 3 startle-blink areas did not exceed the area measure of the
pre-stimulus baseline. A total of 15 high SO, 18 low SO, and 16 moderate SO
participants were retained for further analyses. A chi-square test was used to examine the
possibility that attrition differentially affected one of the socialization groups. This
possibility was not supported by the test, Chi square (2)= 1.828, j7=.401.
EEG Data Reduction and Processing
Digitized EEG files were low pass filtered at 15hz and trials on which
muscle or other artifact was observed were removed from further analyses. EEG data
were digitally rereferenced to linked mastoids and vertical eye blinks were removed using
a standardized regression procedure (Semlitsch, et al, 1986). Continuous EEG files were
then segmented into 15-second stimulus-locked epochs beginning eight seconds prior to
stimulus onset.
27
Startle Probe-Locked ERPs
Continuous EEG files were segmented into 1500ms epochs beginning
500ms prior to the onset of each probe that was presented during the presentation of a
photo stimulus (thus excluding the follow-up tones presented after the offset of each
slide). These epochs were then baselined on a 250ms window ending at probe onset.
EEG epochs were then sorted and averaged by affective condition.
To obtain a measure of N1 amplitude, the minimum value in a llOms-long
window beginning 50ms after stimulus onset was identified for each valence condition at
scalp sites Fz, Cz, and Pz. Measures of P2 amplitude were found by searching for the
maximal value in an 80ms-long window beginning 160ms after startle-probe onset.
Measures of P3 amplitude were obtained by searching for the most positive value in a
200ms-long window beginning 240ms after startle-probe onset. In all cases the search
windows were chosen based on the grand average waveform computed across all
participants, valences, and sites.
In an effort to remove non-responders from the data set, a procedure to
measure peak and pre-stimulus baseline area (identical to the one implemented for the
EMG data) was used. Only one subject (H19) of the 65 was eliminated when it was
determined that N1 area was less than the area in an analogous pre-stimulus baseline.
Picture-Locked ERPs
A strong negative-going drift across all EEG channels was observed in the
data of many subjects. It is believed that this drift was due to one of two (or a
combination of two) causes. Several of the standardized caps used to place the electrodes
28
were relatively old and nearing the end of their functional life. Pitting and scaring of the
metal surfaces of the tin electrodes may have created a battery potential in some of the
caps on some of the participants. Alternatively the mixed use of tin and silver-silver
chloride (for EMG and SCR responses) electrodes may also have created a battery
potential. The latter possibility is not considered as likely as both types of electrodes
were placed on all participants while only a subset of participants demonstrated the EEG
drift. Unfortunately, due to software settings that baseline the screen presentation of
continuous EEG, the drift went unnoticed until the data had been reduced to stimulus-
locked epochs.
Numerous efforts to regress the drift from the data files met with limited
success. Ultimately it was decided that a linear detrending procedure would be
implemented to remove any systematic prestimulus drifts from the EEG epochs. The
continuous EEG was segmented into 15-second-long epochs beginning 8 seconds prior to
stimulus onset. A procedure was then implemented to calculate the linear trend in that
prestimulus baseline and remove that trend from the entire epoch.
Following the linear detrending procedure stimulus-locked epochs were
shortened to include a one-second-long prestimulus baseline, and were also resampled to
250hz to reduce the size of the digitized file. Individual trials were then baselined on a
250ms-long window ending at stimulus onset and then sorted and averaged by condition.
Peak finding algorithms were based on the peaks observed in grand-
average waveforms. Peaks for all ERP components were found by obtaining the most
positive or negative peak (local maximum or minimum) within one of the time windows
29
listed below. In the event that no peak could be discerned, the largest or smallest value in
the search window was recorded as the positive or negative peak, respectively. The N1
peak was identified as the most negative peak in a lOOms-long window starting 52ms
after picture onset. The P2 peak was identified in a 60ms-long window beginning 156ms
after picture onset. The N2 peak was identified in an 80ms-Iong window beginning
220ms after picture onset. The P3 peak was identified in a window extending from
304ms after picture onset to 1000ms after picture onset. Measures of the late positive
complex were also obtained by summing ERP amplitude across each of the last five
seconds for each condition.
30
RESULTS
In order to provide a comprehensive analysis of the data, two sets of
analyses were performed. The first sets of analyses were omnibus examinations of the
data sets including the largest possible statistical models. These analyses were intended
to describe and characterize the data in a statistically appropriate manner, reveal
atheoretical relationships, and provide a context for the second set of analyses, namely
the statistical tests of the a priori hypotheses. The statistical examinations related to
these seven hypotheses are included throughout this section under the heading most
appropriate to the hypothesis.
The atheoretical analyses presented below are grouped by the dependent
measure being analyzed and accordingly are divided into five sections: questionnaire
data, behavioral data, startle-probe EMG responses, startle-probe ERP responses, and
picture-locked ERPs.
When appropriate, all repeated measures analyses were evaluated using
multivariate results, which did not assume sphericity (Vasey & Thayer, 1987). The
Wilks' Lambda statistic is reported, as is the F-ratio.
Questionnaire Data
As described in the method above, several different self-report measures of
behavioral tendencies and personality variables were obtained from the participants in the
present study. While many of those data lie outside of the scope of the present report, a
measure of self-reported psychopathy (LSRP) does warrant further examination. Across
the three socialization groups, CPI-Socialization scores correlated with total LSRP scores
31
(factor 1 + factor 2) significantly, r= -0.64, p<.001 (Figure 2). Socialization also
demonstrated significant relationships with LSRP factor 1 (emotional detachment), r=
-0.52, p<.001, and factor 2 (antisocial behavior), r= -0.66, p<.001.
Behavioral Data
Two types of behavioral responses were quantified in the experiment:
same-different judgments regarding the second startle probe presented on probed trials
(required only for those participants assigned to the attend condition), and valence and
arousal ratings of the pictures (required for all participants).
Participants in the attend condition were required to make same-different
judgments following the presentation of the startle probe that immediately followed each
probed trial. Participants were highly accurate (Table 1), and a univariate ANOVA
revealed no differences between groups with regards to the accuracy, F(2, 32)=.4,
p=.64A, or to the speed, F(2, 32)=.5,/?=.595 of their judgments.
All participants were required to make pleasantness and arousal ratings
after viewing each picture. A 3 (socialization group) x 2 (attention condition) x 3
(valence) repeated-measures ANOVA was performed separately for the pleasantness and
arousal data. Regarding participants' ratings of pleasantness, a main effect of valence
was observed, Wilks' Lambda= .11, F(2, 58)= 244.7, ̂ <.001, demonstrating a near linear
relationship between pleasantness and valence in which all valence conditions differed
from each other (p<.001). A main effect of attention condition F(l, 59)= 4.0, /?=.05 was
also observed; across valence categories participants instructed to attend to the startle
probes found pictures to be significantly more pleasant than participants that ignored the
32
probe, however this effect was small, averaging .33 points on a 9 point scale. An
interaction between valence and socialization group was also observed, Wilks' Lambda=
.64, F(4, 116)=7.1,/7<.001. TO decompose this interaction three separate ANOVAs were
computed, one for each valence category. As can be seen in Figure 3, the ANOVA
computed for pleasant pictures, F(2, 64)= 3.9,p<.05, indicated that the low socialized
group reported the pictures as being less pleasant than the high socialized group (p<.01).
All three groups rated the pleasantness of the unpleasant pictures differently, F(2, 64)=
14.9,/j<.001; high socialized participants found them to be significantly less pleasant
than did the moderately socialized (p<.05), who in turn found them to be less pleasant
than the low socialized participants (p<.001). No statistical effect was observed in the
data for neutral pictures. Finally, a significant socialization by attention condition by
valence effect was observed, Wilks' Lambda= .82, F(4,116)=3.0,/7<.05. To decompose
this interaction three separate ANOVAs were performed, one for each level of the
Socialization factor. Results of these analyses revealed that only the moderately
socialized group showed a trend towards a significant interaction between valence and
attention condition, Wilks' Lambda= .74, F(2,18)= 3.2,p=.063 (Figure 4).
An identical analysis was performed on the self-reported arousal data. A
significant main effect of valence was observed, F(2, 58)=172.7,/?<.001. The main effect
of socialization group approached significance, F(2, 59)=2.6,/7=.081. A posthoc,
Tukey's Least Significant Differences test (LSD) revealed that the high socialized group
perceived all slides to be more arousing than the low socialized group (p<.05). Finally,
an interaction between socialization group and valence was observed, F(4,116)=4.0,
33
p<X)l. To decompose this interaction three separate ANOVAs were performed, one for
each level of the Valence factor. An LSD test was used to further examine differences in
any significant test. Results of these analyses indicated that the low socialized group
reported less arousal when viewing negatively-valenced pictures than the moderately
socialized group (p<.01) and than the high socialized group (p<.001) (Figure 5).
Startle Probe: Startle Blink EMG data
A mixed-model 3 (Socialization group) x 2 (Attention condition) x 3
(valence) repeated-measures ANOVA was performed on the peak amplitude measure of
participant's startle blinks after transforming these data to z-scores. Only one statistical
effect was observed in these data, a main effect of valence category, Wilks' Lamda = .83,
F(2, 40)= 4.2,/?<.05. This effect documented the expected augmentation of startle-blink
when viewing negatively-valenced slides, and the inhibition of startle-blinks when
viewing positively-valenced slides relative to the blinks produced when neutral slides
were probed. Post-hoc, LSD testing of this effect revealed significant differences
between the amplitude in response to probes presented during pleasant and unpleasant
images (p<.01), and a trend for the amplitude of probes administered during pleasant
pictures to be smaller than those administered during neutral pictures (p=.089) (Figure 7).
There were no statistical differences observed between the startle blink amplitudes
produced in response to unpleasant versus neutral probes (p=.224).
The a priori hypothesis that low socialization status would decrease the
expected augmentation of the startle-blink to unpleasant pictures was tested directly in a
one-way ANOVA that examined only the effects of socialization in response to
34
unpleasant pictures. The results of this analyses did not reveal the predicted statistical
effect, F(2, 44)=.6,/J=.564. Although low socialized participants did produce the
smallest responses to probes presented during unpleasant pictures, moderately socialized
participants produced the largest responses to the probes with high socialized participants
generating startle blinks that were intermediate (Table 2).
Startle Probe: ERPs
Grand-average ERPs generated in response to the auditory startle probes as
a function of attention condition and scalp site can be seen in Figure 8. Three mixed-
model, 3 (socialization group) x 2 (attention condition) x 3 (valence) x 3 (scalp site)
repeated-measures ANOVAs were computed to test hypotheses related to the Nl, P2, and
P3 peak amplitudes observed in response to auditory startle-probes. For Nl amplitude, a
main effect of scalp site, Wilks' Lambda= .25, F(2,57)= 84.1,/?<.001 was modified by
two interactions (below). A main effect of valence was also observed, Wilks' Lambda=
.81, F(2, 57)= 6.9,JP<.01. Scalp site interacted with valence, Wilks' Lambda= .73, F(4,
55)= 5.2,;?=.001 (Figure 9). In this interaction, decomposed by three separate ANOVAs
- one for each level of site and further decomposed by post-hoc LSD tests, Nl amplitude
at site Fz was significantly larger (more negative) for unpleasant images than for neutral
images (p<.05) or pleasant images (p<.05). The Nls produced to neutral and pleasant
images at site Fz did not differ (p=.88). At site Cz Nl amplitude was significantly less
negative for pleasant images than it was for unpleasant images (p<.001) or for neutral
images (p<.05), the latter sites did not differ from each other (p=.434). This pattern of
results was repeated at site Pz, albeit with subtly weaker effects; pleasant images
35
produced smaller Nls than unpleasant images (p<.05) and a trend towards smaller images
than neutral images (p=.062). To summarize, the N1 produced in response to neutral
images was indistinguishable from pleasant-image probes at site Fz, but more similar to
unpleasant-image probes at sites Cz and Pz. Finally, site interacted with attention
condition, Wilks' Lambda= .86, F(2,57)=4.5,/)<.05 in which N1 amplitude in the Attend
condition peaked posterior to the peak produced by participants in the Ignore condition
(Figure 10). No other main effects or interactions were observed.
A one-way ANOVA tested the a priori prediction that probes presented
during unpleasant photographs to moderately and high socialized participants in the
attend condition would produce larger amplitude Nls, than low socialized participants.
While the observed means in this analyses demonstrated a pattern consistent with
predictions, no statistical effect of group was observed in the data, F(2,32)= 3,p=.130.
With regard to P2 amplitude, a main effect of site was observed, Wilks'
Lambda= .20, F(2,57)= 112.4 ,/?<.001. P2 amplitude peaked at site Cz, followed by
sites Pz and Fz respectively (all sites differing at /7<.001). A main effect of valence was
also observed, Wilks' Lambda= .87, F(2,57)= 4.1,p<.05. This effect was modified by
interactions with socialization group, and a trend towards a three-way interaction
including socialization group and attention condition. P2 amplitude to probes
administered during pleasant and unpleasant pictures did not differ statistically, but both
unpleasant and pleasant picture probes were significantly smaller than the peak of probes
administered during neutral pictures (p<.05 and /x.OOl respectively). In the interaction
between valence and socialization group, (Wilks' Lambda= .83, F(4,114)= 2.8,/7<.05),
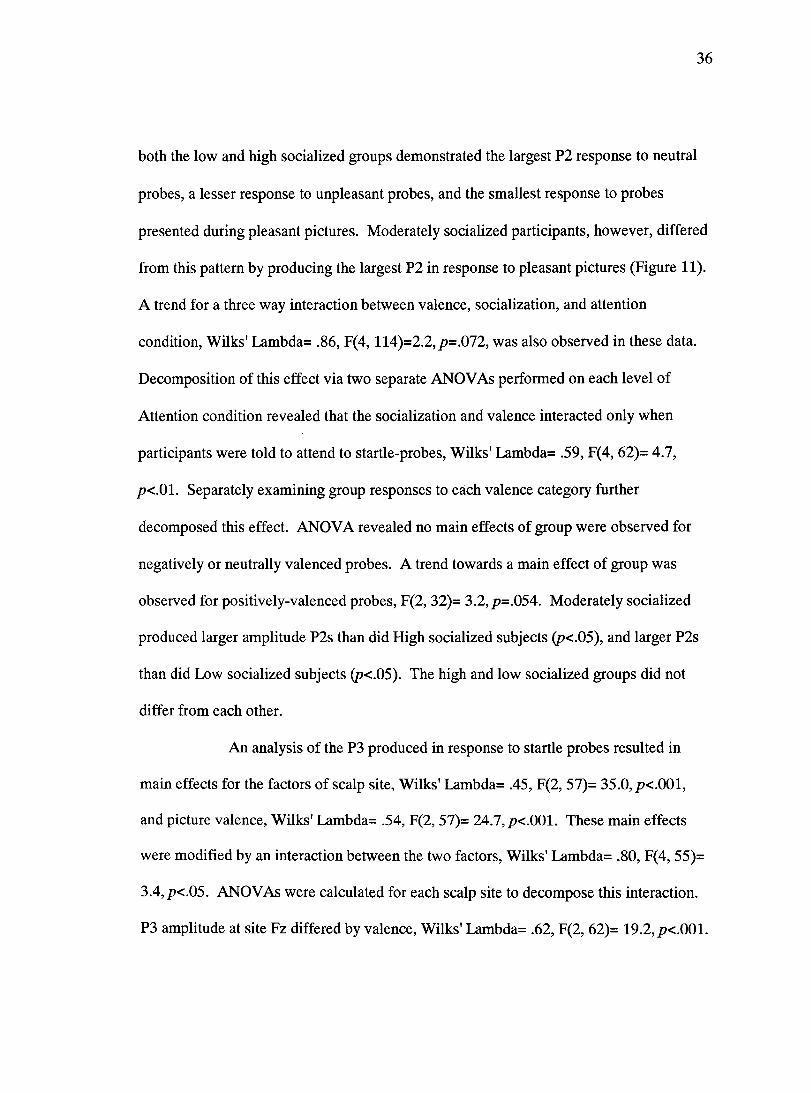
36
both the low and high socialized groups demonstrated the largest P2 response to neutral
probes, a lesser response to unpleasant probes, and the smallest response to probes
presented during pleasant pictures. Moderately socialized participants, however, differed
from this pattern by producing the largest P2 in response to pleasant pictures (Figure 11).
A trend for a three way interaction between valence, socialization, and attention
condition, Wilks' Lambda= .86, F(4,114)=2.2,/?=.072, was also observed in these data.
Decomposition of this effect via two separate ANOVAs performed on each level of
Attention condition revealed that the socialization and valence interacted only when
participants were told to attend to startle-probes, Wilks' Lambda= .59, F(4, 62)= 4.7,
p<.01. Separately examining group responses to each valence category further
decomposed this effect. ANOVA revealed no main effects of group were observed for
negatively or neutrally valenced probes. A trend towards a main effect of group was
observed for positively-valenced probes, F(2, 32)= 3.2,/>=.054. Moderately socialized
produced larger amplitude P2s than did High socialized subjects (p<.05), and larger P2s
than did Ix)w socialized subjects (p<.05). The high and low socialized groups did not
differ from each other.
An analysis of the P3 produced in response to startle probes resulted in
main effects for the factors of scalp site, Wilks' Lambda= .45, F(2, 57)= 35.0,/?<.001,
and picture valence, Wilks' Lambda= .54, F(2, 57)= 24.7,/><.001. These main effects
were modified by an interaction between the two factors, Wilks' Lambda= .80, F(4, 55)=
3.4,p<.05. ANOVAs were calculated for each scalp site to decompose this interaction.
P3 amplitude at site Fz differed by valence, Wilks' Lambda= .62, F(2, 62)= 19.2, jx.OOl.
37
Startle-probe P3 at site Fz to neutral pictures was greater than negatively-valenced probes
(p<.001), which in turn were greater than positively-valenced probes (p<.05). P3
amplitudes at scalp site Cz also varied by valence, Wilks' Lambda= .65, F(2, 62)= 16.4,
p<.001. Neutral pictures produced larger P3 amplitudes than pleasant pictures (p<.001),
and pleasant pictures produced greater P3s than did unpleasant pictures (/7<.05). The
results for P3 amplitude at site Pz were similar to the previous analyses, Wilks' Lambda=
.60, F(2, 62)= 20.5,/7<.001. Once again P3s produced to probes presented during
neutrally-valenced stimuli were significantly larger than positively-valenced probes
(p<.001) and negatively-valenced probes (p<.001). Unlike the more anterior sites, P3
amplitude to negatively and positively-valenced probes did not differ.
Finally a trend towards an interaction between scalp site, socialization
group, and attention condition was observed, Wilks' Lambda= .87, F(4,114)= 2.1,
p=.090. This complex interaction was not expected and did not involve valence effects
and thus was not decomposed further.
The a priori hypothesis that low socialized participants would produce
smaller P3 amplitudes to startle probes when viewing pleasant stimuli than when viewing
unpleasant or neutral stimuli was tested in a 3 (valence) x 3 (site) repeated measures
ANOVA examining the reactions of that group's P3 responses to startle probes presented
during pictures. The hypothesis was not supported. While ANOVA did reveal a main
effect of valence in this model, Wilk's Lambda= .53, F=8.8,/?<.01, the pattern of results
was not consistent with a priori predictions. A post hoc LSD test revealed that low
socialized participants demonstrated the smallest P3 responses to unpleasant pictures that
38
were not statistically different than their responses to pleasant pictures (p=.346). Neutral
pictures were, however statistically different from pleasant pictures (p=.001), and from
unpleasant pictures (p<.01).
Picture-Locked ERPs
As described in detail above, four different measures were quantified for
participants' picture-locked ERP: N1 (peak found 52 to 152ms post picture onset), P2
(156 to 216ms), N2 (220 to 300ms), and P3 (304 to 1000ms). Measurements were
obtained for each of three sites and each of the three valence conditions. Data for each
measure were analyzed in separate, mixed-model, 3 (socialization group) x 2 (attention
condition) x 3 (valence) x 3 (scalp site) repeated-measures GLMs. Grand-average ERPs
for the first second after stimulus onset can be seen in Figure 12a. Grand-average ERPs
spanning the entire stimulus presentation can be seen in figure 12b.
Results of the analysis of N1 data revealed a main effect of site, Wilks'
Lambda= .60, F(2,58)= 19.6,p<.001. The N1 potential peaked at site Cz which differed
from site Fz (p<.01) and from site Pz (p<.001); Fz and Pz were of relatively similar
amplitude. A trend for a main effect of valence was observed in the N1 data, F(2, 58)=
2.9,p=.066. Post hoc analyses indicating that N1 amplitude seemed to index valence;
pleasant pictures produced significantly more negative Nls than did negatively-valenced
images (p<.05), while N1 amplitudes to neutral pictures fell in-between the other two
waveforms. No other main effects or interactions were observed for the N1 peak data.
An analysis of the P2 peak data revealed a significant main effect of site,
Wilks' Lambda= .76, F(2, 58)= 10.8,/)<.001. P2 amplitude peaked at site Pz, was less
39
positive at Cz, and least positive at site Fz, all differences were significant at the p<.0\
level or greater. A main effect of valence was also observed, Wilks' Lambda= .66, F(2,
58)= 14.7,/?<.001. Post hoc analyses revealed that all valences differed from each other
at thep<.Q5 level or greater. Unpleasant images produced the largest amplitude,
followed by pleasant and then neutral images.
A site by condition interaction was observed in the P2 data, Wilks'
Lambda= .88, F(2,58)= 4.1,/><.05. These data indicate that participants in the Attend
condition produced larger amplitude P2s than did participants in the Ignore condition and
that this effect was most prominent at site Cz and least prominent at site Fz (Figure 13).
A valence by site interaction was observed in the data, Wilks' Lambda= .75, F(4, 56)=
4.8,/5<.01. The interaction almost perfectly preserves the main effect of site with the
exception of P2 amplitude at site Pz for the neutral and pleasant pictures, P2 amplitude
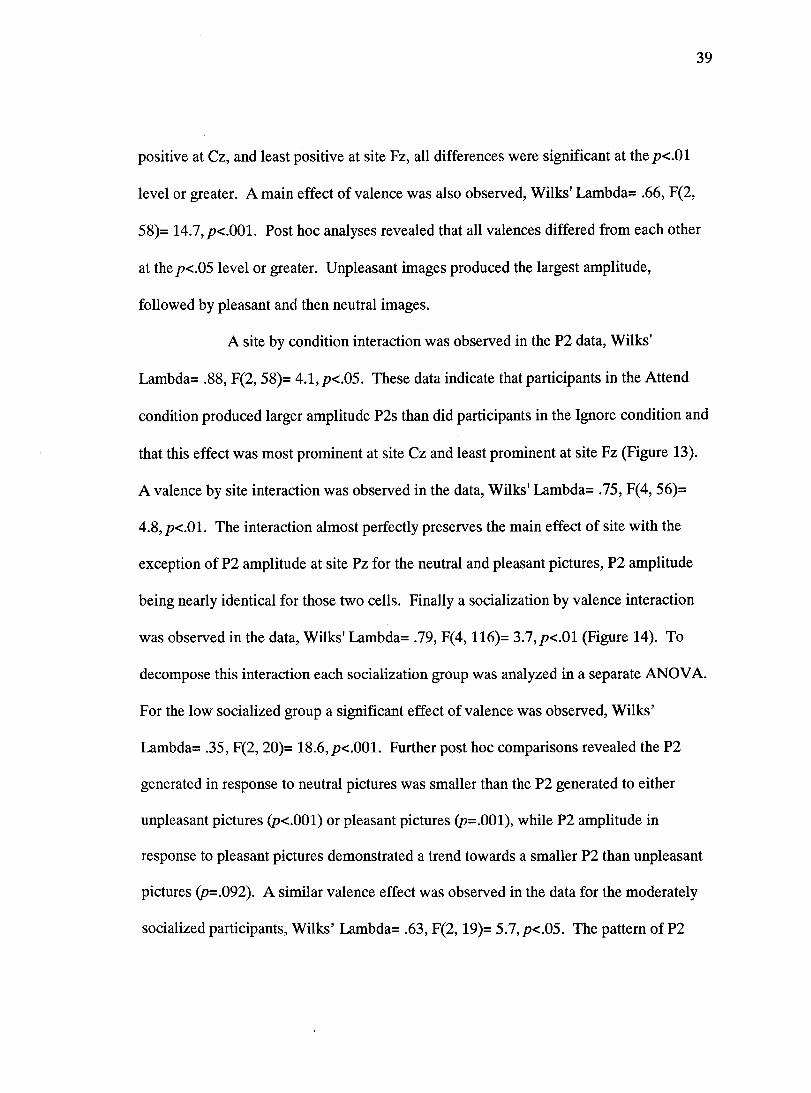
being nearly identical for those two cells. Finally a socialization by valence interaction
was observed in the data, Wilks' Lambda= .79, F(4,116)= 3.7,/7<.01 (Figure 14). To
decompose this interaction each socialization group was analyzed in a separate ANOVA.
For the low socialized group a significant effect of valence was observed, Wilks'
Lambda= .35, F(2, 20)= 18.6,/x.OOl. Further post hoc comparisons revealed the P2
generated in response to neutral pictures was smaller than the P2 generated to either
unpleasant pictures (p<.001) or pleasant pictures (p=.001), while P2 amplitude in
response to pleasant pictures demonstrated a trend towards a smaller P2 than unpleasant
pictures (p=.092). A similar valence effect was observed in the data for the moderately
socialized participants, Wilks' Lambda= .63, F(2,19)= 5.1,p<.05. The pattern of P2
40
amplitude largely matched the pattern described for the low socialized group, with the
exception that no trend was observed for a smaller P2 in pleasant versus unpleasant
pictures. The interaction between socialization and valence was largely a result of
differential response of the high socialized group. Post hoc ANOVA revealed an effect
of valence in this group as well, Wilks' Lambda= .61, F(2, 20)= 6.5,/?<.01. This group
produced a pattern of P2 results more consistent with perceived pleasantness than with
perceived arousal as the other two groups demonstrated. The P2 amplitude generated in
response to pleasant pictures demonstrated a trend towards being smaller than the P2
generated to neutral pictures (p=.073). While the P2 generated to unpleasant pictures was
larger than the P2 to neutral pictures this difference failed to achieve statistical
significance in the post hoc test (p=.226).
For the N2 data, main effects of site, Wilks' Lambda= .67, F(2,58)= 14.3,
/x.OOl, as well as valence, Wilks' Lambda= .57, F(2, 58)= 21.7,/x.OOl were observed.
A valence by site interaction was also observed in the N2 data, Wilks' Lambda= .68, F(4,
56)= 6.5,/?<.001 (Figure 15). This interaction was decomposed via separate ANOVAs
for each level of site. An effect of valence was observed at site Fz, Wilks' Lambda= .64,
F(2, 63)= 17.7,p<.001, where the N2 observed in response to neutral pictures was larger
(i.e. more negative) than the N2 observed for pleasant or unpleasant pictures (p<.001 for
both valences), neither of which differed from the other. An identical pattern of results
was observed at site Cz, Wilks' Lambda= .63, F(2, 63)= 18.6,/7<.001. For site Pz the
effect of valence was also statistically significant, Wilks Lambda= .75, F(2, 63)= 10.6,
/7<.001 and was more sensitive to valence effects than the more anterior sites. The N2
41
produced in response to neutral pictures at site Pz was more negative-going than the N2
response to pleasant pictures (p<.05), and a trend was observed for pleasant pictures to
produce a larger N2 than did negatively-valenced pictures (p=.081).
It was predicted that the early portion of the picture-locked ERPs was
expected to demonstrate a greater differentiation between pleasant, unpleasant, and
neutral pictures in low socialized participants. This prediction was best addressed by the
examining the valence by socialization interaction in the omnibus statistical model for the
N2 data (the peak most equivalent to the time window in the hypotheses). No support for
this hypothesis was observed as the interaction between valence and socialization did not
achieve statistical significance, Wilks' Lambda= .88, F(4,116)= 1.9,p=.109, and no
other interaction including the factors of valence and socialization was observed to reach
statistical significance either. A casual inspection of the means for the valence by
socialization interaction suggests that the moderately socialized group demonstrated the
greatest differences in N2 amplitude in response to the three different valence categories.
The analyses of P3 data produced a pattern of statistical results virtually
identical to the N2 data. The main effect of site, Wilks' Lambda= .77, F(2, 58)= 8.5,
/?=.001, revealed the hallmark centro-parietal peak for the P3. The main effect of
valence, Wilks' Lambda= .34, F(2, 58)=55.2,/J<.001, once again seemed to index
arousal. These two main effects were modified by an interaction, Wilks' Lambda= .48,
F(4, 56)=15.0/x.OOl, which was decomposed via separate ANOVAs computed for each
scalp site, and statistically significant main effects for these analyses were further broken
down via Least Significant Differences post hoc tests. The P3 amplitude observed at site
42
Fz varied by valence condition, Wilks' Lamda = .58, F(2, 63)= 23.2,/j.OOl. Post hoc
comparisons revealed that the P3 generated in response to neutral pictures was
significantly smaller than the P3 generated in response to both unpleasant pictures (p<
.001) and to pleasant pictures (p<.001). The P3 generated to pleasant and unpleasant
pictures did not differ (p=.929). The P3 amplitude observed at site Cz differed as well,
Wilks' Lambda= .32, F(2, 63)= 66.5, 001. Post hoc comparisons revealed a pattern in
which the P3 generated in response to neutral pictures was smaller than the P3
accompanying pleasant pictures (p<.001), which in turn were smaller than the P3
generated in response to unpleasant pictures (p<.05). The analyses of P3 peaks at site Pz
also revealed a differing expression of the potential as a function of valence, Wilks'
Lambda= .43, F(2, 63)= 41.1,/7<.001. The pattern of these results largely mirrored those
observed at site Cz, namely, neutral images produced the smaller P3s than did pleasant
images (p<.001), which in turn produced smaller P3s than did unpleasant images
(p<.001), (Figure 16).
It was predicted that for the area of the picture-locked ERP between 400
and 700 ms that low socialized participants would continue to produce more positive
waveforms to pleasant stimuli and would not produce differences between the negative
and neutral waveforms than were likely to be observed in the other two groups. This
prediction was assessed in two different ways, one being an examination of interaction
patterns in the omnibus model, the other the analyses of P3 amplitudes for the low
socialized group only. In order for the omnibus model to support this hypothesis it would
have been necessary to observe an interaction between socialization group and valence
43
(at the very minimum). No such interaction was observed. In an analysis of the low
socialized group alone main effects of valence, Wilks' Lambda= .22, F(2, 20)= 35.1,
/7<.001, and site, Wilks' Lambda= .72, F(2, 20)= 3.9,p<.05, were observed. An
interaction between these two factors was also observed in the data for the low socialized
group, Wilks' Lambda= .38, F(4,18)= 7.3,/?=.001. These data revealed a pattern that did
not support the hypothesis; low socialized men produced the largest P3 to unpleasant
stimuli.
A final set of analyses was completed to assess the final five seconds of
stimulus processing. To do so, area measures were computed for each of the last five
seconds of the picture-locked ERPs. These data were then entered into a mixed-model, 5
(time) X 3 (valence) x 3 (scalp site) x 3 (socialization group) x 2 (attention condition)
repeated measures GLM. Main effects of time, Wilks' Lambda= .63, F(4,56)= 8.1,
p<.001, and valence, Wilks' Lambda= .88, F(2,58)= 3.8,jP<.05 were observed as well as
a trend for a main effect of site Wilks' Lambda= .92, F(2,58)= 2.7,/?=.078. Several
interactions, all involving the factor of time, were also observed in the data. The factor of
time interacted with scalp site, Wilks' Lambda= .57, F(8, 52)= 5.0,/?<.001. Time also
interacted with valence, Wilks' Lambda= .65, F(8, 52)= 3.5, j7<.01.
Time also demonstrated a trend to interact with attention condition, Wilks'
Lambda= .87, F(4, 56)= 2.1,/)=.087. A four-way interaction between time, valence,
attention condition, and scalp site was also observed in the data, Wilks' Lambda= .53,
F(16, 44)= 2.4,/?<.05. As with previous analyses, this complex interaction was not
expected and did not involve group effects and thus was not decomposed further.
44
The prediction that low socialized participants would demonstrate a pattern
of ERPs that produced a more positive slow wave during the continued process of
pleasant stimuli when compared to the other groups was not observed in the omnibus test
as the interaction between the factors of Valence, Time, and Socialization was non
significant, Wilks' Lambda= .71, F(16,104)= 1.2,p=.262. This prediction was also
tested by examining the socialization by time interaction in an ANOVA model that
examined the slow wave data produced to only pleasant pictures. The interaction
observed for these data was non-significant, Wilks' Lambda= .85, F(8,118)= 1.3,
p=.25S. Furthermore, no interaction between socialization, time, and site was observed
in this analysis either.
The final, a priori hypothesis generated suggested that the low socialized
group would produce a more negative-going slow wave in response to unpleasant
pictures than would the other socialization groups. Similar to the previous hypothesis,
this prediction also suggested an interaction between the factors of Socialization,
Valence, and Time. As was determined above, this interaction failed to achieve statistical
significance (as did the four-way interaction of these factors including Site). To more
fully evaluate this hypothesis the late positive complex data for unpleasant pictures only
were analyzed via ANOVA. The results of the socialization by time interaction in this
analyses were also nonsignificant, Wilks' Lambda= .91, F(8,118)= .7,p=.654. Contrary
to prediction, it was the moderately socialized group that demonstrated the only negative-
going slope in response to negatively-valenced pictures. No other interaction involving
these two factors was observed.
45
DISCUSSION
Results from the present experiment present a mixed set of findings that
were partially consistent with previous work examining the behavioral and
psychophysiological reactions of unselected human participants in response to affective
stimuli. The data did not support any of the hypotheses regarding the
psychophysiological reactivity in low socialized individuals. The lack of support for
these hypotheses did not appear to represent a general failure to replicate well-established
effects, but rather a specific failure to show the predicted alterations as a function of
socialization. Before turning to a discussion of the implications for socialization and
psychopathy, the findings that replicate previous work are reviewed.
Replication of previous research
All participants produced behavioral ratings of pleasantness and arousal
that were generally consistent with normative expectations. As a whole, these students
also demonstrated typical patterns of eye-blinks in response to the three different
valences of slides, producing larger blinks when viewing negatively-valenced pictures
and smaller blinks during positively-valenced stimuli.
Consistent with the reports from Schupp et al (1997), and Cuthbert et al
(1998, 2000) attentional resources seem to have been differentially allocated as a function
of the valence class of a stimulus. These analyses indicated the attention-modulated N1
component generated in response to the images seemed to index valence; pleasant
pictures produced more negative (larger) Nls than did negatively-valenced images.
Similar to Cutbert et als 2000 report, it was observed in the present data set that the P3
46
generated in response to startle probes varied as a function of valence (and was modified
to a degree by scalp site).
It was observed that the probes presented during emotionally arousing
stimuli produced smaller P3s than did probes presented during non-arousing (neutral)
stimuli. In addition to this finding, it was observed in the current data set that anterior
scalp sites, while preserving the non-arousing greater than arousing trend, also
discriminated between valences. The interpretation of these data is consistent with the
interpretation offered by Cuthbert et al (1998), stating that the P3 "reflects the general
motivational pertinence of the cues" (p347). The smaller P3 observed in response to
probes presented during arousing stimuli is thought to be diminished as a result of the
loss of attentional resources that are allocated to the primary stimulus in the environment
- the emotionally arousing visual image. Likewise, the augmented P3 observed in
response to neutral probes represents the brain's attempt to allocate resources to, what is
in a neutral context, the most ecologically salient stimulus - the emotionally arousing
startle probe. Thus, attentional resources are increasingly recruited to the environmental
stimulus that presents itself as most important to survival. An organism is more likely to
survive (or reproduce) in arousing environments if it is able to more thoroughly evaluate
all stimuli that appear during these times. For instance, a loud bang is likely to draw
more attentional resources from a soldier in an otherwise quiet foxhole on a battlefield
than a similar bang heard by the same soldier spending a Saturday afternoon on a cot
watching a football game in the barracks.
47
Other measures of attentional allocation were not consistent with
previously published work. Cuthbert et al (1998) report N1 differences as a function of
valence in startle-probe locked ERPs, where N1 was largest in response to attended
probes presented during negatively-valenced stimuli. The present data demonstrate scalp
site by valence interactions and scalp site by attention condition interactions but no
interaction involving the factors of attention and valence was observed. Contrary to
Cuthbert et al's data, the present data revealed N1 amplitudes to attended probes were
non-significantly smaller than their ignored counterparts. It was observed, however, that
probes administered during pleasant pictures did produce smaller Nls than unpleasant
and neutral probes. One possible interpretation of this result would be that in the context
of a largely pleasant environment early attentional mechanisms are moderated relative to
neutral or unpleasant enviroimients.
Taken together the probe-elicited N1 and P3 data present a complex set of
data regarding the allocation of attentional mechanisms during affective picture viewing.
The N1 data would seem to suggest that attentional mechanisms have a tendency to
minimize the perceptual intensity of aversive stimuli presented in positive contexts. The
P3 data seem to indicate that broader aspects of relevance modulate subsequent
processing of these intrusive stimuli. The attentional system is designed in such a
manner as to promote survival of the organism. Early evaluations of the stimulus are
enhanced in unpleasant or neutral contexts, allowing immediate recognition of stimuli
that might be indicative of imminent harm. Later evaluations are enhanced by the
likelihood that the intrusive stimulus will make aversive or appetitive impacts.
48
The present data also supported Cuthbert et al's (2000) reported
observation that the late positive potential recorded in response to lAPS stimuli indexes
arousal. They reported that the late positive potential of the ERP indexed affective
arousal with more arousing pictures generating larger (more positive) potentials. A
similar effect was observed in the present analyses of the P3 peak where it manifested as
a main effect of valence and an interaction between valence and scalp site. It was also
observed in a time by valence interaction in the ERP extending from 1 to 6 seconds after
picture onset (figure 17). In the present data, unlike Cuthbert et al's, a statistically
significant trend was observed for the ERPs of the positively-valenced pictures to return
to baseline more quickly than the ERPs of the negatively-valenced pictures.
The late positive components seem to index the interest that the viewer
seems to have in the image. While speculative, one can consider that continuing
evaluation of negatively-valenced stimuli is necessary in order to assure survival of the
organism. A missed detail in an unpleasant enviroimient, no matter how seemingly
trivial, might result in some misfortune for the viewer. Pleasantly valenced scenes draw
the viewer's attention longer than non-arousing, neutrally valenced stimuli, but the
interest appears to fade more rapidly as there is no need for ongoing evaluation or threat
monitoring. A stronger challenge to these ideas would examine different content areas
within the broadly defined categories of pleasant and unpleasant. For instance, it could
be hypothesized that threatening images (e.g. a gun pointed at the viewer) would hold
attention longer than non-threatening, but unpleasant images (e.g. mutilation or gore).
49
It is thus the case that the data recorded in this experiment at least partially
replicate previous research utilizing similar methodologies. Some minor differences are
noted above (e.g. the time by valence interaction of the late positive potential observed in
the present data but not seen in Cuthbert et al's (2000) report). Methodological
differences between studies are likely to have played at least a small role in these
differences. Certainly the most salient of these differences would be the utilization of a
selected sample and the exclusion of women in the present study, as well as different
stimulus sets, and differences in the hardware used to acquire the physiological data.
Socialization and its relationship to affective processing
Results of this experiment failed to support any of seven, a priori
hypotheses related to socialization. Furthermore, omnibus statistical models revealed no
consistent and interpretable differences between socialization groups. The observations
made in this experimental work did not support the supposition that low socialized men
would process affective stimuli in a manner different than moderately or highly
socialized men. The results presented here suggest several possible interpretations, three
of which seem most salient. The first of these interpretations is that low socialized men
do not differ in their physiological reactions to affective stimuli. This would suggest that
unlike the more dysfunctional, or "true" Hare or Cleckley psychopaths, low socialized
men have no demonstrable deficit in the manner in which they process affective
information. The second is related to the heterogeneous nature of the stimulus sets and
the possibility that a deficit in affective processing in low socialized men may be more
specific than the broadly-defined affective categories manipulated in this experiment. A
50
final possible interpretation suggests that a Type II statistical error has been made and
that methodological insufficiencies obscured underlying differences between the three
socialization groups.
Differences in socialization may not be related to the manner by which
these individuals process affective information. In other words, physiological
responsivity to affective material may not be related to socialization. In the present
sample socialization was correlated with a self-report (and hence far from ideal) measure
of psychopathy. The correlation was stronger with the antisocial factor (2) of the LSRP
(although both factors were significantly correlated). It may be the case that the low
socialized individuals in the present experiment, unlike true psychopaths, process
affective information in a manner by which they hear the words and feel the music"*.
The present study was developed based on reports in the literature
describing differences in autonomic reactivity to affective stimuli in psychopaths as
compared to non-psychopath controls. Several arguments can be made as to why the
results reported in the present study do not represent a Type II error. Primary among
these arguments, as mentioned above, is the case that socialization is only moderately
correlated with psychopathy. A plausible conceptualization of this relationship is to view
true psychopaths as creating a pathological subset contained within the larger group of
low socialized individuals. Assuming that only a small subset of the low socialized
subjects in this study would be classified as psychopaths by PCL-defined criteria, then
Selected statistical analyses of the data presented in this report were performed using self-reported psychopathy as between-groups measure (in lieu of CPI-Socialization). These analyses did not reveal any between-groups differences in physiological response (either startle blink or ERP) to the affective stimuli.
51
the present findings are not entirely inconsistent with observations reported by Patrick,
Bradley and Lang (1993) that indicated that only the subset of true psychopaths that were
highest on the emotional detachment factor produced diminished amplitude startle blinks
in response to unpleasant stimuli. It is unlikely that the present sample of low socialized
individuals consisted of such individuals. A stronger test of the theory would have
involved selecting a larger group of low socialized students and comparing those who
were more emotionally detached to those who were less so.
One finding that also supports the notion that the observations are not
related to a Type II statistical error is the observation that the low socialized produced
different self-report measures of pleasantness and arousal than did the other groups. The
low socialized found pleasantly valenced pictures to be less pleasant than the high
socialized group, and found the negatively-valenced pictures to be more pleasant than the
other two groups. Furthermore, the low socialized group reported less arousal to
negatively-valenced stimuli than did either of the other groups. These findings suggest
that the low socialized are not similar to psychopaths in the sense that unlike psychopaths
(who report similar arousal and pleasantness ratings to control groups, e.g. Patrick et al,
1993), this sample of low socialized students seemed to have been less attuned to the
"words" of emotion relative to their more socialized peers, while physiologically
experiencing something quite similar.
One possible explanation for this observation was noted in follow-up
interviews with the participants. Many low socialized individuals (and a few moderately
socialized participants as well) reported that the stimuli used in the present experiment
52
were relatively mild compared to material that they commonly viewed on the Internet.
Many of the lAPs images were reported to be dated, or old fashioned by the young
students in this sample; they often commented on the relatively poor image quality of
some of the digitized images. Thus the low socialized group's increased exposure to
more sophisticated and provocative imagery may have accounted for the differences in
self-reported arousal and pleasantness. Simply put the low socialized sample produced a
something that can be interpreted as a blunted response to the affective pictures.
Previous experience with similar low socialized participants (Dikman and Allen, 2000)
suggests that the low socialized group manifests greater degrees of psychopathology and
drug abuse, factors that could reasonable contribute to the blunted response described
above.
The lack of support for the hypotheses cannot be attributed to an
underpowered experiment. Although this experiment was underpowered (estimates of
power varied greatly, but often fell in the .1 range), concerns about lack of power were
trumped by means that were often observed in patterns that were completely inconsistent
with a priori predictions. Increasing sample sizes would have been likely to drive these
differences even further in the 'wrong' (i.e. not predicted) direction. For example it was
predicted that the low socialized group would produce smaller P3s in response to startle
probes presented during pleasant pictures than to probes presented during unpleasant or
neutral pictures. The data did support this hypothesis in the least - low socialized
individuals produced the smallest P3s to negatively-valenced probes (albeit non-
significantly smaller).
53
One other consideration against a Type-II error can be considered. A report
published after the data collection was completed in the present study, suggests that
hypotheses developed for the present experiment that predicted between-groups
differences that occurred late in stimulus evaluation may not have been as viable as
initially considered. Sutton et al. (2002) report that female psychopaths only produced
autonomic differences to affective stimuli during the first two seconds of stimulus
evaluation, and that by some point at or before 4.5 seconds into stimulus presentation the
autonomic differences that were observed earlier had largely disappeared. Their report,
albeit in female psychopaths, might have led to a different set of hypotheses suggesting
that the between groups differences might well have disappeared or been modified during
the later stages of stimulus evaluation.
The inability to detect between-groups differences may be related to the
broadly-defined affective categories manipulated in the present experiment and the
possibility that the affective processing differences in low socialized humans is more
specific than the categories chosen for this experiment. The stimuli as manipulated and
analyzed were grouped into categories based on how pleasant or unpleasant they are to
participants. These categories were rather heterogeneous with respect to the content
included that was selected to maximize arousal and pleasantness ratings between the
three categories. Unpleasant stimuli consisted of images including those depicting gore
or mutilations (8 of 18 slides), threat to the viewer or to another person in the image (8 of
18), and negative faces (2 of 18). The pleasant slides, in similar fashion, also consisted of
stimuli from several different categories including nudes or sexual images (8 of 18),
54
appetizing foods (3 of 18), objects associated with wealth or money (2 of 18), sports (4 of
18), and one images of babies. The deficit in the low socialized participants may be
specific to any one (or possibly some other) of these categories. It may be that low
socialized individuals may, as a group, manifest atypical physiological responses only
negative faces, or only threat images, but not to the broadly construed category of
"unpleasant" stimuli.
The possibility of the occurrence of a Type II error cannot, however, be
absolutely ruled out. Methodological problems may have obscured differences between
the low socialized students and their more highly socialized peers. For instance, no
reports exist in the literature that have examined the between-groups sensitivity of
cortical measures in response to affective stimuli.
Summary
The present experiment demonstrated moderate support for several often-
replicated patterns of human physiological response to affective stimuli. These data
provide additional support for theories suggesting a strong link between attentional
allocation and emotional arousal. This nature and scope of this link merits further
investigation - numerous other questions are raised by this and other similar experiments.
For instance, do specific categories of emotionally arousing stimuli modify attentional
allocation? It seems as though the attention-arousal theory would predict that in some
instances that this might be the case, e.g. do negatively-valenced threat pictures sustain
attention (as measured by the late positive component of the ERP) longer than images
depicting mutilations or other disgusting material? It seems reasonable to assume that in
55
such a case maintaining a constant awareness of the unpleasant stimulus is far more
important in the case of threat than in the case of disgust (in which case attention is often
driven away from the stimulus).
The present experiment did not support a model of socialization in which
low socialized persons process affective information differently than more highly
socialized groups. Numerous possibilities (detailed above) exist as to why the present
experiment failed to find support for the model.
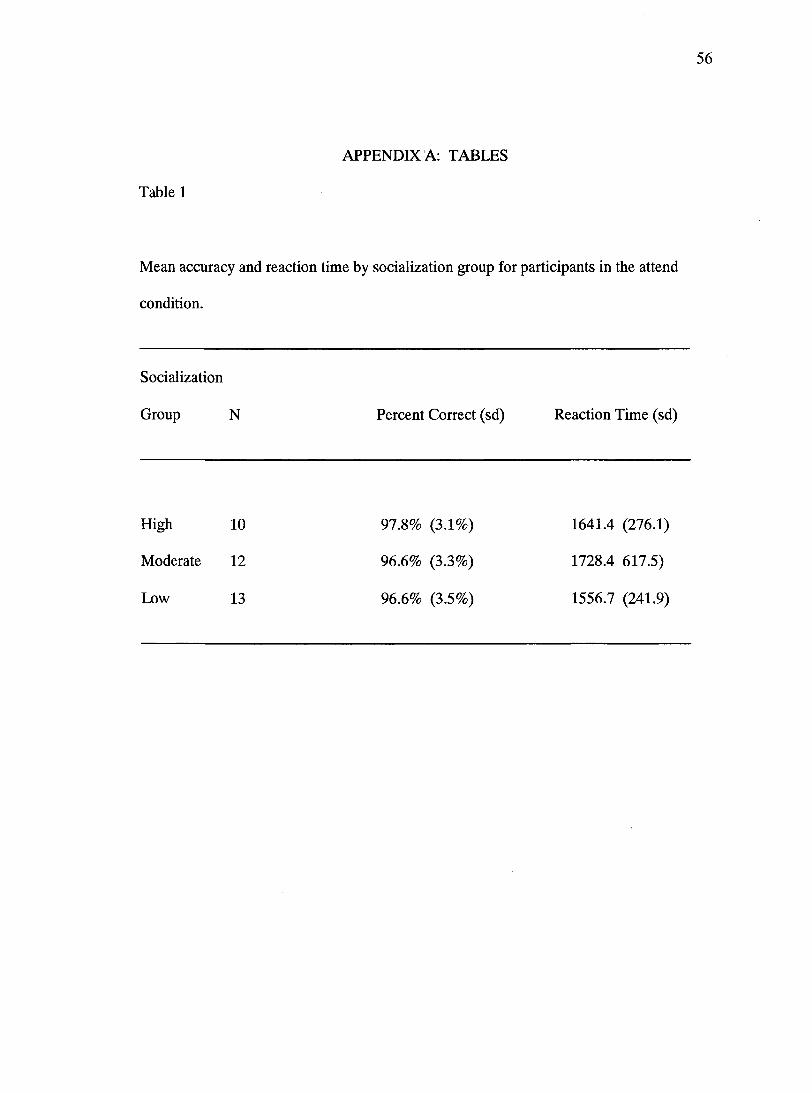
56
APPENDIX A: TABLES
Table 1
Mean accuracy and reaction time by socialization group for participants in the attend
condition.
Socialization
Group N Percent Correct (sd) Reaction Time (sd)
High 10 97.8% (3.1%) 1641.4 (276.1)
Moderate 12 96.6% (3.3%) 1728.4 617.5)
Low 13 96.6% (3.5%) 1556.7 (241.9)
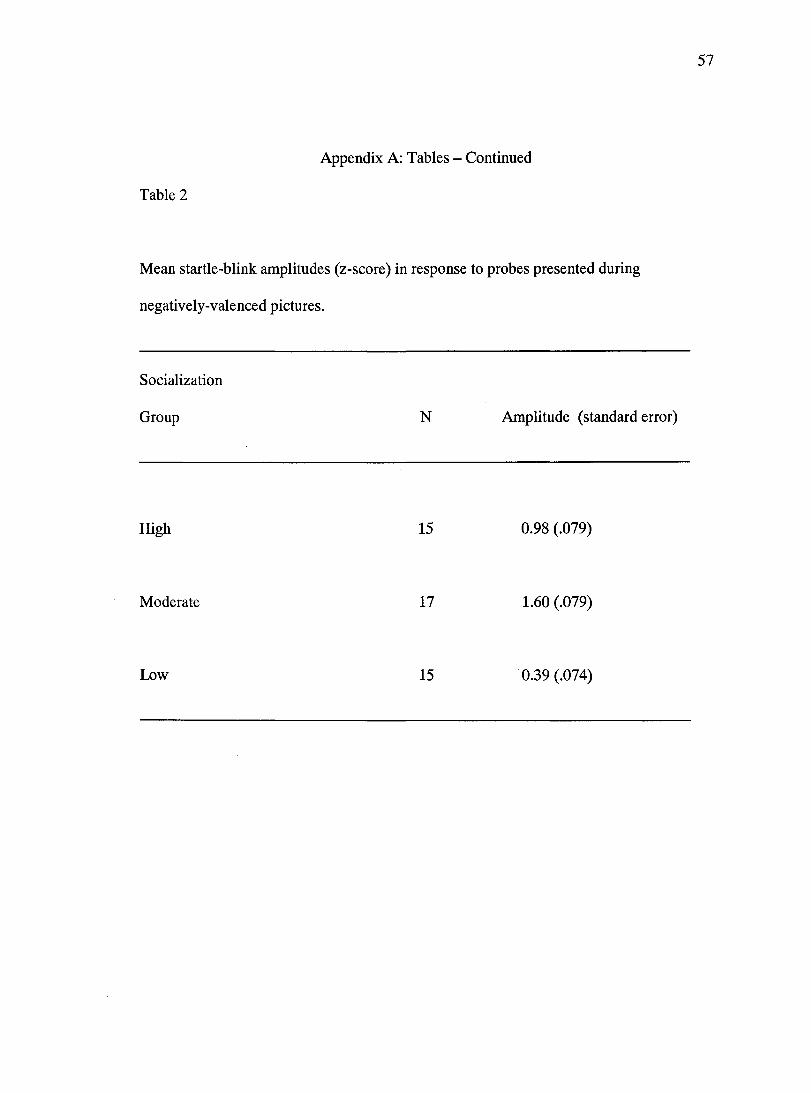
57
Appendix A: Tables - Continued
Table 2
Mean startle-blink amplitudes (z-score) in response to probes presented during
negatively-valenced pictures.
Socialization
Group N Amplitude (standard error)
High 15 0.98 (.079)
Moderate 17 1.60 (.079)
Low 15 0.39 (.074)
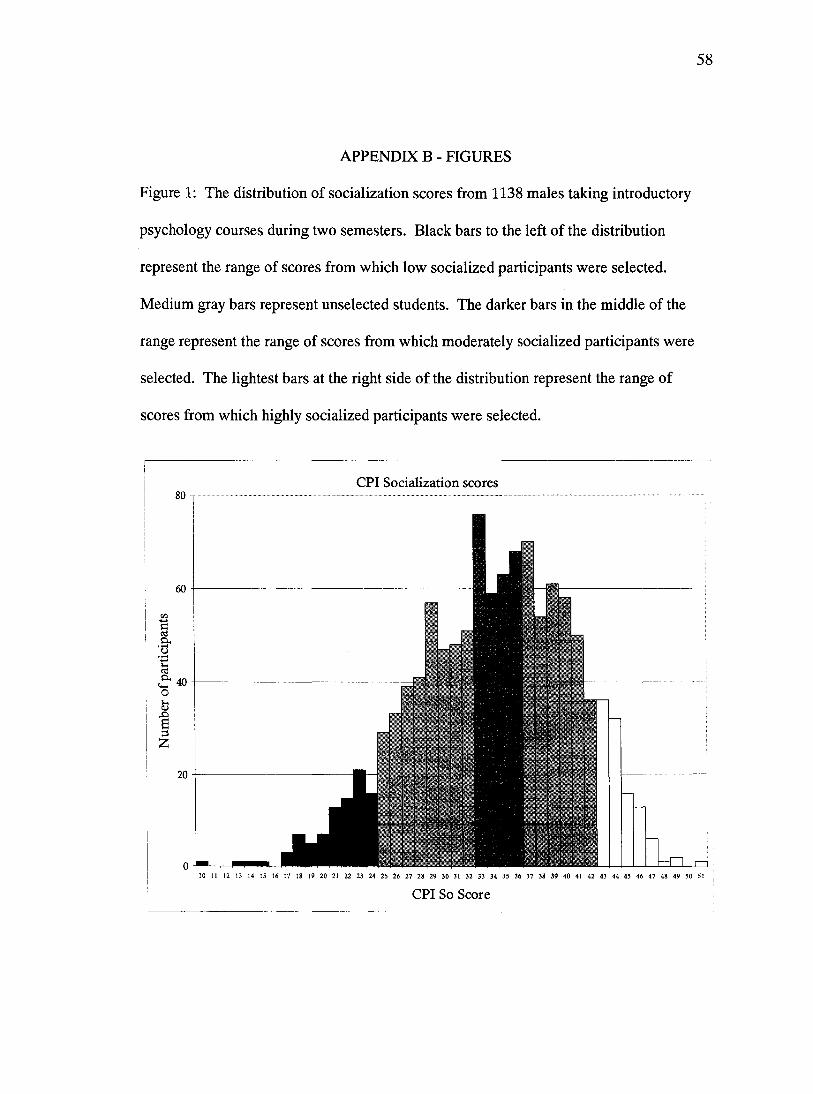
58
APPENDIX B - FIGURES
Figure 1: The distribution of socialization scores from 1138 males taking introductory
psychology courses during two semesters. Black bars to the left of the distribution
represent the range of scores from which low socialized participants were selected.
Medium gray bars represent unselected students. The darker bars in the middle of the
range represent the range of scores from which moderately socialized participants were
selected. The lightest bars at the right side of the distribution represent the range of
scores from which highly socialized participants were selected.
CPI Socialization scores 80 1
10 11 12 13 14 15 16 17 18 19 20 21 22 23 24 25 26 27 28 29 30 31 32 33 34 35 36 37 38 39 40 41 42 43 44 45 46 47 48 49 50 51
CPI So Score
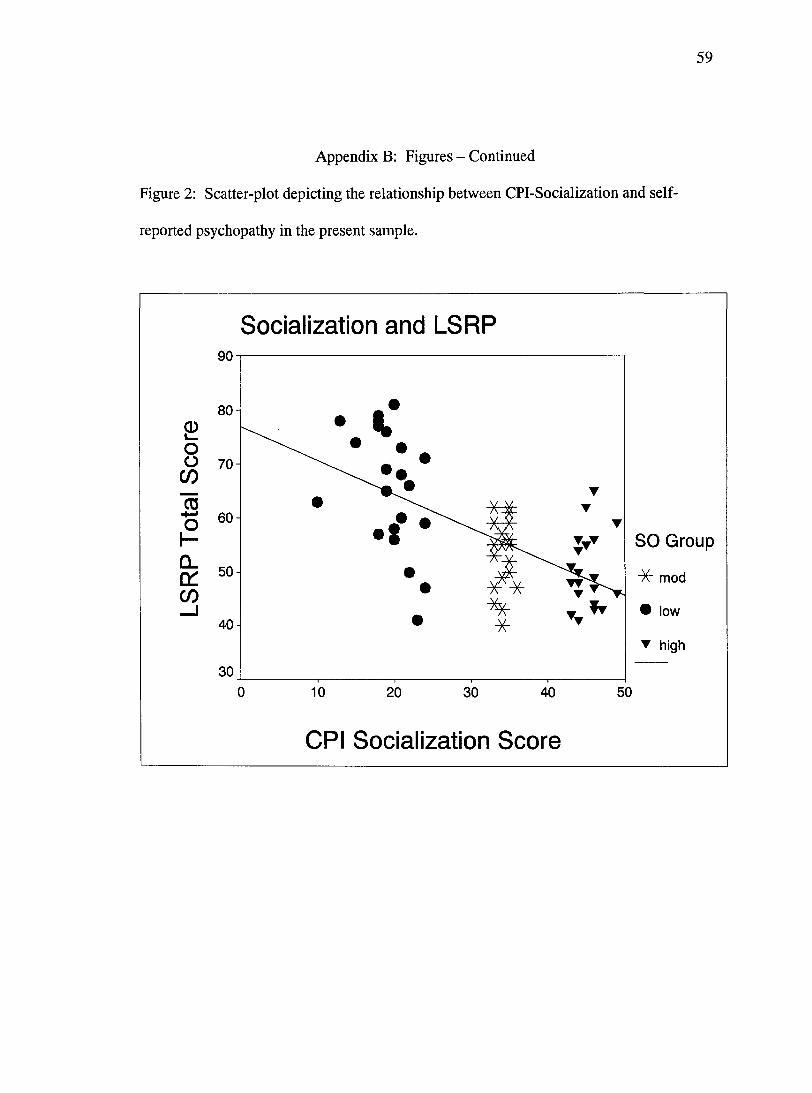
59
Appendix B: Figures - Continued
Figure 2: Scatter-plot depicting the relationship between CPI-Socialization and self-
reported psychopathy in the present sample.
Socialization and LSRP 90
30
O 70
SO Group
mod
• high
10 20 30 40 50
CPI Socialization Score
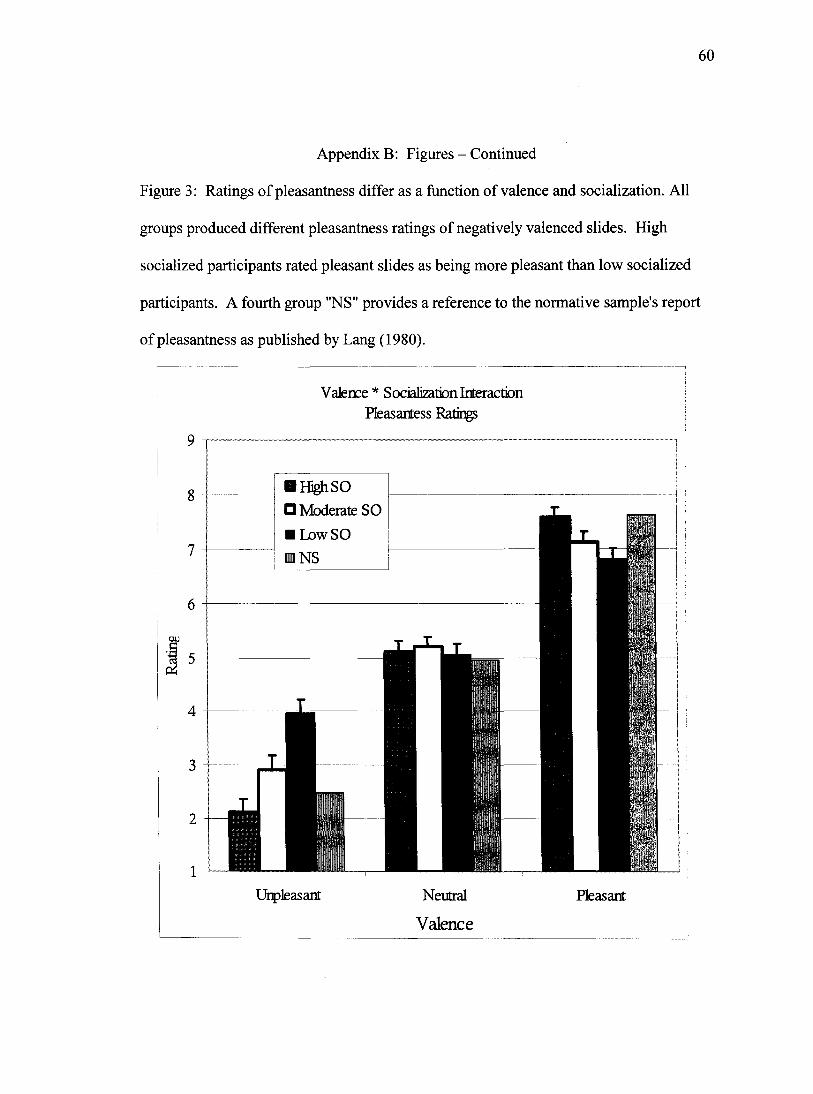
60
Appendix B: Figures - Continued
Figure 3; Ratings of pleasantness differ as a function of valence and socialization. All
groups produced different pleasantness ratings of negatively valenced slides. High
socialized participants rated pleasant slides as being more pleasant than low socialized
participants. A fourth group "NS" provides a reference to the normative sample's report
of pleasantness as published by Lang (1980).
Valence * Socialization Interaction Heasartess Ratings
9 ^
BHghSO
• Moderate SO
• Low SO
II NS
Uipkasant Neutral Pleasail
Valence
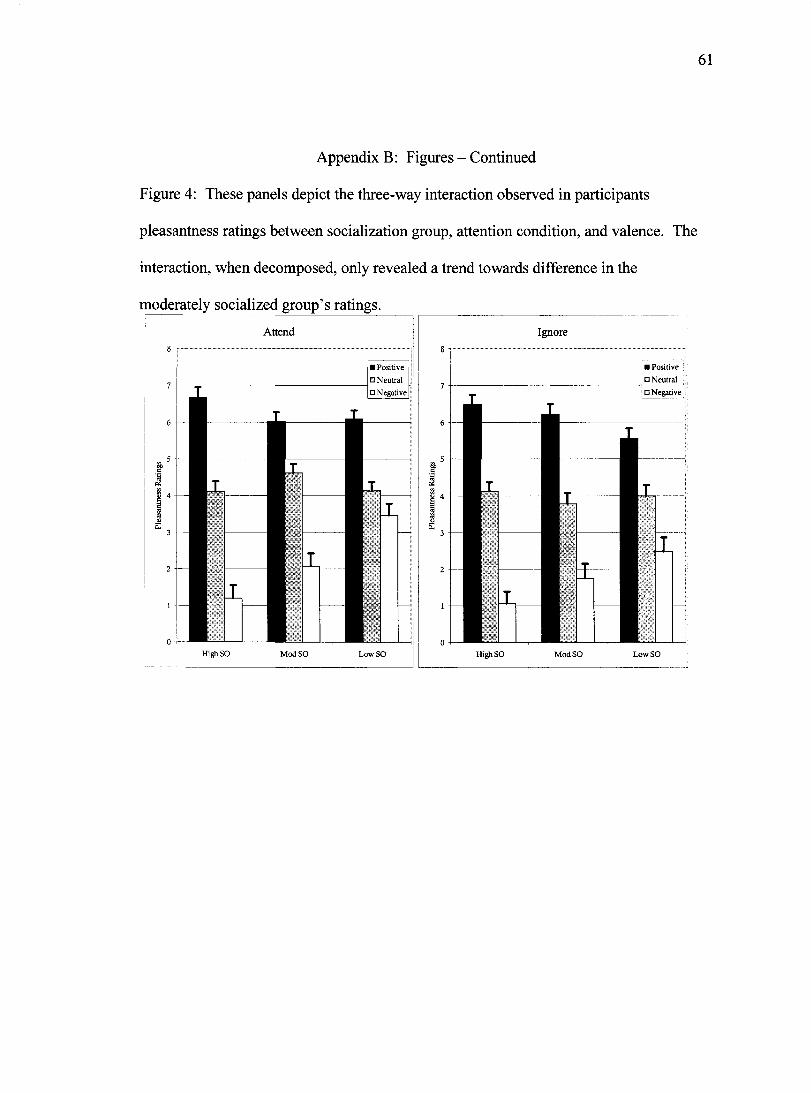
61
Appendix B: Figures - Continued
Figure 4; These panels depict the three-way interaction observed in participants
pleasantness ratings between socialization group, attention condition, and valence. The
interaction, when decomposed, only revealed a trend towards difference in the
moderately socialized group's ratings.
Attend
• Positive
O Neutral
• Negative
High SO Mod SO
Ignore
Positive
• Neutral
• Negative
High SO
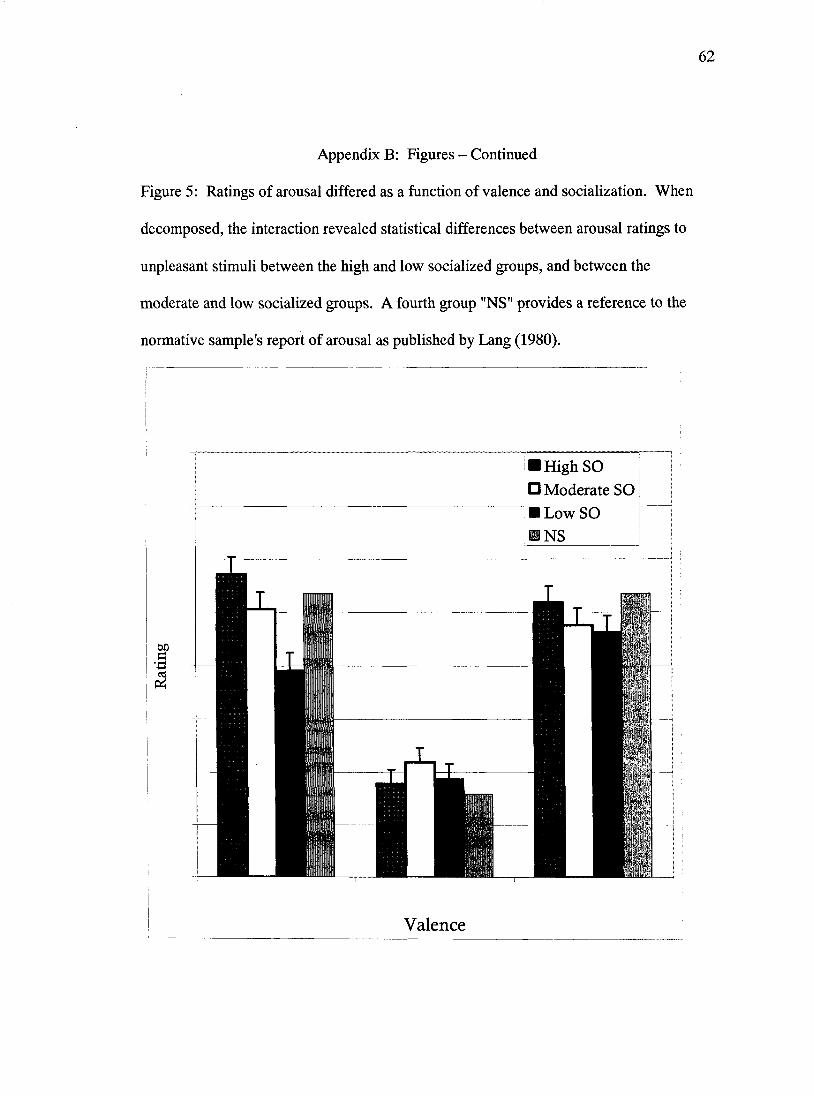
62
Appendix B: Figures - Continued
Figure 5: Ratings of arousal differed as a function of valence and socialization. When
decomposed, the interaction revealed statistical differences between arousal ratings to
unpleasant stimuli between the high and low socialized groups, and between the
moderate and low socialized groups. A fourth group "NS" provides a reference to the
normative sample's report of arousal as published by Lang (1980).
High SO
• Moderate SO
Low SO
NS
Valence
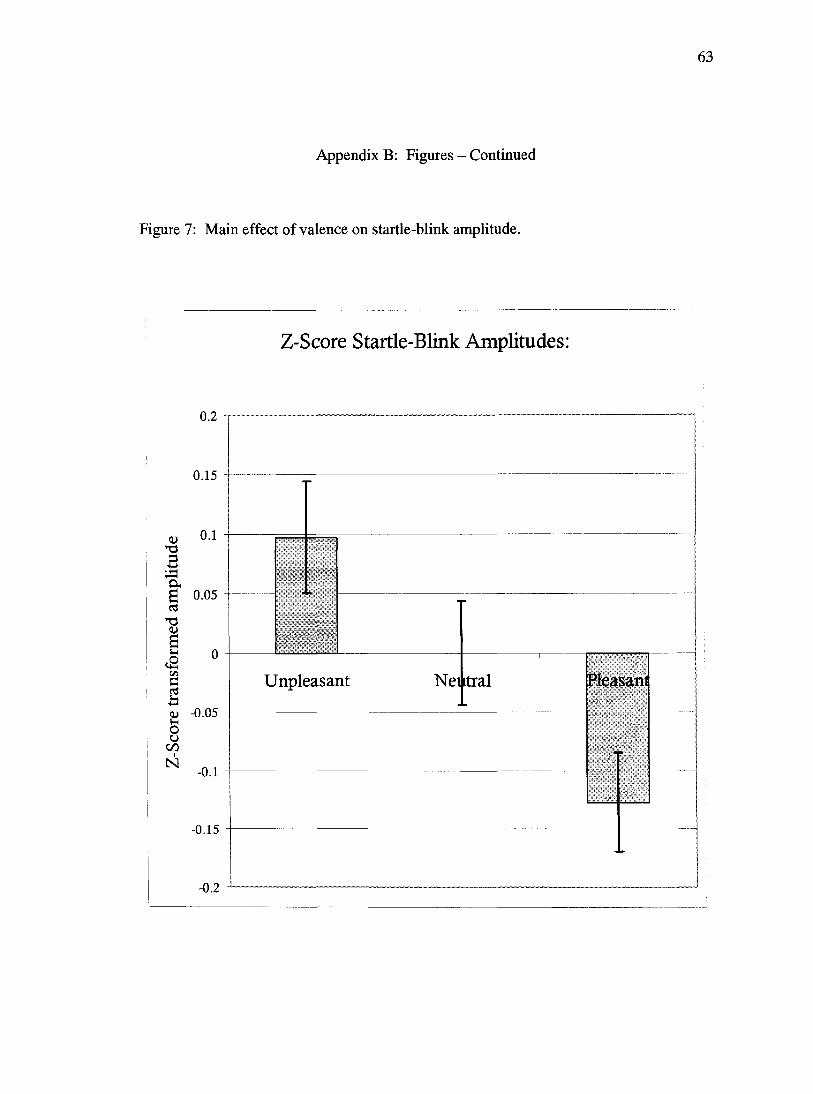
63
Appendix B: Figures - Continued
Figure 7: Main effect of valence on startle-blink amplitude.
0.2
0.15
a; 0.1
3
g 0.05 ct
TS <u
0 C/5 n S (]j -0.05 !-H o u
00
-0.1
-0.15
Z-Score Startle-Blink Amplitudes:
Unpleasant Nei itral Pleasani
-0.2
Appendix B: Figures - Continued
Figure 8: Figures on the following three pages display grand average waveforms
depicting probe-locked ERPs for each scalp site (by page), both attention conditions (by
row), socialization group (by column), and valence (line styles).
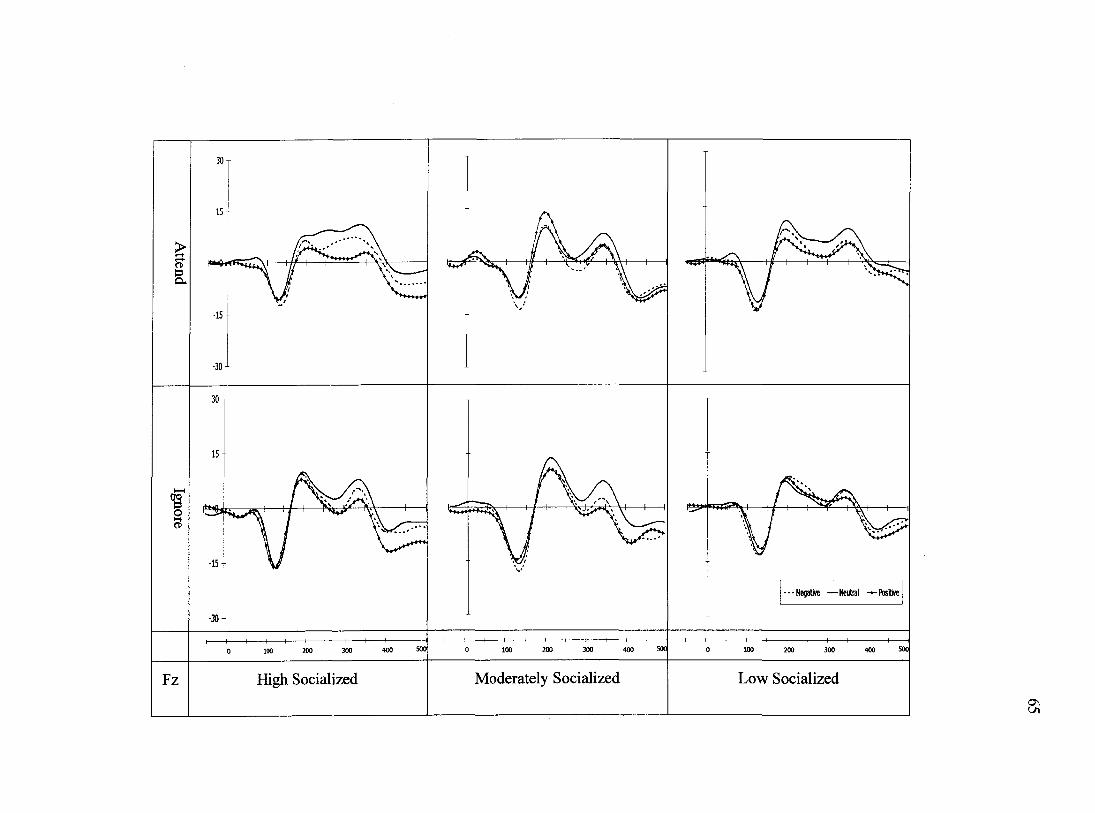
CU
Negative —Neutral -^Positive
500 500 500 300 100 200 400 100 400 200 300 400 200 300 100
Moderately Socialized Low Socialized High Socialized
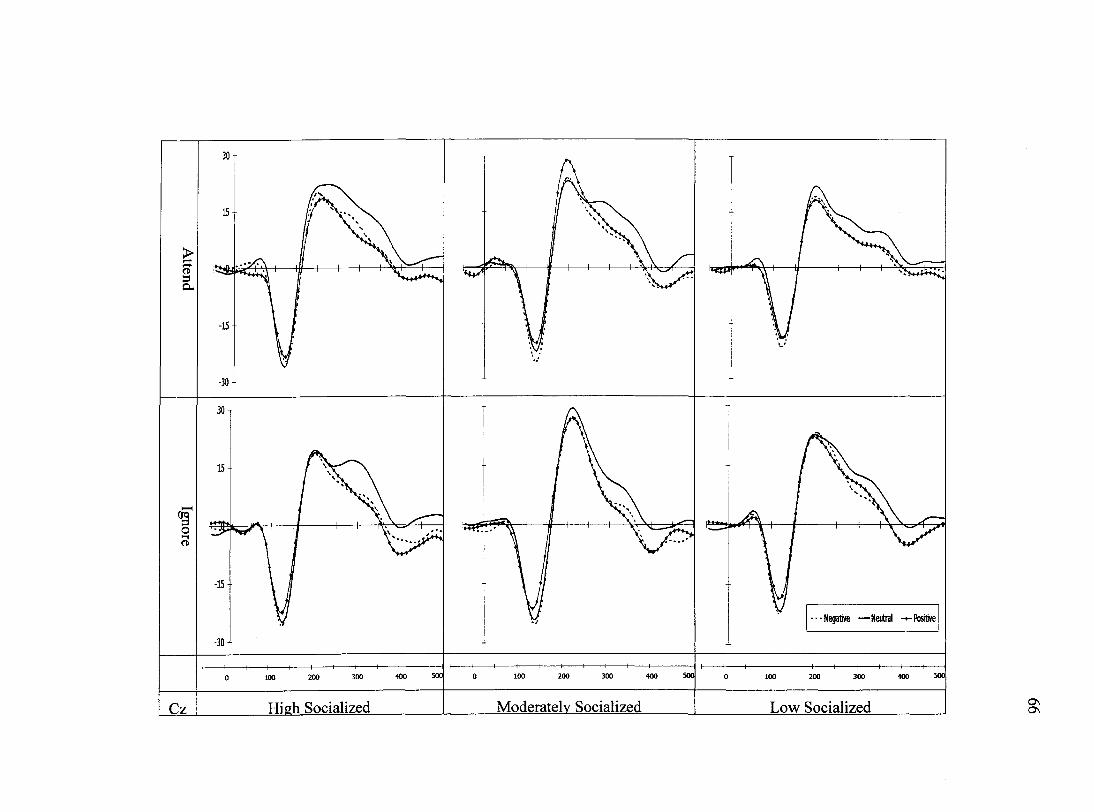
30 T
15-
•15-
•••Negative —Neutral Positive
500 500 500 100 200 300 400 400 100 200 300 400 300 200 100
Moderately Socialized High Socialized Low Socialized Cz
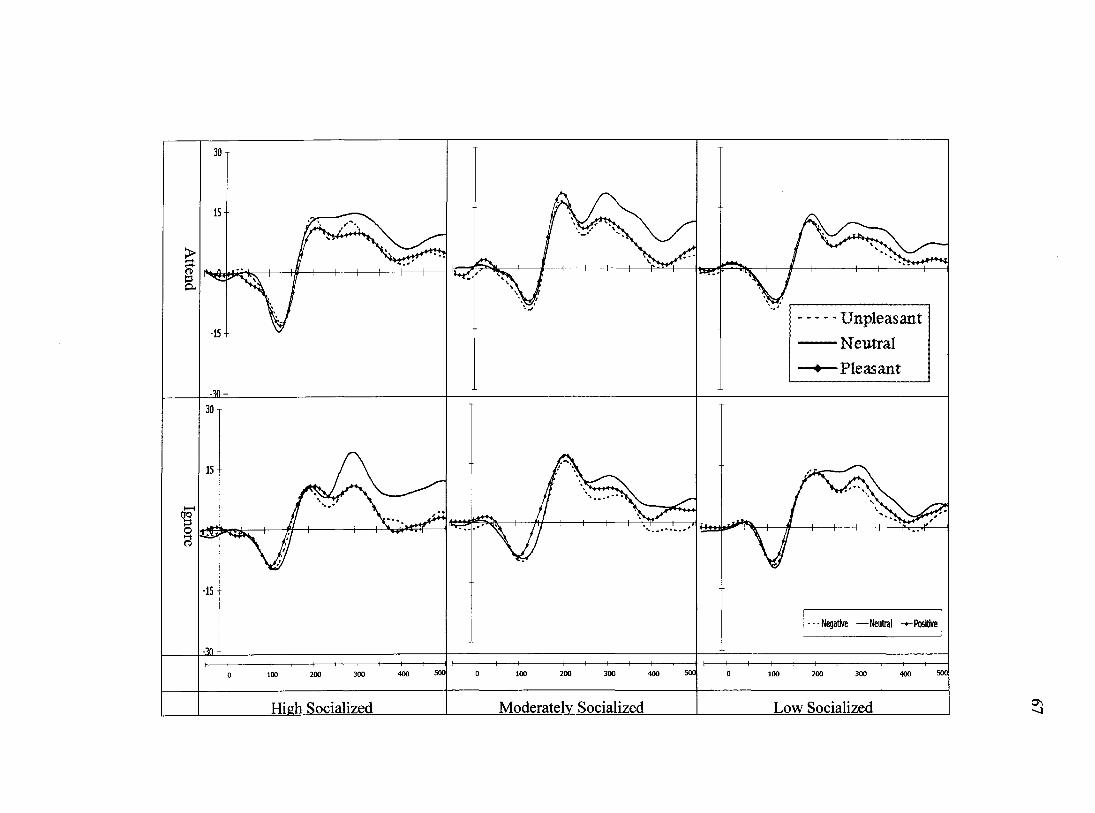
1 5 -
- - - Unpleasant — Neutral
—Pleasant
-15 -
•15-
•••Negative —Neutral -^Positive
500 500 500 200 300 100 400 200 300 400 100 400 200 300 100
Moderately Socialized Low Socialized High Socialized (y\ <1
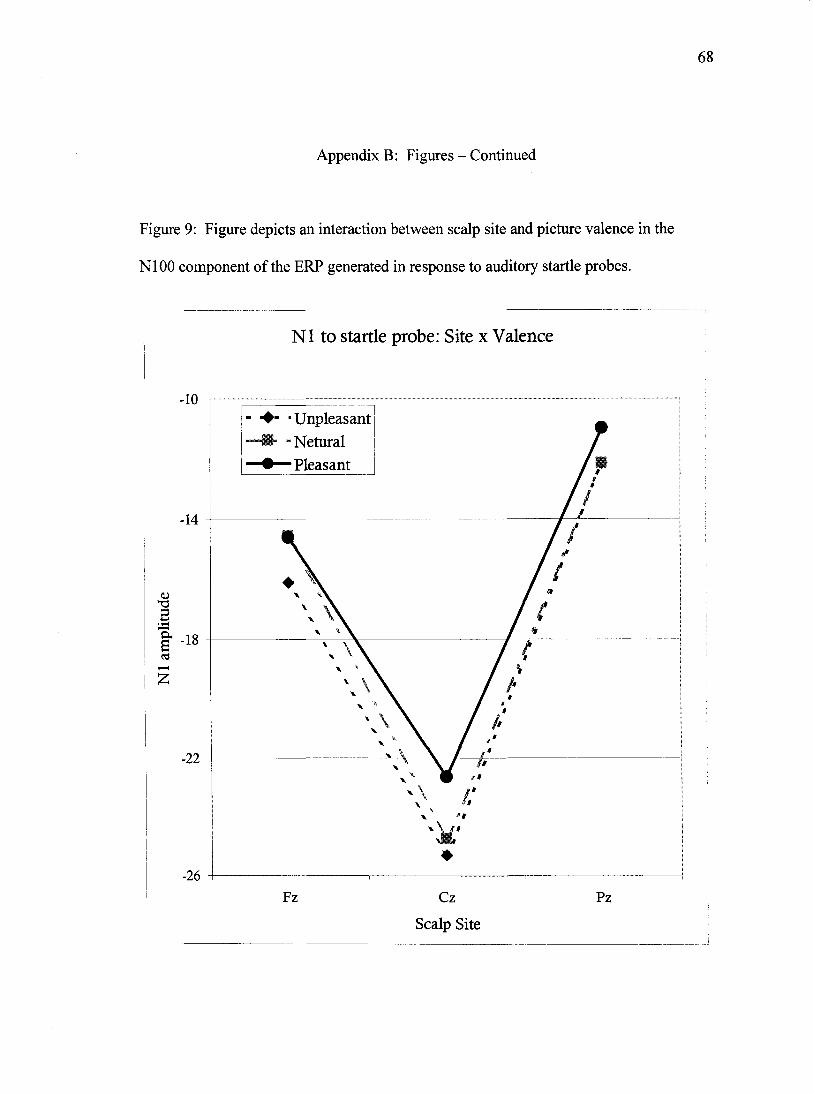
Appendix B: Figvires - Continued
Figure 9: Figure depicts an interaction between scalp site and picture valence in the
NlOO component of the ERP generated in response to auditory startle probes.
N1 to startle probe: Site x Valence
-10
- -Unpleasant
—•> -Netural
—•—Pleasant
-14
u •a
I | .18
-22
-26
Fz Cz Pz
Scalp Site
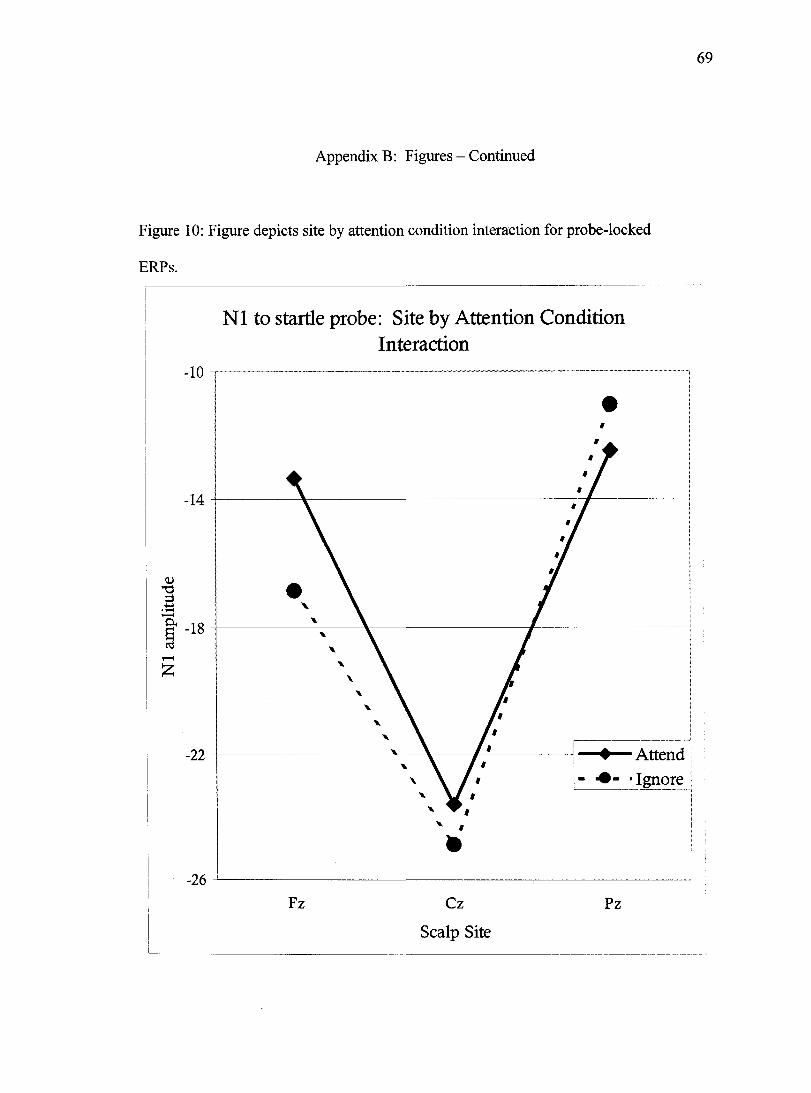
Appendix B: Figures - Continued
Figure 10: Figure depicts site by attention condition interaction for probe-locked
ERPs.
N1 to startle probe: Site by Attention Condition Interaction
-10
-14
<u
T-H
— Attend - -Ignore
-22
-26
Fz Cz Pz
Scalp Site
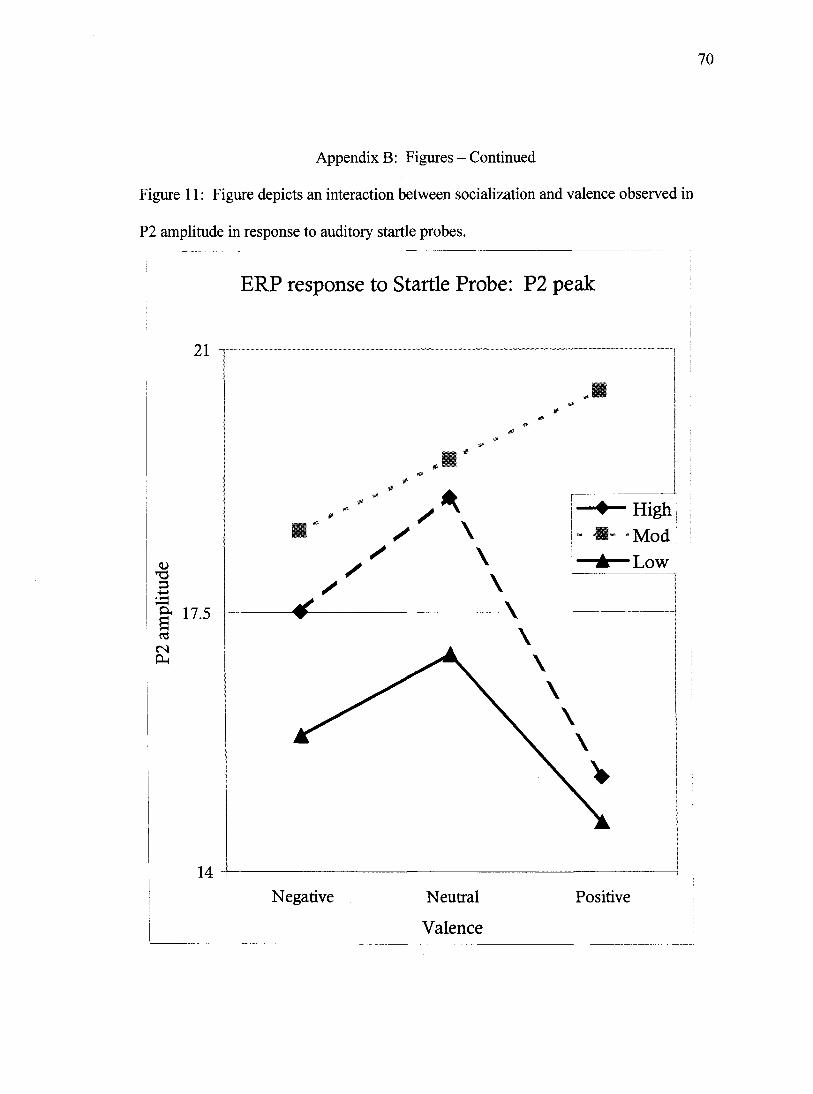
70
Appendix B: Figures - Continued
Figure 11: Figure depicts an interaction between socialization and valence observed in
P2 amplitude in response to auditory startle probes.
ERP response to Startle Probe: P2 peak
<u
2 & 17.5 cd
csi pLn
Negative Neutral
Valence
Positive
Appendix B: Figures - Continued
Figure 12a: Figure depicts the picture-locked, grand-average waveforms for the
interaction of scalp-site, socialization group, and valence category for the first 800ms
after stimulus onset.
Figure 12b: Figure depicts the picture-locked, grand-average waveforms for the
interaction of scalp-site, socialization group, and valence category for the entire, 6-
second-long viewing period.
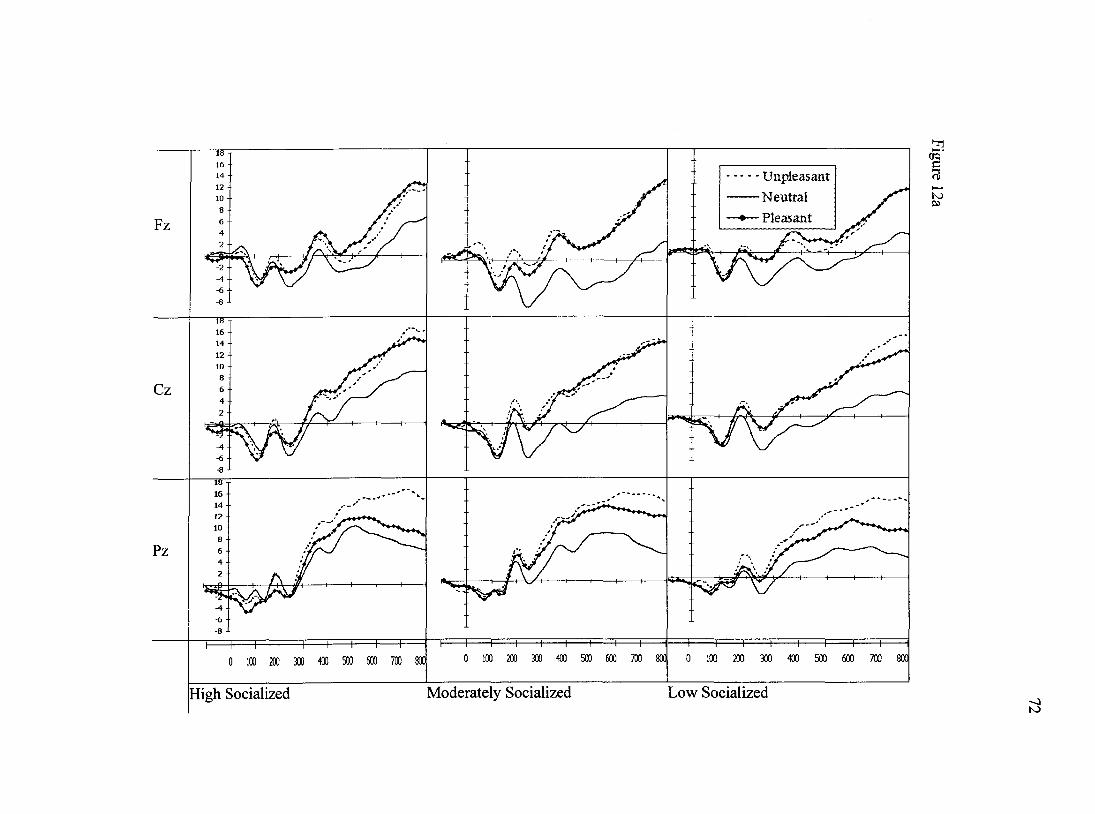
— Unpleasant
—Neutral •*— Pleasant
High Socialized Moderately Socialized Low Socialized to
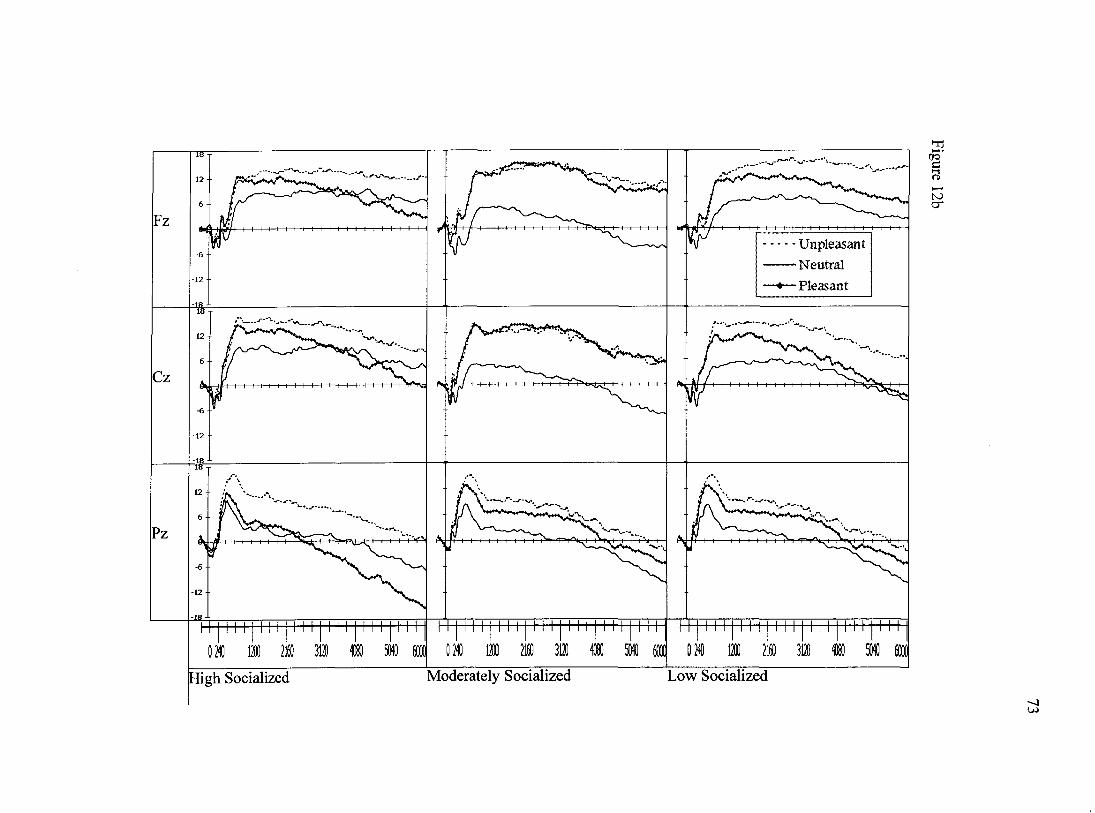
Fz
12
6 -
Fz
-6 •
-12
-
Unpleasant
Neutral
—•— Pleasant
Cz
18
12
6
/ ^*S|| , 1 Jf
Jif /
>»*••*• """x.
Cz
-6
-12
-IR
Pz
m 1 12
6 f W 1
1 f \ v,,--,^, •// \ "
<*"4 2 \ -v. / Ak fx \ ^
.1/ \
Pz
-6 •
-12 •
-19-
ji 1 1 1 1 1 1 1 1 1 1
1 1 1 M 1 M i 1 1 1 1 M 1 1 M M 1 OM) 11 2i M D Mm
M 1 1 M 1 1 M 1 M 1 1 1 M 1 1 M 1 1 M OM) 11 m 3120 « M sn
1 1 1 1 M 1 1 M 1 M 1 1 1 M 1 1 M 1 1 M OM) 11 2160 3120 1180 5i fflOC
High Socialized Moderately Socialized Low Socialized
U)
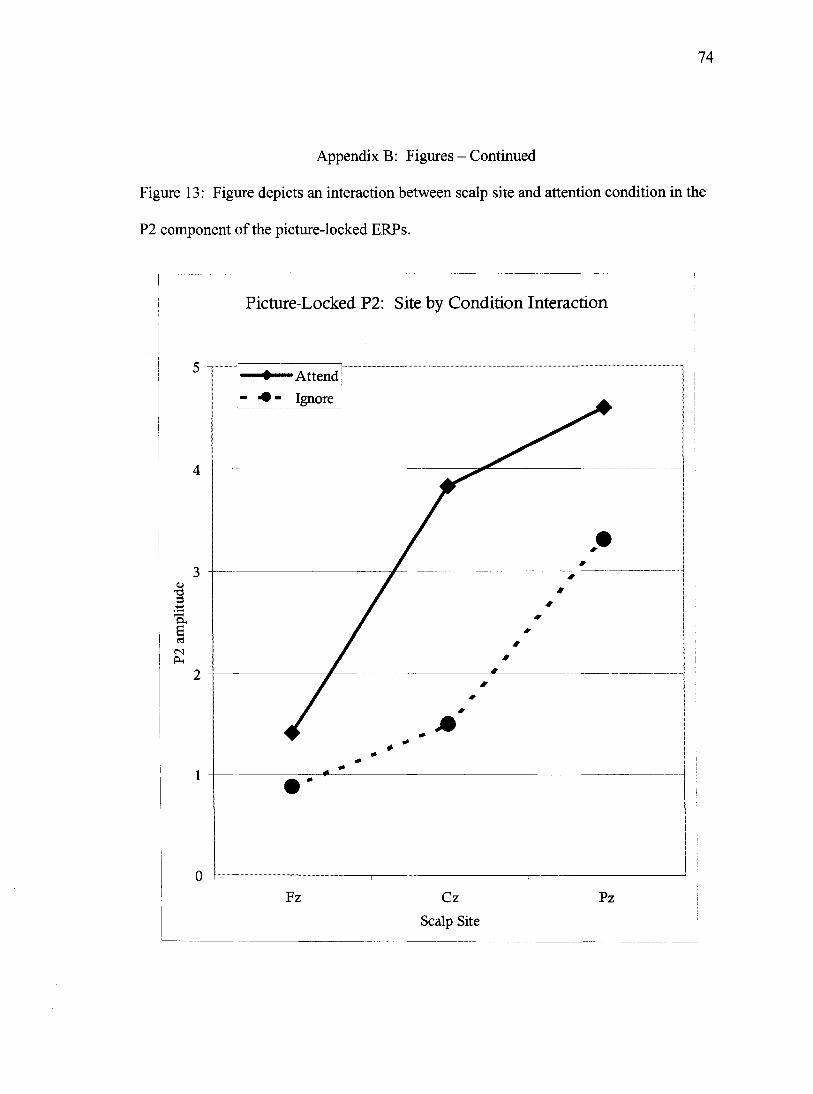
74
Appendix B: Figures - Continued
Figure 13: Figure depicts an interaction between scalp site and attention condition in the
P2 component of the picture-locked ERPs.
Picture-Locked P2: Site by Condition Interaction
5 • Attend
• - Ignore
4
3
2
1
0
Fz Cz Pz
Scalp Site
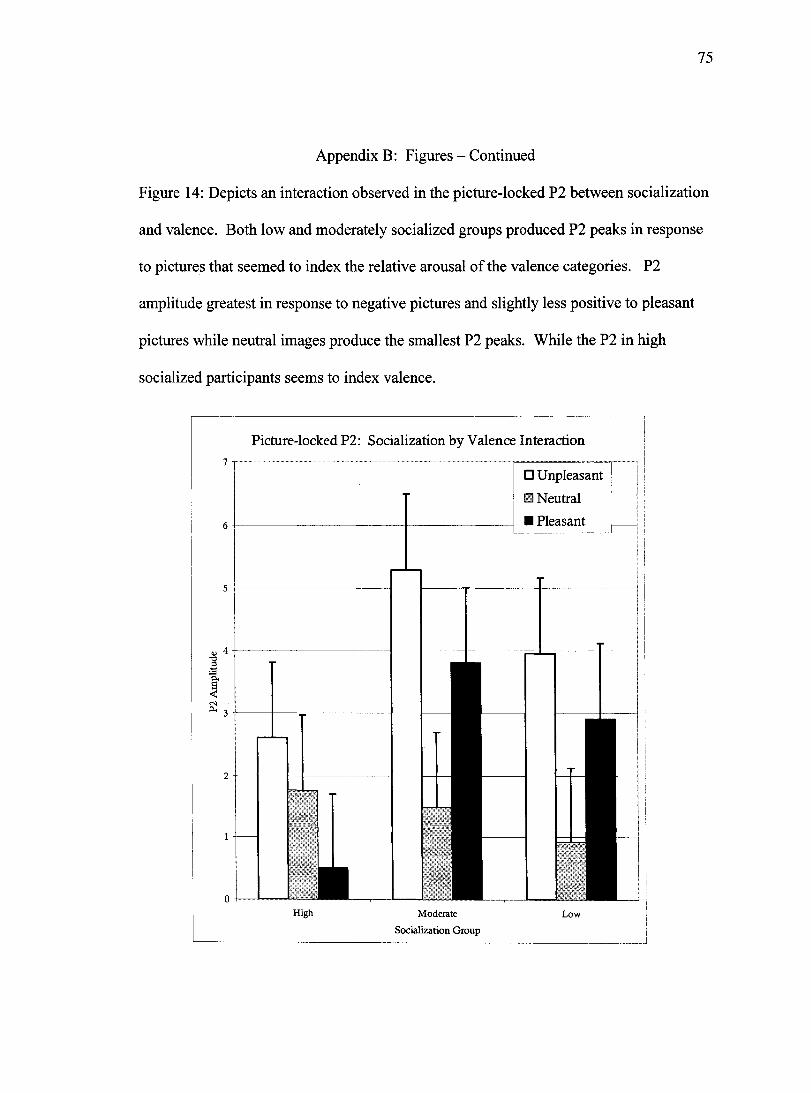
75
Appendix B: Figures - Continued
Figure 14: Depicts an interaction observed in the picture-locked P2 between socialization
and valence. Both low and moderately socialized groups produced P2 peaks in response
to pictures that seemed to index the relative arousal of the valence categories. P2
amplitude greatest in response to negative pictures and slightly less positive to pleasant
pictures while neutral images produce the smallest P2 peaks. While the P2 in high
socialized participants seems to index valence.
Picture-locked P2: Socialization by Valence Interaction
• Unpleasant
S Neutral
• Pleasant
5
Moderate
Socialization Group
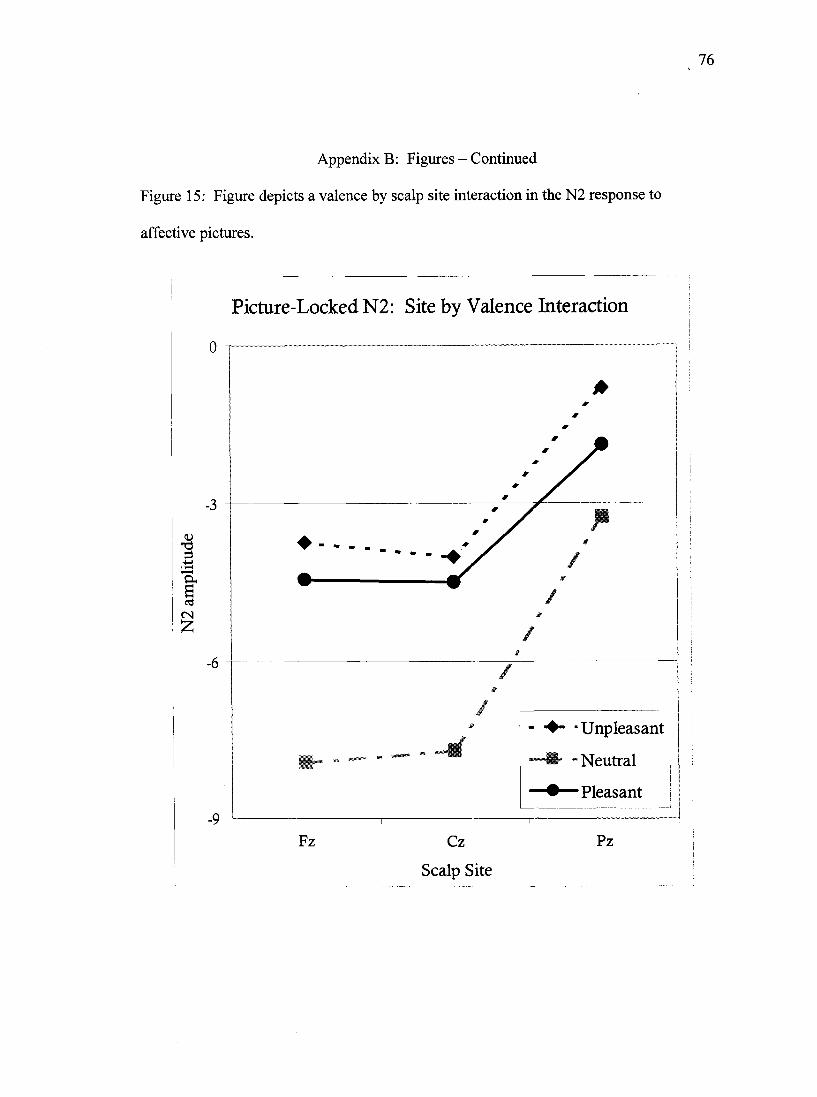
76
Appendix B: Figures - Continued
Figure 15: Figure depicts a valence by scalp site interaction in the N2 response to
affective pictures.
Picture-Locked N2: Site by Valence Interaction I
0
3
CN
•6
• Unpleasant
"Neutral
-Pleasant
•-
•9
Pz Fz Cz I
Scalp Site
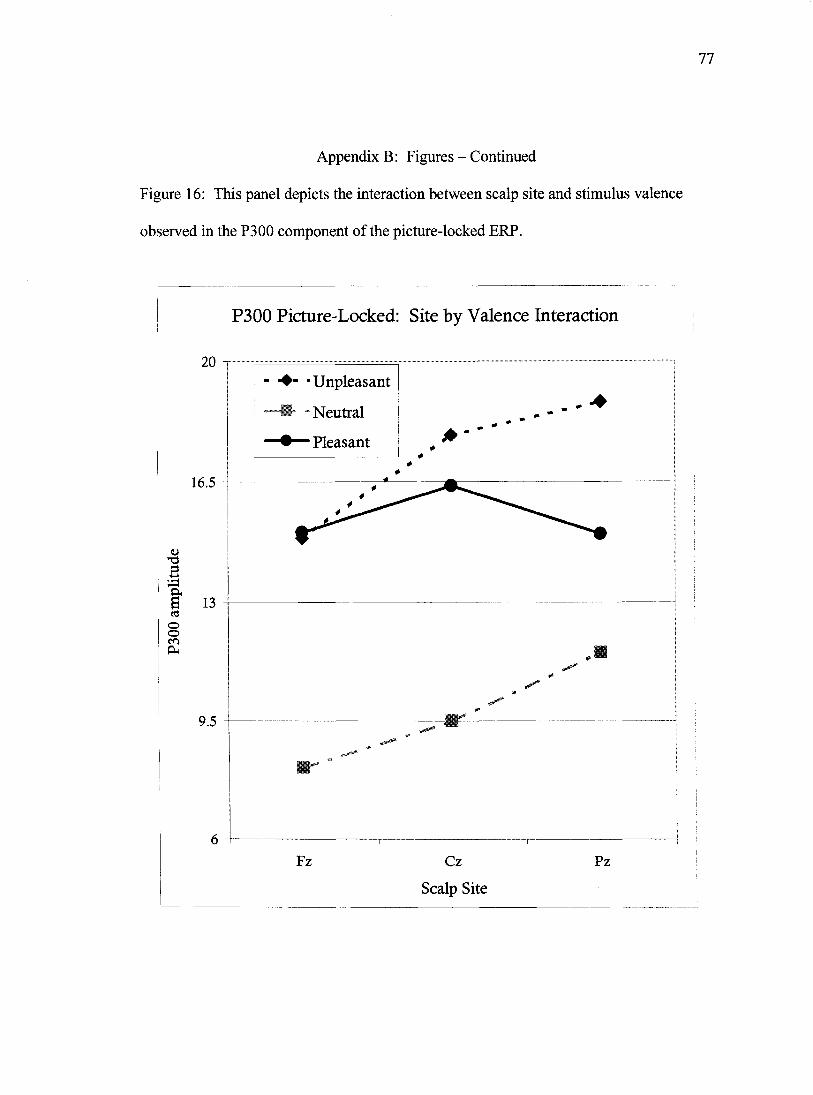
Appendix B: Figures - Continued
Figure 16: This panel depicts the interaction between scalp site and stimulus valence
observed in the P300 component of the picture-locked ERP.
P300 Picture-Locked: Site by Valence Interaction
20
16.5
<u
3 •,=i
& o o <r> PM
13
9.5
• Unpleasant
• Neutral
•Pleasant
Fz Cz
Scalp Site
Pz
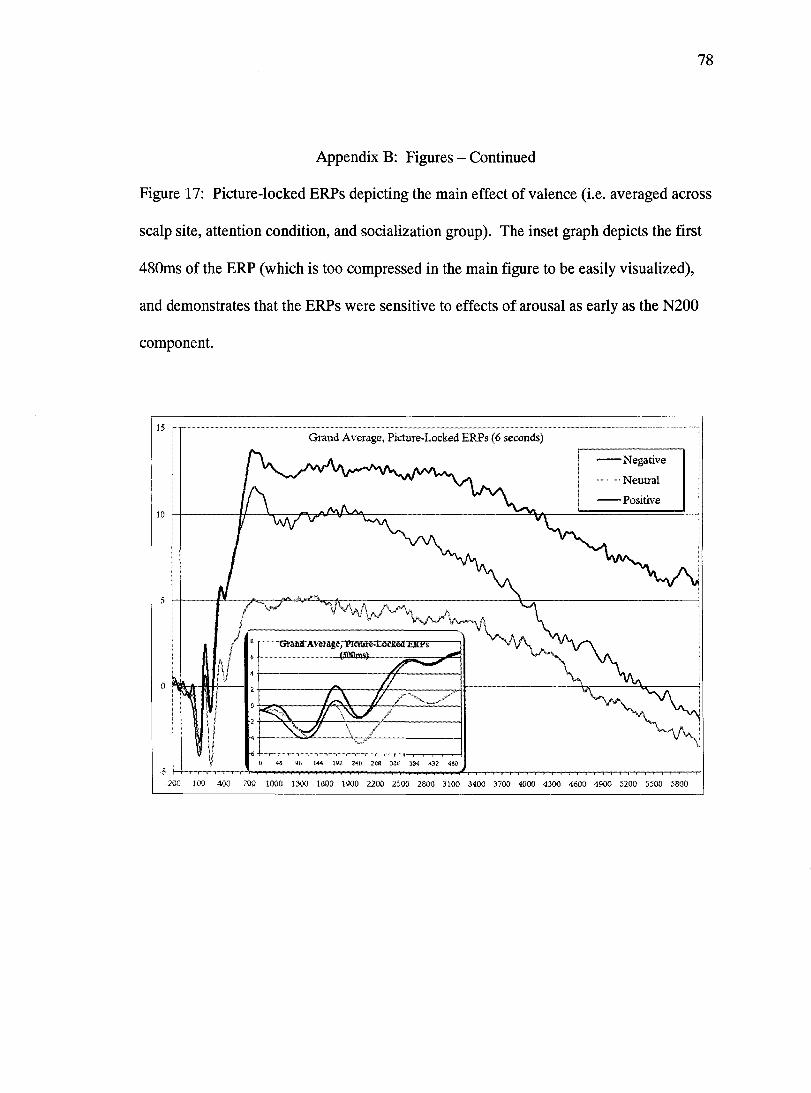
78
Appendix B: Figures - Continued
Figure 17: Picture-locked ERPs depicting the main effect of valence (i.e. averaged across
scalp site, attention condition, and socialization group). The inset graph depicts the first
480ms of the ERP (which is too compressed in the main figure to be easily visualized),
and demonstrates that the ERPs were sensitive to effects of arousal as early as the N200
component.
15 Grand Averse, PictBre-Locked ERPs (6 seconds)
Negative
Neutral
Positive 10
0
•200 iOO 400 700 1000 1300 1600 1900 2200 2500 2800 3100 3«0 3700 4000 4300 4600 4900 5200 5500 5800
79
REFERENCES
Center for the Study of Emotion and Attention [CSEA-NIMH] (1996). The international
affective picture system [lAPS; digitized photographic slides]. Gainesville, FL:
University of Florida
Cleckley, H. C. (1976). The Mask of Sanity. St. Louis: Mosby.
Cuthbert, B. N. (2000). Personal communication via Email. Copy available upon
request.
Cuthbert, B. N., Schupp, H. T., Bradley, M. M., Birbaumer, N., & Lang, P. J. (2000).
Brain potentials in affective picture processing: Covariation with autonomic arousal
and affective report. Biological Psvcholoev. 52. 95-111.
Cuthbert, B. N., Schupp, H. T., Bradley, M., McManis, M., & Lang, P. J. (1998).
Probing affective pictures: Attended startle and tone probes. Psvchophvsiologv. 35.
344-347.
Day, R., & Wong, S. (1996). Anomalous perceptual asymmetries for negative emotional
stimuli in the psychopath. Journal of Abnormal Psychology. 105. 648-652.
80
Dikman, Z. V., & Allen, J. J. B. (2000). Error Monitoring during Reward and Avoidance
Learning in High and Low socialized Individuals. Psvchophvsioloev. 37. 43-54.
Donchin, E. (1981). Surprise!...Surprise? Psvchophvsiologv. 18.493-513.
Foulds, J., McAllister, H., & Foulds, S. (1988). The relationship between socialisation
and electrodermal activity in normal subjects. Journal of Psvchophvsioloev. 2. 227-
230.
Gough, H. G. (1994). Theory, development, and interpretation of the CPI socialization
scale. Psvchological Reports. 75. 651-700.
Hare, R. D., Frazelle, J., & Cox, D. N. (1978). Psychopathy and physiological responses
to threat of an aversive stimulus. Psvchophysiologv. 15.165-172.
Hare, R. D., Harpur, T. J., Hakstian, A. R., Forth, A. E., Hart, S. D., and Newman, J. P.
(1990). The revised Psychopathy Checklist: Reliability and factor structure.
Psvchological Assessment: A Journal of Consulting and Clinical Psvchologv. 2.
338-341.
81
Rowland, E. W., Kosson, D. S., Patterson, M., & Newman, J. P. (1993). Altering a
dominant response: Performance of psychopaths and low socialized college students
on a cued reaction time task.
Jutai, J. W., & Hare, R. D. (1983). Psychopathy and selective attention during
performance of a complex perceptual-motor task. Psvchophvsiology, 20,146-151.
Lang, P. J. (1980). Behavioral treatment and bio-behavioral assessment: Computer
applications. In J. B. Sidowski, J. H. Johnson, & T. A. Williams (Eds.), Technology
in mental health care delivery systems (pp. 119-137). Norwood, NJ: Ablex
Publishing.
Levenson, M. R., Kiehl, K. A, & Fitzpatrick, C. M. (1995). Assessing psychopathic
attributes in a noninstitutionalized population. Journal of Personality and Social
Psychology. 68.151-158.
Lynam, D. R., Whiteside, S., & Jones, S. (1999). Self-reported psychopathy: A
validation study. Journal of Personality Assessment, 73.110-132.
Patrick, C. J., Bradley, M. M., & I^ng, P. J. (1993). Emotion in the criminal psychopath:
Startle reflex modulation. Journal of Abnormal Psychology. 102. 82-92.
82
Patrick, C. J., Cuthbert, B. N., & Lang, P. J. (1994). Emotion in the criminal psychopath:
Fear image processing. Journal of Abnormal Psychology. 103. 523-534.
Raine, A., & Venables, P. H. (1987). Contingent negative variation, P3 evoked
potentials, and antisocial behavior. Psvchophvsiologv. 24.191-199.
Raine, A., & Venables, P. H. (1988). Enhanced P3 evoked potentials and longer P3
recovery times in psychopaths. Psvchophvsiologv. 25,30-38.
Schupp, H. T., Cuthbert, B. N., Bradley, M. M., Birbaumer, N., & Lang, P. J. (1997).
Probe P3 and blinks: Two measures of affective startle modulation.
Psvchophvsiologv. 34.1-6.
Sutton, S. K., Vitale, J. E., & Newman, J. P. (2002). Emotion among women with
psychopathy during picture perception. Journal of Abnormal Psychology. 111. 610-
619.


![Research Article Psychophysiological Associations between ... · etiological factors in comorbid tinnitus and sleep disorders [ ]. Primary or psychophysiological insomnia insomnia](https://img.pdfslide.net/doc/110x75/5e988286df96d863364cf528/research-article-psychophysiological-associations-between-etiological-factors.jpg)