Embed Size (px)
Citation preview
1
Supplementary Information
Pt-Au Core/Shell Nanorods: Preparation and Applications as
Electrocatalysts for Fuel Cells
Chen-Wei Liu, Yu-Chen Wei, Chung-Chiun Liu and Kuan-Wen Wang*
Institute of Materials Science and Engineering, National Central University
Taoyuan 32001, Taiwan
*To whom correspondence should be addressed,
E-mail: [email protected]
Fax: 886-3-2805034, Tel: 886-3-4227151 ext 34014
Current address: Institute of Materials Science and Engineering, National Central
University, No.300, Jhongda Rd., Taoyuan 32001, Taiwan.
Electronic Supplementary Material (ESI) for Journal of Materials ChemistryThis journal is © The Royal Society of Chemistry 2012
2
Experimental section
1. Preparation of Catalysts
The 45 wt % of Pt-Au/C nanorods with the Pt/Au ratio of 3:1 were prepared via
the formic acid reduction method. Two step of reduction routes were used to
synthesized Pt-Au/C nanorods with core/shell structures. In briefly, aqueous solutions
of H2PtCl6 (Alfa Aesar) and HAuCl4 (Aldrich) with stoichiometric ratio of 3:1 were
blended and deposited with different sequence at 340 K onto the commercial carbon
black (Vulcan XC-72R). For instance, the solution of H2PtCl6 and carbon were first
mixed and reduced by formic acid for 72 hours, and then Au precursor was reduced
by formic acid for another 48 hours. The as-deposited catalysts were subsequently
dried at 330 K for 24 h, and stored as fresh PtAu shell nanorods. On the contrary, the
Pt shell nanorods were prepared by the initial reduction of Au precursor and following
deposition of Pt. For comparison, the commercial Pt/C (TKK) catalysts with 50 wt %
Pt loading were used.
2. Characterization of Catalysts
The exact compositions of the Pt-Au nanorods were examined by inductively
coupled plasma- atomic emission spectroscopy (ICP-AES, Jarrell-Ash,ICAP 9000).
The metal loadings of the Pt-Au nanorods were performed by thermal
gravimetric analysis (TGA, Perkin Elmer TGA-7). Initially, a small amount of Pt-Au
nanorods was placed into a Pt made basket and then transferred it into TGA
measurement with a temperature range staring from 300 to 1173 K at a heating rate of
7 K min-1 under air atmosphere.
The phase structure of the nanorods have been characterized by a Shimadzu
X-ray diffractometer with a CuKα (λ = 0.15406 nm) radiation source generated at 40
kV and 25 mA and performed in a 2θ range of 20 and 80o. The XRD with a scan rate
Electronic Supplementary Material (ESI) for Journal of Materials ChemistryThis journal is © The Royal Society of Chemistry 2012

3
of 1°min-1 was used to estimate the grain size of alloy nanoparticles by Scherrer’s
formula.
The morphologies of the Pt-Au nanorods were examined by a Jeol-2100 high
resolution transmission electron microscope (HRTEM) with a LaB6 electron gun
source operated at 200 KeV. The line-scan results with varying composition across the
nanorods were obtained by the equipped EDX attachment (Oxford). Initially, the
catalysts were ultrasonically suspended in 2-propanol which was placed into a vial.
The uniform suspension was then immediately dried on a 200 mesh/inch copper grid.
The morphologies of the Pt-Au nanorods were characterized by a field emission
scanning electron microscope (FEI Nova Nano 230).
Electrochemical measurements were performed by a glassy carbon rotating disk
electrode (RDE), a MSR rotator (Pine Instrument) and a microcomputer-controlled
electrochemical analyzer (CHI700a, CH Instrument). The ink was mixed of 5 mg
alloy catalysts and diluted Nafion solution (5 wt %, DuPont) in 1 mL 2-propanol
which was dispersed in ultrasonic bath, and then deposited onto the glassy carbon
RDE (0.196 cm2 area). A Pt plate and a saturated calomel electrode (SCE) were used
as the counter and reference electrodes, respectively.
For the ORR measurement, 20 μL of the slurry was deposited on the GC
electrode. The estimated Pt metal loading on the GC electrode was about 44 and 33
μg for Pt/C and Pt-Au nanorods, respectively. The electrolyte was used as 0.5 M
H2SO4 (Panreac) aqueous solution, and then saturated with high-purified O2 (99.999
%) at room temperature. Linear sweep voltammetry (LSV) was conducted to study
the activity of the ORR with a scan rate of 5 mVs-1 and a rotation rate of 1600 rpm.
Before each electrochemical measurement, the electrodes were cycled several times
between -0.24 and 0.96 V (vs. SCE), to produce clean surfaces at a scan rate of 20
mVs-1 and a rotation rate of 1600 rpm. All potentials in this study are given with
Electronic Supplementary Material (ESI) for Journal of Materials ChemistryThis journal is © The Royal Society of Chemistry 2012
4
respect to the reference electrode, which is +0.241 V vs. NHE. For the comparison of
ORR activity on all catalysts, the current density is calculated from the experimental
data based on the mass-transfer correction for RDE by the following equation:S1
dk
d
I II =
I - I (1)
where I is the experimentally measured current density during the ORR, Ik is the mass
transport free kinetic current density and Id is the diffusion-limited current density.
Moreover, the mass activity is obtained by the normalization of kinetic current to the
weight of Pt. All of the Ik reported in this study is compared within the mixed
kinetic-diffusion region at E = 0.85 V.
The stability of the Pt-Au nanorods was conducted via cyclic voltammograms
(CV) characterization on an identical three electrode system. A similar preparation
method of catalyst inks was also used as described above. The CV plots were
recorded at a scan rate of 20 mVs-1 in the N2-saturated 0.5 M H2SO4 aqueous solution
between -0.24 and 1.36 V (vs. SCE). Furthermore, the potential cycling experiments
of accelerated durability test (ADT) were used to characterize the electrochemical
stability and performance of the Pt-Au nanorods and Pt/C catalyst.21,S2 The ADT was
conducted by continuously potential cycling between 0.6 and 1.2 V with periodic
measurements of electrochemical surface area (ECSA) and ORR activity after every
400 scans. Moreover, each ECSA value is normalized to the original active surface
area (calculate from the Hads/des region in 1st scan) in order to compare the degradation
rate of ECSA. The ECSA was performed by the integration of the charges associated
with hydrogen adsorption/desorption region and by the use of assumed value for
desorption of monolayer Hads on Pt of near 210 μCcm-2.S3
CO stripping measurement: CO was pre-adsorbed onto the electrode surface at
0.1 V (vs. NHE) by purging the high purity CO gas through 0.5 M H2SO4 for 30 mins.
Electronic Supplementary Material (ESI) for Journal of Materials ChemistryThis journal is © The Royal Society of Chemistry 2012

5
Finally, N2-saturated 0.5 M H2SO4 was used for the CO stripping study. Two CVs
were collected between -0.35 and 1.2 V (vs. SCE) at a scan rate of 50 mVs-1. The first
potential sweep was conducted to electro-oxidize the adsorbed CO species.
Formic acid oxidation measurement: N2-saturated 0.5 M H2SO4 and 2 M
HCOOH were used for the FAO. CV scans were conducted to study the activity of the
FAO with a scan rate of 20 mVs-1. The CV profiles were recorded in the 31th cycle.
Electronic Supplementary Material (ESI) for Journal of Materials ChemistryThis journal is © The Royal Society of Chemistry 2012
6
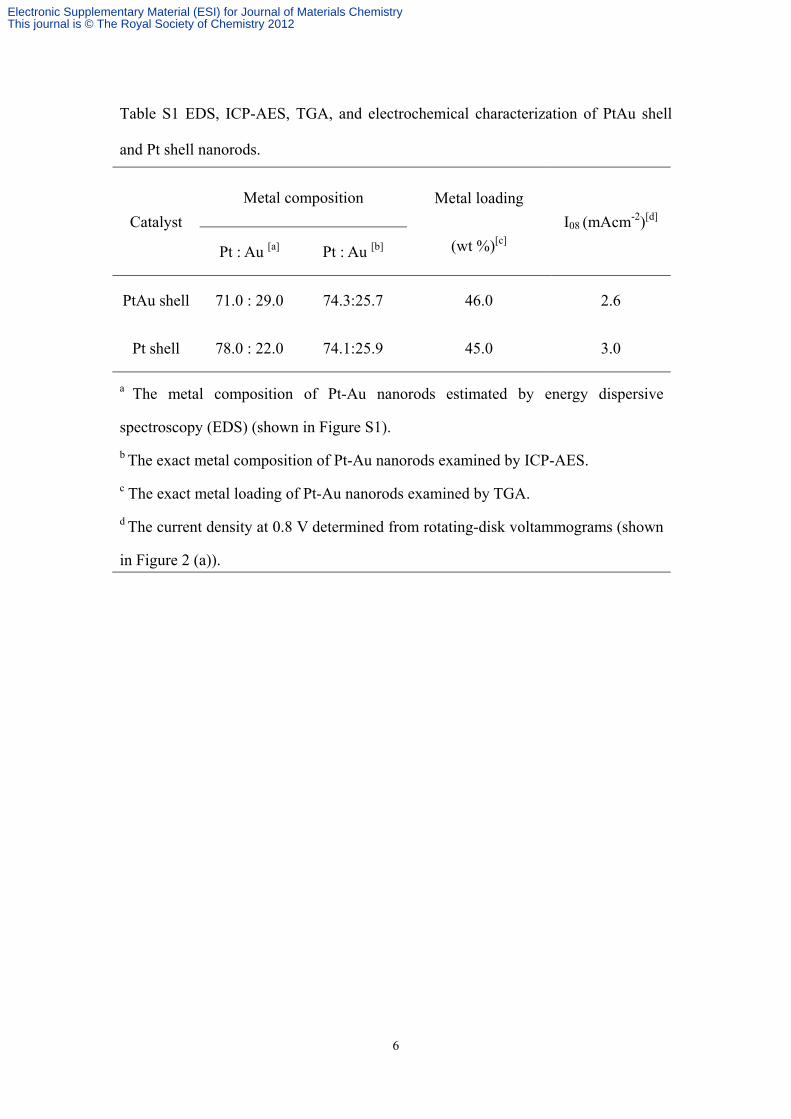
Table S1 EDS, ICP-AES, TGA, and electrochemical characterization of PtAu shell
and Pt shell nanorods.
Catalyst
Metal composition Metal loading
(wt %)[c]
I08 (mAcm-2)[d]
Pt : Au [a] Pt : Au [b]
PtAu shell 71.0 : 29.0 74.3:25.7 46.0 2.6
Pt shell 78.0 : 22.0 74.1:25.9 45.0 3.0
a The metal composition of Pt-Au nanorods estimated by energy dispersive
spectroscopy (EDS) (shown in Figure S1).
b The exact metal composition of Pt-Au nanorods examined by ICP-AES.
c The exact metal loading of Pt-Au nanorods examined by TGA.
d The current density at 0.8 V determined from rotating-disk voltammograms (shown
in Figure 2 (a)).
Electronic Supplementary Material (ESI) for Journal of Materials ChemistryThis journal is © The Royal Society of Chemistry 2012

7
Table S2 Results of ECSA and ORR activities for various catalysts.
Samples ECSAa
(m2/g)
ORR activity (at E = 0.80 V)
Ikb
(mAcm-2)
MAc
(AgPt-1)
Pt/C 69 2.5 11.4
PtAu shell 29 5.0 29.7
Pt shell 35 7.0 41.3
a Electrochemical surface area (ECSA): the ECSA is estimated by integrating the charges
associated with electro-oxidation of Hads species.
b Kinetic current density (Ik): the kinetic current at E = 0.80 V.
c Mass activity (MA): the mass activity is obtained by the normalization of kinetic current
to the weight of Pt.
Electronic Supplementary Material (ESI) for Journal of Materials ChemistryThis journal is © The Royal Society of Chemistry 2012

8
Figure S1 UHR-SEM images of Pt shell (a) and PtAu shell (b) nanorods. The
chemical composition of Pt-Au nanorods examined by energy dispersive spectroscopy
(EDS).
Pt shell PtAu shell
Electronic Supplementary Material (ESI) for Journal of Materials ChemistryThis journal is © The Royal Society of Chemistry 2012
9
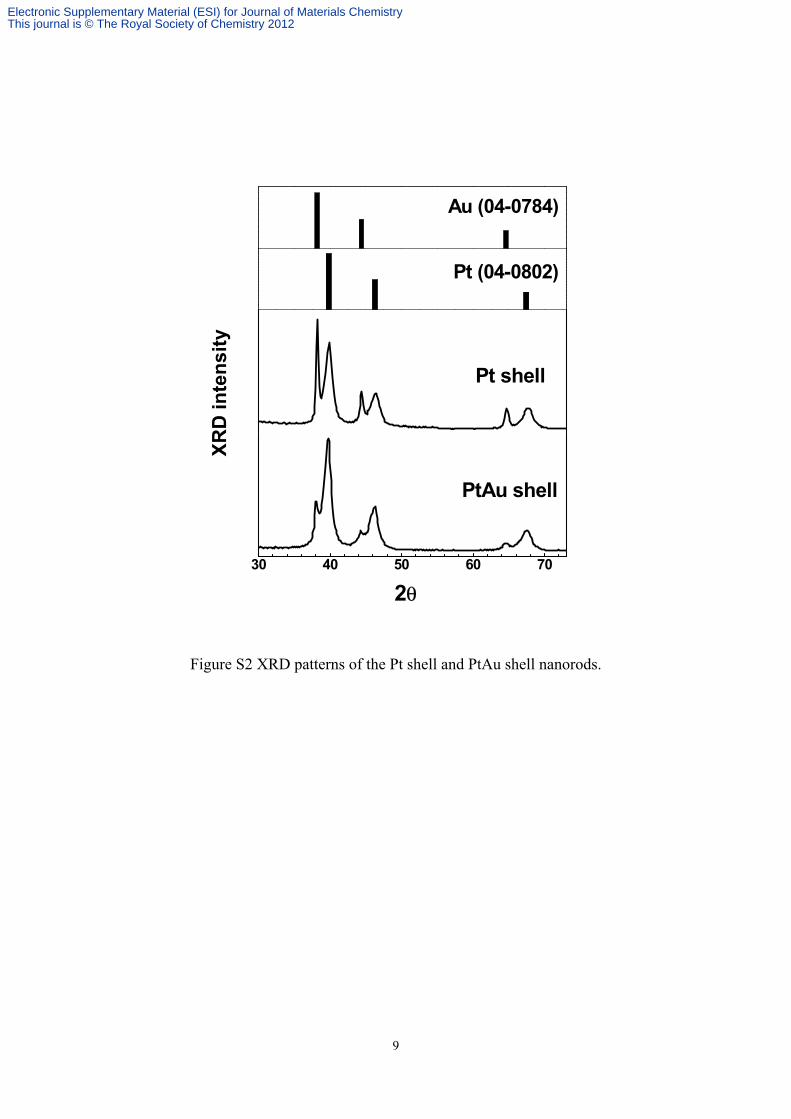
Figure S2 XRD patterns of the Pt shell and PtAu shell nanorods.
30 40 50 60 70
XRD
inte
nsity
PtAu shell
Pt shell
Pt (04-0802)
2θ
Au (04-0784)
Electronic Supplementary Material (ESI) for Journal of Materials ChemistryThis journal is © The Royal Society of Chemistry 2012
10
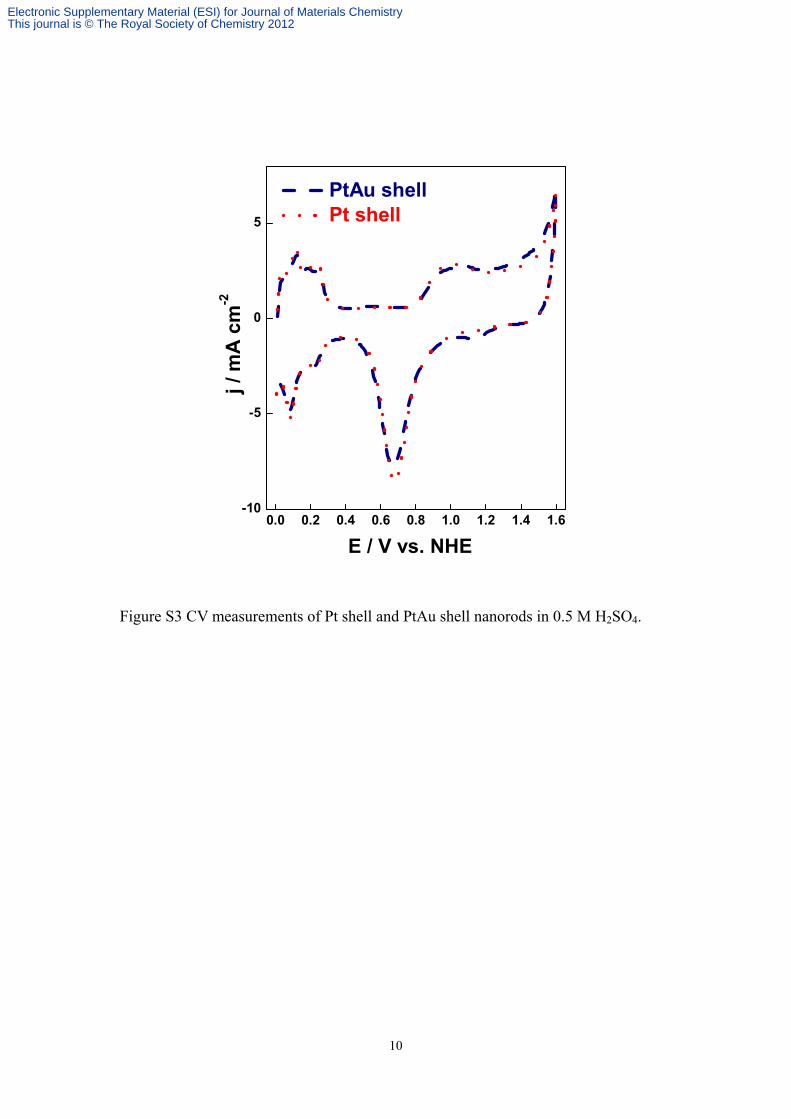
Figure S3 CV measurements of Pt shell and PtAu shell nanorods in 0.5 M H2SO4.
0.0 0.2 0.4 0.6 0.8 1.0 1.2 1.4 1.6-10
-5
0
5
PtAu shell Pt shell
E / V vs. NHE
j / m
A c
m-2
Electronic Supplementary Material (ESI) for Journal of Materials ChemistryThis journal is © The Royal Society of Chemistry 2012

11
Figure S4 The line-scan results of Pt shell and PtAu shell nanorods.
Pt
Au
Pt
Au
Electronic Supplementary Material (ESI) for Journal of Materials ChemistryThis journal is © The Royal Society of Chemistry 2012
12
0.3 0.4 0.5 0.6 0.7 0.8 0.9 1.0-6.0
-5.5
-5.0
-4.5
-4.0
-3.5
-3.0
-2.5
-2.0
-1.5
-1.0
-0.5
0.0
Pt/C PtAu shell PtAu shell-L Pt shell Pt shell-L
E / V vs. NHE
j /
mA
cm
-2
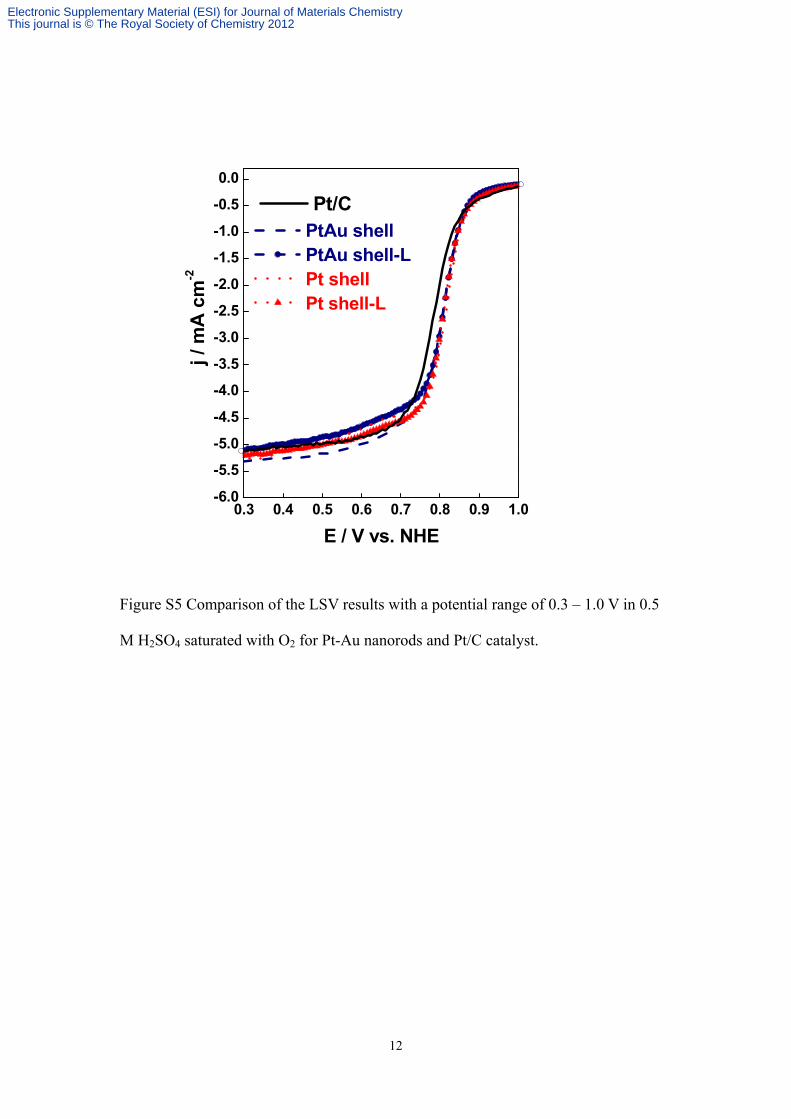
Figure S5 Comparison of the LSV results with a potential range of 0.3 – 1.0 V in 0.5
M H2SO4 saturated with O2 for Pt-Au nanorods and Pt/C catalyst.
Electronic Supplementary Material (ESI) for Journal of Materials ChemistryThis journal is © The Royal Society of Chemistry 2012

13
References
S1 (a) V. M. Dhavale, S. M. Unni, H. N. Kagalwala, V. K. Pillai and S. Kurungot,
Chem. Commun., 2011, 47, 3951; (b) S. L. Gojkovic, S. K. Zecevic and R. F.
Savinell, J. Electrochem. Soc., 1998, 145, 3713.
S2 H. R. Colon-Mercado and B. N. Popov, J. Power Source, 2006, 155, 253.
S3 (a) A. Pozio, M. De Francesco, A. Cemmi, F. Cardellini and L. Giorgi, Journal of Power Sources, 2002, 105, 13; (b) E. A. Ticianelli, J. G. Beery and S.
Srinivasan, J. Appl. Electrochem., 1991, 21, 597; (c) E. Antolini, L. Giorgi, A.
Pozio and E. Passalacqua, J. Power Source, 1999, 77, 136.
Electronic Supplementary Material (ESI) for Journal of Materials ChemistryThis journal is © The Royal Society of Chemistry 2012


![A Nonaqueous Approach to the Preparation of Iron Phosphide ...€¦ · preparation of MnP and FeP using metal carbonyls as metal source. Liu et al. [8] synthesized FeP nanorods by](https://img.pdfslide.net/doc/110x75/60d78e4e1379346cfc1eb676/a-nonaqueous-approach-to-the-preparation-of-iron-phosphide-preparation-of-mnp.jpg)