Embed Size (px)
Citation preview
Page | 1 | PHILLIP SEKURITAS INDONESIA
PT Ciputra Development Tbk (CTRA IJ) Diversification Still King
INDONESIA | PROPERTY | INITIATION
Company Background
PT Ciputra Development Tbk (CTRA) primarily engages in property development and management. It classifies its business into two main segments: residential property and commercial property. Its properties are located nationwide, such as Greater Jakarta and Greater Surabaya. Investment Merits
Improved but “neutral” outlook for marketing sales in 2017 CTRA is confident that its marketing sales target of IDR 8,505 bn (18% YoY) is feasible to achieve, given that marketing sales reached around IDR 1,218 bn in 3M17 which translates an increase of 7.8% (QoQ). However, we expect marketing sales in FY17 to grow no more than by 13% to IDR 8,121 bn as CTRA’s core projects, such as Citra Garden City Jakarta, Citra Raya Tangerang and Citra Indah Jonggol will become the main driver of the company’s upcoming marketing sales.
Develops lower-cost homes to avoid housing backlog CTRA plans to grow its portfolio of lower-priced house and this strategy is supported by weaker property affordability. However, there is still growth in Indonesia's lower middle-income population, which comprises of first-home buyers who seek houses priced under IDR 1 bn. There is also fewer competition in this market segment and less speculative buyers, who can cause volatility in demand.
Diversified portfolio to come in handy in the midst of sluggish appetite CTRA currently has a presence in over 33 cities with more than 70 projects in its portfolio to tap demand in different regions. In addition, its ample range of products can accommodate numerous customer segments. With a track record of over 30 years, CTRA is the preferred JO partner for land owners to develop new projects. Therefore, it has an advantage over other developers in securing a continuous stream of projects. CTRA targets to have between 6-10 new projects every year.
Key Risks
Net gearing increases as installments lengthen The weak presales forced CTRA to allow property buyers to extend their installment plans to a maximum of five years from three years previously. As such, CTRA has had to rely on additional debt to fund construction of its projects. We expect net gearing to grow by 9% to 27% at end-2017 and peak at 33% in 2019. CTRA is likely to deleverage after 2019 as we expect property market conditions to improve.
Regulation flip-flopping emits negative sentiment We believe the proposed tax regulation tweaks (capital gain tax on property and progressive tax on land ownership), as one of the key downside risks to the sector. Despite the proposed taxations have been delayed, too frequent government intervention in the property sector could give negative implications as uncertainty will certainly generate confusion for both developers and buyers. If the regulations to be implemented, we deem property stocks will be adversely afflicted just like in 2015 when there were changes in the luxury and super luxury property tax.
Initiate with BUY
We believe CTRA is currently trading at discount valuation, thus we initiate our coverage on CTRA with BUY rating and price target of IDR 1,480 ps using NAV valuation method which implies 1.34x PBV ratios FY17E, P/E ratio FY17E of 18.1 and ROE FY17E of 7.4%. The valuation method is based under assumption of risk free rate of 7.125% and terminal growth rate of 4.5%.
8 May 2017
BUY
MARKET PRICE IDR 1,200
TARGET PRICE IDR 1,480 (+23.3%) COMPANY DATA
O/S SHARES (BN) : 18.56
MARKET CAP (IDR TN) : 23.85
MARKET CAP (USDBN) : 2.66
52 - WK HI/LO (IDR) : 1,745/1,080
3M AVG. VOLUME (MN SHARES): 21.25
PAR VALUE (IDR) : 100
MAJOR SHAREHOLDERS, %
PT SANG PELOPOR: 25.45%
CREDIT SUISSE AG: 6.40%
FINE CAPITAL PARTNERS : 4.51%
NORGES BANK : 2.68%
VANGUARD GROUP : 2.17%
PRICE VS. JCI
Source: PSI Research, Bloomberg
KEY FINANCIALS
Source: PSI Research
Analyst
Yehuda Anthony Harahap (+62 57900800)
IDR bn FY17E FY18F FY19F FY20F
Revenue 7,242 7,561 8,732 10,304
EBIT 2,280 2,404 2,819 3,248
Net Profit 1,098 1,089 1,329 1,531
EPS, IDR 72 71 87 100
PER, x 18.1 18.3 14.9 13.0
P/BV, x 1.34 1.26 1.18 1.09
ROE, % 7.4 6.9 7.9 8.4
Net Gearing, % 26 26 27 23
8090
100110120130140
Mar-16 Jun-16 Sep-16 Dec-16
JCI Rebased CTRA IJ
Page | 2 | PHILLIP SEKURITAS INDONESIA
CIPUTRA DEVELOPMENT
INITIATION
Investment Thesis
We have positive view on CTRA’s high exposure in residential development and capex-light joint operation strategy. CTRA has been able to generate strong progress without requiring rigorous capital expenditures since 2011. The strategy is not easily replicated by peers due to CTRA’s founder’s reputation in the Indonesia property sector and the company’s brand positioning in the country. CTRA’s projects are spread over more than 30 cities in Indonesia, and it should benefit most when the domestic economy improves and infrastructure projects are accelerated. Hence, we initiate our coverage on Ciputra Development (CTRA) with BUY rating and price target of IDR 1,480 ps using NAV (see RNAV summary) valuation method which implies 50% discount to RNAV. Our RNAV calculation uses DCF method to value investment properties, which applies terminal growth of 4.5%, risk free rate of 7.125% (Indonesia 10-year Government Bond) and WACC of 17.0%.
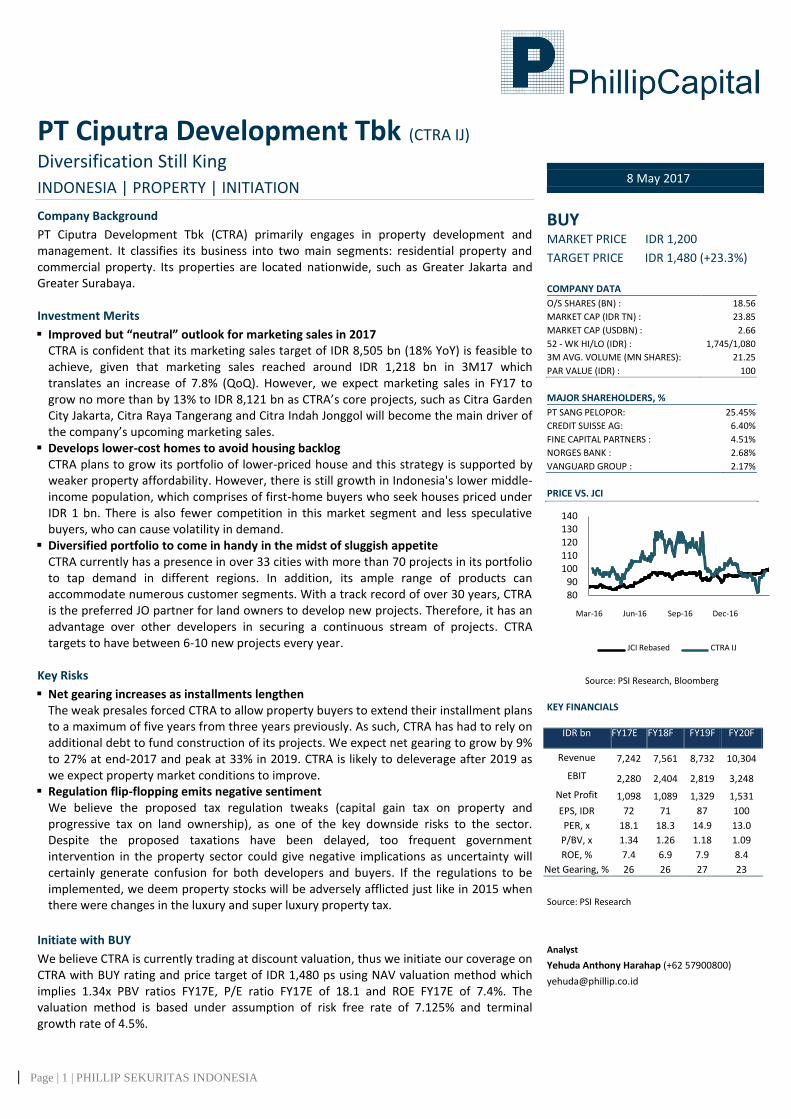
Why are we optimistic marketing sales will recover in 2017? CTRA sets its marketing sales target to IDR 8,505 bn (18% YoY), given that marketing sales reached around IDR 1,218 bn in 1Q17 which translates an increase of 7.8% (QoQ). Such achievement was obtained from the sale of Monteverde Citraland in Cibubur. This residence was heavily overbooked by 500 units although only 322 units are available. On the other hand, we forecast marketing sales in FY17 will grow by 13% to IDR 8,121 bn as CTRA’s major projects, such as Citra Plaza in Jakarta and Batam, The Newton at Ciputra World 2 and Citra Land in Cibubur, will become the core driver. In addition, there are positive catalysts supporting property industry in 2017, namely housing loans with lower interest rate and relaxation on loan to value (LTV) ratio. However, we believe those factors are not quite sufficient to push marketing sales growth above 15% mark as property buyers’ liquidity are low post tax-amnesty program. Indeed, lower mortgage rates and policy relaxation will help to stimulate demand except it will take time for the impact to be noticeable.
Source: Company, PSI Research
We notice that recently CTRA’s consumers were given longer period of installments than previous years. Such prolonged payment method was mirrored in the decline of sales in 2016 which was triggered by longer installment maturity between 2014 and 2015. CTRA’s collaboration with CIMB Niaga Bank (BNGA IJ) will provide promotional mortgage rate at 5.5% (fixed for 3-year tenor) for 41 CTRA’s projects across Indonesia. This partnership offers one of the lowest mortgage rates in the market if compared to Bank of Central Asia’s (BBCA IJ) mortgage rate at 6.5% and partnership between Permata Bank (BNLI IJ) with Summarecon Agung (SMRA IJ) at 5.99%. From consumers’ point of view, low mortgage rate has every potential to be a positive stimulus for them to buy property. Consequently, we expect that the partnership will boost CTRA’s marketing sales in 2017 as during 2016 (BI rate started to decline), around 49% CTRA’S consumers buyers opted mortgage which soared considerably compared to 29% in 2015.
8120.67
9127.53
10304.31
0
2000
4000
6000
8000
10000
2015A 2016A 2017F 2018F 2019F
Marketing Sales Houses Shophouses Apartments Lots Office
IDR bn
Page | 3 | PHILLIP SEKURITAS INDONESIA
CIPUTRA DEVELOPMENT
INITIATION
Lower-cost houses: narrower margins but more quantities to sell CTRA sets landed residential and retail space as its focal point of development and our long-term view for residential segment is “positive”. We are convinced both landed houses and high-rise residential could benefit from rising urbanization rate and increasing number of lower-middle and middle class who can afford property for primary residences and investment purposes. Additionally, the government has scraped plan to tax unoccupied apartments and delayed the proposal of capital gain tax on property purchases which will induce positive sentiment for residential property demand.
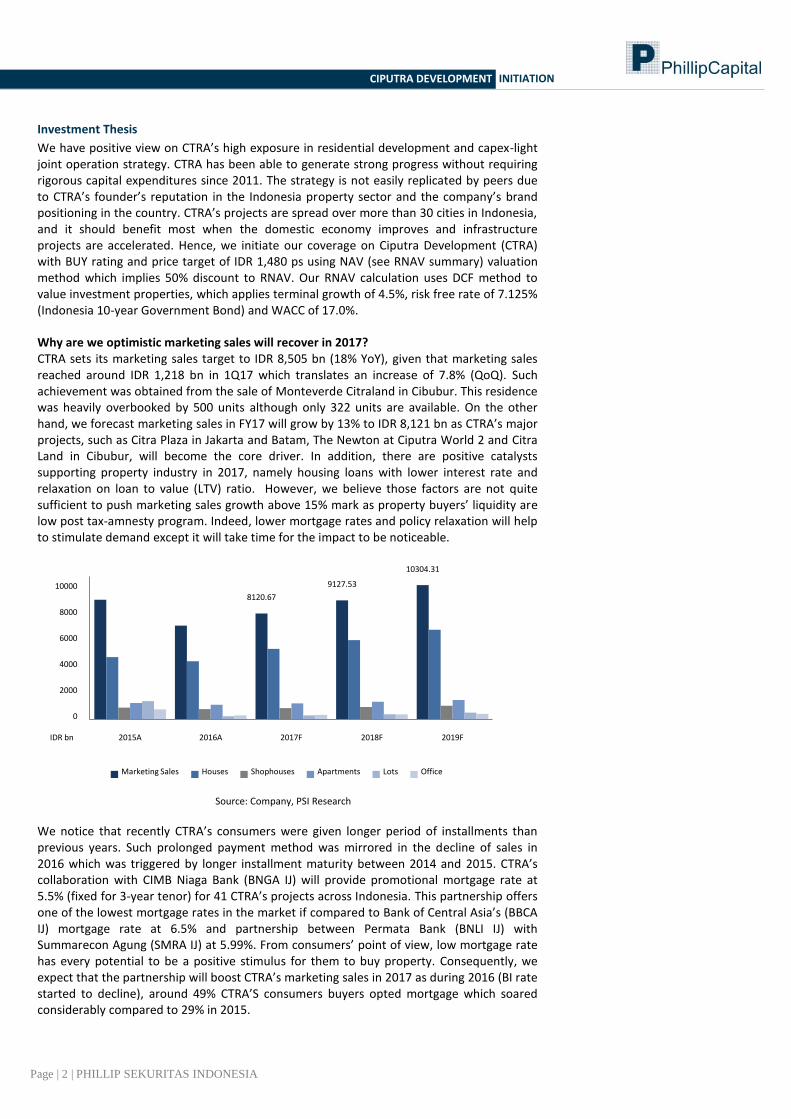
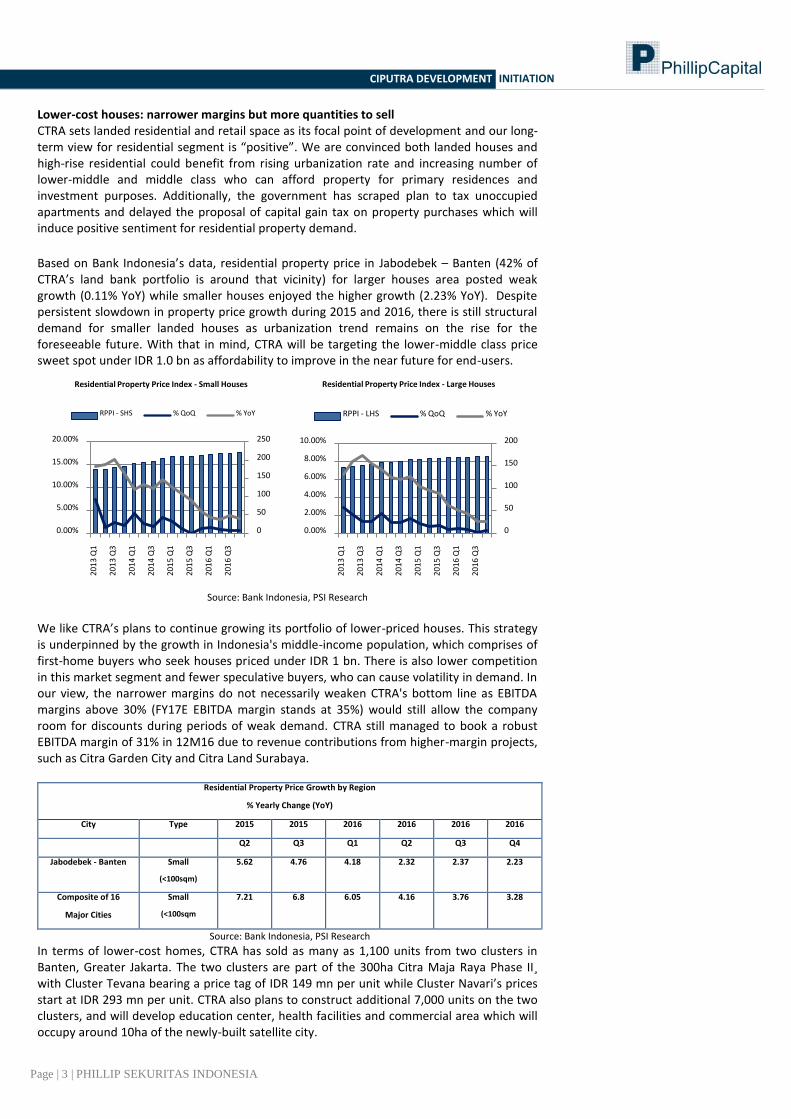
Based on Bank Indonesia’s data, residential property price in Jabodebek – Banten (42% of CTRA’s land bank portfolio is around that vicinity) for larger houses area posted weak growth (0.11% YoY) while smaller houses enjoyed the higher growth (2.23% YoY). Despite persistent slowdown in property price growth during 2015 and 2016, there is still structural demand for smaller landed houses as urbanization trend remains on the rise for the foreseeable future. With that in mind, CTRA will be targeting the lower-middle class price sweet spot under IDR 1.0 bn as affordability to improve in the near future for end-users.
Source: Bank Indonesia, PSI Research
We like CTRA’s plans to continue growing its portfolio of lower-priced houses. This strategy is underpinned by the growth in Indonesia's middle-income population, which comprises of first-home buyers who seek houses priced under IDR 1 bn. There is also lower competition in this market segment and fewer speculative buyers, who can cause volatility in demand. In our view, the narrower margins do not necessarily weaken CTRA's bottom line as EBITDA margins above 30% (FY17E EBITDA margin stands at 35%) would still allow the company room for discounts during periods of weak demand. CTRA still managed to book a robust EBITDA margin of 31% in 12M16 due to revenue contributions from higher-margin projects, such as Citra Garden City and Citra Land Surabaya.
Residential Property Price Growth by Region
% Yearly Change (YoY)
City Type 2015 2015 2016 2016 2016 2016
Q2 Q3 Q1 Q2 Q3 Q4
Jabodebek - Banten Small
(<100sqm)
5.62 4.76 4.18 2.32 2.37 2.23
Composite of 16
Major Cities
Small
(<100sqm
7.21 6.8 6.05 4.16 3.76 3.28
Source: Bank Indonesia, PSI Research
In terms of lower-cost homes, CTRA has sold as many as 1,100 units from two clusters in Banten, Greater Jakarta. The two clusters are part of the 300ha Citra Maja Raya Phase II¸ with Cluster Tevana bearing a price tag of IDR 149 mn per unit while Cluster Navari’s prices start at IDR 293 mn per unit. CTRA also plans to construct additional 7,000 units on the two clusters, and will develop education center, health facilities and commercial area which will occupy around 10ha of the newly-built satellite city.
0
50
100
150
200
250
0.00%
5.00%
10.00%
15.00%
20.00%
20
13
Q1
20
13
Q3
20
14
Q1
20
14
Q3
20
15
Q1
20
15
Q3
20
16
Q1
20
16
Q3
Residential Property Price Index - Small Houses
RPPI - SHS % QoQ % YoY
0
50
100
150
200
0.00%
2.00%
4.00%
6.00%
8.00%
10.00%
20
13
Q1
20
13
Q3
20
14
Q1
20
14
Q3
20
15
Q1
20
15
Q3
20
16
Q1
20
16
Q3
Residential Property Price Index - Large Houses
RPPI - LHS % QoQ % YoY

Page | 4 | PHILLIP SEKURITAS INDONESIA
CIPUTRA DEVELOPMENT
INITIATION
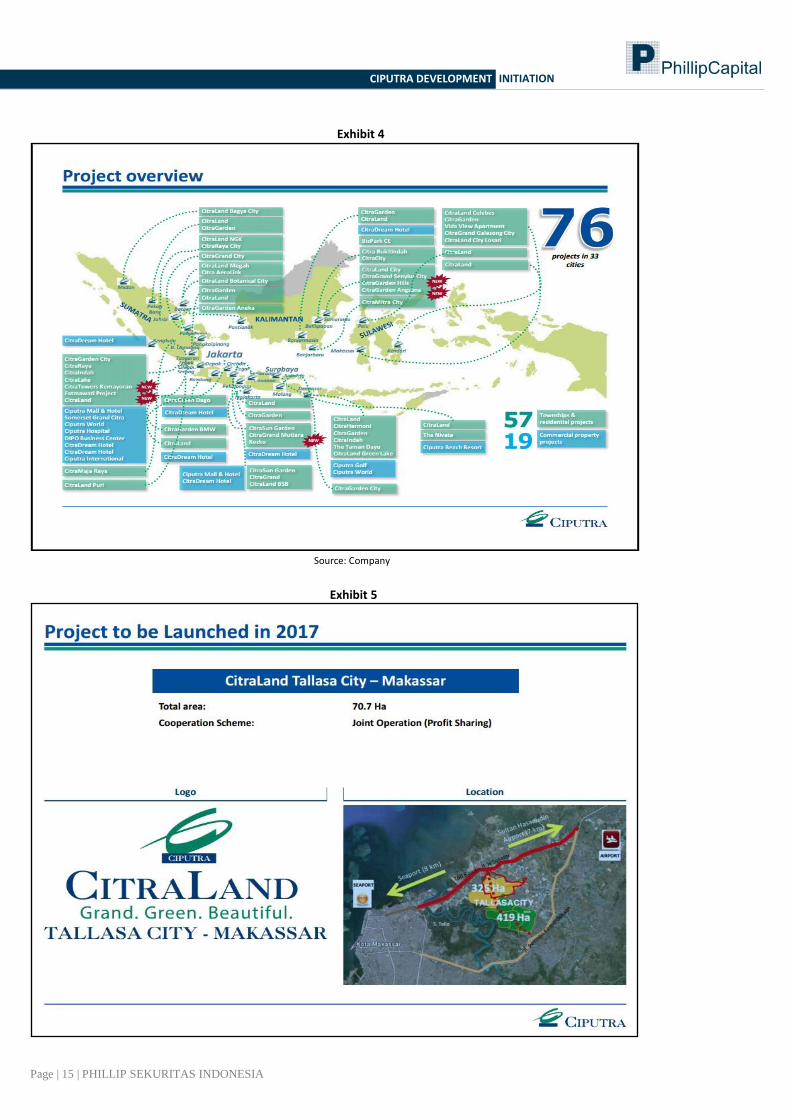
Diversified portfolio to come in handy in the midst of sluggish property appetite With a proven track record of over 30 years, CTRA is the preferred JO partner for land owners in new projects. This is due to CTRA’s strong reputation in 33 cities and more than 75 projects in its portfolio. CTRA has also been able to generate strong development pipeline growth without actually allocating significant amount of capex (FY17E 20.7% of total revenue). In addition, its ample range of products can accommodate numerous customer segments. Therefore, it has an advantage over other developers in securing a continuous stream of projects which should sustain stable financial performance during dire time.
Source: Company, PSI Research CTRA is most leveraged to potential structural changes, especially related to mortgage conditions, in Indonesia. Hence, it should benefit most when the domestic economy improves and infrastructure projects are accelerated. The conclusion of the tax amnesty program should spur investment sentiment as fears of tax scrutiny fade away and as onshore liquidity improves from stable economic growth. At present, CTRA has 6 new projects to launch in 2017 in addition to several existing projects launched in late 2016. 2 of the projects are directly owned by the company (The Newton 2 and The Suites Apartment) while the rest being joint venture (Ciputra Beach Resort – Bali and Citra Plaza Batam) or joint operation – profit sharing (Citra Land Makassar). These projects are well-diversified in terms of location as only 2 are located in CBD Jakarta whereas the rest are located outside Java. Based on our meeting with the company, we believe diversification across Indonesia is crucial as it will help the company to maintain stable pre-sales performance particularly in Surabaya and Medan. According to Bank of Indonesia, residential property price in both Surabaya and Medan registered higher growth than regional average in Indonesia. In Q416, Surabaya posted 6.61% (YoY) increase while Medan booked 3.35% (YoY) growth. Both regions fared higher compared to composite index consisting of 16 major cities (2.38% YoY), which signifies that property demand are still strong in these regions. With that in mind, CTRA’s existing major projects located in Surabaya and Medan such as Citraland Surabaya and Citraland Bagya City Medan will be the one to watch to boost for pre-sales performance in 2017.
Residential Property Price Growth by Region
% Yearly Change (YoY)
City Type Q315 Q415 Q116 Q216 Q316 Q416
Surabaya Total 7.86 4.92 5.41 5.45 5.76 6.61
Medan Total 2.78 5.66 7.23 7.44 6.85 3.53
Composite of 16
Cities
Total 5.46 4.62 4.15 3.39 2.75 2.38
Source: Bank Indonesia, PSI Research
Jakarta
59 ha
3%
Tangerang
657 ha
37%
Jonggol
241 ha
13%
Surabaya
781 ha
43%
Others
71 ha
4%
CTRA's Land Bank Portfolio
Greater
Jakarta, 30
%
Sulawesi
17%
Greater
Surabaya
2%
Kalimantan
2%
Other
Inner Java
18%
Bali
2%
Sumatra
9%
CTRA's Projects
Page | 5 | PHILLIP SEKURITAS INDONESIA
CIPUTRA DEVELOPMENT
INITIATION
Key Risk
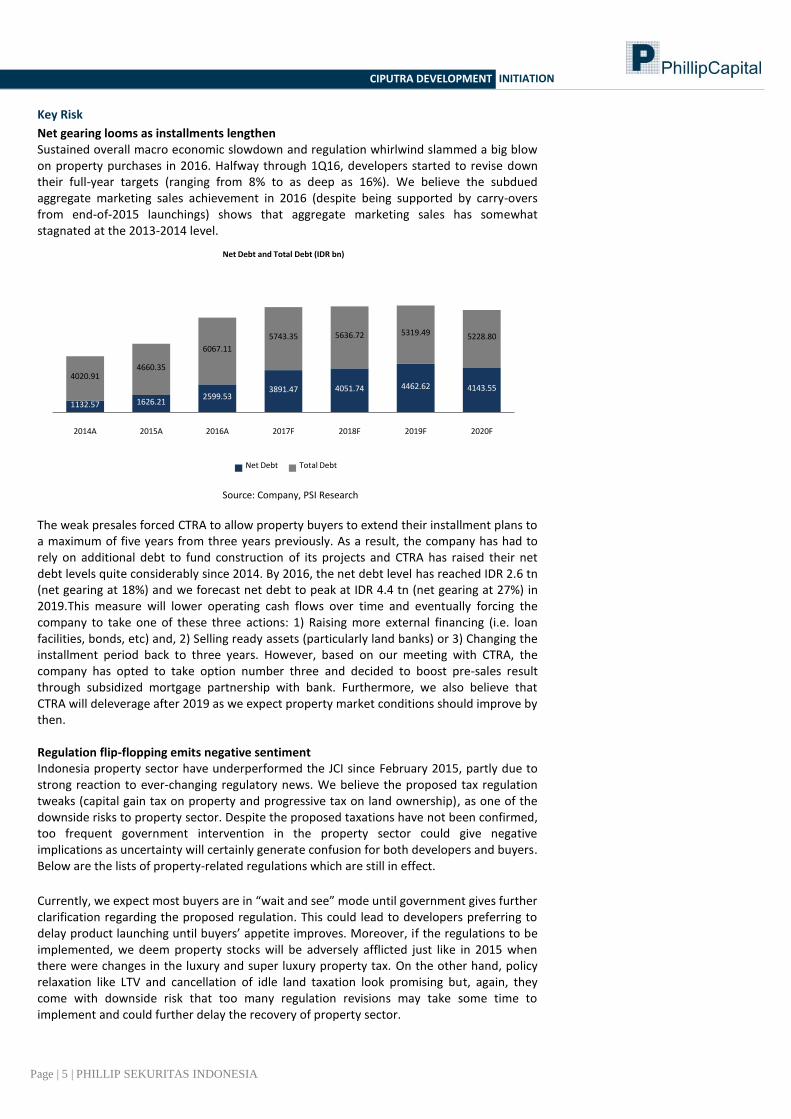
Net gearing looms as installments lengthen Sustained overall macro economic slowdown and regulation whirlwind slammed a big blow on property purchases in 2016. Halfway through 1Q16, developers started to revise down their full-year targets (ranging from 8% to as deep as 16%). We believe the subdued aggregate marketing sales achievement in 2016 (despite being supported by carry-overs from end-of-2015 launchings) shows that aggregate marketing sales has somewhat stagnated at the 2013-2014 level.
Source: Company, PSI Research
The weak presales forced CTRA to allow property buyers to extend their installment plans to a maximum of five years from three years previously. As a result, the company has had to rely on additional debt to fund construction of its projects and CTRA has raised their net debt levels quite considerably since 2014. By 2016, the net debt level has reached IDR 2.6 tn (net gearing at 18%) and we forecast net debt to peak at IDR 4.4 tn (net gearing at 27%) in 2019.This measure will lower operating cash flows over time and eventually forcing the company to take one of these three actions: 1) Raising more external financing (i.e. loan facilities, bonds, etc) and, 2) Selling ready assets (particularly land banks) or 3) Changing the installment period back to three years. However, based on our meeting with CTRA, the company has opted to take option number three and decided to boost pre-sales result through subsidized mortgage partnership with bank. Furthermore, we also believe that CTRA will deleverage after 2019 as we expect property market conditions should improve by then. Regulation flip-flopping emits negative sentiment Indonesia property sector have underperformed the JCI since February 2015, partly due to strong reaction to ever-changing regulatory news. We believe the proposed tax regulation tweaks (capital gain tax on property and progressive tax on land ownership), as one of the downside risks to property sector. Despite the proposed taxations have not been confirmed, too frequent government intervention in the property sector could give negative implications as uncertainty will certainly generate confusion for both developers and buyers. Below are the lists of property-related regulations which are still in effect.
Currently, we expect most buyers are in “wait and see” mode until government gives further clarification regarding the proposed regulation. This could lead to developers preferring to delay product launching until buyers’ appetite improves. Moreover, if the regulations to be implemented, we deem property stocks will be adversely afflicted just like in 2015 when there were changes in the luxury and super luxury property tax. On the other hand, policy relaxation like LTV and cancellation of idle land taxation look promising but, again, they come with downside risk that too many regulation revisions may take some time to implement and could further delay the recovery of property sector.
1132.57 1626.212599.53
3891.47 4051.74 4462.62 4143.55
4020.914660.35
6067.11
5743.35 5636.72 5319.49 5228.80
2014A 2015A 2016A 2017F 2018F 2019F 2020F
Net Debt and Total Debt (IDR bn)
Net Debt Total Debt

Page | 6 | PHILLIP SEKURITAS INDONESIA
CIPUTRA DEVELOPMENT
INITIATION
Current property tax regulations in effect Applicable to
Type of Tax Primary Secondary Method of Calculation
Title deed holder name change Yes Yes 5% x NPOPKP (2.5% for subsidized residential)
Service tax Yes No 10% x gross rent
Property final tax Yes Yes Gross property value; Public housing development = 0-1%
x gross property value
Super luxury property tax Yes No 5% x residential property valued above IDR 5 bn per unit
or larger than 400 sqm or apartments larger than 150 sqm
per unit
Luxury property tax Yes No 20% x residential property valued at or over IDR 20 bn per
unit or apartments valued at or over IDR 10 bn per unit
Annual property tax Yes Yes (0.01% - 0.3%) x NJOP (set by provincial government
every 3 years
Asset transfer tax No Yes 5% x transaction value
Source: Bank Indonesia, Ministry of Finance
Category 1st Credit Facility 2nd Credit Facility 3rd Credit Facility
Type Previous Current Previous Current Previous Current
Landed Houses
Type > 70 m2
80% 85% 70% 80% 60% 75%
Landed Houses
Type 22-70 m2
- - 80% 85% 70% 80%
Apartments
Type > 70 m2
80% 85% 70% 80% - -
Apartments
Type 22-70 m2
90% 90% 80% 85% 70% 80%
Apartments
Type 22 m2
- - 80% 85% 70% 80%
Shop Houses - - 80% 85% 70% 80%
Source: Bank Indonesia, Ministry of Finance
Latest revision on LTV caps – August 2016
Financial Highlights
Healthy balance sheet with strong cash generation CTRA had been in net cash position from 2011 to 2015 (except in 2014 due to land acquisition) and its strong cash generation has outpaced annual capex requirements. Moreover, capex in proportion to revenue had been below 10% on average as CTRA has numerous joint operation projects with light capex requirement. But, the accelerated progress of its superblock developments (Ciputra World 2) required more exhaustive capex, and as a result, net gearing went up to 10% at end 2014. We also expect net gearing to continue going up until late 2018 as weak pre-sales result forced CTRA to fund project externally. However, with solid cash generation from pre-sales in developing region (Surabaya, Medan and Semarang) and more high-rise development will help to reduce CTRA’s net gearing to below 10% after 2019.
Page | 7 | PHILLIP SEKURITAS INDONESIA
CIPUTRA DEVELOPMENT
INITIATION
Source: Company, PSI Research
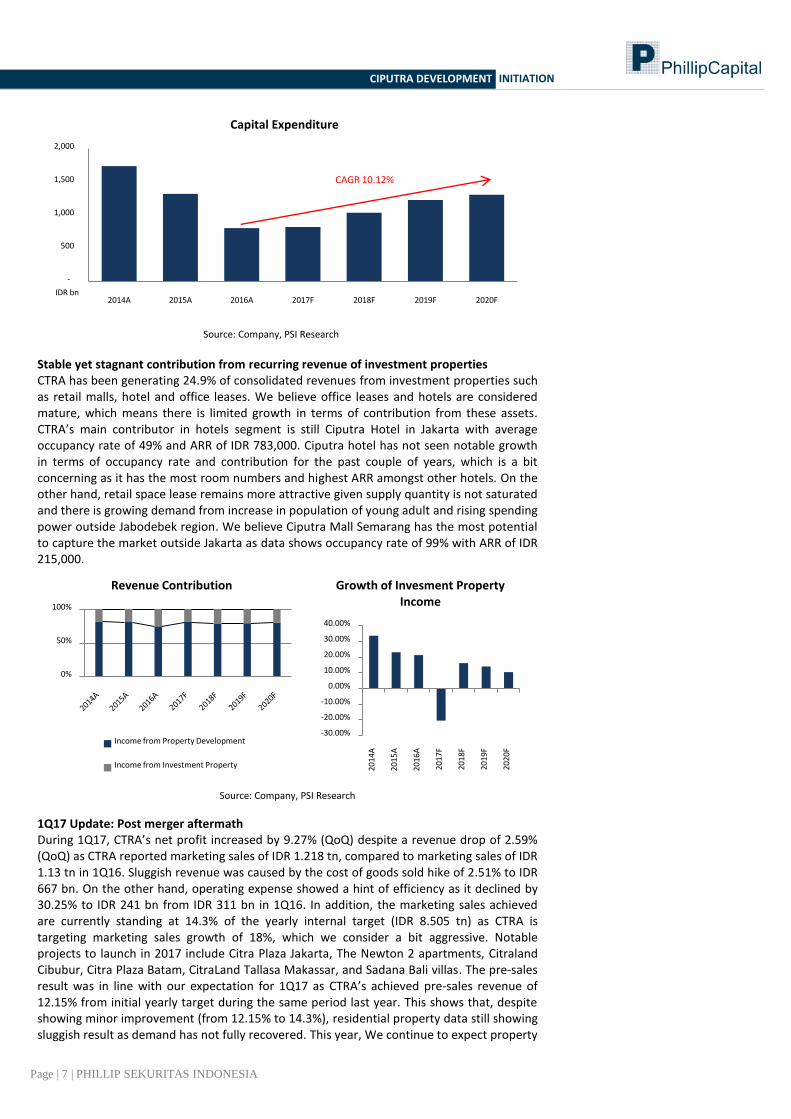
Stable yet stagnant contribution from recurring revenue of investment properties CTRA has been generating 24.9% of consolidated revenues from investment properties such as retail malls, hotel and office leases. We believe office leases and hotels are considered mature, which means there is limited growth in terms of contribution from these assets. CTRA’s main contributor in hotels segment is still Ciputra Hotel in Jakarta with average occupancy rate of 49% and ARR of IDR 783,000. Ciputra hotel has not seen notable growth in terms of occupancy rate and contribution for the past couple of years, which is a bit concerning as it has the most room numbers and highest ARR amongst other hotels. On the other hand, retail space lease remains more attractive given supply quantity is not saturated and there is growing demand from increase in population of young adult and rising spending power outside Jabodebek region. We believe Ciputra Mall Semarang has the most potential to capture the market outside Jakarta as data shows occupancy rate of 99% with ARR of IDR 215,000.
Source: Company, PSI Research
1Q17 Update: Post merger aftermath During 1Q17, CTRA’s net profit increased by 9.27% (QoQ) despite a revenue drop of 2.59% (QoQ) as CTRA reported marketing sales of IDR 1.218 tn, compared to marketing sales of IDR 1.13 tn in 1Q16. Sluggish revenue was caused by the cost of goods sold hike of 2.51% to IDR 667 bn. On the other hand, operating expense showed a hint of efficiency as it declined by 30.25% to IDR 241 bn from IDR 311 bn in 1Q16. In addition, the marketing sales achieved are currently standing at 14.3% of the yearly internal target (IDR 8.505 tn) as CTRA is targeting marketing sales growth of 18%, which we consider a bit aggressive. Notable projects to launch in 2017 include Citra Plaza Jakarta, The Newton 2 apartments, Citraland Cibubur, Citra Plaza Batam, CitraLand Tallasa Makassar, and Sadana Bali villas. The pre-sales result was in line with our expectation for 1Q17 as CTRA’s achieved pre-sales revenue of 12.15% from initial yearly target during the same period last year. This shows that, despite showing minor improvement (from 12.15% to 14.3%), residential property data still showing sluggish result as demand has not fully recovered. This year, We continue to expect property
-
500
1,000
1,500
2,000
2014A 2015A 2016A 2017F 2018F 2019F 2020F
Capital Expenditure
CAGR 10.12%
IDR bn
0%
50%
100%
Revenue Contribution
Income from Property Development
Income from Investment Property
-30.00%
-20.00%
-10.00%
0.00%
10.00%
20.00%
30.00%
40.00%
20
14
A
20
15
A
20
16
A
201
7F
201
8F
201
9F
202
0F
Growth of Invesment Property Income

Page | 8 | PHILLIP SEKURITAS INDONESIA
CIPUTRA DEVELOPMENT
INITIATION
demand to not fully bounce back at least until 3Q17. This is due to the fact that buyers’ liquidity and appetite are still in ‘hangover’ period post tax-amnesty program. Moreover, less than half of CTRA’s customer opted for mortgage as a primary payment method. This means only a handful of customers will be affected by lower mortgage rates as the rest preferred in-house installments and lump-sum cash. On the bright side, CTRA’s projects outside Greater Jakarta, such as Citraland Surabaya (109.2% realization from target), Citraland BSB City Semarang (94.7%) and Nivata Bali (163.9%) have performed better than expected which also supported our estimation on region outside Greater Jakarta being better performer. 2016 was a lackluster year for CTRA As of 2016, CTRA marked downturn in its performance. CTRA booked IDR 7.1 tn in marketing sales, a 21.7% YoY decline from IDR 9.2 tn in 2015. In our view, lethargic property demand and low property affordability were the key factors hurting developers’ marketing sales last year. We also believe, the dip in pre-sales of 2016 was largely caused by the extension of installment payments by the company for consumers. It is crucial to note that marketing sales recognition in financial statements are not always recognized in the same financial year as such period gap is greatly correlated with the payment method consumers select. Moreover, CTRA’s exposure to mortgages has increased from 29% in FY15 to 49% in FY16 (43% in 1Q17). Given our projection that the benchmark interest rate will not go down any further this year, it will be challenging for banks to push their cost of fund in order to offer better mortgage rates. This will affect property buyers’ ability to take mortgages and eventually hampered CTRA’s aggressiveness in property selling.
Source: Bank Indonesia, Company, PSI Research
Property industry On recuperation after major setback The Indonesia property sector has underperformed the JCI index by 2% YTD. We set our view on the Indonesia property sector to “neutral” as current sector valuations mostly reflect a sluggish pre-sales in 4Q16 and slow recovery in 1Q17. Moreover, We update our projection of property sector pre-sales growth to 11% YoY for FY17E as majority of buyers (especially those in mid-upper segment) are still in doubt as whether to buy or to invest in real properties, after the tax amnesty program. Based on our view, there are three reasons why some potential buyers have decided to postpone property purchases: 1) Mortgage rate decline is still an insignificant factor in stimulating property buyers, especially those in mid-upper segment, 2) Slower Average selling price growth is expected to persist, in line with the overall industry sluggishness, 3) Tighter liquidity and lower appetite to spend post tax-amnesty. From the developers’ side, many are still wary about launching new projects, as they think that overall demand has yet to recover in the near term. Hence, several new project launches scheduled for 2017 may well be postponed.
49%
15%
36%
Payment Method in 2016
Mortgage In-house Financing Cash
3.50%
4.50%
5.50%
6.50%
7.50%
8.50%
9.50%
State-Owned
Banks
Private
National
Banks
Foreign and
Joint Venture
Banks
Regional
Government
Banks
Weighted Average Mortgage Rates
Page | 9 | PHILLIP SEKURITAS INDONESIA
CIPUTRA DEVELOPMENT
INITIATION
Source: Bloomberg, PSI Research
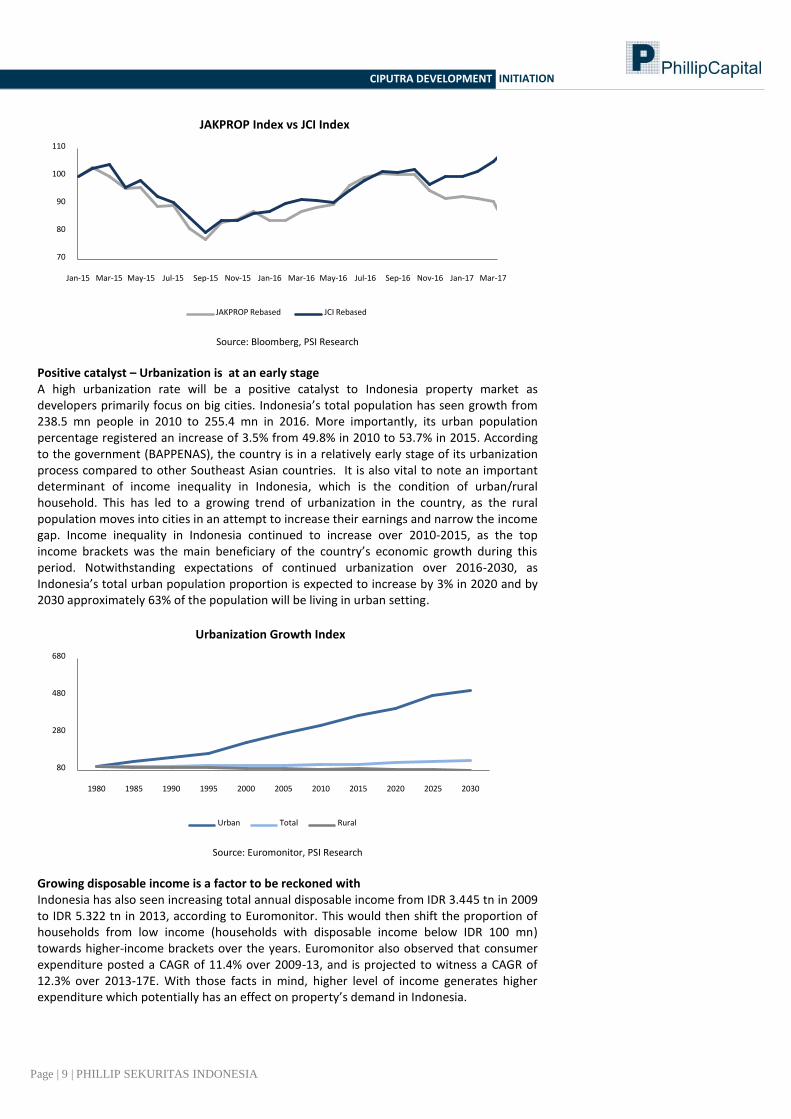
Positive catalyst – Urbanization is at an early stage A high urbanization rate will be a positive catalyst to Indonesia property market as developers primarily focus on big cities. Indonesia’s total population has seen growth from 238.5 mn people in 2010 to 255.4 mn in 2016. More importantly, its urban population percentage registered an increase of 3.5% from 49.8% in 2010 to 53.7% in 2015. According to the government (BAPPENAS), the country is in a relatively early stage of its urbanization process compared to other Southeast Asian countries. It is also vital to note an important determinant of income inequality in Indonesia, which is the condition of urban/rural household. This has led to a growing trend of urbanization in the country, as the rural population moves into cities in an attempt to increase their earnings and narrow the income gap. Income inequality in Indonesia continued to increase over 2010-2015, as the top income brackets was the main beneficiary of the country’s economic growth during this period. Notwithstanding expectations of continued urbanization over 2016-2030, as Indonesia’s total urban population proportion is expected to increase by 3% in 2020 and by 2030 approximately 63% of the population will be living in urban setting.
Source: Euromonitor, PSI Research
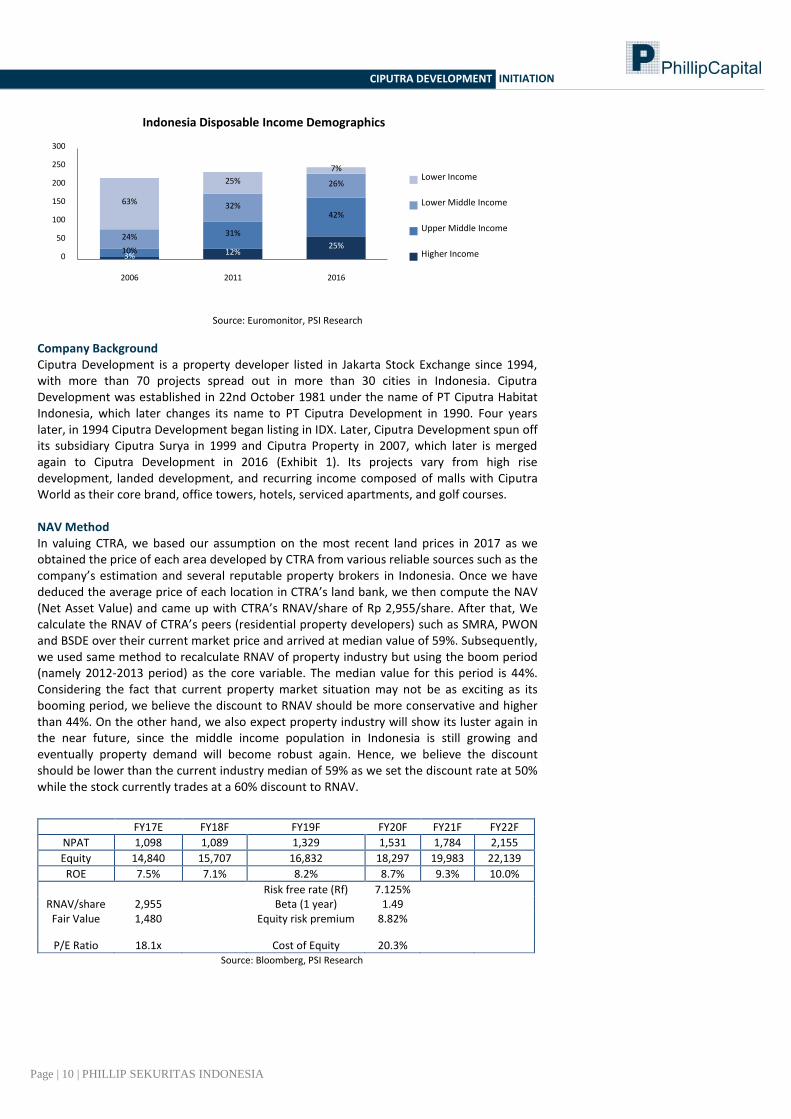
Growing disposable income is a factor to be reckoned with Indonesia has also seen increasing total annual disposable income from IDR 3.445 tn in 2009 to IDR 5.322 tn in 2013, according to Euromonitor. This would then shift the proportion of households from low income (households with disposable income below IDR 100 mn) towards higher-income brackets over the years. Euromonitor also observed that consumer expenditure posted a CAGR of 11.4% over 2009-13, and is projected to witness a CAGR of 12.3% over 2013-17E. With those facts in mind, higher level of income generates higher expenditure which potentially has an effect on property’s demand in Indonesia.
70
80
90
100
110
Jan-15 Mar-15 May-15 Jul-15 Sep-15 Nov-15 Jan-16 Mar-16 May-16 Jul-16 Sep-16 Nov-16 Jan-17 Mar-17
JAKPROP Index vs JCI Index
JAKPROP Rebased JCI Rebased
80
280
480
680
1980 1985 1990 1995 2000 2005 2010 2015 2020 2025 2030
Urbanization Growth Index
Urban Total Rural
Page | 10 | PHILLIP SEKURITAS INDONESIA
CIPUTRA DEVELOPMENT
INITIATION
Source: Euromonitor, PSI Research
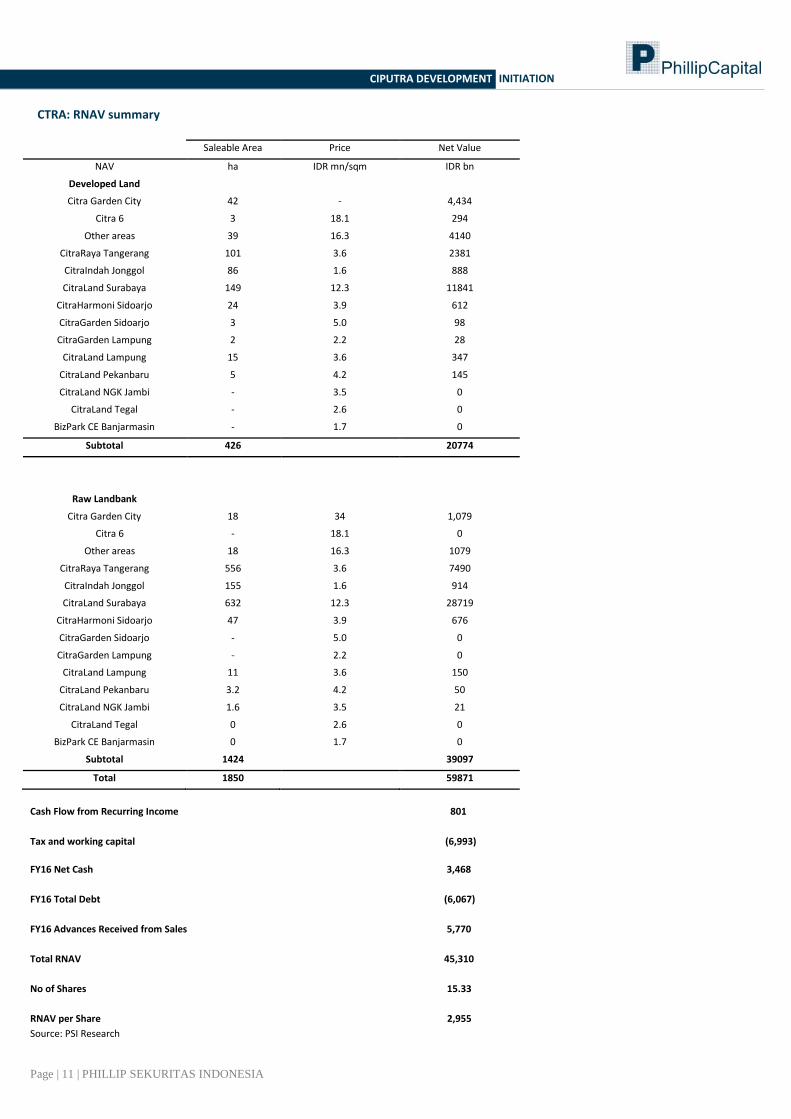
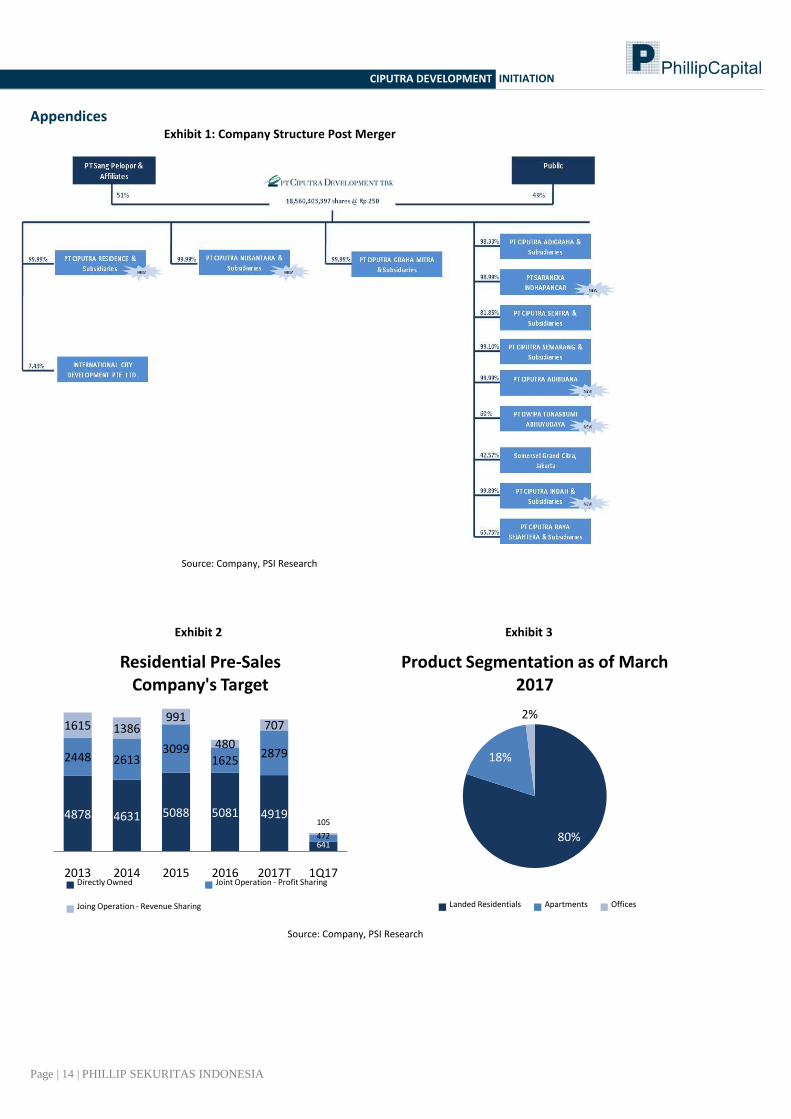
Company Background Ciputra Development is a property developer listed in Jakarta Stock Exchange since 1994, with more than 70 projects spread out in more than 30 cities in Indonesia. Ciputra Development was established in 22nd October 1981 under the name of PT Ciputra Habitat Indonesia, which later changes its name to PT Ciputra Development in 1990. Four years later, in 1994 Ciputra Development began listing in IDX. Later, Ciputra Development spun off its subsidiary Ciputra Surya in 1999 and Ciputra Property in 2007, which later is merged again to Ciputra Development in 2016 (Exhibit 1). Its projects vary from high rise development, landed development, and recurring income composed of malls with Ciputra World as their core brand, office towers, hotels, serviced apartments, and golf courses. NAV Method In valuing CTRA, we based our assumption on the most recent land prices in 2017 as we obtained the price of each area developed by CTRA from various reliable sources such as the company’s estimation and several reputable property brokers in Indonesia. Once we have deduced the average price of each location in CTRA’s land bank, we then compute the NAV (Net Asset Value) and came up with CTRA’s RNAV/share of Rp 2,955/share. After that, We calculate the RNAV of CTRA’s peers (residential property developers) such as SMRA, PWON and BSDE over their current market price and arrived at median value of 59%. Subsequently, we used same method to recalculate RNAV of property industry but using the boom period (namely 2012-2013 period) as the core variable. The median value for this period is 44%. Considering the fact that current property market situation may not be as exciting as its booming period, we believe the discount to RNAV should be more conservative and higher than 44%. On the other hand, we also expect property industry will show its luster again in the near future, since the middle income population in Indonesia is still growing and eventually property demand will become robust again. Hence, we believe the discount should be lower than the current industry median of 59% as we set the discount rate at 50% while the stock currently trades at a 60% discount to RNAV.
FY17E FY18F FY19F FY20F FY21F FY22F
NPAT 1,098 1,089 1,329 1,531 1,784 2,155
Equity 14,840 15,707 16,832 18,297 19,983 22,139
ROE 7.5% 7.1% 8.2% 8.7% 9.3% 10.0%
Risk free rate (Rf) 7.125% RNAV/share 2,955 Beta (1 year) 1.49
Fair Value 1,480 Equity risk premium 8.82%
P/E Ratio 18.1x Cost of Equity 20.3% Source: Bloomberg, PSI Research
3% 12%25%
10%
31%
42%
24%
32%
26%
63%
25%
7%
0
50
100
150
200
250
300
2006 2011 2016
Indonesia Disposable Income Demographics
Lower Income
Lower Middle Income
Upper Middle Income
Higher Income
Page | 11 | PHILLIP SEKURITAS INDONESIA
CIPUTRA DEVELOPMENT
INITIATION
Saleable Area Price Net Value
NAV ha IDR mn/sqm IDR bn
Developed Land
Citra Garden City 42 - 4,434
Citra 6 3 18.1 294
Other areas 39 16.3 4140
CitraRaya Tangerang 101 3.6 2381
CitraIndah Jonggol 86 1.6 888
CitraLand Surabaya 149 12.3 11841
CitraHarmoni Sidoarjo 24 3.9 612
CitraGarden Sidoarjo 3 5.0 98
CitraGarden Lampung 2 2.2 28
CitraLand Lampung 15 3.6 347
CitraLand Pekanbaru 5 4.2 145
CitraLand NGK Jambi - 3.5 0
CitraLand Tegal - 2.6 0
BizPark CE Banjarmasin - 1.7 0
Subtotal 426 20774
Raw Landbank
Citra Garden City 18 34 1,079
Citra 6 - 18.1 0
Other areas 18 16.3 1079
CitraRaya Tangerang 556 3.6 7490
CitraIndah Jonggol 155 1.6 914
CitraLand Surabaya 632 12.3 28719
CitraHarmoni Sidoarjo 47 3.9 676
CitraGarden Sidoarjo - 5.0 0
CitraGarden Lampung - 2.2 0
CitraLand Lampung 11 3.6 150
CitraLand Pekanbaru 3.2 4.2 50
CitraLand NGK Jambi 1.6 3.5 21
CitraLand Tegal 0 2.6 0
BizPark CE Banjarmasin 0 1.7 0
Subtotal 1424 39097
Total 1850 59871
Cash Flow from Recurring Income 801
Tax and working capital (6,993)
FY16 Net Cash 3,468
FY16 Total Debt (6,067)
FY16 Advances Received from Sales 5,770
Total RNAV 45,310
No of Shares 15.33
RNAV per Share 2,955
Source: PSI Research
CTRA: RNAV summary

Page | 12 | PHILLIP SEKURITAS INDONESIA
CIPUTRA DEVELOPMENT
INITIATION
Financial Breakdown
INCOME STATEMENT 2016A 2017E 2018F 2019F 2020F 2021F
Marketing sales IDR bn 7,187 8,121 9,128 10,304 11,781 13,627
Revenue IDR bn 6,739 7,242 7,561 8,732 10,046 11,322
COGS IDR bn 3,450 3,691 3,822 4,374 5,029 5,657
Gross profit IDR bn 3,290 3,551 3,739 4,358 5,017 5,665
Operating expenses IDR bn 1,484 1,271 1,335 1,539 1,770 1,999
Operating profit IDR bn 1,806 2,280 2,404 2,819 3,248 3,667
EBITDA IDR bn 2,031 2,523 2,673 3,124 3,589 4,041
Interest income IDR bn 272 241 129 110 60 75
Interest expense IDR bn 566 415 407 384 378 366 Other non-operating income IDR bn 46 293 306 353 406 458
Profit before tax IDR bn 1,464 1,811 1,818 2,190 2,522 2,916
Tax expenses IDR bn 385 381 382 460 530 613
Profit after tax IDR bn 1,080 1,430 1,436 1,730 1,991 2,303
Net profit IDR bn 771 1,098 1,089 1,329 1,531 1,784
REVENUE SUMMARY
2016A 2017E 2018F 2019F 2020F 2021F
Revenue - Total IDR bn 6,522 6,715 7,544 8,887 10,242 11,648
Revenue - Development property IDR bn 5,282 5,357 6,056 7,252 8,442 9,663
Land, houses, shop houses IDR bn 4,775 5,090 5,753 6,889 8,020 9,180
Land and strata title IDR bn 506 268 303 363 422 483
Revenue - Investment property IDR bn 1,146 1,250 1,367 1,497 1,644 1,808
Rental IDR bn 811 912 1,024 1,151 1,293 1,453
Hotel IDR bn 82 82 82 83 83 83
Building Management IDR bn 252 256 260 264 268 272
Revenue - Others IDR bn 94 107 121 138 156 177
Key Ratios 2016A 2017E 2018F 2019F 2020F 2021F
EPS x 50 59 58 71.62179 82.48282 96.13277
P/E x 25.9 18.1 18.3 15.0 13.0 11.2
DER x 0.42 0.39 0.36 0.32 0.29 0.25
PBV x 1.39 1.34 1.27 1.18 1.09 1.00
YoY growth 2016A 2017E 2018F 2019F 2020F 2021F
Marketing sales % -22% 13% 12% 13% 14% 16%
Revenue % -10% 7% 4% 15% 15% 13%
Gross profit % -12% 8% 5% 17% 15% 13%
Operating profit % -23% 26% 5% 17% 15% 13%
Profit before tax % -30% 24% 0% 20% 15% 16%
Net profit % -34% 43% -1% 22% 15% 17%
Source: PSI Research
Page | 13 | PHILLIP SEKURITAS INDONESIA
CIPUTRA DEVELOPMENT
INITIATION
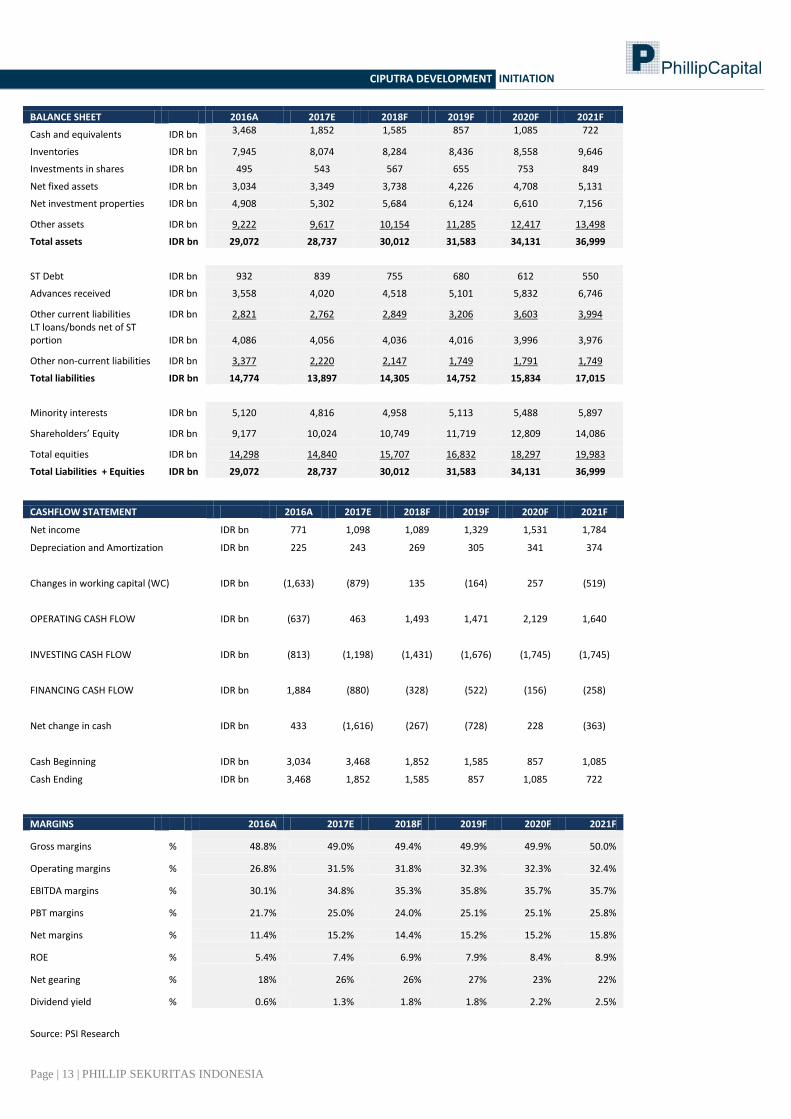
BALANCE SHEET 2016A 2017E 2018F 2019F 2020F 2021F
Cash and equivalents IDR bn 3,468 1,852 1,585 857 1,085 722
Inventories IDR bn 7,945 8,074 8,284 8,436 8,558 9,646
Investments in shares IDR bn 495 543 567 655 753 849
Net fixed assets IDR bn 3,034 3,349 3,738 4,226 4,708 5,131
Net investment properties IDR bn 4,908 5,302 5,684 6,124 6,610 7,156
Other assets IDR bn 9,222 9,617 10,154 11,285 12,417 13,498
Total assets IDR bn 29,072 28,737 30,012 31,583 34,131 36,999
ST Debt IDR bn 932 839 755 680 612 550
Advances received IDR bn 3,558 4,020 4,518 5,101 5,832 6,746
Other current liabilities IDR bn 2,821 2,762 2,849 3,206 3,603 3,994 LT loans/bonds net of ST portion IDR bn 4,086 4,056 4,036 4,016 3,996 3,976
Other non-current liabilities IDR bn 3,377 2,220 2,147 1,749 1,791 1,749
Total liabilities IDR bn 14,774 13,897 14,305 14,752 15,834 17,015
Minority interests IDR bn 5,120 4,816 4,958 5,113 5,488 5,897
Shareholders’ Equity IDR bn 9,177 10,024 10,749 11,719 12,809 14,086
Total equities IDR bn 14,298 14,840 15,707 16,832 18,297 19,983
Total Liabilities + Equities IDR bn 29,072 28,737 30,012 31,583 34,131 36,999
MARGINS 2016A 2017E 2018F 2019F 2020F 2021F
Gross margins % 48.8% 49.0% 49.4% 49.9% 49.9% 50.0%
Operating margins % 26.8% 31.5% 31.8% 32.3% 32.3% 32.4%
EBITDA margins % 30.1% 34.8% 35.3% 35.8% 35.7% 35.7%
PBT margins % 21.7% 25.0% 24.0% 25.1% 25.1% 25.8%
Net margins % 11.4% 15.2% 14.4% 15.2% 15.2% 15.8%
ROE % 5.4% 7.4% 6.9% 7.9% 8.4% 8.9%
Net gearing % 18% 26% 26% 27% 23% 22%
Dividend yield % 0.6% 1.3% 1.8% 1.8% 2.2% 2.5%
Source: PSI Research
CASHFLOW STATEMENT 2016A 2017E 2018F 2019F 2020F 2021F
Net income IDR bn 771 1,098 1,089 1,329 1,531 1,784
Depreciation and Amortization IDR bn 225 243 269 305 341 374
Changes in working capital (WC) IDR bn (1,633) (879) 135 (164) 257 (519)
OPERATING CASH FLOW IDR bn (637) 463 1,493 1,471 2,129 1,640
INVESTING CASH FLOW IDR bn (813) (1,198) (1,431) (1,676) (1,745) (1,745)
FINANCING CASH FLOW IDR bn 1,884 (880) (328) (522) (156) (258)
Net change in cash IDR bn 433 (1,616) (267) (728) 228 (363)
Cash Beginning IDR bn 3,034 3,468 1,852 1,585 857 1,085
Cash Ending IDR bn 3,468 1,852 1,585 857 1,085 722
Page | 14 | PHILLIP SEKURITAS INDONESIA
CIPUTRA DEVELOPMENT
INITIATION
Appendices Exhibit 1: Company Structure Post Merger
Source: Company, PSI Research
Exhibit 2 Exhibit 3
Source: Company, PSI Research
4878 4631 5088 5081 4919
641
2448 26133099
16252879
472
1615 1386991
480
707
105
2013 2014 2015 2016 2017T 1Q17
Residential Pre-Sales Company's Target
Directly Owned Joint Operation - Profit Sharing
Joing Operation - Revenue Sharing
80%
18%
2%
Product Segmentation as of March 2017
Landed Residentials Apartments Offices
Page | 15 | PHILLIP SEKURITAS INDONESIA
CIPUTRA DEVELOPMENT
INITIATION
Exhibit 4
Source: Company
Exhibit 5
Page | 16 | PHILLIP SEKURITAS INDONESIA
CIPUTRA DEVELOPMENT
INITIATION
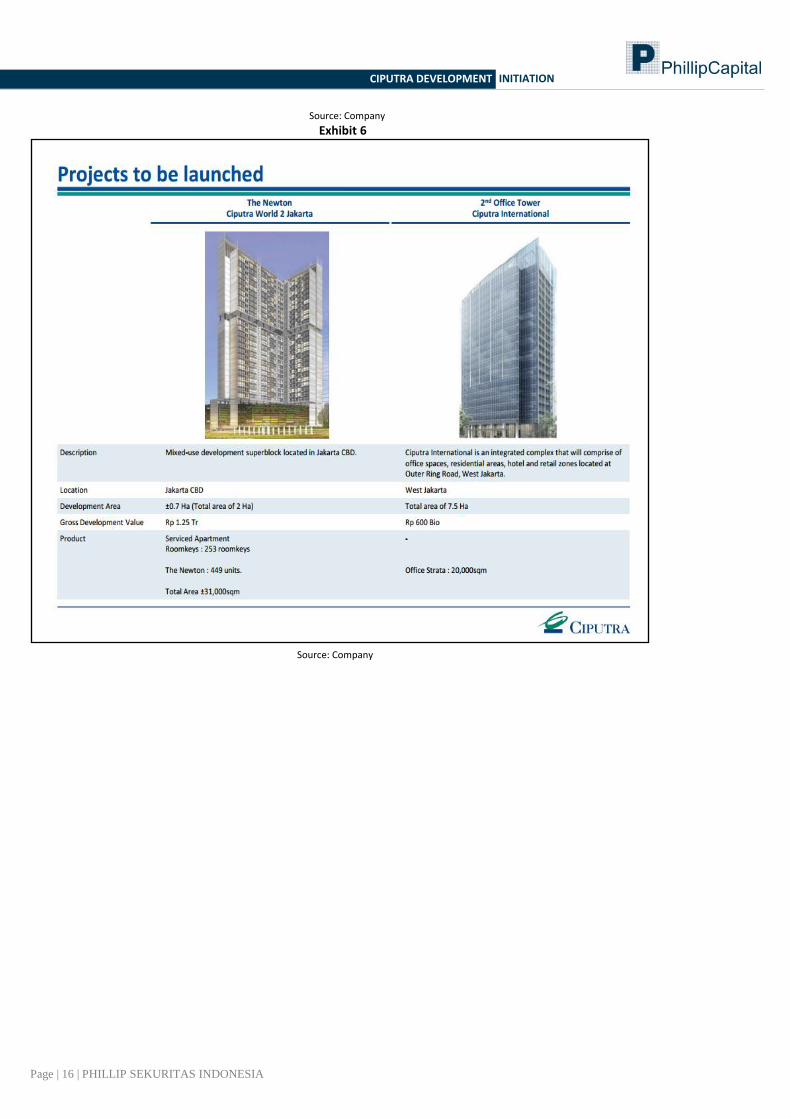
Source: Company Exhibit 6
Source: Company

Page | 17 | PHILLIP SEKURITAS INDONESIA
CIPUTRA DEVELOPMENT
INITIATION
Ratings History
PSR Rating System
Total Returns Recommendation Rating
> 10% Buy 1
0% to +10% Hold 2
<-0% Sell 3
Remarks
We do not base our recommendations entirely on the above quantitative return bands. We consider qualitative factors like (but not limited to) a stock's risk reward profile, market sentiment, recent rate of share price appreciation, presence or absence of stock price catalysts, and speculative undertones surrounding the stock, before making our final recommendation.
1
2
3
700
900
1,100
1,300
1,500
1,700
1,900
Jun
-15
Jul-1
5
Au
g-15
Sep-1
5
Oct-1
5
No
v-15
Dec-1
5
Jan-1
6
Feb-1
6
Mar-1
6
Ap
r-16
May-1
6
Jun
-16
Jul-1
6
Au
g-16
Sep-1
6
Oct-1
6
No
v-16
Dec-1
6
Jan-1
7
Feb-1
7
Mar-1
7
Ap
r-17
PT Ciputra DevelopmentTbk.Source: Bloomberg, PSI Market Price
Target Price
Page | 18 | PHILLIP SEKURITAS INDONESIA
CIPUTRA DEVELOPMENT
INITIATION
Important Information
Rating for Sectors: Overweight : We expect the industry to perform better than the primary market index (JCI) over the next 12 months. Neutral : We expect the industry to perform in line with the primary market index (JCI) over the next 12 months. Underweight : We expect the industry to under-perform the primary market index (JCI) over the next 12 months. Rating for Stocks: Buy : The stock is expected to give total return (price appreciation + dividend yield) of > +10% over the next. 12 months. Hold : The stock is expected to give total return of > 0% to ≤ +10% over the next 12 months. Sell : The stock is expected to give total return of < 0% over the next 12 months. Outperform : The stock is expected to do slightly better than the market return. Equal to “moderate buy” Underperform : The stock is expected to do slightly worse than the market return. Equal to “moderate sell” Analyst Certification The research analyst(s) primarily responsible for the preparation of this research report hereby certify that all of the views expressed in this research report accurately reflect their personal views about any and all of the subject securities or issuers. The research analyst(s) also certify that no part of their compensation was, is, or will be, directly or indirectly, related to the specific recommendations or views expressed in this research report. Disclaimers This document has been prepared for general circulation based on information obtained from sources believed to be reliable. But we do not make any representations as to its accuracy or completeness. Phillip Sekuritas Indonesia (PSI) accept no liability whatsoever for any direct or consequential loss arising from any use of this document or any solicitations of an offer to buy or sell any securities. PSI and its directors, officials and/or employees may have positions in, and may affect transactions in securities mentioned herein from time to time in the open market or otherwise, and may receive brokerage fees or act as principal or agent in dealing with respect to these companies. PSI may also seek investment banking business with companies covered in its research reports. As a result investors should be aware that the firm may have a conflict of interest that could affect the objectivity of this report. Investors should consider this report as only a single factor in making their investment decision. Disclosure Phillip Sekuritas Indonesia, or persons associated with or connected to Phillip Sekuritas Indonesia, including but not limited to its officers, directors, employees or persons involved in the issuance of this report, may provide an array of financial services to a large number of corporations in Indonesia and worldwide, including but not limited to commercial / investment banking activities (including sponsorship, financial advisory or underwriting activities), brokerage or securities trading activities. Phillip Sekuritas Indonesia, or persons associated with or connected to Phillip Sekuritas Indonesia, including but not limited to its officers, directors, employees or persons involved in the issuance of this report, may have participated in or invested in transactions with the issuer(s) of the securities mentioned in this report, and may have performed services for or solicited business from such issuers. Additionally, Phillip Sekuritas Indonesia, or persons associated with or connected to Phillip Sekuritas Indonesia, including but not limited to its officers, directors, employees or persons involved in the issuance of this report, may have provided advice or investment services to such companies and investments or related investments, as may be mentioned in this report. Investment Banking and Advisory activities: In the preceding 12 months, Phillip Sekuritas Indonesia and/or an affiliate is not involved in any investment banking activities with PT. Ciputra Development Tbk. Market Maker and Liquidity Provider: Phillip Sekuritas Indonesia and/or an affiliate is not a market maker / liquidity provider in securities issued by PT. Ciputra Development Tbk. Other Financial Interests: Phillip Sekuritas Indonesia owns 0 shares in PT. Ciputra Development Tbk. Analyst’s Disclosure: Share Ownership: The analyst who wrote and published this report owns 0 shares in PT. Ciputra Development Tbk. Affiliation: The analyst who wrote and published this report is not affiliated with PT. Ciputra Development Tbk and any of the affiliates of PT. Ciputra Development Tbk.
Page | 19 | PHILLIP SEKURITAS INDONESIA
CIPUTRA DEVELOPMENT
INITIATION
Contact Information (Indonesia Research Team)
Management
Jasa Adhimulya (Head, Research - Equities)
+62 21 57 900 800 [email protected]
Banking | Economist Construction| Construction Materials Research Assistant Jasa Adhimulya +62 21 57 900 800 Toska Mardian Wurika +62 21 57 900 800 Dwi Prisetyowati +62 21 57 900 800 [email protected] [email protected] [email protected] Retail Trade | FMCG Property Mohamad Adityo Nugroho +62 21 57 900 800 Yehuda Anthony Harahap +62 21 57 900 800 [email protected] [email protected]
SINGAPORE Phillip Securities Pte Ltd
Raffles City Tower 250, North Bridge Road #06-00
Singapore 179101 Tel +65 6533 6001 Fax +65 6535 6631
Website: www.poems.com.sg
MALAYSIA Phillip Capital Management SdnBhd
B-3-6 Block B Level 3 Megan Avenue II, No. 12, Jalan Yap Kwan Seng, 50450
Kuala Lumpur Tel +603 2162 8841 Fax +603 2166 5099
Website: www.poems.com.my
HONG KONG Phillip Securities (HK) Ltd
11/F United Centre 95 Queensway Hong Kong
Tel +852 2277 6600 Fax +852 2868 5307
Websites: www.phillip.com.hk
JAPAN
Phillip Securities Japan, Ltd. 4-2 Nihonbashi Kabuto-cho Chuo-ku,
Tokyo 103-0026 Tel +81-3 3666 2101 Fax +81-3 3666 6090
Website: www.phillip.co.jp
INDONESIA PT Phillip Sekuritas Indonesia
ANZ Tower Level 23B, Jl Jend Sudirman Kav. 33A Jakarta 10220 – Indonesia
Tel +62-21 5790 0800 Fax +62-21 5790 0809 Website:www.phillip.co.id
CHINA Phillip Financial Advisory (Shanghai) Co Ltd
No 550 Yan An East Road, Ocean Tower Unit 2318,
Postal code 200001 Tel +86-21 5169 9200 Fax +86-21 6351 2940
Website: www.phillip.com.cn
THAILAND Phillip Securities (Thailand) Public Co. Ltd
15th Floor, Vorawat Building, 849 Silom Road, Silom, Bangrak,
Bangkok 10500 Thailand Tel +66-2 6351700 / 22680999
Fax +66-2 22680921 Websitewww.phillip.co.th
FRANCE King & Shaxson Capital Limited
3rd Floor, 35 Rue de la Bienfaisance 75008 Paris France
Tel +33-1 45633100 Fax +33-1 45636017
Website: www.kingandshaxson.com
UNITED KINGDOM King & Shaxson Capital Limited
6th Floor, Candlewick House, 120 Cannon Street, London, EC4N 6AS
Tel +44-20 7426 5950 Fax +44-20 7626 1757
Website: www.kingandshaxson.com
UNITED STATES Phillip Futures Inc
141 W Jackson Blvd Ste 3050 The Chicago Board of Trade Building
Chicago, IL 60604 USA Tel +1-312 356 9000
Fax +1-312 356 9005
AUSTRALIA Phillip Capital
Level 12, 15 William Street, Melbourne, Victoria 3000, Australia
Tel +61-03 9629 8288 Fax +61-03 9629 8882
Website: www.phillipcapital.com.au
SRI LANKA Asha Phillip Securities Limited
No 10, Prince Alfred Tower, Alfred House Gardens, Colombo 3, Sri Lanka
Tel: (94) 11 2429 100 Fax: (94) 11 2429 199 Website: www.ashaphillip.net/home.htm
INDIA
Phillip Capital (India) Private Limited No. 1, C‐Block, 2nd Floor, Modern Center , Jacob
Circle, K. K. Marg, Mahalaxmi Mumbai 400011 Tel: (9122) 2300 2999 Fax: (9122) 6667 9955
Website: www.phillipcapital.in
Page | 20 | PHILLIP SEKURITAS INDONESIA
CIPUTRA DEVELOPMENT
INITIATION
ANZ Tower Level 23B, Jl. Jendral Sudirman Kav 33A, Jakarta, 10220 - Indonesia
Telp. (62-21) 57 900 800, Fax. (62-21) 57 900 809, Email : [email protected] Website: www.phillip.co.id | www.poems.co.id | www.poems.web.id
Komp. Ruko Mega Grosir Cempaka Mas
Jl. Let. Jend. Soeprapto Blok D No. 7 Jakarta, 10640
Telp. (62) 811211970 / (62-21) 42885051 Email: [email protected]
Mangga Dua
Ruko Bahan Bangunan Mangga Dua Blok F1/8
Jl. Mangga Dua Selatan Jakarta 10730 Telp. (62) 819705980 / (62-21) 62203589
Email: [email protected]
Rukan Sentra Latumenten
Jl.Prof.Dr Latumenten no.50
Blk AA 12 Jakarta, 11460
Telp. (62) 8159138999 / (62-21) 56941781
Email: [email protected]
Roxy
Pusat Niaga Roxy Mas Blok B2/2
Jl. KH. Hasyim Ashari - Jakarta Barat
Telp. (62) 816900562 / (62-21) 63868308
Email: [email protected]
Pantai Indah Kapuk
Jl. Pantai Indah Barat Rukan Ekslusif BGM Blok B-6
Telp. (62) 81298798168 / (62-21) 56945791
Email: [email protected]
Taman Palem
Citypark Business District Blok B2 No.12 Cengkareng, Jakbar 11730
Telp. (62-21) 5694 5055 / 5077; Fax. (62-21) 5694 5013;
Email: [email protected]/[email protected]
Tanah Abang Pusat Grosir Metro Tanah Abang (PGMTA) Lantai 7 Unit 12,
Jl.Fachrudin Tanah Abang - Jakarta Pusat 10250
Telp : (021) 3003 6745 / 3003 6746; Fax : (021) 3003 6748
Email: [email protected]
Kelapa Gading Jl. Boulevard Raya Blok WB2/27 Kelapa Gading Jakarta Utara
Telp. (62) 8164845571 / (62-21) 70700050
Email: [email protected]
Citra Garden 2
Komp. Citra Niaga Blok A No.18
Citra Garden 2 - Kalideres, JakBar Telp. (62) 811885685 / (62-21) 54360175
Email: [email protected]
Alam Sutera
Ruko Prominence Blok 38G. No. 18
Jl. Sutra Barat Boulevard, Alam Sutera, Tangerang 15143 Telp. (62-21) 50314300
Email: [email protected]
Purwokerto
Jln. Perintis Kemerdekaan No. 38
Purwokerto - Jawa Tengah, 53110 Telp. (62-281) 626 899; Fax. (62-281) 891 150
Email: [email protected]
Yogyakarta
Kantor Perwakilan (KP) BEI Yogyakarta
Jl. Mangkubumi No. 111 Yogyakarta Telp. (0274) 557367
Email: [email protected]
Semarang
Jl. Karang Wulan Timur No. 2 - 4 Semarang
Telp. (62-24) 355 5959; Fax. (62-24) 351 3194
Email: [email protected]
Tegal
Kompleks Nirmala Square Blok C no.7
Jl. Yos Sudarso - Tegal 52121
Telp. (62-283) 340773; Fax. (62-283) 340774
Email: [email protected]
Jawa Barat Batam
Komp.Paskal Hypersquare Blok D-40
Jl Pasirkaliki 25-27 Bandung
Telp. (62-22) 8606 0690; Fax. (62-22) 8606 0765
Email: [email protected]
Kompleks Mahkota Raya Blok A No. 10
Batam Centre, Kota Batam 29456, Kepri
Telp. (62-778) 748 3337/3030/3131; Fax. (62-778) 748 3117; E-
Email: [email protected]
Jawa Timur Kalimantan Barat
Jln. Flores No. 11 Surabaya, 60281
Telp. (62-31) 501 5777; Fax. (62-31) 501 0567
Email: [email protected]
Jl. Teuku Umar Komplek Pontianak Mal C 23-24 Pontianak,
Kalimantan Barat
Telp. (62-561) 777 887; Fax. (62-561) 745 103
Email: [email protected]
Jambi Denpasar
Jln. GR. Djamin Datuk Bagindo No. 56A Jambi, 36142 Telp. (0741) 707 8260, 7555 699
Email: [email protected]
Kantor Perwakilan (KP) BEI Denpasar, Jl. P.B. Sudirman 10 X Kav. 2 Telp: (0361) 255 900
Email: [email protected]
Lampung Palembang
Jl. Ikan Tongkol No. 33 Blok 7-8 Teluk Betung
Bandar Lampung, 35223
Telp. (62-721) 474 234; Fax. (62-721) 474 108
Email: [email protected]
Pontianak
Kantor Perwakilan (KP) BEI Pontianak, Komplek Perkantoran Central
Perdana Blok A2-A3, Jalan Perdana
Telp: (62) 85750035553 / (62-561) 8102257 Email: [email protected]
Kantor Perwakilan (KP) BEI Palembang, Jl. Angkatan 45 No.13-14
Telp: (62) 8117886464 / (62-711) 5649260
Email: [email protected]
Manado
Kantor Perwakilan (KP) BEI Manado, Ruko Mega Style Blok 1C No.9
Komplek Mega Mas, Jl. Piere Tendean Boulevard
Telp: (62) 8997430892 / (62-431) 8820390 Email: [email protected]