Embed Size (px)
Citation preview
1 page
PT Indosat Tbk. Full Year 2011 Results

2 page
• PT Indosat Tbk cautions investors that certain statements contained in this document state
management's intentions, hopes, beliefs, expectations, or predictions of the future are forward-looking
statements
• Management wishes to caution the reader that forward-looking statements are not historical facts and
are only estimates or predictions. Actual results may differ materially from those projected as a result
of risks and uncertainties including, but not limited to:
• Our ability to manage domestic and international growth and maintain a high level of customer service
• Future sales growth
• Market acceptance of our product and service offerings
• Our ability to secure adequate financing or equity capital to fund our operations
• Network expansion
• Performance of our network and equipment
• Our ability to enter into strategic alliances or transactions
• Cooperation of incumbent local exchange carriers in provisioning lines and interconnecting our equipment
• Regulatory approval processes
• Changes in technology
• Price competition
• Other market conditions and associated risks
• The company undertakes no obligation to update publicly any forward-looking statements, whether as
a result of future events, new information, or otherwise
Disclaimer
3 page
Today’s Agenda
● FY 2011 Overview
● Financial & Operational Results
● Commercial, Strategy and Technical
● Tower Sale and Leaseback Transaction
4 page
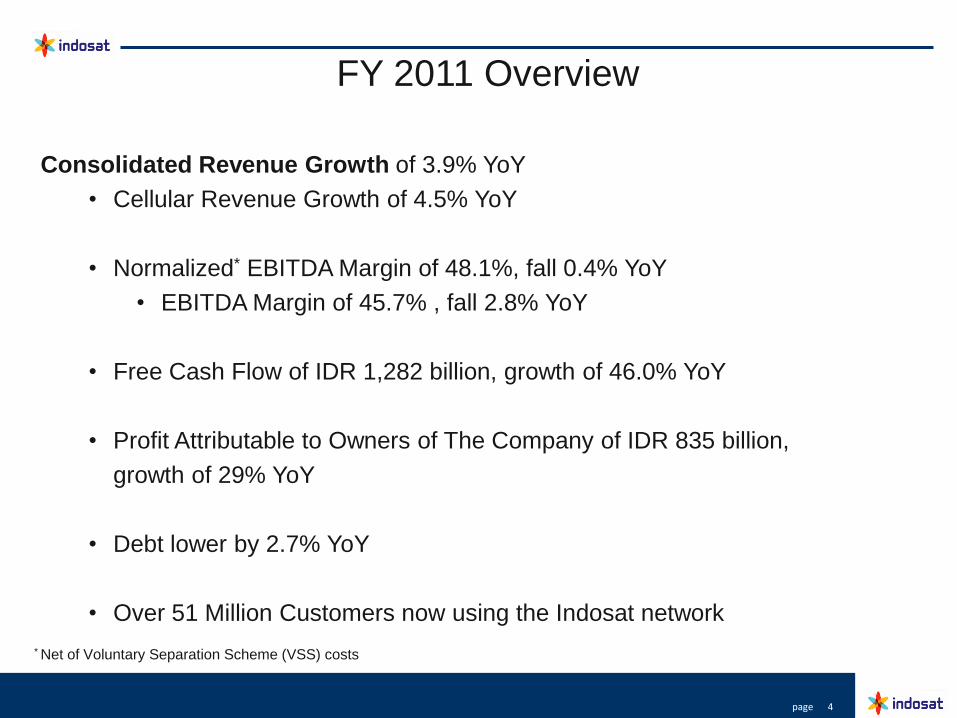
FY 2011 Overview
Consolidated Revenue Growth of 3.9% YoY
• Cellular Revenue Growth of 4.5% YoY
• Normalized* EBITDA Margin of 48.1%, fall 0.4% YoY
• EBITDA Margin of 45.7% , fall 2.8% YoY
• Free Cash Flow of IDR 1,282 billion, growth of 46.0% YoY
• Profit Attributable to Owners of The Company of IDR 835 billion,
growth of 29% YoY
• Debt lower by 2.7% YoY
• Over 51 Million Customers now using the Indosat network
* Net of Voluntary Separation Scheme (VSS) costs
5 page
Today’s Agenda
● FY 2011 Overview
● Financial & Operational Results
● Commercial, Strategy and Technical
● Tower Sale and Leaseback Transaction
6 page
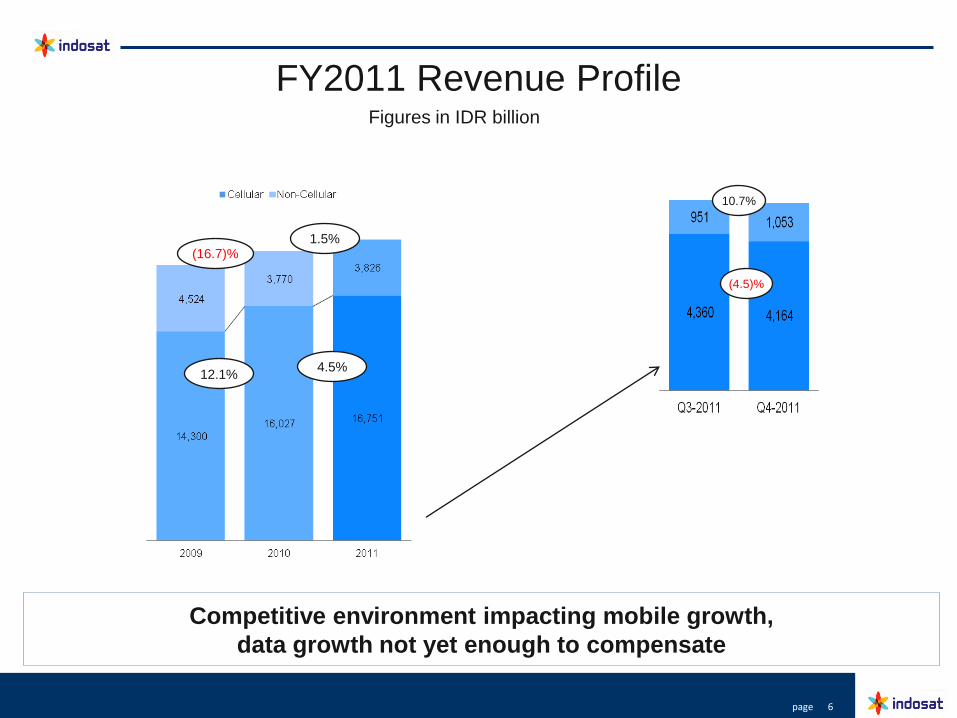
FY2011 Revenue Profile
12.1%
(16.7)%
4.5%
1.5%
Figures in IDR billion
Competitive environment impacting mobile growth,
data growth not yet enough to compensate
(4.5)%
10.7%
7 page
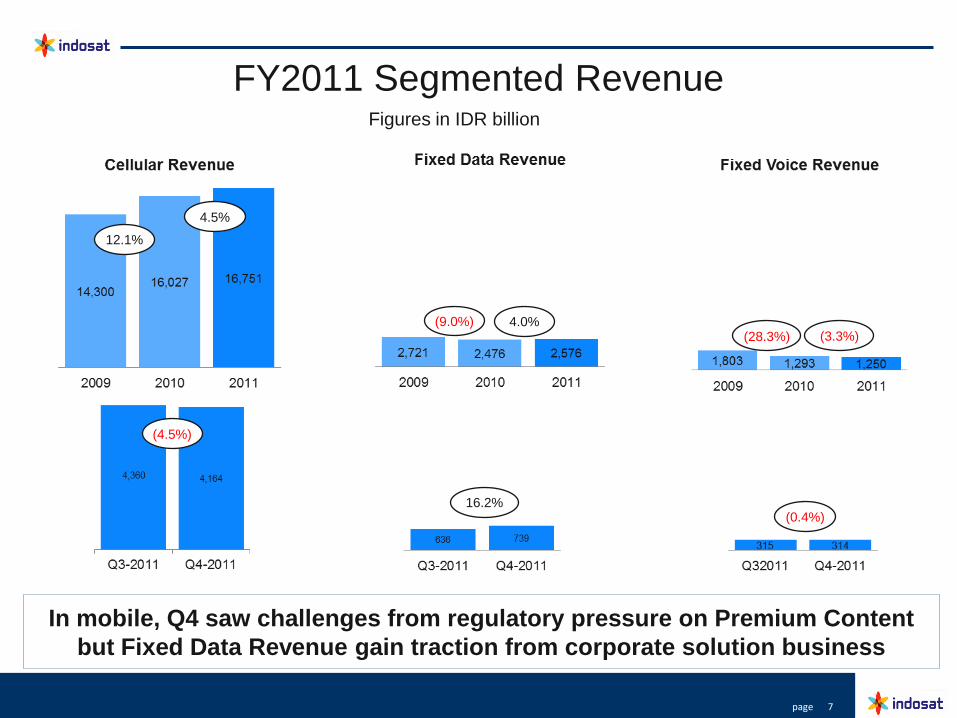
FY2011 Segmented Revenue
12.1%
4.5%
(9.0%) 4.0% (28.3%) (3.3%)
Figures in IDR billion
In mobile, Q4 saw challenges from regulatory pressure on Premium Content
but Fixed Data Revenue gain traction from corporate solution business
(4.5%)
16.2% (0.4%)
8 page
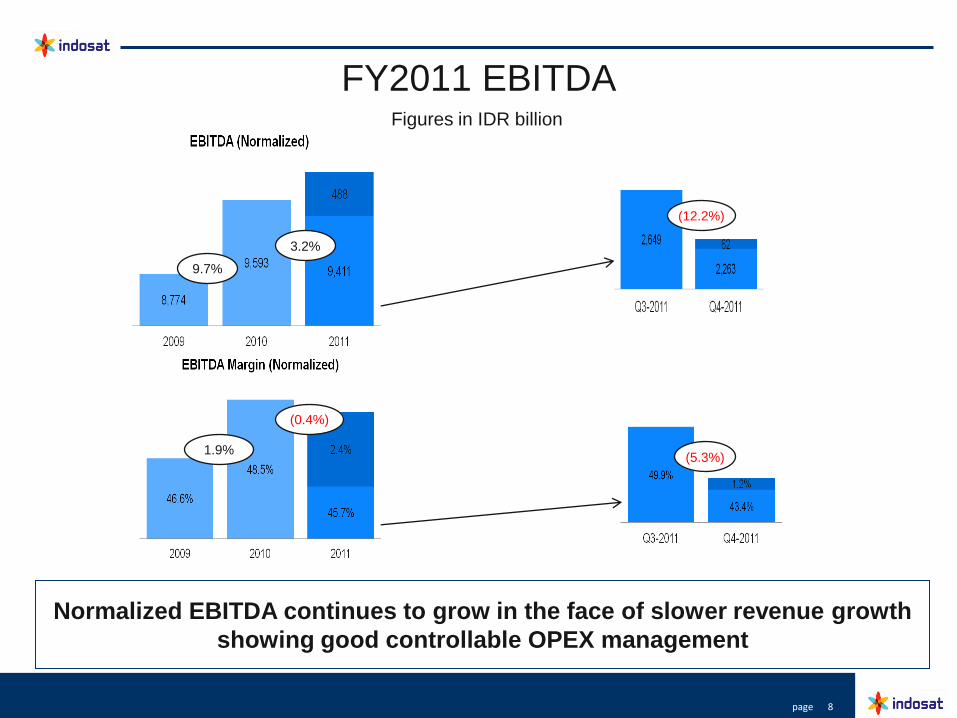
FY2011 EBITDA Figures in IDR billion
Normalized EBITDA continues to grow in the face of slower revenue growth
showing good controllable OPEX management
9.7%
3.2%
1.9%
(0.4%)
(5.3%)
(12.2%)
9 page
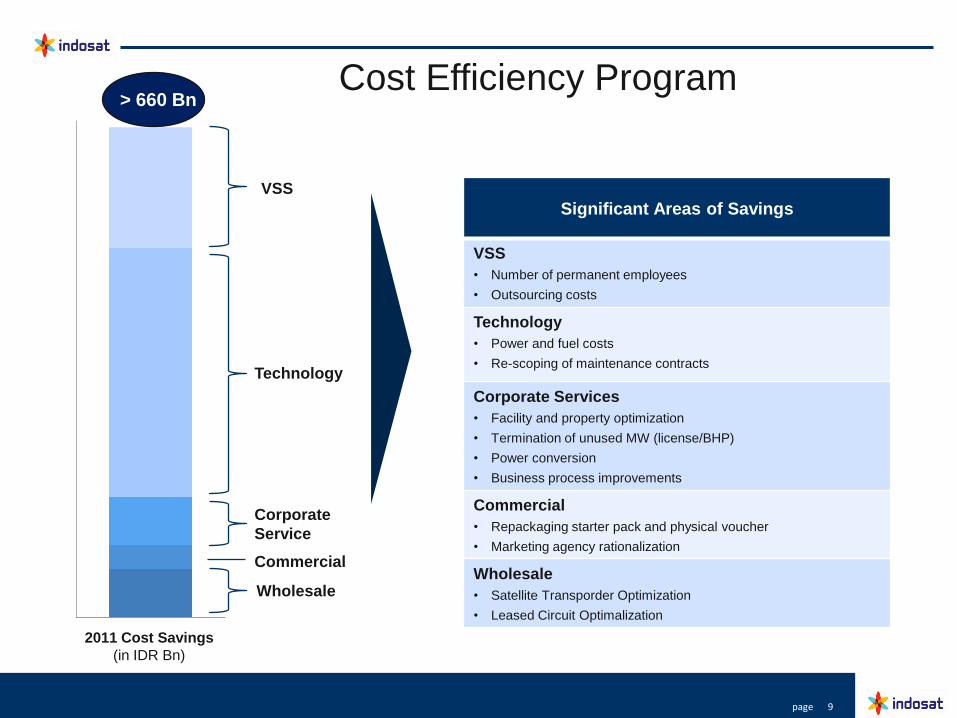
2011 Cost Savings
(in IDR Bn)
Commercial
Corporate
Service
Technology
> 660 Bn
VSS
Cost Efficiency Program
Wholesale
Significant Areas of Savings
VSS
• Number of permanent employees
• Outsourcing costs
Technology
• Power and fuel costs
• Re-scoping of maintenance contracts
Corporate Services
• Facility and property optimization
• Termination of unused MW (license/BHP)
• Power conversion
• Business process improvements
Commercial
• Repackaging starter pack and physical voucher
• Marketing agency rationalization
Wholesale
• Satellite Transporder Optimization
• Leased Circuit Optimalization
10 page
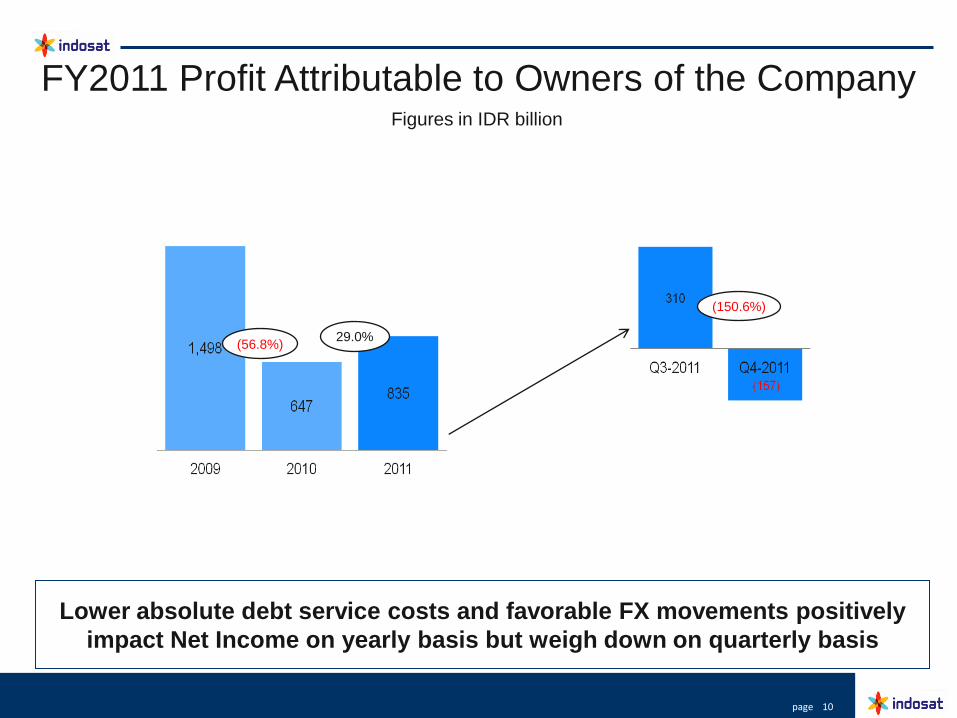
FY2011 Profit Attributable to Owners of the Company
(56.8%) 29.0%
Figures in IDR billion
Lower absolute debt service costs and favorable FX movements positively
impact Net Income on yearly basis but weigh down on quarterly basis
(150.6%)

11 page
2011 FCF and CAPEX Figures in IDR billion
(38.8%)
(7.3%)
113.3%
46%
CAPEX efficiency and Free Cash Flow generation is improving
12 page
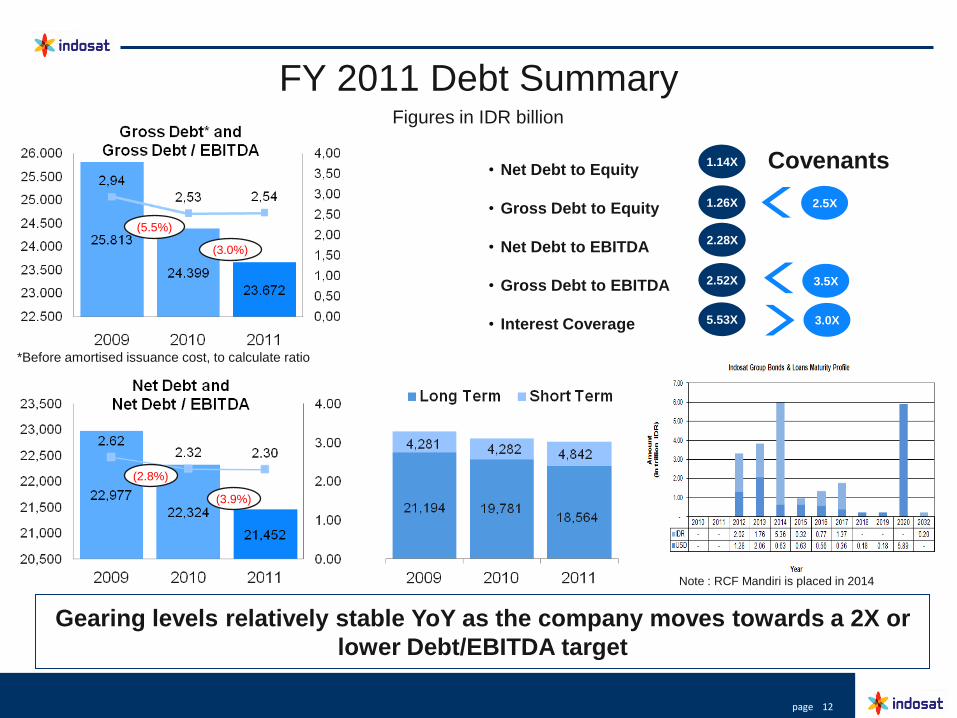
FY 2011 Debt Summary Figures in IDR billion
(2.8%)
(3.9%)
(5.5%)
(3.0%)
Gearing levels relatively stable YoY as the company moves towards a 2X or
lower Debt/EBITDA target
• Net Debt to Equity
• Gross Debt to Equity
• Net Debt to EBITDA
• Gross Debt to EBITDA
• Interest Coverage
1.14X
1.26X
2.52X
5.53X
2.28X
2.5X
3.5X
3.0X
Covenants
Note : RCF Mandiri is placed in 2014
*Before amortised issuance cost, to calculate ratio
13 page
Today’s Agenda
● FY 2011 Overview
● Financial & Operational Results
● Commercial, Strategy and Technical
● Tower Sale and Leaseback Transaction
14 page
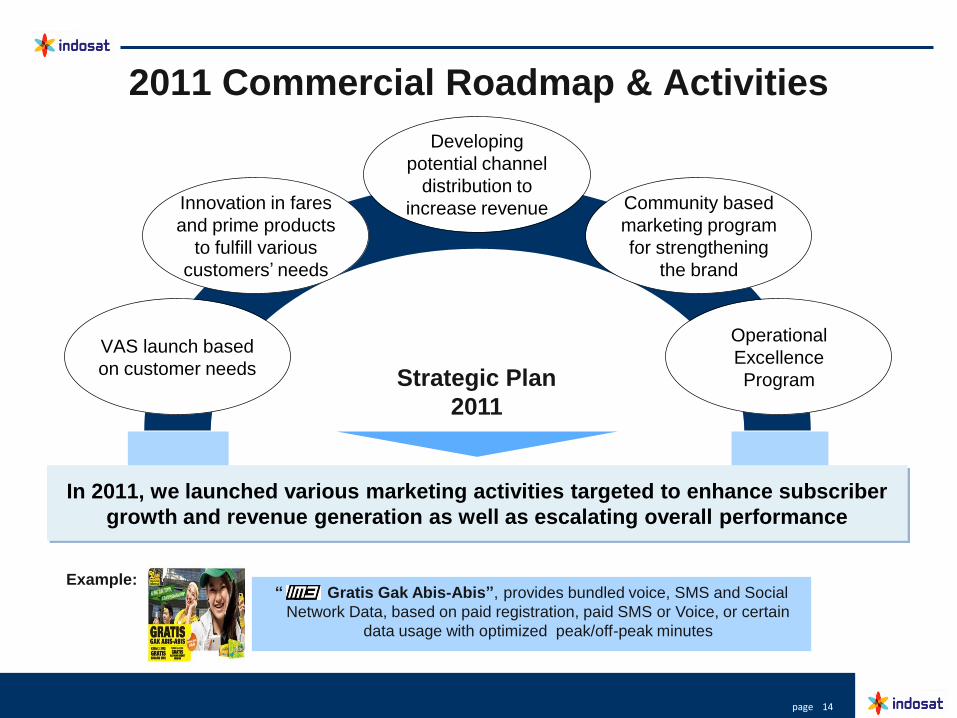
VAS launch based
on customer needs
Operational
Excellence
Program
Innovation in fares
and prime products
to fulfill various
customers‟ needs
Community based
marketing program
for strengthening
the brand
Developing
potential channel
distribution to
increase revenue
In 2011, we launched various marketing activities targeted to enhance subscriber
growth and revenue generation as well as escalating overall performance
Strategic Plan
2011
“ IM3 Gratis Gak Abis-Abis”, provides bundled voice, SMS and Social
Network Data, based on paid registration, paid SMS or Voice, or certain
data usage with optimized peak/off-peak minutes
Example:
2011 Commercial Roadmap & Activities

15 page
Wireless broadband is one of Indosat’s key
focus areas for future growth
Source: Informa Telecoms & Media (WCIS+)
We aim to gain market leadership in wireless broadband by
becoming the preferred operator for data services
3G is expected to witness steep increase
in uptake in immediate future…
…and we will continue focusing on data,
which has already been recognized as a
key element of our overall strategy
16 page
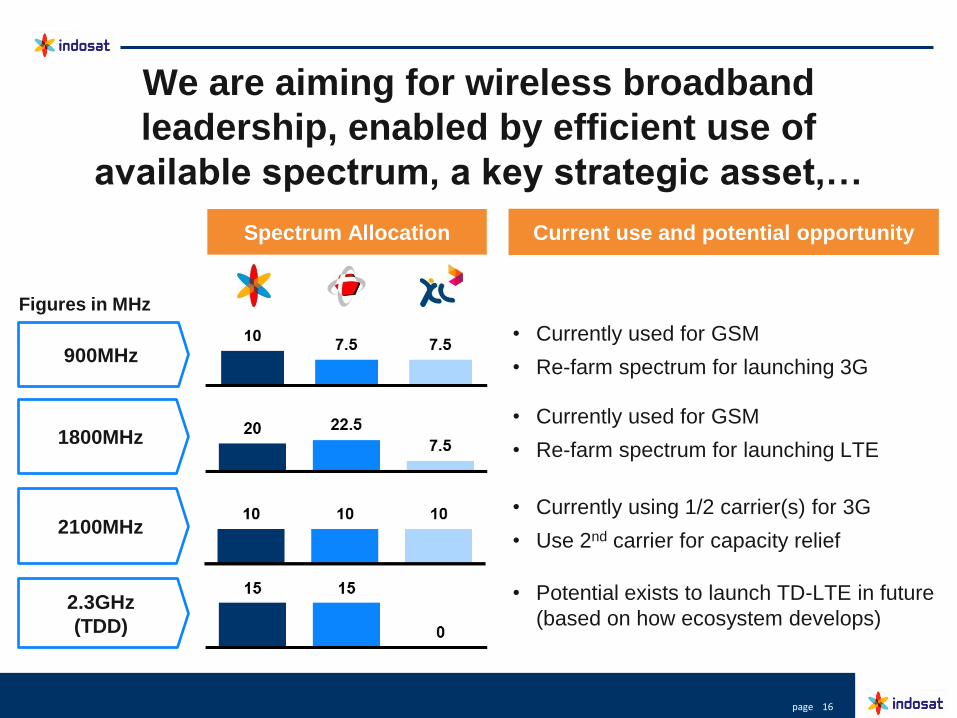
We are aiming for wireless broadband
leadership, enabled by efficient use of
available spectrum, a key strategic asset,…
900MHz
1800MHz
2100MHz
2.3GHz
(TDD)
Spectrum Allocation Current use and potential opportunity
• Currently used for GSM
• Re-farm spectrum for launching 3G
• Currently used for GSM
• Re-farm spectrum for launching LTE
• Currently using 1/2 carrier(s) for 3G
• Use 2nd carrier for capacity relief
• Potential exists to launch TD-LTE in future
(based on how ecosystem develops)
Figures in MHz
17 page
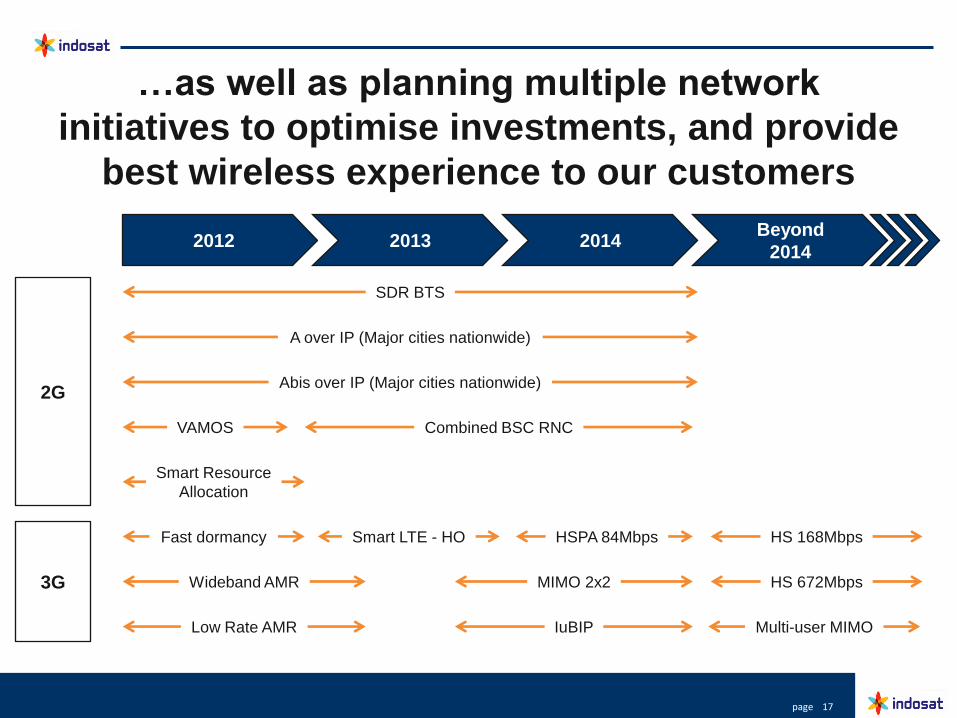
…as well as planning multiple network
initiatives to optimise investments, and provide
best wireless experience to our customers
2012 2013 Beyond
2014
2G
3G
A over IP (Major cities nationwide)
2014
SDR BTS
Abis over IP (Major cities nationwide)
VAMOS Combined BSC RNC
Smart Resource
Allocation
Fast dormancy Smart LTE - HO HSPA 84Mbps HS 168Mbps
Wideband AMR MIMO 2x2 HS 672Mbps
Low Rate AMR IuBIP Multi-user MIMO
18 page
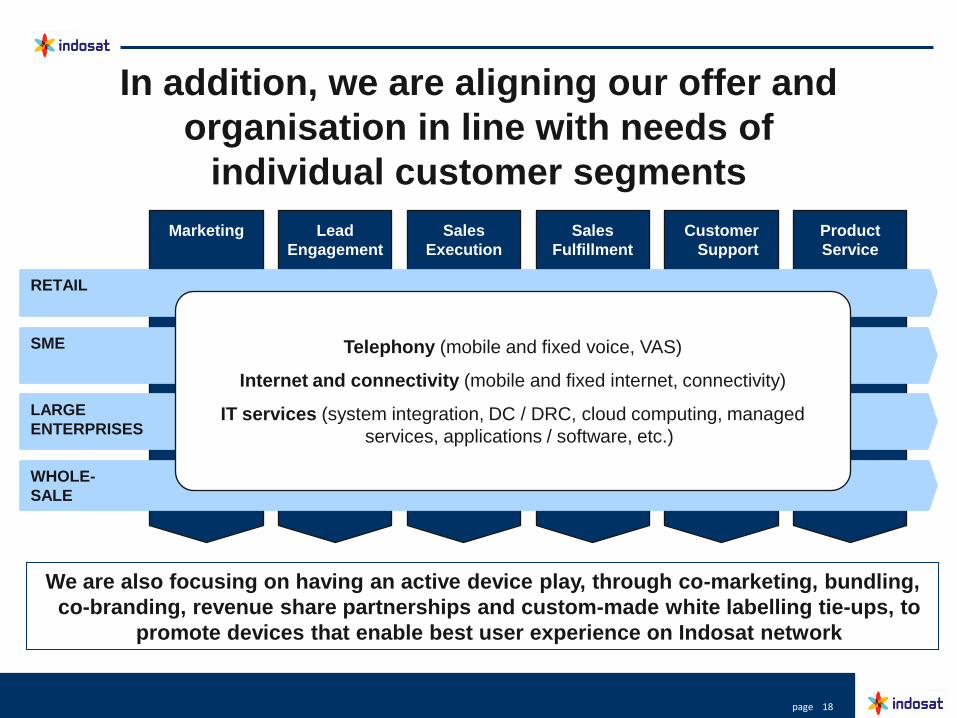
In addition, we are aligning our offer and
organisation in line with needs of
individual customer segments
Marketing Lead
Engagement
Sales
Execution
Product
Service
Sales
Fulfillment
Customer
Support
WHOLE-
SALE
RETAIL
SME
LARGE
ENTERPRISES
Telephony (mobile and fixed voice, VAS)
Internet and connectivity (mobile and fixed internet, connectivity)
IT services (system integration, DC / DRC, cloud computing, managed
services, applications / software, etc.)
We are also focusing on having an active device play, through co-marketing, bundling,
co-branding, revenue share partnerships and custom-made white labelling tie-ups, to
promote devices that enable best user experience on Indosat network
19 page
Today’s Agenda
● FY 2011 Overview
● Financial & Operational Results
● Company Strategy
● Tower Sale and Leaseback Transaction
20 page
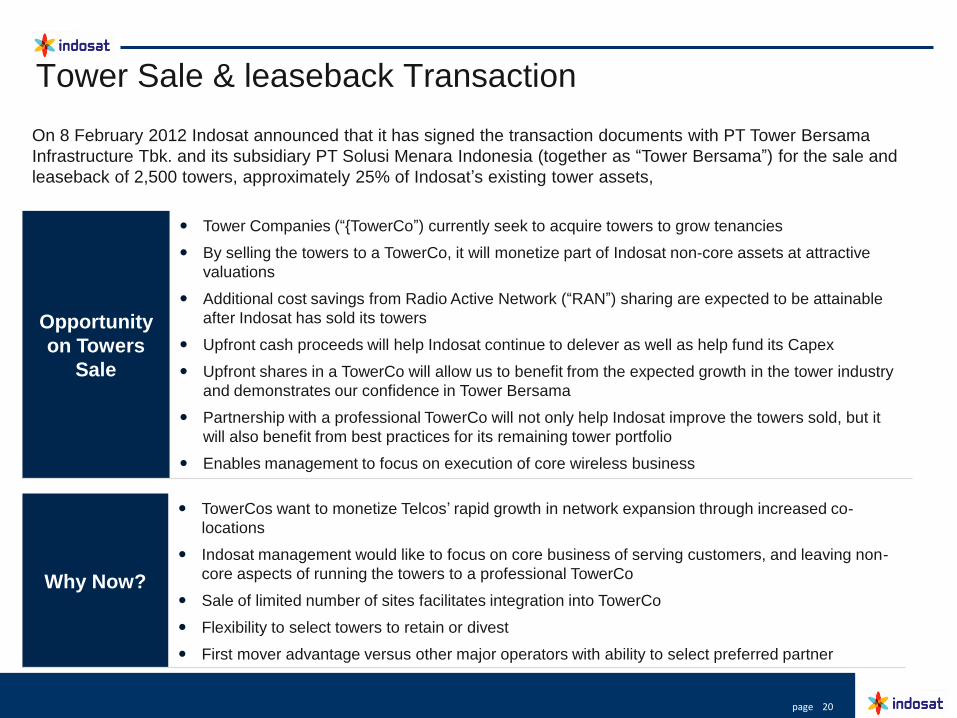
Tower Sale & leaseback Transaction
Opportunity
on Towers
Sale
Tower Companies (“{TowerCo”) currently seek to acquire towers to grow tenancies
By selling the towers to a TowerCo, it will monetize part of Indosat non-core assets at attractive
valuations
Additional cost savings from Radio Active Network (“RAN”) sharing are expected to be attainable
after Indosat has sold its towers
Upfront cash proceeds will help Indosat continue to delever as well as help fund its Capex
Upfront shares in a TowerCo will allow us to benefit from the expected growth in the tower industry
and demonstrates our confidence in Tower Bersama
Partnership with a professional TowerCo will not only help Indosat improve the towers sold, but it
will also benefit from best practices for its remaining tower portfolio
Enables management to focus on execution of core wireless business
Why Now?
TowerCos want to monetize Telcos‟ rapid growth in network expansion through increased co-
locations
Indosat management would like to focus on core business of serving customers, and leaving non-
core aspects of running the towers to a professional TowerCo
Sale of limited number of sites facilitates integration into TowerCo
Flexibility to select towers to retain or divest
First mover advantage versus other major operators with ability to select preferred partner
On 8 February 2012 Indosat announced that it has signed the transaction documents with PT Tower Bersama
Infrastructure Tbk. and its subsidiary PT Solusi Menara Indonesia (together as “Tower Bersama”) for the sale and
leaseback of 2,500 towers, approximately 25% of Indosat‟s existing tower assets,
21 page
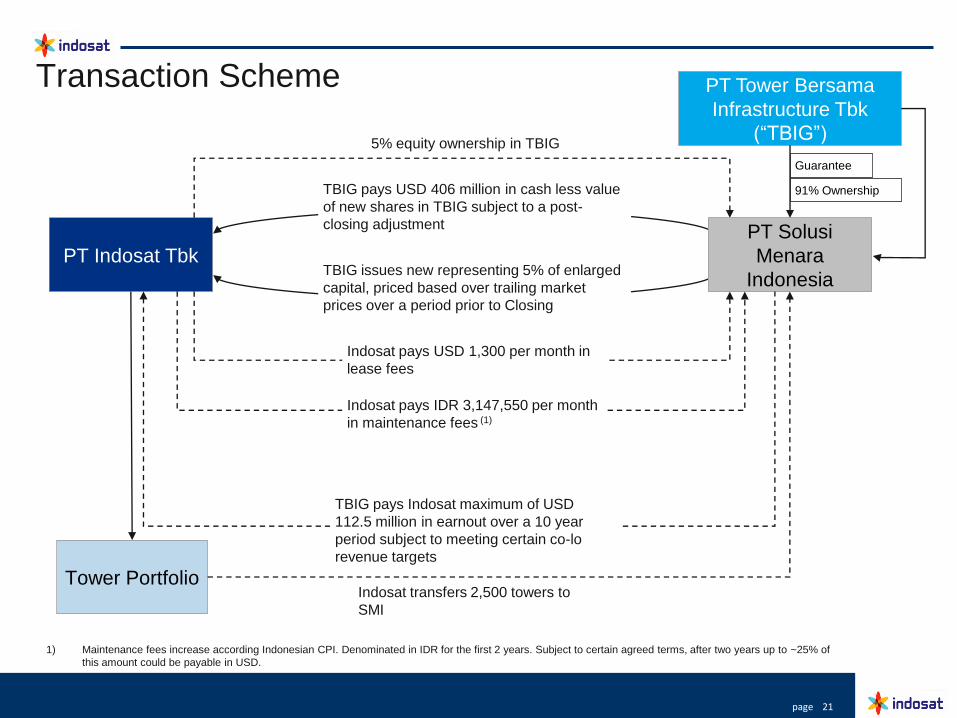
Transaction Scheme
PT Indosat Tbk
PT Tower Bersama
Infrastructure Tbk
(“TBIG”)
Tower Portfolio
PT Solusi
Menara
Indonesia
5% equity ownership in TBIG
TBIG pays USD 406 million in cash less value
of new shares in TBIG subject to a post-
closing adjustment
TBIG issues new representing 5% of enlarged
capital, priced based over trailing market
prices over a period prior to Closing
Indosat transfers 2,500 towers to
SMI
Guarantee
91% Ownership
TBIG pays Indosat maximum of USD
112.5 million in earnout over a 10 year
period subject to meeting certain co-lo
revenue targets
Indosat pays USD 1,300 per month in
lease fees
Indosat pays IDR 3,147,550 per month
in maintenance fees (1)
1) Maintenance fees increase according Indonesian CPI. Denominated in IDR for the first 2 years. Subject to certain agreed terms, after two years up to ~25% of
this amount could be payable in USD.

22 page
Ratings Updates
On 9 February 2012, FitchRatings says that the agreement signed between PT Indosat Tbk.
(Indosat; „BBB-‟/Positive) and PT Tower Bersama Infrastucture Tbk. (TBI; „BB‟/Stable) for the sale
and leaseback of 2,500 towers has no impact on Indosat‟s ratings.
On 8 February 2012, Moody‟s affirmed Indosat Ba1 ratings and Stable outlook, follows
announcement that Indosat has agreed to sell 2,500 of its communications towers to PT Tower
Bersama Infrastructure Tbk.
On 10 February 2012, S&P placed its „BB‟ long-term corporate credit rating on Indonesia-based
telecom operator PT Indosat Tbk. And the „BB‟ rating on the company‟s guaranteed senior
unsecured notes on CreditWatch with positive implications.
23 page
Supplemental
Information
24 page
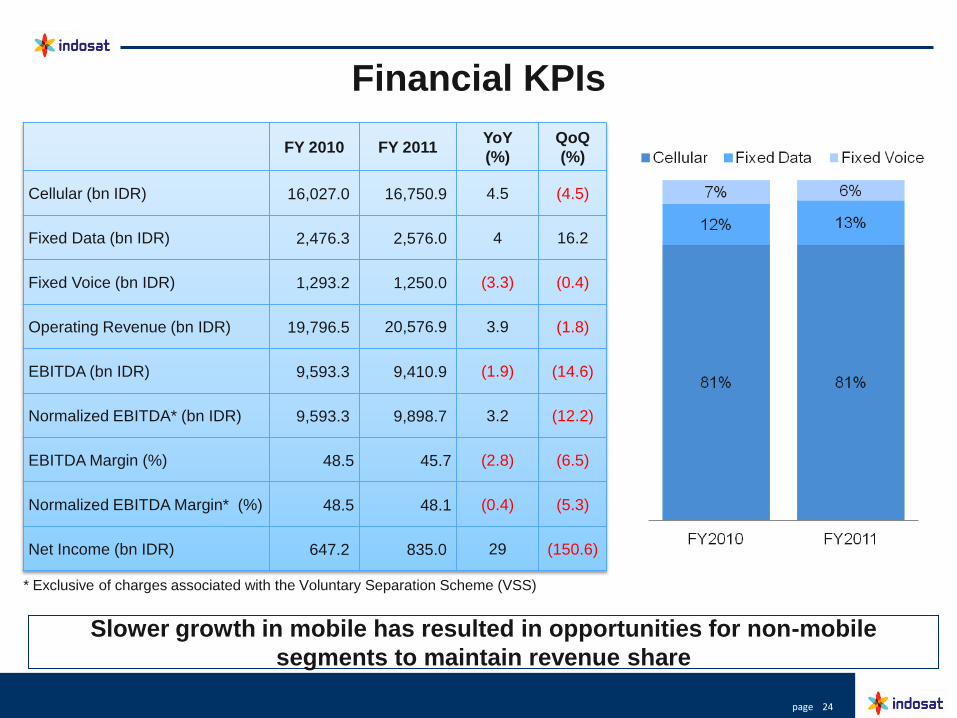
Financial KPIs
FY 2010 FY 2011 YoY
(%)
QoQ
(%)
Cellular (bn IDR) 16,027.0 16,750.9 4.5 (4.5)
Fixed Data (bn IDR) 2,476.3 2,576.0 4 16.2
Fixed Voice (bn IDR) 1,293.2 1,250.0 (3.3) (0.4)
Operating Revenue (bn IDR) 19,796.5 20,576.9 3.9 (1.8)
EBITDA (bn IDR) 9,593.3 9,410.9 (1.9) (14.6)
Normalized EBITDA* (bn IDR) 9,593.3 9,898.7 3.2 (12.2)
EBITDA Margin (%) 48.5 45.7 (2.8) (6.5)
Normalized EBITDA Margin* (%) 48.5 48.1 (0.4) (5.3)
Net Income (bn IDR) 647.2 835.0 29 (150.6)
* Exclusive of charges associated with the Voluntary Separation Scheme (VSS)
Slower growth in mobile has resulted in opportunities for non-mobile
segments to maintain revenue share
25 page
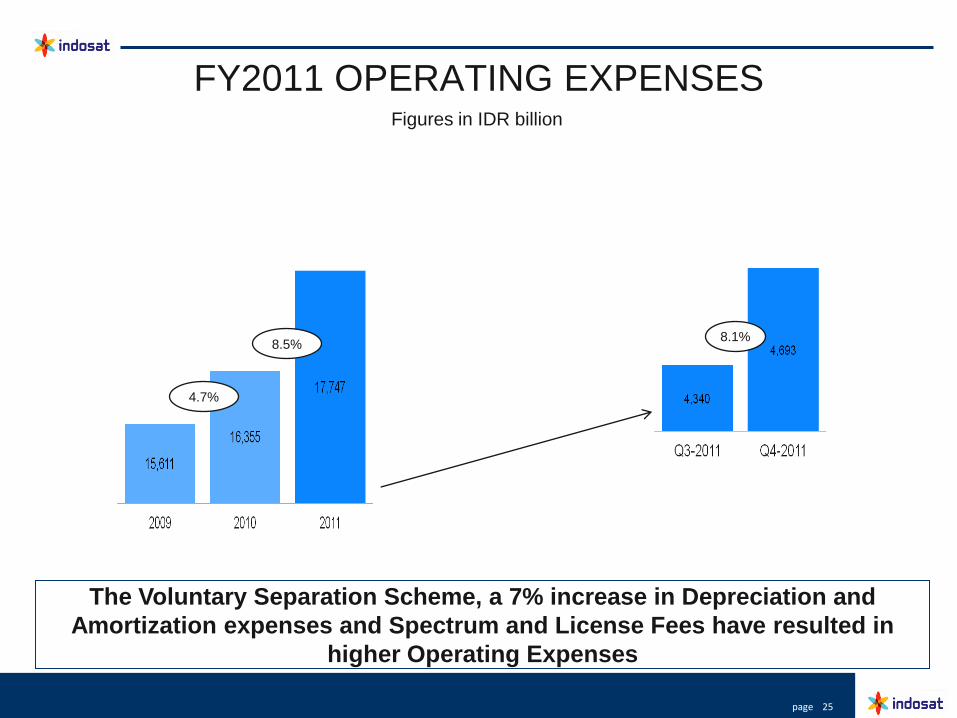
FY2011 OPERATING EXPENSES
The Voluntary Separation Scheme, a 7% increase in Depreciation and
Amortization expenses and Spectrum and License Fees have resulted in
higher Operating Expenses
Figures in IDR billion
4.7%
8.5% 8.1%
26 page
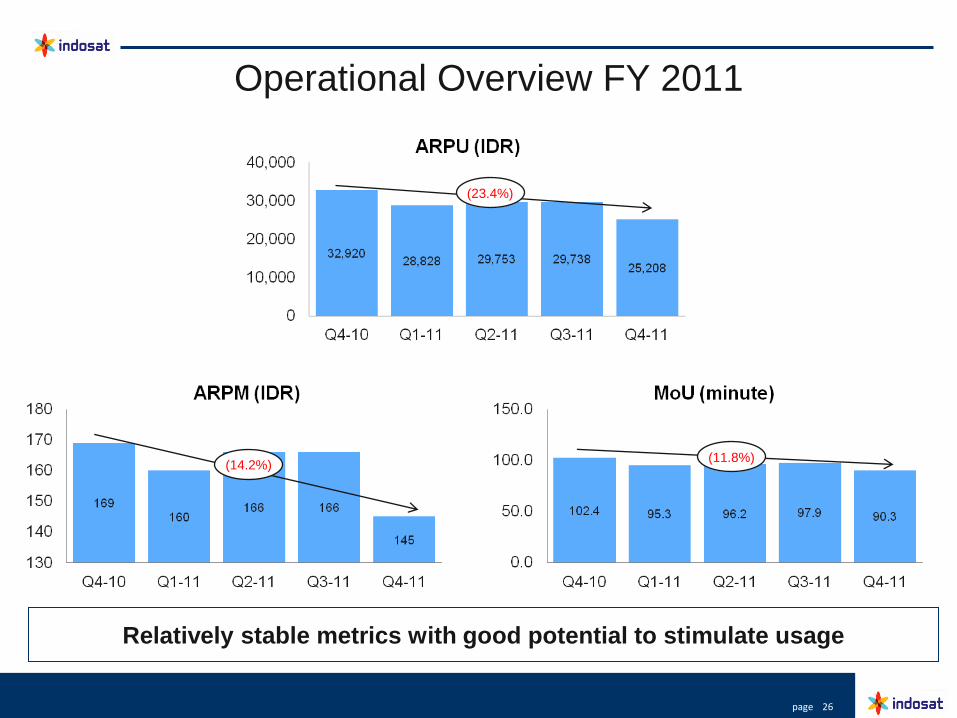
(23.4%)
(14.2%) (11.8%)
Operational Overview FY 2011
Relatively stable metrics with good potential to stimulate usage
27 page
Thank You
Upcoming
events
Any further
questions?
Indosat Investor Relations
Jl. Medan Merdeka Barat No. 21
Jakarta - 10110
Tel: +62 21 3869615
1Q-2012 Results
Mid Q2 2012