Embed Size (px)
Citation preview
Investor Presentation
Integrated Wood-Based Company
PT INTEGRA INDOCABINET TBK
2Q21
Desa Betro, Kecamatan SedatiSidoarjo 61253 – Indonesia
Phone: +62 31 8910434, +62 31 8910435, +62 31 8910436 Faximile: +62 31 8911391
E-mail: [email protected]: www.integrafurniture.co.id
Table of contents
2
Company profile
Investment case
Milestones
Corporate structure
Board of Commissioners
Board of Directors
Shareholder structure
Commitment to Minority Shareholders
Business model and growth strategy
Product portfolio
Vertically-integrated operations
Value chain
Geographic footprint and key customers
Production capacity, area, and facilities
Impact of COVID-19
UN Sustainable Development Goals
Preserving our environment
Nurturing our talent
Governance
Certifications and awards
COVID-19 safety and prevention measures
Opportunity in US protectionism
Opportunity in US and China tensions
Global furniture trading
Rising online home furnishing sales
Business outlook
IntroductionCorporate overview
Business overview
ESG, sustainability and safety
Growth drivers
Financial overview
Sales order update
Sales by segment
Seles by region
Financial highlights
Balance sheet
Capex and production capacity
Capital structure
Earnings guidance
Company profile
3
Establishment date 19 May 1989
Listing date 21 June 2017
Security code WOOD IJ
Business fieldIndustry, trade, and processing services of wood-based furniture and other wood products, forest concessions, as well as retail
and distribution of furniture and home decorations through the Company and subsidiaries.
Market cap IDR 4.7 trillion1
Company at a glance
The Company was established under the initial name of PT Integra Indocabinet in 1989 as a manufacturing company for simple wooden products.
Throughout its journey, Integra has become the largest integrated wood-based manufacturing company in Indonesia. The Company listed its shares on
the Indonesia Stock Exchange on 21 June 2017 and became PT Integra Indocabinet Tbk with a ticker code of “WOOD”.
Integra engages in 3 (three) business fields, namely Forest Concession, Manufacturing of Wooden Furniture Processing, and Trading, which are currently
operated through 7 (seven) subsidiaries: PT Narkata Rimba, PT Belayan River Timber (Forest Concession), PT Intertrend Utama, PT Interkraft, PT Intera
Indonesia, PT Inter Kayu Mandiri (Manufacturing), and PT Integriya Dekorindo (Trading).
As of 31 December 2020, Integra had 2,568 employees across various regions of Indonesia.
(1) As of 30 June 2021

Investment case
4
Efficient operations
Largest vertically-integrated timber products manufacturer, which results in margin improvement due to cost efficiencies.
Sustainable raw materials
Strategically located in a tropical region rich with tropical hardwood and softwood species, the company gains competitive
advantages on wood material prices and availability. Additionally, Integra also owns FSC-certified forest concessions.
Immense growth potential
Taking advantage of the US-China trade war opportunity and AD & CVD implementation on China’s timber products, Integra, as
the largest Indonesian timber products exporter to the US, is strongly positioned to expand its exports and market share.
Credible international certifications
The Company has obtained international certifications such as FSC and ISO.
Resiliency in COVID-19
The Company benefits from favorable demand dynamics in the US market due to a shift to stay-at-home lifestyle which includes
significant home redesign and furniture enhancements, boosting wooden product sales.
IntroductionCorporate overview
Business overview
ESG, sustainability and safety
Growth drivers
Financial overview
Table of contents
5
Company profile
Investment case
Milestones
Corporate structure
Board of Commissioners
Board of Directors
Shareholder structure
Commitment to Minority Shareholders
Business model and growth strategy
Product portfolio
Vertically-integrated operations
Value chain
Geographic footprint and key customers
Production capacity, area, and facilities
Impact of COVID-19
UN Sustainable Development Goals
Preserving our environment
Nurturing our talent
Governance
Certifications and awards
COVID-19 safety and prevention measures
Opportunity in US protectionism
Opportunity in US and China tensions
Global furniture trading
Rising online home furnishing sales
Business outlook
Sales order update
Sales by segment
Seles by region
Financial highlights
Balance sheet
Capex and production capacity
Capital structure
Earnings guidance
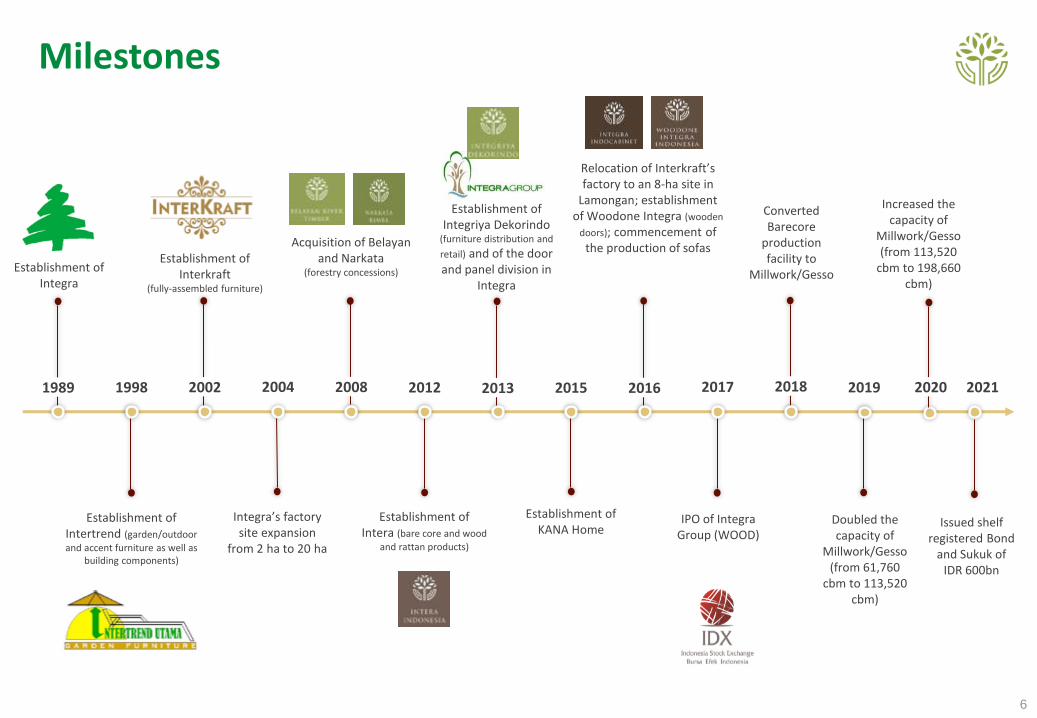
Milestones
6
Establishment of Integra
Establishment of Interkraft
(fully-assembled furniture)
Establishment of Intertrend (garden/outdoor
and accent furniture as well as building components)
Integra’s factory site expansion
from 2 ha to 20 ha
Establishment of KANA Home
Establishment of Intera (bare core and wood
and rattan products)
Acquisition of Belayanand Narkata
(forestry concessions)
Establishment of Integriya Dekorindo
(furniture distribution and
retail) and of the door and panel division in
Integra
Relocation of Interkraft’sfactory to an 8-ha site in
Lamongan; establishment of Woodone Integra (wooden
doors); commencement of the production of sofas
1989 1998 2002 2004 2008 2013 2015 20162012 2019
IPO of Integra Group (WOOD)
2017 2018
Converted Barecore
production facility to
Millwork/Gesso
Doubled the capacity of
Millwork/Gesso (from 61,760
cbm to 113,520 cbm)
Increased the capacity of
Millwork/Gesso (from 113,520
cbm to 198,660 cbm)
2020 2021
Issued shelf registered Bond
and Sukuk of IDR 600bn
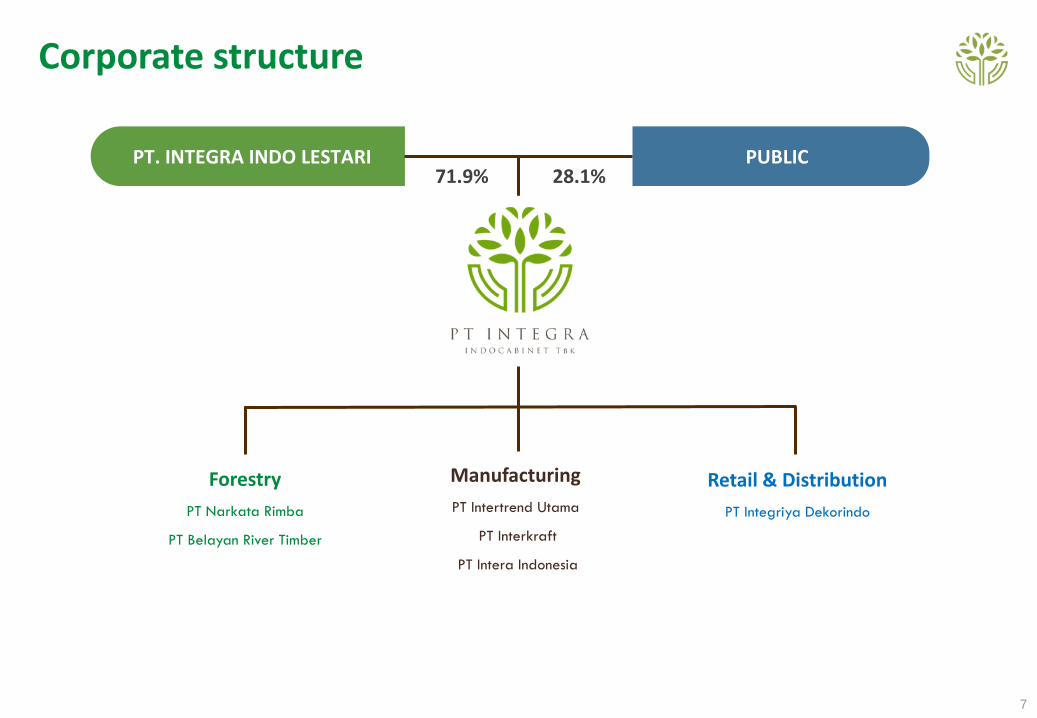
Corporate structure
7
71.9%PT. INTEGRA INDO LESTARI
28.1%PUBLIC
Forestry
PT Narkata Rimba
PT Belayan River Timber
Manufacturing
PT Intertrend Utama
PT Interkraft
PT Intera Indonesia
Retail & Distribution
PT Integriya Dekorindo
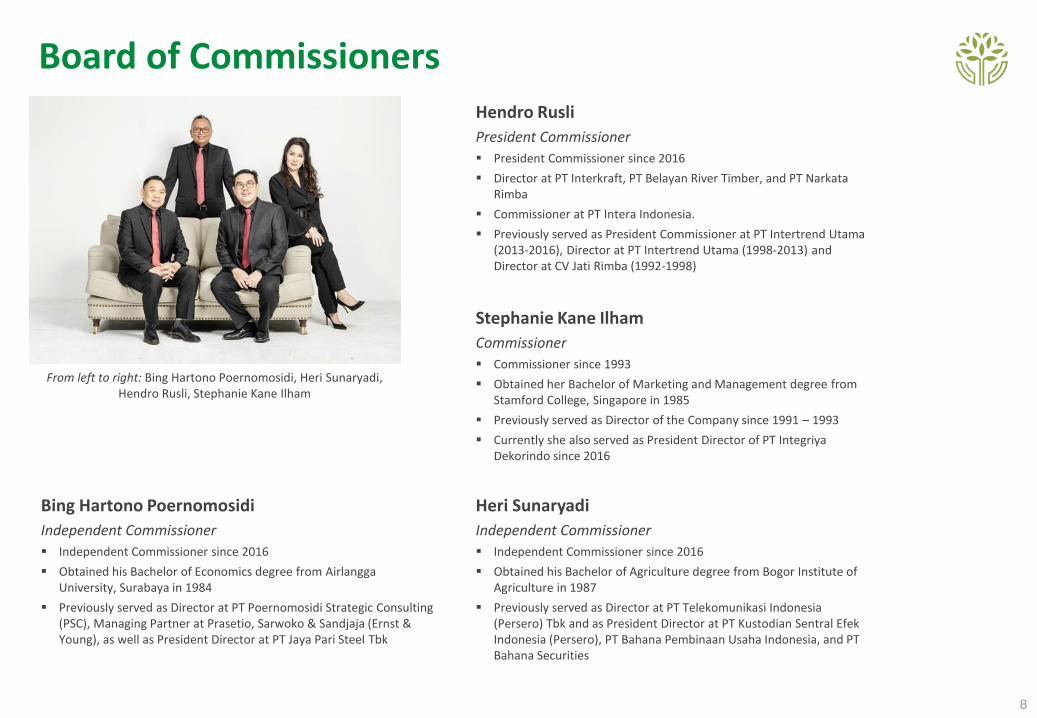
Board of Commissioners
8
Hendro Rusli
President Commissioner
▪ President Commissioner since 2016
▪ Director at PT Interkraft, PT Belayan River Timber, and PT NarkataRimba
▪ Commissioner at PT Intera Indonesia.
▪ Previously served as President Commissioner at PT Intertrend Utama (2013-2016), Director at PT Intertrend Utama (1998-2013) and Director at CV Jati Rimba (1992-1998)
Heri Sunaryadi
Independent Commissioner
▪ Independent Commissioner since 2016
▪ Obtained his Bachelor of Agriculture degree from Bogor Institute of Agriculture in 1987
▪ Previously served as Director at PT Telekomunikasi Indonesia (Persero) Tbk and as President Director at PT Kustodian Sentral Efek Indonesia (Persero), PT Bahana Pembinaan Usaha Indonesia, and PT Bahana Securities
Bing Hartono Poernomosidi
Independent Commissioner
▪ Independent Commissioner since 2016
▪ Obtained his Bachelor of Economics degree from AirlanggaUniversity, Surabaya in 1984
▪ Previously served as Director at PT Poernomosidi Strategic Consulting (PSC), Managing Partner at Prasetio, Sarwoko & Sandjaja (Ernst & Young), as well as President Director at PT Jaya Pari Steel Tbk
Stephanie Kane Ilham
Commissioner
▪ Commissioner since 1993
▪ Obtained her Bachelor of Marketing and Management degree from Stamford College, Singapore in 1985
▪ Previously served as Director of the Company since 1991 – 1993
▪ Currently she also served as President Director of PT IntegriyaDekorindo since 2016
From left to right: Bing Hartono Poernomosidi, Heri Sunaryadi, Hendro Rusli, Stephanie Kane Ilham
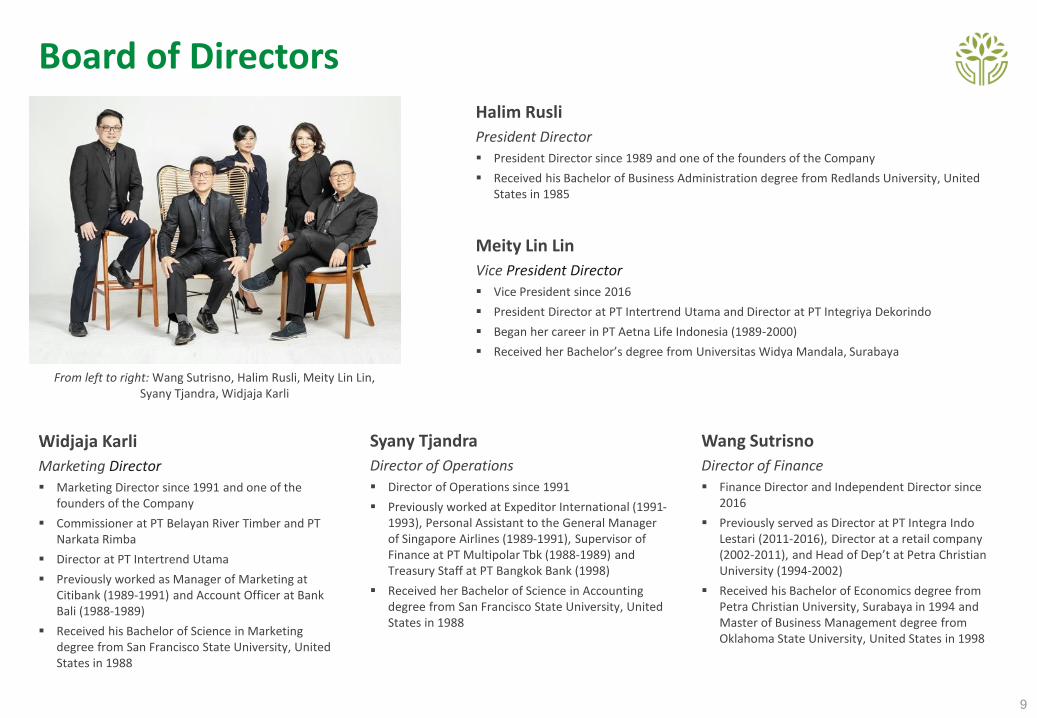
Board of Directors
9
From left to right: Wang Sutrisno, Halim Rusli, Meity Lin Lin, Syany Tjandra, Widjaja Karli
Meity Lin Lin
Vice President Director
▪ Vice President since 2016
▪ President Director at PT Intertrend Utama and Director at PT Integriya Dekorindo
▪ Began her career in PT Aetna Life Indonesia (1989-2000)
▪ Received her Bachelor’s degree from Universitas Widya Mandala, Surabaya
Widjaja Karli
Marketing Director
▪ Marketing Director since 1991 and one of the founders of the Company
▪ Commissioner at PT Belayan River Timber and PT Narkata Rimba
▪ Director at PT Intertrend Utama
▪ Previously worked as Manager of Marketing at Citibank (1989-1991) and Account Officer at Bank Bali (1988-1989)
▪ Received his Bachelor of Science in Marketing degree from San Francisco State University, United States in 1988
Syany Tjandra
Director of Operations
▪ Director of Operations since 1991
▪ Previously worked at Expeditor International (1991-1993), Personal Assistant to the General Manager of Singapore Airlines (1989-1991), Supervisor of Finance at PT Multipolar Tbk (1988-1989) and Treasury Staff at PT Bangkok Bank (1998)
▪ Received her Bachelor of Science in Accounting degree from San Francisco State University, United States in 1988
Wang Sutrisno
Director of Finance
▪ Finance Director and Independent Director since 2016
▪ Previously served as Director at PT Integra Indo Lestari (2011-2016), Director at a retail company (2002-2011), and Head of Dep’t at Petra Christian University (1994-2002)
▪ Received his Bachelor of Economics degree from Petra Christian University, Surabaya in 1994 and Master of Business Management degree from Oklahoma State University, United States in 1998
Halim Rusli
President Director
▪ President Director since 1989 and one of the founders of the Company
▪ Received his Bachelor of Business Administration degree from Redlands University, United States in 1985
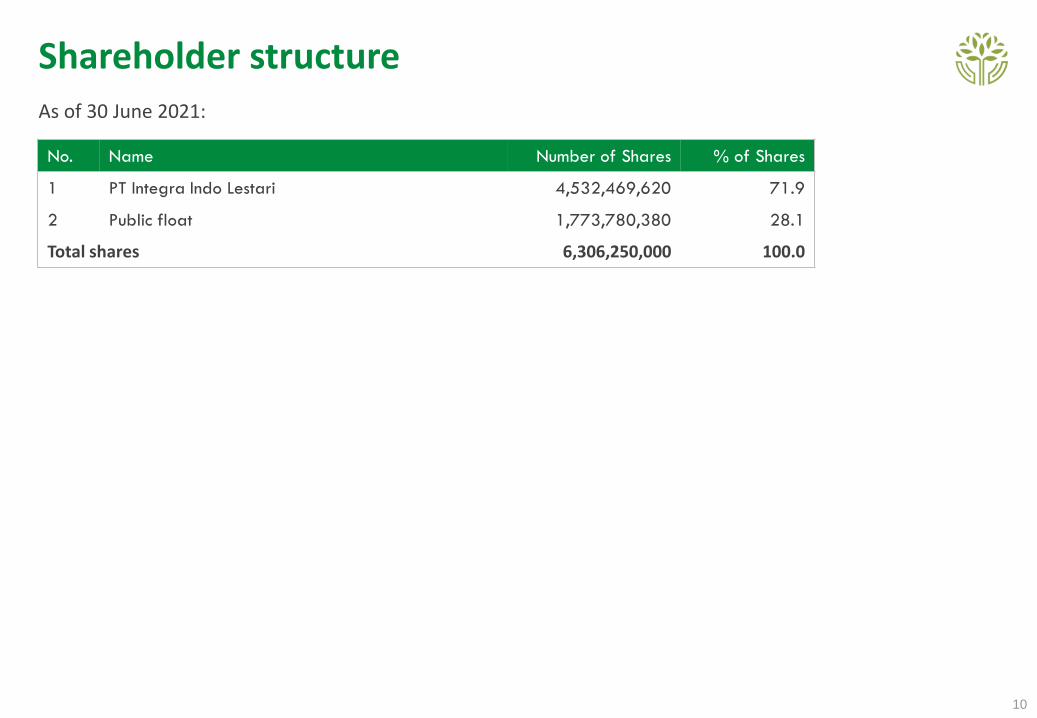
Shareholder structure
10
As of 30 June 2021:
No. Name Number of Shares % of Shares
1 PT Integra Indo Lestari 4,532,469,620 71.9
2 Public float 1,773,780,380 28.1
Total shares 6,306,250,000 100.0

Commitment to minority shareholders
11
As a listed Company, we are committed to creating value for minority shareholders and acting in their best interests through:
Fair DisclosureThe Company is committed to fairly disclosing information to all our shareholders.
Voting in General MeetingAll our shareholders have voting rights in the General Meeting by following the provisions and regulations of the
Indonesia Financial Services Authority (OJK).
Holding Shareholders General Meeting (SGM) as requested by ShareholdersThe Company will hold an SGM as requested by shareholders by following the Indonesia Financial Services Authority’s
(OJK) regulations and Company’s Articles of Association.
Dividend PolicyThe Company plans to pay cash dividends at least once a year. The amount of dividend depends on the Company’s
profit during the current fiscal year with consideration of the Company’s soundness and without prejudice to the rights of
the General Meeting of Shareholders of the Company to decide otherwise, in accordance with the Company’s Articles of
Association. The Company’s capital structure has a max payout ratio of cash dividends to annual profit of 35%.
Table of contents
12
Company profile
Investment case
Milestones
Corporate structure
Board of Commissioners
Board of Directors
Shareholder structure
Commitment to Minority Shareholders
Business model and growth strategy
Product portfolio
Vertically-integrated operations
Value chain
Geographic footprint and key customers
Production capacity, area, and facilities
Impact of COVID-19
UN Sustainable Development Goals
Preserving our environment
Nurturing our talent
Governance
Certifications and awards
COVID-19 safety and prevention measures
Opportunity in US protectionism
Opportunity in US and China tensions
Global furniture trading
Rising online home furnishing sales
Business outlook
IntroductionCorporate overview
Business overview
ESG, sustainability and safety
Growth drivers
Financial overview
Sales order update
Sales by segment
Seles by region
Financial highlights
Balance sheet
Capex and production capacity
Capital structure
Earnings guidance

Business model and growth strategy
13
WOOD consolidated its facilities to increase the capacity:▪ Furniture : 47,775 m3 ▪ Building Components: 345,060 m3
(almost double)
Production Strategy: Optimizing capacity
WOOD should benefit from wooden products impacted by the Anti-Dumping &
Countervailing Policies
US-China Trade War & Anti-Dumping Opportunities ▪ Providing financial support to
ensure growth▪ Improving financial structure
Financial Strategy
▪ Focusing on the US Market ▪ Maintaining furniture growth through big account
customers ▪ Accelerating growth through newly developed
building components particularly Millwork products▪ Improving margins through Direct Marketing Arms▪ Utilizing growing demand in online platform
Market Strategy
▪ Target sales increase by 25% YoY
▪ Target net margin: 10-12%
2021 Target
2021 business plan

Business model and growth strategy
14
Consolidating production facilities
WOOD is preparing the foundations to move the business towards green business.
Preparing material resources
WOOD is preparing local material resources to anticipate the jump of
production to gain its competitive advantages
Increasing production capacity
WOOD is consolidating new building component facilities under Intertrend, doubling capacity of Millwork
products and Plywood.
Increasing competitiveness
WOOD is making sure both material and labor costs are competitive versus those of regional
competitors by moving to more efficient levels of production processes
Strategy in facing 2021 challenges
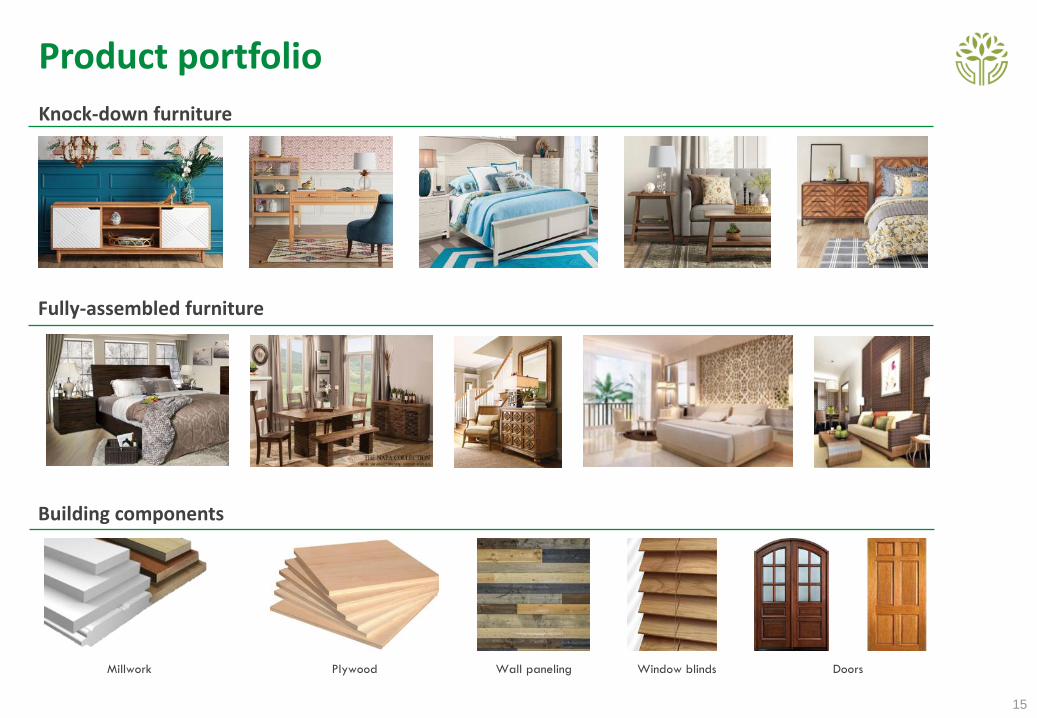
Product portfolio
15
Fully-assembled furniture
Building components
Plywood Wall paneling Window blinds DoorsMillwork
Knock-down furniture
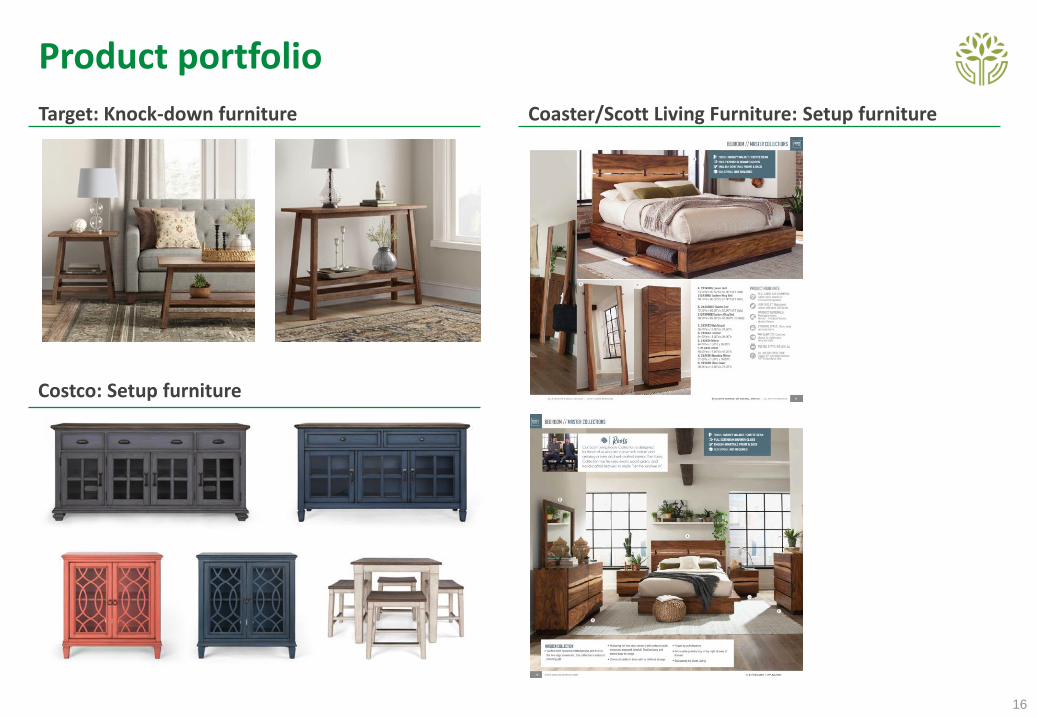
Product portfolio
16
Target: Knock-down furniture Coaster/Scott Living Furniture: Setup furniture
Costco: Setup furniture
Product portfolio
17
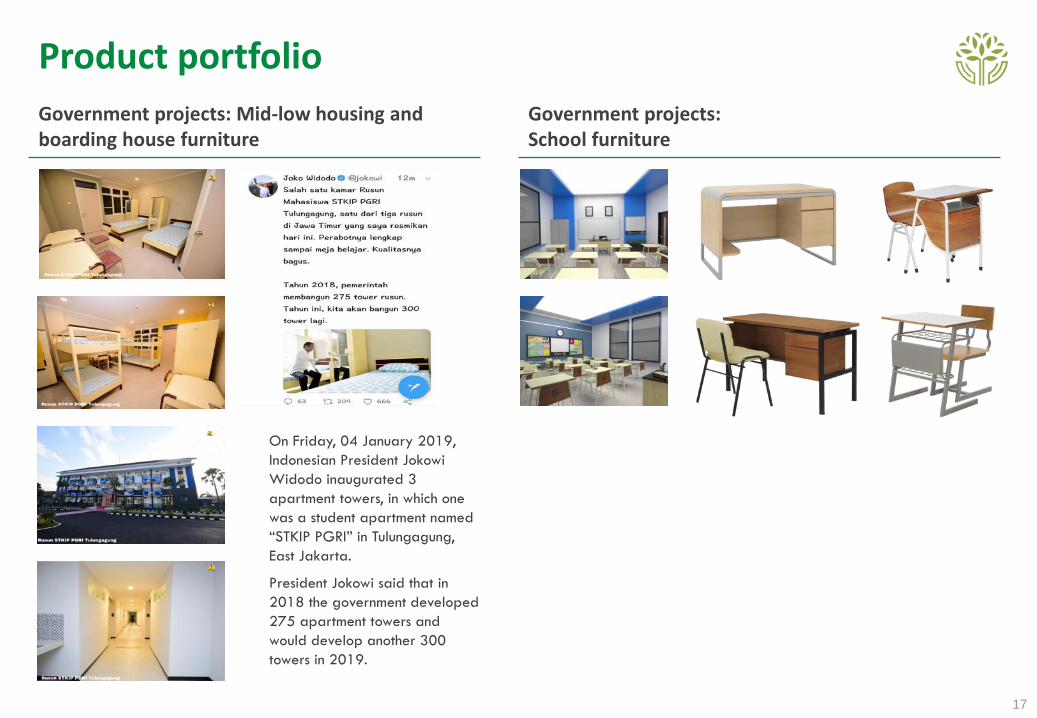
Government projects: Mid-low housing and boarding house furniture
On Friday, 04 January 2019,
Indonesian President Jokowi
Widodo inaugurated 3
apartment towers, in which one
was a student apartment named
“STKIP PGRI” in Tulungagung,
East Jakarta.
President Jokowi said that in
2018 the government developed
275 apartment towers and
would develop another 300
towers in 2019.
Government projects:School furniture
Product portfolio
18
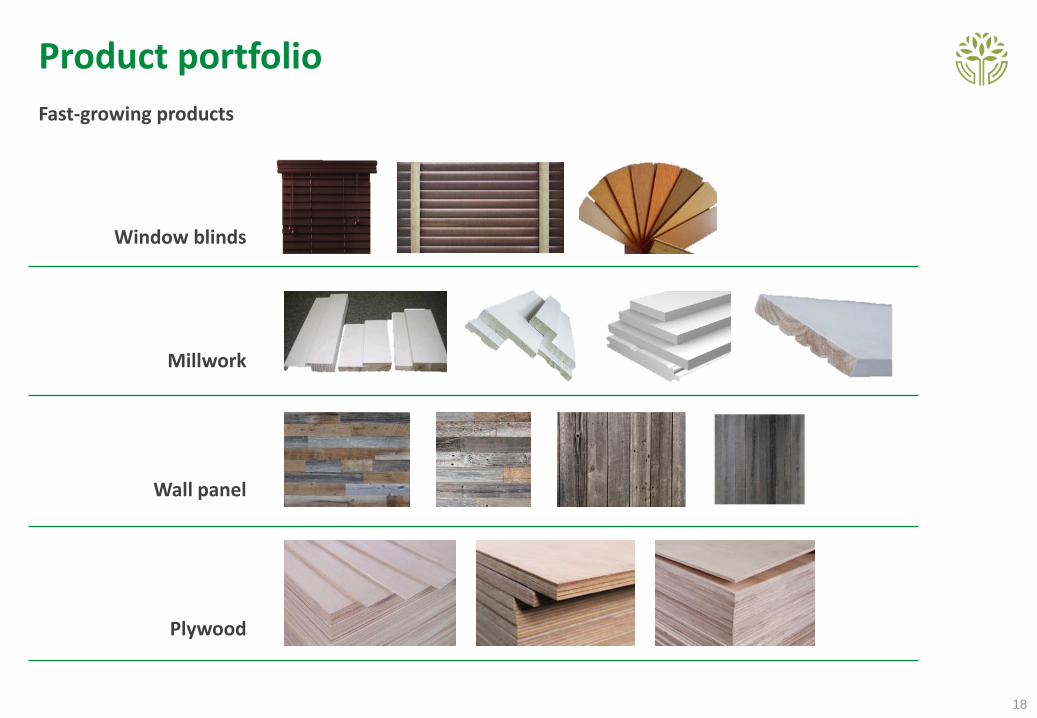
Fast-growing products
Window blinds
Millwork
Wall panel
Plywood
Vertically-integrated operations
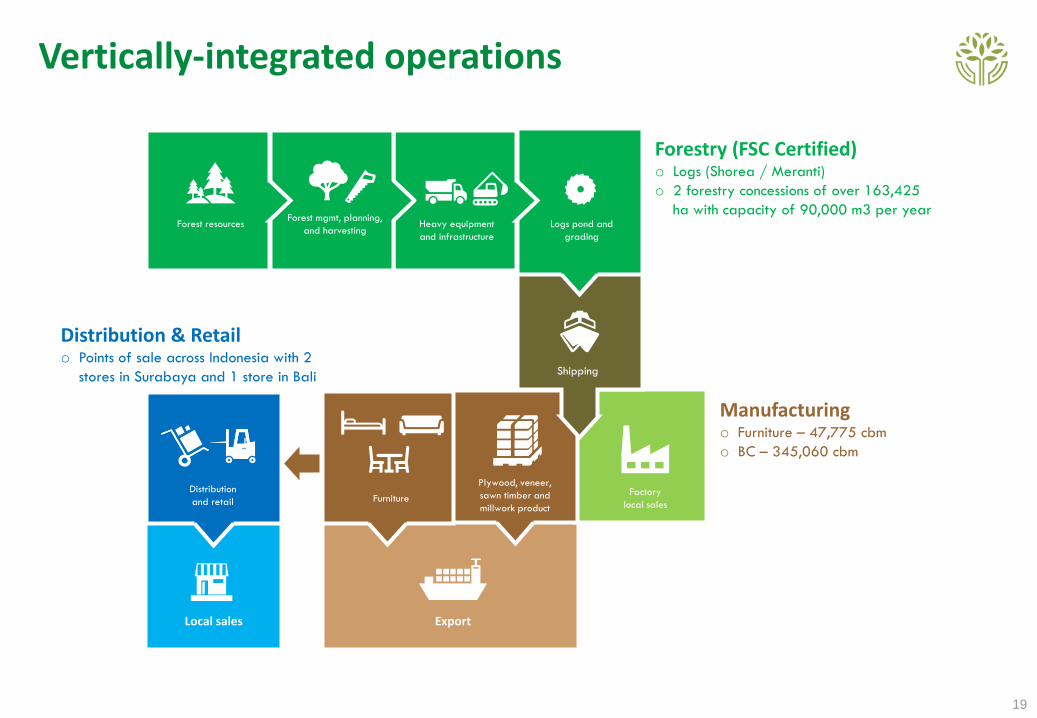
19
Forest resourcesForest mgmt, planning,
and harvestingHeavy equipment
and infrastructure
Logs pond and
grading
Shipping
Factory
local sales
Plywood, veneer,
sawn timber and
millwork productFurniture
Distribution
and retail
Forestry (FSC Certified)o Logs (Shorea / Meranti)
o 2 forestry concessions of over 163,425
ha with capacity of 90,000 m3 per year
Manufacturingo Furniture – 47,775 cbm
o BC – 345,060 cbm
Distribution & Retailo Points of sale across Indonesia with 2
stores in Surabaya and 1 store in Bali
Local sales Export

Value chain
20
Forestry Manufacturing
Log yard
Sawmill process
Wet sawn timber warehouse
Kiln dry process
Dry sawn timber warehouse
Dry sawn timber warehouse
Processing
Sanding
Assembling
Final sanding
Fully-assembledfurniture
Finishing
Packing
Finished goods warehouse
Customer
Dry sawn timber warehouse
Processing
Final sanding
Finishing
Packing
Knock downfurniture
Finished goods warehouse
Customer
Dry sawn timber warehouse
Processing
Packing
Finished goodswarehouse
Customer
Buildingcomponents
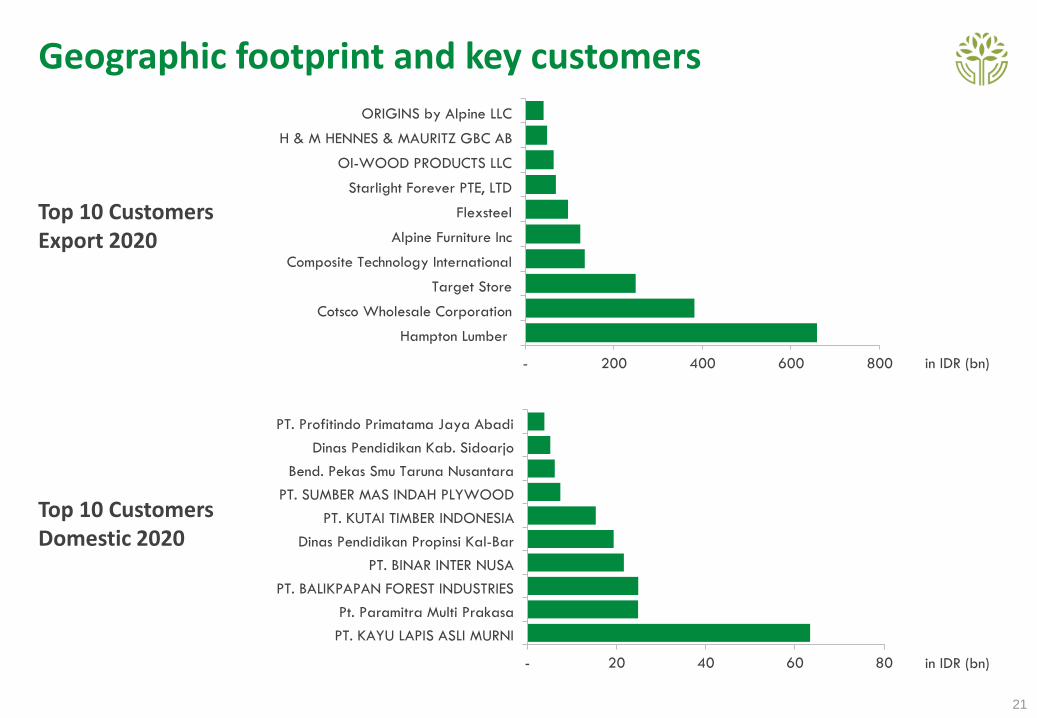
Geographic footprint and key customers
21
- 20 40 60 80
PT. KAYU LAPIS ASLI MURNI
Pt. Paramitra Multi Prakasa
PT. BALIKPAPAN FOREST INDUSTRIES
PT. BINAR INTER NUSA
Dinas Pendidikan Propinsi Kal-Bar
PT. KUTAI TIMBER INDONESIA
PT. SUMBER MAS INDAH PLYWOOD
Bend. Pekas Smu Taruna Nusantara
Dinas Pendidikan Kab. Sidoarjo
PT. Profitindo Primatama Jaya Abadi
- 200 400 600 800
Hampton Lumber
Cotsco Wholesale Corporation
Target Store
Composite Technology International
Alpine Furniture Inc
Flexsteel
Starlight Forever PTE, LTD
OI-WOOD PRODUCTS LLC
H & M HENNES & MAURITZ GBC AB
ORIGINS by Alpine LLC
Top 10 CustomersExport 2020
Top 10 CustomersDomestic 2020
in IDR (bn)
in IDR (bn)
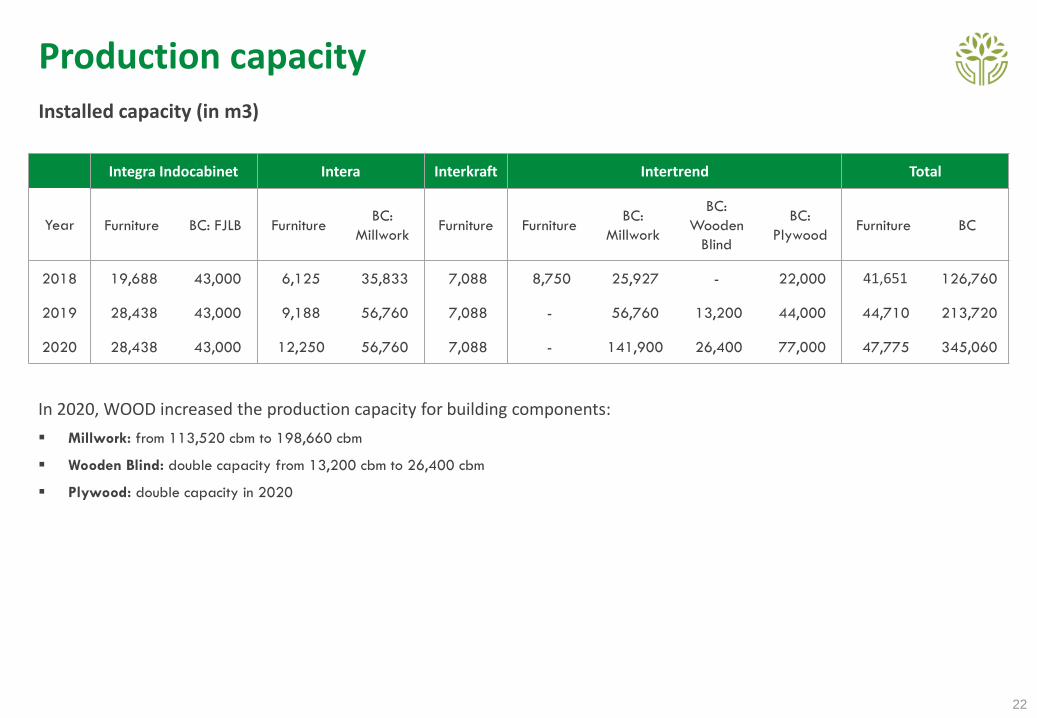
Production capacity
22
Integra Indocabinet Intera Interkraft Intertrend Total
Year Furniture BC: FJLB FurnitureBC:
MillworkFurniture Furniture
BC:
Millwork
BC:
Wooden
Blind
BC:
PlywoodFurniture BC
2018 19,688 43,000 6,125 35,833 7,088 8,750 25,927 - 22,000 41,651 126,760
2019 28,438 43,000 9,188 56,760 7,088 - 56,760 13,200 44,000 44,710 213,720
2020 28,438 43,000 12,250 56,760 7,088 - 141,900 26,400 77,000 47,775 345,060
In 2020, WOOD increased the production capacity for building components:
▪ Millwork: from 113,520 cbm to 198,660 cbm
▪ Wooden Blind: double capacity from 13,200 cbm to 26,400 cbm
▪ Plywood: double capacity in 2020
Installed capacity (in m3)
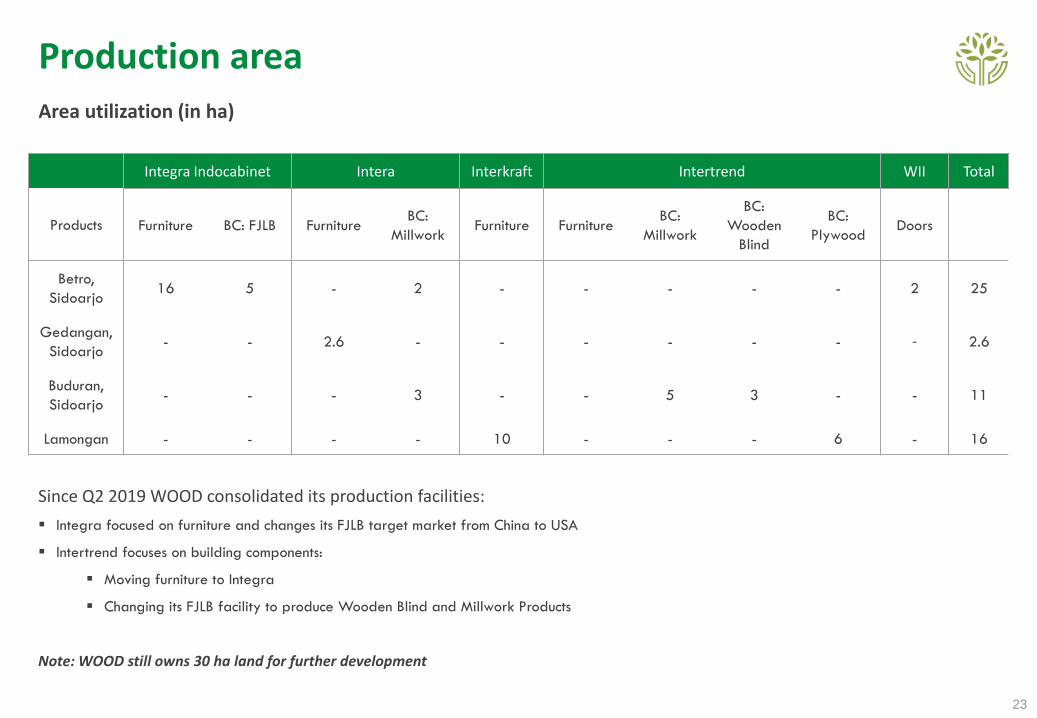
Production area
23
Since Q2 2019 WOOD consolidated its production facilities:
▪ Integra focused on furniture and changes its FJLB target market from China to USA
▪ Intertrend focuses on building components:
▪ Moving furniture to Integra
▪ Changing its FJLB facility to produce Wooden Blind and Millwork Products
Note: WOOD still owns 30 ha land for further development
Area utilization (in ha)
Integra Indocabinet Intera Interkraft Intertrend WII Total
Products Furniture BC: FJLB FurnitureBC:
MillworkFurniture Furniture
BC:
Millwork
BC:
Wooden
Blind
BC:
PlywoodDoors
Betro,
Sidoarjo16 5 - 2 - - - - - 2 25
Gedangan,
Sidoarjo- - 2.6 - - - - - - - 2.6
Buduran,
Sidoarjo- - - 3 - - 5 3 - - 11
Lamongan - - - - 10 - - - 6 - 16
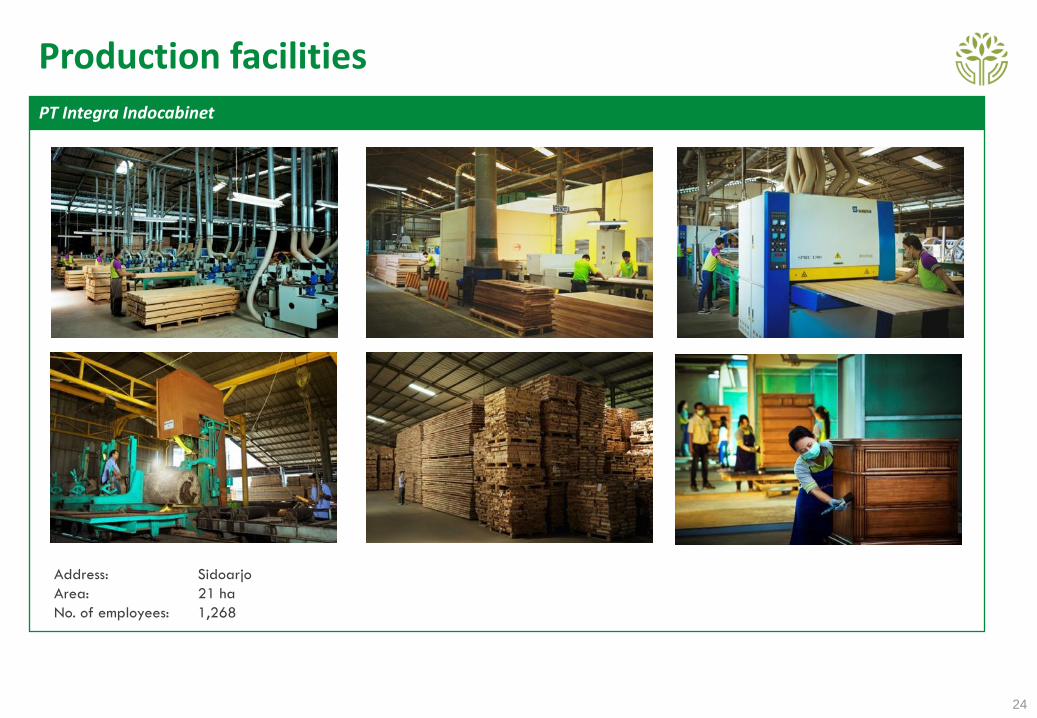
Production facilities
24
PT Integra Indocabinet
Address: Sidoarjo
Area: 21 ha
No. of employees: 1,268
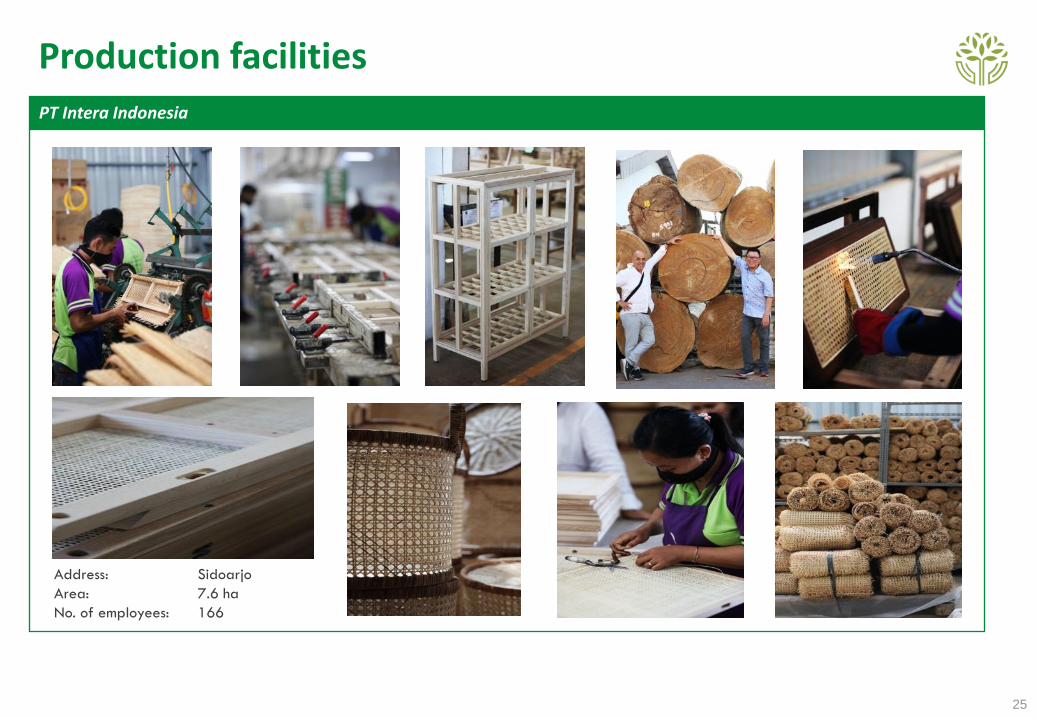
Production facilities
25
PT Intera Indonesia
Address: Sidoarjo
Area: 7.6 ha
No. of employees: 166
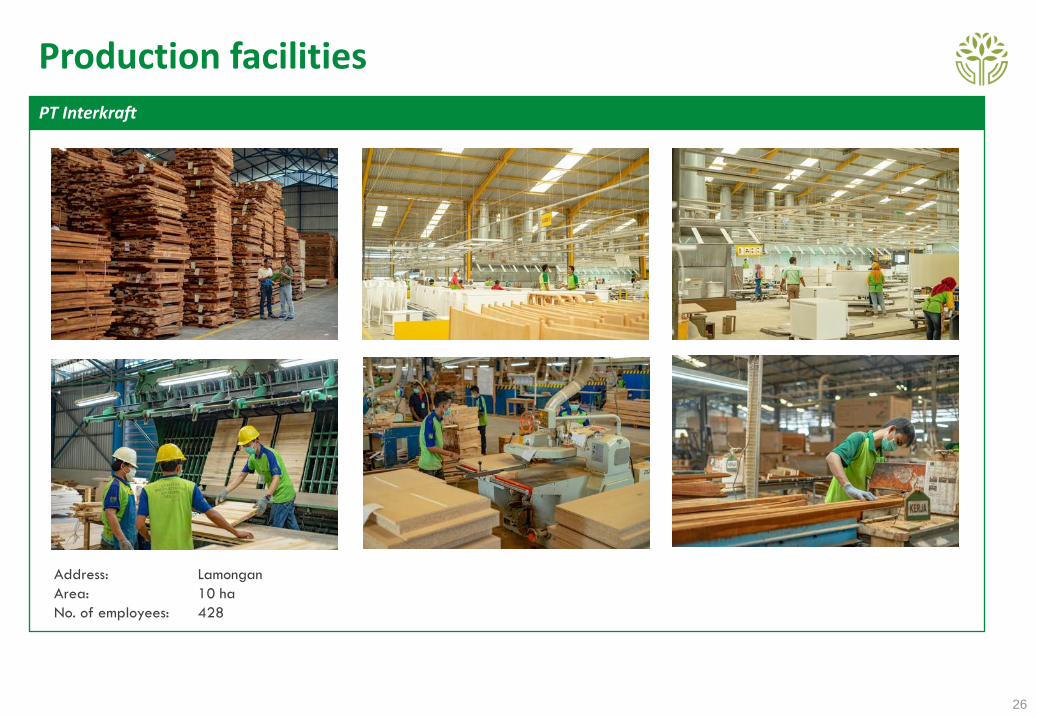
Production facilities
26
PT Interkraft
Address: Lamongan
Area: 10 ha
No. of employees: 428
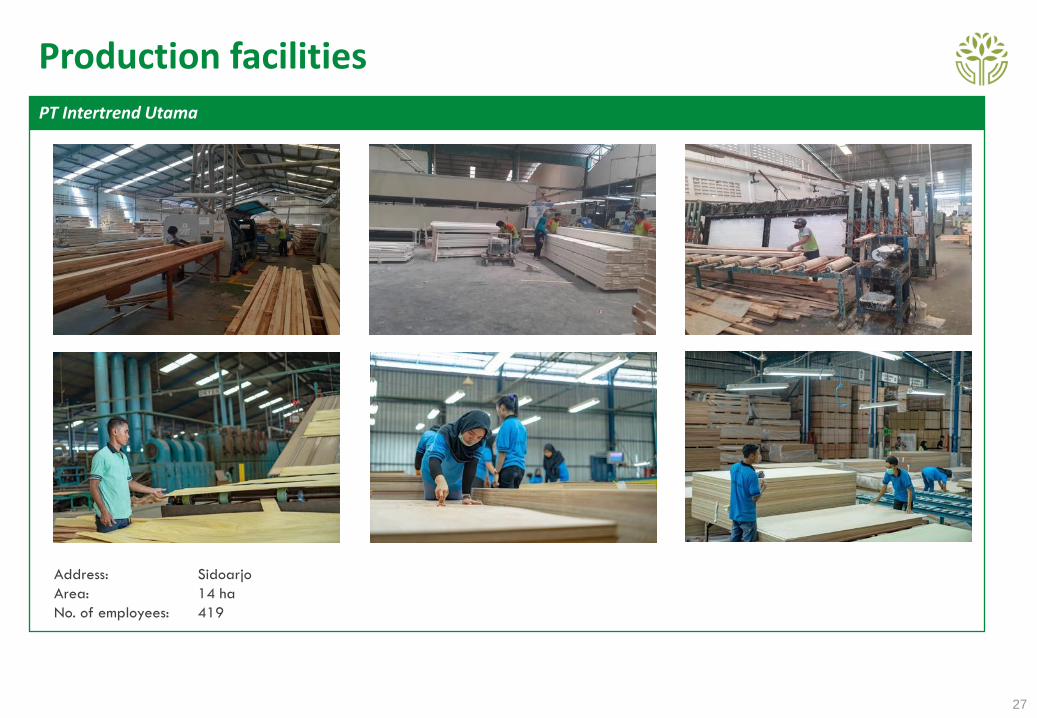
Production facilities
27
PT Intertrend Utama
Address: Sidoarjo
Area: 14 ha
No. of employees: 419
Impact of COVID-19
28
▪ Safety and prevention efforts to protect our employees, such as:
▪ Public service announcements on sanitation and general recommendation to
minimize contact and transmission
▪ Temperature checks upon entry
▪ Sanitation, protection and immune boosters
▪ Early social distancing training and implementation
▪ Employee rotation
▪ Operations remain normal as the Company has implemented safety and prevention
efforts earlier
▪ Business remains strong despite the pandemic as the US (the largest importer of
furniture and building components) shifted sourcing out of China (the largest
exporter) to alternative locations, benefiting our Company
▪ Sales continue to be robust as in 1H20 the Company recorded 16% YoY growth
Table of contents
29
Company profile
Investment case
Milestones
Corporate structure
Board of Commissioners
Board of Directors
Shareholder structure
Commitment to Minority Shareholders
Business model and growth strategy
Product portfolio
Vertically-integrated operations
Value chain
Geographic footprint and key customers
Production capacity, area, and facilities
Impact of COVID-19
UN Sustainable Development Goals
Preserving our environment
Nurturing our talent
Governance
Certifications and awards
COVID-19 safety and prevention measures
Opportunity in US protectionism
Opportunity in US and China tensions
Global furniture trading
Rising online home furnishing sales
Business outlook
IntroductionCorporate overview
Business overview
ESG, sustainability and safety
Growth drivers
Financial overview
Sales order update
Sales by segment
Seles by region
Financial highlights
Balance sheet
Capex and production capacity
Capital structure
Earnings guidance
UN Sustainable Development Goals
30
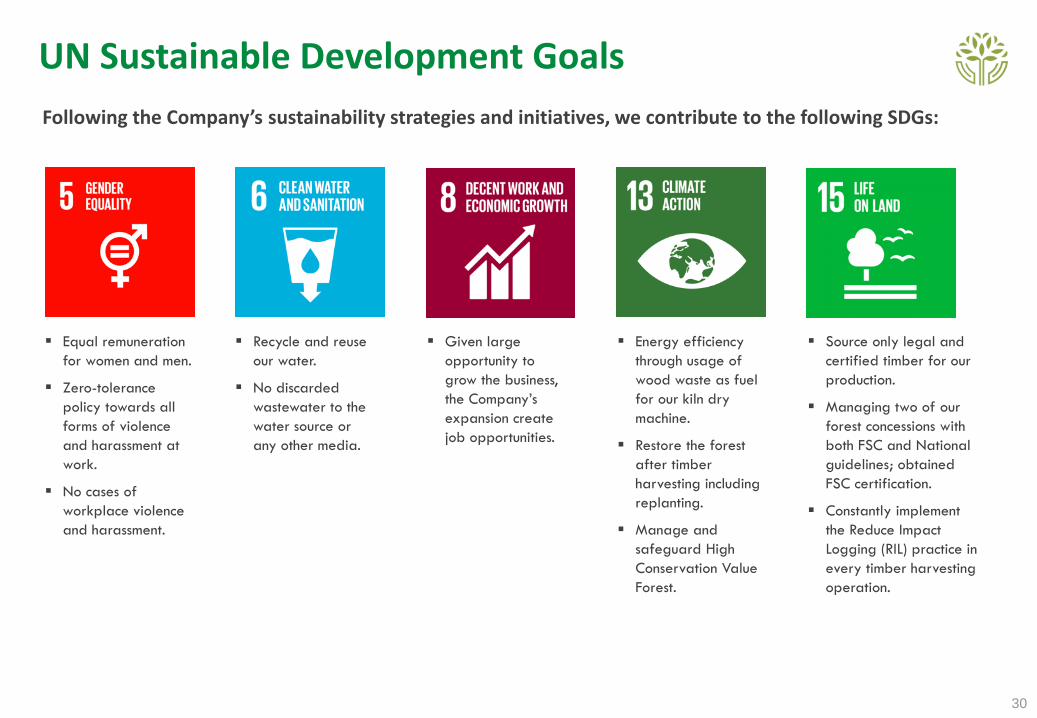
Following the Company’s sustainability strategies and initiatives, we contribute to the following SDGs:
▪ Equal remuneration
for women and men.
▪ Zero-tolerance
policy towards all
forms of violence
and harassment at
work.
▪ No cases of
workplace violence
and harassment.
▪ Recycle and reuse
our water.
▪ No discarded
wastewater to the
water source or
any other media.
▪ Given large
opportunity to
grow the business,
the Company’s
expansion create
job opportunities.
▪ Source only legal and
certified timber for our
production.
▪ Managing two of our
forest concessions with
both FSC and National
guidelines; obtained
FSC certification.
▪ Constantly implement
the Reduce Impact
Logging (RIL) practice in
every timber harvesting
operation.
▪ Energy efficiency
through usage of
wood waste as fuel
for our kiln dry
machine.
▪ Restore the forest
after timber
harvesting including
replanting.
▪ Manage and
safeguard High
Conservation Value
Forest.

Preserving our environment
31
Our core principle in managing two of our forest concessions is to conduct responsible tropical natural
management in line with both FSC and National guidelines to maintain our status as the well-managed
tropical natural forest. Hence, we obtained both FSC1 and SVLK (Indonesia’s National Timber Legality)
certifications. As we supply our end product mostly to international customers, and due to our
commitment to preserve the nature and source wood from more sustainable sources, we source only
legal and certified timber for our production. Our own forest concession supplies 30-50% of its
production to our manufacturing, while the rest of the timber is sourced from certified suppliers. As we
source our timber from certified internal forestry and third parties, PT Integra Indocabinet Tbk
obtained FSC2 Chain of Custody (COC) certification. The FSC COC gives credible assurance for
products with environmentally and socially responsible sources to access the market.
We have commitment in combatting illegal logging that leads to deforestation and protecting
biodiversity of the forested areas affected by our operations, particularly the supply chain of our raw
materials. Strongly holding on to our commitment, we constantly implement the Reduce Impact Logging
(RIL) practice in every timber harvesting operation. Our forestry company also conducts in-house
training for our team on RIL that cooperates with The Nature Conservancy, Tropical Forest Fund, and
Tropical Forest Foundation, and RIL-C activity that cooperates with Responsible Asia Forestry and
Timber Trade. Additionally, our forestry division strictly adheres to the duty and responsibility in
government regulations and FSC guidelines which covers replanting policy, community engagement,
community welfare, trees cutting guidelines and environmental assessment.
(1) FSC-C109061 & FSC-C007461(2) FSC-C129307
Sustainable sourcing
Preserving our environment
32
We believe climate change poses a threat to our planet and its impact has become more visible. At
Integra, we address this issue through energy efficiency by reducing energy usage. In our manufacturing
division, in line with our spirit to realize a zero-waste strategy, we use our raw materials and wood
waste such as sawdust and bark as fuel for our kiln dry machine. Moreover, we recycle and reuse our
water, hence there is no discarded wastewater to the water source or any other media.
As part of our effort to combat climate change, Integra also conducts forest development activity to
restore the forest after timber harvesting, which covers replanting on harvesting area and non-
productive area or empty land. Additionally, sustainable forest management with FSC guidelines
encourages the Company to manage High Conservation Value Forest and safeguard the protected
species in the Convention of International Trade in Endangered Species of Wild Fauna and Flora
(CITES) and follow the guidelines of the Convention on the Conservation of Biological Diversity (CBD)
and International Timber Agreement (ITTA).
Climate
Preserving our environment
33
Manufacturing
Water Management
Following our commitment to preserve the nature and reduce water use, we recycle our wastewater
and reuse it, hence there is no wastewater discarded to the environment. Concurrently, we also do
regular checks and tests of our drinking water and clean water against the minimum regulatory limit to
ensure health and safety of our workers and working environment.
Pollution Prevention
The Company is committed to obeying the environmental laws and regulations. The adherence is also
part of the code of conduct and ethics to be a supplier for international buyers. We regularly conduct
analytical testing of the air quality in our production facilities. By far, our test results show that the
ambient and emission air quality in our facilities is within regulatory limits.
The regulatory limits are based on: 1. Governor of East Java Regulation No.10/2009 for Ambient Air Standard Quality
2. Environment Minister Regulation No.13/2009 on The Quality of Source Emission Quality For Oil And Gas Activities
3. Minister of Manpower Regulation No.5/2018 on Health and Safety in Working Area
4. Health Minister Regulation No.31/2017 in Environmental Quality Standards For Environmental Health and Requirements Water Health
For Hygiene Sanitation Needs, Swimming Pool, Solus Per Aqua and General Bath
5. Minister of Health Regulation No. 492/MENKES/2010 in Drinking Water Standard Quality
Health & Safety
We place health & safety as our first priority to realize Zero Accident strategy in our working
environment. Moreover, to be a supplier for international buyers, providing healthy & safe working
environment at our production facilities is essential.
The occupational health & safety standards in the company are compliant with the relevant regulations
the Ministry of Manpower, Ministry of Health, and Ministry of Industry. Furthermore, the company
regularly conducts reviews and safety training for the employees.
Nurturing our talent
34
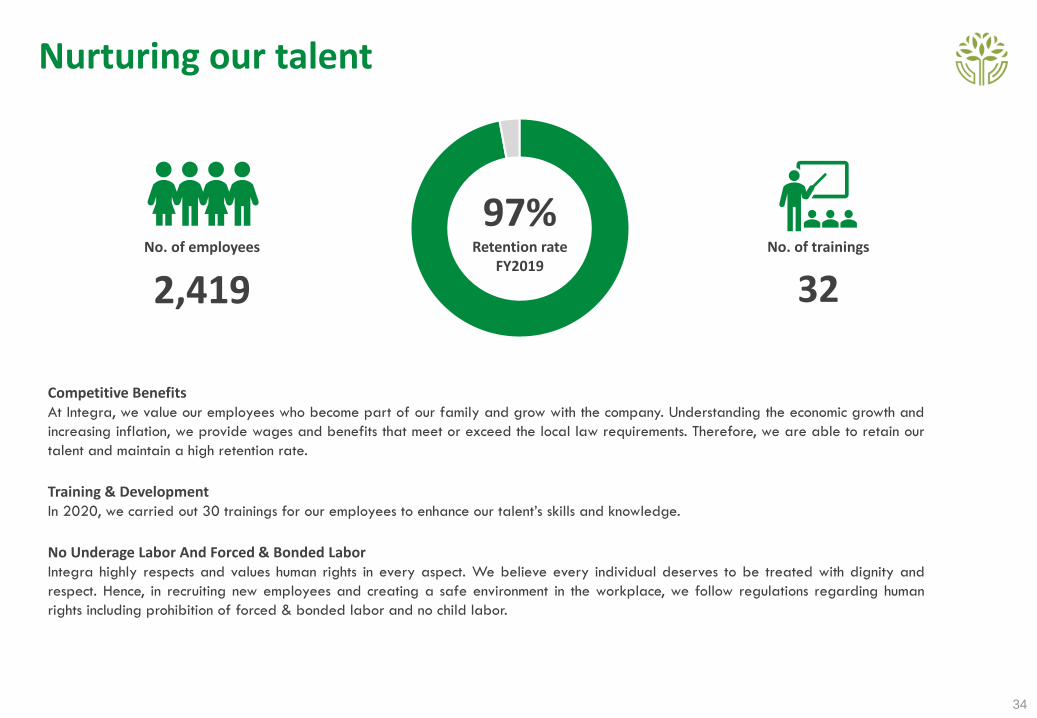
No. of employees
2,419
97%Retention rate
FY2019
32
Competitive BenefitsAt Integra, we value our employees who become part of our family and grow with the company. Understanding the economic growth and
increasing inflation, we provide wages and benefits that meet or exceed the local law requirements. Therefore, we are able to retain our
talent and maintain a high retention rate.
Training & DevelopmentIn 2020, we carried out 30 trainings for our employees to enhance our talent’s skills and knowledge.
No Underage Labor And Forced & Bonded LaborIntegra highly respects and values human rights in every aspect. We believe every individual deserves to be treated with dignity and
respect. Hence, in recruiting new employees and creating a safe environment in the workplace, we follow regulations regarding human
rights including prohibition of forced & bonded labor and no child labor.
No. of trainings
Governance
35
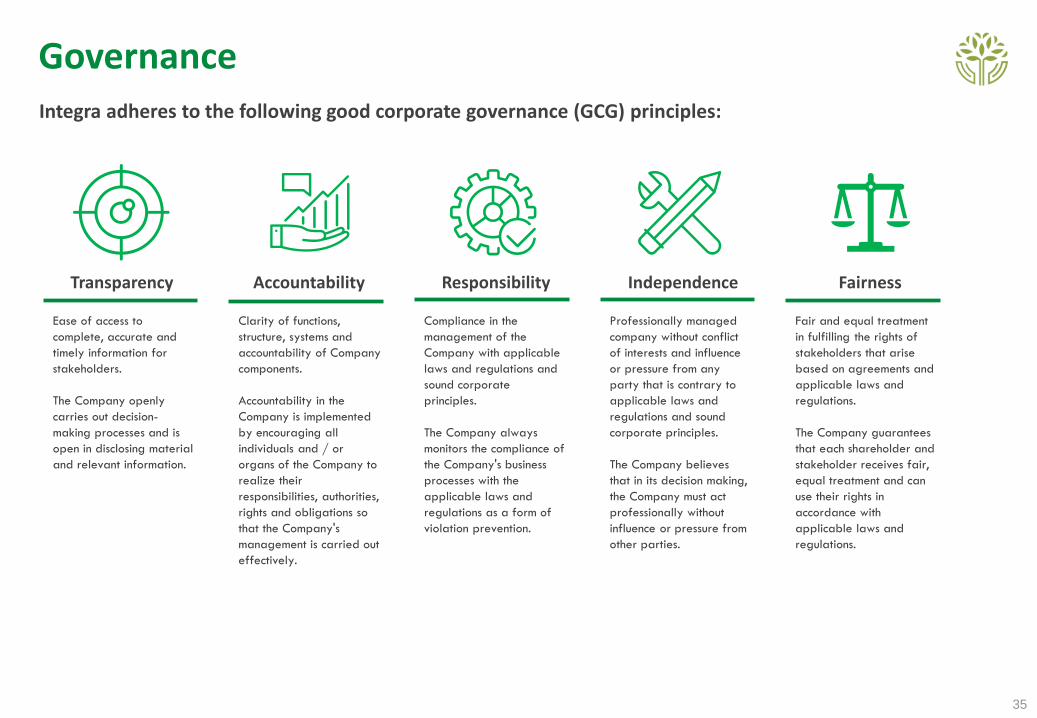
Transparency Accountability Responsibility Independence Fairness
Ease of access to
complete, accurate and
timely information for
stakeholders.
The Company openly
carries out decision-
making processes and is
open in disclosing material
and relevant information.
Clarity of functions,
structure, systems and
accountability of Company
components.
Accountability in the
Company is implemented
by encouraging all
individuals and / or
organs of the Company to
realize their
responsibilities, authorities,
rights and obligations so
that the Company's
management is carried out
effectively.
Compliance in the
management of the
Company with applicable
laws and regulations and
sound corporate
principles.
The Company always
monitors the compliance of
the Company's business
processes with the
applicable laws and
regulations as a form of
violation prevention.
Professionally managed
company without conflict
of interests and influence
or pressure from any
party that is contrary to
applicable laws and
regulations and sound
corporate principles.
The Company believes
that in its decision making,
the Company must act
professionally without
influence or pressure from
other parties.
Fair and equal treatment
in fulfilling the rights of
stakeholders that arise
based on agreements and
applicable laws and
regulations.
The Company guarantees
that each shareholder and
stakeholder receives fair,
equal treatment and can
use their rights in
accordance with
applicable laws and
regulations.
Integra adheres to the following good corporate governance (GCG) principles:
Governance
36
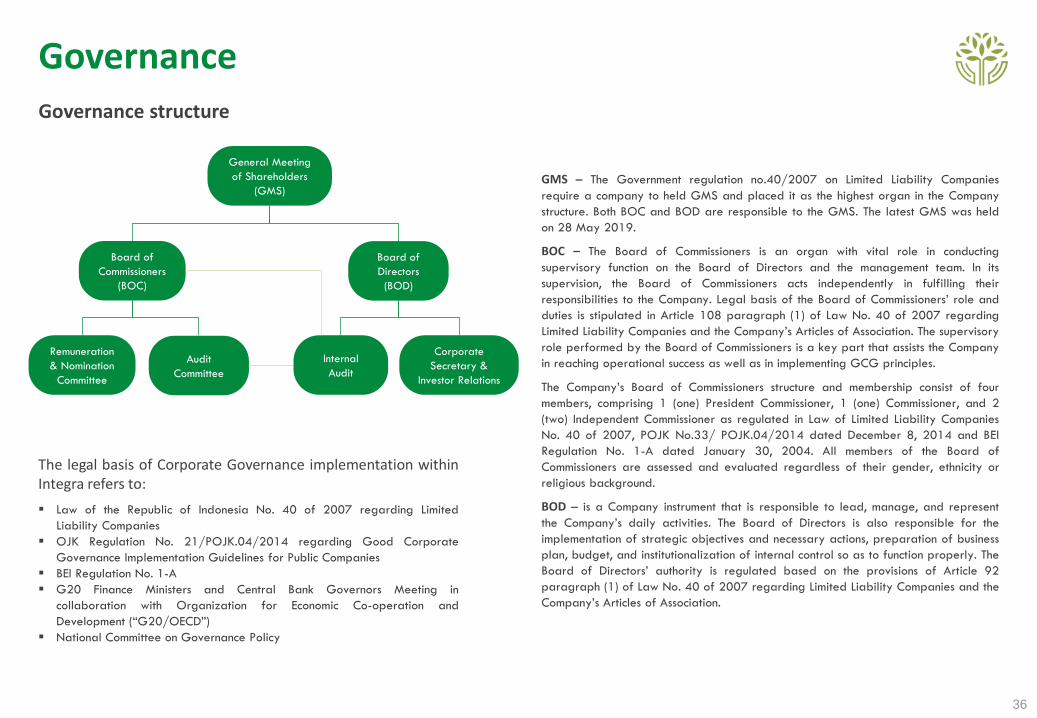
General Meeting
of Shareholders
(GMS)
Board of
Commissioners
(BOC)
Board of
Directors
(BOD)
Audit
Committee
Remuneration
& Nomination
Committee
Internal
Audit
Corporate
Secretary &
Investor Relations
The legal basis of Corporate Governance implementation withinIntegra refers to:
▪ Law of the Republic of Indonesia No. 40 of 2007 regarding Limited
Liability Companies
▪ OJK Regulation No. 21/POJK.04/2014 regarding Good Corporate
Governance Implementation Guidelines for Public Companies
▪ BEI Regulation No. 1-A
▪ G20 Finance Ministers and Central Bank Governors Meeting in
collaboration with Organization for Economic Co-operation and
Development (“G20/OECD”)
▪ National Committee on Governance Policy
Governance structure
GMS – The Government regulation no.40/2007 on Limited Liability Companies
require a company to held GMS and placed it as the highest organ in the Company
structure. Both BOC and BOD are responsible to the GMS. The latest GMS was held
on 28 May 2019.
BOC – The Board of Commissioners is an organ with vital role in conducting
supervisory function on the Board of Directors and the management team. In its
supervision, the Board of Commissioners acts independently in fulfilling their
responsibilities to the Company. Legal basis of the Board of Commissioners’ role and
duties is stipulated in Article 108 paragraph (1) of Law No. 40 of 2007 regarding
Limited Liability Companies and the Company’s Articles of Association. The supervisory
role performed by the Board of Commissioners is a key part that assists the Company
in reaching operational success as well as in implementing GCG principles.
The Company’s Board of Commissioners structure and membership consist of four
members, comprising 1 (one) President Commissioner, 1 (one) Commissioner, and 2
(two) Independent Commissioner as regulated in Law of Limited Liability Companies
No. 40 of 2007, POJK No.33/ POJK.04/2014 dated December 8, 2014 and BEI
Regulation No. 1-A dated January 30, 2004. All members of the Board of
Commissioners are assessed and evaluated regardless of their gender, ethnicity or
religious background.
BOD – is a Company instrument that is responsible to lead, manage, and represent
the Company’s daily activities. The Board of Directors is also responsible for the
implementation of strategic objectives and necessary actions, preparation of business
plan, budget, and institutionalization of internal control so as to function properly. The
Board of Directors’ authority is regulated based on the provisions of Article 92
paragraph (1) of Law No. 40 of 2007 regarding Limited Liability Companies and the
Company’s Articles of Association.

Governance
37
Whistleblowing policy
The violation reporting system or also known as the Whistleblowing System was established in order to encourage the employees to report
violations based on a reward system. The approach used by the Company to maintain management discipline aligns with the Company’s
intent to implement GCG in all organizational levels.
Reports regarding violations can be submitted through e-mail, complaint contact or any other media provided by the Company. The
Company guarantees the confidentiality of the reporter’s identity and provides guarantees for the protection of the reporter.
Certifications and awards
38
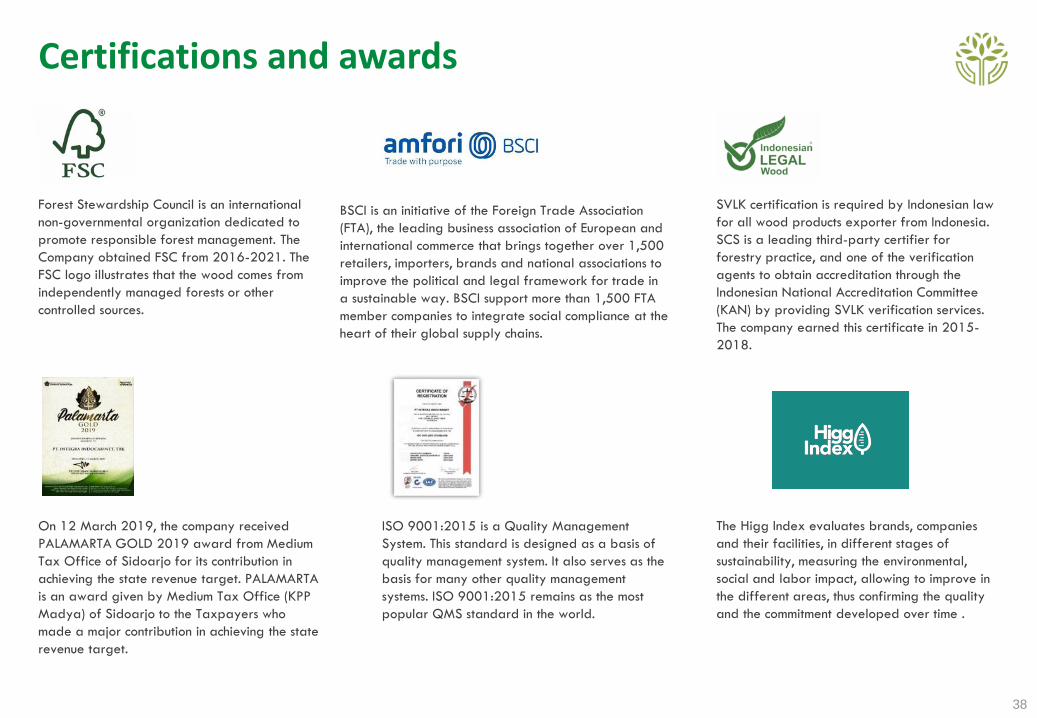
Forest Stewardship Council is an international
non-governmental organization dedicated to
promote responsible forest management. The
Company obtained FSC from 2016-2021. The
FSC logo illustrates that the wood comes from
independently managed forests or other
controlled sources.
BSCI is an initiative of the Foreign Trade Association
(FTA), the leading business association of European and
international commerce that brings together over 1,500
retailers, importers, brands and national associations to
improve the political and legal framework for trade in
a sustainable way. BSCI support more than 1,500 FTA
member companies to integrate social compliance at the
heart of their global supply chains.
SVLK certification is required by Indonesian law
for all wood products exporter from Indonesia.
SCS is a leading third-party certifier for
forestry practice, and one of the verification
agents to obtain accreditation through the
Indonesian National Accreditation Committee
(KAN) by providing SVLK verification services.
The company earned this certificate in 2015-
2018.
The Higg Index evaluates brands, companies
and their facilities, in different stages of
sustainability, measuring the environmental,
social and labor impact, allowing to improve in
the different areas, thus confirming the quality
and the commitment developed over time .
ISO 9001:2015 is a Quality Management
System. This standard is designed as a basis of
quality management system. It also serves as the
basis for many other quality management
systems. ISO 9001:2015 remains as the most
popular QMS standard in the world.
On 12 March 2019, the company received
PALAMARTA GOLD 2019 award from Medium
Tax Office of Sidoarjo for its contribution in
achieving the state revenue target. PALAMARTA
is an award given by Medium Tax Office (KPP
Madya) of Sidoarjo to the Taxpayers who
made a major contribution in achieving the state
revenue target.

COVID-19 safety and prevention efforts
39
Public services announcements Temperature checks upon entry
Sanitation, protection and immune boosters Social distancing training and implementation
PSAs are put on public & visible spaces to outline sanitation and general recommendations to minimize contact and transmission.
▪ Hand sanitizers are provided by the Company for each department and placed in every room and every communal space.
▪ Disinfectant sprays are place upon entry and sprayed on Company vicinity after office hours.
▪ Protective gear are always to be worn to minimize exposure in public areas.
▪ A bottle of herbal drink (concoction of ginger, clove and curcumin) are prepared for all staff and workers to promote a healthy and strong immune system.
▪ Education/training about social distancing are provided by management.
▪ In smaller teams, distance are added between office desks to minimize point of contact between employees.
▪ In larger teams, office attendance are rotated between employees, and coordination meetings are done regularly via Zoom, Skype, or WhatsApp.

Table of contents
40
Company profile
Investment case
Milestones
Corporate structure
Board of Commissioners
Board of Directors
Shareholder structure
Commitment to Minority Shareholders
Business model and growth strategy
Product portfolio
Vertically-integrated operations
Value chain
Geographic footprint and key customers
Production capacity, area, and facilities
Impact of COVID-19
UN Sustainable Development Goals
Preserving our environment
Nurturing our talent
Governance
Certifications and awards
COVID-19 safety and prevention measures
Opportunity in US protectionism
Opportunity in US and China tensions
Global furniture trading
Rising online home furnishing sales
Business outlook
IntroductionCorporate overview
Business overview
ESG, sustainability and safety
Growth drivers
Financial overview
Sales order update
Sales by segment
Seles by region
Financial highlights
Balance sheet
Capex and production capacity
Capital structure
Earnings guidance
Opportunity in US protectionism
41
In addition to US trade war tariffs implemented on imported Chinese products which started in 06 July 2018, China also faced additional anti-dumping
(AD) and anti-subsidy (CVD) duties that cause its products becoming less competitive compared to the other countries. Wood-based products such as
furniture and building components has been recently hit by the duties tariff which is much higher than the trade war tariff.
• On 16 February 2021, the US Commerce Department Issued the countervailing duty order on wood mouldings and millwork products (millwork
products) from China with the rate of 20.56% - 252.29% (21) and antidumping rate of 45.49% - 231.60% (22)
• On 02 October 2020, the U.S. Trade Representative initiated a Section 301 trade investigation on Vietnam regarding the alleged use of illegal
timber and other practices that may harm U.S. commerce and valuation of its currency (23, 24, 25)
• On 08 January 2020, The Coalition of American Millwork Producers (CAMP) filed antidumping (AD) petitions on imports of wood moldings and
millwork products from Brazil and China and a countervailing duty (CVD) petition on imports of wood moldings and millwork products from China
(1,2)
• On 17 April 2020, the USITC made its final determination in this investigation (3,4,5,6,7) where the China-wide entity anti-dumping duty is
262.2% and countervailing duty is 29.9%.
• As the result of tariff and duties implementation, China’s furniture exports to the US market declined significantly in 2019 by 35.9%, hence, giving
opportunities to other exporting countries to expand their market share in the US furniture import market (8)
• US Coalition for Fair Trade of Hardwood Plywood requested the US Department of Commerce to launch an anti-dumping and countervailing
investigation on hardwood plywood products from Vietnam (18, 19)
• In October 2017, the ITC had a hearing on imports of Chinese hardwood plywood and listened to the testimony of numerous US producers,
company executives, and members of Congress. The Department of Commerce made its final determinations against Chinese hardwood plywood
and set an anti-dumping duty of 183.6%, as well as countervailing duties ranging up to 194.9%.
• On 17 November 2004, the US Department of Commerce made a final determination that all Chinese enterprises involved in the export of
wooden bedroom furniture to the US will have a 5.1% ~ 198.1% anti-dumping rate. In 2019, there is no change to the rate for Chinese-wide
entities from the preliminary results. The existing rate for the Chinese-wide entities is 216.0%.
Opportunity in US protectionism
42
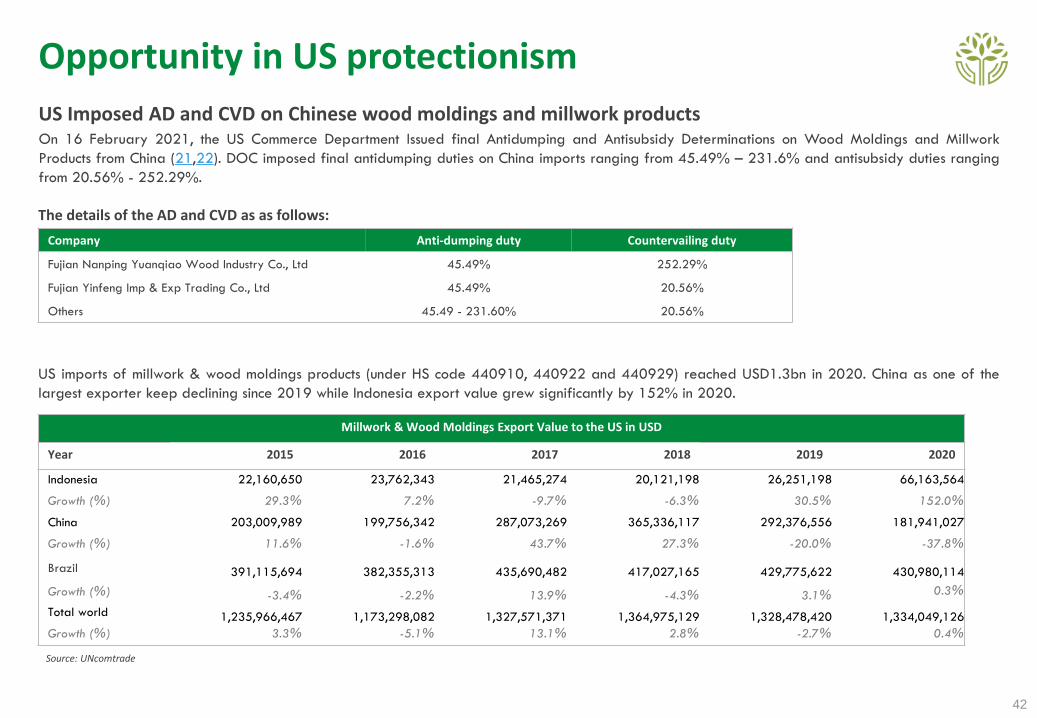
US Imposed AD and CVD on Chinese wood moldings and millwork productsOn 16 February 2021, the US Commerce Department Issued final Antidumping and Antisubsidy Determinations on Wood Moldings and Millwork
Products from China (21,22). DOC imposed final antidumping duties on China imports ranging from 45.49% – 231.6% and antisubsidy duties ranging
from 20.56% - 252.29%.
US imports of millwork & wood moldings products (under HS code 440910, 440922 and 440929) reached USD1.3bn in 2020. China as one of the
largest exporter keep declining since 2019 while Indonesia export value grew significantly by 152% in 2020.
Millwork & Wood Moldings Export Value to the US in USD
Year 2015 2016 2017 2018 2019 2020
Indonesia 22,160,650 23,762,343 21,465,274 20,121,198 26,251,198 66,163,564
Growth (%) 29.3% 7.2% -9.7% -6.3% 30.5% 152.0%
China 203,009,989 199,756,342 287,073,269 365,336,117 292,376,556 181,941,027
Growth (%) 11.6% -1.6% 43.7% 27.3% -20.0% -37.8%
Brazil 391,115,694 382,355,313 435,690,482 417,027,165 429,775,622 430,980,114
Growth (%) -3.4% -2.2% 13.9% -4.3% 3.1% 0.3%
Total world 1,235,966,467 1,173,298,082 1,327,571,371 1,364,975,129 1,328,478,420 1,334,049,126
Growth (%) 3.3% -5.1% 13.1% 2.8% -2.7% 0.4%
Source: UNcomtrade
Company Anti-dumping duty Countervailing duty
Fujian Nanping Yuanqiao Wood Industry Co., Ltd 45.49% 252.29%
Fujian Yinfeng Imp & Exp Trading Co., Ltd 45.49% 20.56%
Others 45.49 - 231.60% 20.56%
The details of the AD and CVD as as follows:
Opportunity in US protectionism
43
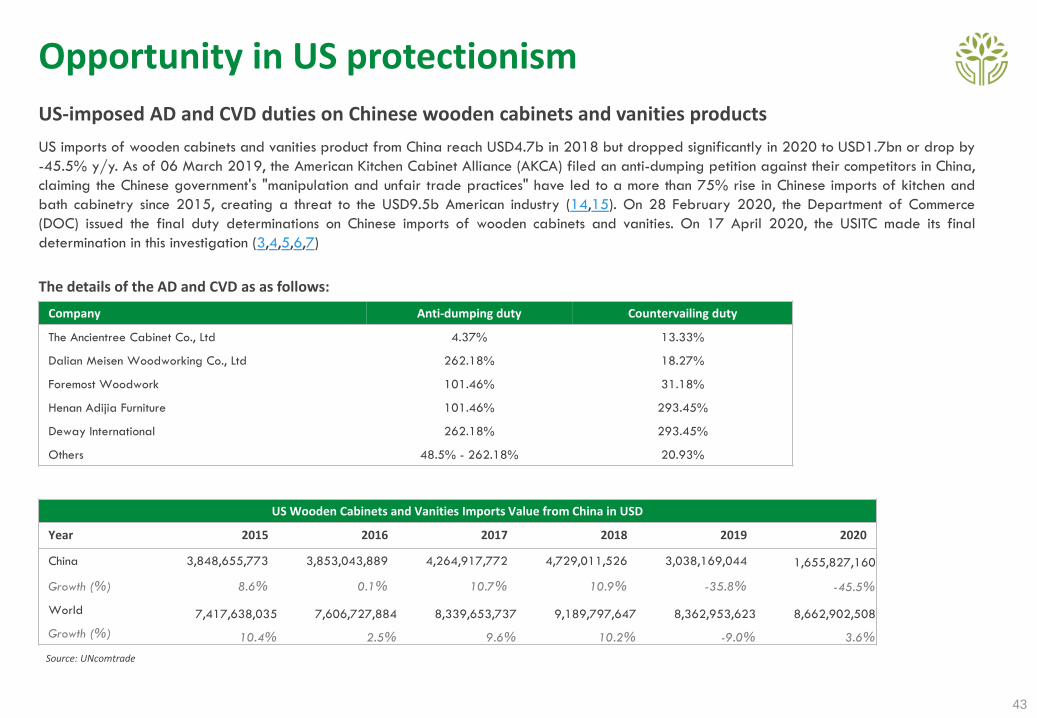
US-imposed AD and CVD duties on Chinese wooden cabinets and vanities products
US imports of wooden cabinets and vanities product from China reach USD4.7b in 2018 but dropped significantly in 2020 to USD1.7bn or drop by
-45.5% y/y. As of 06 March 2019, the American Kitchen Cabinet Alliance (AKCA) filed an anti-dumping petition against their competitors in China,
claiming the Chinese government's "manipulation and unfair trade practices" have led to a more than 75% rise in Chinese imports of kitchen and
bath cabinetry since 2015, creating a threat to the USD9.5b American industry (14,15). On 28 February 2020, the Department of Commerce
(DOC) issued the final duty determinations on Chinese imports of wooden cabinets and vanities. On 17 April 2020, the USITC made its final
determination in this investigation (3,4,5,6,7)
The details of the AD and CVD as as follows:
Company Anti-dumping duty Countervailing duty
The Ancientree Cabinet Co., Ltd 4.37% 13.33%
Dalian Meisen Woodworking Co., Ltd 262.18% 18.27%
Foremost Woodwork 101.46% 31.18%
Henan Adijia Furniture 101.46% 293.45%
Deway International 262.18% 293.45%
Others 48.5% - 262.18% 20.93%
US Wooden Cabinets and Vanities Imports Value from China in USD
Year 2015 2016 2017 2018 2019 2020
China 3,848,655,773 3,853,043,889 4,264,917,772 4,729,011,526 3,038,169,044 1,655,827,160
Growth (%) 8.6% 0.1% 10.7% 10.9% -35.8% -45.5%
World 7,417,638,035 7,606,727,884 8,339,653,737 9,189,797,647 8,362,953,623 8,662,902,508
Growth (%) 10.4% 2.5% 9.6% 10.2% -9.0% 3.6%
Source: UNcomtrade
Export tariff to US
44
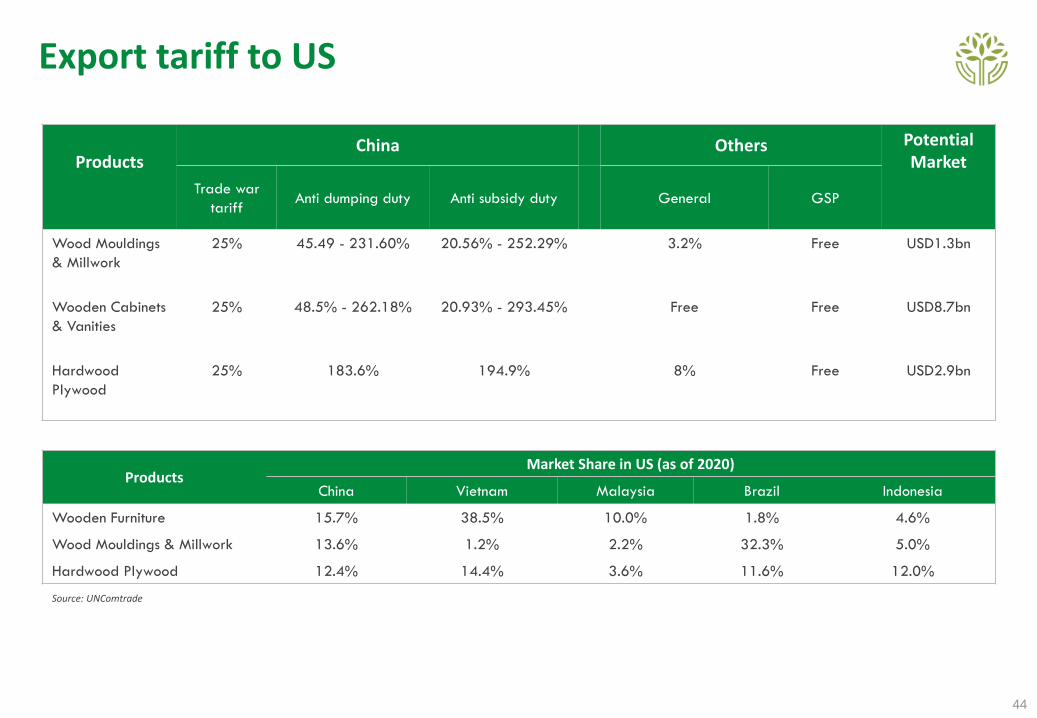
ProductsChina Others Potential
Market
Trade war
tariffAnti dumping duty Anti subsidy duty General GSP
Wood Mouldings
& Millwork
25% 45.49 - 231.60% 20.56% - 252.29% 3.2% Free USD1.3bn
Wooden Cabinets
& Vanities
25% 48.5% - 262.18% 20.93% - 293.45% Free Free USD8.7bn
Hardwood
Plywood
25% 183.6% 194.9% 8% Free USD2.9bn
ProductsMarket Share in US (as of 2020)
China Vietnam Malaysia Brazil Indonesia
Wooden Furniture 15.7% 38.5% 10.0% 1.8% 4.6%
Wood Mouldings & Millwork 13.6% 1.2% 2.2% 32.3% 5.0%
Hardwood Plywood 12.4% 14.4% 3.6% 11.6% 12.0%
Source: UNComtrade
Opportunity in US-China tensions
45
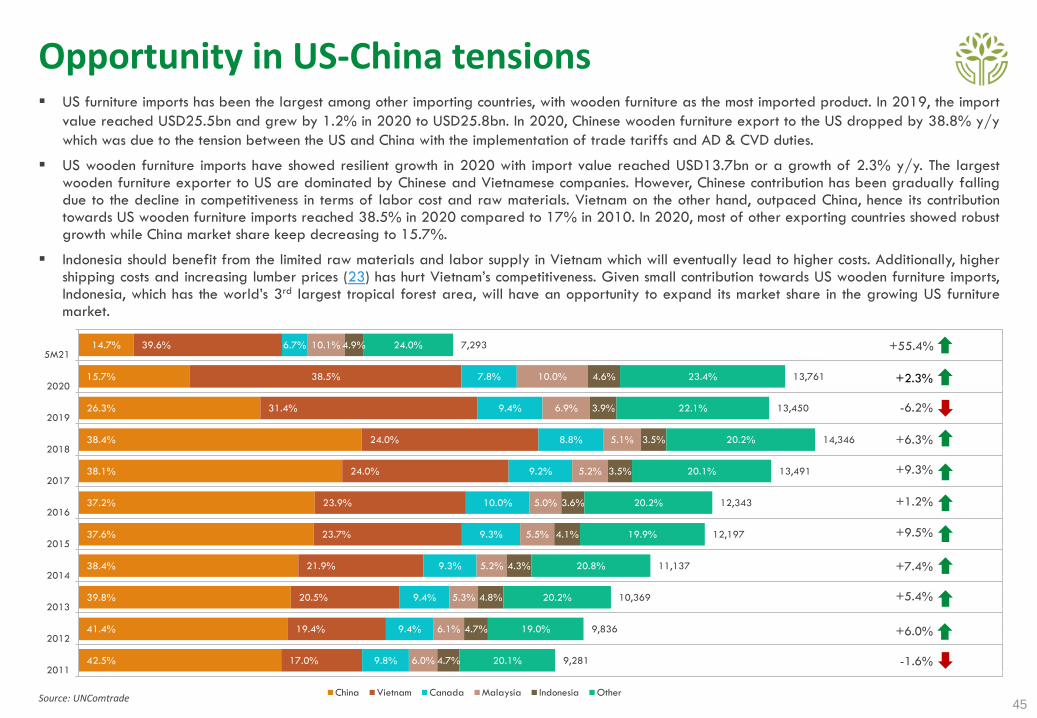
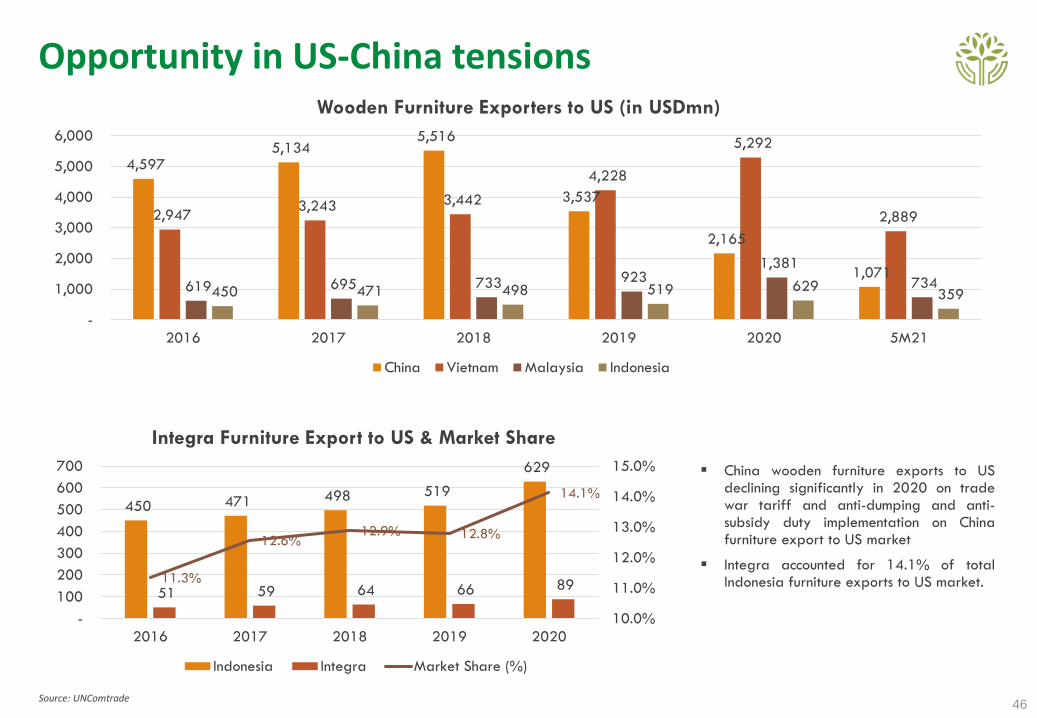
▪ US furniture imports has been the largest among other importing countries, with wooden furniture as the most imported product. In 2019, the import
value reached USD25.5bn and grew by 1.2% in 2020 to USD25.8bn. In 2020, Chinese wooden furniture export to the US dropped by 38.8% y/y
which was due to the tension between the US and China with the implementation of trade tariffs and AD & CVD duties.
▪ US wooden furniture imports have showed resilient growth in 2020 with import value reached USD13.7bn or a growth of 2.3% y/y. The largestwooden furniture exporter to US are dominated by Chinese and Vietnamese companies. However, Chinese contribution has been gradually fallingdue to the decline in competitiveness in terms of labor cost and raw materials. Vietnam on the other hand, outpaced China, hence its contributiontowards US wooden furniture imports reached 38.5% in 2020 compared to 17% in 2010. In 2020, most of other exporting countries showed robustgrowth while China market share keep decreasing to 15.7%.
▪ Indonesia should benefit from the limited raw materials and labor supply in Vietnam which will eventually lead to higher costs. Additionally, highershipping costs and increasing lumber prices (23) has hurt Vietnam’s competitiveness. Given small contribution towards US wooden furniture imports,Indonesia, which has the world’s 3rd largest tropical forest area, will have an opportunity to expand its market share in the growing US furnituremarket.
Source: UNComtrade
42.5%
41.4%
39.8%
38.4%
37.6%
37.2%
38.1%
38.4%
26.3%
15.7%
14.7%
17.0%
19.4%
20.5%
21.9%
23.7%
23.9%
24.0%
24.0%
31.4%
38.5%
39.6%
9.8%
9.4%
9.4%
9.3%
9.3%
10.0%
9.2%
8.8%
9.4%
7.8%
6.7%
6.0%
6.1%
5.3%
5.2%
5.5%
5.0%
5.2%
5.1%
6.9%
10.0%
10.1%
4.7%
4.7%
4.8%
4.3%
4.1%
3.6%
3.5%
3.5%
3.9%
4.6%
4.9%
20.1%
19.0%
20.2%
20.8%
19.9%
20.2%
20.1%
20.2%
22.1%
23.4%
24.0%
9,281
9,836
10,369
11,137
12,197
12,343
13,491
14,346
13,450
13,761
7,293
2011
2012
2013
2014
2015
2016
2017
2018
2019
2020
5M21
China Vietnam Canada Malaysia Indonesia Other
+55.4%
+2.3%
-6.2%
+6.3%
+9.3%
+1.2%
+9.5%
+7.4%
+5.4%
+6.0%
-1.6%
Opportunity in US-China tensions
46Source: UNComtrade
4,597 5,134
5,516
3,537
2,165
1,071
2,947 3,243 3,442
4,228
5,292
2,889
619 695 733 923 1,381
734 450 471 498 519 629
359
-
1,000
2,000
3,000
4,000
5,000
6,000
2016 2017 2018 2019 2020 5M21
Wooden Furniture Exporters to US (in USDmn)
China Vietnam Malaysia Indonesia
450 471 498 519
629
51 59 64 66 89 11.3%
12.6%12.9% 12.8%
14.1%
10.0%
11.0%
12.0%
13.0%
14.0%
15.0%
-
100
200
300
400
500
600
700
2016 2017 2018 2019 2020
Integra Furniture Export to US & Market Share
Indonesia Integra Market Share (%)
▪ China wooden furniture exports to USdeclining significantly in 2020 on tradewar tariff and anti-dumping and anti-subsidy duty implementation on Chinafurniture export to US market
▪ Integra accounted for 14.1% of totalIndonesia furniture exports to US market.
Global furniture trading
47
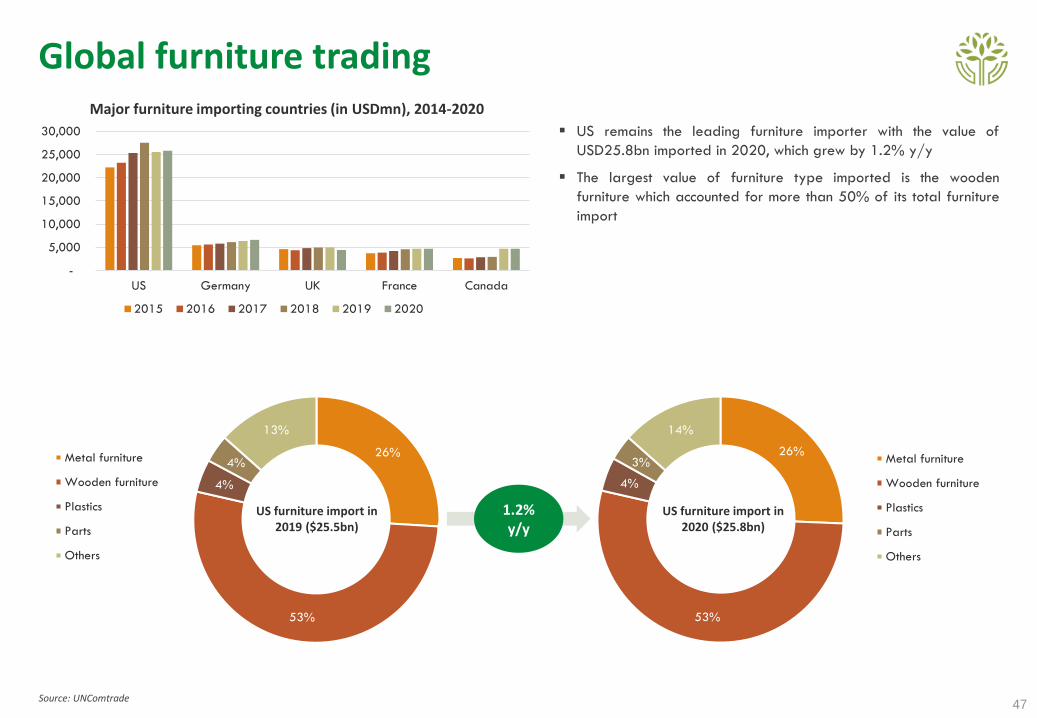
▪ US remains the leading furniture importer with the value of
USD25.8bn imported in 2020, which grew by 1.2% y/y
▪ The largest value of furniture type imported is the wooden
furniture which accounted for more than 50% of its total furniture
import
Source: UNComtrade
1.2% y/y
-
5,000
10,000
15,000
20,000
25,000
30,000
US Germany UK France Canada
Major furniture importing countries (in USDmn), 2014-2020
2015 2016 2017 2018 2019 2020
26%
53%
4%
4%
13%
Metal furniture
Wooden furniture
Plastics
Parts
Others
26%
53%
4%
3%
14%
Metal furniture
Wooden furniture
Plastics
Parts
Others
US furniture import in 2019 ($25.5bn)
US furniture import in 2020 ($25.8bn)
US Furniture Retail Sales
48
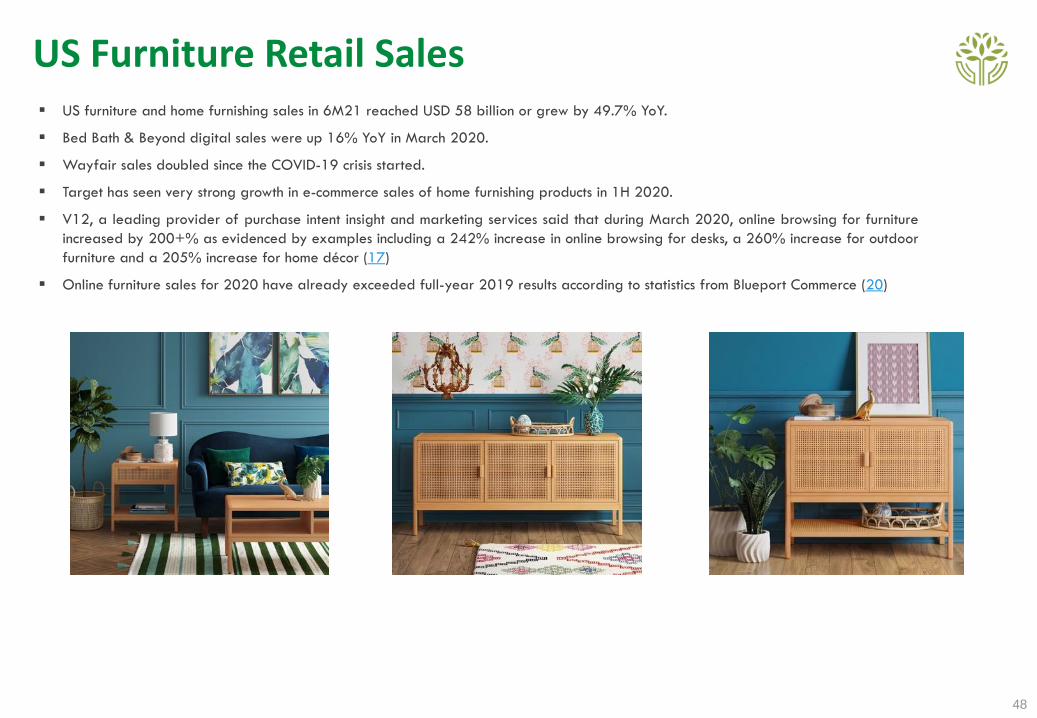
▪ US furniture and home furnishing sales in 6M21 reached USD 58 billion or grew by 49.7% YoY.
▪ Bed Bath & Beyond digital sales were up 16% YoY in March 2020.
▪ Wayfair sales doubled since the COVID-19 crisis started.
▪ Target has seen very strong growth in e-commerce sales of home furnishing products in 1H 2020.
▪ V12, a leading provider of purchase intent insight and marketing services said that during March 2020, online browsing for furniture
increased by 200+% as evidenced by examples including a 242% increase in online browsing for desks, a 260% increase for outdoor
furniture and a 205% increase for home décor (17)
▪ Online furniture sales for 2020 have already exceeded full-year 2019 results according to statistics from Blueport Commerce (20)
Business outlook
49
Integra will continue to benefit from:▪ Market expansion
▪ China and US tensions; implementation of tariffs, AD and CVD on Chinese exports (particularly wood-based products) to the US
and potentially other large exporting countries, such as Brazil and Vietnam; opportunity to take over the shrinking Chinese
market share in the US, particularly in the wooden furniture products space
▪ Limited resources of Vietnam in terms of raw materials and labor availability
▪ Favorable COVID-19 demand dynamics
Millwork/Molding production facility expansionSince 2019, the Company has kept increasing its millwork production capacity to satisfy the large demand from the US given the expected
significant drop in Chinese supply due to the implementation of AD and CVD.
Sustainable raw materialsIntegra only sources legally produced wood which is supported by its own FSC-certified forest concession.
Abundant supply of raw materialsThe Government of Indonesia has banned log exports to combat illegal logging, hence, the supply of wood as raw materials is abundant
with a stable price trend. This gives opportunity for the Company to expand its gross margin.
Strongly managed operations to ensure no negative impact from the ongoing pandemicThe company has practiced social distancing and conducted education drives regarding the safety and prevention measures against
COVID-19 even before the outbreak of the disease in Indonesia. Therefore, our operations have not been disrupted so far.
Table of contents
50
Company profile
Investment case
Milestones
Corporate structure
Board of Commissioners
Board of Directors
Shareholder structure
Commitment to Minority Shareholders
Business model and growth strategy
Product portfolio
Vertically-integrated operations
Value chain
Geographic footprint and key customers
Production capacity, area, and facilities
Impact of COVID-19
UN Sustainable Development Goals
Preserving our environment
Nurturing our talent
Governance
Certifications and awards
COVID-19 safety and prevention measures
Opportunity in US protectionism
Opportunity in US and China tensions
Global furniture trading
Rising online home furnishing sales
Business outlook
Sales order update
Sales by segment
Seles by region
Financial highlights
Balance sheet
Capex and production capacity
Capital structure
Earnings guidance
IntroductionCorporate overview
Business overview
ESG, sustainability and safety
Growth drivers
Financial overview
Sales order update (as of July 2021)
51
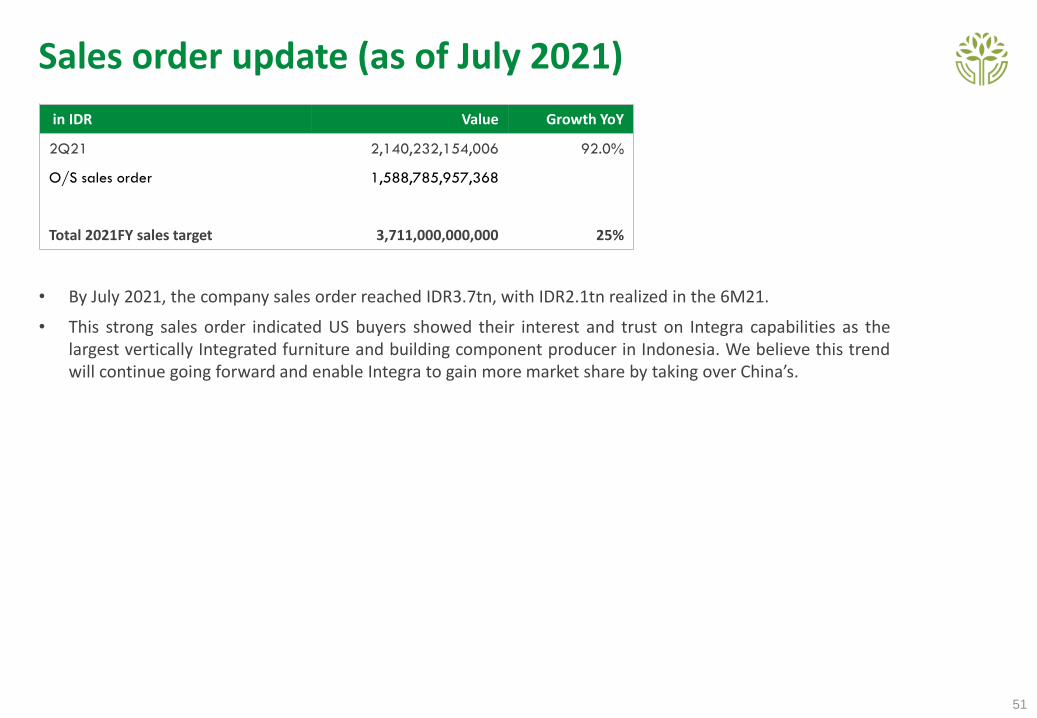
in IDR Value Growth YoY
2Q21 2,140,232,154,006 92.0%
O/S sales order 1,588,785,957,368
Total 2021FY sales target 3,711,000,000,000 25%
• By July 2021, the company sales order reached IDR3.7tn, with IDR2.1tn realized in the 6M21.
• This strong sales order indicated US buyers showed their interest and trust on Integra capabilities as thelargest vertically Integrated furniture and building component producer in Indonesia. We believe this trendwill continue going forward and enable Integra to gain more market share by taking over China’s.
52
Revenue Op. profit
Net profit
Highest 2Q21 Earnings Result
652
1,228
912
1,228
-
500
1,000
1,500
2Q20 2Q21 1Q21 2Q21
(IDRbn)
125
209 189
209
-
50
100
150
200
250
2Q20 2Q21 1Q21 2Q21
(IDRbn)
67.6% YoY
10.6% QoQ
56
120
102
120
-
50
100
150
2Q20 2Q21 1Q21 2Q21
(IDRbn)
88.4% YoY
34.7% QoQ
112.3% YoY
17.7% QoQ
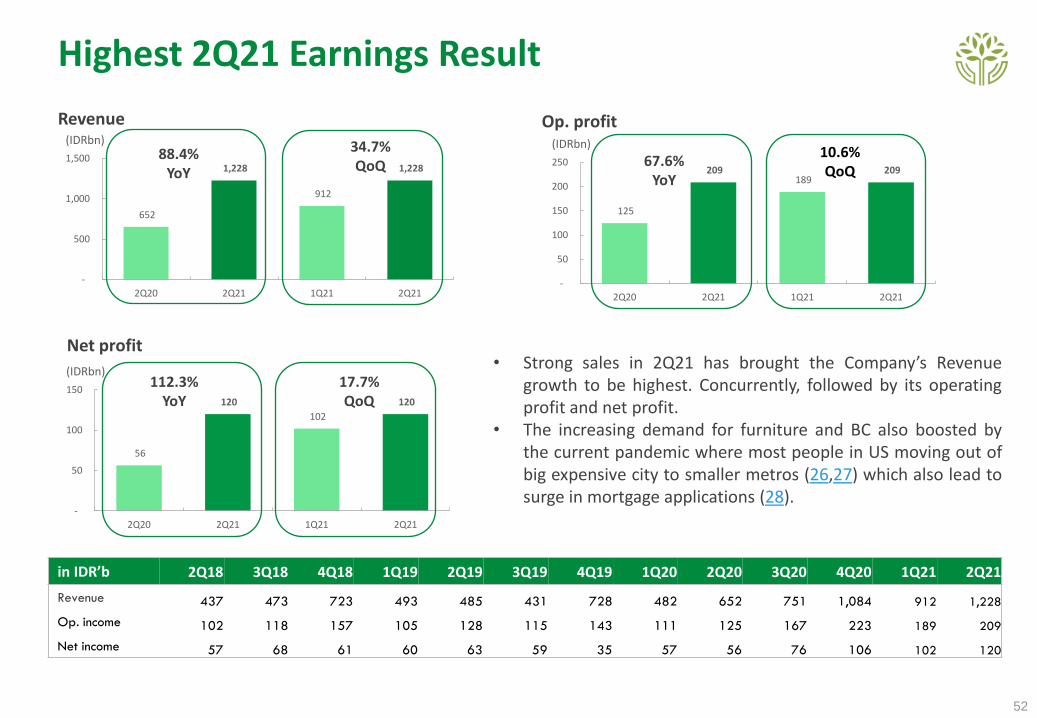
• Strong sales in 2Q21 has brought the Company’s Revenuegrowth to be highest. Concurrently, followed by its operatingprofit and net profit.
• The increasing demand for furniture and BC also boosted bythe current pandemic where most people in US moving out ofbig expensive city to smaller metros (26,27) which also lead tosurge in mortgage applications (28).
in IDR’b 2Q18 3Q18 4Q18 1Q19 2Q19 3Q19 4Q19 1Q20 2Q20 3Q20 4Q20 1Q21 2Q21
Revenue 437 473 723 493 485 431 728 482 652 751 1,084 912 1,228
Op. income 102 118 157 105 128 115 143 111 125 167 223 189 209
Net income 57 68 61 60 63 59 35 57 56 76 106 102 120

53
97.1%Manufacturing
(export)
0.4%Forestry
2.5%Manufacturing
(domestic)
1H21
in IDR 1H21 1H20 Growth
Manufacturing – export 2,078,309,043,263 969,056,132,501 114.5%
Manufacturing – domestic 53,995,156,650 62,326,317,725 -13.4%
Forestry 7,927,954,090 83,146,798,011 -90.5%
Total 2,140,232,154,003 1,114,529,248,237 92.0%
Our 1H21 export sales grew significantly by
114.5% YoY due to strong demand from the US
market. Meanwhile, domestic and forestry down
by -13.4% YoY and -90.5% YoY.
86.9%Manufacturing
(export)
7.5%Forestry
5.6%Manufacturing
(domestic)
1H20
Sales by segment 1H21 vs 1H20
Sales by segment FY20 VS FY19
54
66%Manufacturing
(export)
2%Retail and
distribution
66%Forestry
25%Manufacturing
(domestic)
2019
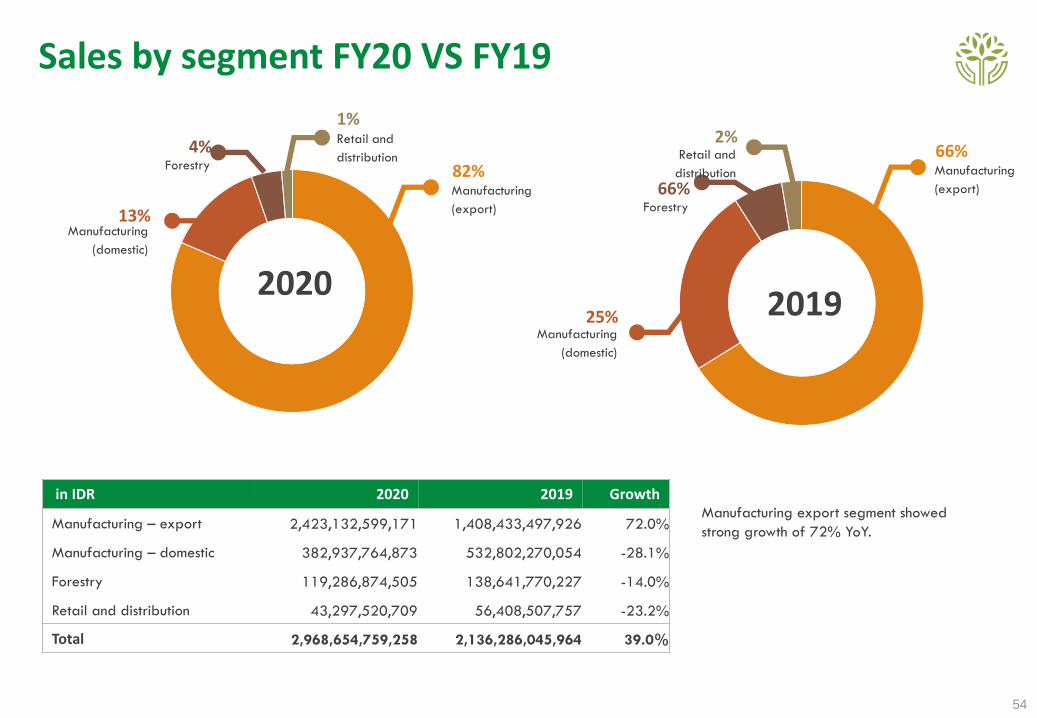
in IDR 2020 2019 Growth
Manufacturing – export 2,423,132,599,171 1,408,433,497,926 72.0%
Manufacturing – domestic 382,937,764,873 532,802,270,054 -28.1%
Forestry 119,286,874,505 138,641,770,227 -14.0%
Retail and distribution 43,297,520,709 56,408,507,757 -23.2%
Total 2,968,654,759,258 2,136,286,045,964 39.0%
Manufacturing export segment showed
strong growth of 72% YoY.
2020
82%Manufacturing
(export)
1%Retail and
distribution4%
Forestry
13%Manufacturing
(domestic)

Sales by region 1H21 vs 1H20
55
Sales by region as of 1H21, US sales showed strong
growth of 132.5% YoY. Concurrently, Europe sales
recover and grew by 29.8%. Meanwhile, Asia and
Indonesia sales down by -55.9% YoY and -57.4%
respectively.
77%
94%
7%
2%
3%
2%
13%
3%
0% 10% 20% 30% 40% 50% 60% 70% 80% 90% 100%
1H20
1H21
in IDR 1H21 1H20 Growth
America 2,004,003,615,462 861,793,672,636 132.5%
Asia 33,390,250,713 75,732,395,349 -55.9%
Europe 40,915,177,087 31,530,064,517 29.8%
Others - - -
Indonesia 61,923,110,743 145,473,115,736 -57.4%

Sales by region FY20 VS FY19
56
in IDR 2020 2019 Growth
America 2,196,919,994,012 1,120,908,444,133 96.0%
Asia 152,874,910,471 156,939,950,965 -2.6%
Europe 73,337,694,688 130,140,062,173 -43.6%
Others - 445,040,656 -100.0%
Indonesia 545,522,160,086 727,852,548,038 -25.1%
53%
74%
7%
5%
6%
2%
34%
18%
0% 10% 20% 30% 40% 50% 60% 70% 80% 90% 100%
2019
2020
US sales showed strong growth of 96% y/y, while other
regions dropped
Financial highlights
57
in IDR’b 2016 2017 2018 2019 2020 1H20 1H21
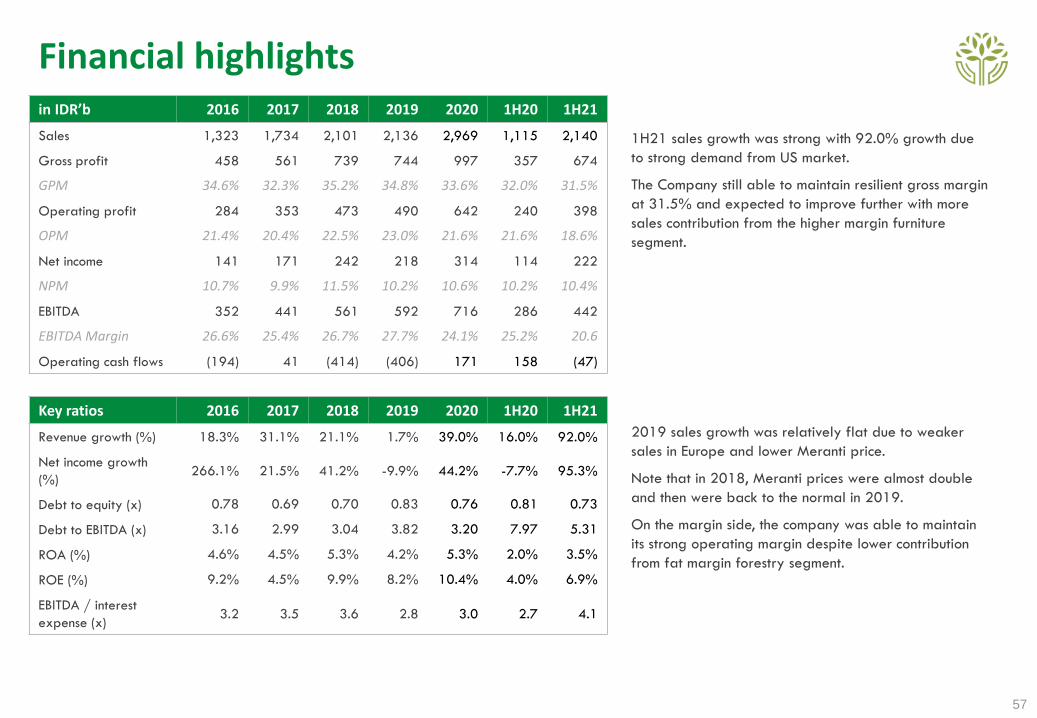
Sales 1,323 1,734 2,101 2,136 2,969 1,115 2,140
Gross profit 458 561 739 744 997 357 674
GPM 34.6% 32.3% 35.2% 34.8% 33.6% 32.0% 31.5%
Operating profit 284 353 473 490 642 240 398
OPM 21.4% 20.4% 22.5% 23.0% 21.6% 21.6% 18.6%
Net income 141 171 242 218 314 114 222
NPM 10.7% 9.9% 11.5% 10.2% 10.6% 10.2% 10.4%
EBITDA 352 441 561 592 716 286 442
EBITDA Margin 26.6% 25.4% 26.7% 27.7% 24.1% 25.2% 20.6
Operating cash flows (194) 41 (414) (406) 171 158 (47)
Key ratios 2016 2017 2018 2019 2020 1H20 1H21
Revenue growth (%) 18.3% 31.1% 21.1% 1.7% 39.0% 16.0% 92.0%
Net income growth
(%)266.1% 21.5% 41.2% -9.9% 44.2% -7.7% 95.3%
Debt to equity (x) 0.78 0.69 0.70 0.83 0.76 0.81 0.73
Debt to EBITDA (x) 3.16 2.99 3.04 3.82 3.20 7.97 5.31
ROA (%) 4.6% 4.5% 5.3% 4.2% 5.3% 2.0% 3.5%
ROE (%) 9.2% 4.5% 9.9% 8.2% 10.4% 4.0% 6.9%
EBITDA / interest
expense (x)3.2 3.5 3.6 2.8 3.0 2.7 4.1
2019 sales growth was relatively flat due to weaker
sales in Europe and lower Meranti price.
Note that in 2018, Meranti prices were almost double
and then were back to the normal in 2019.
On the margin side, the company was able to maintain
its strong operating margin despite lower contribution
from fat margin forestry segment.
1H21 sales growth was strong with 92.0% growth due
to strong demand from US market.
The Company still able to maintain resilient gross margin
at 31.5% and expected to improve further with more
sales contribution from the higher margin furniture
segment.
Balance sheet
58
in IDR’b 2016 2017 2018 2019 2020 1H21
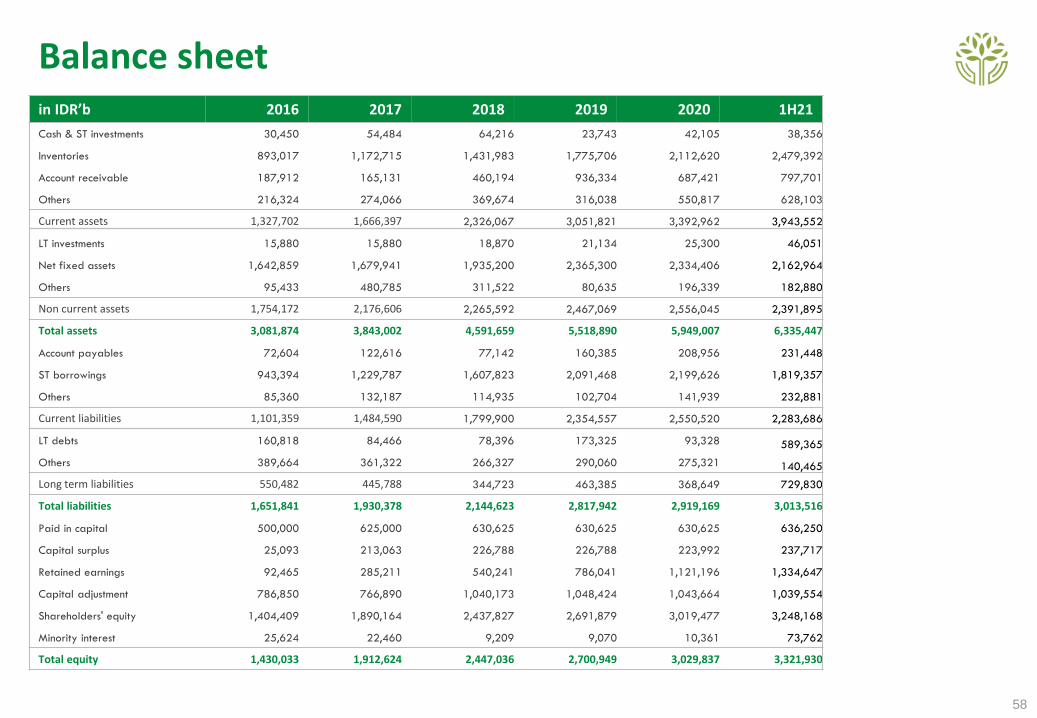
Cash & ST investments 30,450 54,484 64,216 23,743 42,105 38,356
Inventories 893,017 1,172,715 1,431,983 1,775,706 2,112,620 2,479,392
Account receivable 187,912 165,131 460,194 936,334 687,421 797,701
Others 216,324 274,066 369,674 316,038 550,817 628,103
Current assets 1,327,702 1,666,397 2,326,067 3,051,821 3,392,962 3,943,552
LT investments 15,880 15,880 18,870 21,134 25,300 46,051
Net fixed assets 1,642,859 1,679,941 1,935,200 2,365,300 2,334,406 2,162,964
Others 95,433 480,785 311,522 80,635 196,339 182,880
Non current assets 1,754,172 2,176,606 2,265,592 2,467,069 2,556,045 2,391,895
Total assets 3,081,874 3,843,002 4,591,659 5,518,890 5,949,007 6,335,447
Account payables 72,604 122,616 77,142 160,385 208,956 231,448
ST borrowings 943,394 1,229,787 1,607,823 2,091,468 2,199,626 1,819,357
Others 85,360 132,187 114,935 102,704 141,939 232,881
Current liabilities 1,101,359 1,484,590 1,799,900 2,354,557 2,550,520 2,283,686
LT debts 160,818 84,466 78,396 173,325 93,328 589,365
Others 389,664 361,322 266,327 290,060 275,321 140,465
Long term liabilities 550,482 445,788 344,723 463,385 368,649 729,830
Total liabilities 1,651,841 1,930,378 2,144,623 2,817,942 2,919,169 3,013,516
Paid in capital 500,000 625,000 630,625 630,625 630,625 636,250
Capital surplus 25,093 213,063 226,788 226,788 223,992 237,717
Retained earnings 92,465 285,211 540,241 786,041 1,121,196 1,334,647
Capital adjustment 786,850 766,890 1,040,173 1,048,424 1,043,664 1,039,554
Shareholders' equity 1,404,409 1,890,164 2,437,827 2,691,879 3,019,477 3,248,168
Minority interest 25,624 22,460 9,209 9,070 10,361 73,762
Total equity 1,430,033 1,912,624 2,447,036 2,700,949 3,029,837 3,321,930

Capex and production capacity
59
Capex (IDR’m) FY 2017 FY 2018 FY 2019 FY 2020
Manufacturing 115,811 85% 201,382 97% 270,633 98.8% 95,763 99.5%
Forestry 15,263 11% 5,675 2% 813 0.3% 42 0.0%
Commerce 4,580 3% 5,273 1% 2,385 0.9% 401 0.4%
Total 135,654 212,330 273,831 96,206
Advances 269,443 285,548 221,270 83,499
Production capacity FY 2017 FY 2018 FY 2019 FY 2020
Furniture (m3)
Installed capacity 38,106 41,650 44,710 47,775
Net increase in capacity 3,063 3,544 3,060 3,065
Production volume 25,116 27,518 29,678 30,246
Capacity utilization 66% 66% 66.4% 67.6%
Building component (m3)
Installed capacity 129,238 126,760 213,720 345,060
Net increase in capacity - (2,477) 86,960 131,340
Production volume 85,260 75,156 91,463 164,270
Capacity utilization 66% 58% 42.8% 47.6%
Capital structure
60
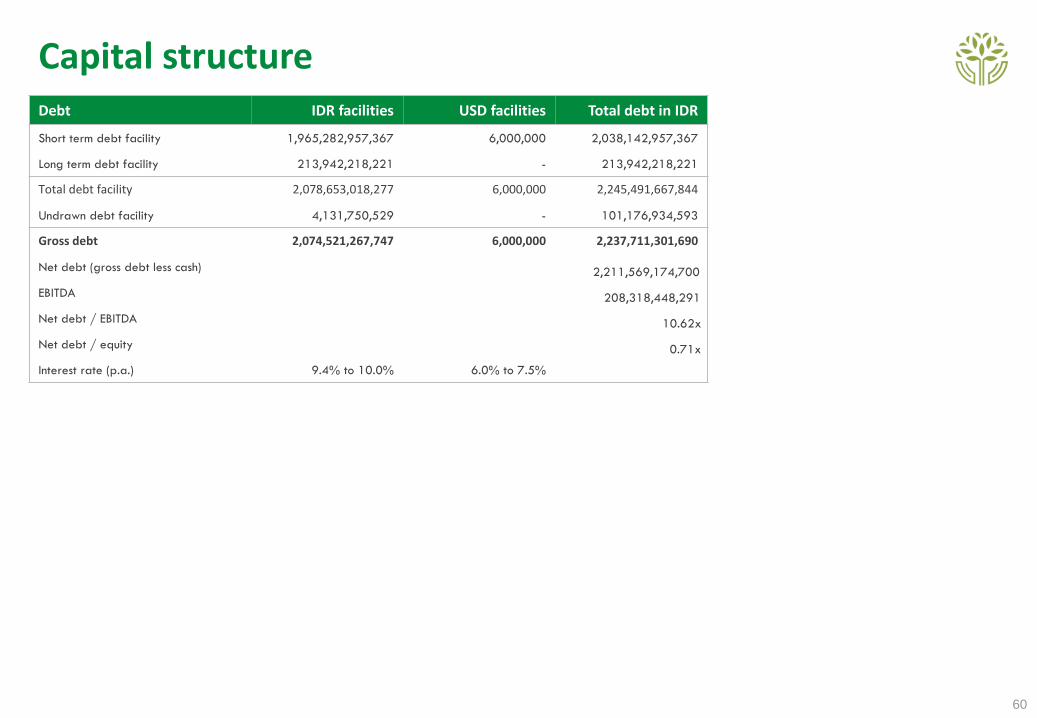
Debt IDR facilities USD facilities Total debt in IDR
Short term debt facility 1,965,282,957,367 6,000,000 2,038,142,957,367
Long term debt facility 213,942,218,221 - 213,942,218,221
Total debt facility 2,078,653,018,277 6,000,000 2,245,491,667,844
Undrawn debt facility 4,131,750,529 - 101,176,934,593
Gross debt 2,074,521,267,747 6,000,000 2,237,711,301,690
Net debt (gross debt less cash) 2,211,569,174,700
EBITDA 208,318,448,291
Net debt / EBITDA 10.62x
Net debt / equity 0.71x
Interest rate (p.a.) 9.4% to 10.0% 6.0% to 7.5%
2021 Earnings guidance
61
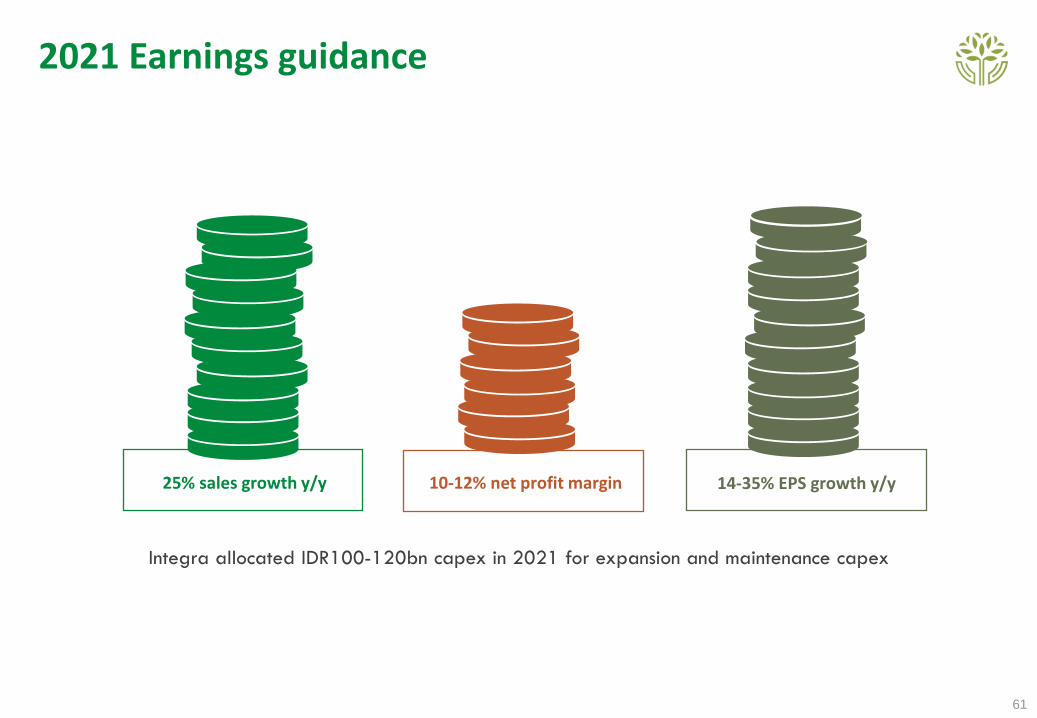
25% sales growth y/y 10-12% net profit margin 14-35% EPS growth y/y
Integra allocated IDR100-120bn capex in 2021 for expansion and maintenance capex

THANK YOU!
Desa Betro, Kecamatan SedatiSidoarjo 61253 – Indonesia
Phone: +62 31 8910434, +62 31 8910435, +62 31 8910436 Faximile: +62 31 8911391
E-mail: [email protected]: www.integrafurniture.co.id