Embed Size (px)
Citation preview

0
PT SURYA SEMESTA INTERNUSA TBK (“SSIA”)Review Nine Month 2018
www.suryainternusa.com
1
Table of ContentsSurya Semesta Internusain Summary
Review of Business Segments• Milestone• Major Subsidiaries,
Shareholders & Management• Investment Portfolio• Strategic Roadmap• Indonesia Economic
Indicator9M18 Financial Highlights• Consolidated Operating
Results• Consolidated Revenue• Consolidated EBITDA• Consolidated Net Profit• Consolidated Balance Sheet
PROPERTY• PT Suryacipta Swadaya (“SCS”)• PT SLP SURYA TICON INTERNUSA (“SLP”)• PT TCP Internusa (“TCP”)• PT Sitiagung Makmur (“SAM”)
CONSTRUCTION • PT Nusa Raya Cipta (“NRCA”)
HOSPITALITY• PT Suryalaya Anindita International (“SAI”)• PT Ungasan Semesta Resort (“USR”)• PT Surya Internusa Hotels (“SIH”)
2
Surya Semesta Internusa in Summary

3
Consolidated its hospitality business, PT Suryalaya AninditaInternational
2008
2006
Development of the ultra-high-end Banyan Tree Resort in Ungasan, Bali
Listed on the Indonesia Stock Exchange
1997
1996
Developed a 5-star Gran Meliã Hotel and Graha Surya Internusa Office Building
1991
Developed 1,400 hectare industrial estate development in Karawang, West Java
Developed Meliã Bali Hotel, a 494-room, 5-star hotel in Nusa Dua, Bali
1983
1976
Glodok Plaza inauguration, Indonesia’s first modern shopping center in Chinatown, Jakarta
Entered into a property development company to develop Golden Triangle area in Kuningan
1971
Acquired construction business, PT Nusa Raya Cipta
1994
2010
Launched opening Banyan Tree UngasanResort, Bali
Conducted stock split on a ratio of 1 : 4
2011
2012 Issued IDR
700 billion bond Distribute first
dividend since IPO in 1997
Invested in –Cikopo-PalimananToll Road
IPO of Nusa Raya Cipta @ IDR 850 per share
2013
Joint venture with Mitsui & Co and TICON in warehousing/ factory business
Openning of Cikopo – Palimanan toll road
2015
PT Surya Semesta Internusa TbkPT Surya Semesta Internusa Tbk
Operating track record in property sector can be traced back to over 40 years in early 1970s
Significant growth since IPO– Raised over IDR 545 billion equity(1)
– Raised over IDR 1,600 billion in debt– Market cap increased from IDR0.6tn (IPO) to current IDR2.3tn(2)
Note: Timeline not to scale. (1) Including IDR 132bn raised in IPO. (2) Market data as of 30 September 2018. (3) As of 30 September 2018
2014 Acquired location
permit of 2,000 ha in Subang, West Java
Launched first BATIQA hotel in Karawang
2017
DivestmetCikopo PalimananToll road at 3X BV

4
9.4%7.9%
6.3%
5.4%
1.2%70.0%
PT Arman Investments UtamaPT Persada Capital InvestamaPT Interpid Investmets LimitedPT Union SampoernaPT Surya Semesta Internusa TbkOthers
Surya Semesta Internusa in SummaryCompany Highlights
Established and commenced operations in 1971, SSIA’s primary businesses are in construction, property and hospitality sectors
One of the Leading Listed Developers in Indonesia(1)
– Market Capitalization of IDR 2.3tn / US$ 153mn
– 9M18 Total Equity of IDR 4,287bn / US$ 287mn
– 9M18 EBITDA(3) of IDR 214bn / US$ 14mn
– FY17 EBITDA(3) of IDR 403bn / US$ 27mn
– Established presence in more than twelve Indonesian cities
Suryacipta City of Industry is the company’s largest project with total location permit of 1,400 ha
Obtained location permit for 2,000 ha landbank in Subang
Core Businesses
Construction
Industrial Estate Land
Hotel
Rental, Parking & Maintenance
Warehouse & Factory
High rise buildings Commercial and manufacturing
facilities Infrastructure Suryacipta City of Industry Construction of Cikopo-
Palimanan toll road
Resorts and Villas Business Hotels 5-star hotels
Non-Recurring Recurring(2)
Note: (1) Market data as of 30 September 2018, based on USDIDR of 14,929 (2) Recurring revenue comprises that of hotel, rental, parking and maintenance. (3) EBITDA defined as net income, before interest expenses, tax expenses, depreciation and amortization expenses, includes JO income (loss)
Real Estate (Residential)
Shareholding Structure
Note: Shareholding as of 30 September 2018
5
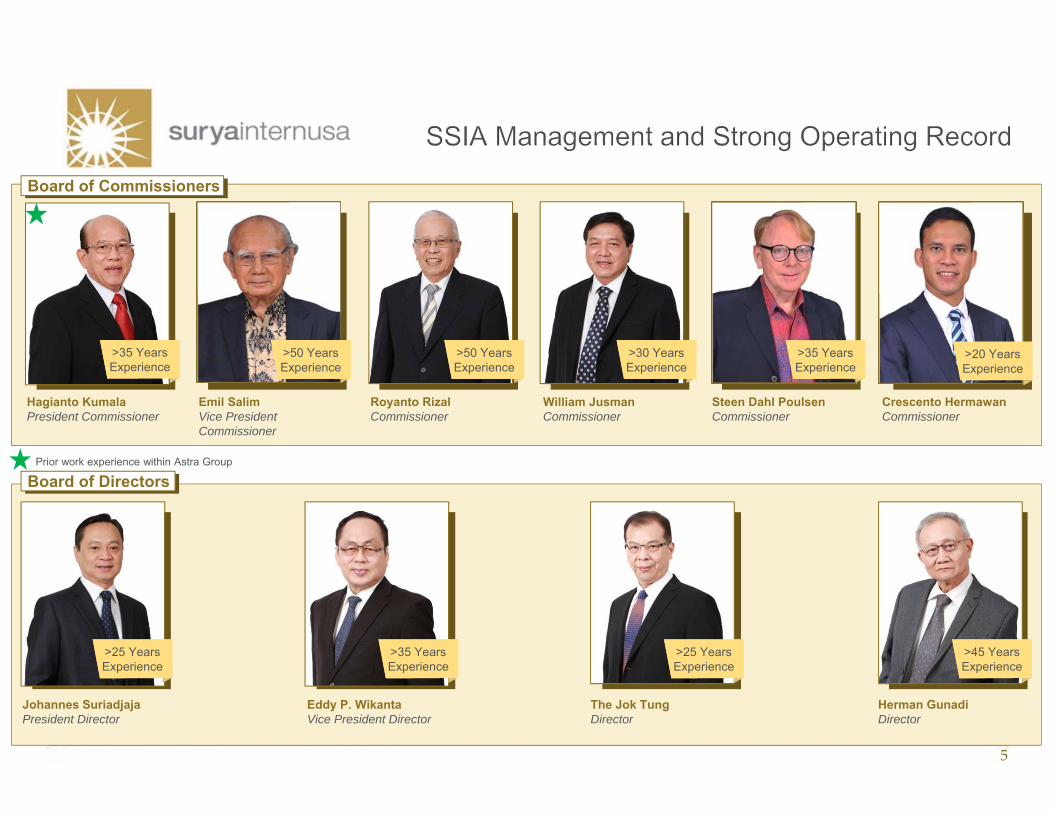
Eddy P. WikantaVice President Director
>35 YearsExperience
Johannes SuriadjajaPresident Director
>25 YearsExperience
The Jok TungDirector
>25 YearsExperience
Herman GunadiDirector
>45 YearsExperience
Prior work experience within Astra Group
Board of Directors
Hagianto KumalaPresident Commissioner
Emil SalimVice PresidentCommissioner
Royanto RizalCommissioner
William JusmanCommissioner
Steen Dahl PoulsenCommissioner
Crescento HermawanCommissioner
>35 YearsExperience
>50 YearsExperience
>30 YearsExperience
Board of Commissioners
>20 YearsExperience
>35 YearsExperience
>50 YearsExperience
6
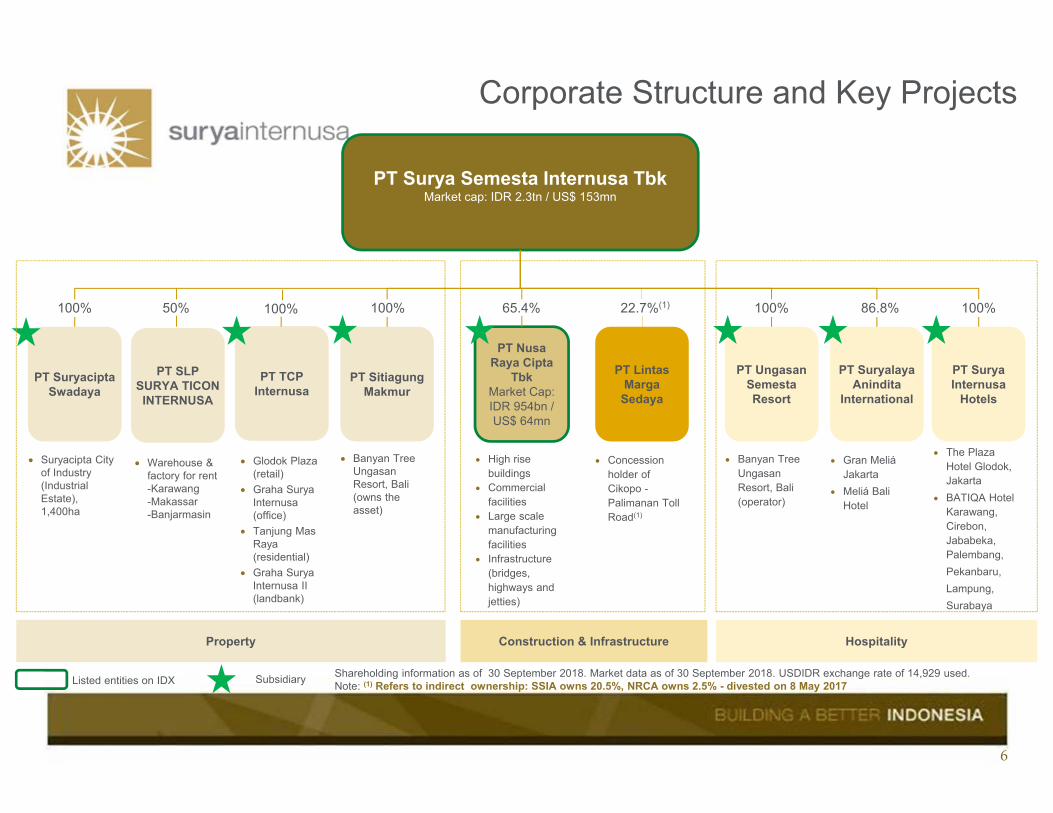
Corporate Structure and Key Projects
Shareholding information as of 30 September 2018. Market data as of 30 September 2018. USDIDR exchange rate of 14,929 used.Note: (1) Refers to indirect ownership: SSIA owns 20.5%, NRCA owns 2.5% - divested on 8 May 2017
Property
PT Surya Semesta Internusa TbkMarket cap: IDR 2.3tn / US$ 153mn
PT Suryacipta Swadaya
PT SitiagungMakmur
PT Ungasan SemestaResort
Construction & Infrastructure Hospitality
PT Suryalaya Anindita
International
PT Surya Internusa
Hotels
Glodok Plaza (retail)
Graha Surya Internusa(office)
Tanjung Mas Raya(residential)
Graha Surya Internusa II (landbank)
Warehouse & factory for rent-Karawang-Makassar -Banjarmasin
PT Nusa Raya Cipta
TbkMarket Cap: IDR 954bn / US$ 64mn
High rise buildings
Commercial facilities
Large scale manufacturing facilities
Infrastructure (bridges, highways and jetties)
Banyan Tree Ungasan Resort, Bali(operator)
Gran Meliá Jakarta
Meliá Bali Hotel
The Plaza Hotel Glodok, Jakarta
BATIQA Hotel Karawang, Cirebon, Jababeka, Palembang,Pekanbaru,Lampung,Surabaya
100% 50% 100% 65.4% 100% 86.8% 100%
PT LintasMargaSedaya
Concession holder of Cikopo -Palimanan Toll Road(1)
22.7%(1)
Listed entities on IDX Subsidiary
Suryacipta City of Industry (Industrial Estate), 1,400ha
PT TCP Internusa
100%
Banyan Tree Ungasan Resort, Bali (owns the asset)
PT SLPSURYA TICONINTERNUSA
7
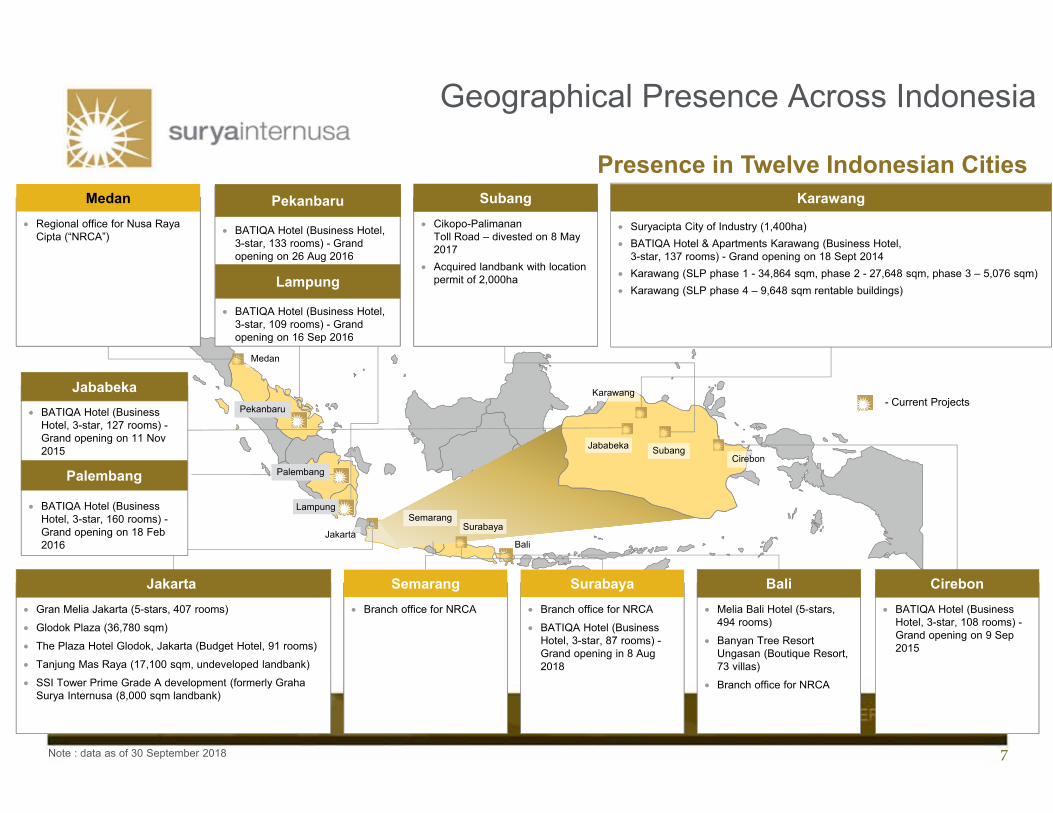
Geographical Presence Across Indonesia
Presence in Twelve Indonesian Cities
JakartaBali
Pekanbaru
Medan
Karawang
CirebonSubang
- Current Projects
Cikopo-PalimananToll Road – divested on 8 May 2017
Acquired landbank with location permit of 2,000ha
Subang
Suryacipta City of Industry (1,400ha) BATIQA Hotel & Apartments Karawang (Business Hotel,
3-star, 137 rooms) - Grand opening on 18 Sept 2014 Karawang (SLP phase 1 - 34,864 sqm, phase 2 - 27,648 sqm, phase 3 – 5,076 sqm) Karawang (SLP phase 4 – 9,648 sqm rentable buildings)
Karawang Regional office for Nusa Raya
Cipta (“NRCA”)
Medan
SemarangSurabaya
BATIQA Hotel (Business Hotel, 3-star, 108 rooms) -Grand opening on 9 Sep 2015
Cirebon Melia Bali Hotel (5-stars,
494 rooms) Banyan Tree Resort
Ungasan (Boutique Resort, 73 villas)
Branch office for NRCA
Bali Gran Melia Jakarta (5-stars, 407 rooms) Glodok Plaza (36,780 sqm) The Plaza Hotel Glodok, Jakarta (Budget Hotel, 91 rooms) Tanjung Mas Raya (17,100 sqm, undeveloped landbank) SSI Tower Prime Grade A development (formerly Graha
Surya Internusa (8,000 sqm landbank)
Jakarta Branch office for NRCA
Semarang Branch office for NRCA BATIQA Hotel (Business
Hotel, 3-star, 87 rooms) -Grand opening in 8 Aug 2018
Surabaya
Jababeka
BATIQA Hotel (Business Hotel, 3-star, 127 rooms) -Grand opening on 11 Nov 2015
BATIQA Hotel (Business Hotel, 3-star, 160 rooms) -Grand opening on 18 Feb 2016
Jababeka
Palembang Palembang
Lampung
BATIQA Hotel (Business Hotel, 3-star, 133 rooms) - Grand opening on 26 Aug 2016
BATIQA Hotel (Business Hotel, 3-star, 109 rooms) - Grand opening on 16 Sep 2016
Pekanbaru
Lampung
Note : data as of 30 September 2018
8
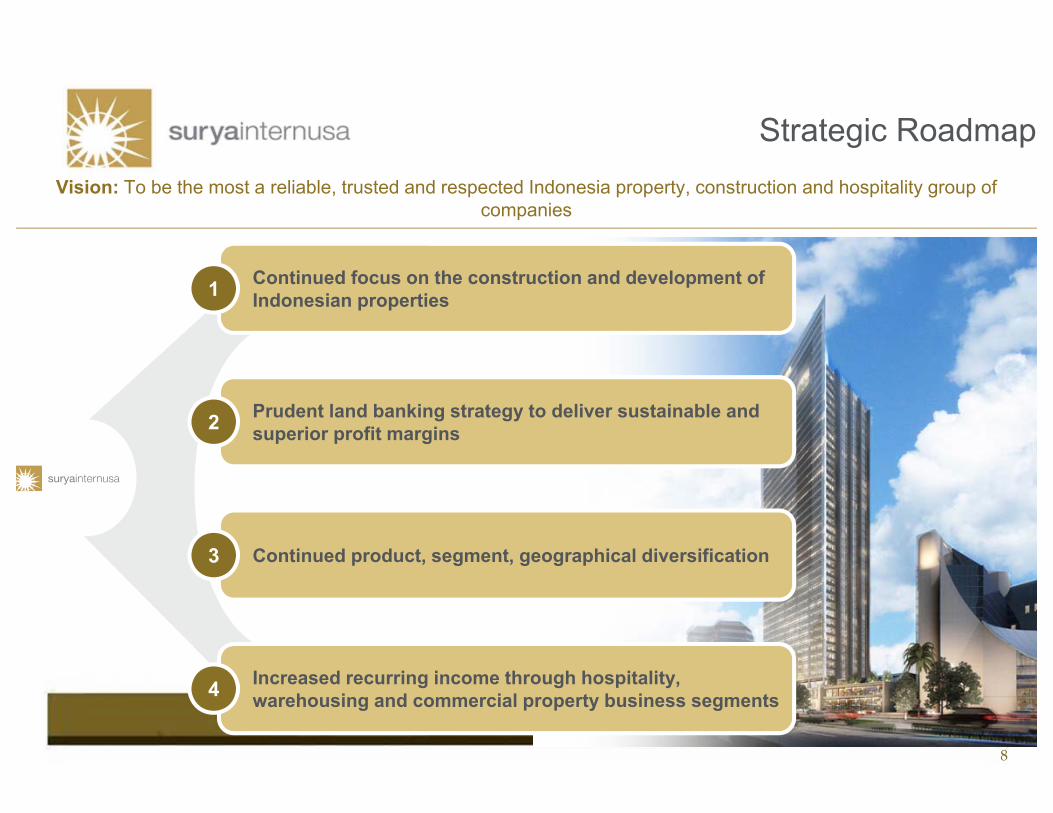
Strategic Roadmap
Continued focus on the construction and development of Indonesian properties1
Prudent land banking strategy to deliver sustainable and superior profit margins2
Continued product, segment, geographical diversification3
Increased recurring income through hospitality, warehousing and commercial property business segments4
Vision: To be the most a reliable, trusted and respected Indonesia property, construction and hospitality group of companies
9
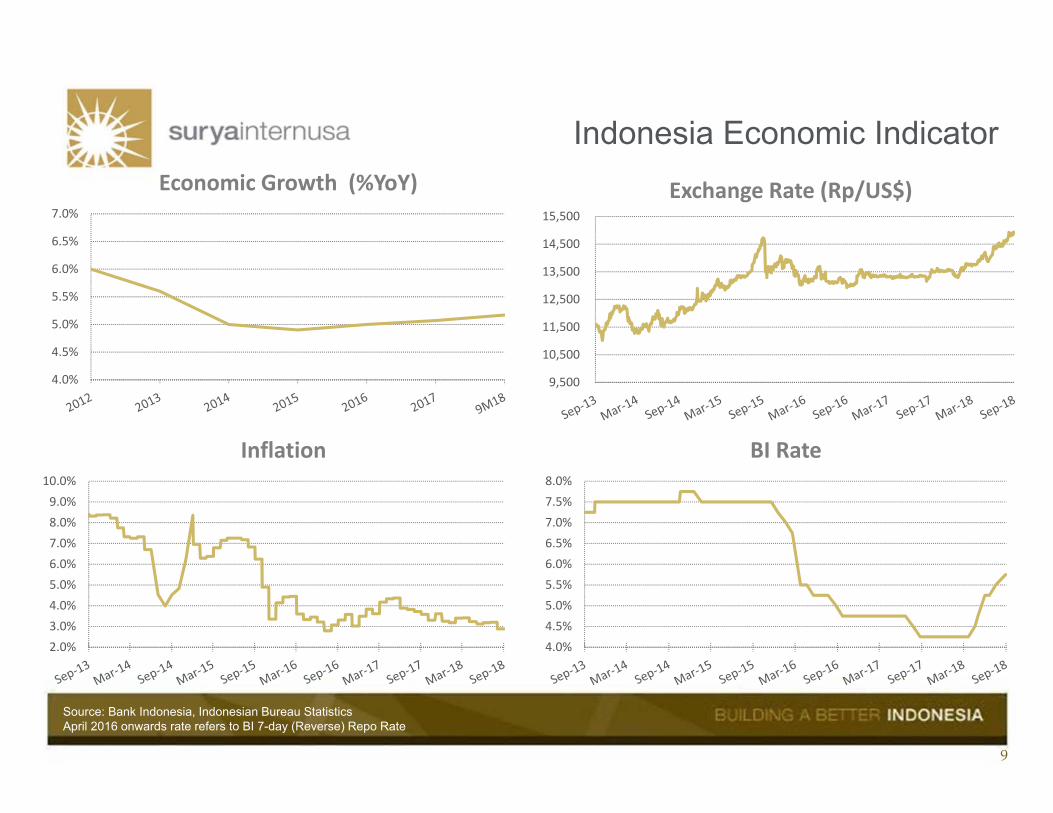
Indonesia Economic Indicator
Source: Bank Indonesia, Indonesian Bureau StatisticsApril 2016 onwards rate refers to BI 7-day (Reverse) Repo Rate
9,500
10,500
11,500
12,500
13,500
14,500
15,500
Exchange Rate (Rp/US$)
4.0%
4.5%
5.0%
5.5%
6.0%
6.5%
7.0%
Economic Growth (%YoY)
2.0%3.0%4.0%5.0%6.0%7.0%8.0%9.0%
10.0%
Inflation
4.0%4.5%5.0%5.5%6.0%6.5%7.0%7.5%8.0%
BI Rate
10
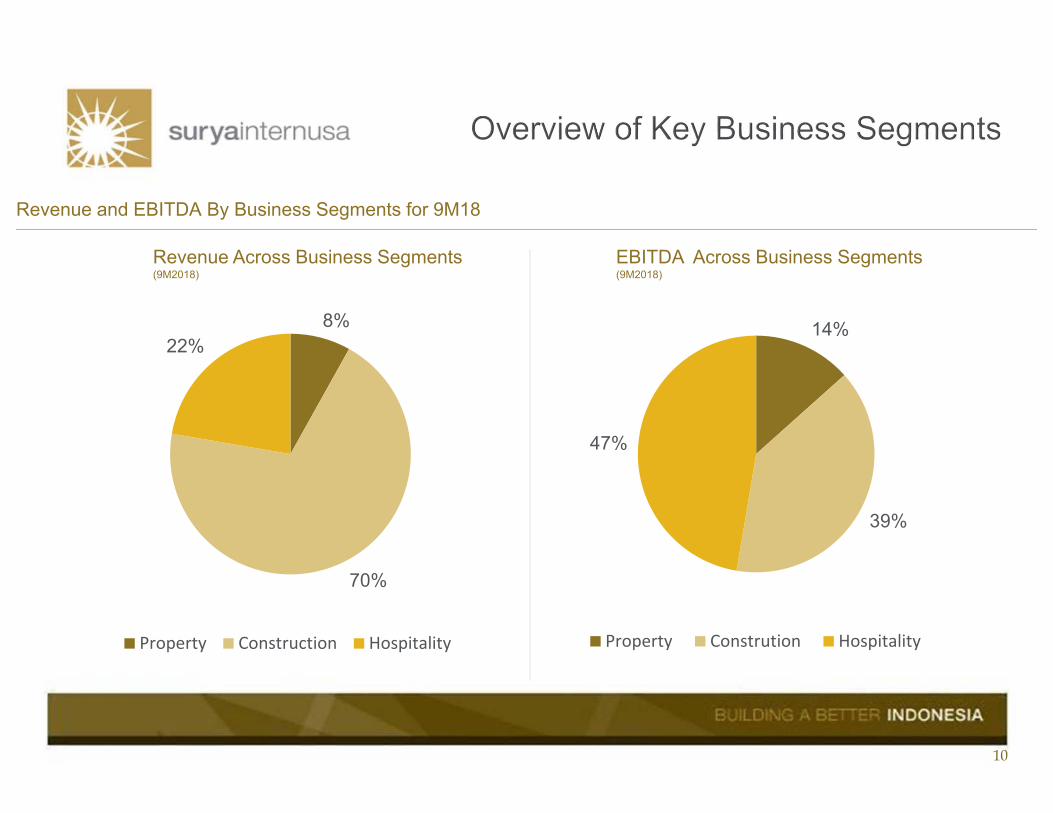
Revenue Across Business Segments(9M2018)
EBITDA Across Business Segments(9M2018)
Revenue and EBITDA By Business Segments for 9M18
14%
39%
47%
Property Constrution Hospitality
8%
70%
22%
Property Construction Hospitality
11
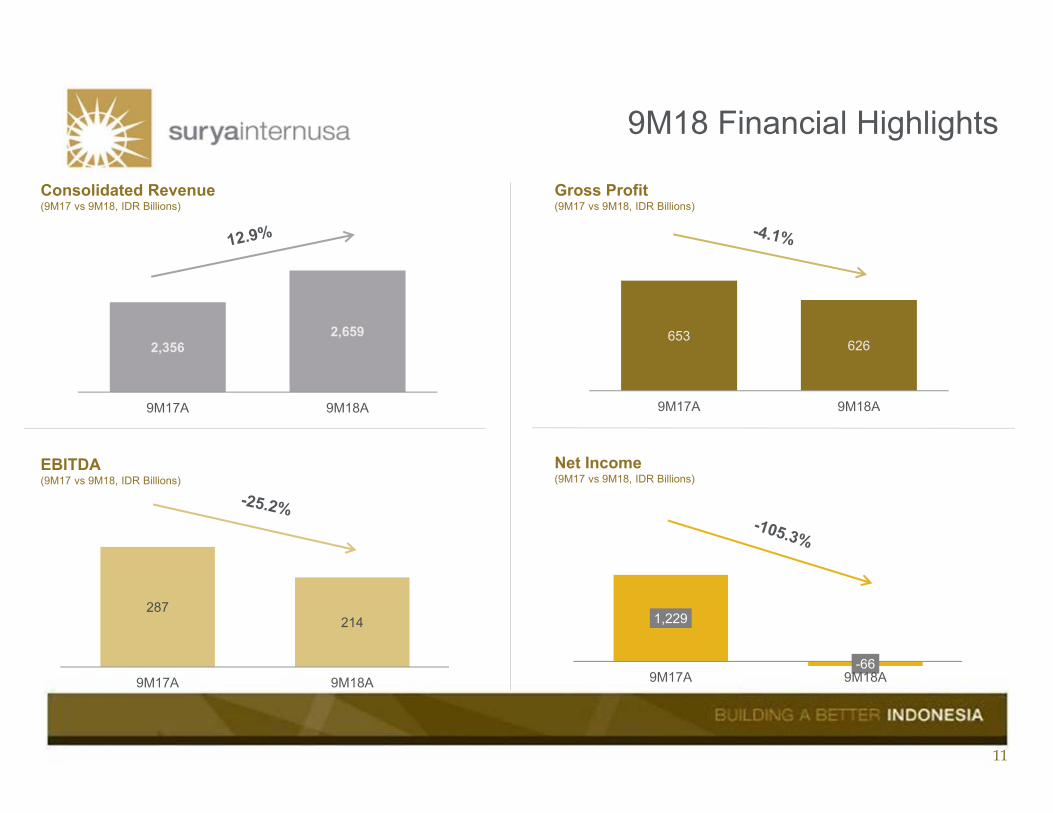
Consolidated Revenue(9M17 vs 9M18, IDR Billions)
2,3562,659
9M17A 9M18A
9M18 Financial Highlights
Gross Profit(9M17 vs 9M18, IDR Billions)
653626
9M17A 9M18A
EBITDA(9M17 vs 9M18, IDR Billions)
287214
9M17A 9M18A
Net Income(9M17 vs 9M18, IDR Billions)
1,229
-669M17A 9M18A
12
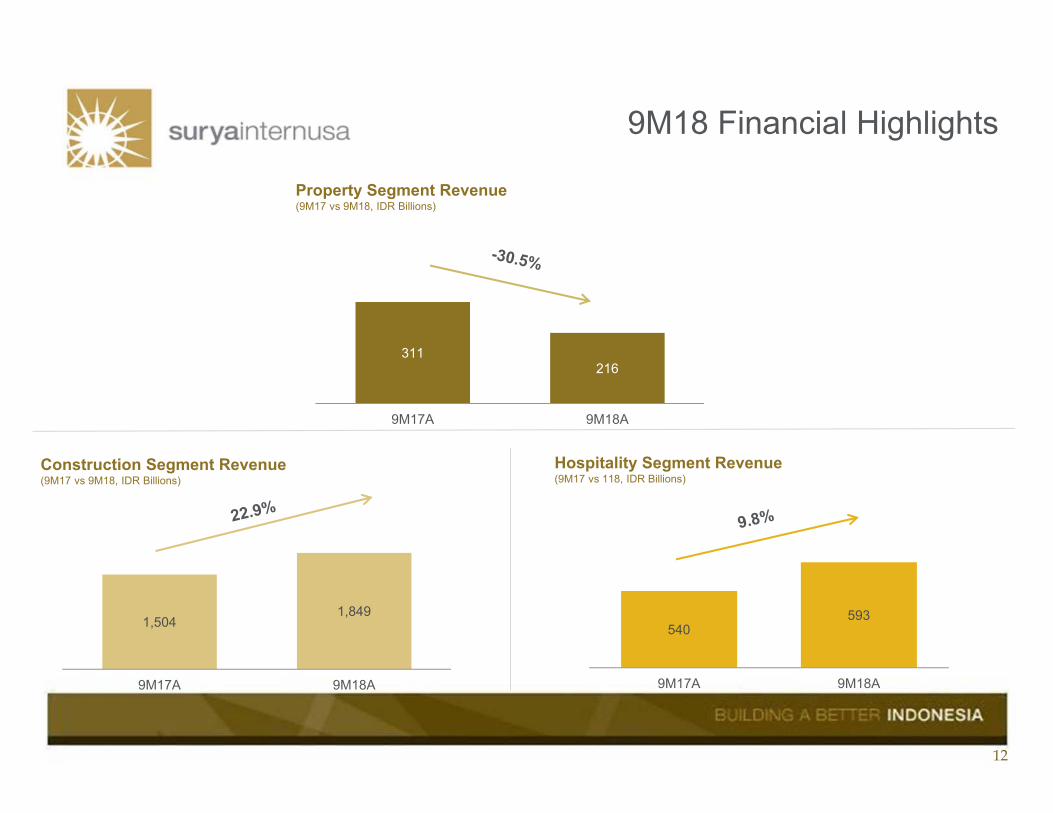
9M18 Financial Highlights
Property Segment Revenue(9M17 vs 9M18, IDR Billions)
311216
9M17A 9M18A
Construction Segment Revenue(9M17 vs 9M18, IDR Billions)
1,5041,849
9M17A 9M18A
Hospitality Segment Revenue(9M17 vs 118, IDR Billions)
540593
9M17A 9M18A
13
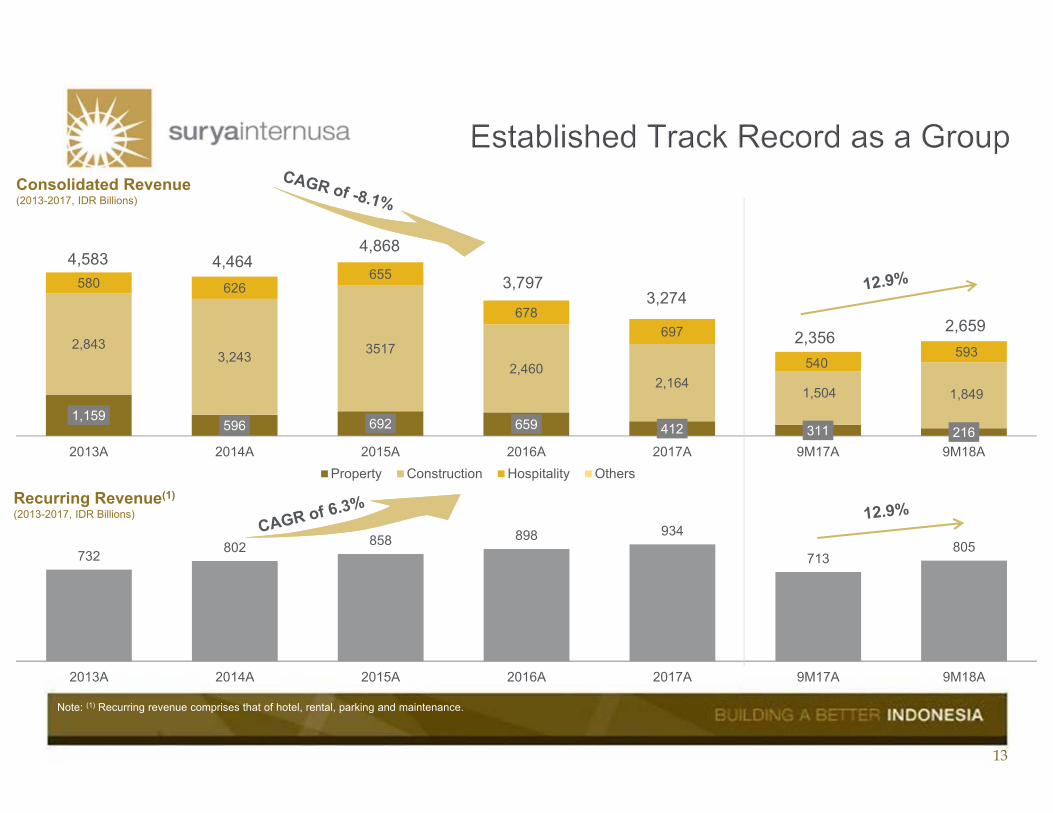
Consolidated Revenue(2013-2017, IDR Billions)
Recurring Revenue(1)(2013-2017, IDR Billions)
Note: (1) Recurring revenue comprises that of hotel, rental, parking and maintenance.
1,159 596 692 659 412 311 216
2,843 3,243 3517
2,460 2,164
1,504 1,849
580 626 655
678 697
540593
2013A 2014A 2015A 2016A 2017A 9M17A 9M18AProperty Construction Hospitality Others
2,3562,659
3,274
4,4644,5834,868
3,797
732 802 858 898 934
713805
2013A 2014A 2015A 2016A 2017A 9M17A 9M18A

14
Gross MarginsProperty Gross Margins %
Hotel Gross Margins%
55.7%
62.1%
57.2%
48.7%
35.3%
0%
10%
20%
30%
40%
50%
60%
70%
2014A 2015A 2016A 2017A 9M18A
67.2% 65.6% 63.8% 63.4% 64.0%
0%
20%
40%
60%
80%
100%
2014A 2015A 2016A 2017A 9M18A
Construction Gross Margins(1)%
9.1% 9.0% 10.2% 9.9% 9.4%
0%
5%
10%
15%
2014A 2015A 2016A 2017A 9M18ANote: (1) Includes projects within SSIA group
15
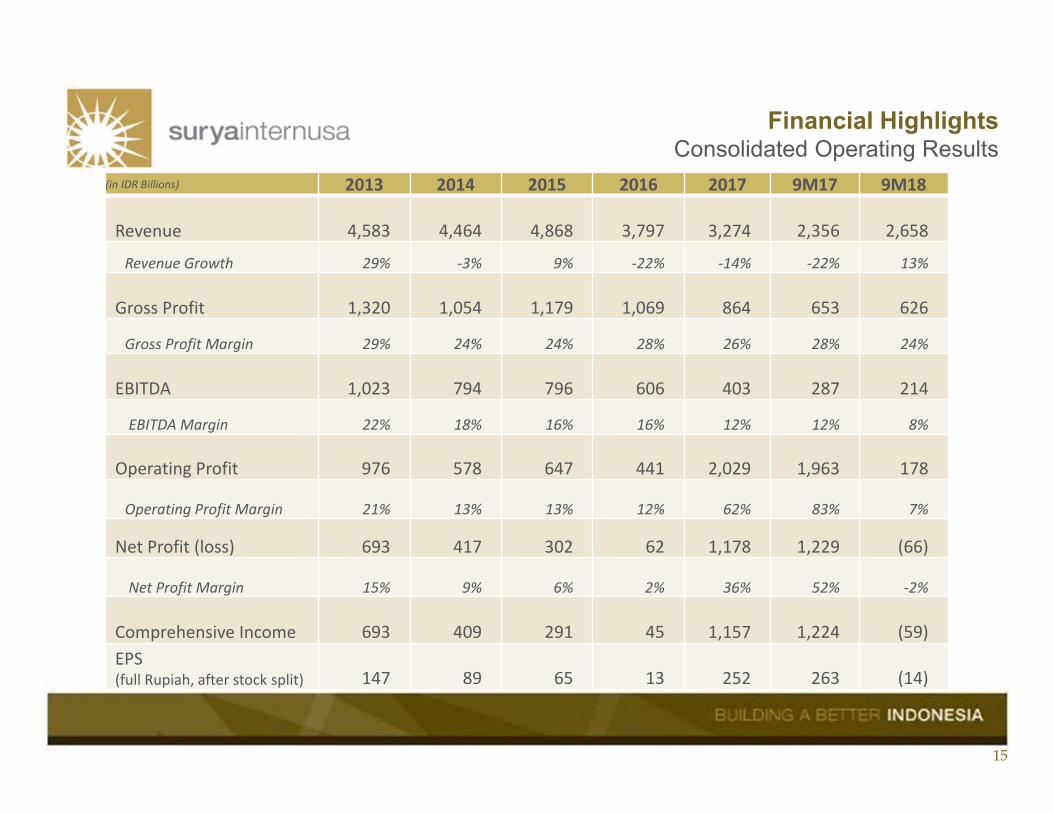
Financial HighlightsConsolidated Operating Results
(in IDR Billions) 2013 2014 2015 2016 2017 9M17 9M18
Revenue 4,583 4,464 4,868 3,797 3,274 2,356 2,658
Revenue Growth 29% ‐3% 9% ‐22% ‐14% ‐22% 13%
Gross Profit 1,320 1,054 1,179 1,069 864 653 626
Gross Profit Margin 29% 24% 24% 28% 26% 28% 24%
EBITDA 1,023 794 796 606 403 287 214
EBITDA Margin 22% 18% 16% 16% 12% 12% 8%
Operating Profit 976 578 647 441 2,029 1,963 178
Operating Profit Margin 21% 13% 13% 12% 62% 83% 7%
Net Profit (loss) 693 417 302 62 1,178 1,229 (66)
Net Profit Margin 15% 9% 6% 2% 36% 52% ‐2%
Comprehensive Income 693 409 291 45 1,157 1,224 (59)EPS (full Rupiah, after stock split) 147 89 65 13 252 263 (14)
16
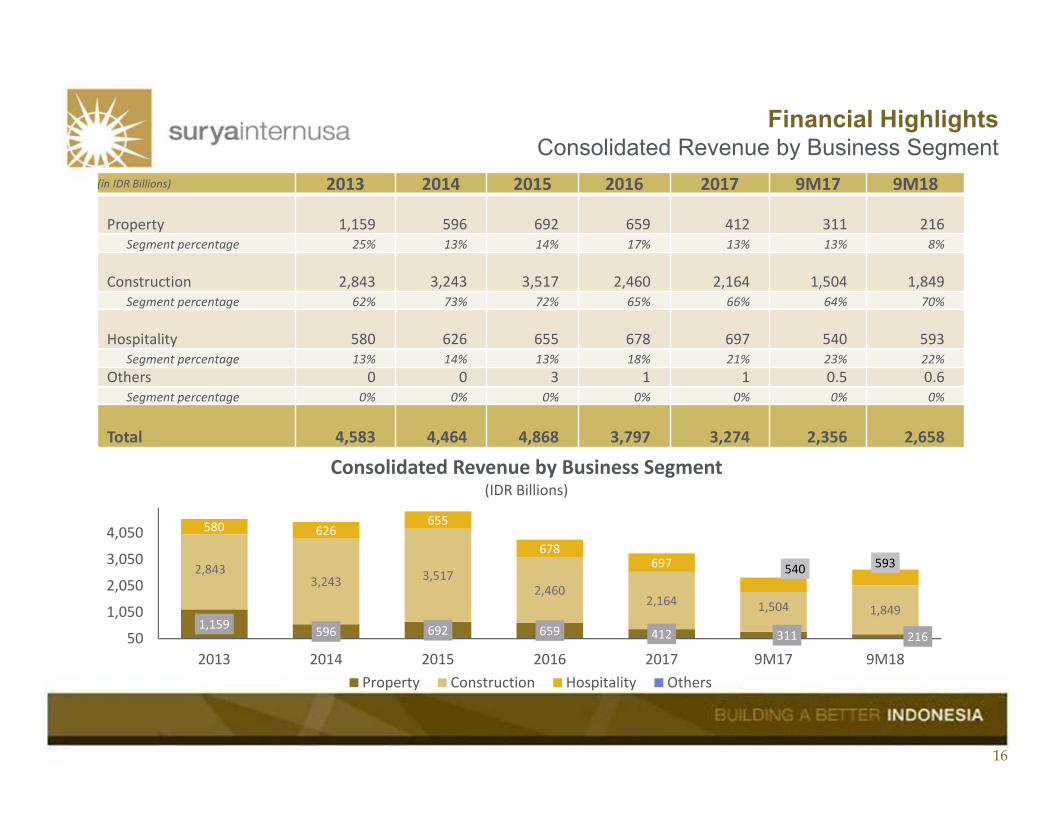
Financial HighlightsConsolidated Revenue by Business Segment
(in IDR Billions) 2013 2014 2015 2016 2017 9M17 9M18
Property 1,159 596 692 659 412 311 216 Segment percentage 25% 13% 14% 17% 13% 13% 8%
Construction 2,843 3,243 3,517 2,460 2,164 1,504 1,849 Segment percentage 62% 73% 72% 65% 66% 64% 70%
Hospitality 580 626 655 678 697 540 593 Segment percentage 13% 14% 13% 18% 21% 23% 22%
Others 0 0 3 1 1 0.5 0.6Segment percentage 0% 0% 0% 0% 0% 0% 0%
Total 4,583 4,464 4,868 3,797 3,274 2,356 2,658
1,159 596 692 659 412 311 216
2,8433,243 3,517
2,4602,164 1,504 1,849
580 626655
678697 540 593
50
1,050
2,050
3,050
4,050
2013 2014 2015 2016 2017 9M17 9M18
Consolidated Revenue by Business Segment (IDR Billions)
Property Construction Hospitality Others
17
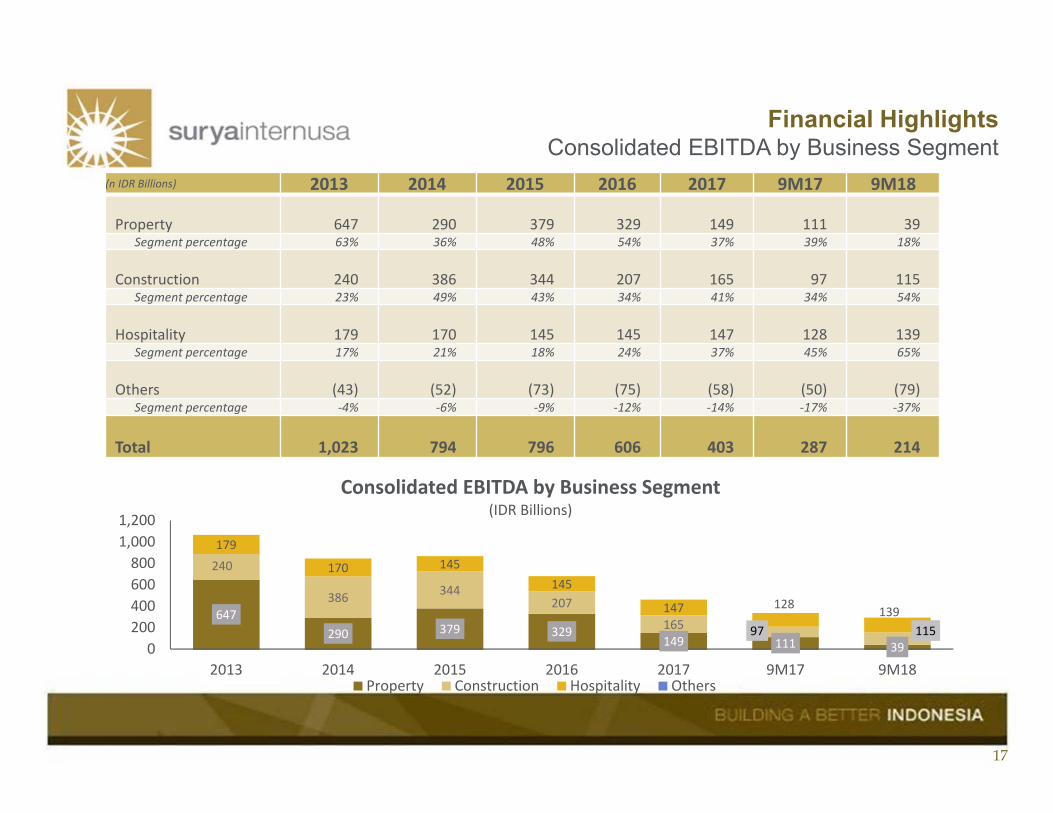
Financial HighlightsConsolidated EBITDA by Business Segment
(n IDR Billions) 2013 2014 2015 2016 2017 9M17 9M18
Property 647 290 379 329 149 111 39 Segment percentage 63% 36% 48% 54% 37% 39% 18%
Construction 240 386 344 207 165 97 115 Segment percentage 23% 49% 43% 34% 41% 34% 54%
Hospitality 179 170 145 145 147 128 139 Segment percentage 17% 21% 18% 24% 37% 45% 65%
Others (43) (52) (73) (75) (58) (50) (79)Segment percentage ‐4% ‐6% ‐9% ‐12% ‐14% ‐17% ‐37%
Total 1,023 794 796 606 403 287 214
647290 379 329
149 111 39
240
386 344207
165 97 115
179
170 145145
147 128 139
0200400600800
1,0001,200
2013 2014 2015 2016 2017 9M17 9M18
Consolidated EBITDA by Business Segment (IDR Billions)
Property Construction Hospitality Others
18
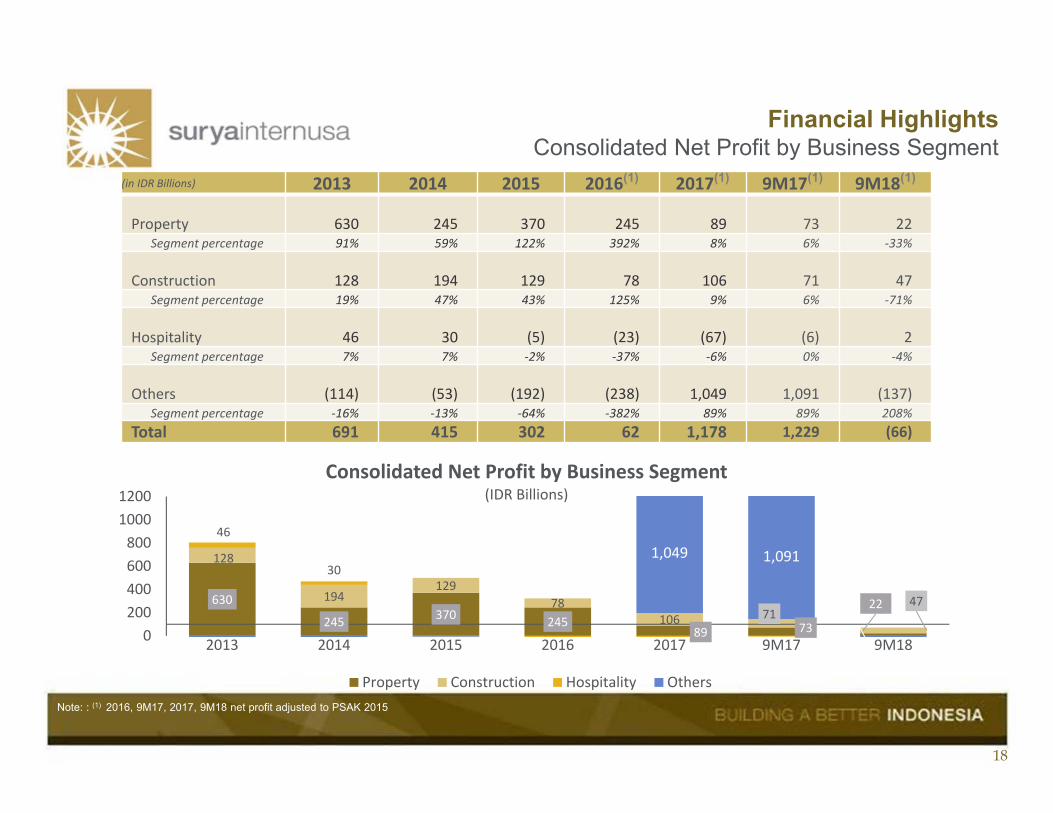
Financial HighlightsConsolidated Net Profit by Business Segment
(in IDR Billions) 2013 2014 2015 2016(1) 2017(1) 9M17(1) 9M18(1)
Property 630 245 370 245 89 73 22 Segment percentage 91% 59% 122% 392% 8% 6% ‐33%
Construction 128 194 129 78 106 71 47 Segment percentage 19% 47% 43% 125% 9% 6% ‐71%
Hospitality 46 30 (5) (23) (67) (6) 2 Segment percentage 7% 7% ‐2% ‐37% ‐6% 0% ‐4%
Others (114) (53) (192) (238) 1,049 1,091 (137)Segment percentage ‐16% ‐13% ‐64% ‐382% 89% 89% 208%
Total 691 415 302 62 1,178 1,229 (66)
630
245 370 24589 73
22
128
194129
78106 71
47
46
30
2
1,049 1,091
0200400600800
10001200
2013 2014 2015 2016 2017 9M17 9M18
Consolidated Net Profit by Business Segment (IDR Billions)
Property Construction Hospitality OthersNote: : (1) 2016, 9M17, 2017, 9M18 net profit adjusted to PSAK 2015
19
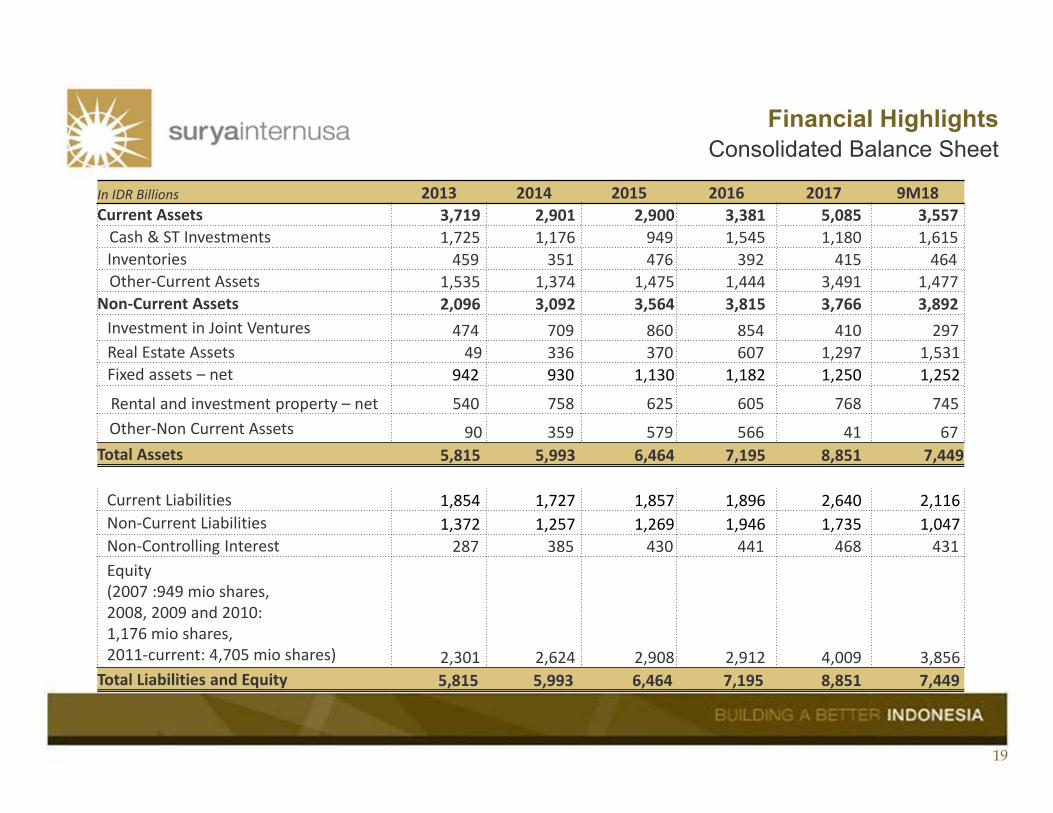
Financial HighlightsConsolidated Balance Sheet
In IDR Billions 2013 2014 2015 2016 2017 9M18Current Assets 3,719 2,901 2,900 3,381 5,085 3,557Cash & ST Investments 1,725 1,176 949 1,545 1,180 1,615Inventories 459 351 476 392 415 464Other‐Current Assets 1,535 1,374 1,475 1,444 3,491 1,477
Non‐Current Assets 2,096 3,092 3,564 3,815 3,766 3,892Investment in Joint Ventures 474 709 860 854 410 297Real Estate Assets 49 336 370 607 1,297 1,531Fixed assets – net 942 930 1,130 1,182 1,250 1,252
Rental and investment property – net 540 758 625 605 768 745Other‐Non Current Assets 90 359 579 566 41 67
Total Assets 5,815 5,993 6,464 7,195 8,851 7,449
Current Liabilities 1,854 1,727 1,857 1,896 2,640 2,116Non‐Current Liabilities 1,372 1,257 1,269 1,946 1,735 1,047Non‐Controlling Interest 287 385 430 441 468 431Equity(2007 :949 mio shares, 2008, 2009 and 2010: 1,176 mio shares, 2011‐current: 4,705 mio shares) 2,301 2,624 2,908 2,912 4,009 3,856
Total Liabilities and Equity 5,815 5,993 6,464 7,195 8,851 7,449
20
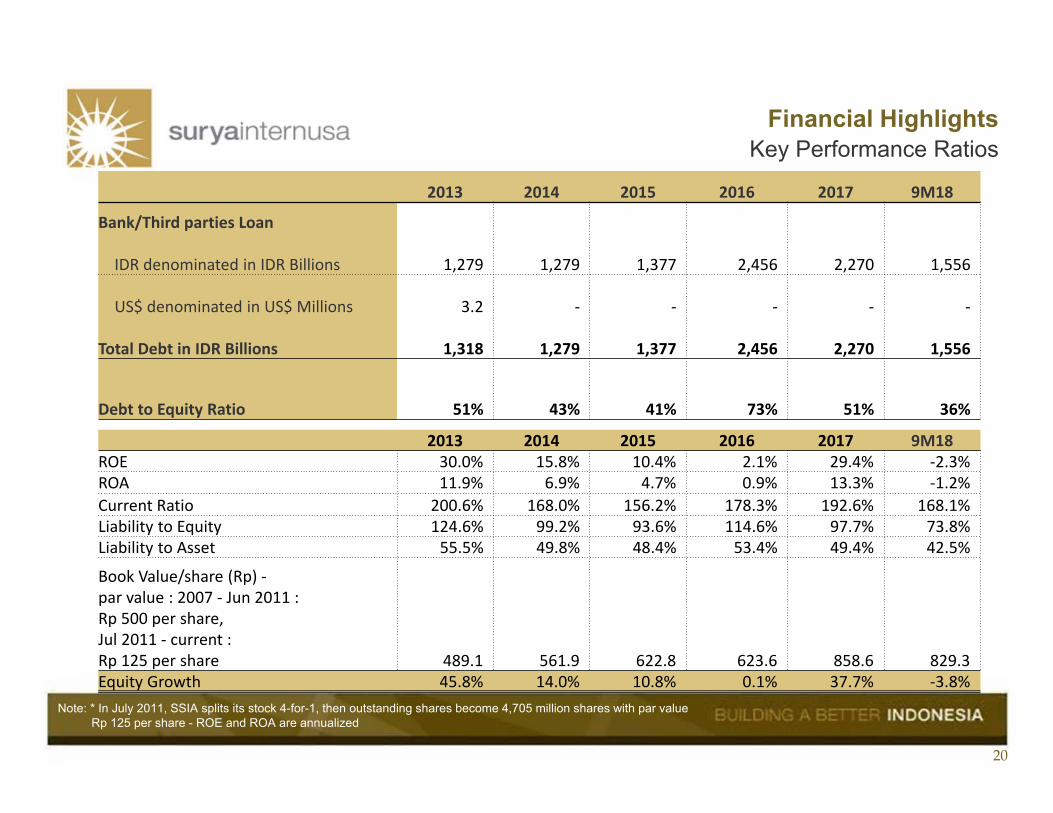
Note: * In July 2011, SSIA splits its stock 4-for-1, then outstanding shares become 4,705 million shares with par value Rp 125 per share - ROE and ROA are annualized
Financial HighlightsKey Performance Ratios
2013 2014 2015 2016 2017 9M18ROE 30.0% 15.8% 10.4% 2.1% 29.4% ‐2.3%ROA 11.9% 6.9% 4.7% 0.9% 13.3% ‐1.2%Current Ratio 200.6% 168.0% 156.2% 178.3% 192.6% 168.1%Liability to Equity 124.6% 99.2% 93.6% 114.6% 97.7% 73.8%Liability to Asset 55.5% 49.8% 48.4% 53.4% 49.4% 42.5%
Book Value/share (Rp) ‐par value : 2007 ‐ Jun 2011 : Rp 500 per share, Jul 2011 ‐ current : Rp 125 per share 489.1 561.9 622.8 623.6 858.6 829.3 Equity Growth 45.8% 14.0% 10.8% 0.1% 37.7% ‐3.8%
2013 2014 2015 2016 2017 9M18
Bank/Third parties Loan
IDR denominated in IDR Billions 1,279 1,279 1,377 2,456 2,270 1,556
US$ denominated in US$ Millions 3.2 ‐ ‐ ‐ ‐ ‐
Total Debt in IDR Billions 1,318 1,279 1,377 2,456 2,270 1,556
Debt to Equity Ratio 51% 43% 41% 73% 51% 36%
21
Review of Business Segments
22
PROPERTY- PT Suryacipta Swadaya (“SCS”)- PT SLP SURYA TICON INTERNUSA(“SLP”)- PT TCP Internusa (“TCP”)- PT Sitiagung Makmur (“SAM”)

23
Foreign Direct Investment and Domestic Direct Investment Realization (LHS) vs Statistic of Industrial Land Sales in West Java Area in (RHS)
Source: BKPM (Indonesia Investment Coordinating Board) and Colliers
28.5 29.3 28.9 32.2 23.9 21.9
13.214.4 16.1 19.6
14.5 18.0
40.941.7 43.6
51.8
38.4 39.9
440
348
175 208
118
115
0
50
100
150
200
250
300
350
400
450
500
0
10
20
30
40
50
60
2014 2015 2016 2017 9M17 9M18DDI (US$ b) FDI (US$ b) Total FDI+DDI Land Sales (ha)
24
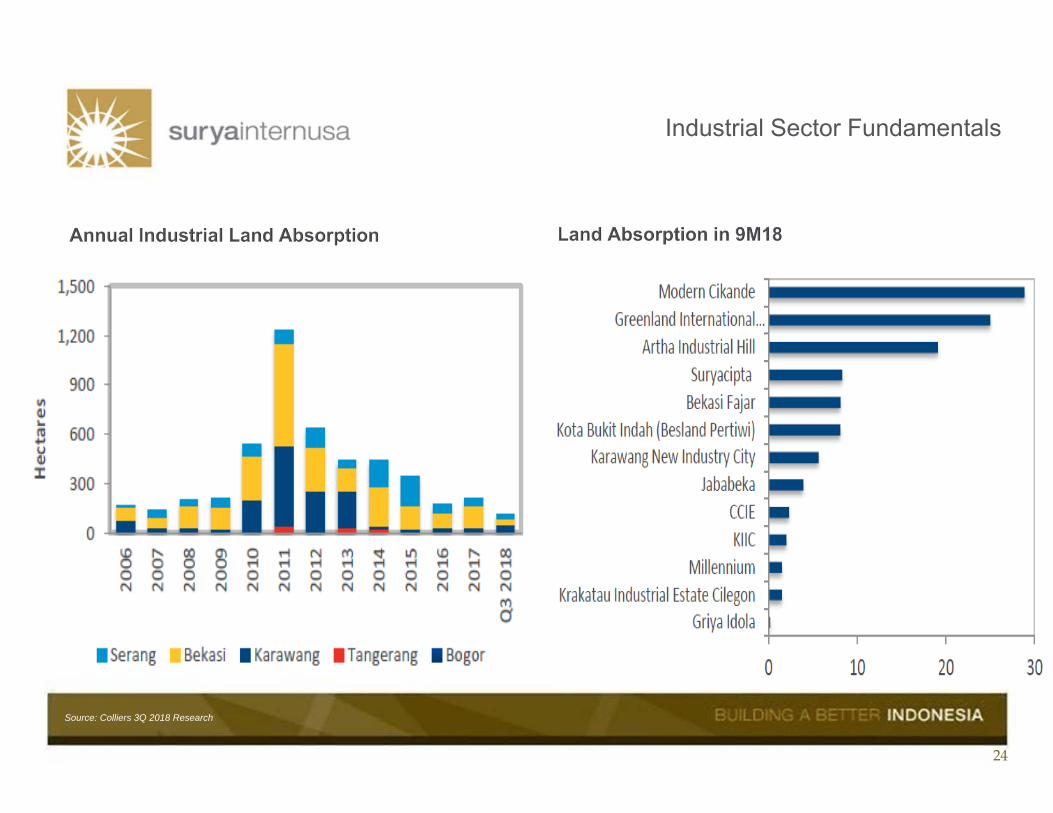
Industrial Sector Fundamentals
Source: Colliers 3Q 2018 Research

25
Industrial Sector Fundamentals
Source: Colliers 3Q 2018 Research
26
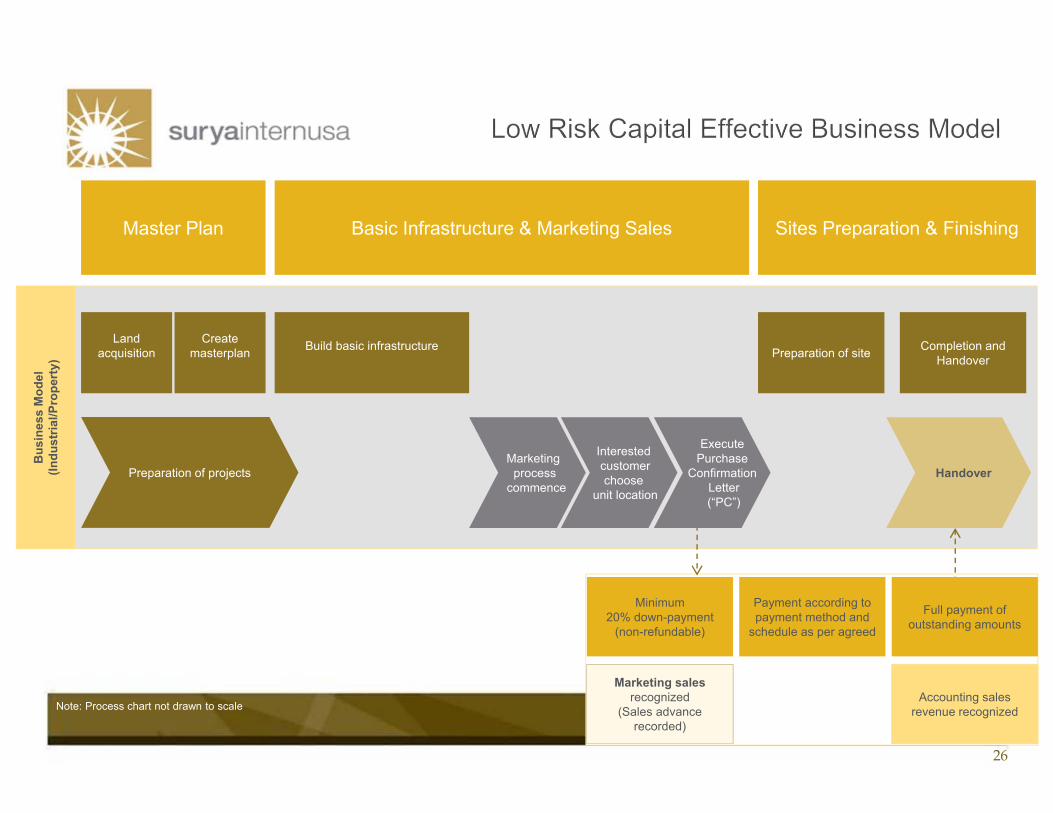
Note: Process chart not drawn to scaleAccounting sales
revenue recognized
Marketing salesrecognized
(Sales advance recorded)
Full payment of outstanding amounts
Minimum 20% down-payment
(non-refundable)
Payment according to payment method and
schedule as per agreed
Handover
Preparation of site Completion and Handover
Land acquisition
Create masterplan Build basic infrastructure
Bus
ines
s M
odel
(In
dust
rial/P
rope
rty)
Preparation of projectsMarketing
processcommence
Execute Purchase
Confirmation Letter(“PC”)
Interested customerchoose
unit location
Master Plan Sites Preparation & FinishingBasic Infrastructure & Marketing Sales
27
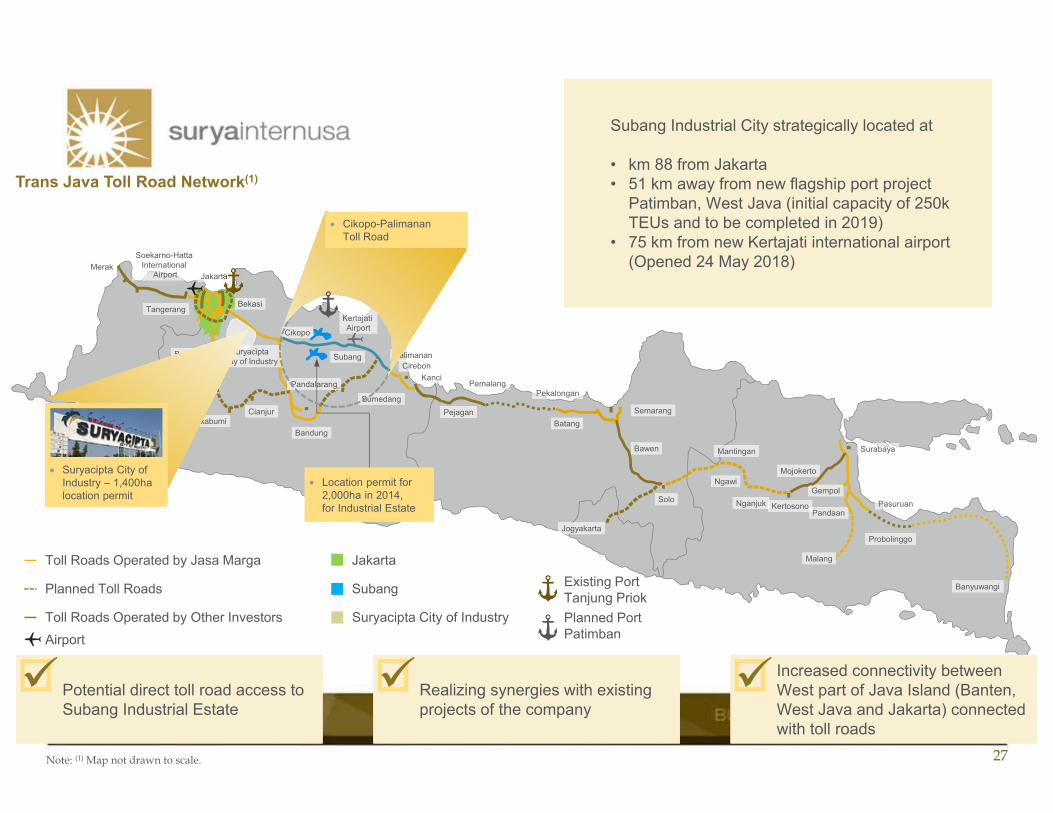
Trans Java Toll Road Network(1)
Potential direct toll road access to Subang Industrial EstatePotential direct toll road access to Subang Industrial Estate
Merak
Tangerang
Jakarta
Bogor
Bandung
CirebonKanci
SukabumiCianjur Pejagan
PemalangPekalongan
Semarang
Jogyakarta
Solo
Ngawi
Mantingan
Mojokerto
Pandaan
Malang
Gempol
Banyuwangi
Pasuruan
Probolinggo
KertosonoNganjuk
SurabayaBawen
SuryaciptaCity of Industry
Sumedang
Subang
Cikopo
Palimanan
Pandalarang
KertajatiAirport
Soekarno-HattaInternational
Airport
Bekasi
Planned Toll Roads Subang
Toll Roads Operated by Jasa Marga Jakarta
Toll Roads Operated by Other InvestorsAirport
Suryacipta City of Industry
Location permit for 2,000ha in 2014,for Industrial Estate
Location permit for 2,000ha in 2014,for Industrial Estate
Suryacipta City of Industry – 1,400ha location permit
Suryacipta City of Industry – 1,400ha location permit
Cikopo-PalimananToll Road
Cikopo-PalimananToll Road
Realizing synergies with existing projects of the companyRealizing synergies with existing projects of the company
Increased connectivity between West part of Java Island (Banten, West Java and Jakarta) connected with toll roads
Increased connectivity between West part of Java Island (Banten, West Java and Jakarta) connected with toll roads
Existing PortTanjung PriokPlanned PortPatimban
Note: (1) Map not drawn to scale.
Batang
Subang Industrial City strategically located at
• km 88 from Jakarta• 51 km away from new flagship port project
Patimban, West Java (initial capacity of 250k TEUs and to be completed in 2019)
• 75 km from new Kertajati international airport (Opened 24 May 2018)
Subang Industrial City strategically located at
• km 88 from Jakarta• 51 km away from new flagship port project
Patimban, West Java (initial capacity of 250k TEUs and to be completed in 2019)
• 75 km from new Kertajati international airport (Opened 24 May 2018)
28
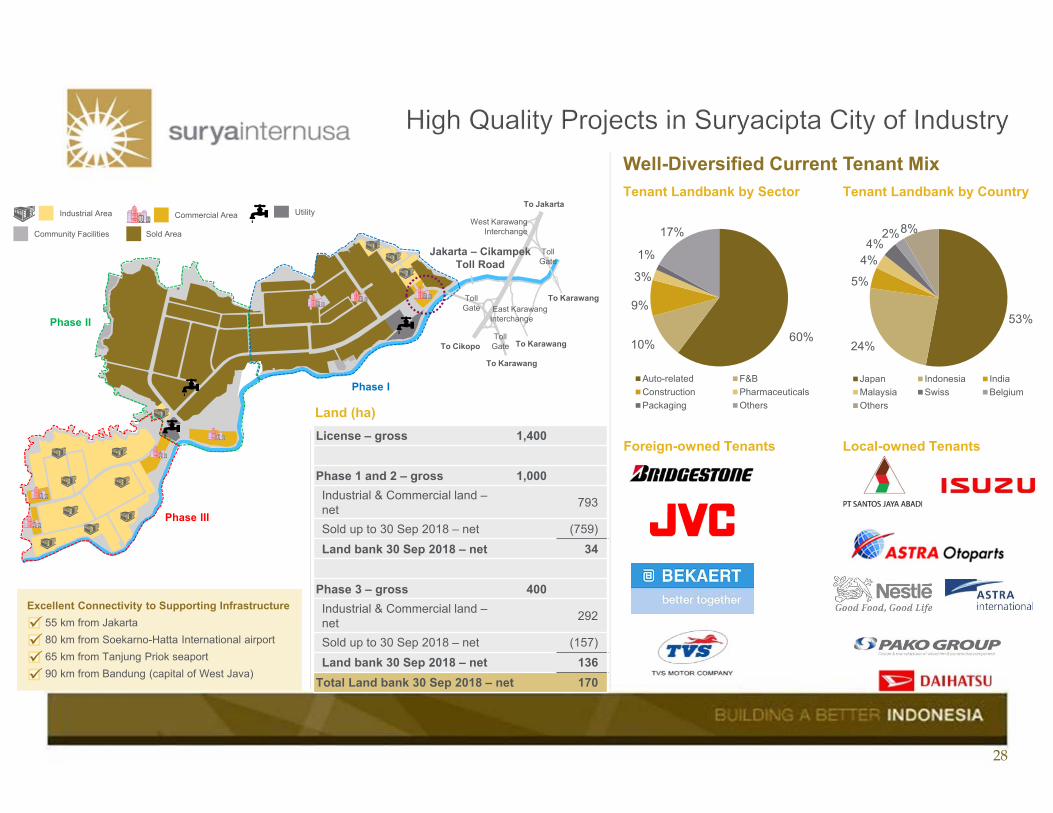
53%
24%
5%
4%4%
2%8%
Japan Indonesia IndiaMalaysia Swiss BelgiumOthers
60%10%
9%
3%
1%
17%
Auto-related F&BConstruction PharmaceuticalsPackaging Others
TollGate
To Karawang
To Karawang
To Karawang
To Cikopo
To Jakarta
West KarawangInterchange
Jakarta – CikampekToll Road
East KarawangInterchange
TollGate
TollGate
Phase II
Phase I
Well-Diversified Current Tenant Mix
License – gross 1,400
Phase 1 and 2 – gross 1,000Industrial & Commercial land –net 793
Sold up to 30 Sep 2018 – net (759)Land bank 30 Sep 2018 – net 34
Phase 3 – gross 400Industrial & Commercial land –net 292
Sold up to 30 Sep 2018 – net (157)Land bank 30 Sep 2018 – net 136
Total Land bank 30 Sep 2018 – net 170
Foreign-owned Tenants Local-owned Tenants
Tenant Landbank by Country
Community Facilities Sold Area
Industrial Area Commercial Area Utility
Phase III
Excellent Connectivity to Supporting Infrastructure55 km from Jakarta80 km from Soekarno-Hatta International airport65 km from Tanjung Priok seaport90 km from Bandung (capital of West Java)
Excellent Connectivity to Supporting Infrastructure55 km from Jakarta80 km from Soekarno-Hatta International airport65 km from Tanjung Priok seaport90 km from Bandung (capital of West Java)
Tenant Landbank by Sector
Land (ha)

29
Property Business Segment Revenue(2013-2017, IDR Billions)
Suryacipta City of Industry ASP(US$ / sqm)
1,080
545 638 605 358 272 164
71
51 55 55
55 39
52
1,159
596 692 659
414 311
217
0
200
400
600
800
1,000
1,200
1,400
1,600
2013A 2014A 2015A 2016A 2017A 9M17A 9M18A
Industrial Estate Real Estate Rental Property
Decrease driven by - Uncertain political
climate (elections)- One-off dispute with
local villagers in 4Q14 (resolved)
94 103 128 150 121 120
0
100
200
2012A 2013A 2014A 2015A 2016A 2017A
30
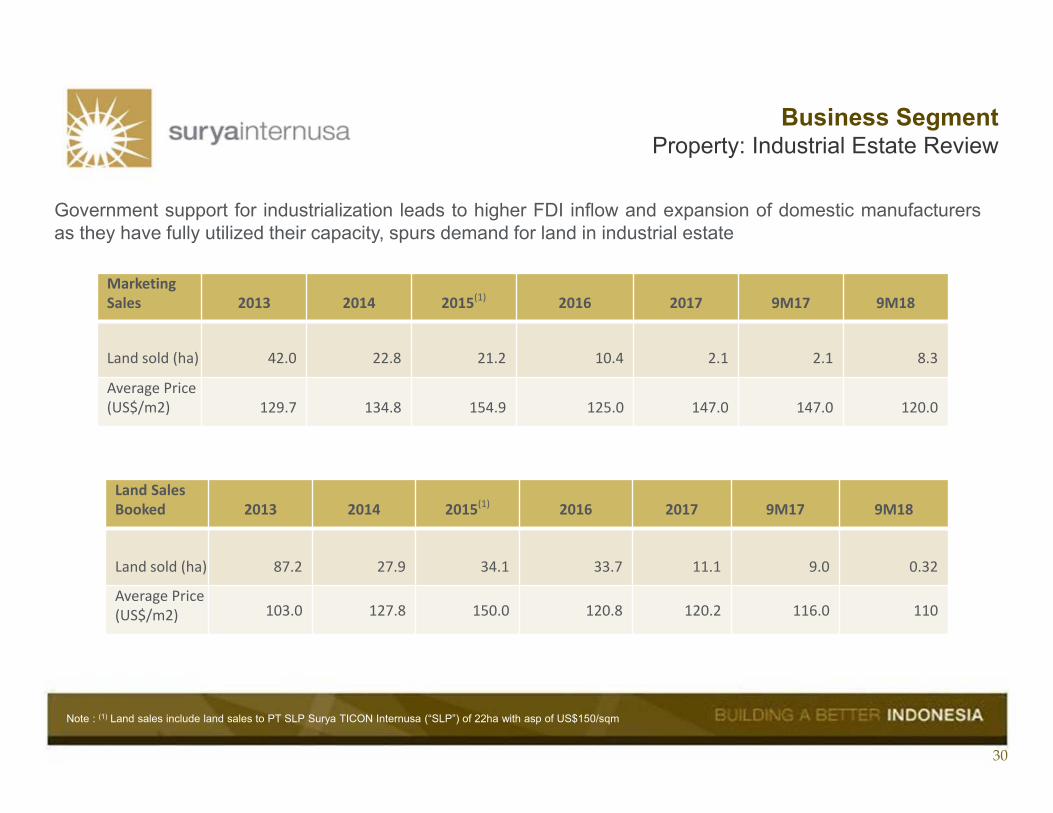
Business SegmentProperty: Industrial Estate Review
Government support for industrialization leads to higher FDI inflow and expansion of domestic manufacturersas they have fully utilized their capacity, spurs demand for land in industrial estate
Note : (1) Land sales include land sales to PT SLP Surya TICON Internusa (“SLP”) of 22ha with asp of US$150/sqm
Land Sales Booked 2013 2014 2015(1) 2016 2017 9M17 9M18
Land sold (ha) 87.2 27.9 34.1 33.7 11.1 9.0 0.32
Average Price (US$/m2) 103.0 127.8 150.0 120.8 120.2 116.0 110
Marketing Sales 2013 2014 2015(1) 2016 2017 9M17 9M18
Land sold (ha) 42.0 22.8 21.2 10.4 2.1 2.1 8.3
Average Price (US$/m2) 129.7 134.8 154.9 125.0 147.0 147.0 120.0
31
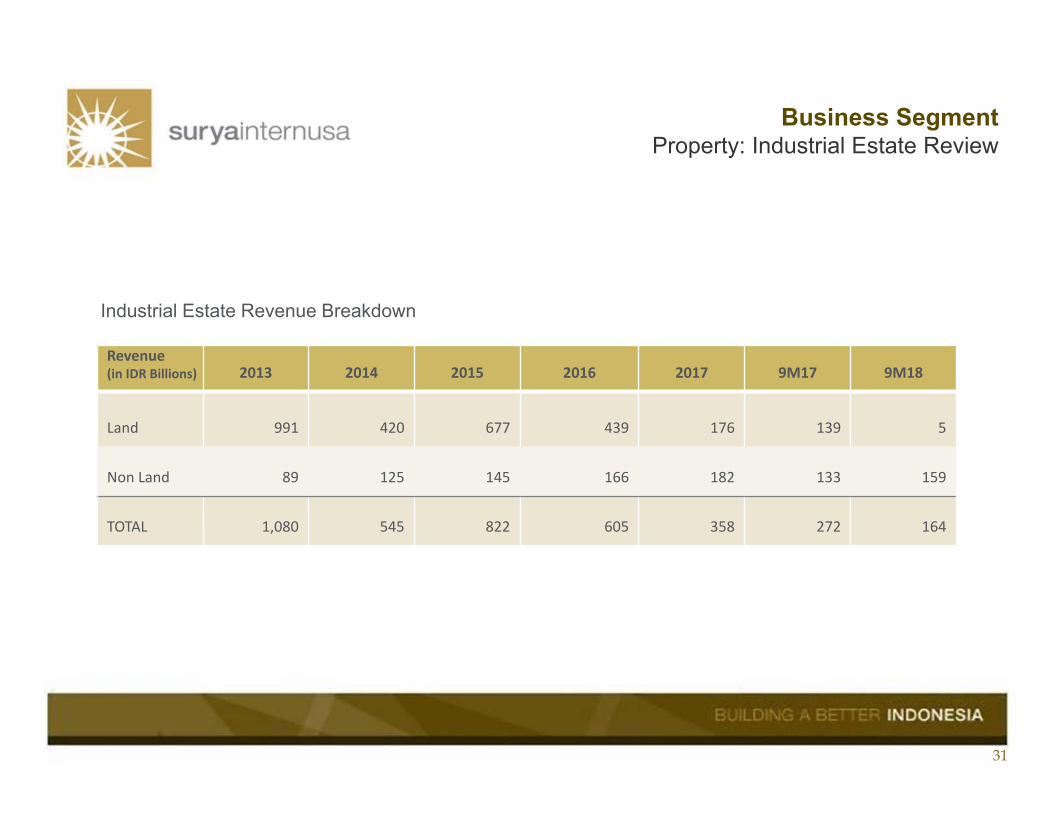
Business SegmentProperty: Industrial Estate Review
Revenue(in IDR Billions) 2013 2014 2015 2016 2017 9M17 9M18
Land 991 420 677 439 176 139 5
Non Land 89 125 145 166 182 133 159
TOTAL 1,080 545 822 605 358 272 164
Industrial Estate Revenue Breakdown
32
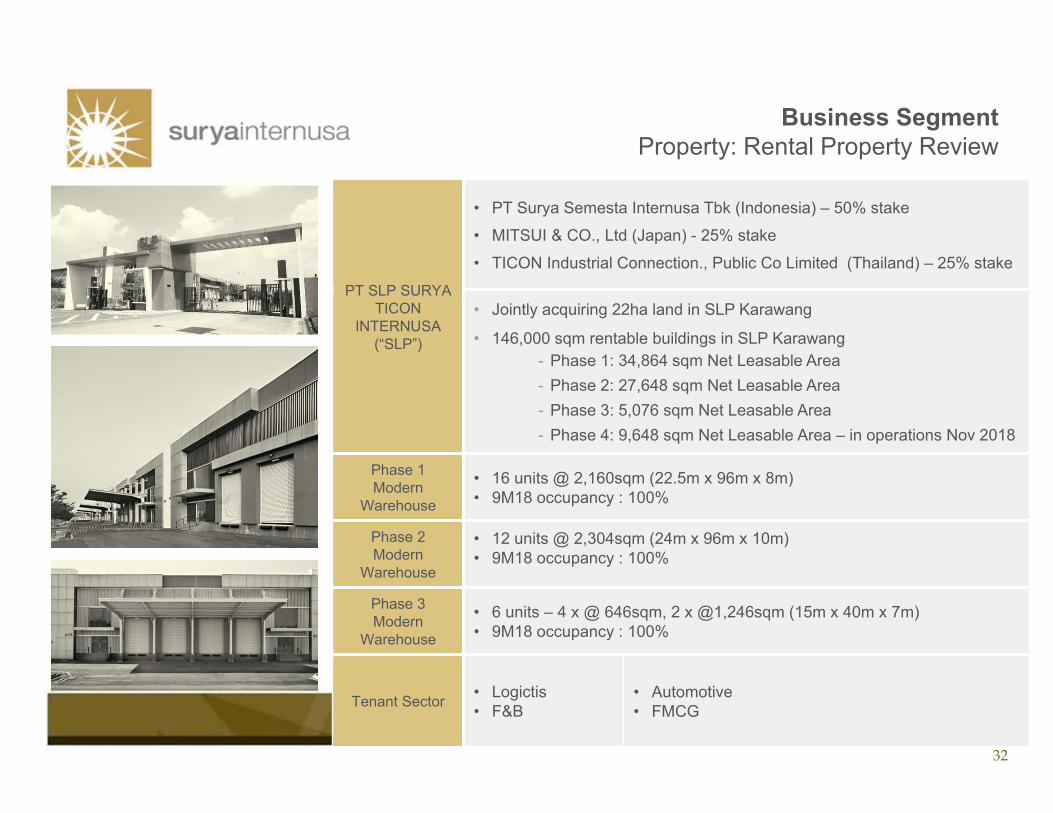
Business SegmentProperty: Rental Property Review
PT SLP SURYA TICON
INTERNUSA(“SLP”)
• PT Surya Semesta Internusa Tbk (Indonesia) – 50% stake• MITSUI & CO., Ltd (Japan) - 25% stake• TICON Industrial Connection., Public Co Limited (Thailand) – 25% stake
• Jointly acquiring 22ha land in SLP Karawang
• 146,000 sqm rentable buildings in SLP Karawang- Phase 1: 34,864 sqm Net Leasable Area- Phase 2: 27,648 sqm Net Leasable Area- Phase 3: 5,076 sqm Net Leasable Area- Phase 4: 9,648 sqm Net Leasable Area – in operations Nov 2018
Phase 1 Modern
Warehouse
• 16 units @ 2,160sqm (22.5m x 96m x 8m)• 9M18 occupancy : 100%
Phase 2Modern
Warehouse
• 12 units @ 2,304sqm (24m x 96m x 10m)• 9M18 occupancy : 100%
Phase 3Modern
Warehouse
• 6 units – 4 x @ 646sqm, 2 x @1,246sqm (15m x 40m x 7m)• 9M18 occupancy : 100%
Tenant Sector • Logictis• F&B
• Automotive• FMCG
33
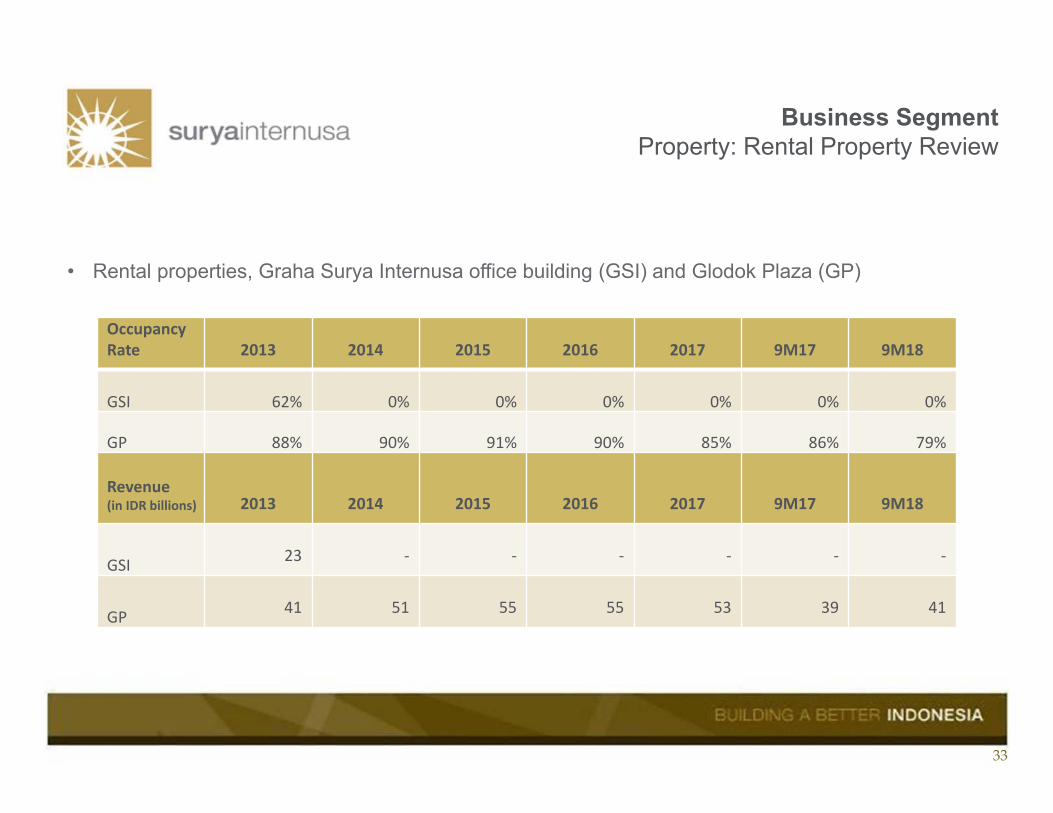
Business SegmentProperty: Rental Property Review
• Rental properties, Graha Surya Internusa office building (GSI) and Glodok Plaza (GP)
Occupancy Rate 2013 2014 2015 2016 2017 9M17 9M18
GSI 62% 0% 0% 0% 0% 0% 0%
GP 88% 90% 91% 90% 85% 86% 79%
Revenue(in IDR billions) 2013 2014 2015 2016 2017 9M17 9M18
GSI 23 ‐ ‐ ‐ ‐ ‐ ‐
GP 41 51 55 55 53 39 41
34
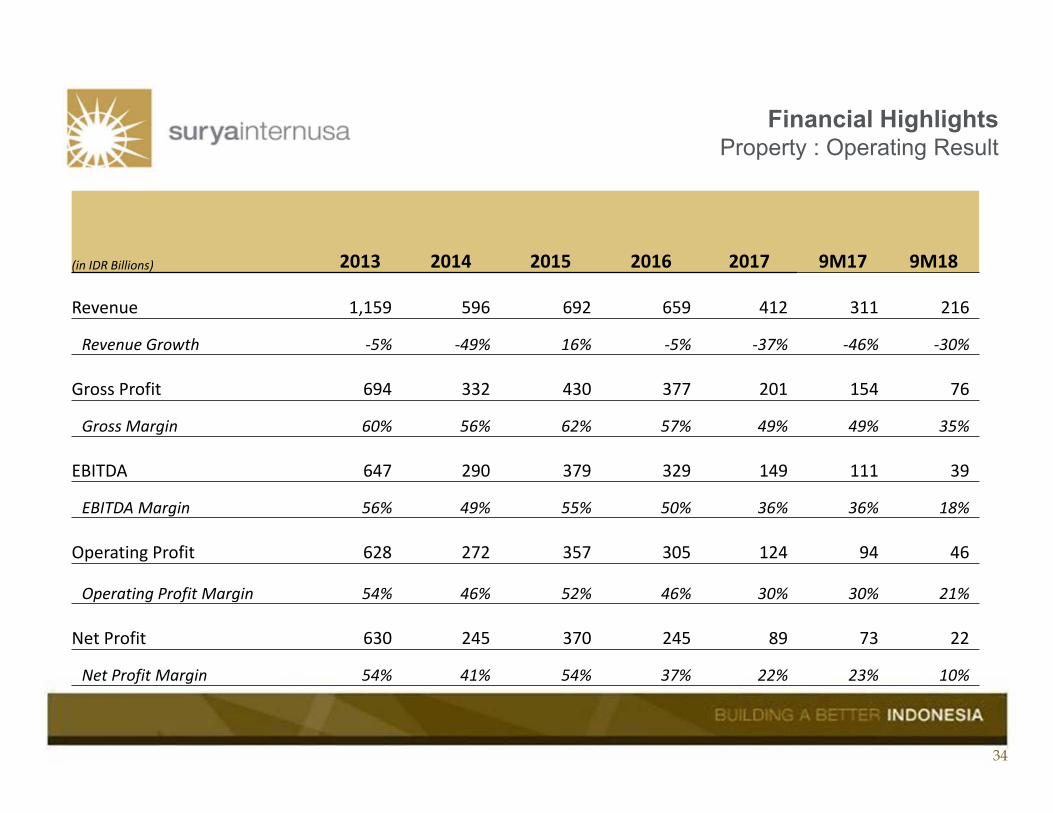
Financial HighlightsProperty : Operating Result
(in IDR Billions) 2013 2014 2015 2016 2017 9M17 9M18
Revenue 1,159 596 692 659 412 311 216
Revenue Growth ‐5% ‐49% 16% ‐5% ‐37% ‐46% ‐30%
Gross Profit 694 332 430 377 201 154 76
Gross Margin 60% 56% 62% 57% 49% 49% 35%
EBITDA 647 290 379 329 149 111 39
EBITDA Margin 56% 49% 55% 50% 36% 36% 18%
Operating Profit 628 272 357 305 124 94 46
Operating Profit Margin 54% 46% 52% 46% 30% 30% 21%
Net Profit 630 245 370 245 89 73 22
Net Profit Margin 54% 41% 54% 37% 22% 23% 10%
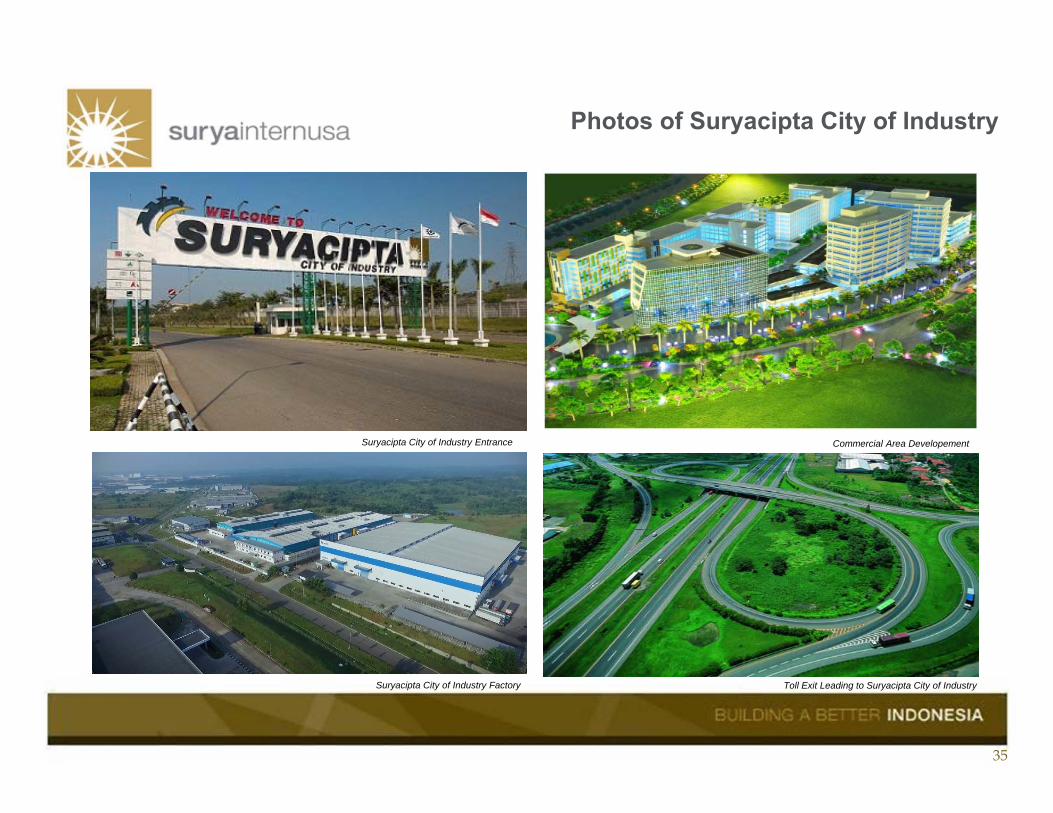
35
Commercial Area DevelopementSuryacipta City of Industry Entrance
Photos of Suryacipta City of Industry
Toll Exit Leading to Suryacipta City of IndustrySuryacipta City of Industry Factory
36
CONSTRUCTION- PT Nusa Raya Cipta Tbk (“NRCA”)
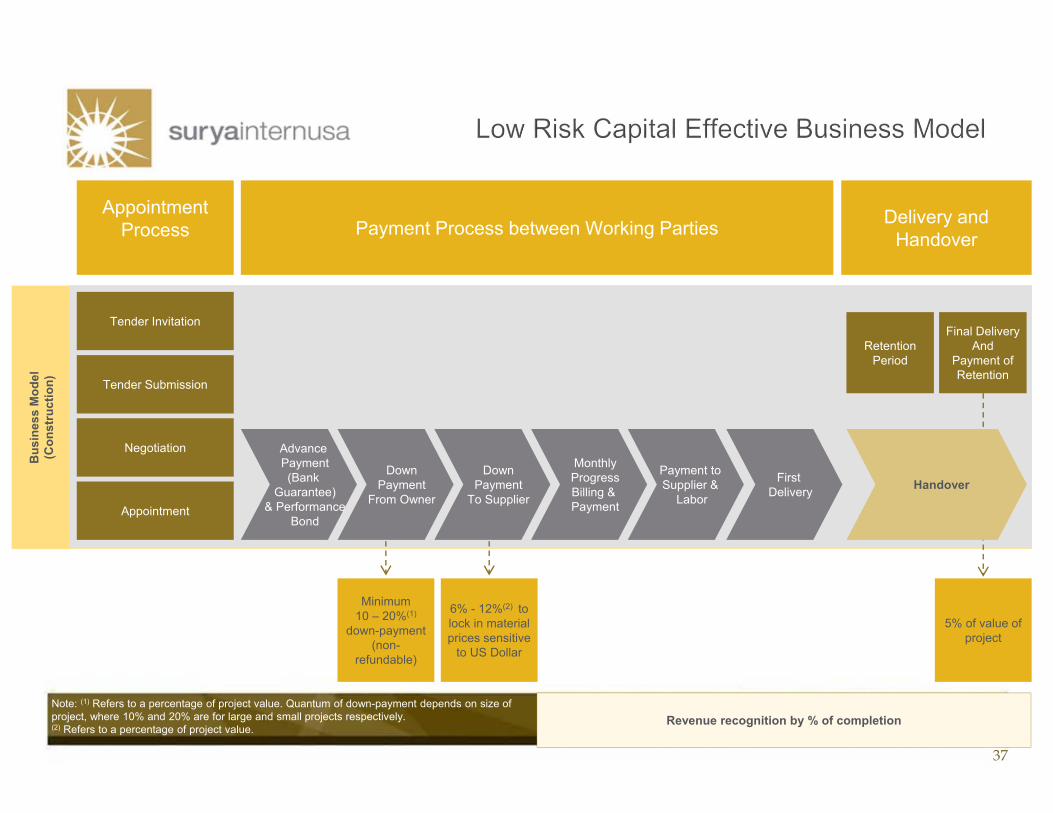
37
Bus
ines
s M
odel
(C
onst
ruct
ion)
Appointment Process
Delivery and HandoverPayment Process between Working Parties
Tender Invitation
Tender Submission
Negotiation
Appointment
Advance Payment(Bank
Guarantee)& Performance
Bond
DownPayment
To Supplier
DownPayment
From Owner
MonthlyProgressBilling & Payment
Payment to Supplier &
LaborHandover
Retention Period
Final DeliveryAnd
Payment of Retention
Minimum 10 – 20%(1)
down-payment(non-
refundable)
6% - 12%(2) to lock in material prices sensitive
to US Dollar
Revenue recognition by % of completion
5% of value of project
First Delivery
Note: (1) Refers to a percentage of project value. Quantum of down-payment depends on size of project, where 10% and 20% are for large and small projects respectively. (2) Refers to a percentage of project value.
38
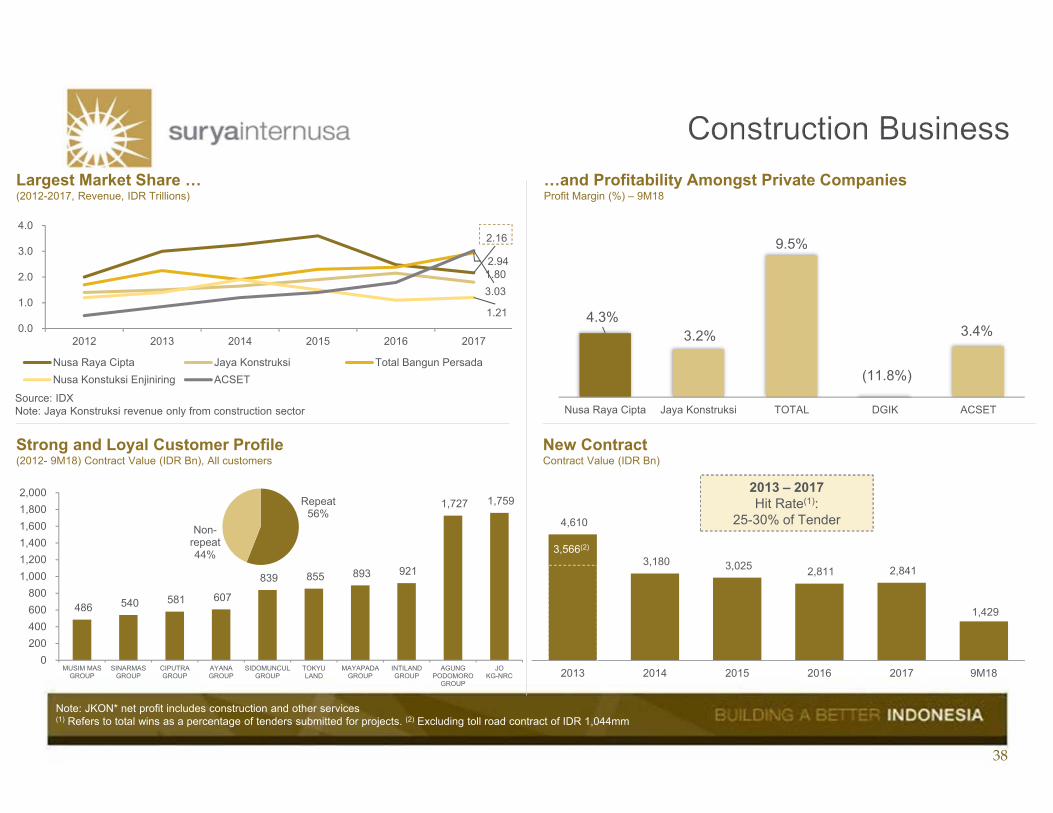
Largest Market Share …(2012-2017, Revenue, IDR Trillions)
…and Profitability Amongst Private CompaniesProfit Margin (%) – 9M18
New ContractContract Value (IDR Bn)
Strong and Loyal Customer Profile(2012- 9M18) Contract Value (IDR Bn), All customers
2013 – 2017Hit Rate(1):
25-30% of Tender
Source: IDXNote: Jaya Konstruksi revenue only from construction sector
Note: JKON* net profit includes construction and other services(1) Refers to total wins as a percentage of tenders submitted for projects. (2) Excluding toll road contract of IDR 1,044mm
3,566(2)
4,610
3,180 3,025 2,811 2,841
1,429
2013 2014 2015 2016 2017 9M18
4.3%3.2%
9.5%
(11.8%)
3.4%
Nusa Raya Cipta Jaya Konstruksi TOTAL DGIK ACSET
486 540 581 607
839 855 893 921
1,727 1,759
0200400600800
1,0001,2001,4001,6001,8002,000
MUSIM MASGROUP
SINARMASGROUP
CIPUTRAGROUP
AYANAGROUP
SIDOMUNCULGROUP
TOKYULAND
MAYAPADAGROUP
INTILANDGROUP
AGUNGPODOMORO
GROUP
JOKG-NRC
Repeat56%
Non-repeat44%
2.16
1.80 2.94
1.21
3.03
0.0
1.0
2.0
3.0
4.0
2012 2013 2014 2015 2016 2017
Nusa Raya Cipta Jaya Konstruksi Total Bangun PersadaNusa Konstuksi Enjiniring ACSET
3,566(2)
39
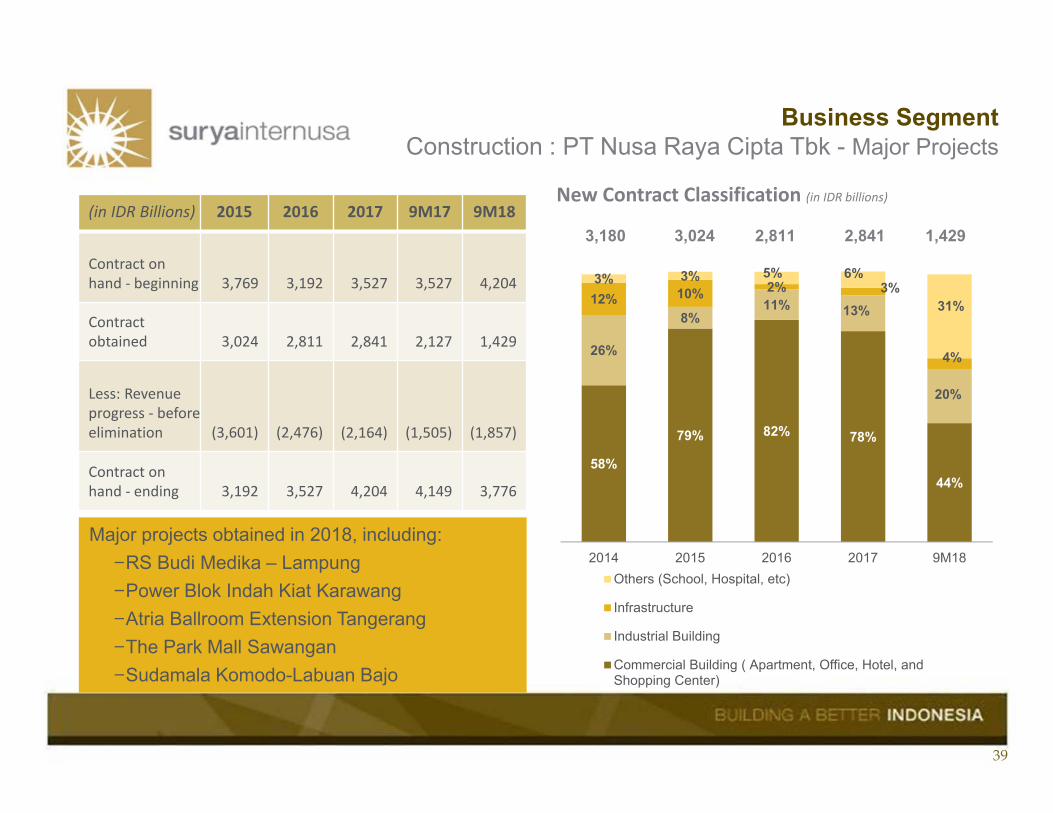
Business SegmentConstruction : PT Nusa Raya Cipta Tbk - Major Projects
58%
79% 82% 78%
44%
26%
8%11% 13%
20%
12% 10% 2% 3%
4%
3% 3% 5% 6%
31%
2014 2015 2016 2017 9M18
New Contract Classification (in IDR billions)
Others (School, Hospital, etc)
Infrastructure
Industrial Building
Commercial Building ( Apartment, Office, Hotel, andShopping Center)
3,180 3,024 2,811 2,841 1,429
Major projects obtained in 2018, including:−RS Budi Medika – Lampung−Power Blok Indah Kiat Karawang−Atria Ballroom Extension Tangerang−The Park Mall Sawangan−Sudamala Komodo-Labuan Bajo
(in IDR Billions) 2015 2016 2017 9M17 9M18
Contract on hand ‐ beginning 3,769 3,192 3,527 3,527 4,204
Contract obtained 3,024 2,811 2,841 2,127 1,429
Less: Revenue progress ‐ before elimination (3,601) (2,476) (2,164) (1,505) (1,857)
Contract on hand ‐ ending 3,192 3,527 4,204 4,149 3,776

40
Business SegmentConstruction : Operating Result
Note: NRCA Operating Result doesn’t include intercompany eliminations ROE are annualized
(in IDR Billions) 2013 2014 2015 2016 2017 9M17 9M18
Revenue 3,006 3,311 3,601 2,476 2,164 1,505 1,859 Revenue Growth 49% 10% 9% ‐31% ‐13% ‐23% 23%
Gross Profit 251 302 324 253 215 149 175 Gross Margin 8% 9% 9% 10% 10% 10% 9%
Income from JO 63 176 112 31 27 0 7
EBITDA 298 419 341 211 275 212 154 EBITDA Margin 10% 13% 10% 9% 13% 14% 8%
Operating Profit 210 205 186 142 218 187 126 Operating Profit Margin 7% 6% 5% 6% 10% 12% 7%
Net Profit 189 278 198 101 153 113 80 Net Profit Margin 6% 8% 5% 4% 7% 8% 4%
EPS (full amount) 211 112 80 41 64 46 33 ROE 24% 28% 18% 9% 13% 13% 9%
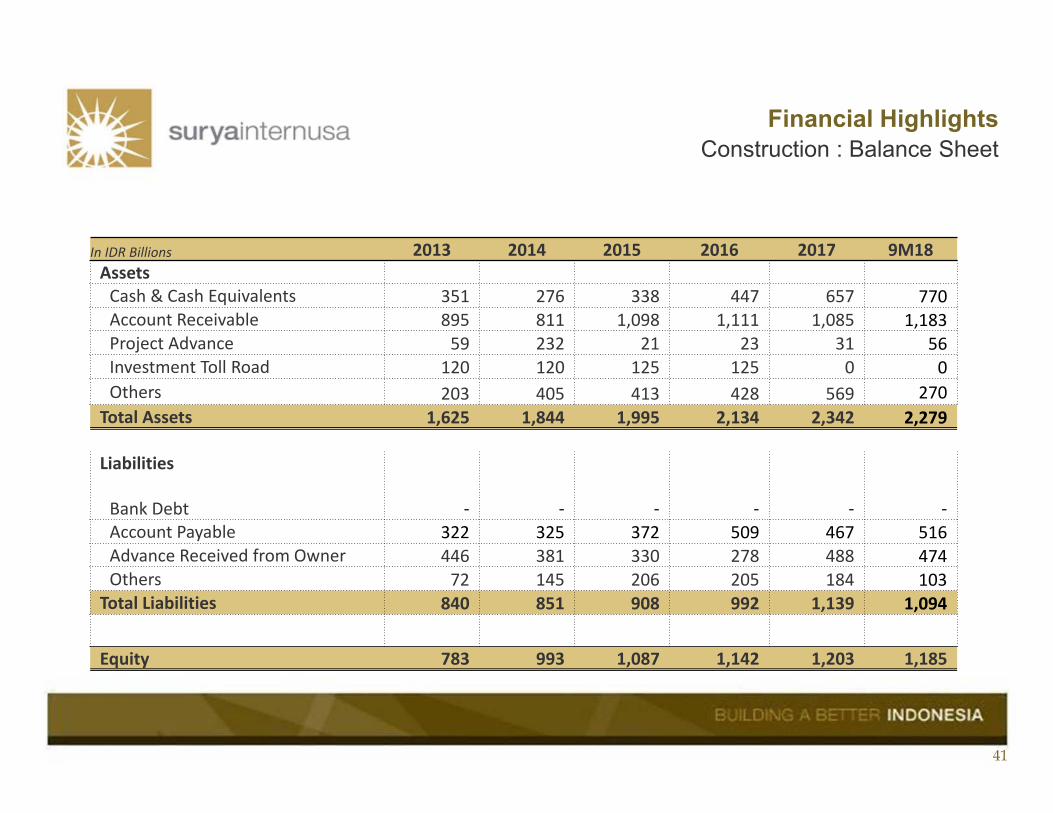
41
Financial HighlightsConstruction : Balance Sheet
In IDR Billions 2013 2014 2015 2016 2017 9M18AssetsCash & Cash Equivalents 351 276 338 447 657 770Account Receivable 895 811 1,098 1,111 1,085 1,183Project Advance 59 232 21 23 31 56Investment Toll Road 120 120 125 125 0 0Others 203 405 413 428 569 270
Total Assets 1,625 1,844 1,995 2,134 2,342 2,279
Liabilities
Bank Debt ‐ ‐ ‐ ‐ ‐ ‐Account Payable 322 325 372 509 467 516Advance Received from Owner 446 381 330 278 488 474Others 72 145 206 205 184 103
Total Liabilities 840 851 908 992 1,139 1,094
Equity 783 993 1,087 1,142 1,203 1,185
42
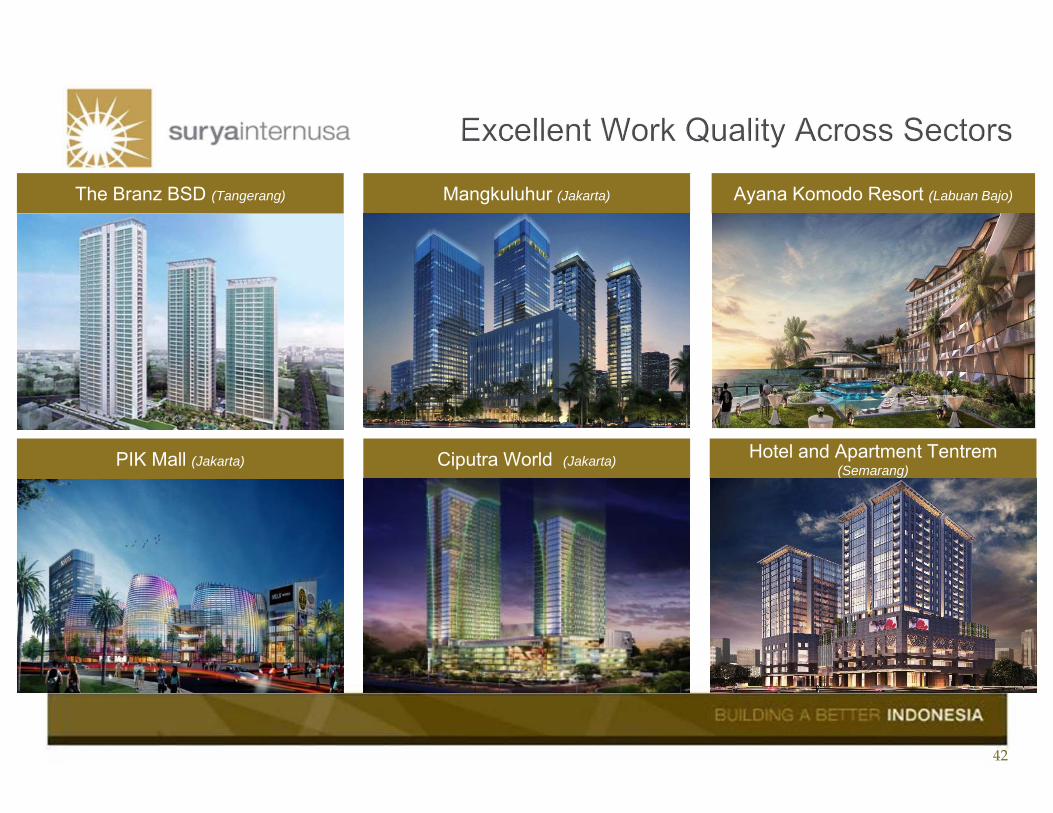
The Branz BSD (Tangerang) Mangkuluhur (Jakarta) Ayana Komodo Resort (Labuan Bajo)
PIK Mall (Jakarta) Ciputra World (Jakarta) Hotel and Apartment Tentrem(Semarang)
43
Hospitality- PT Suryalaya Anindita International (“SAI”)- PT Ungasan Semesta Resort (“USR”)- PT Surya Internusa Hotels (“SIH”)
44
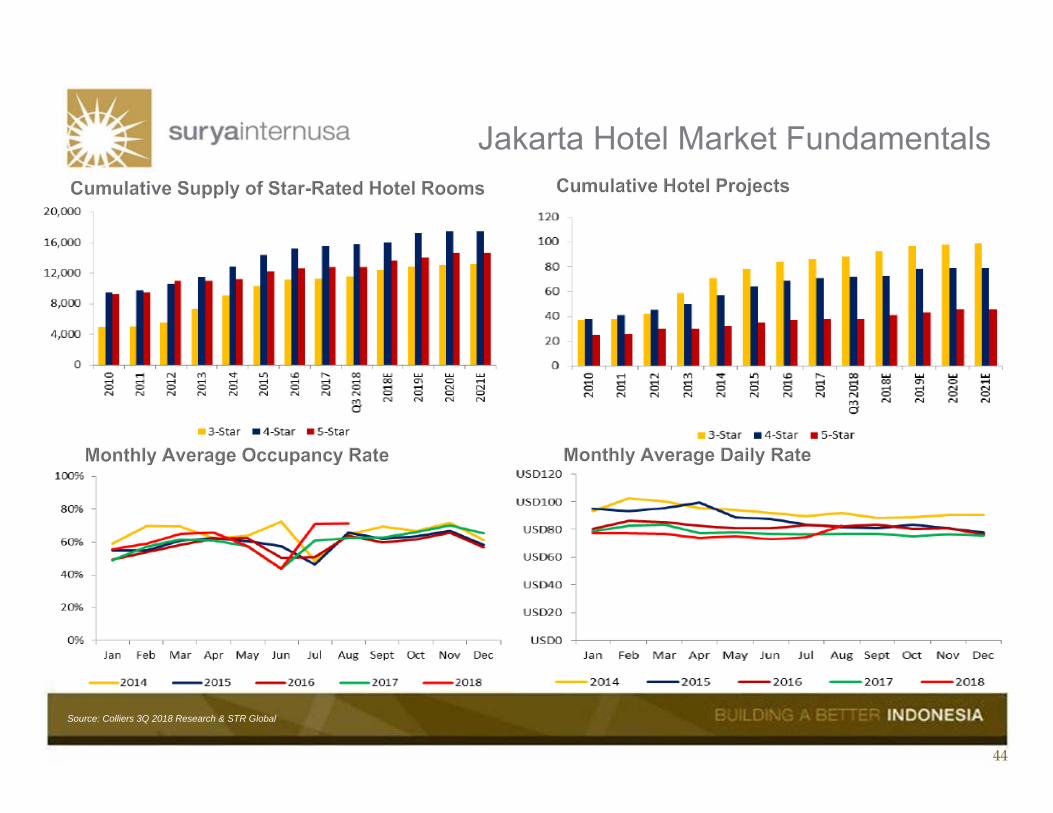
Jakarta Hotel Market Fundamentals
Source: Colliers 3Q 2018 Research & STR Global
45
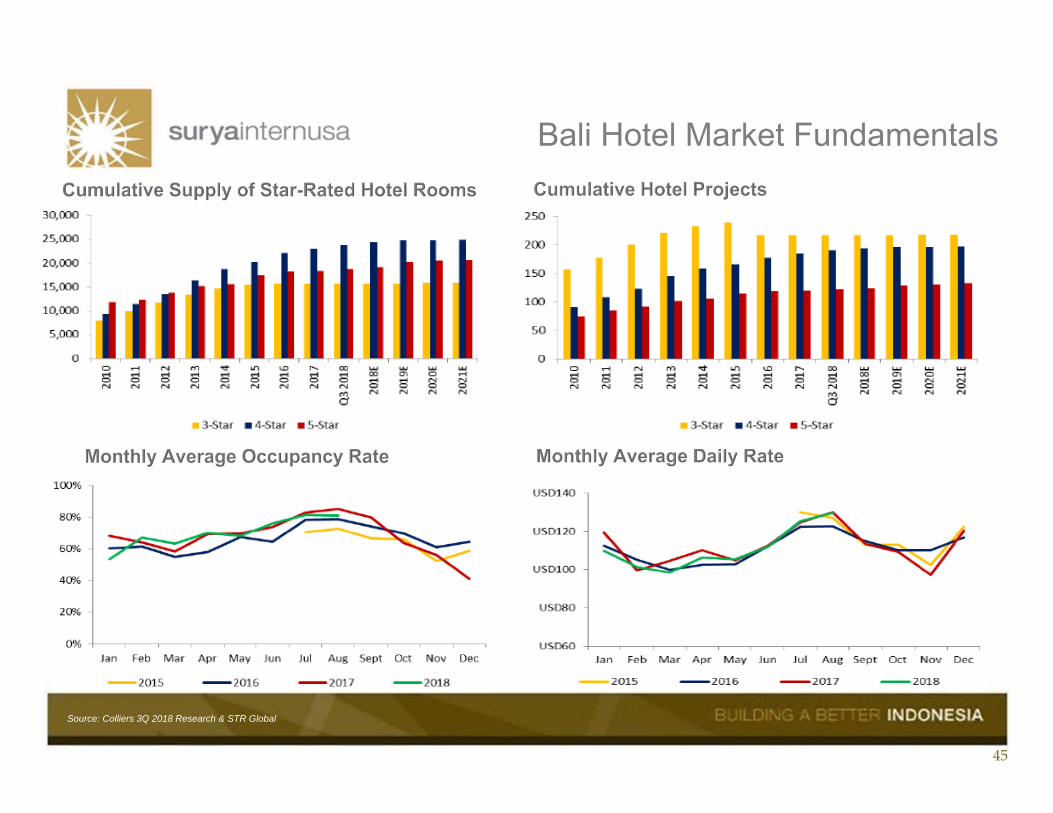
Bali Hotel Market Fundamentals
Source: Colliers 3Q 2018 Research & STR Global

46
209 194 200 171 151
243 274 261 286 315
124 144 162 155 151
14 32 66 80
2013 2014 2015 2016 2017Gran Melia Melia Bali Banyan Tree BATIQA+PHG
697
576626
655 678
Revenue(2013-2017, IDR Billions)
Occupancy Rate(2013-9M18)
Room RevPar (3)
(2013-9M18, US$)
Opened Six BATIQA Hotels by 2016(1)
Note: (1) Locations include Karawang, Cirebon, Jababeka, Palembang, Pekanbaru, Lampung(2) Occupancy rate consists of the average occupancy of BATIQA Karawang, Cirebon, Jababeka, Palembang, Pekanbaru, Lampung(3) Average of full period USDIDR exchange rate used to convert BATIQA room RevPar
48.7%
80.3%
55.3%60.9% 61.7%(2)
20%
30%
40%
50%
60%
70%
80%
90%
2013 2014 2015 2016 2017 9M18
Gran Melia Melia Bali Banyan Tree BATIQA
66 56 59 50 46 47 84 84 69 73 77 87
313 324 316 287 281
260
28 20 12 14 15
2013A 2014A 2015A 2016A 2017A 9M18AGran Meliá Meliá Bali Banyan Tree BATIQA
47
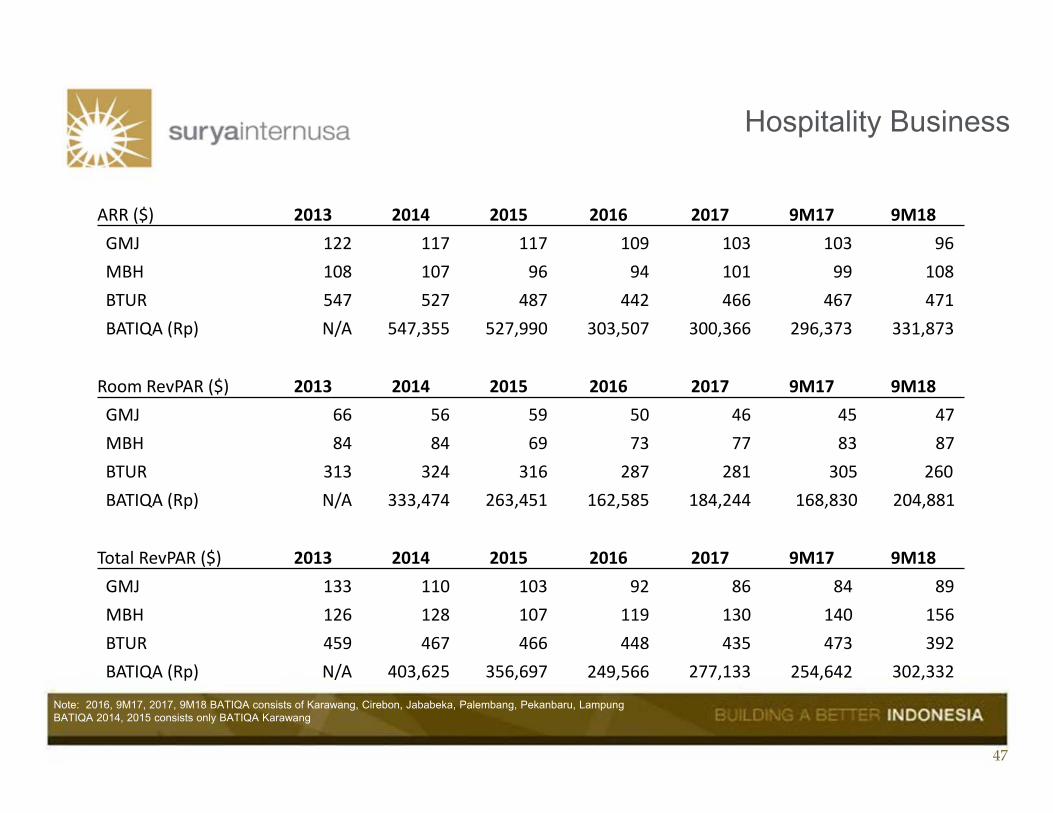
Hospitality Business
Note: 2016, 9M17, 2017, 9M18 BATIQA consists of Karawang, Cirebon, Jababeka, Palembang, Pekanbaru, LampungBATIQA 2014, 2015 consists only BATIQA Karawang
ARR ($) 2013 2014 2015 2016 2017 9M17 9M18GMJ 122 117 117 109 103 103 96MBH 108 107 96 94 101 99 108BTUR 547 527 487 442 466 467 471BATIQA (Rp) N/A 547,355 527,990 303,507 300,366 296,373 331,873
Room RevPAR ($) 2013 2014 2015 2016 2017 9M17 9M18GMJ 66 56 59 50 46 45 47 MBH 84 84 69 73 77 83 87 BTUR 313 324 316 287 281 305 260 BATIQA (Rp) N/A 333,474 263,451 162,585 184,244 168,830 204,881
Total RevPAR ($) 2013 2014 2015 2016 2017 9M17 9M18GMJ 133 110 103 92 86 84 89 MBH 126 128 107 119 130 140 156 BTUR 459 467 466 448 435 473 392 BATIQA (Rp) N/A 403,625 356,697 249,566 277,133 254,642 302,332
48
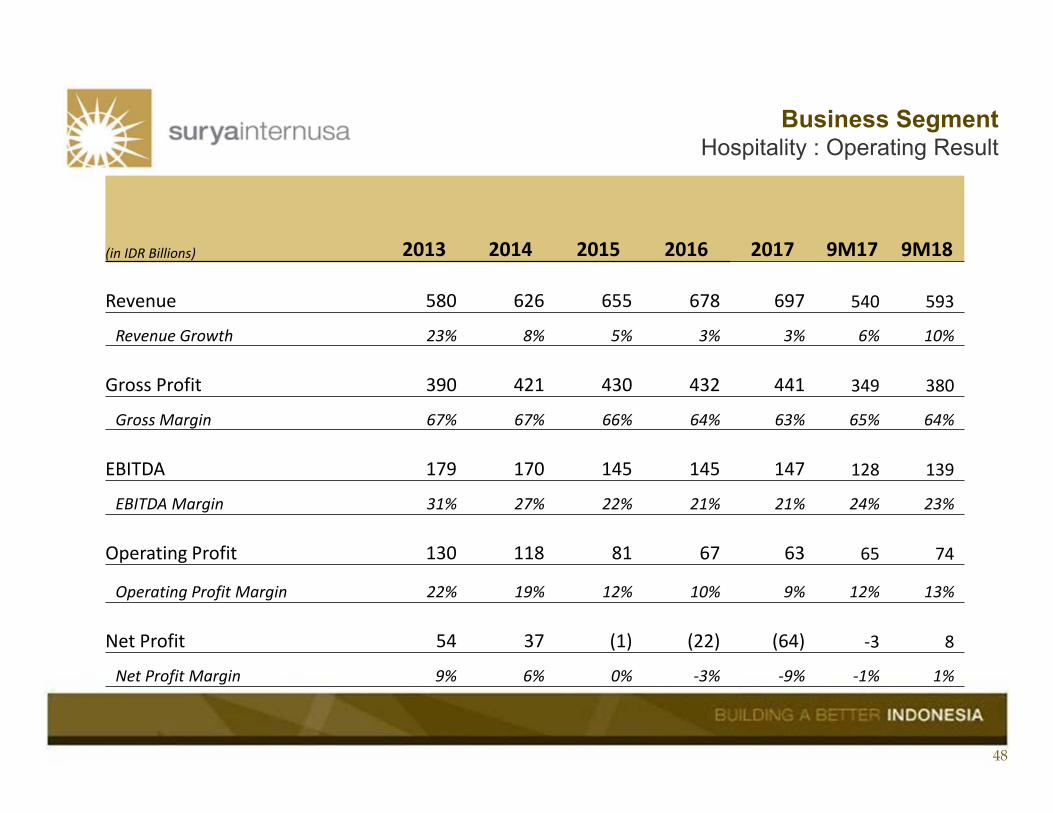
Business SegmentHospitality : Operating Result
(in IDR Billions) 2013 2014 2015 2016 2017 9M17 9M18
Revenue 580 626 655 678 697 540 593
Revenue Growth 23% 8% 5% 3% 3% 6% 10%
Gross Profit 390 421 430 432 441 349 380
Gross Margin 67% 67% 66% 64% 63% 65% 64%
EBITDA 179 170 145 145 147 128 139
EBITDA Margin 31% 27% 22% 21% 21% 24% 23%
Operating Profit 130 118 81 67 63 65 74
Operating Profit Margin 22% 19% 12% 10% 9% 12% 13%
Net Profit 54 37 (1) (22) (64) ‐3 8
Net Profit Margin 9% 6% 0% ‐3% ‐9% ‐1% 1%
49
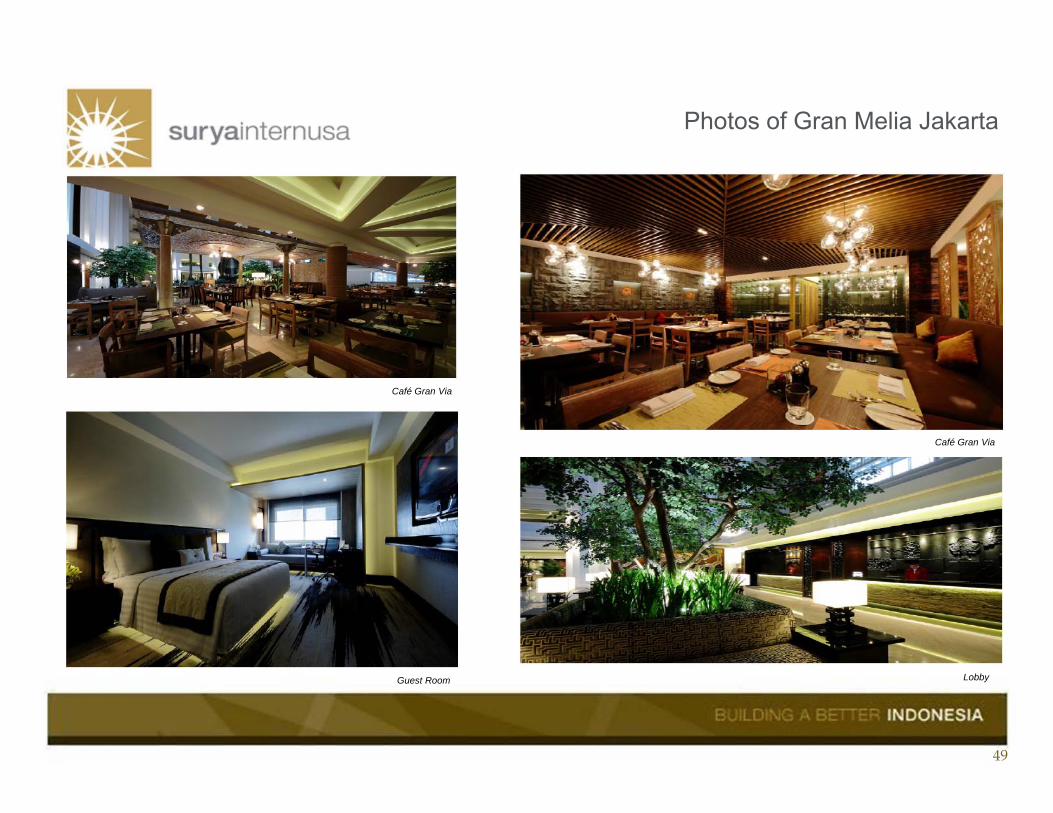
Café Gran Via
Lobby
Café Gran Via
Guest Room
Photos of Gran Melia Jakarta

50
Villa Main Pool
Family Suite Room
Photos of Melia Bali Hotel
Lobby Hotel
51
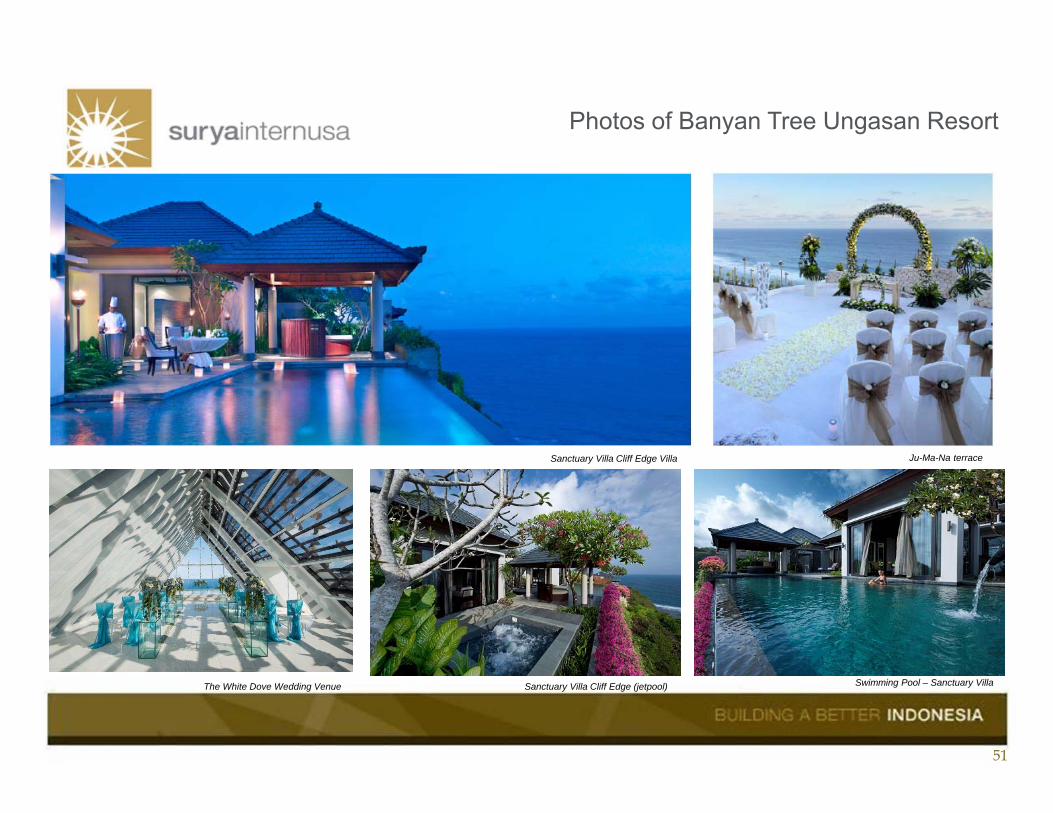
Photos of Banyan Tree Ungasan Resort
Sanctuary Villa Cliff Edge Villa Ju-Ma-Na terrace
Sanctuary Villa Cliff Edge (jetpool) Swimming Pool – Sanctuary VillaThe White Dove Wedding Venue
52
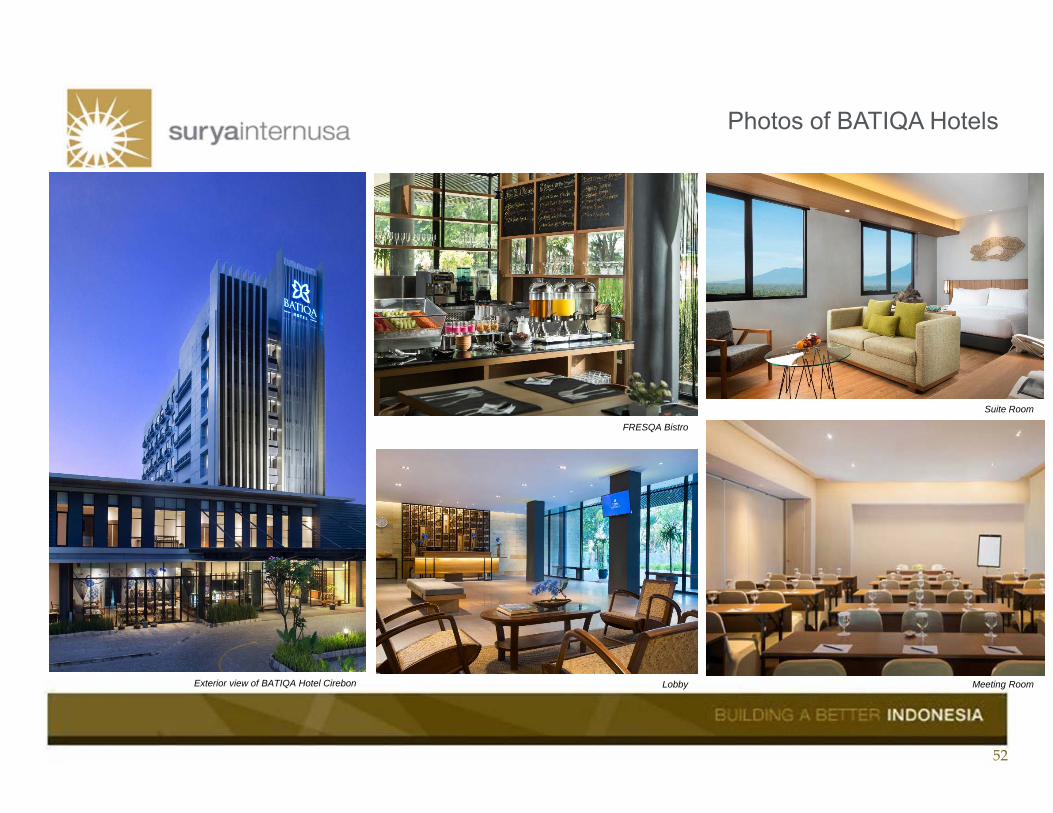
Photos of BATIQA Hotels
Exterior view of BATIQA Hotel Cirebon
FRESQA Bistro
Lobby
Suite Room
Meeting Room

53
Country Japan Japan Thailand Spain Singapore Indonesia Malaysia
Business Description / Strengths
One of Japan’s major trading and investment company with presence in 136 locations in 67 countries
Operates through Metal Products Transportation and Construction Systems; Infrastructure; Media, Resources, Energy, Chemical, and Electronics business segments
One of the most diversified and comprehensive trading investment and service enterprises globally
General trading business operating through Iron & Steel, Mineral & Metal, Infrastructure, Integrated Transportation, Chemicals, Energy
Develops and provides international standard ready-built factories for lease in Thailand
Named Thailand’s Second Best Real Estate Developer Award 2014 (Euromoney)
One of Spain’s leading hotel company and one of the largest hotel companies in the world
Managed brands include: Club Meliá, Meliá Hotels & Resorts and Sol Hotels & Resorts
Manager and developer of premium resorts, hotels and spas in the Asia Pacific
Award-winning managed brands: Banyan Tree and Angsana
Operates leading integrated resort in Thailand—Laguna Phuket
Leading private equity fund focusing in growth capital and special situation investments in Indonesia
Business interests span natural resources, energy, infrastructure, telecommunication, and consumer goods
Engineering-based infrastructure and services group
Established track record and operations in expressways, townships & property development, engineering & construction, and assets & facility management
Partnership Arrangements
Marketing agent
Responsible for introducing Japanese clients / tenants for Suryacipta City of Industry
Joint venture partners
Jointly acquiring 22ha land in SLP Karawang(50% SSIA / 25% TICON% / 25% Mitsui)
146,000 sqm rentable buildings in SLP Karawang- Phase 1: 34,864 sqm completed- Phase 2: 27,648 sqm completed- Phase 3: 5,076 sqm completed- Phase 4 : 9,648 sqm – in operations Nov 2018
Management agreement, trademark license and international marketing and promotional services agreements effective till 2020
Management agreement to provide operational services, personnel, commercial, purchasing and quality control services
Villas commercialized under “Banyan Tree” brand
Joint venture partners (until 8 May 2017)
Jointly developed Cikopo-Palimanan toll road (20.5% SSIA / 6.5% NRCA / 55% UEM / 18% Saratoga), which was completed and inaugurated on 13 June 2015, and it is currently operational
Exchange of sector and development expertiseExchange of sector and development expertise
Expand network and strengthen competitiveness
Expand network and strengthen competitiveness
Increase branding strength and international credibility
Increase branding strength and international credibility
Reduce capital outlay requirements for new developments
Reduce capital outlay requirements for new developments
Industrial Partner Hotel Partner Trans-Java Toll Road network Trans-Java Toll Road networkIndustrial Partner Industrial Partner Hotel Partner
54
Thank You
55
These materials have been prepared by PT Surya Semesta Internusa Tbk (the “Company”, “SSIA”) and have not beenindependently verified. No representation or warranty, expressed or implied, is made and no reliance should be placed on theaccuracy, fairness or completeness of the information presented or contained in these materials. The Company or any of itsaffiliates, advisers or representatives accepts no liability whatsoever for any loss howsoever arising from any informationpresented or contained in these materials. The information presented or contained in these materials is subject to change withoutnotice and its accuracy is not guaranteed.
These materials may contain statements that constitute forward-looking statements. These statements include descriptionsregarding the intent, belief or current expectations of the Company or its officers with respect to the consolidated results ofoperations and financial condition of the Company. These statements can be recognized by the use of words such as “expects,”“plan,” “will,” “estimates,” “projects,” “intends,” or words of similar meaning. Such forward-looking statements are not guaranteesof future performance and involve risks and uncertainties, and actual results may differ from those in the forward-lookingstatements as a result of various factors and assumptions. The Company has no obligation and does not undertake to reviseforward-looking statements to reflect future events or circumstances.
These materials are for information purposes only and do not constitute or form part of an offer, solicitation or invitation of anyoffer to buy or subscribe for any securities of the Company, in any jurisdiction, nor should it or any part of it form the basis of, orbe relied upon in any connection with, any contract, commitment or investment decision whatsoever. Any decision to purchase orsubscribe for any securities of the Company should be made after seeking appropriate professional advice.