Embed Size (px)
Citation preview

PTOM Impacts on Bus Driver Employment Conditions and Wage Rates Final Report
3 August 2018
Ian Wallis
Associates Ltd
Releas
ed un
der th
e
Official
Infor
mation
Act 19
82
ii
ABOUT ALLEN + CLARKE
Allen and Clarke Policy and Regulatory Specialists Limited (Allen + Clarke) is a consultancy firm
based in Wellington, New Zealand. We specialise in policy and programme development and
implementation, research and evaluation, business change, operational management and risk, and
secretariat and programme support services. A key component of our work is undertaking
reviews and developing and implementing policies that improve the outcomes for the public.
Founded in 2001, the company is owned and managed by senior staff and has a team of
approximately forty-nine senior evaluation and policy practitioners, analysts and project support
staff. Our company works extensively for a range of government agencies in New Zealand, and
international clients and non-government organisations in the Pacific and Asia. More information
about our work can be found on our website: www.allenandclarke.co.nz.
IAN WALLIS ASSOCIATES LTD
Ian Wallis Associates is a Wellington-based specialist consultancy in urban public transport
planning and policy issues. The company has undertaken numerous assignments on bus sector
reform, policy evaluation, service planning, service procurement and contracting matters. Our
clients include most public transport authorities and major operators in New Zealand and
Australia, and many transport authorities internationally.
JARVIS MCDONALD GROUP
Jarvis McDonald Group Ltd (JMG) provides advice and analytical capability to central and local
government, public sector agencies, NGOs and iwi. Achievements are built on strong networks
with government agencies, partner organisations and providers, underpinned by solid and proven
capability of its consultant base. Its analytical and data modelling capability provides clarity and
insight to organisations and the way they work. JMG Managing Director Bill McDonald has held
senior financial positions at Wellington City Council. As a consultant he has applied his strategic,
financial and analytical acumen to a wide range of development, investment and business case
projects.
Document status: Final Allen + Clarke has been independently certified as
compliant with ISO9001:2015 Quality Management Systems
Version and date: V3.0; 3 August 2018
Author(s): Grant McLean, Ian Wallis, Bill McDonald, Nick Leffler
Filing Location: W:\the Ministry of Transport\PTOM impact on employment conditions research\Report
Peer / technical review:
Paul Houliston
Verification that QA changes made:
Nick Leffler
Proof read: Nick Leffler
Formatting: Nick Leffler
Final QA check and approved for release:
Paul Houliston
Releas
ed un
der th
e
Official
Infor
mation
Act 19
82

PTOM Impacts on Bus Driver Employment Conditions and Wage Rates iii
CONTENTS
EXECUTIVE SUMMARY 1
1. INTRODUCTION 3
1.1. Purpose 3 1.2. Scope 3 1.3. Structure of this report 4 1.4. Probity 5 1.5. Limitations 5
2. BACKGROUND AND RESEARCH PURPOSE 6
2.1. PTOM Context 6 2.2. Research approach 8
3. INITIAL SYSTEM LEVEL IMPACTS OF PTOM 10
3.1. PTOM approach to operator procurement 10 3.2. Increased competition for tendered contracts 11 3.3. PTOM impacts on bus operator market shares 11 3.4. Regional Council views on PTOM procurement and contracting process 12 3.5. Impacts on service levels, contract costs and public funding requirements 14
4. IMPACTS ON BUS DRIVERS 15
4.1. National Context 15 4.2. Modelling bus driver wages 20 4.3. Key Findings 21
5. OPPORTUNITIES FOR FURTHER RESEARCH 25
5.1. Impact on Business Processes and Rules and Custom and Practice 25 5.2. Working conditions and Health and Safety 25 5.3. Post-evaluation of PTOM 25
Releas
ed un
der th
e
Official
Infor
mation
Act 19
82
iv
Tables
Table 1: PTOM bus contract procurement approaches 10
Table 2: Competition for tendered contracts 11
Table 3: Change in market share (Auckland and Wellington) 12
Table 4: Summary of RC survey responses to qualitative questions 13
Table 5: Impact on service levels and costs (Auckland and Wellington) 14
Table 6: Average bus driver wages by region 16
Table 7: Comparison of employment conditions between Auckland and Wellington operators 18
Table 8: Change in operator staff numbers 22
Figures
Figure 1: Evolution of public transport contracting environment 1992-2017 7
Figure 2: Determinants of bus driver terms and conditions 9
Figure 3: NZ Bus loss of market share in Auckland and Wellington 12
Figure 4: Bus driver wages 2005-2017 adjusted by average hourly earnings 16
Figure 5: Average Effective Hourly Rates in Greater Wellington Region 20
Figure 6: Average Effective Hourly Rate in Auckland 21
Releas
ed un
der th
e
Official
Infor
mation
Act 19
82

Context
Initial System Level Impacts of PTOM
Executive Summary
Implementation of the Public Transport Operating Model (PTOM) started in. 2015.
PTOM has increased competition for contracts and operators with cost structures above the industry norm have been largely unsuccessful in tendering.
PTOM aims to facilitate innovation and deliver the best value for money through competitive tendering of public transport services.
There has been a major shift in the operator landscape with the dominant incumbent provider, NZ Bus, losing significant market share.
There are early indications that there have been some improvements in the quality of public transport services without a significant increase in cost.
The proportion of service kms provided by NZ Bus fell from 61% to 34% in Auckland and from 73% to 29% in Wellington.
The impact on bus driver employment conditions and wage rates is less well known.
Service kms in Auckland and Wellington combined increased by 25% with only a 4% increase in gross contract costs.
As a result, the efficiency of the bus sector has improved substantially with gross contract costs per service km falling by 17%.
1
Releas
ed un
der th
e
Official
Infor
mation
Act 19
82

2
The impact on drivers is driven by the change in the operator landscape with drivers of incumbent operators needing to either move to a new operator or leave the sector.
In Auckland, drivers who move from NZ Bus to another operator are almost always worse off.
The dominant incumbent operators in Auckland and Wellington typically have complex employment agreements where effective pay largely depends on tenure, seniority and penal rates for overtime work.
Drivers who move from NZ Bus (Valley Flyer), Mana or Uzabus to Tranzit are better off.
Those with 5-10 years of service depend on the business processes and culture of NZ Bus post-PTOM.
Those with more than 10 years of service are likely worse off at Tranzit.
Most other operators typically have simple agreements with flat wage rates and no penal rates.
In Wellington, the impact on drivers who move from NZ Bus (Go Wellington) to Tranzit depends on the length of their service.
Drivers with less than 5 years of service are likely better off at Tranzit.
Impact on effective pay of bus drivers
In other regions, operators typically already used flat-rate employment agreements and drivers are not likely to be impacted.
Impacts on Bus Driver Employment Agreements
Releas
ed un
der th
e
Official
Infor
mation
Act 19
82
PTOM Impacts on Bus Driver Employment Conditions and Wage Rates 3
1. INTRODUCTION
The Ministry of Transport (the Ministry) commissioned Allen + Clarke in association with
public transport specialists Ian Wallis and Bill McDonald to undertake research into the
impacts of the Public Transport Operating Model (PTOM) on bus driver employment conditions
and wage rates. The research was conducted in two phases: a feasibility assessment phase and
the research and analysis phase.
The research scope included a targeted regional breakdown of the effects of PTOM on bus
driver employment conditions and wage rates that primarily focuses on Auckland and
Wellington, with some reference to other areas where there appear to be significant impacts
on bus drivers. These two regions employ the majority of bus drivers and are known to have
had a recent and direct impact on employment conditions and wage rates.
The research endeavoured to gather complete information on employment conditions and
wage rates across all the key stakeholders within the eight-week timeframe of the research.
While not all stakeholders agreed to provide information or respond, the research team
(through the feasibility assessment phase) is confident it secured sufficient data to conduct a
robust analysis of the effects of PTOM on employment conditions and wage rates; where there
are data gaps, these are acknowledged.
1.1. Purpose
Early evidence of operations contracted under PTOM suggests that it has resulted in some
improvements in the quality of public transport services without a significant increase in cost.
However, the Ministry does not currently have clear evidence on whether or not PTOM has had
impacts on employment conditions and wage rates of public transport workers.
The Ministry commissioned Allen + Clarke, in association with public transport specialists Ian
Wallis and Bill McDonald,1 to undertake research into the effects of PTOM on bus driver
employment conditions and wage rates. The research was undertaken in two-phases with an
initial feasibility assessment to confirm sufficient data would be available to conduct robust
analysis (Phase 1)2 and, subject to the feasibility assessment, collecting and analysing the available
data (Phase 2), which is reported here.
1.2. Scope
This research project addresses the Ministry's commitment to undertake research to explore the
effects of PTOM on wages, salaries and employment conditions in the first half of 2018.
The project is part of a broader suite of work the Ministry is engaged in that will include a post-
evaluation of PTOM and research, in collaboration with the NZ Transport Agency (NZTA), to
explore how the PTOM procurement provisions could be strengthened to improve employment
protections and other outcomes. The Ministry of Business, Innovation and Employment (MBIE) is
1 Ian Wallis was contracted through Ian Wallis Associates. Bill McDonald was contracted through Jarvis McDonald Group. 2 The feasibility study findings were reported separately and provided confirmation that the research could be conducted, which was subsequently agreed by the Ministry.
Releas
ed un
der th
e
Official
Infor
mation
Act 19
82

4
also investigating a range of areas around employment conditions and procurement, including
Fair Pay Agreements.
While the employment conditions and wage rates of all workers in the public transport industry
may be affected by the changes arising from PTOM, it was agreed that for the purposes of this
research the focus is on bus drivers due to:
• drivers being the largest group affected by the change of bus operations; and
• concerns expressed by unions highlighting bus drivers as the most affected group,
facing the most significant reduction in employment conditions.
The key research questions were:
Does PTOM impact on the wages and employment conditions of public bus drivers?
If yes, what are those impacts?
If yes, do the impacts differ by:
• region? different bus driver workforces? other bus driver characteristics?
Are there other factors impacting on wages and employment conditions of public bus
drivers?
It was agreed with the Ministry that the research would include:
• A targeted regional breakdown of the effects of PTOM on wages and employment
conditions that primarily focuses on Auckland and Wellington, with some reference to
other areas where there appear to be significant impacts on bus drivers. These two
regions employ the majority of all public bus drivers and are the two areas where
PTOM is known to have had a recent and direct impact on bus driver employment
conditions and wage rates.
• Analysis of the impacts of PTOM may differ across different workforces; and
• Comparison wage rates of public transport drivers with a similar cohort (e.g. school or
charter bus drivers).
1.3. Structure of this report
This report is structured as follows:
• Section 2 provides background and the approach of the research;
• Section 3 sets out overall impacts of PTOM on the public transport sector that are the
key drivers of impact on bus driver employment conditions and wage rates;
• Section 4 presents the impact on bus driver employment conditions and wage rates;
and
• Section 5 identifies areas for further research.
Supporting and additional detail underpinning the analysis and findings are presented in a
companion report.
Releas
ed un
der th
e
Official
Infor
mation
Act 19
82

PTOM Impacts on Bus Driver Employment Conditions and Wage Rates 5
1.4. Probity
The research team was mindful that all PTOM participants are committed to achieving the highest
standard of probity in relation to the tender process. To maintain the integrity of the process, we,
to the best of our knowledge and ability, ensured that commercially sensitive information is not
disclosed without the full knowledge and authority of the party providing the information.
The research team has drawn on the report commissioned by the Greater Wellington Regional
Council, delivered by research team member Bill McDonald, on the impacts of PTOM in the
Wellington region.3
1.5. Limitations
The research team endeavoured to gather complete information on employment conditions and
wage rates from all the key stakeholders within the eight-week timeframe of the research. While
it was not possible to negotiate access to data from all the stakeholders (see Appendix 2 for the
list of stakeholders and responses summary), the research team is confident it secured sufficient
data to conduct a robust analysis. Where there are gaps due to the availability of data, these are
acknowledged along with the perspectives of particular stakeholders.
3 PTOM Impact on Staff – Independent Assurance Review, Final Report, TDM Consulting, 2018; and, PTOM Impact on Staff – Independent Assurance Review, Supplementary Report, TDM Consulting, 2018
Releas
ed un
der th
e
Official
Infor
mation
Act 19
82

6
2. BACKGROUND AND RESEARCH PURPOSE
PTOM was introduced in 2013 with the aim of facilitating innovation and delivering the best
value for money through competitive tendering of public transport services. While changes to
bus service contracts are relatively new, there are early indications that there have been some
improvements in the quality of public transport services without a significant increase in cost.
However, the impacts of PTOM on bus driver employment conditions and wage rates are less
well known. This research specifically focuses on these impacts for bus drivers.
2.1. PTOM Context
2.1.1. Development and implementation of PTOM
PTOM was developed collaboratively by a core working group comprising the Ministry, NZTA,
Auckland Transport, Greater Wellington Regional Council, and the Bus and Coach Association,
representing most existing New Zealand public transport operators. PTOM modified the regime
that had operated under the Transport Service Licensing Act 1989 (TSLA). The establishment of
PTOM was as a result of the government at the time having concerns that investment in public
transport had grown rapidly without an equivalent increase in patronage.
The new legislation for the planning, procurement and ongoing operation and management of
local public transport services through PTOM was established in the Land Transport Management
Amendment Act 2013, which came into force on 13 June 2013.
PTOM was designed to contribute to the government's goal to increase public transport patronage
with less reliance on subsidy. It was developed with two overarching objectives:
• to grow the commerciality of public transport services and create incentives for
services to become fully commercial, and
• to grow confidence that services are priced efficiently and there is access to public
transport markets for competitors.4
Under previous legislation, public transport services were delivered through a mixture of
commercial and contracted services. Interested operators were allowed to identify services and
associated fares they would provide on a commercial basis (i.e., with no public subsidy, apart from
reimbursement for carrying Supergold card holders). Regional councils then determined what
other services were necessary to the public transport network and contracted these through an
open competitive tendering process. This limited the ability of regional councils to provide an
integrated bus network and led to increased tensions between regional councils and operators.5
Under PTOM, the previous rights for operators to provide services on a commercial basis were
withdrawn. Regional councils, as the contracting authority, are now responsible for determining
the public transport network, segmenting services into ‘units’ and ranking their commerciality.
Councils may then award contracts for units through a mix of tendering and negotiation. While a
4 http://www.transport.govt.nz/land/ptom/ 5 Introduction of a new policy framework for bus and ferry public transport services, Cabinet Economic Growth and Infrastructure Committee Paper, 2011
Releas
ed un
der th
e
Official
Infor
mation
Act 19
82

PTOM Impacts on Bus Driver Employment Conditions and Wage Rates 7
proportion of a region’s network6 must be subject to tender, councils will be able negotiate the
direct appointment of units that have above average commerciality and are performing well under
existing PTOM contracts.
As part of transitional arrangements to PTOM, in recognition of the services previously provided
by operators on a commercial basis, a proportion of units, equivalent to the amount of service
kilometres operated on a commercial basis, were negotiated with incumbent operators – these
are known as 'like-for-like' contracts.
The PTOM provisions led to a new round of bus service procurement in (almost) all regions in the
period 2015 - 2017, with new contracts with the selected operators coming into effect around 12
months after the tendering process. PTOM is now operating in five of the six largest regions
(Auckland, Wellington, Bay of Plenty, Waikato and Otago), providing over 80 percent of bus
services in New Zealand. The earthquake recovery in Canterbury, which accounts for 14 percent
of local bus services, has delayed the implementation of PTOM. Smaller regions make up the
remaining six percent.
Figure 1: Evolution of public transport contracting environment 1992-20177
2.1.2. Outcomes of PTOM to date
PTOM is being gradually introduced by regional councils and most of the new contracts have only
commenced operations since 2016. The contracts in the two largest areas of Auckland were rolled
out from late 2016 through to 2017; and in Wellington most contracts only began in July 2018.
Early indications of operations under PTOM, based on regional council reporting to the NZTA
under PTOM monitoring requirements, suggest there have been some improvements in the
quality of public transport services without a significant increase in cost.8
PTOM is designed to foster innovation and encourage greater partnering between regional
councils and operators. While the new Wellington contracts include the introduction of electric
buses in the first three years, which could be a signal of increased innovation, it is arguable
whether these have been introduced as a direct impact of PTOM. It is also too early to tell whether
there is more partnering between local government and operators or what the impact on
patronage of bus services is as a result of PTOM.
6 This depends on the region’s size, the overall commerciality ratio of the region’s bus network, and the region having enough units to support a mix of negotiation and tendering. 7 http://www.nzbus.co.nz/who-are-we 8 Additional information collected through this research project on the impacts of PTOM indicates that there have been impacts of the PTOM bus contracts (Auckland and Wellington) on service levels, contract costs and public funding requirements (see section 3).
Releas
ed un
der th
e
Official
Infor
mation
Act 19
82

8
The removal of commercial route provisions and the change from net to gross contracts do,
however, appear to have removed a major barrier to entry for new operators, changing the bus
operator landscape. Section 3 provides greater detail on the impacts of PTOM on the market.
2.2. Research approach
2.2.1. Analytical framework to assess impact on employment conditions and wage rates
To understand the context for changes in bus driver employment conditions and wage rates, it is
essential to understand what has happened within the overall PTOM contracting environment
across regional councils. Information collected from regional councils was analysed to
understand:
• How PTOM was implemented by regional councils and in particular the balance of
“like-for-like” negotiation and tendering of units;
• The level of competition for tendered units and how that may have impacted the
market;
• Changes to market shares of operators following the transition to PTOM contracts; and
• The impact on in-service kilometres, contract costs, and public funding contributions.
The overarching analytical framework for producing analyses of the impact on bus driver
employment conditions and wage rates first required establishing a basis for comparison of bus
driver employment conditions and wage rates in order to make comparisons across regions and
bus operators.
These steps allowed analysis of overall employment conditions and wage trends pre- and post-
PTOM and specific analysis of changes in employment conditions and wage rates across bus
operators (primarily focused on Auckland and Wellington).
For the purposes of this research, it is also important to understand the labour market for bus
drivers more generally. The research team undertook a high-level scan of the labour market,
which included:
• comparing wages with a similar cohort - a brief look at industry pay rates;
• operator approach - a sample survey of operators to determine if employment
conditions and wage rates were different for different driver groups; and
• medium/long term trends in driver pay rates – to establish driver wage levels and
trends.
2.2.2. Establishing the basis for comparison
A basis for comparison was built up from information in documents providing evidence of the
employment conditions and wage rates pre- and post-PTOM. These before and after comparisons
enabled similarities and differences between regions, operators and bus driver groups to be
identified. Key components of establishing a basis for comparison included:
• creating of a research database;
• establishing consistent definitions to be used for this research;
• developing a model to evaluate the impact on driver pay of different scenarios; and
Releas
ed un
der th
e
Official
Infor
mation
Act 19
82

PTOM Impacts on Bus Driver Employment Conditions and Wage Rates 9
• reviewing the roster and shift analysis conducted in Greater Wellington Regional
Council commissioned report.
The research also looked to leverage prior relevant research including union (employee)
perspectives of PTOM impacts.
2.2.3. Determinants of employment conditions
The research team identified that there are three key determinants (factors) that can be applied
to a particular bus operator workplace and analysed, namely:
• employment terms and conditions for full-time, part-time and casual workers;
• business processes; and
• custom and practice.
This bottom up approach to determine the impact of employment conditions on an individual
worker is based on their employment agreement and status, the business process that guide
implementation of their employment agreement and how they are applied in practice. As shown
in Figure 2 below the interaction of these factors determines driver working conditions and pay.
Figure 2: Determinants of bus driver terms and conditions
The analysis in this research is limited to a comparison of the terms and conditions determinant
through reviewing the collective and individual employment agreements between operators and
drivers across the Auckland and Wellington regions.
Releas
ed un
der th
e
Official
Infor
mation
Act 19
82

10
3. INITIAL SYSTEM LEVEL IMPACTS OF PTOM
A key feature of PTOM is that it has resulted in a more competitive market for contracts than
has existed in New Zealand since the ‘deregulation’ of local bus services in 1991. Competitively
tendered contracts under PTOM have typically been contested by around five bidders,
compared to an average of fewer than two bidders (generally including the incumbent
operator) in previous tendering rounds. As a result, operators with cost structures above the
industry norm have been largely unsuccessful in competitive tendering under PTOM.
In both Auckland and Wellington, the previous dominant operator was NZ Bus, which had
provided a major proportion of the total (commercial and contracted) bus services in both
centres. With the advent of PTOM’s new procurement procedures, NZ Bus’s market share has
reduced by nearly half in Auckland and more than half in Wellington.
A survey of regional councils was undertaken, to provide comprehensive data on the new
PTOM contracts and operators and to elicit comments on how their competitive
tendering/contracting processes took into account driver employment conditions and wage
rates. It found that, in general, tender evaluation and contract processes placed considerable
importance on health and safety aspects but did not attempt to mandate minimum driver pay
rates or other employment conditions.
As part of understanding the wider PTOM context, analysis was undertaken for Auckland and
Wellington of levels of bus service and of contract costs before and after the PTOM contract
changes. These results indicate that there have been quite substantial increases in the amount
of services operated (particularly in Auckland) with only modest increases in gross costs. While
sufficient patronage data for the new contracts is not yet available, it seems likely that there
will be very little change in net public funding requirements.
3.1. PTOM approach to operator procurement
As noted previously, under PTOM services are now generally procured through competitive
tendering for ‘units’ of the public transport network. Operators of services previously provided
on a commercial basis were given the right to operate an equivalent amount of service through a
negotiated “Like-for-Like” contract. Councils are also able to negotiate the provision of some other
services with incumbent operators.
Table 1: PTOM bus contract procurement approaches
Procurement Type Duration Market Share (service km)
Auckland Wellington
Competitive tendering 9 years 47.2% 65.6%
Negotiation Like-for-Like 12 years 30.7% 28.3%
Other 6 years 22.1% 6.1%
In the two largest centres, a substantial proportion of all bus services were contracted with
incumbent operators through the negotiation process. These “Like-for-Like” contracts represent
about 53% of total bus service kilometres in Auckland and about 34% in Wellington. The
Releas
ed un
der th
e
Official
Infor
mation
Act 19
82

PTOM Impacts on Bus Driver Employment Conditions and Wage Rates 11
remaining services in these centres, and all (or the great majority of) services in the other centres,
have been procured through open competitive tendering.
3.2. Increased competition for tendered contracts
For the first time since the original ‘deregulation’ of local public transport services in New Zealand
(largely implemented in 1991), the PTOM process has resulted in strong levels of competition for
competitively-tendered contracts. This has particularly been the case in the two largest centres,
where open tenders received five to six bids on average. In smaller centres, tenders typically
received three to four bids.
Table 2: Competition for tendered contracts
Region9
Tendered Market Bidders/contract
Units Service km
(million) Mean Typical range
Auckland 23 27.8 5.65 4-8
Wellington 9 9.8 5.22 5-7
Medium centres (4) 17 18.8 3.94 2-6
Small centres (6) 12 2.4 2.63 2-5
New Zealand Total 61 58.8 4.66 -
Where tenders are received from at least three to four bidders, this would usually be taken as an
indication that the market is operating efficiently and that the resulting contract prices would
provide a reasonable reflection of the efficient costs of supply in the local bus service market. It
has meant that, under PTOM, contracts that have been competitively tendered have been awarded
generally to operators with relatively efficient (low) cost structures, subject to their meeting all
other contract requirements.
3.3. PTOM impacts on bus operator market shares
In both Auckland and Wellington, the previous dominant operator was NZ Bus, which had
provided a major proportion of the total (commercial and contracted) bus services. Following
procurement under PTOM, NZ Bus has retained a significant, although much diminished, share of
the operator market in both centres, very largely through its contracts negotiated as part of the
transitional arrangements for incumbent operators. It had little success in the competitive
tendering process for other contracts. As a result, the overall market share of NZ Bus in both the
centres has considerably diminished, falling from 61 to 34 percent of total bus service kilometres
in Auckland and from 73 to 28 percent share in Wellington.
9 Excludes Canterbury where PTOM has not yet been implemented and Otago, which did not respond to the survey
Releas
ed un
der th
e
Official
Infor
mation
Act 19
82

12
Figure 3: NZ Bus loss of market share in Auckland and Wellington
NZ Bus’s reduction in overall market share has been to the benefit of other operators. As a result,
a large proportion of all contracts in the main centres saw a change in operator, as was also the
case for a significant proportion in most of the smaller centres. Some of the larger operators in
New Zealand overall have secured contracts in areas where they previously did not operate (e.g.,
Go Bus, Ritchies, Tranzit), thus very much increasing their national ‘foot-print’.
Table 3: Change in market share (Auckland and Wellington)
Operator Natl.
Market Share
Regional Market Share
Auckland Wellington
Pre-PTOM
Post-PTOM
Tender Neg’td Pre-
PTOM Post-
PTOM Tender Neg’td
Go Bus 27.8% - 16.5% 34.9% - - - - -
NZ Bus 24.0% 61% 33.8% 1.4% 62.8% 73% 28.5% - 82.8%
Ritchies / RMTS 15.2% 16% 24.5% 38.7% 11.7% - - - -
Tranzit 12.2% 1% 2.8% 5.9% - 1% 59.6% 90.8% -
All others 20.8% 22% 22.4% 19.1% 25.5% 26% 11.9% 9.2% 17.2%
Total 100% 100% 100% 100% 100% 100% 100%
3.4. Regional Council views on PTOM procurement and contracting process
Regional councils were surveyed to ask questions relating to the following two areas of the PTOM
tendering and contracting processes and practices, with an emphasis on aspects relevant to driver
wages and employment conditions:
• Contract requirements and tender evaluation criteria, and
• Relevant impacts of the PTOM tendering/contracting process.
Responses to at least some of the questions were received from 11 of the 13 regional councils that
responded to the survey. Table 4 below summarises these responses.
201773%
201828%
20171%
201860%
201761%
201836%
20170%
201816%
Releas
ed un
der th
e
Official
Infor
mation
Act 19
82

PTOM Impacts on Bus Driver Employment Conditions and Wage Rates 13
Table 4: Summary of RC survey responses to qualitative questions
Specific aspect Summary of responses
Contract requirements and tender evaluation criteria
Safeguarding previous employment
terms and conditions for driver's
previously staffing same or similar
service
(number or respondents n=1)
• The possibility of safeguards was explored in some detail
by Greater Wellington Regional Council, with an explicit
decision being made not to impose such a requirement.
Track record re passenger complaints
and resolution, workplace health and
safety, on-road accidents
(number of respondents n=9)
• Most regional councils included at least two of these three
aspects as part of their quality evaluation.
• Greater Wellington Regional Council considered but
decided against assessing previous complaints
performance, on the basis that there is little consistency
between operators in record keeping.
Commitment to paying at minimum
'living wage' rate to drivers
(number of respondents n=1)
• Bay of Plenty Regional Council included a 'living wage'
provision in the form of awarding additional quality points
for commitment to pay higher wage rates to drivers.
Relevant impacts of the PTOM tendering/contracting process
Tender bid prices and contract prices
(number of respondents n=6)
• Four regional councils consider that the PTOM process had
no discernible effects on this aspect.
• Two regional councils considered that PTOM contract
prices were somewhat lower than anticipated or than
previous prices for the same services.
Driver employment conditions and
wage rates
(number of respondents n=8)
• 11 of the 13 regional councils either had no knowledge or
did not respond.
• Hawkes Bay Regional Council thought that their relatively
low contract price probably reflected low driver pay rates.
• Greater Wellington Regional Council had good knowledge
of differences in pay rates and structures between its main
incumbent operator (NZ Bus) and other bidders with flat
rate payment structures.
Releas
ed un
der th
e
Official
Infor
mation
Act 19
82

14
3.5. Impacts on service levels, contract costs and public funding
requirements
An initial ‘before and after’ assessment of the changes in bus service levels was undertaken. This
assessment included, bus operator contract costs and overall public funding requirements for bus
services in the Auckland and Wellington regions resulting from the implementation of the new
PTOM contracts over the period 2016 – 2018. In interpreting this assessment, it should be noted
that:
• These comparisons are between the bus service levels and costs under the 'old' (pre-
PTOM) situation with those following the completion of the PTOM
tendering/contracting process.
• These comparisons have been made on a consistent basis, to the extent possible.
• They cover all bus services contracted by the regional councils in the two regions
(excluding 'exempt' services - principally the separate airport services in each region).
Table 5: Impact on service levels and costs (Auckland and Wellington)
Percentage change
Auckland Wellington Aggregate
Service kms +32.1% +2.1% +25%
Service hours +40.6% n/a n/a
Peak buses +15.0% n/a n/a
Gross contract costs +7.0% -6.6% +4%
Gross contract costs / service km -19.0% -8.4% -17%
The impact on service levels and costs in Table 5, highlights that the changes are quite different in
each region. In Auckland, there has been a substantial increase of service kilometres, service
hours, and peak buses for only a comparatively small increase in gross contract cost. As a result,
the gross contract costs per service kilometre, a common measure of cost efficiency in the bus
sector, has fallen by 19%. The increase in service levels would be expected to result in an increase
in patronage levels (and fare revenues), in the order of 8 – 10 percent in the medium term.10 The
additional expected revenue has been estimated to more-or-less offset the increase in gross costs.
Wellington saw only a small increase in service kilometres, but the gross contract costs fell overall.
As a result, the gross contract cost per service kilometre has reduced by more than 8%. In
aggregate, only a very small change (upwards or downwards) in the total public funding
requirements for bus services in the two regions combined is expected.
10 This figure is an approximate estimate only, as sufficient patronage and fare revenue data is not yet available to provide good estimates of the demand impacts.
Releas
ed un
der th
e
Official
Infor
mation
Act 19
82

PTOM Impacts on Bus Driver Employment Conditions and Wage Rates 15
4. IMPACTS ON BUS DRIVERS
The impacts on bus driver employment conditions and wage rates is directly linked to changes
in the contracting and operating environment. Operators have largely preserved their
employment conditions, with small increases in wage rates. However, these vary considerable
between incumbent and new operators. NZ Bus acquired its bus operations from local councils
and largely preserved employment conditions and wage rates that were in place pre-
acquisition. Effective pay for NZ Bus drivers largely depends on tenure, seniority, and penal
rates. Most of the other operators, in particular the new entrants, tend to have flat wage rates
with no penal rates.
With significant changes in operator market share, some bus drivers working for incumbent
operators either need to move to new operators or leave the industry. Consequently, the impact
of PTOM on bus driver employment conditions and wage rates varies by region and largely
depends on whether bus drivers remain with the same operator, move to a new operator, or
leave or enter the industry.
• In Auckland, drivers who move from NZ Bus to another operator (except Birkenhead
Transport) will typically be worse off under PTOM when seniority and cancelled days
off are factored in. Drivers who remain with the same operator are not impacted with
the introduction of PTOM.
• In Wellington the outcome for drivers is mixed. Wages and employment conditions
for drivers who remain with the incumbent operator are unchanged, though operator
practices are likely to be adjusted in a post PTOM environment, impacting on the take-
home pay that drivers receive. The impact on drivers who move to Tranzit from NZ
Bus (Go Wellintgon) depends on their tenure:
- Drivers with less than five years-service are likely to be better off under a
Tranzit agreement;
- Drivers with between five and ten years-service are dependent on the practices
of the incumbent NZ Bus in a post PTOM environment; and
- Drivers with ten or more years of service are worse off.
• In other regional councils, the operating environment prior to PTOM was flat-rate and
low-cost, with almost all hours paid at the same rate. It is therefore unlikely that
drivers will be affected by the move to PTOM.
4.1. National Context
4.1.1. Bus Driver Wages
Entry level bus drivers usually start on $17 per hour, while experienced drivers can earn up to
$23 for ordinary (non-overtime) hours worked. The main findings from our analyses of
movements in bus driver pay rates for our sample of operators over the period since 2005
(excluding any significant effects of the recent PTOM tendering) indicate:
• increases of around 1 percent per annum or more, relative to the Consumer Price Index
(which reflects the costs of goods and services in the NZ economy as a whole);
Releas
ed un
der th
e
Official
Infor
mation
Act 19
82

16
• increases of less than 1 percent per annum relative to Labour Cost Index (an index
representing labour cost movements in the wider motor driver sector); and
• some small reductions, but well under 0.5 percent per annum and particularly in the
later part of the period, relative to Average Hourly Earnings (an index of average hourly
earnings in the economy as a whole). This is represented in Figure 4 below.
Figure 4: Bus driver wages 2005-2017 adjusted by average hourly earnings (December 2017 prices)11
In general, driver wage rates are above the statutory minimum hourly wage.12 Of the operator
pay rates that were reviewed, three are significantly above the 'living wage', two are very close to
this figure, and the remaining seven are significantly below this figure. The average wage rates by
region are presented in Table 6 below.
Table 6: Average bus driver wages by region
Region Starting rate Top rate
2017 2018 2017 2018
Hamilton
Napier
Dunedin
Christchurch
Wellington
Auckland
National Average
11 Selected operators 12 Employment conditions and wage rates for post-PTOM agreements that were reviewed for this research are all above the minimum wage following its increase in April 2018. This is presented later in this report.
Section 9(2)(b)(ii)
Section(9)(2)(b)(ii)
Releas
ed un
der th
e
Official
Infor
mation
Act 19
82

PTOM Impacts on Bus Driver Employment Conditions and Wage Rates 17
A more detailed description of the work undertaken to establish the basis for comparison in
Appendix 7.
4.1.2. Bus driver employment conditions
Employment contracts for bus drivers fall into two broad categories:
• Agreements that feature a relatively complex remuneration model subject to
interpretation, extensive penal rates for evenings, weekends and additional shifts
worked, full recognition of seniority with a progressive scale and additional rights and
benefits and non-standard employment conditions. Take home pay in these agreements
is dependent on business process and rules as well as custom and practice (e.g. the
practice of allocating overtime shifts).
• Relatively straightforward contracts with a flat hourly rate, minimal penal rates and
other statutory based entitlements. Only business process and rules affect take home
pay under these agreements.
Each agreement is founded on the history of the business, reflecting the underlying business
philosophy of the operator and shaped by unions. Operators that had acquired existing bus
operations from local councils had largely preserved the employment terms and conditions that
were in place pre-acquisition and tend to be complex, rewarding tenure and providing penal rates.
New entrants to the public transport sector bring the agreements they have in place for their
charter services that typically relatively straightforward with flat rates and minimal penal rates.
For the majority of operators with a progressive, the scale only applies to the first 6-12 months of
employment, recognising this is typically a training period, after which bus drivers are paid a flat
rate that does not increase with tenure. Only Birkenhead Transport in Auckland and NZ Bus (Go
Wellington) in Wellington operate a truly progressive scale that recognises tenure.
A number of Auckland's incumbent operators appear to have attempted to renegotiate their
collective agreements before bidding for a PTOM contract. From the information received for this
research, it would appear that this resulted in a strongly negative response from the unions and
did not result in widespread change to terms and conditions. Therefore, the agreements have
transitioned to the new PTOM environment intact (i.e. there is little noticeable difference between
a pre-PTOM and post-PTOM agreements for the same operator providing services in the same
location).
The significant loss of market share by incumbent operator NZ Bus has markedly changed the
landscape for driver wages and conditions. Table 7 below presents employment conditions for the
major operators in Auckland and Wellington.
Releas
ed un
der th
e
Official
Infor
mation
Act 19
82

18
Table 7: Comparison of employment conditions between major Auckland and Wellington operators
NZ Bus (Auckland)
Go Bus (Auckland)
NZ Bus (Go Wellington)
NZ Bus (Valley Flyer)
Mana Tranzit
Allowances
Agreements
Benefits
Costs
Disciplinary
Hours
Incentives
Leave
Penals
Remuneration
Pay rates
Section 9(2)(b)(ii
Releas
ed un
der th
e
Official
Infor
mation
Act 19
82

PTOM Impacts on Bus Driver Employment Conditions and Wage Rates 19
NZ Bus (Auckland)
Go Bus (Auckland)
NZ Bus (Go Wellington)
NZ Bus (Valley Flyer)
Mana Tranzit
Redundancy
Retirement
Service
Superannuation
Uniform
Unions
Section 9(2)(b)(ii)
Releas
ed un
der th
e
Official
Infor
mation
Act 19
82

20
4.2. Modelling bus driver wages
Given the differences in employment agreement structures between operators, it is necessary to
model the Effective Hourly Rate of bus drivers for each operator. This is a calculated rate derived
from total pay for the period, including hourly base rate adjusted for tenure and penal rates,
divided by the number of hours worked in that period.13 A model was built in order to determine
how various operator conditions and wage rates compare. The scenarios modelled were:
• Scenario A – Weekday ordinary hours: 40 hours working Monday to Friday.
• Scenario B – Weekend ordinary hours: Scenario A modified to include working on
either Saturday or Sunday.
• Scenario C – Overtime: Scenario B plus working 8 hours overtime to make up a 48-hour
working week.
• Scenario D – Cancelled Day Off: Scenario C plus working on a day a driver is rostered off
to make a 56-hour working week.
While a driver may work one of the above scenarios in any given week, it is expected that over a
period a time, drivers would work an assortment of these scenarios impacting on annual take-
home pay. For this reason, comparison is best done on effective hourly rates. Figure 1Figure 5 and
Figure 6 below provide an overview of the Average Effective Hourly Rate for each of the scenarios
above for operators in Wellington and Auckland.
Figure 5: Average Effective Hourly Rates in Greater Wellington Region
13 In ideal circumstances, the effective rate would include shift allowances but without additional information from all operators it was not practical to include these in this analysis
0.00 5.00 10.00 15.00 20.00 25.00
NZ Bus (Go Wellington)
Tranzit (Wellington)
NZ Bus (Valley Flyer)
Mana
Tranzit (Hutt)
Uzabus
Average of Base Rate Average of Effectively Hourly Rate (Weekends)
Average of Effective Hourly Rate (Overtime) Average of Effective Hourly Rate (CDO)
Section 9(2)(b)(ii)
Releas
ed un
der th
e
Official
Infor
mation
Act 19
82
PTOM Impacts on Bus Driver Employment Conditions and Wage Rates 21
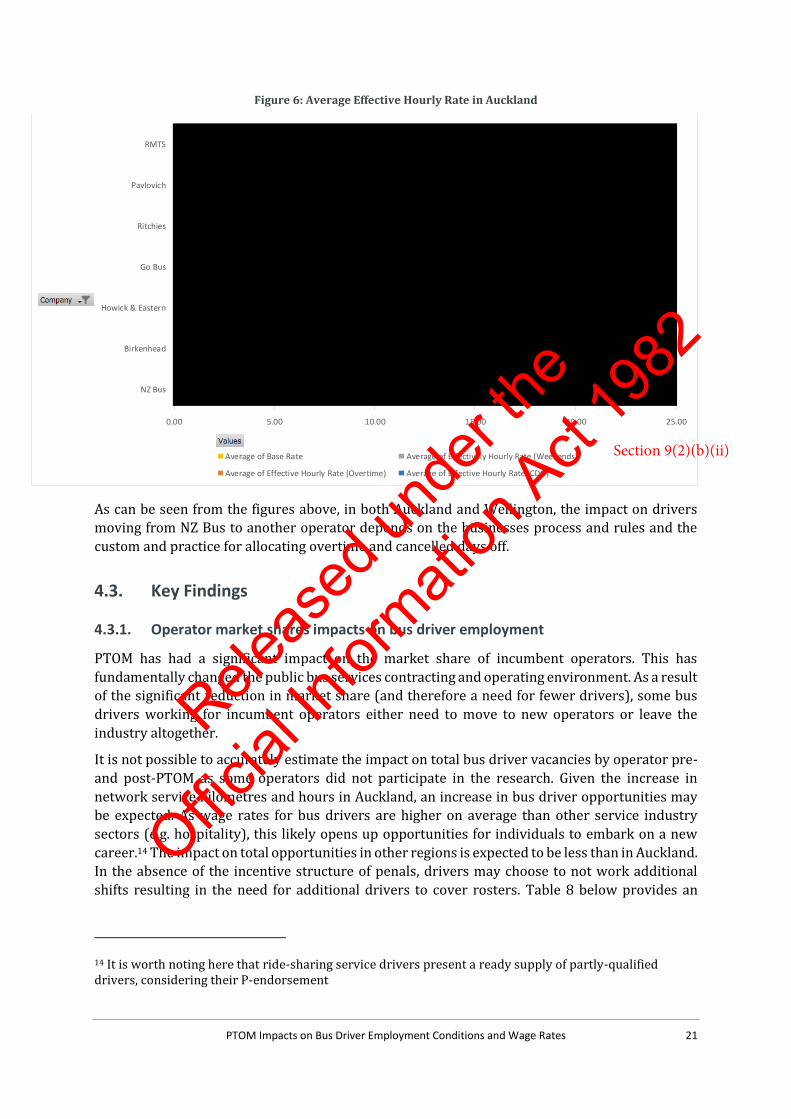
Figure 6: Average Effective Hourly Rate in Auckland
As can be seen from the figures above, in both Auckland and Wellington, the impact on drivers
moving from NZ Bus to another operator depends on the businesses process and rules and the
custom and practice for allocating overtime and cancelled days off.
4.3. Key Findings
4.3.1. Operator market shares impacts on bus driver employment
PTOM has had a significant impact on the market share of incumbent operators. This has
fundamentally changed the public bus services contracting and operating environment. As a result
of the significant reduction in market share (and therefore a need for fewer drivers), some bus
drivers working for incumbent operators either need to move to new operators or leave the
industry altogether.
It is not possible to accurately estimate the impact on total bus driver vacancies by operator pre-
and post-PTOM as some operators did not participate in the research. Given the increase in
network service kilometres and hours in Auckland, an increase in bus driver opportunities may
be expected. As wage rates for bus drivers are higher on average than other service industry
sectors (e.g. hospitality), this likely opens up opportunities for individuals to embark on a new
career.14 The impact on total opportunities in other regions is expected to be less than in Auckland.
In the absence of the incentive structure of penals, drivers may choose to not work additional
shifts resulting in the need for additional drivers to cover rosters. Table 8 below provides an
14 It is worth noting here that ride-sharing service drivers present a ready supply of partly-qualified drivers, considering their P-endorsement
0.00 5.00 10.00 15.00 20.00 25.00
NZ Bus
Birkenhead
Howick & Eastern
Go Bus
Ritchies
Pavlovich
RMTS
Average of Base Rate Average of Effectively Hourly Rate (Weekends)
Average of Effective Hourly Rate (Overtime) Average of Effective Hourly Rate (CDO)
Section 9(2)(b)(ii)
Releas
ed un
der th
e
Official
Infor
mation
Act 19
82

22
overview in the change of staff numbers by operator, noting that only partial data for NZ Bus was
available.15
Table 8: Change in operator staff numbers
Operator 2017 staff 2018 staff Change
Auckland
Howick & Eastern 209 180 -29
RMTS 56 185 +129
Pavlovich 150 150 -
Ritchies 175 255 +80
Go Bus 215 290 +75
NZ Bus n/a n/a -
Hamilton
Go Bus 120 167 +47
Greater Wellington Region16
NZ Bus (Go Wellington) 340 200 -140
NZ Bus (Valley Flyer) 180 40 -140
Uzabus 0 30 +30
Mana 140 30 -110
Tranzit 0 360 +360
4.3.2. Impact on drivers of changing operator
Ritchies/RMTS and Go Bus gained major market shares in Auckland, while Tranzit gained a major
market share in Wellington. Given this, the impact on drivers is analysed below from the
perspective of a driver moving from an incumbent operator to one of these operators.
In Auckland, the Average Effective Hourly Rate for NZ Bus drivers when cancelled days off are
factored in was significantly higher. On the assumption that an average driver completes one of
each type of shift over the period of 4 weeks,17 a NZ Bus driver moving to any new operator (except
Birkenhead Transport) is always worse off.
Similarly, in Wellington a driver moving from NZ Bus (Go Wellington) is worse off, though the
difference with Tranzit is minimal. Meanwhile, drivers moving from Uzabus, Mana, and NZ Bus
(Valley Flyer) will always be better off with Tranzit.
15 Data for NZ Bus in Wellington was obtained from third-party sources 16 Staff numbers for the Greater Wellington Region were agreed by the operators pre-PTOM as a good indication of the expected change in numbers. Actual numbers post PTOM have not been sourced, though the Tramways Union has confirmed that the number of redundancies at NZ Bus (Go Wellington) and NZ Bus (Valley Flyer) were closer to 120 each. 17 In the absence of roster data this assumption allows for some level of comparison.
Releas
ed un
der th
e
Official
Infor
mation
Act 19
82

PTOM Impacts on Bus Driver Employment Conditions and Wage Rates 23
A more detailed model was built for the earlier Greater Wellington Regional Council-
commissioned report that included analysis of wages and employment conditions that could be
monetised to allow Unions and Operators to establish a baseline of the NZ Bus rosters and shifts
for comparison to the offer made by Tranzit. While this level of analysis has not been undertaken
for this research, the Greater Wellington Regional Council report has been reviewed. Based on the
conclusion of this analysis, the expected impact on NZ Bus (Go Wellington) drivers moving to a
Tranzit agreement is as follows:
• Drivers with less than five years-service are likely to be better off under a Tranzit
agreement;
• The impact on drivers with between five and ten years-service will depend the business
practices and culture at NZ Bus in a post PTOM environment; and
• Drivers with ten or more years of service are likely to be worse off.
The impact on individual drivers depends on the business processes and rules and the custom and
practice at NZ Bus (Go Wellington). Drivers with longer tenure have both higher basic wage rates
but are also more likely to be allocated more lucrative shifts including overtime and cancelled
days off.
Without additional information on the impact on individual drivers at NZ Bus (Go Wellington) and
NZ Bus Auckland following the implementation of PTOM (i.e. the numbers and demographics of
driver that have been made redundant or chosen to leave the company), it is not possible to
estimate the impact on the average driver. It is also difficult to estimate any impact on drivers that
remain with NZ Bus (Go Wellington) and NZ Bus Auckland without knowing what the business
processes and rules and custom and practice for allocating overtime and cancelled days off is
without further information from NZ Bus.
In other regions, the operating environment prior to PTOM was predominantly flat-rate and low-
cost, with almost all hours paid at the same rate. It is unlikely that drivers will be affected
significantly by the move to PTOM.
4.3.3. Comparing wages with a similar cohort (e.g., school or charter bus drivers)
The research included brief review of bus industry pay rates and whether there are significant
differences by the role or type of bus driver in order to understand whether it was possible to
compare urban bus driver wages and conditions with school or charter bus drivers as a cohort.
There wasn’t a clear basis to compare based on type of bus driving (i.e. school bus, charter, urban
bus), rather a mix of approaches by operators. Some bus operators pay by qualifications and
experience, and some pay differently by driver role/type. Pay is also influenced by region. It was
therefore not possible to conduct this type of comparative analysis.
In terms of industry pay rates the research found that:
• Entry-level bus drivers usually start on $17 per hour. Experienced bus drivers can earn
$23 per hour in Wellington. With the minimum wage increase to $16.50 per hour from
1 April 2018 it is expected that the starting rate for new bus drivers will rise and this
will have a knock-on effect on starting rates and relativities through the entire driver
pay scale.
• By way of comparison, the ‘Living Wage’ was set at $20.20 per hour on 1 July 2017. This
represents 40 cents increase on the 2016/17 rate in line with the average movement in
Releas
ed un
der th
e
Official
Infor
mation
Act 19
82

24
wages. The Living Wage rate is set by the Family Centre Social Policy Research Unit in
the Hutt Valley.
• These figures compare to New Zealand Household Labour Force Survey average hourly
earnings of $29.62 and median hourly earnings from wages and salaries of $23.49.
Releas
ed un
der th
e
Official
Infor
mation
Act 19
82

PTOM Impacts on Bus Driver Employment Conditions and Wage Rates 25
5. OPPORTUNITIES FOR FURTHER RESEARCH
5.1. Impact on Business Processes and Rules and Custom and Practice
The analysis in this research is based on the data available at the time and is confined to the
employment terms and conditions. The analysis did not identify any in-depth impact of PTOM on
operator processes, due to time constraints and that some operators declined to participate in this
research. Some conclusions have been drawn relating to the Wellington region as a result of the
earlier Greater Wellington Regional Council-commissioned report. However, these are largely
speculative as the timing of that analysis occurred in advance of PTOM and actual processes had
not yet adjusted to the new environment. This would merit further research.
5.2. Working conditions and Health and Safety
There were some concerns raised during the research from unions that general working
conditions of bus drivers are being eroded (e.g., with requirements to work longer hours; more
split shifts, reductions in breaks) and that both public and driver safety (with an increase in crash
incidents) is starting to be compromised as a result of PTOM. These concerns, while outside of the
direct scope of this research may require further independent exploration.
5.3. Post-evaluation of PTOM
The impact of PTOM on service levels and costs can already be assessed to a certain degree as has
been done in this report. This is limited only to service kilometres and gross contract costs
however and does not reflect the additional changes to the network from the introduction of
larger and double-decker buses. There is an opportunity to deepen the assessment of impact in
these dimensions with more time and a greater partnership approach with operators. This would
also enable an analysis on changes in the employment market for bus drivers.
In addition, there is currently no evidence-base to assess the impact on ridership and farebox
revenue from the significant changes in the operator environment as a result of PTOM. As new
contracts are still being introduced throughout the country, including the Wellington contracts in
July 2018 and further Auckland contracts beginning operations in December 2018, it is too early
to collect reliable information to conduct robust analysis. There is a balance to be struck between
the phased introduction of contracts and the time elapsed from the beginning of operations.
Attribution to PTOM will diminish over time and it is therefore appropriate to set a deadline by
when the evaluation must start. Following twelve months of operations, sufficient reliable data
should be available to assess the impact on ridership and farebox revenue. For this reason, it may
be appropriate to consider commissioning a post-evaluation in July 2019 as this would enable
data to be included from:
• At least twelve months of data for many Auckland contracts
• Twelve months of data for Wellington
• A variety of timeframes from other regions.
In order to contextualise that evaluation, developing a robust baseline is necessary. NZTA is
already collecting a number of data points that will be relevant and it is timely to review this to
ensure that it addresses all the dimensions that may be relevant to a post-evaluation.
Releas
ed un
der th
e
Official
Infor
mation
Act 19
82