Embed Size (px)
Citation preview

Pua Kah Kin Samuel

The objective of the presentation is for educational purposes. The full content of the presentation is for illustration purposes only and should not be used as investment recommendations. AB Maximus and its presenters are not responsible for all investment activities conducted by the participants and cannot be held liable for any investment loss. The company and presenters may have personal interest in the particular shares presented.
Company Background
Industry Overview
Valuation
Risk
Q&A

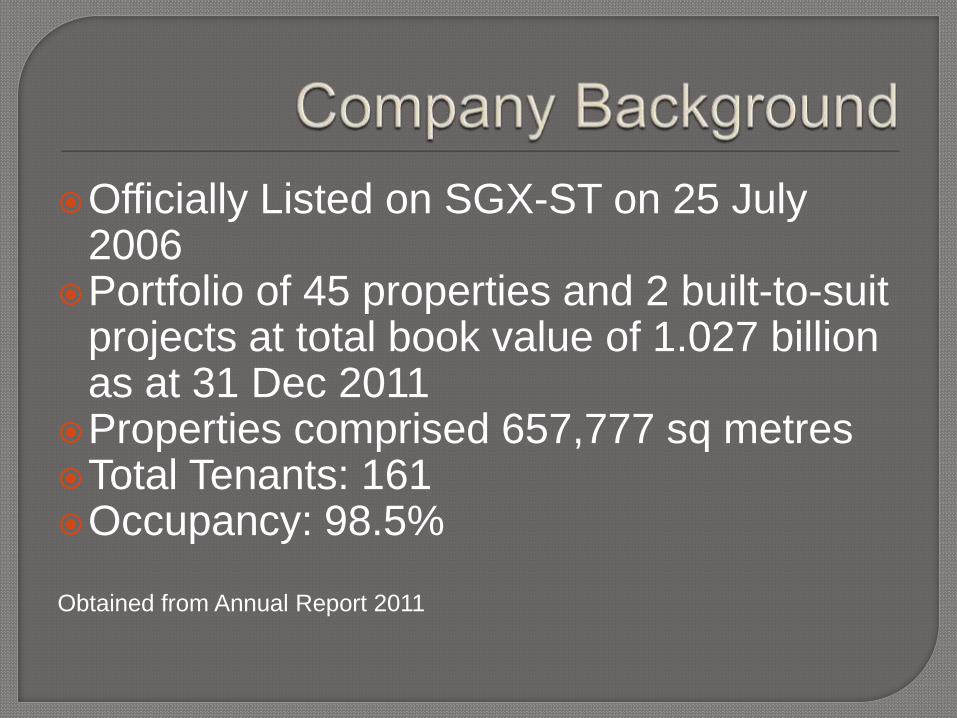
Officially Listed on SGX-ST on 25 July 2006
Portfolio of 45 properties and 2 built-to-suit projects at total book value of 1.027 billion as at 31 Dec 2011
Properties comprised 657,777 sq metres Total Tenants: 161 Occupancy: 98.5%
Obtained from Annual Report 2011
Investment Strategy • Real estate used mainly for industrial purposes
• Investment made in Singapore and Asian markets
• Generally long term investments
Obtained from Annual Report 2011
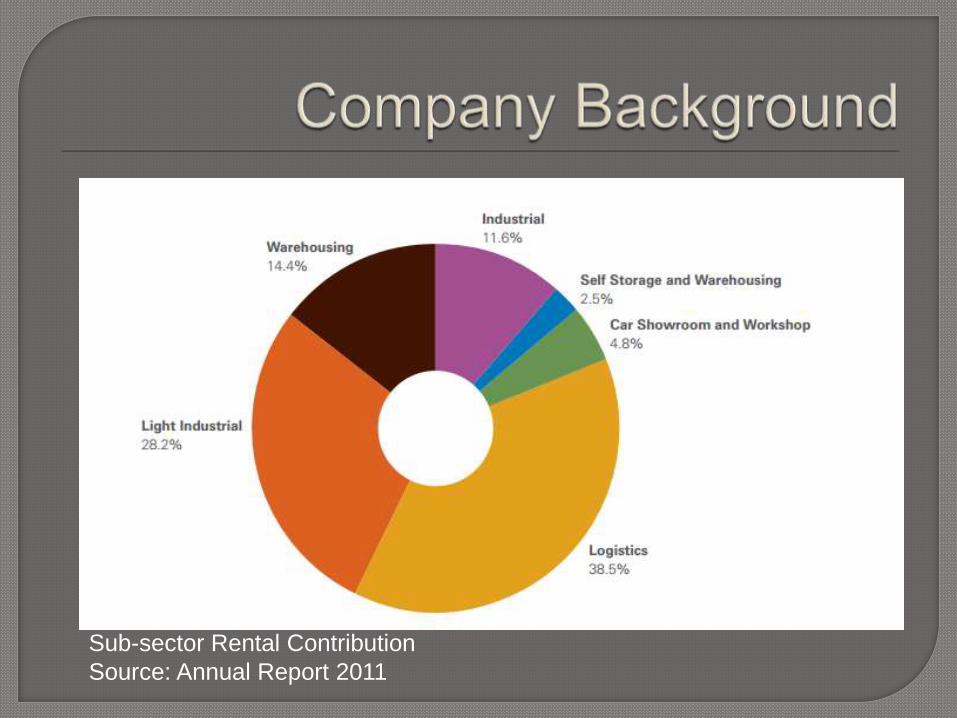
Sub-sector Rental Contribution
Source: Annual Report 2011
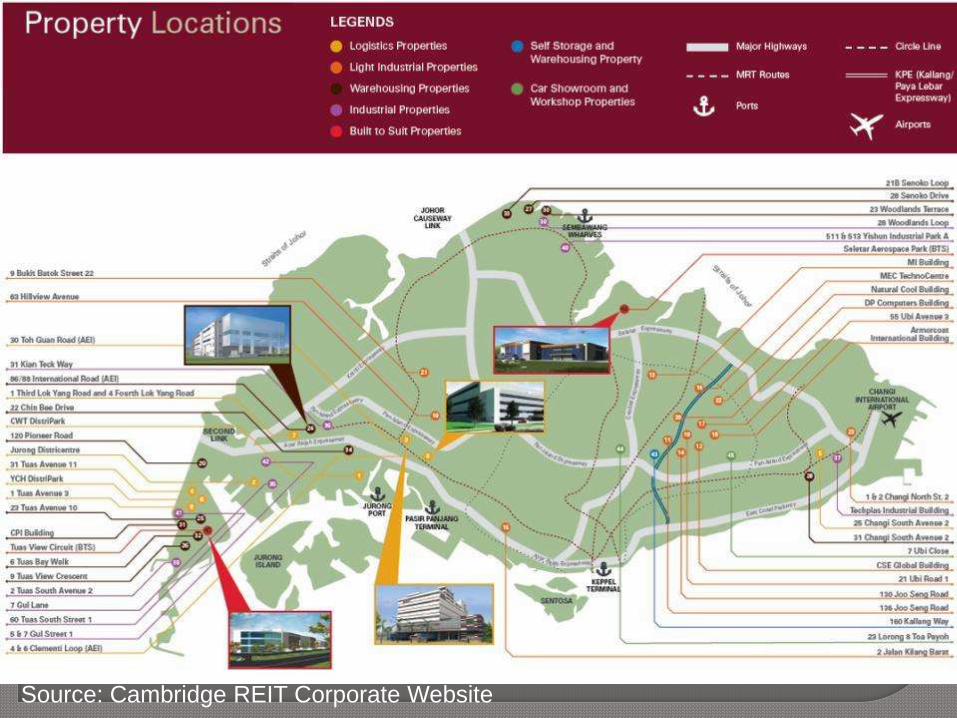
Source: Cambridge REIT Corporate Website
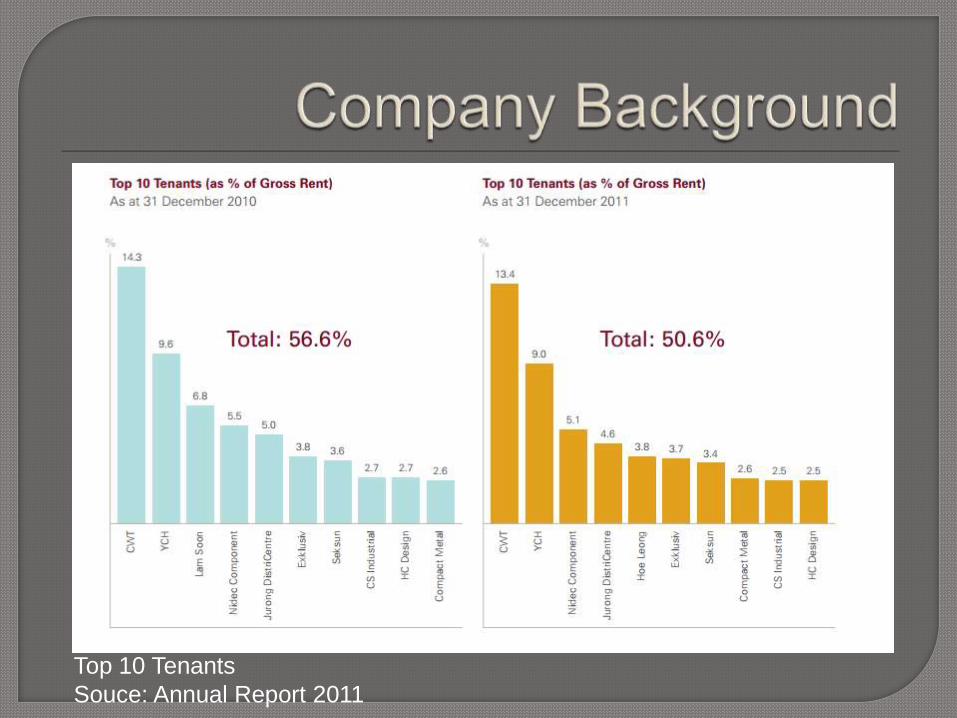
Top 10 Tenants
Souce: Annual Report 2011

Changes to Properties
Source: Annual Report 2011
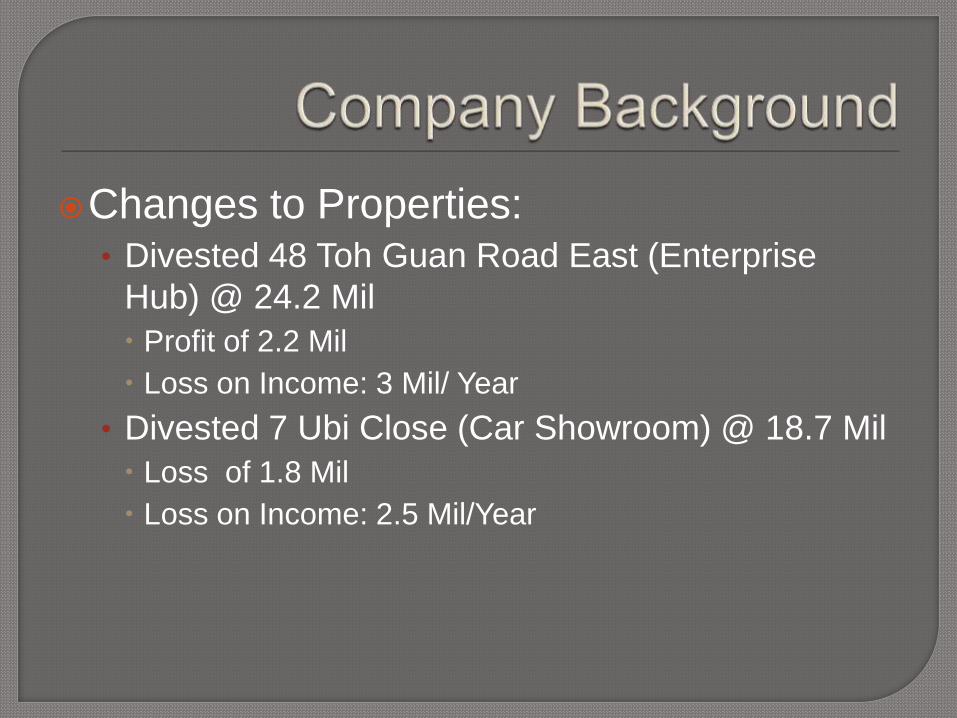
Changes to Properties: • Divested 48 Toh Guan Road East (Enterprise
Hub) @ 24.2 Mil
Profit of 2.2 Mil
Loss on Income: 3 Mil/ Year
• Divested 7 Ubi Close (Car Showroom) @ 18.7 Mil
Loss of 1.8 Mil
Loss on Income: 2.5 Mil/Year
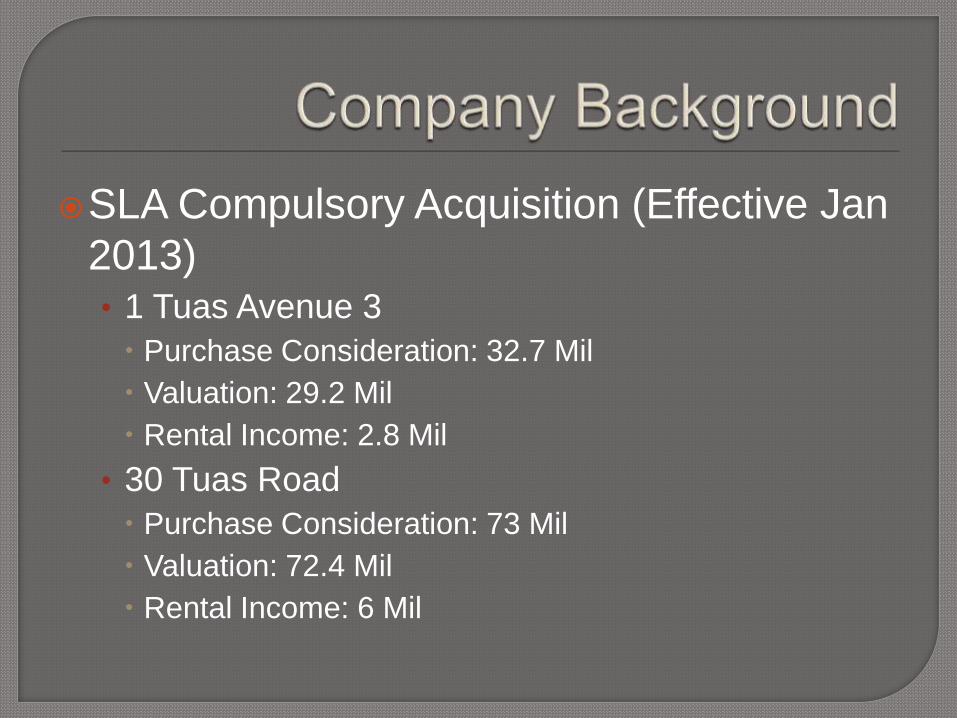
SLA Compulsory Acquisition (Effective Jan
2013) • 1 Tuas Avenue 3
Purchase Consideration: 32.7 Mil
Valuation: 29.2 Mil
Rental Income: 2.8 Mil
• 30 Tuas Road
Purchase Consideration: 73 Mil
Valuation: 72.4 Mil
Rental Income: 6 Mil
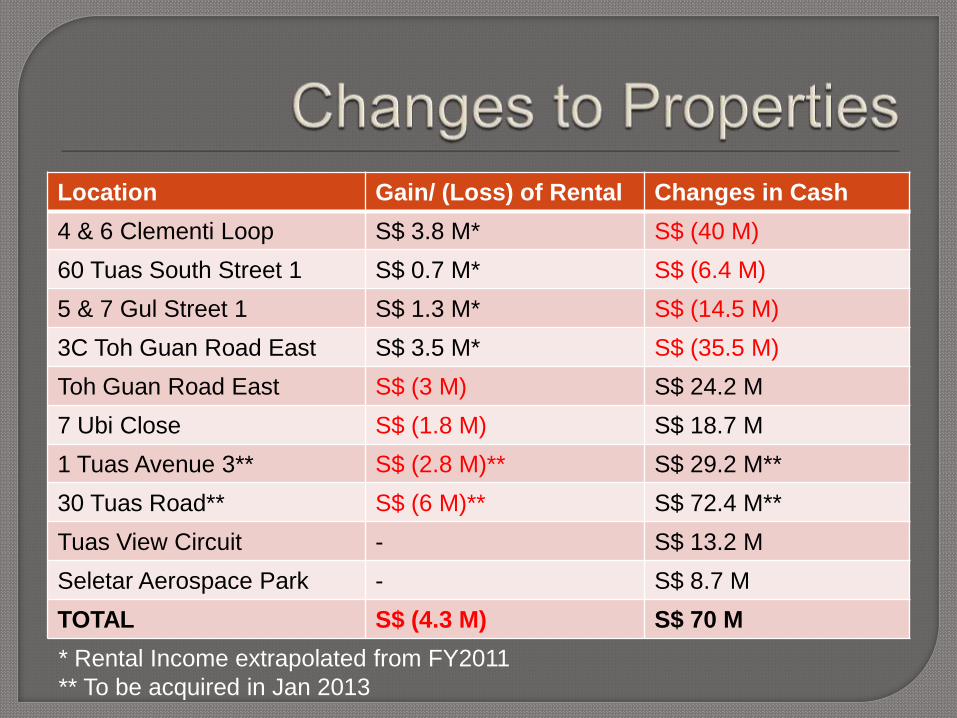
Location Gain/ (Loss) of Rental Changes in Cash
4 & 6 Clementi Loop S$ 3.8 M* S$ (40 M)
60 Tuas South Street 1 S$ 0.7 M* S$ (6.4 M)
5 & 7 Gul Street 1 S$ 1.3 M* S$ (14.5 M)
3C Toh Guan Road East S$ 3.5 M* S$ (35.5 M)
Toh Guan Road East S$ (3 M) S$ 24.2 M
7 Ubi Close S$ (1.8 M) S$ 18.7 M
1 Tuas Avenue 3** S$ (2.8 M)** S$ 29.2 M**
30 Tuas Road** S$ (6 M)** S$ 72.4 M**
Tuas View Circuit - S$ 13.2 M
Seletar Aerospace Park - S$ 8.7 M
TOTAL S$ (4.3 M) S$ 70 M
* Rental Income extrapolated from FY2011
** To be acquired in Jan 2013
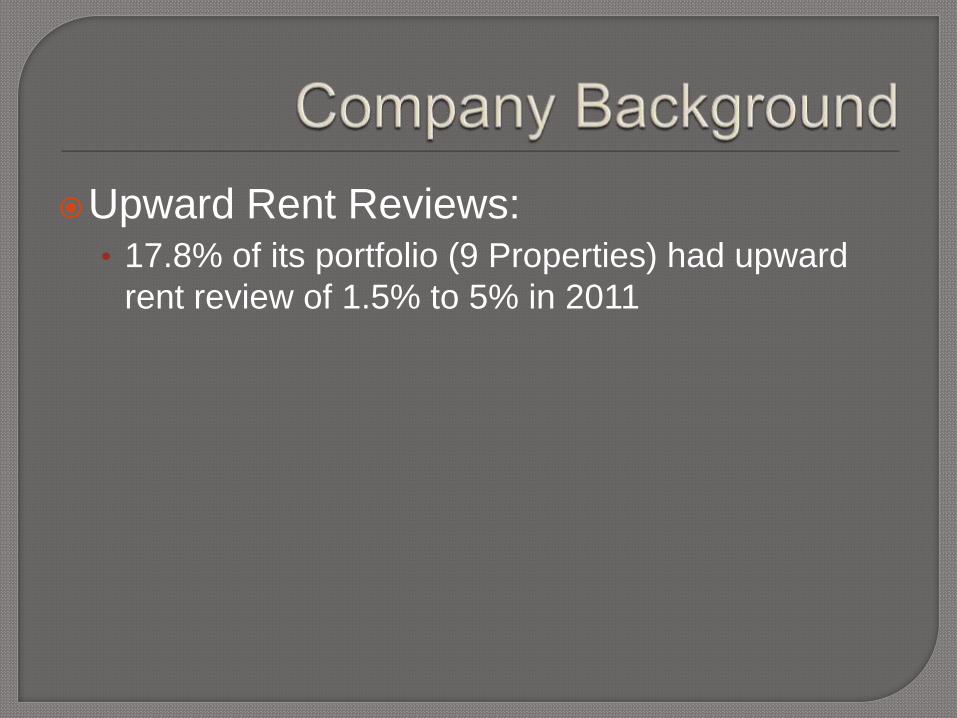
Upward Rent Reviews: • 17.8% of its portfolio (9 Properties) had upward
rent review of 1.5% to 5% in 2011
Management Changes • Hired Michael Long
• New Position: Development Manager
• May indicate REIT’s interest in Development &
Asset Enhancement projects

Residential Property Measures • Property cooling measures to residential
properties
• Real estate investors may channel their interest
towards industrial property market
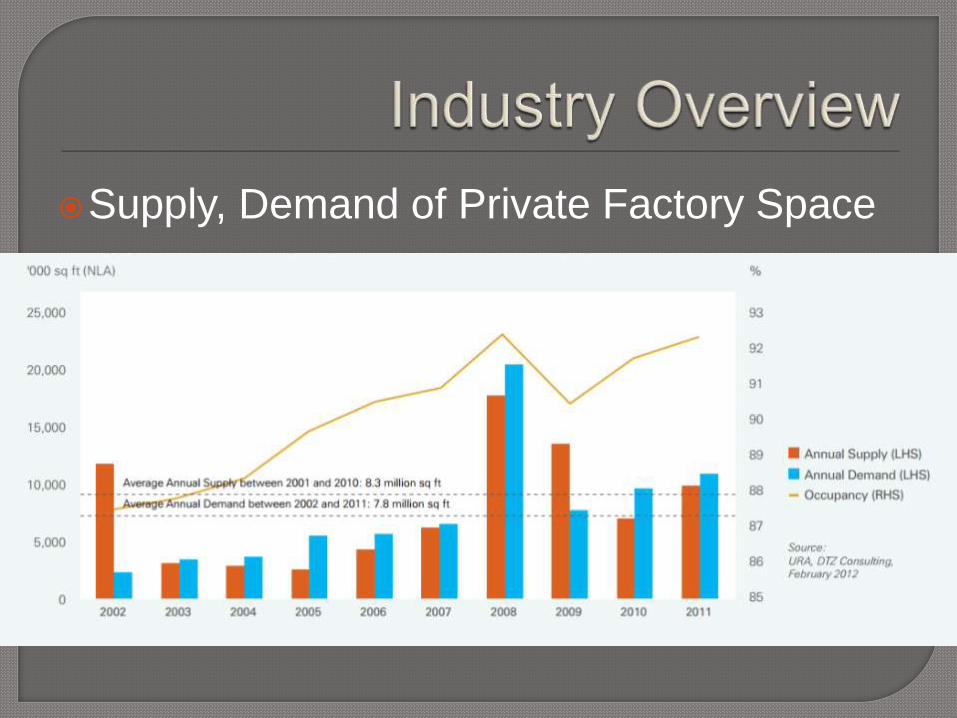
Supply, Demand of Private Factory Space
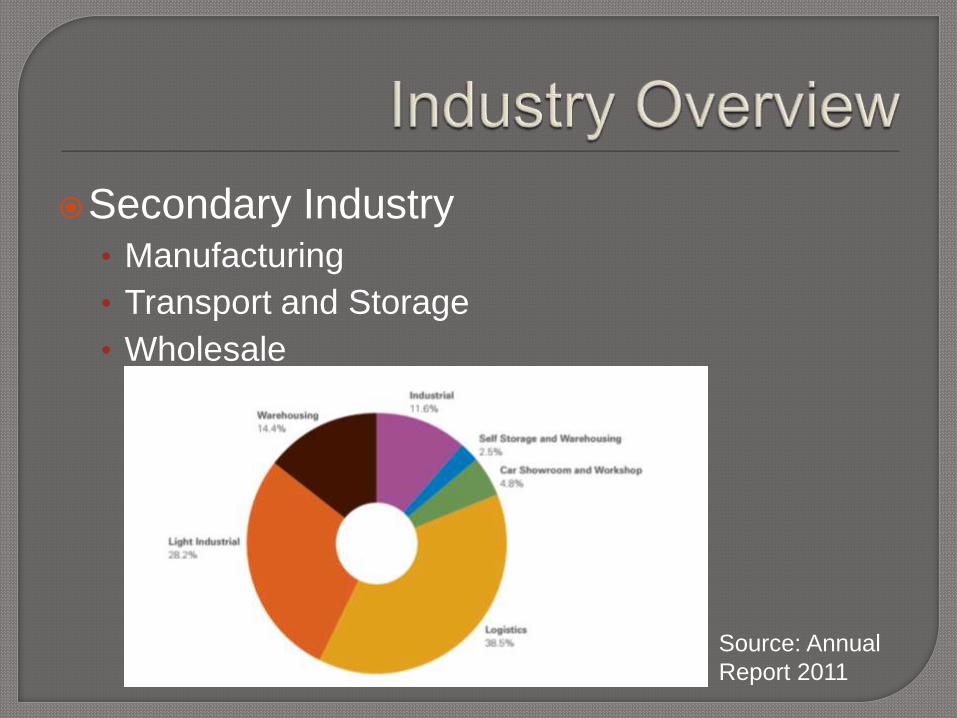
Secondary Industry • Manufacturing
• Transport and Storage
• Wholesale
Source: Annual
Report 2011
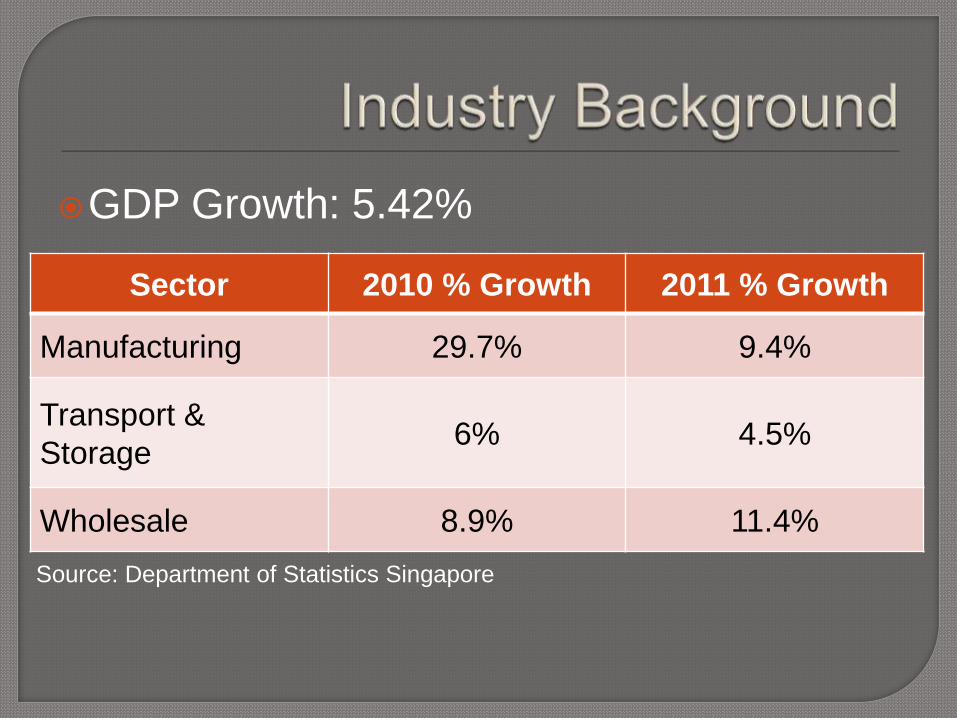
GDP Growth: 5.42%
Source: Department of Statistics Singapore
Sector 2010 % Growth 2011 % Growth
Manufacturing 29.7% 9.4%
Transport &
Storage 6% 4.5%
Wholesale 8.9% 11.4%


Methodology • Dividend Discount Model
Revenue Model
Estimate Expenses
Estimate Payout
• Dividend Yield Comparison
Peer Comparison
Other Industrial/Logistics REITs
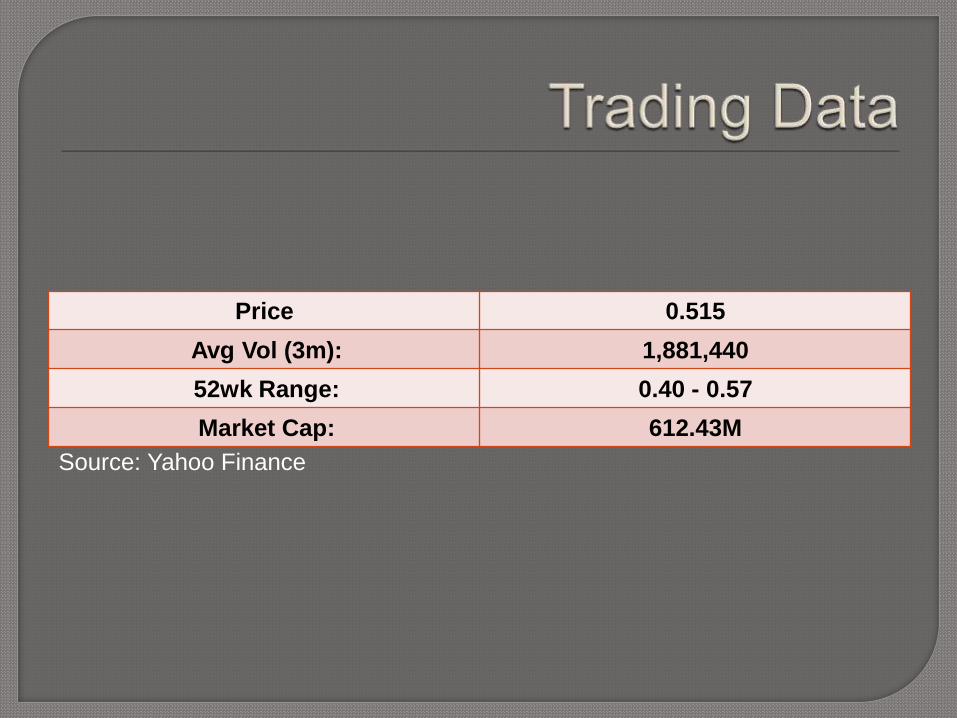
Price 0.515
Avg Vol (3m): 1,881,440
52wk Range: 0.40 - 0.57
Market Cap: 612.43M
Source: Yahoo Finance
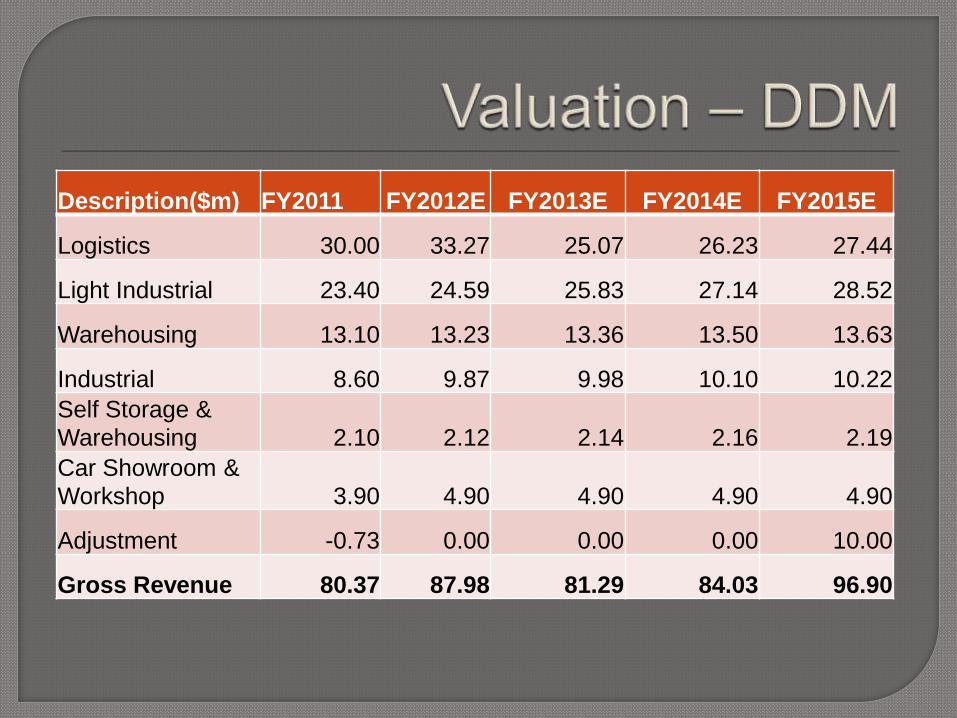
Description($m) FY2011 FY2012E FY2013E FY2014E FY2015E
Logistics 30.00 33.27 25.07 26.23 27.44
Light Industrial 23.40 24.59 25.83 27.14 28.52
Warehousing 13.10 13.23 13.36 13.50 13.63
Industrial 8.60 9.87 9.98 10.10 10.22
Self Storage &
Warehousing 2.10 2.12 2.14 2.16 2.19
Car Showroom &
Workshop 3.90 4.90 4.90 4.90 4.90
Adjustment -0.73 0.00 0.00 0.00 10.00
Gross Revenue 80.37 87.98 81.29 84.03 96.90
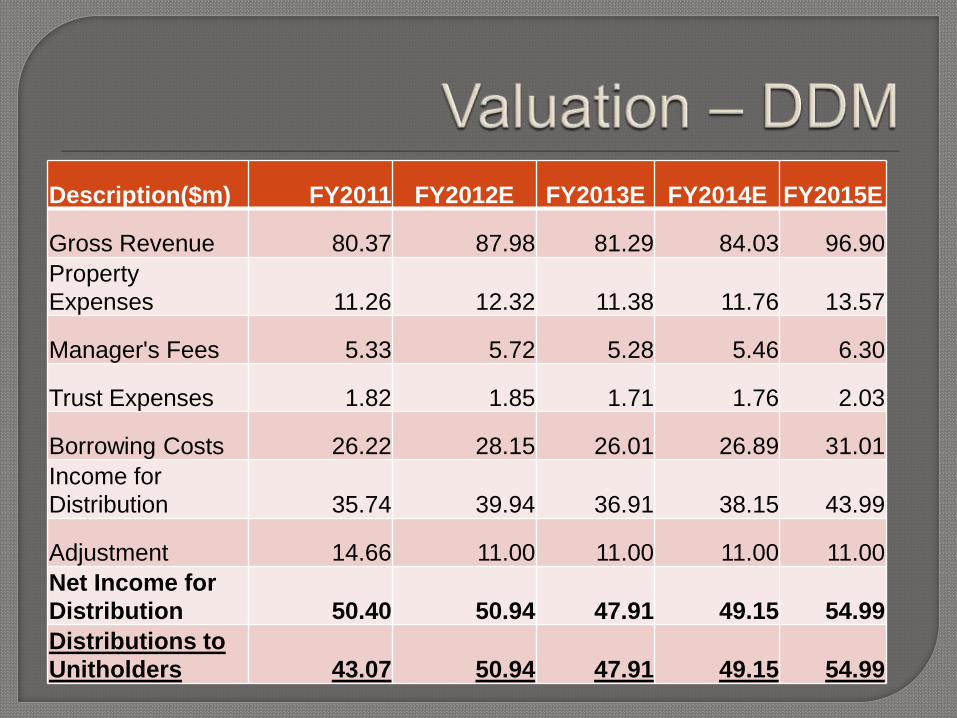
Description($m) FY2011 FY2012E FY2013E FY2014E FY2015E
Gross Revenue 80.37 87.98 81.29 84.03 96.90
Property
Expenses 11.26 12.32 11.38 11.76 13.57
Manager's Fees 5.33 5.72 5.28 5.46 6.30
Trust Expenses 1.82 1.85 1.71 1.76 2.03
Borrowing Costs 26.22 28.15 26.01 26.89 31.01
Income for
Distribution 35.74 39.94 36.91 38.15 43.99
Adjustment 14.66 11.00 11.00 11.00 11.00
Net Income for
Distribution 50.40 50.94 47.91 49.15 54.99
Distributions to
Unitholders 43.07 50.94 47.91 49.15 54.99
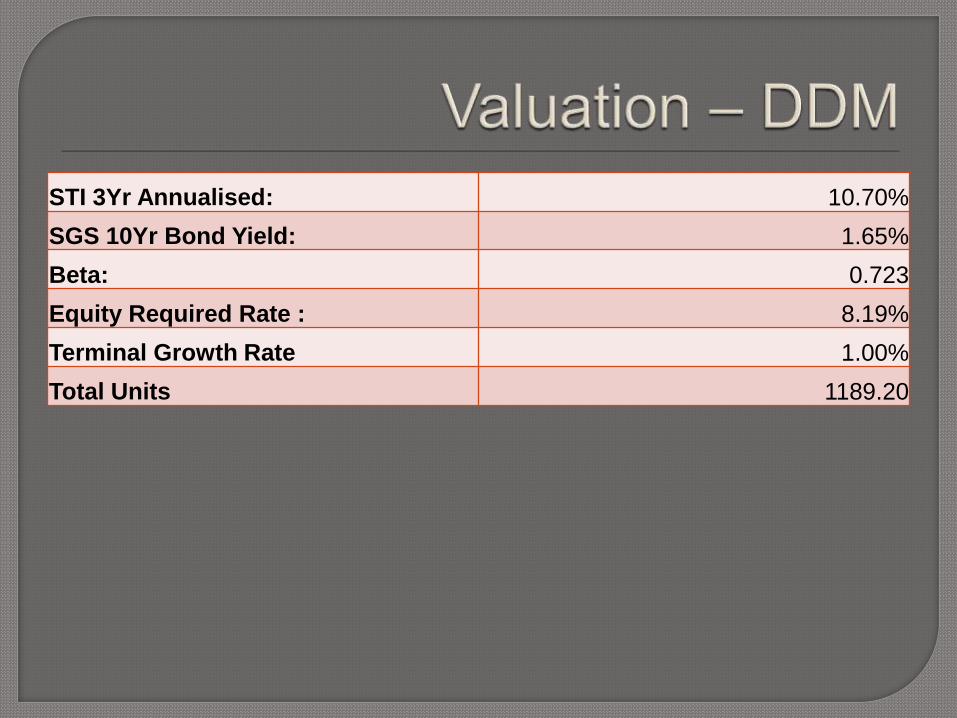
STI 3Yr Annualised: 10.70%
SGS 10Yr Bond Yield: 1.65%
Beta: 0.723
Equity Required Rate : 8.19%
Terminal Growth Rate 1.00%
Total Units 1189.20
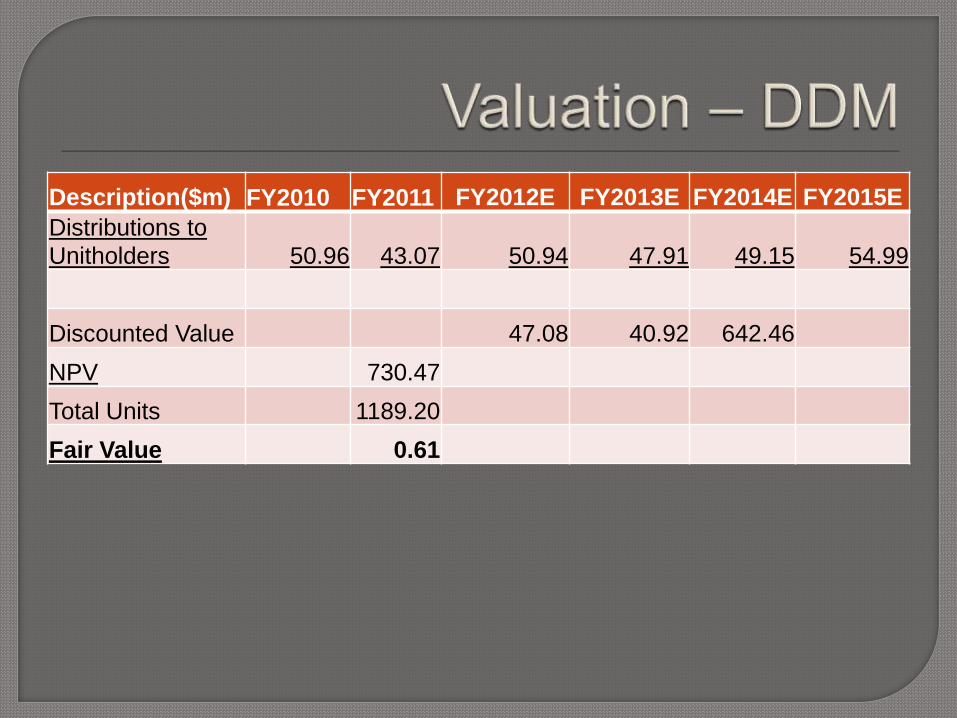
Description($m) FY2010 FY2011 FY2012E FY2013E FY2014E FY2015E
Distributions to
Unitholders 50.96 43.07 50.94 47.91 49.15 54.99
Discounted Value 47.08 40.92 642.46
NPV 730.47
Total Units 1189.20
Fair Value 0.61
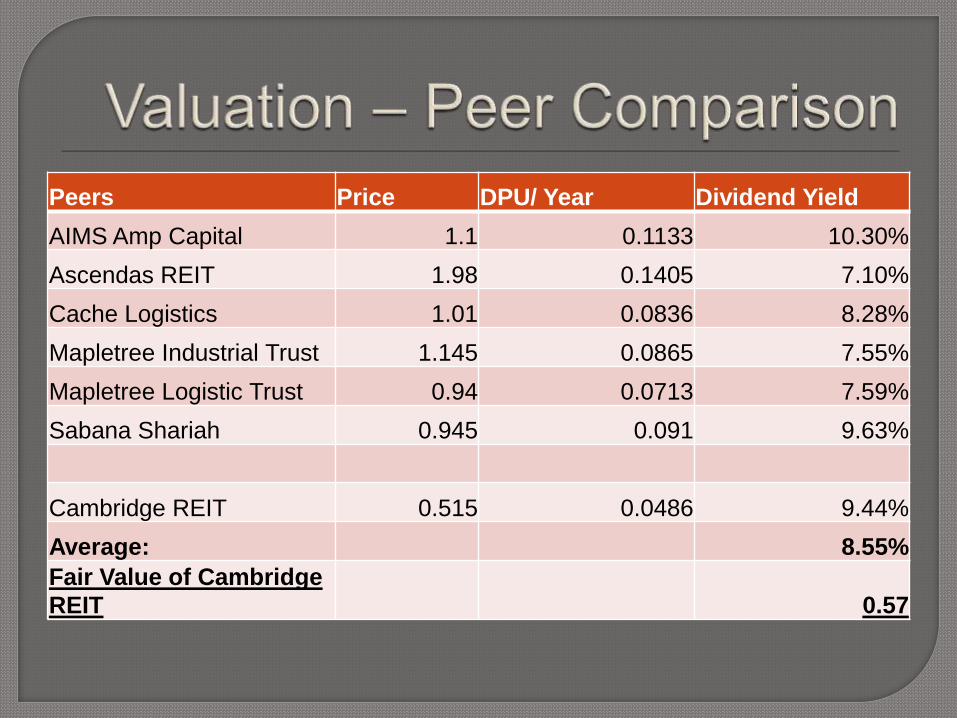
Peers Price DPU/ Year Dividend Yield
AIMS Amp Capital 1.1 0.1133 10.30%
Ascendas REIT 1.98 0.1405 7.10%
Cache Logistics 1.01 0.0836 8.28%
Mapletree Industrial Trust 1.145 0.0865 7.55%
Mapletree Logistic Trust 0.94 0.0713 7.59%
Sabana Shariah 0.945 0.091 9.63%
Cambridge REIT 0.515 0.0486 9.44%
Average: 8.55%
Fair Value of Cambridge
REIT 0.57
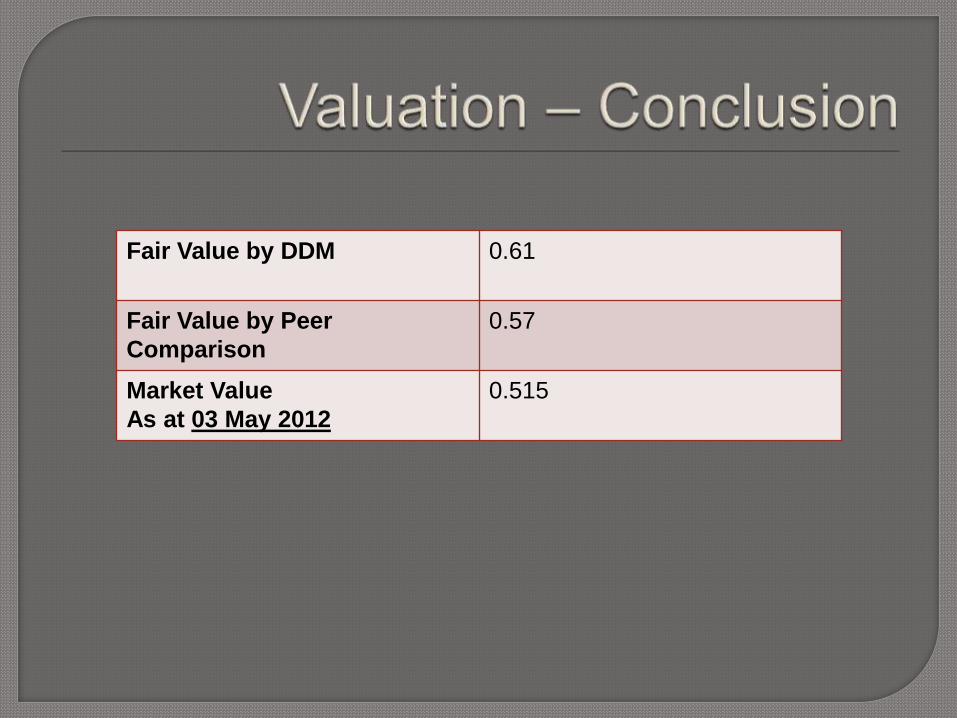
Fair Value by DDM 0.61
Fair Value by Peer
Comparison
0.57
Market Value
As at 03 May 2012
0.515

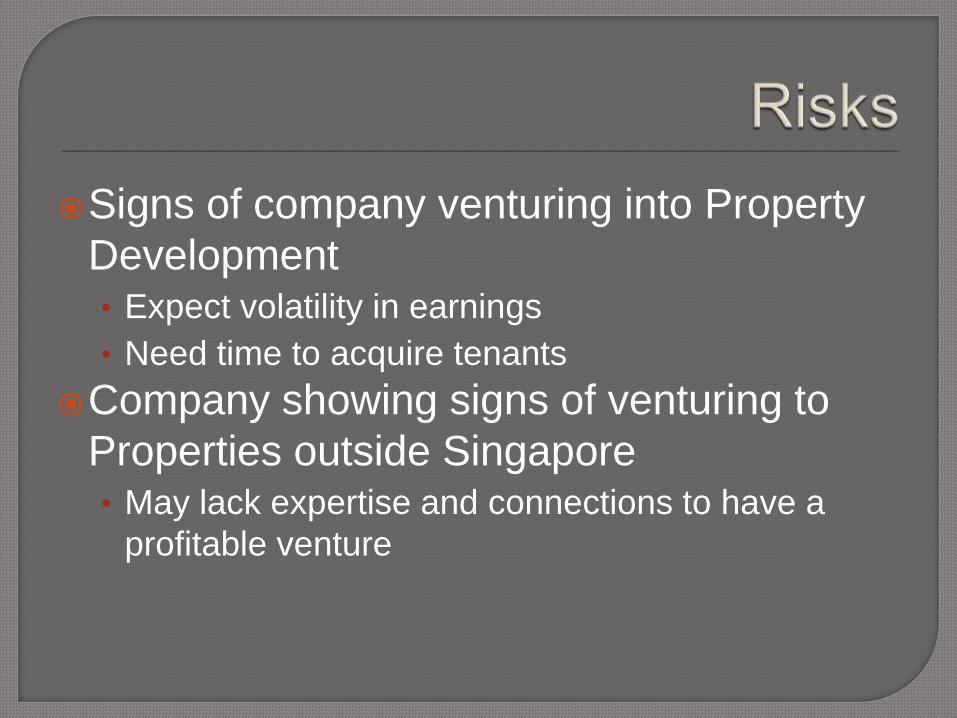
Signs of company venturing into Property
Development • Expect volatility in earnings
• Need time to acquire tenants
Company showing signs of venturing to
Properties outside Singapore • May lack expertise and connections to have a
profitable venture
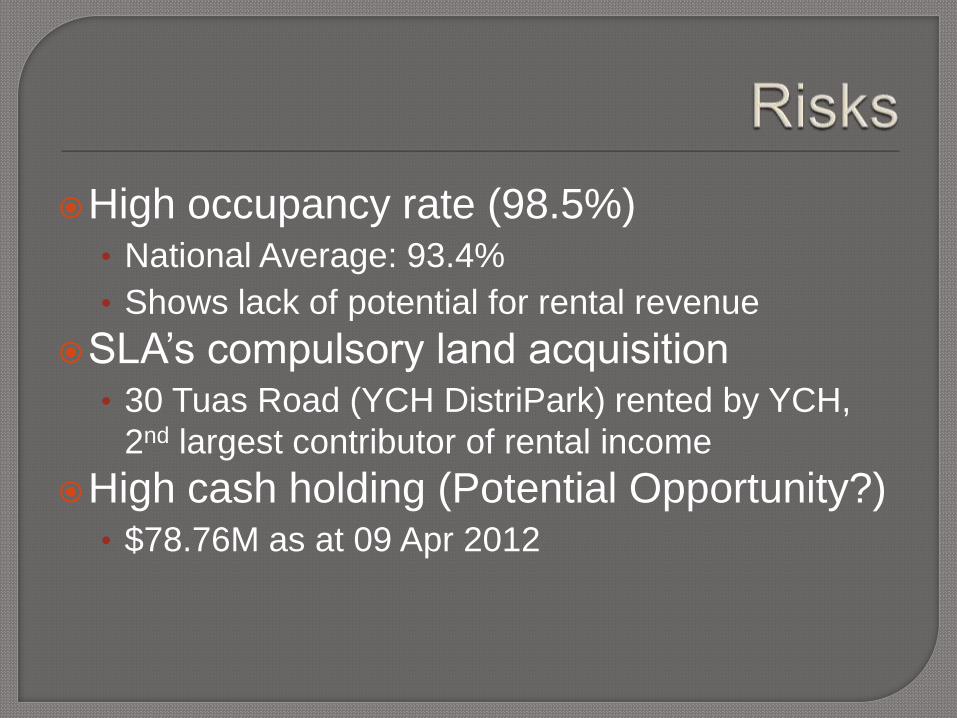
High occupancy rate (98.5%) • National Average: 93.4%
• Shows lack of potential for rental revenue
SLA’s compulsory land acquisition • 30 Tuas Road (YCH DistriPark) rented by YCH,
2nd largest contributor of rental income
High cash holding (Potential Opportunity?) • $78.76M as at 09 Apr 2012
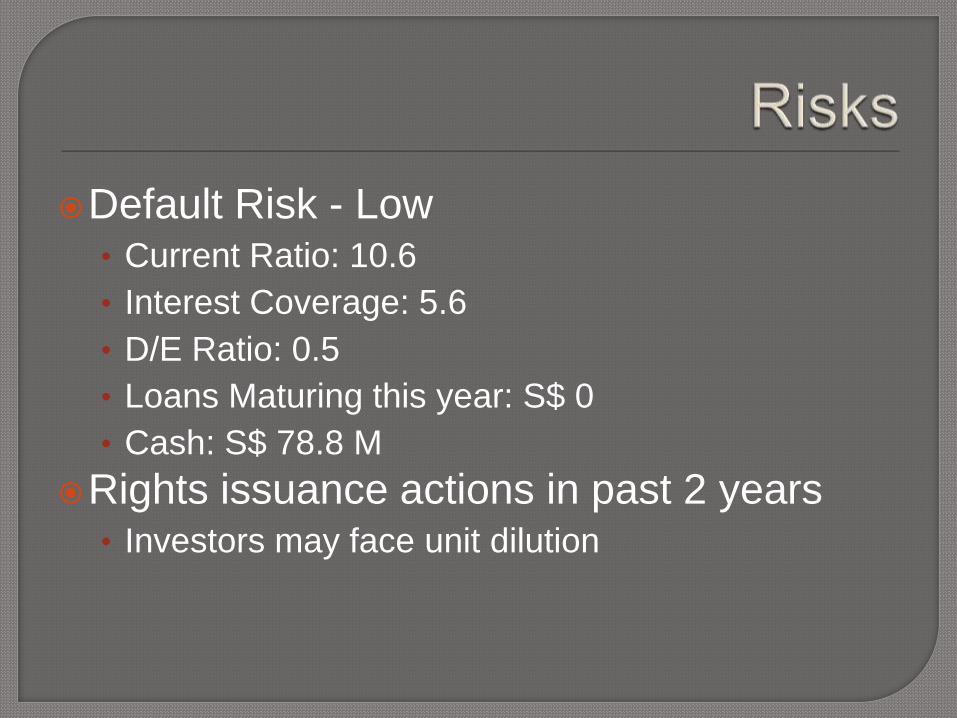
Default Risk - Low • Current Ratio: 10.6
• Interest Coverage: 5.6
• D/E Ratio: 0.5
• Loans Maturing this year: S$ 0
• Cash: S$ 78.8 M
Rights issuance actions in past 2 years • Investors may face unit dilution