Embed Size (px)
Citation preview
1.
Public Attitudes to Inequality
Scottish Social Attitudes 2016
Authors: Diana Bardsley, Stephen Hinchliffe, Ian Montagu, Joanne McLean and Susan Reid
Scottish Social Attitudes | Public Attitudes to Inequalities
ScotCen Social Research 2
Acknowledgements
First and foremost, we would like to thank the 1,237 participants who gave up their free time to take part in the survey.
We would like to thank Elspeth Molony, Project Manager of the module at NHS Health Scotland for her input into the questionnaire design and comments on the report. We would also like to thank Rebecca Sludden for her comments on the report.
Our thanks go to other members of the SSA research team and John Curtice for their work on the development of the questionnaire. Thanks are also due to our colleagues in NatCen’s Project Management, Logistics and Computing departments (particularly Emma Fenn and Sue Corbett), Jackie Palmer our data manager, and to our team of interviewers and supervisors.
Responsibility for the opinions expressed in this report, and for all interpretation of the data, lies solely with the authors.
Summary
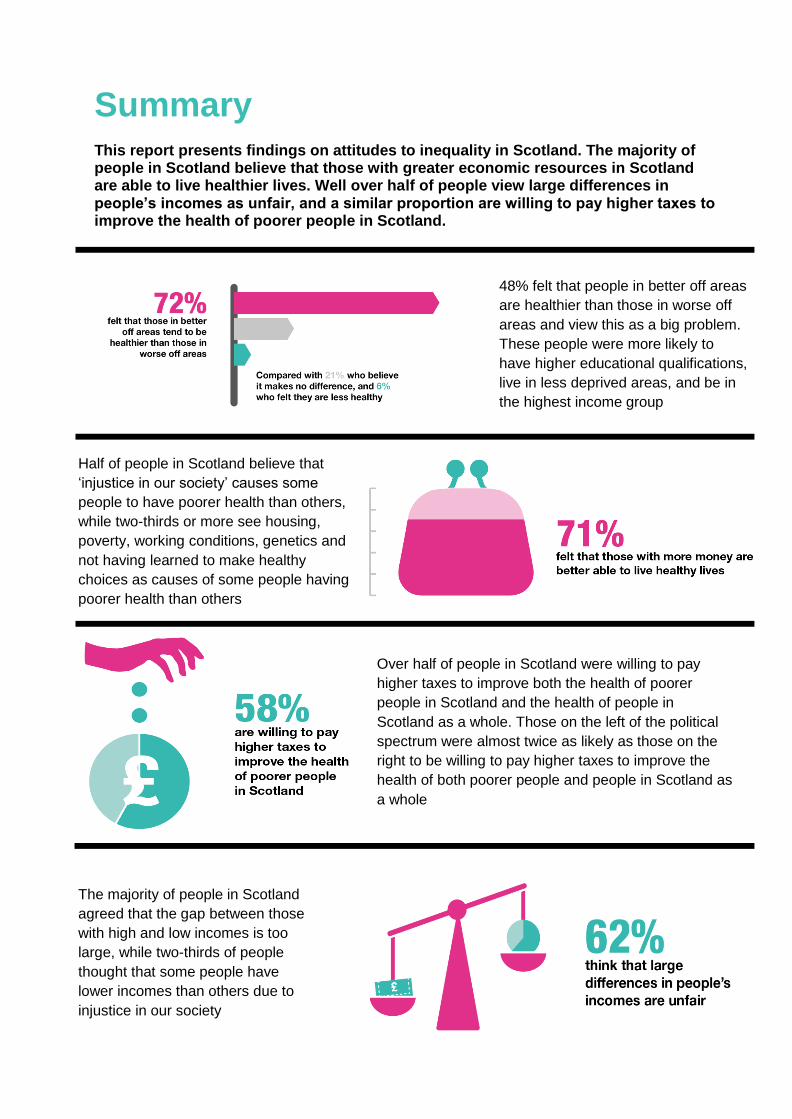
This report presents findings on attitudes to inequality in Scotland. The majority of people in Scotland believe that those with greater economic resources in Scotland are able to live healthier lives. Well over half of people view large differences in people’s incomes as unfair, and a similar proportion are willing to pay higher taxes to improve the health of poorer people in Scotland.
Half of people in Scotland believe that
‘injustice in our society’ causes some
people to have poorer health than others,
while two-thirds or more see housing,
poverty, working conditions, genetics and
not having learned to make healthy
choices as causes of some people having
poorer health than others
48% felt that people in better off areas
are healthier than those in worse off
areas and view this as a big problem.
These people were more likely to
have higher educational qualifications,
live in less deprived areas, and be in
the highest income group
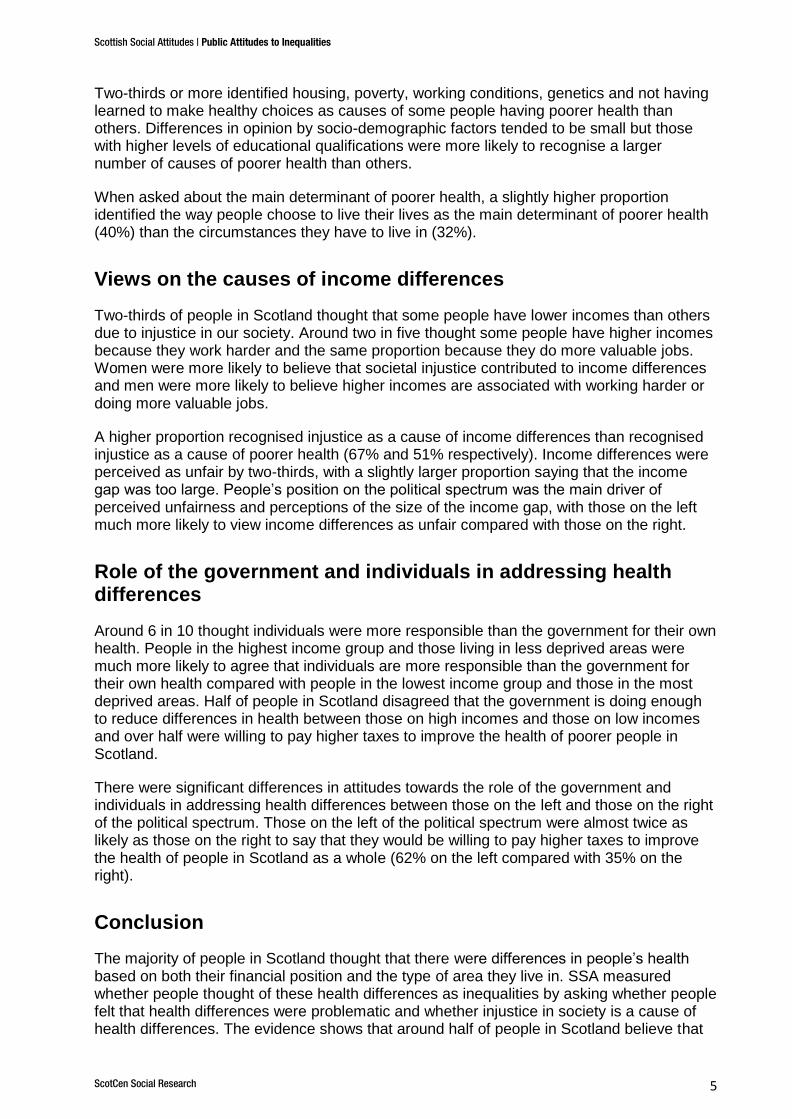
Over half of people in Scotland were willing to pay
higher taxes to improve both the health of poorer
people in Scotland and the health of people in
Scotland as a whole. Those on the left of the political
spectrum were almost twice as likely as those on the
right to be willing to pay higher taxes to improve the
health of both poorer people and people in Scotland as
a whole
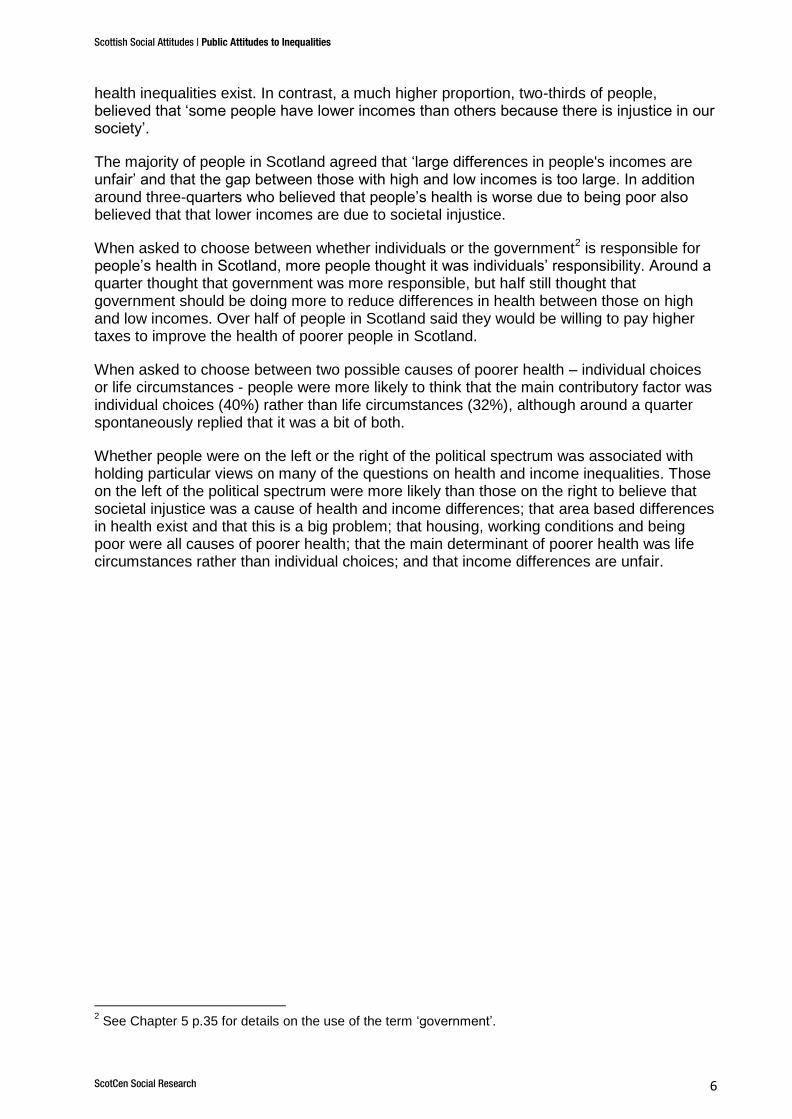
The majority of people in Scotland
agreed that the gap between those
with high and low incomes is too
large, while two-thirds of people
thought that some people have
lower incomes than others due to
injustice in our society
Scottish Social Attitudes | Public Attitudes to Inequalities
ScotCen Social Research 4
Executive Summary
This report presents findings from Scottish Social Attitudes (SSA) 2016 on public attitudes to inequality in Scotland. Run annually by ScotCen Social Research since 1999, the Scottish Social Attitudes survey provides a robust and reliable picture of public attitudes in Scotland. Fieldwork for SSA 2016 ran between July and December 2016 and consisted of face-to-face interviews with 1,237 adults aged 16 and over.
The 2016 survey included 20 questions about inequality developed in consultation with colleagues from NHS Health Scotland. All but one of these questions had never been asked on SSA before. The main objectives were to:
explore public awareness of the existence of health inequalities: there is considerable evidence on the existence of health and income inequalities, however, little is known about whether the Scottish public are aware of these inequalities or whether they are concerned about them.
explore public views in Scotland on the potential causes of health and income differences and views on the relationship between health inequalities, individual choices and social circumstances.
facilitate an examination of whether, and if so how, these attitudes vary amongst sub-groups.
explore the role of government (in its broadest sense) and individuals in addressing health differences.
Differences in health in Scotland
Seven in ten (71%) people felt that those with more money are better able to live healthy lives with a similar proportion (72%) feeling that those living in better off areas in Scotland tend to be healthier than those living in worse off areas. Views on whether there are differences in people’s health based on their financial position and the type of area they live in differed by people’s level of education, income and whether people lived in more or less deprived areas. Those educated to degree-level were more likely to agree both that people in better off areas and that people with more money were healthier compared with those with no formal qualifications. Those in the highest income group (82%) were more likely than those in the lowest income group (56%) to believe that people living in better off areas tend to be healthier than those living in worse off areas. And around half (48%) felt that those living in better off areas tended to be healthier than those in worse off areas and that this represents a big problem.
Views on causes of health differences in Scotland
Half of people in Scotland1 recognised injustice in our society as a cause of some people
having poorer health than others. Women were more likely than men to agree that some people had poorer health because of injustices in society. And those on the left of the political spectrum were more than six times as likely to agree that ‘certain people’s health is worse because of injustice in our society’ compared with those on the right (64% compared with 10% respectively).
1 The findings of SSA are representative of the views of the people of Scotland due to the way the survey
selects its respondents using a random probability sample (see Section 1.6 for more details).
Scottish Social Attitudes | Public Attitudes to Inequalities
ScotCen Social Research 5
Two-thirds or more identified housing, poverty, working conditions, genetics and not having learned to make healthy choices as causes of some people having poorer health than others. Differences in opinion by socio-demographic factors tended to be small but those with higher levels of educational qualifications were more likely to recognise a larger number of causes of poorer health than others.
When asked about the main determinant of poorer health, a slightly higher proportion identified the way people choose to live their lives as the main determinant of poorer health (40%) than the circumstances they have to live in (32%).
Views on the causes of income differences
Two-thirds of people in Scotland thought that some people have lower incomes than others due to injustice in our society. Around two in five thought some people have higher incomes because they work harder and the same proportion because they do more valuable jobs. Women were more likely to believe that societal injustice contributed to income differences and men were more likely to believe higher incomes are associated with working harder or doing more valuable jobs.
A higher proportion recognised injustice as a cause of income differences than recognised injustice as a cause of poorer health (67% and 51% respectively). Income differences were perceived as unfair by two-thirds, with a slightly larger proportion saying that the income gap was too large. People’s position on the political spectrum was the main driver of perceived unfairness and perceptions of the size of the income gap, with those on the left much more likely to view income differences as unfair compared with those on the right.
Role of the government and individuals in addressing health differences
Around 6 in 10 thought individuals were more responsible than the government for their own health. People in the highest income group and those living in less deprived areas were much more likely to agree that individuals are more responsible than the government for their own health compared with people in the lowest income group and those in the most deprived areas. Half of people in Scotland disagreed that the government is doing enough to reduce differences in health between those on high incomes and those on low incomes and over half were willing to pay higher taxes to improve the health of poorer people in Scotland.
There were significant differences in attitudes towards the role of the government and individuals in addressing health differences between those on the left and those on the right of the political spectrum. Those on the left of the political spectrum were almost twice as likely as those on the right to say that they would be willing to pay higher taxes to improve the health of people in Scotland as a whole (62% on the left compared with 35% on the right).
Conclusion
The majority of people in Scotland thought that there were differences in people’s health based on both their financial position and the type of area they live in. SSA measured whether people thought of these health differences as inequalities by asking whether people felt that health differences were problematic and whether injustice in society is a cause of health differences. The evidence shows that around half of people in Scotland believe that
Scottish Social Attitudes | Public Attitudes to Inequalities
ScotCen Social Research 6
health inequalities exist. In contrast, a much higher proportion, two-thirds of people, believed that ‘some people have lower incomes than others because there is injustice in our society’.
The majority of people in Scotland agreed that ‘large differences in people's incomes are unfair’ and that the gap between those with high and low incomes is too large. In addition around three-quarters who believed that people’s health is worse due to being poor also believed that that lower incomes are due to societal injustice.
When asked to choose between whether individuals or the government2 is responsible for
people’s health in Scotland, more people thought it was individuals’ responsibility. Around a quarter thought that government was more responsible, but half still thought that government should be doing more to reduce differences in health between those on high and low incomes. Over half of people in Scotland said they would be willing to pay higher taxes to improve the health of poorer people in Scotland.
When asked to choose between two possible causes of poorer health – individual choices or life circumstances - people were more likely to think that the main contributory factor was individual choices (40%) rather than life circumstances (32%), although around a quarter spontaneously replied that it was a bit of both.
Whether people were on the left or the right of the political spectrum was associated with holding particular views on many of the questions on health and income inequalities. Those on the left of the political spectrum were more likely than those on the right to believe that societal injustice was a cause of health and income differences; that area based differences in health exist and that this is a big problem; that housing, working conditions and being poor were all causes of poorer health; that the main determinant of poorer health was life circumstances rather than individual choices; and that income differences are unfair.
2 See Chapter 5 p.35 for details on the use of the term ‘government’.
Scottish Social Attitudes | Public Attitudes to Inequalities
ScotCen Social Research 7
1. Introduction
1.1. What are health inequalities?
Health inequalities are defined as the unfair and avoidable differences in people’s health across social groups and between different population groups (NHS Health Scotland, 2016). Within this definition, health inequalities are viewed as unfair, as they are socially determined by circumstances beyond an individual’s control rather than occurring by chance. They are also viewed as avoidable, as the social and economic conditions that facilitate such inequalities result from political decisions (NHS Health Scotland, 2016).
Although the determinants of health are often interrelated and complex (Kemm, 2006; Dahlgreen & Whitehead, 2006), deprivation is a key determinant of health inequalities (Audit Scotland, 2012). Both health and life expectancy are seen to worsen as deprivation levels increase, resulting in people who are worse off generally experiencing poorer health and shorter lives (NICE, 2012). These inequalities can begin before birth (CMCE, 2011) and continue throughout the life course (BMA, 2017).
1.2. The problem in Scotland
Inequalities in mortality and morbidity in Scotland are among the highest in Western and Central Europe (NHS Health Scotland, 2014), with the existence and extent of such inequalities preventing every individual in Scotland from enjoying equally the right to the highest attainable standard of physical and mental health (NHS Health Scotland, 2017). The scale of the problem of inequalities in health in Scotland is highlighted by the difference in the years of good health that people living in more deprived areas experience compared with those in less deprived areas. Men living in the least deprived areas of Scotland experience 23.8 more years of good health and women experience 22.6 more years compared with the most deprived areas (NHS Health Scotland, 2016).
While mortality and morbidity rates can differ widely between social groups across the country, they can also vary dramatically within Scotland’s towns and cities. The City of Edinburgh Council, for example, highlights a 25-year gap in life expectancy between the most and least deprived areas of the capital (City of Edinburgh Council, 2016), while Sir Michael Marmot notes that within Glasgow a male’s life expectancy can differ by up to 28 years depending upon the area in which they are born (Marmot, 2008). The interplay between health and deprivation has led to suggestions that both issues should be tackled jointly from a policy perspective, with the link between social conditions and health becoming ‘the main focus’ of health policy rather than being viewed as ‘a footnote to the ‘real’ concerns’ (Marmot, 2010).
1.3. What does this mean?
Just as those with a higher socio-economic position in society have a greater array of life chances and more opportunities to lead a flourishing life, they also have better health (Marmot, 2010). As a result, the Scottish Government recognise that reducing inequalities in health is fundamental to the wider pursuit of ‘making Scotland a better, healthier place for everyone no matter where they live’.
3
3 http://www.gov.scot/Topics/Health/Healthy-Living/Health-Inequalities
Scottish Social Attitudes | Public Attitudes to Inequalities
ScotCen Social Research 8
In addition to the social costs of health inequalities, a number of attempts have been made to measure their economic implications. Such implications stem from productivity losses, reduced tax revenue, higher welfare payments and increased treatment costs (Marmot, 2010), with the European Parliament estimating that losses linked to health inequalities cost around 1.4% of gross domestic product (GDP) within the European Union (WHO, 2017).
1.4. Scottish Social Attitudes
The Scottish Social Attitudes survey (SSA) was established in 1999 by ScotCen Social Research, an independent research organisation based in Edinburgh and part of NatCen Social Research, the UK’s largest independent social research institute. The survey, which is conducted annually, provides robust data on changing social and political attitudes in Scotland with the aim of informing both public policy and academic study. SSA has different funders every year - including charities, government and universities. Previous topics in SSA have included, among others, attitudes to dementia, alcohol, discrimination, policing, independence and Brexit. In 2016 questions on SSA were funded by the Scottish Government (attitudes to government and political engagement) and NHS Health Scotland (attitudes to obesity). In addition, NHS Health Scotland funded 20 questions on attitudes to inequality which form the basis for this report.
1.5. Aims and objectives
There were three main objectives to the inclusion of a set of questions on inequalities on SSA 2016. The objectives were to:
explore public awareness of the existence of health inequalities: as discussed in Section 1.2 there is considerable evidence on the existence of health and income inequalities, however, little is known about whether the Scottish public are aware of these inequalities or whether they are concerned about them.
explore public views in Scotland on the potential causes of health and income differences and views on the relationship between health inequalities, individual choices and social circumstances.
facilitate an examination of whether, and if so how, these attitudes vary amongst sub-groups.
explore the role of government (in its broadest sense) in addressing health differences.
The questions included in SSA did not directly ask respondents about health inequalities but instead explored this by asking people about the existence of health differences, whether the differences were a problem and whether they felt they were caused by societal injustice. The report, therefore, often discusses health differences, and takes the view that a health difference can only be described as a health inequality if people believe that it is caused by injustice in society which is potentially beyond the control of individuals.
1.6. Data collection and methodology
Run annually by ScotCen Social Research since 1999, the Scottish Social Attitudes survey provides a robust and reliable picture of changing public attitudes over time.
The 2016 survey included 20 questions about inequality developed in consultation with colleagues from NHS Health Scotland. All but one of these questions had never been asked on SSA before. A process of collaborative questionnaire design was supplemented by a
Scottish Social Attitudes | Public Attitudes to Inequalities
ScotCen Social Research 9
phase of cognitive testing of potential questions among a small sample of the public. Cognitive testing is used to identify any difficulties of comprehension or any reluctance or unwillingness among members of the public to answer a question as worded, so that these problems can be corrected. The cognitive testing involved face-to-face interviews with 15 respondents who are asked a number of survey questions, followed by prompts and probes designed to explore respondents’ understanding of those survey questions and to ascertain any difficulties they may have had in responding. Some of the final questions were asked as part of the face-to-face section of the survey, whilst a number of questions which may be considered to be more sensitive were carried in the self-completion section.
Fieldwork for SSA 2016 ran between July and December 2016 and consisted of face-to-face interviews with 1,237 adults aged 16 and over (prior to SSA 2016, SSA interviewed adults aged 18 and over). The survey uses random probability sample which is designed to yield a representative sample of adults aged 16 or over living in Scotland. Probability samples minimise unobserved biases associated with other sampling methods which exclude groups who are initially less likely to respond and who may differ in important ways from those who are more easily available. This is particularly important for a proper representation of national attitudes. Participation in SSA is entirely voluntary and potential respondents are sent a letter in advance of an interviewer visiting their address with includes details on how to opt out of the survey.
Data are weighted in order to correct for potential sources of bias in the sample and to ensure that they reflect the age and gender profile of the Scottish population. Further details about the sampling, weighting and technical details of how the survey is administered are published in a separate SSA 2016 technical report.
1.7. Analysis
This report explores how views differ by a range of different socio-demographic factors: age, gender, education, income, area deprivation (as measured by the Scottish Index of Multiple Deprivation (SIMD)) and socio-economic status (using the National Statistics Socio-Economic Classification (NS-SEC)).
4 Attitudes on a range of different political and social
issues are routinely shown to vary by these factors.
In addition, how views differ on health and income inequality were explored by whether people are on the left or the right of the political spectrum. Since 1999, the Scottish Social Attitudes survey has included an attitude scale which aims to measure respondents’ underlying political views and whether these are situated to the left or right of the political spectrum. The scale consists of five statements to which the respondent is invited to “agree strongly”, “agree”, “neither agree nor disagree”, “disagree” or “disagree strongly”. The statements are:
Government should redistribute income from the better off to those who are less well off.
Big business benefits owners at the expense of workers.
Ordinary working people do not get their fair share of the nation’s wealth.
There is one law for the rich and one for the poor.
Management will always try to get the better of employees if it gets the chance.
4 For further details see the SSA 2016 Technical Report:
http://natcen.ac.uk/media/1493001/ssa-2016-technical-report-final-for-publication.pdf
Scottish Social Attitudes | Public Attitudes to Inequalities
ScotCen Social Research 10
The scores to all the questions in the scale are added and then divided by the number of items in the scale, giving indices ranging from 1 (left of the political spectrum) to 5 (right of the political spectrum).
All percentages cited in this report are based on the weighted data and are rounded to the nearest whole number. All differences described in the text (between years, or between different groups of people) are statistically significant at the 95% level or above, unless otherwise specified. This means that the probability of having found a difference of at least this size if there was no actual difference in the population is 5% or less. The term ‘significant’ is used in this report to refer to statistical significance, and is not intended to imply substantive importance. Further details of significance testing and analysis are included in the separate SSA 2016 technical report.
1.8. Report structure
The remainder of this report is structured as follows:
Chapter Two discusses perceptions on whether people’s health is related to the area they live in or to the amount of money they have.
Chapter Three explores people’s views on a range of potential causes of health differences in Scotland.
Chapter Four focuses on views on income differences, whether these are seen as unfair and the relationship between views on health and income differences.
Chapter Five explores people’s views on the responsibility of the government and individuals for people’s health, the role of government in reducing health differences and people’s willingness to pay taxes to reduce health differences.
Finally, Chapter Six summarises the main conclusions of the report.
Scottish Social Attitudes | Public Attitudes to Inequalities
ScotCen Social Research 11
2. Differences in health in Scotland
This chapter examines whether people feel that differences in health exist between different groups of people in Scotland
5 based on whether people have more money or live in better
off areas, and the extent to which this is seen as a problem.
2.1 Do people believe that differences in health in Scotland exist?
Respondents were asked:
Some people think that those in Scotland with more money are better able than those in Scotland with less money to live healthy lives. Others disagree. How about you? Would you say that people with more money are...
…a lot better able to live healthy lives,
…a little better able to live healthy lives,
…a little less able to live healthy lives,
…a lot less able to live healthy lives,
…or, does it make no difference?
Some people think that people in better off areas in Scotland tend to be healthier than people in worse off areas in Scotland and others think they are less healthy or it makes no difference. Which comes closest to your view? Compared with those living in worse off areas, people living in better off areas tend to be...
...a lot healthier,
…a little healthier,
…a little less healthy,
…a lot less healthy,
…or, does it make no difference?
5 The findings on SSA are representative of the views of the people of Scotland due to the way the survey
selects its respondents using a random probability sample (see Section 1.6 for more details).
Key findings
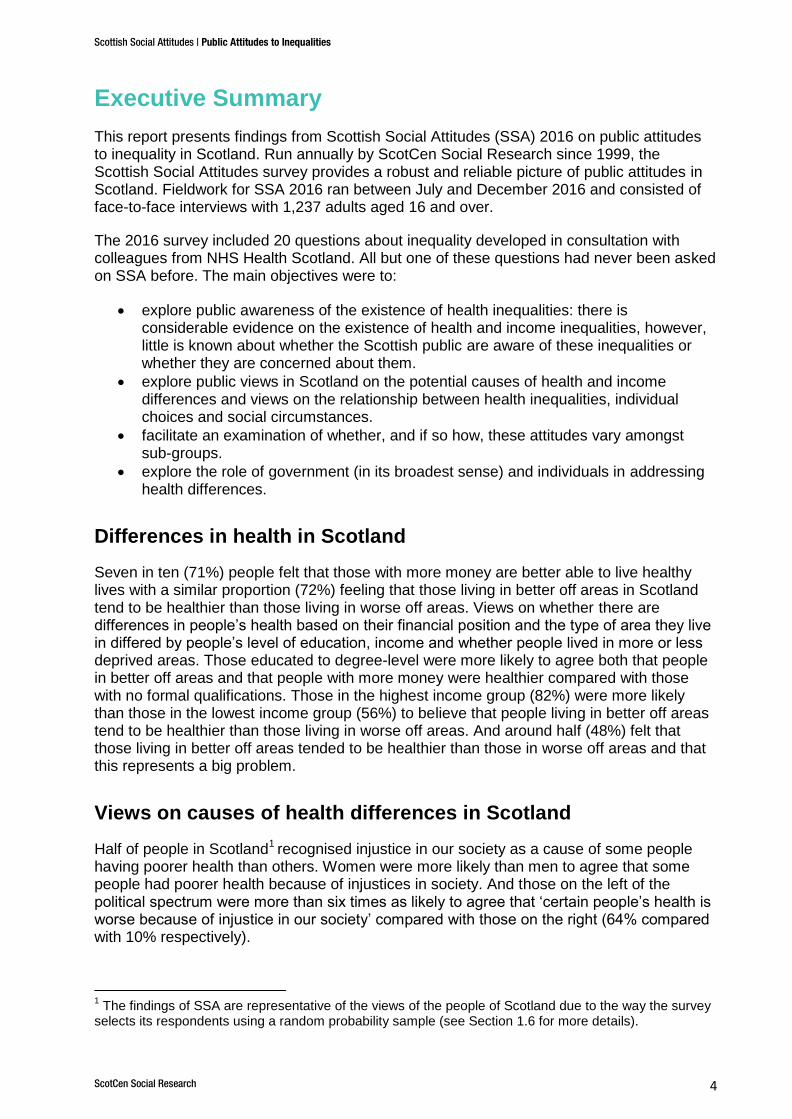
Seven in ten (71%) people felt that those with more money are better able to live
healthy lives.
Similarly, 72% felt that those living in better off areas in Scotland tend to be
healthier than those living in worse off areas.
Views varied by education, with those educated to degree-level more likely to
agree both that people in better off areas and that people with more money were
healthier compared with those with no formal qualifications.
Those in the highest income group (82%) were more likely than those in the
lowest income group (56%) to believe that people living in better off areas tend to
be healthier than those living in worse off areas.
Around half (48%) felt that those living in better off areas tended to be healthier
than those in worse off areas and that this represents a big problem.
Scottish Social Attitudes | Public Attitudes to Inequalities
ScotCen Social Research 12
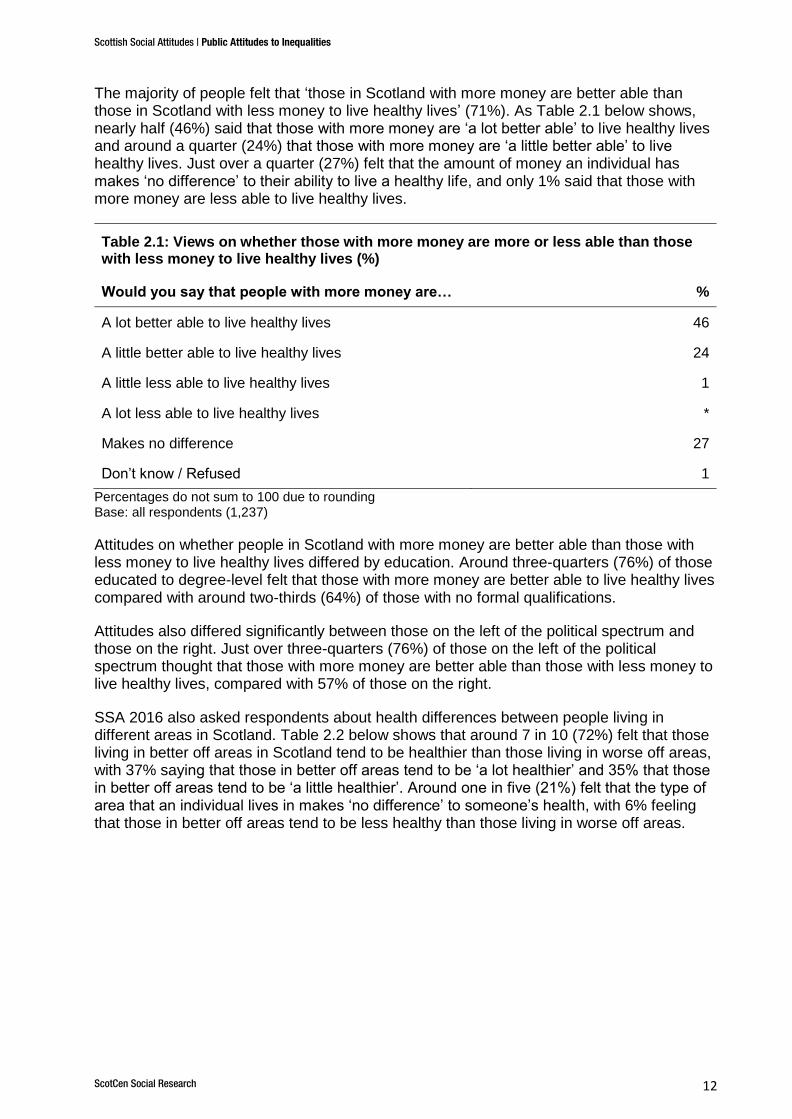
The majority of people felt that ‘those in Scotland with more money are better able than those in Scotland with less money to live healthy lives’ (71%). As Table 2.1 below shows, nearly half (46%) said that those with more money are ‘a lot better able’ to live healthy lives and around a quarter (24%) that those with more money are ‘a little better able’ to live healthy lives. Just over a quarter (27%) felt that the amount of money an individual has makes ‘no difference’ to their ability to live a healthy life, and only 1% said that those with more money are less able to live healthy lives.
Table 2.1: Views on whether those with more money are more or less able than those with less money to live healthy lives (%)
Would you say that people with more money are… %
A lot better able to live healthy lives 46
A little better able to live healthy lives 24
A little less able to live healthy lives 1
A lot less able to live healthy lives *
Makes no difference 27
Don’t know / Refused 1
Percentages do not sum to 100 due to rounding Base: all respondents (1,237)
Attitudes on whether people in Scotland with more money are better able than those with less money to live healthy lives differed by education. Around three-quarters (76%) of those educated to degree-level felt that those with more money are better able to live healthy lives compared with around two-thirds (64%) of those with no formal qualifications.
Attitudes also differed significantly between those on the left of the political spectrum and those on the right. Just over three-quarters (76%) of those on the left of the political spectrum thought that those with more money are better able than those with less money to live healthy lives, compared with 57% of those on the right.
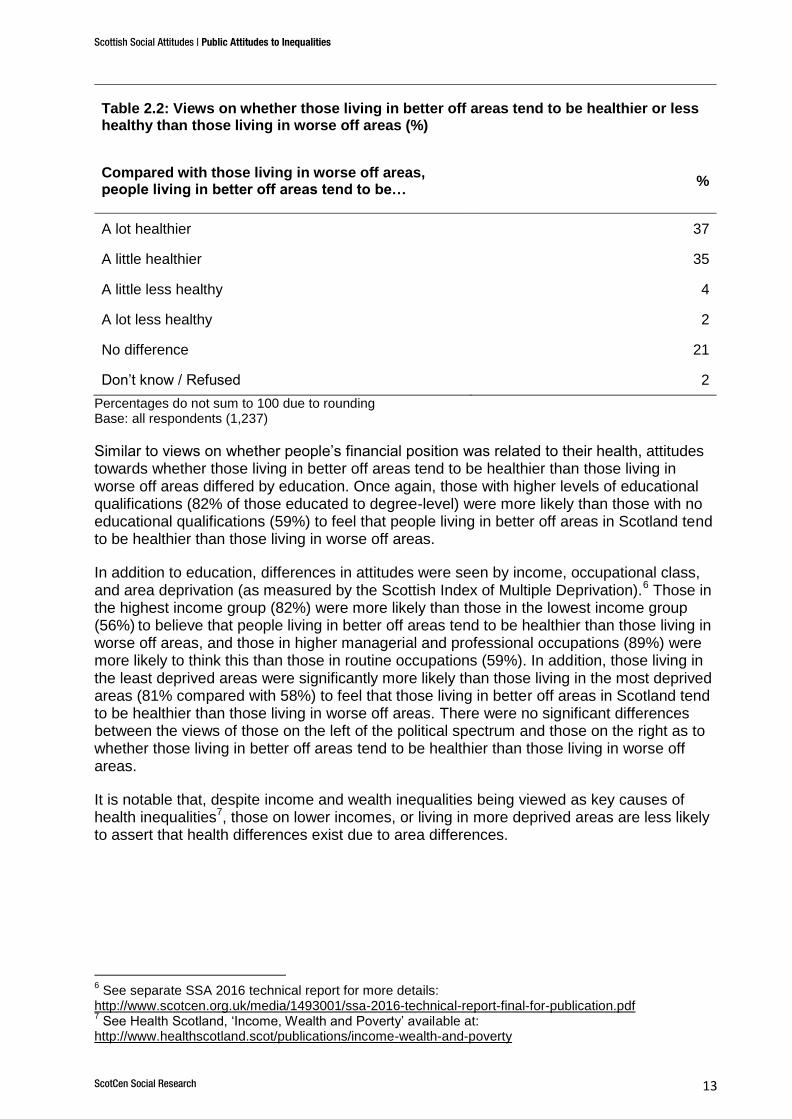
SSA 2016 also asked respondents about health differences between people living in different areas in Scotland. Table 2.2 below shows that around 7 in 10 (72%) felt that those living in better off areas in Scotland tend to be healthier than those living in worse off areas, with 37% saying that those in better off areas tend to be ‘a lot healthier’ and 35% that those in better off areas tend to be ‘a little healthier’. Around one in five (21%) felt that the type of area that an individual lives in makes ‘no difference’ to someone’s health, with 6% feeling that those in better off areas tend to be less healthy than those living in worse off areas.
Scottish Social Attitudes | Public Attitudes to Inequalities
ScotCen Social Research 13
Table 2.2: Views on whether those living in better off areas tend to be healthier or less healthy than those living in worse off areas (%)
Compared with those living in worse off areas, people living in better off areas tend to be…
%
A lot healthier 37
A little healthier 35
A little less healthy 4
A lot less healthy 2
No difference 21
Don’t know / Refused 2
Percentages do not sum to 100 due to rounding Base: all respondents (1,237)
Similar to views on whether people’s financial position was related to their health, attitudes towards whether those living in better off areas tend to be healthier than those living in worse off areas differed by education. Once again, those with higher levels of educational qualifications (82% of those educated to degree-level) were more likely than those with no educational qualifications (59%) to feel that people living in better off areas in Scotland tend to be healthier than those living in worse off areas.
In addition to education, differences in attitudes were seen by income, occupational class, and area deprivation (as measured by the Scottish Index of Multiple Deprivation).
6 Those in
the highest income group (82%) were more likely than those in the lowest income group (56%)
to believe that people living in better off areas tend to be healthier than those living in
worse off areas, and those in higher managerial and professional occupations (89%) were more likely to think this than those in routine occupations (59%). In addition, those living in the least deprived areas were significantly more likely than those living in the most deprived areas (81% compared with 58%) to feel that those living in better off areas in Scotland tend to be healthier than those living in worse off areas. There were no significant differences between the views of those on the left of the political spectrum and those on the right as to whether those living in better off areas tend to be healthier than those living in worse off areas.
It is notable that, despite income and wealth inequalities being viewed as key causes of health inequalities
7, those on lower incomes, or living in more deprived areas are less likely
to assert that health differences exist due to area differences.
6 See separate SSA 2016 technical report for more details:
http://www.scotcen.org.uk/media/1493001/ssa-2016-technical-report-final-for-publication.pdf 7 See Health Scotland, ‘Income, Wealth and Poverty’ available at:
http://www.healthscotland.scot/publications/income-wealth-and-poverty
Scottish Social Attitudes | Public Attitudes to Inequalities
ScotCen Social Research 14
2.2 Are differences in health in Scotland perceived as a problem?
In addition to asking whether or not differences in health exist between those living in better off areas compared with those living in worse off areas, SSA 2016 asked respondents whether or not this is seen as a problem.
Respondents were asked:
Would you say that the difference, if any, between the health of those living in better off areas and the health of those living in worse off areas is...
...a very big problem,
…quite a big problem
…quite a small problem,
...a very small problem,
…or, not a problem at all?
As discussed in the previous section around 7 in 10 people recognised that people in better off areas tend to be healthier than those in worse off areas. By combining views on whether health differences exist between areas and the extent to which this is a problem, we discovered that overall:
48% felt that people in better off areas are healthier than those in worse off areas and view this as a big problem
23% felt that people in better off areas are healthier than those in worse off areas but felt that this is either a small problem or not a problem at all
20% felt that where people live makes no difference to their health or that people in better off areas are less healthy and that this is a small problem or no problem, and
6% felt that where people live makes no difference to their health or that people in better off areas are less healthy and that this is a problem.
This shows that although the majority of people recognise differences in health these differences are not of concern to all members of the public as around half see them as a big problem and around a quarter see these differences as only a small problem or not a problem at all.
Exploring those who thought that there were area-based differences in health and who also felt that this is a big problem, we found that they were more likely to:
have higher educational qualifications
live in less deprived areas
be in managerial and professional occupations
be in the highest income group, and
be on the left of the political spectrum.
For example, those educated to degree-level (61%) were more likely than those with no formal qualifications (33%) to feel both that people in better off areas tend to be healthier and that this is a problem, as were those living in less deprived areas compared with those living in the most deprived areas (61% and 35% respectively). And those on the left of the political spectrum (55%) were more likely than those on the right (44%) to feel that people in better off areas tend to be healthier and that this is a problem. In contrast, those on the right of the political spectrum (33%) were more likely than those on the left (19%) to think that
Scottish Social Attitudes | Public Attitudes to Inequalities
ScotCen Social Research 15
area based differences in health exist and that this is only a small problem or not a problem at all. This suggests that, although thinking that area-based health differences exist does not appear to vary according to an individual’s location on the political spectrum, there may be a relationship between political standpoint and the positioning of health differences as a ‘problem’ that requires addressing.
Scottish Social Attitudes | Public Attitudes to Inequalities
ScotCen Social Research 16
3. Views on causes of health differences in Scotland
While Chapter 2 examined people’s views on whether differences in health exist, this chapter explores perceptions of the causes of such health differences. People were asked their views on a range of possible causes of health differences, including those related to individual choice, genetic conditions, environmental factors, poverty and injustice.
3.1 Views on different causes of health differences
Respondents were asked their views on a range of different causes of health differences. These questions were developed to explore a range of potential views that the public might hold, rather than to mirror current evidence on the causes of health inequalities.
Respondents were asked how much they agreed or disagreed that ‘certain people’s health is worse than others…
‘…because of the quality of the house they live in‘
‘…because they haven’t learned to make healthy choices’
‘…because of genetic conditions that have been passed down from their parents’
’…because of the conditions they work in’
’…because they are poor’
’...because of injustice in our society’
Key findings
Half of people in Scotland recognised injustice in our society as a cause of
some people having poorer health than others.
Two-thirds or more identified housing, poverty, working conditions, genetics
and not having learned to make healthy choices as causes of some people
having poorer health than others.
Differences in opinion by socio-demographic factors tended to be small.
Those with higher levels of educational qualifications were more likely to
recognise a larger number of causes of poorer health than others. Women
were more likely than men to agree that some people had poorer health
because of injustices in society.
When asked to choose between two potential reasons ‘why certain people in
Scotland have poorer health than others’, a slightly higher proportion thought
this was mainly due to the way people ‘choose to lead their lives’ (40%) than
mainly due to ‘the circumstances that they have to live in’ (32%).
Those on the political left, those who disagreed that ‘anyone can make healthy
choices if they want to’, and those who identified life circumstances as the
main determinant of poorer health were all more likely than others to agree
that housing, working conditions, poverty and injustice in our society caused
differences in health.
Those on the left of the political spectrum were more than six times as likely to
agree that ‘certain people’s health is worse because of injustice in our society’
compared with those on the right (64% compared with 10% respectively).
Scottish Social Attitudes | Public Attitudes to Inequalities
ScotCen Social Research 17
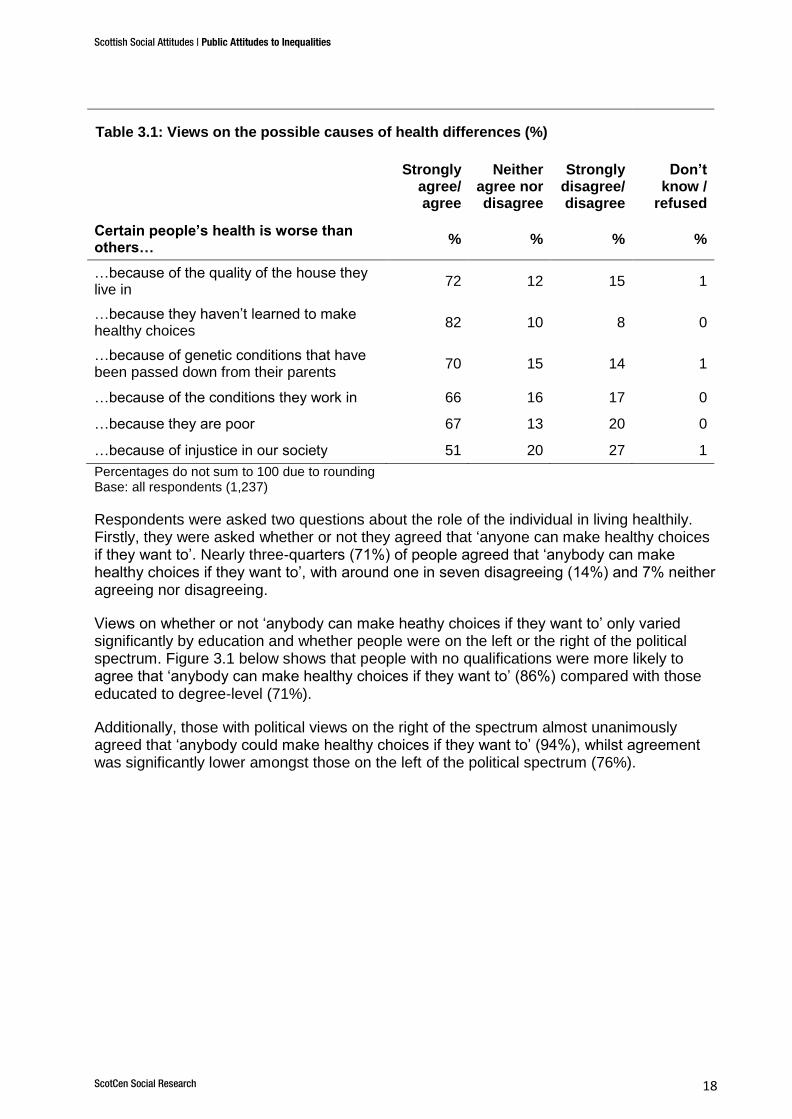
Table 3.1 below shows that the highest level of agreement was seen in relation to believing that ‘certain people’s health is worse than others because they haven’t learned to make healthy choices’, with 82% agreeing with this statement and only 8% disagreeing. The high level of agreement with this question suggests that people believe that the information that people receive about health is related to the choices that people make which in turn may impact on some people’s health.
There was also widespread agreement that environmental factors, such as housing and working conditions, can impact negatively on some people’s health. Nearly three-quarters (72%) of people in Scotland
8 agreed that ‘certain people’s health is worse than others
because of the quality of the house they live in’ with 15% disagreeing. And two-thirds agreed that ‘certain people’s health is worse because of the conditions they work in’ (66%). A similar proportion (70%) agreed that genetic conditions cause some people’s health to be worse than others.
Around two-thirds (67%) agreed that ‘certain people’s health is worse than others because they are poor’, a similar proportion to those viewing environmental factors as linked to poorer health. Finally people were asked their views on whether people’s health was poorer because of ‘injustice in our society’ and here we found that only half (51%) agreed that ‘certain people’s health is worse than others because of injustice in our society’, a considerably lower proportion than was recorded for all other factors.
So, while work, housing and being poor were all recognised by two-thirds or more of the adult population as contributing to health differences, not all of those who agreed with these statements also felt that poor health is caused by societal injustice. For example, among those who agreed that ‘certain people’s health is worse because of the quality of the house they live in’, 58% agreed that ‘certain people’s health is worse than others because of injustice in our society’, with 22% disagreeing and 18% neither agreeing nor disagreeing.
9
8 The findings on SSA are representative of the views of the people of Scotland due to the way the survey
selects its respondents using a random probability sample (see Section 1.6 for more details). 9 2% chose ‘don’t know’
Scottish Social Attitudes | Public Attitudes to Inequalities
ScotCen Social Research 18
Table 3.1: Views on the possible causes of health differences (%)
Strongly
agree/ agree
Neither agree nor disagree
Strongly disagree/ disagree
Don’t know /
refused
Certain people’s health is worse than others…
% % % %
…because of the quality of the house they live in
72 12 15 1
…because they haven’t learned to make healthy choices
82 10 8 0
…because of genetic conditions that have been passed down from their parents
70 15 14 1
…because of the conditions they work in 66 16 17 0
…because they are poor 67 13 20 0
…because of injustice in our society 51 20 27 1
Percentages do not sum to 100 due to rounding Base: all respondents (1,237)
Respondents were asked two questions about the role of the individual in living healthily. Firstly, they were asked whether or not they agreed that ‘anyone can make healthy choices if they want to’. Nearly three-quarters (71%) of people agreed that ‘anybody can make healthy choices if they want to’, with around one in seven disagreeing (14%) and 7% neither agreeing nor disagreeing.
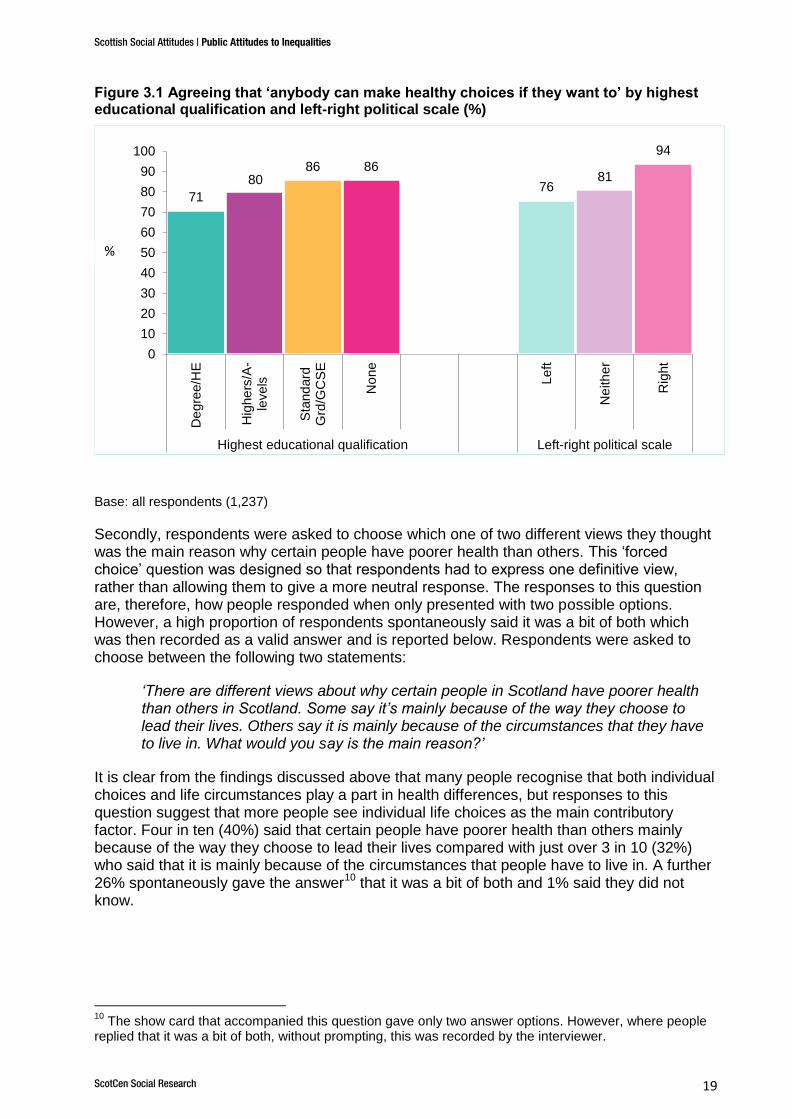
Views on whether or not ‘anybody can make heathy choices if they want to’ only varied significantly by education and whether people were on the left or the right of the political spectrum. Figure 3.1 below shows that people with no qualifications were more likely to agree that ‘anybody can make healthy choices if they want to’ (86%) compared with those educated to degree-level (71%).
Additionally, those with political views on the right of the spectrum almost unanimously agreed that ‘anybody could make healthy choices if they want to’ (94%), whilst agreement was significantly lower amongst those on the left of the political spectrum (76%).
Scottish Social Attitudes | Public Attitudes to Inequalities
ScotCen Social Research 19
Figure 3.1 Agreeing that ‘anybody can make healthy choices if they want to’ by highest educational qualification and left-right political scale (%)
Base: all respondents (1,237)
Secondly, respondents were asked to choose which one of two different views they thought was the main reason why certain people have poorer health than others. This ‘forced choice’ question was designed so that respondents had to express one definitive view, rather than allowing them to give a more neutral response. The responses to this question are, therefore, how people responded when only presented with two possible options. However, a high proportion of respondents spontaneously said it was a bit of both which was then recorded as a valid answer and is reported below. Respondents were asked to choose between the following two statements:
‘There are different views about why certain people in Scotland have poorer health than others in Scotland. Some say it’s mainly because of the way they choose to lead their lives. Others say it is mainly because of the circumstances that they have to live in. What would you say is the main reason?’
It is clear from the findings discussed above that many people recognise that both individual choices and life circumstances play a part in health differences, but responses to this question suggest that more people see individual life choices as the main contributory factor. Four in ten (40%) said that certain people have poorer health than others mainly because of the way they choose to lead their lives compared with just over 3 in 10 (32%) who said that it is mainly because of the circumstances that people have to live in. A further 26% spontaneously gave the answer
10 that it was a bit of both and 1% said they did not
know.
10
The show card that accompanied this question gave only two answer options. However, where people replied that it was a bit of both, without prompting, this was recorded by the interviewer.
71
80 86 86
76 81
94
0
10
20
30
40
50
60
70
80
90
100
De
gre
e/H
E
Hig
he
rs/A
-le
vels
Sta
nd
ard
Grd
/GC
SE
No
ne
Le
ft
Ne
ith
er
Rig
ht
Highest educational qualification Left-right political scale
%
Scottish Social Attitudes | Public Attitudes to Inequalities
ScotCen Social Research 20
3.2 How do views on different causes of health differences vary between subgroups?
How views on the different causes of health differences varied were explored in relation to:
Age
Gender
Education
Household income
Area deprivation11
Occupational class12
Position on the left-right political scale
Whether people believe that the area people live in makes a difference to health and whether this is a problem (see Chapter 2 for details)
Belief that ‘anyone can make healthy choices if they want to’
Belief that poorer health is mainly due to how people lead their lives or mainly due to their circumstances.
There were no significant differences by either socio-demographic or attitudinal factors in relation to views on whether ‘certain people’s health is worse than others because of genetic conditions that have been passed down from their parents’. The following sections therefore explore the significant differences across the other five factors.
Differences by socio-demographic factors
Across the five factors that might be linked to certain people having poorer health than
others (housing, working conditions, learning to make healthy choices, being poor and societal injustice) there was little variation by socio-demographic factors. The exceptions were views on the link between poorer health and housing quality, whether people hadn’t learned to make healthy choices and injustice.
Views varied according to area deprivation for both agreeing that ‘certain people’s health is worse than others because of the quality of the house they live in’ and ‘worse than others because they haven’t learned to make health choices’. Similar patterns were seen for both, with those living in the most deprived areas less likely to agree with these statements than those in the least deprived areas. For example, around two-thirds (65%) of those living in the most deprived areas agreed that housing quality was associated with poorer health compared with around three-quarters (76%) of those in the least deprived areas.
In addition, people’s views on whether ‘certain people’s health is worse than others because they haven’t learned to make healthy choices’ differed according to their level of education. Nearly 9 out of 10 people educated to degree level (88%) agreed with this statement compared with between 76-80% of those with lower levels of education.
In contrast, views on whether ‘certain people’s health is worse than others because of injustice in our society’ varied by gender and income. Women were more likely than men to agree with this statement (56% and 46% respectively) as were those in the lowest income
11
Area deprivation was measured using the Scottish Index of Multiple Deprivation (SIMD). For details on SIMD, please see the separate SSA 2016 technical report. 12
Occupational class was measured using a five category version of the National Statistics Socio-Economic Classification (NS-SEC). See the SSA 2016 technical report for further details.
Scottish Social Attitudes | Public Attitudes to Inequalities
ScotCen Social Research 21
groups compared with those in the highest income groups (57-60% of those in the two lowest income groups agreed compared with 45-53% of those on higher incomes).
Differences by whether people believe that poorer health is mainly
due to individual choice or life circumstances
In contrast to the lack of associations between views on the causes of poorer health and socio-demographic factors, views on all five potential factors were associated with a wide range of different attitudes.
Responses to the question on whether ‘certain people are more likely to have poorer health mainly because of the way they choose to lead their lives’ or ‘mainly because of the circumstances that they have to live in’ were strongly associated with responses to all five potential causes of poorer health. The findings from this question divide respondents into those who are more likely to think that individual choices are the main contributory factor to poorer health and those who are more likely to think that poorer health is associated with circumstances.
People who said that poorer health is mainly due to individual choices were more likely than those who said it was mainly due to life circumstances to agree that ‘certain people’s health is worse than others because they haven’t learned to make healthy choices’ (86% and 74% respectively).
For the other four factors – housing, working conditions, being poor and injustice – those who said that poorer health is mainly due to circumstances were more likely to agree than those who said it was mainly due to individual choices that these potential causes were associated with certain people having poorer health. For example, over 8 in 10 (83%) who believed that health is mainly determined by circumstances agreed that ‘certain people’s health is worse than others because they are poor’ compared with half (50%) of those who believe health is mainly determined by individual choices.
Similarly those who disagreed that ‘anybody can make healthy choices if they want to’, were more likely to agree that housing, working conditions, being poor and injustice were linked to people having poorer health. For example, 8 in 10 (80%) of those who disagreed that ‘anyone can make healthy choices’ thought that ‘certain people’s health is worse than others due to injustice in our society’ compared with 44% of those who agreed.
Differences by believe that people in better off areas are healthier and
that this is a problem
There were also some differences between those who felt that people in better off areas were healthier and saw this as a big problem compared with those who saw these health differences as either a small problem or not a problem at all.
13 Those who felt that people in
better off areas were healthier and saw this as a big problem were more likely to agree that some people’s health was worse than others because of the quality of housing, because they are poor and because of injustice in our society. For example, around 4 in 5 (82%) of those who felt that people in better off areas are healthier and that this is a big problem agreed that people’s health is worse because they are poor compared with 58% of those who felt that people in better off areas are healthier but that this is only a small problem or not a problem at all.
13
See Chapter 2 for details.
Scottish Social Attitudes | Public Attitudes to Inequalities
ScotCen Social Research 22
Differences by political attitudes
Chapter 2 showed that those on the left of the political spectrum were more likely than those on the right to believe that people in better off areas were healthier than those in worse off areas and to see this as a problem. Exploring views on the causes of health differences shows that those on the left of the political spectrum are more likely than those on the right to agree that housing, working conditions, being poor and injustice in our society are associated with certain people having poorer health. This is particularly marked in relation to views on whether ‘certain people’s health is worse because of injustice in our society’ where those on the left were more than six times as likely to agree with this statement compared with those on the right (64% compared with 10% respectively).
Around three-quarters (74%) of those on the left agreed that ‘certain people’s health is worse than others because they are poor’ compared with 45% on the right and similarly 72% of those on the left agreed that poorer health is because of working conditions compared with 48% on the right. However, there was less difference between the views of those on the left and those on the right on the link between poorer health and the quality of housing: 76% of those on the left agreed that poorer health is because of the quality of the house people live in compared with 62% of those on the right.
This shows that those on the left of the political spectrum are more likely to believe that there is a link between people having poor health and a range of different factors, including environmental, workplace, income and injustice. The association between a belief in poorer health and injustice was particularly strong among those on the left of the political spectrum, showing that those on the left are considerably more likely than others to view health differences as an inequality, which is at least to some extent linked to injustices in the way that society is structured, rather than due to the choices individuals make.
Choice or circumstances
As already discussed above, there was a strong association between views on whether individual choice or circumstances were the main determinant of poorer health and five of the six specific causes of poorer health (housing, working conditions, learning to make healthy choices, being poor, and societal injustice). But who is more likely to say that individual choices are the main determinant and who are more likely to say that it is mainly life circumstances?
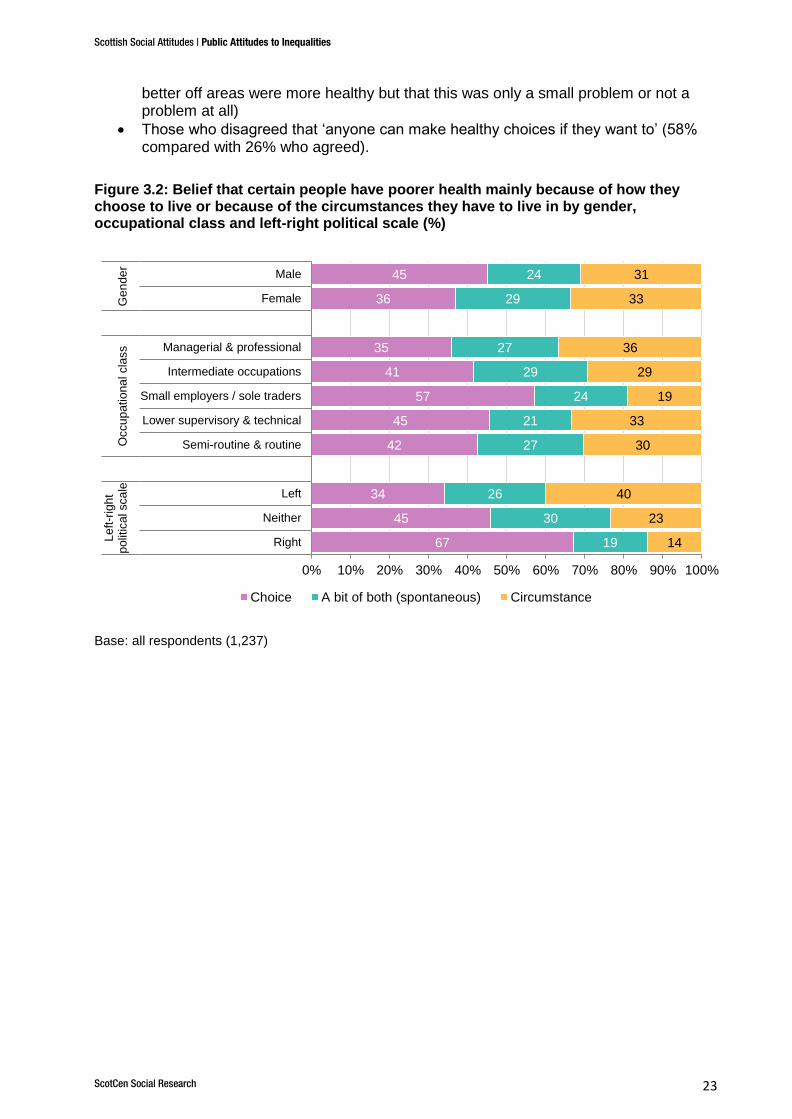
Figure 3.2 below shows that those who said that ‘poorer health is mainly because of the way they choose to lead their lives’ were more likely to be:
Men (45%) compared with women (36%)
On the right of the political spectrum (67% of those on the right compared with 34% of those on the left)
Those who agreed that ‘anyone can make healthy choices if they want to’ (47% compared with 17% of those who disagreed)
Now, taking those who agreed that ‘certain people are more likely to have poorer health mainly because of the circumstances they have to live in’, shows that they were more likely to be:
On the left of the political spectrum (40% compared with 14% on the right)
Those who believed that those living in better off areas were more healthy and that it is a big problem (44% compared with 19% of those who believed those living in
Scottish Social Attitudes | Public Attitudes to Inequalities
ScotCen Social Research 23
better off areas were more healthy but that this was only a small problem or not a problem at all)
Those who disagreed that ‘anyone can make healthy choices if they want to’ (58% compared with 26% who agreed).
Figure 3.2: Belief that certain people have poorer health mainly because of how they choose to live or because of the circumstances they have to live in by gender, occupational class and left-right political scale (%)
Base: all respondents (1,237)
67
45
34
42
45
57
41
35
36
45
19
30
26
27
21
24
29
27
29
24
14
23
40
30
33
19
29
36
33
31
0% 10% 20% 30% 40% 50% 60% 70% 80% 90% 100%
Right
Neither
Left
Semi-routine & routine
Lower supervisory & technical
Small employers / sole traders
Intermediate occupations
Managerial & professional
Female
Male
Left
-rig
ht
polit
ical sca
leO
ccu
patio
na
l cla
ss
Ge
nde
r
Choice A bit of both (spontaneous) Circumstance
Scottish Social Attitudes | Public Attitudes to Inequalities
ScotCen Social Research 24
4. Views on the causes of income differences
This chapter explores views on the causes of differences in income, whether they are perceived as unfair and how these relate to views on health differences introduced in Chapter 2.
4.1 Perceptions on factors contributing to income differences
Respondents were asked how much they agreed or disagreed that:
’Some people have higher incomes than others because they work harder.’
’Some people have higher incomes than others because they do more valuable jobs.’
’Some people have lower incomes than others because there is injustice in our society.’
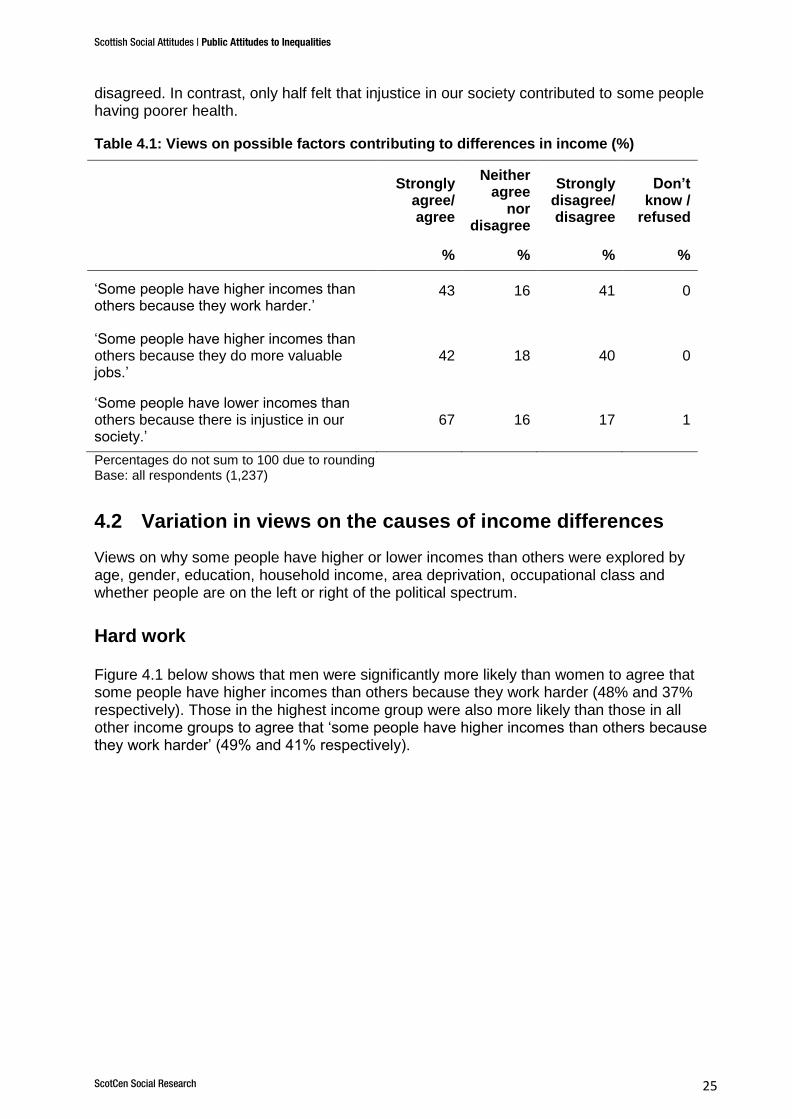
Table 4.1 shows that around 2 in 5 (43%) agreed that some people have higher incomes than others because they work harder; with the same proportion disagreeing (41%). Similarly, 42% agreed that ‘some people have higher incomes than others because they do more valuable jobs’ and 40% disagreed.
A far higher proportion agreed that injustice was associated with some people having lower incomes than others. Around two-thirds (67%) agreed that ‘some people have lower incomes than others because there is injustice in our society’, while only one in six (17%)
Key findings
Two-thirds of people in Scotland thought that some people have lower
incomes than others due to injustice in our society.
A higher proportion recognised injustice as a cause of income differences
than recognised injustice as a cause of poorer health (67% and 51%
respectively).
Around two in five thought some people have higher incomes because they
work harder and the same proportion because they do more valuable jobs.
Women were more likely to believe that societal injustice contributed to
income differences and men were more likely to believe higher incomes are
associated with working harder or doing more valuable jobs.
Income differences were perceived as unfair by two-thirds, with a slightly
larger proportion saying that the income gap was too large.
People’s position on the political spectrum was the main driver of perceived
unfairness and perceptions of the size of the income gap, with those on the
left much more likely to view income differences as unfair compared with
those on the right.
Those who perceived income differences to be unfair were more likely than
others to agree some people have higher incomes because of injustice in
society, and less likely to agree it was because they work harder or do more
valuable jobs. They were also more likely than others to say that people
with more money are better able to live healthy lives.
Scottish Social Attitudes | Public Attitudes to Inequalities
ScotCen Social Research 25
disagreed. In contrast, only half felt that injustice in our society contributed to some people having poorer health.
Table 4.1: Views on possible factors contributing to differences in income (%)
Strongly
agree/ agree
Neither agree
nor disagree
Strongly disagree/disagree
Don’t know /
refused
% % % %
‘Some people have higher incomes than others because they work harder.’
43 16 41 0
‘Some people have higher incomes than others because they do more valuable jobs.’
42 18 40 0
‘Some people have lower incomes than others because there is injustice in our society.’
67 16 17 1
Percentages do not sum to 100 due to rounding Base: all respondents (1,237)
4.2 Variation in views on the causes of income differences
Views on why some people have higher or lower incomes than others were explored by age, gender, education, household income, area deprivation, occupational class and whether people are on the left or right of the political spectrum.
Hard work
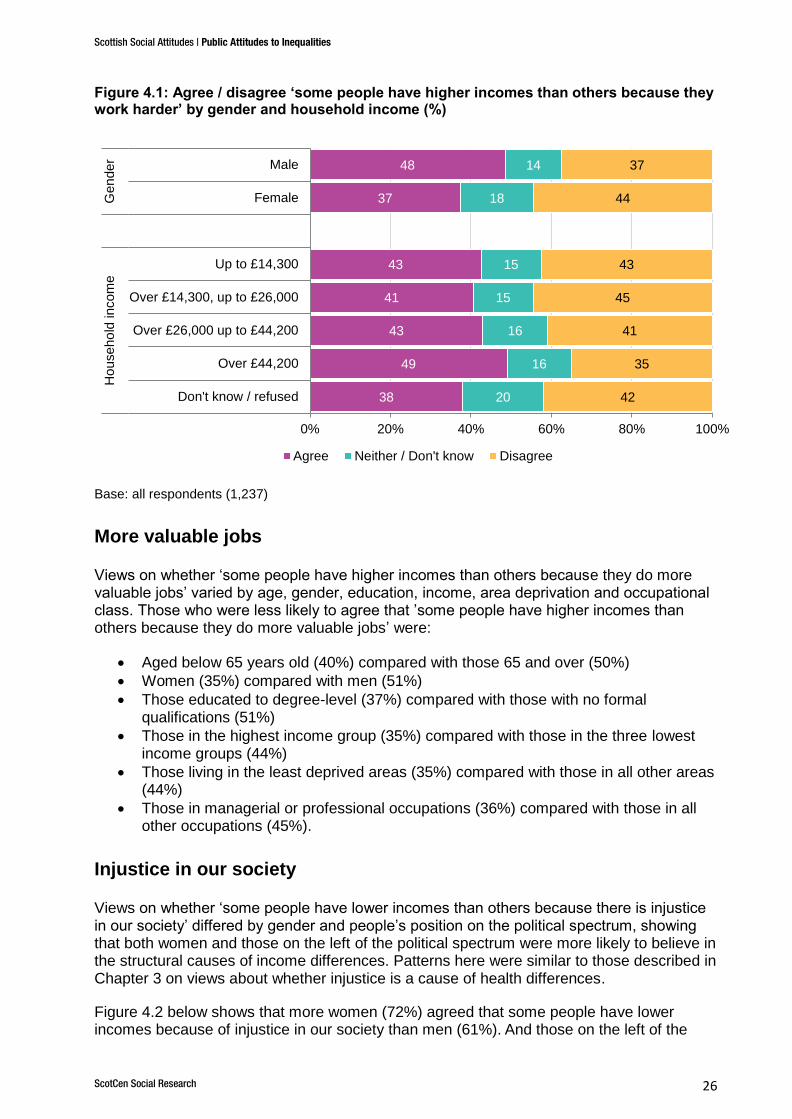
Figure 4.1 below shows that men were significantly more likely than women to agree that some people have higher incomes than others because they work harder (48% and 37% respectively). Those in the highest income group were also more likely than those in all other income groups to agree that ‘some people have higher incomes than others because they work harder’ (49% and 41% respectively).
Scottish Social Attitudes | Public Attitudes to Inequalities
ScotCen Social Research 26
Figure 4.1: Agree / disagree ‘some people have higher incomes than others because they work harder’ by gender and household income (%)
Base: all respondents (1,237)
More valuable jobs
Views on whether ‘some people have higher incomes than others because they do more valuable jobs’ varied by age, gender, education, income, area deprivation and occupational class. Those who were less likely to agree that ’some people have higher incomes than others because they do more valuable jobs’ were:
Aged below 65 years old (40%) compared with those 65 and over (50%)
Women (35%) compared with men (51%)
Those educated to degree-level (37%) compared with those with no formal qualifications (51%)
Those in the highest income group (35%) compared with those in the three lowest income groups (44%)
Those living in the least deprived areas (35%) compared with those in all other areas (44%)
Those in managerial or professional occupations (36%) compared with those in all other occupations (45%).
Injustice in our society
Views on whether ‘some people have lower incomes than others because there is injustice in our society’ differed by gender and people’s position on the political spectrum, showing that both women and those on the left of the political spectrum were more likely to believe in the structural causes of income differences. Patterns here were similar to those described in Chapter 3 on views about whether injustice is a cause of health differences.
Figure 4.2 below shows that more women (72%) agreed that some people have lower incomes because of injustice in our society than men (61%).
And those on the left of the
38
49
43
41
43
37
48
20
16
16
15
15
18
14
42
35
41
45
43
44
37
0% 20% 40% 60% 80% 100%
Don't know / refused
Over £44,200
Over £26,000 up to £44,200
Over £14,300, up to £26,000
Up to £14,300
Female
Male
Ho
useho
ld incom
eG
en
der
Agree Neither / Don't know Disagree
Scottish Social Attitudes | Public Attitudes to Inequalities
ScotCen Social Research 27
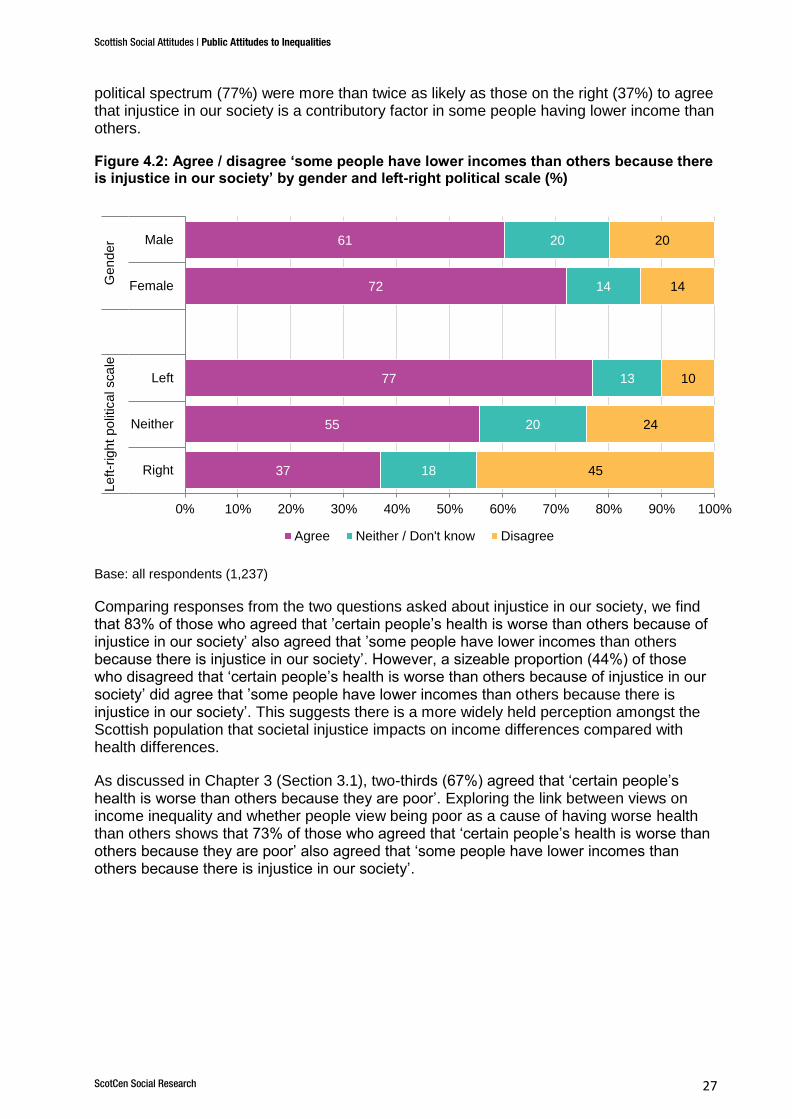
political spectrum (77%) were more than twice as likely as those on the right (37%) to agree that injustice in our society is a contributory factor in some people having lower income than others.
Figure 4.2: Agree / disagree ‘some people have lower incomes than others because there is injustice in our society’ by gender and left-right political scale (%)
Base: all respondents (1,237)
Comparing responses from the two questions asked about injustice in our society, we find that 83% of those who agreed that ’certain people’s health is worse than others because of injustice in our society’ also agreed that ’some people have lower incomes than others because there is injustice in our society’. However, a sizeable proportion (44%) of those who disagreed that ‘certain people’s health is worse than others because of injustice in our society’ did agree that ’some people have lower incomes than others because there is injustice in our society’. This suggests there is a more widely held perception amongst the Scottish population that societal injustice impacts on income differences compared with health differences.
As discussed in Chapter 3 (Section 3.1), two-thirds (67%) agreed that ‘certain people’s health is worse than others because they are poor’. Exploring the link between views on income inequality and whether people view being poor as a cause of having worse health than others shows that 73% of those who agreed that ‘certain people’s health is worse than others because they are poor’ also agreed that ‘some people have lower incomes than others because there is injustice in our society’.
37
55
77
72
61
18
20
13
14
20
45
24
10
14
20
0% 10% 20% 30% 40% 50% 60% 70% 80% 90% 100%
Right
Neither
Left
Female
Male
Le
ft-r
igh
t po
litic
al sca
leG
en
der
Agree Neither / Don't know Disagree
Scottish Social Attitudes | Public Attitudes to Inequalities
ScotCen Social Research 28
4.3 Are income differences seen as unfair?
Around two-thirds (67%) of people in Scotland14
agreed that ‘large differences in people's incomes are unfair’, with only one in six (17%) disagreeing. Similar views were expressed about the gap between those with high and low incomes, with 72% saying the gap is too large, 18% that it is about right, 2% that it is too small and 8% saying they did not know. It is worth noting here that 72% is the lowest proportion of people saying that the income gap is ‘too large’ since SSA first included this question in 2006 and the highest proportion, at 18%, saying that the gap was ‘about right’.
15
There was a strong correlation between responses to the above two questions. More than three-quarters (78%) of those who said that the gap between those on high and low incomes is too large agreed that large differences in people’s income are unfair.
4.4 Differences in perceptions of unfairness of income differences
Differences in views on the unfairness of income differences followed a similar pattern to that found for views on whether some people have lower incomes than others because there is injustice in our society.
Women were more likely than men to agree that large differences in people's incomes are unfair (72% compared with 63%). Those on the left of the political spectrum, compared with those on the right, were considerably more likely to agree that ‘large differences in people's incomes are unfair’ (80% compared with 26% respectively).
Patterns were slightly different for views on whether the gap between those with high incomes and those with low incomes is too large, about right, or too small. First, there were no significant differences between the views of men and women. However, there were differences by age, with those aged 40-64 years old being most likely to say the gap was too large (77%) compared with those aged 16-29 who were the least likely (66%).
People’s political standpoint was again highly significant: 81% of those on the left of the political spectrum thought the income gap was too large, compared with 40% of those on the right. Around half (48%) of those on the right thought the income gap was about right, compared with 12% of those on the left.
The perceived unfairness of income differences and their causes
Returning to people’s views on the causes of income differences, we now look at how these relate to perceptions of unfairness of income differences.
Those who agreed that large differences in people’s incomes are unfair were less likely than those who disagreed to think that some people have higher incomes because they work harder (36% compared with 63% respectively) or because they do more valuable jobs (38% and 49% respectively). And conversely, they were more likely than those that disagreed to
14
The findings on SSA are representative of the views of the people of Scotland due to the way the survey selects its respondents using a random probability sample (see Section 1.6 for more details). 15
In SSA 2006, 79% said the income gap is ‘too large’ and 16% said it was ‘about right’. Between 2006 and 2013, the proportion saying the income gap was ‘about right’ had declined from 16% to 13%, however, the SSA 2016 figure of 18% reverses this trend.
Scottish Social Attitudes | Public Attitudes to Inequalities
ScotCen Social Research 29
think that some people have lower incomes because there is injustice in our society (79% compared with 36%).
The perceived unfairness of income differences and belief that people
with more money are better able to live healthy lives
We return to the question discussed in Chapter 2 on whether people with more money are better able to live healthy lives. Are those who perceive income differences to be unfair more likely than others to believe that having more money can lead to better health?
The findings confirm that this is indeed the case. Around three-quarters (76%) of those who agreed that large differences in incomes are unfair also said that people with more money are better able to live healthy lives, compared with 61% of those who disagreed that large differences in incomes are unfair.
A similar pattern was seen with respect to views on the size of the income gap. Three-quarters (77%) of those who said the income gap is too large also said that people with more money are better able to live healthy lives, compared with 57% of those who said the income gap is about right.
Scottish Social Attitudes | Public Attitudes to Inequalities
ScotCen Social Research 30
5. Role of the government and individuals in addressing health differences
Previous chapters have looked at views on, and causes of, differences in health and income, and how these views interact. This chapter will look at people’s views on the responsibility of the government and individuals for people’s health, the role of the government in reducing health differences and people’s willingness to pay taxes to reduce health differences.
The generic term ‘government’ was used in all questions as opposed to asking about a specific level of government (for example, Westminster, Scottish Parliament, local authority). Experience of testing these questions, and others in previous years of SSA, has shown that people’s knowledge of the different levels of government and where responsibilities lie is low and that they answer questions about the ‘government’ thinking of a wide range of different levels of government.
In addition, views on all these questions were explored by a range of different socio-demographic and attitudinal factors including age, gender, education, household income, area deprivation, occupational class, and whether people are on the left or right of the political spectrum.
5.1 Are people willing to pay higher taxes to improve the health of others?
Respondents were asked two questions about how willing they would be to pay higher taxes:
Key findings:
Around 6 in 10 (62%) thought individuals were more responsible than
government for their own health.
People in the highest income group and those living in less deprived areas
were much more likely to agree that individuals are more responsible than
government for their own health compared with people in the lowest income
group and those in the most deprived areas.
Half of people in Scotland disagreed that the government is doing enough to
reduce differences in health between those on high incomes and those on low
incomes.
Over half (58%) were willing to pay higher taxes to improve the health of
poorer people in Scotland - views which did not differ significantly by income,
occupational class or area deprivation.
There were significant differences in attitudes towards the role of government
and individuals in addressing health differences between those on the left and
those on the right of the political spectrum. Those on the left of the political
spectrum were almost twice as likely as those on the right to be willing to pay
higher taxes to improve the health of people in Scotland as a whole (62% on
the left compared with 35% on the right).
Scottish Social Attitudes | Public Attitudes to Inequalities
ScotCen Social Research 31
‘How willing or unwilling would you be to pay higher taxes…
‘…to improve the health of people in Scotland as a whole?’
‘…to improve the health of poorer people in Scotland?’
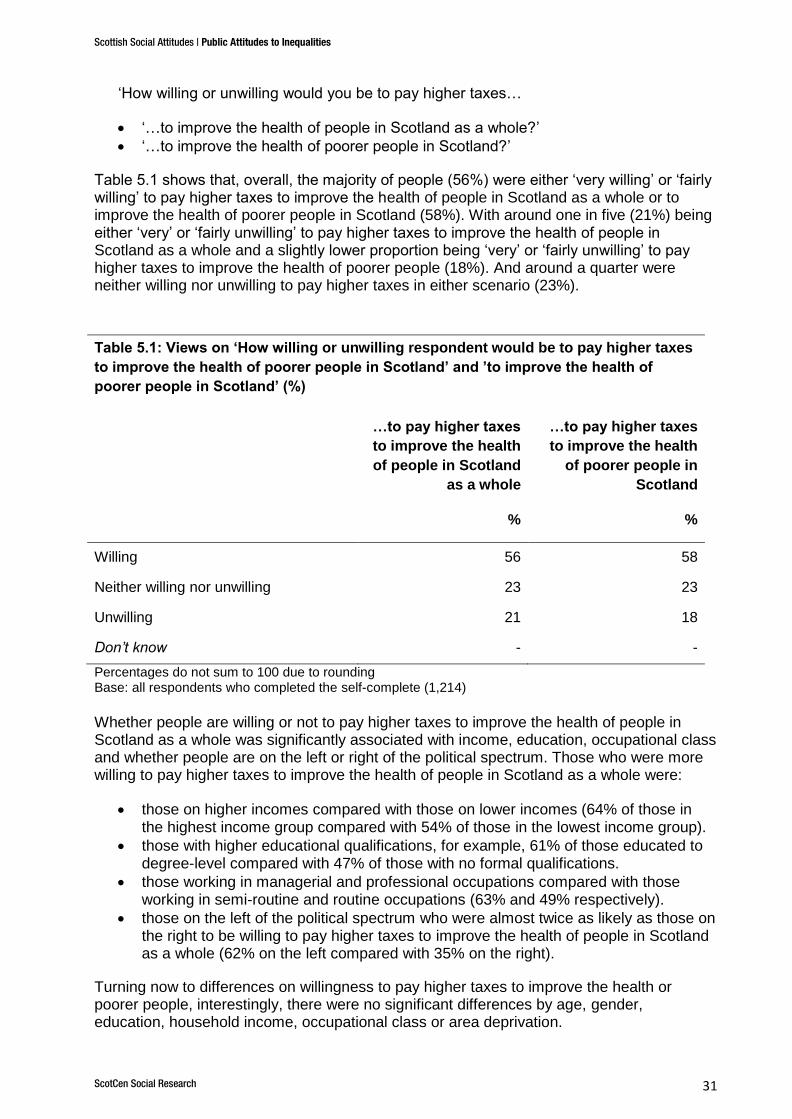
Table 5.1 shows that, overall, the majority of people (56%) were either ‘very willing’ or ‘fairly willing’ to pay higher taxes to improve the health of people in Scotland as a whole or to improve the health of poorer people in Scotland (58%). With around one in five (21%) being either ‘very’ or ‘fairly unwilling’ to pay higher taxes to improve the health of people in Scotland as a whole and a slightly lower proportion being ‘very’ or ‘fairly unwilling’ to pay higher taxes to improve the health of poorer people (18%). And around a quarter were neither willing nor unwilling to pay higher taxes in either scenario (23%).
Table 5.1: Views on ‘How willing or unwilling respondent would be to pay higher taxes
to improve the health of poorer people in Scotland’ and ’to improve the health of
poorer people in Scotland’ (%)
…to pay higher taxes
to improve the health
of people in Scotland
as a whole
…to pay higher taxes
to improve the health
of poorer people in
Scotland
% %
Willing 56 58
Neither willing nor unwilling 23 23
Unwilling 21 18
Don’t know - -
Percentages do not sum to 100 due to rounding Base: all respondents who completed the self-complete (1,214)
Whether people are willing or not to pay higher taxes to improve the health of people in Scotland as a whole was significantly associated with income, education, occupational class and whether people are on the left or right of the political spectrum. Those who were more willing to pay higher taxes to improve the health of people in Scotland as a whole were:
those on higher incomes compared with those on lower incomes (64% of those in the highest income group compared with 54% of those in the lowest income group).
those with higher educational qualifications, for example, 61% of those educated to degree-level compared with 47% of those with no formal qualifications.
those working in managerial and professional occupations compared with those working in semi-routine and routine occupations (63% and 49% respectively).
those on the left of the political spectrum who were almost twice as likely as those on the right to be willing to pay higher taxes to improve the health of people in Scotland as a whole (62% on the left compared with 35% on the right).
Turning now to differences on willingness to pay higher taxes to improve the health or poorer people, interestingly, there were no significant differences by age, gender, education, household income, occupational class or area deprivation.
Scottish Social Attitudes | Public Attitudes to Inequalities
ScotCen Social Research 32
However, whether people were on the left or right of the political spectrum was associated with willingness to pay higher taxes to improve the health of poorer people in Scotland. Those on the left of the political spectrum were almost twice as likely as those on the right to be willing to pay higher taxes to improve the health of poorer people (65% on the left, compared with 34% on the right).
5.2 Is the government doing enough to reduce differences in health?
Respondents were asked whether or not they feel the government is doing enough to reduce differences in health between those on high and low incomes. Overall, half (50%) disagreed that ‘the government is doing enough to reduce differences in health between those on high incomes and those on low incomes', with around one in four agreeing (24%) and a similar proportion neither agreeing nor disagreeing (23%).
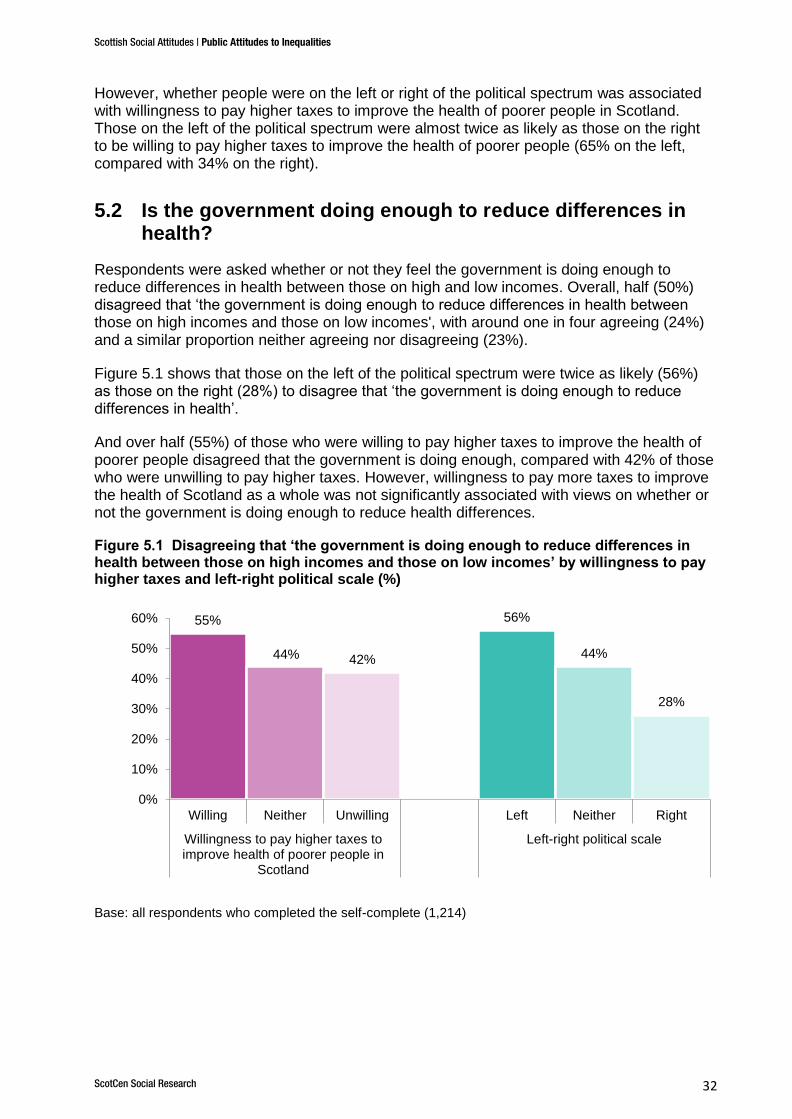
Figure 5.1 shows that those on the left of the political spectrum were twice as likely (56%) as those on the right (28%) to disagree that ‘the government is doing enough to reduce differences in health’.
And over half (55%) of those who were willing to pay higher taxes to improve the health of poorer people disagreed that the government is doing enough, compared with 42% of those who were unwilling to pay higher taxes. However, willingness to pay more taxes to improve the health of Scotland as a whole was not significantly associated with views on whether or not the government is doing enough to reduce health differences.
Figure 5.1 Disagreeing that ‘the government is doing enough to reduce differences in health between those on high incomes and those on low incomes’ by willingness to pay higher taxes and left-right political scale (%)
Base: all respondents who completed the self-complete (1,214)
55%
44% 42%
56%
44%
28%
0%
10%
20%
30%
40%
50%
60%
Willing Neither Unwilling Left Neither Right
Willingness to pay higher taxes toimprove health of poorer people in
Scotland
Left-right political scale
Scottish Social Attitudes | Public Attitudes to Inequalities
ScotCen Social Research 33
Who is responsible for people’s health?
Respondents were asked:
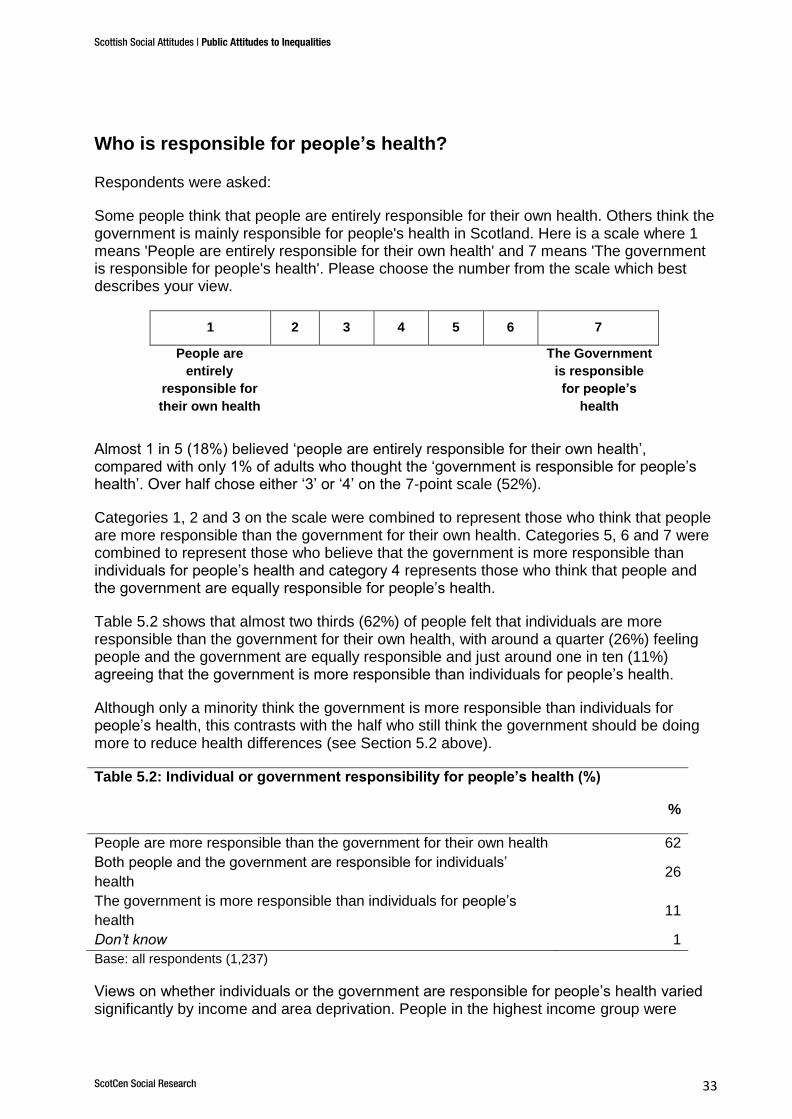
Some people think that people are entirely responsible for their own health. Others think the government is mainly responsible for people's health in Scotland. Here is a scale where 1 means 'People are entirely responsible for their own health' and 7 means 'The government is responsible for people's health'. Please choose the number from the scale which best describes your view.
1 2 3 4 5 6 7
People are
entirely
responsible for
their own health
The Government
is responsible
for people’s
health
Almost 1 in 5 (18%) believed ‘people are entirely responsible for their own health’, compared with only 1% of adults who thought the ‘government is responsible for people’s health’. Over half chose either ‘3’ or ‘4’ on the 7-point scale (52%).
Categories 1, 2 and 3 on the scale were combined to represent those who think that people are more responsible than the government for their own health. Categories 5, 6 and 7 were combined to represent those who believe that the government is more responsible than individuals for people’s health and category 4 represents those who think that people and the government are equally responsible for people’s health.
Table 5.2 shows that almost two thirds (62%) of people felt that individuals are more responsible than the government for their own health, with around a quarter (26%) feeling people and the government are equally responsible and just around one in ten (11%) agreeing that the government is more responsible than individuals for people’s health.
Although only a minority think the government is more responsible than individuals for people’s health, this contrasts with the half who still think the government should be doing more to reduce health differences (see Section 5.2 above).
Table 5.2: Individual or government responsibility for people’s health (%)
%
People are more responsible than the government for their own health 62
Both people and the government are responsible for individuals’
health 26
The government is more responsible than individuals for people’s
health 11
Don’t know 1
Base: all respondents (1,237)
Views on whether individuals or the government are responsible for people’s health varied significantly by income and area deprivation. People in the highest income group were
Scottish Social Attitudes | Public Attitudes to Inequalities
ScotCen Social Research 34
much more likely to agree that individuals are more responsible than the government for their own health (71%) compared with people in the lowest income group (50%).
Similarly, those living in all but the most deprived areas were significantly more likely to agree that individuals had more responsibility than government for their own health (61-68%) compared with those living in the most deprived areas (54%).
Views on who is
responsible for people’s health did not vary significantly by age, gender, education or occupational class.
Those on the right of the political spectrum almost unanimously agreed that individuals were more responsible for their own health than the government (91%), a significantly higher proportion than those on the left of the political spectrum (57%).
Perhaps not surprisingly, those who agreed that ‘anybody can make healthy choices’ were more likely to believe that individuals were more responsible for their own health (67%) compared with those who disagreed (42%).
Additionally, whether or not people thought the government is doing enough to reduce health differences between those on high and low incomes had a strong association with who people viewed as responsible for an individual’s health. Almost three quarters (72%) of those who agreed that the government is doing enough to reduce health differences also agreed that individuals were more responsible for their own health than the government, compared with 57% of those who did not think the government is doing enough.
Why do health differences exist?
Chapter 3 explored in detail people’s views on whether the way people ‘choose to lead their lives’ is the main reason certain people’s health is worse than others, or if it is ‘mainly because of the circumstances they have to live in’. It showed that views were somewhat divided with 40% thinking that ‘certain people are more likely to have poorer health mainly because of the way they choose to lead their lives’, 32% ‘because of the circumstances they have to live in’ with 26% thinking it is a bit of both.
In this section we explore people’s views on why certain people’s health is worse than others in relation to two sets of beliefs; firstly, who is responsible for people's health in Scotland and, secondly, whether or not ‘anybody can make healthy choices if they want to’. Almost half (47%) of those who agreed that ‘anybody can make healthy choices if they want to’ thought certain people’s health was worse than others because of ‘the way they choose to lead their lives’, whilst only a quarter (26%) thought it is ‘mainly because of the circumstances they have to live in’.
In contrast, the majority (58%) of those who disagreed that ‘anybody can make healthy choices if they want to’ thought certain people are more likely to have poorer health because of the circumstances they live in, with just 17% thinking it was because of the choices they make.
Additionally, people who thought that individuals are more responsible for their own health than the government were significantly more likely to have said that certain people are more likely to have poorer health because of the choices they make (46%, compared with 31% of people who think the government is more responsible for people’s health than individuals).
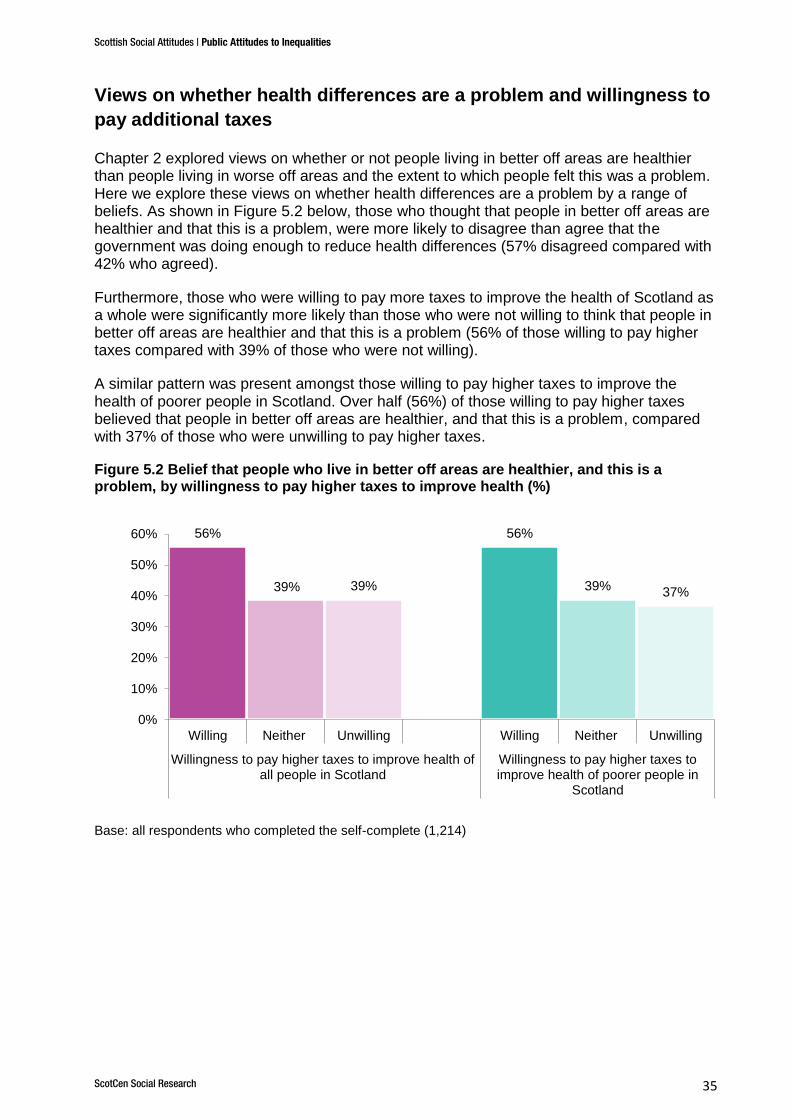
Scottish Social Attitudes | Public Attitudes to Inequalities
ScotCen Social Research 35
Views on whether health differences are a problem and willingness to
pay additional taxes
Chapter 2 explored views on whether or not people living in better off areas are healthier than people living in worse off areas and the extent to which people felt this was a problem. Here we explore these views on whether health differences are a problem by a range of beliefs. As shown in Figure 5.2 below, those who thought that people in better off areas are healthier and that this is a problem, were more likely to disagree than agree that the government was doing enough to reduce health differences (57% disagreed compared with 42% who agreed).
Furthermore, those who were willing to pay more taxes to improve the health of Scotland as a whole were significantly more likely than those who were not willing to think that people in better off areas are healthier and that this is a problem (56% of those willing to pay higher taxes compared with 39% of those who were not willing).
A similar pattern was present amongst those willing to pay higher taxes to improve the health of poorer people in Scotland. Over half (56%) of those willing to pay higher taxes believed that people in better off areas are healthier, and that this is a problem, compared with 37% of those who were unwilling to pay higher taxes.
Figure 5.2 Belief that people who live in better off areas are healthier, and this is a problem, by willingness to pay higher taxes to improve health (%)
Base: all respondents who completed the self-complete (1,214)
56%
39% 39%
56%
39% 37%
0%
10%
20%
30%
40%
50%
60%
Willing Neither Unwilling Willing Neither Unwilling
Willingness to pay higher taxes to improve health ofall people in Scotland
Willingness to pay higher taxes toimprove health of poorer people in
Scotland
Scottish Social Attitudes | Public Attitudes to Inequalities
ScotCen Social Research 36
6. Conclusions
Based on the analysis of SSA 2016, this chapter sets out our main conclusions on the Scottish public’s views on the existence of health and income inequalities, potential causes of health and income inequalities and the role of the government and individuals in addressing these inequalities. The findings are representative of the views of the people of Scotland due to the way the Scottish Social Attitudes survey selects its respondents using a random probability sample (see Section 1.6 for more details).
The majority of people in Scotland thought that there are differences in people’s health based on both their financial position and the type of area they live in. Around 7 in 10 felt that those with more money are better able to live healthy lives and that those living in better off areas in Scotland tend to be healthier than those living in worse off areas. Views differed by people’s level of education, with those with higher educational qualifications being more likely than those with lower, or no, educational qualifications to agree that those with more money and those living in better off areas are healthier. Those on lower incomes and those living in more deprived areas were both less likely than those on higher incomes and those living in less deprived areas to say that people in worse off areas tend to be less healthy.
Evidence on people’s health in Scotland shows that there are measurable health differences between those living in the most and least deprived areas (McLean et al, 2017). SSA measured whether people thought of health differences as inequalities by asking whether people felt that health differences were problematic and whether injustice in our society was a cause of health differences.
Around half of people in Scotland felt that people in better off areas were healthier and that this was a big problem. These people were more likely to have higher educational qualifications, live in less deprived areas and be in the highest income group. Around a quarter thought that although people in better off areas tend to be healthier that this was only a small problem, or not a problem at all that. Similarly, around a half of people in Scotland thought that certain people’s health is poorer than others due to injustice in our society. This suggests that around half of people in Scotland believe that health inequalities exist.
At least two-thirds felt that housing, working conditions, genetic factors, not having learned to make healthy choices, and being poor were reasons why some people have poorer health than others, considerably higher than the half of people in Scotland who felt that poorer health is because of injustice in society.
The majority of people in Scotland agreed that ‘large differences in people's incomes are unfair’ and that the gap between those with high and low incomes is too large. Over three-quarters of those who said that the gap between those on high and low incomes is too large also agreed that large differences in people’s incomes are unfair. Those who perceive income differences to be unfair were also more likely than others to believe that having more money can lead to better health with around three-quarters of those who agreed that large differences in incomes are unfair also saying that people with more money are better able to live healthy lives.
Two-thirds of people believed that ‘some people have lower incomes than others because there is injustice in our society’, considerably higher than the half that felt that health differences were due to societal injustice. In contrast, only around 4 in 10 thought that ‘some people have higher incomes because they work harder’ or ‘because they do more valuable jobs’. Women were more likely than men to believe that lower incomes are caused
Scottish Social Attitudes | Public Attitudes to Inequalities
ScotCen Social Research 37
by injustice in society whereas men were more likely to believe that working hard and doing more valuable jobs are linked to having higher incomes.
In addition there was an association between believing that lower incomes are due to societal injustice and believing that people’s health is worse due to being poor, showing that around three-quarters of those who view poverty as a cause of poorer health also believe that income differences are due to injustice.
But to what extent do people view individual choices as the reason for some people having poorer health and to what extent is it related to life circumstances? SSA 2016 found that people were more likely to think that the main contributory factor to poorer health was individual choices (40%) rather than life circumstances (32%) although around a quarter felt it was a bit of both.
When asked to choose between whether individuals or the government16
is responsible for people’s health in Scotland, again more people thought it was individuals, with nearly two-thirds saying that individuals are more responsible than the government. But although only around a quarter thought that the government was more responsible, half still thought the government should be doing more to reduce differences in health between those on high and low incomes. And over half were also willing to pay higher taxes to improve the health of poorer people in Scotland.
Whether people were on the left or the right of the political spectrum was associated with holding particular views on many of the questions on health and income inequalities. Those on the left of the political spectrum were more likely than those on the right of the political spectrum to believe that area based differences in health exist and that this is a big problem, that housing, working conditions and being poor were all causes of poorer health and that the main determinant of poorer health was life circumstances rather than individual choices.
Differences were particularly marked in relation to views on whether societal injustice was a cause of health and income differences. Those on the left of the political spectrum were six times as likely to agree that ‘certain people’s health is worse because of injustice in our society’ compared with those on the right and twice as likely to agree that ‘some people have lower incomes than others because there is injustice in our society’.
Those on the left of the political spectrum were also considerably more likely to view income differences as unfair and to have said that the gap between those with high and low incomes is too large. They were almost twice as likely as those on the right of the political spectrum to be willing to pay higher taxes to improve the health of people in Scotland as a whole.
There were significant differences in attitudes towards the role of government and individuals in relation to people’s health between those on the left and those on the right of the political spectrum. Those on the right of the political spectrum almost unanimously agreed that individuals were more responsible for their own health than the government compared with less than 3 in 5 of those on the left of the political spectrum. In contrast, those on the left were almost twice as likely as those on the right of the political spectrum to say that they would be willing to pay higher taxes to improve the health of people in Scotland as a whole. Those on the left were also more likely than those on the right of the political spectrum to believe that government is not doing enough to reduce health
16
See Chapter 5 p.35 for details on the use of the term ‘government’.
Scottish Social Attitudes | Public Attitudes to Inequalities
ScotCen Social Research 38
inequalities, that is, they disagreed that government are doing enough to reduce the differences in health between those on high incomes and those on low incomes.
Scottish Social Attitudes | Public Attitudes to Inequalities
ScotCen Social Research 39
Annex A - References
McLean, Christie and Gray (eds). (2017) Scottish Health Survey 2016: Volume 1 – main report. Edinburgh: Scottish Government; 2016. http://www.gov.scot/Resource/0052/00525472.pdf
NHS Health Scotland (2014) Health Inequalities Policy Review for the Scottish Ministerial Task Force on Health Inequalities http://www.healthscotland.scot/media/1536/healthinequalitieskeymessages-sept-2014-english.pdf
NHS Health Scotland (2016) Health inequalities: What are they? How do we reduce them? http://www.healthscotland.scot/media/1086/health-inequalities-what-are-they-how-do-we-reduce-them-mar16.pdf
NHS Health Scotland (2017) What are health inequalities? http://www.healthscotland.scot/health-inequalities/what-are-health-inequalities
Kemm, J (2006) Health impact assessment and health in all policies in Stahl T et al, Health in all policies: prospects and potentials. Helsinki: Ministry of Social Affairs and Health, 189-207
Dahlgren, G., Whitehead, M. (2006) Levelling up (part 2): a discussion paper on European strategies for tackling social inequities in health. Copenhagen: WHO Regional Office for Europe
Audit Scotland (2012) Health inequalities in Scotland http://www.audit-scotland.gov.uk/docs/health/2012/nr_121213_health_inequalities.pdf
National Institute for Health and Care Excellence (2012) Health inequalities and population health https://www.nice.org.uk/advice/lgb4/chapter/Introduction
Centre for Maternal and Child Enquiries (2011) Perinatal Mortality http://www.maternal-and-early-years.org.uk/topic/pregnancy/inequalities-in-pregnancy
BMA (2017) Health inequalities https://www.bma.org.uk/collective-voice/policy-and-research/public-and-population-health/health-inequalities
City of Edinburgh Council (2016) Transform Edinburgh: Strategic Plan 2016-2019 http://www.edinburgh.gov.uk/transformedinburgh/downloads/file/132/strategic_plan_2016-2019
Marmot, M (2008) Closing the Gap in a Generation
Marmot, M (2010) Fair Society, Healthy Lives: The Marmot Review http://www.parliament.uk/documents/fair-society-healthy-lives-full-report.pdf
World Health Organisation (2017) 10 facts on health inequalities and their causes http://www.who.int/features/factfiles/health_inequities/en/
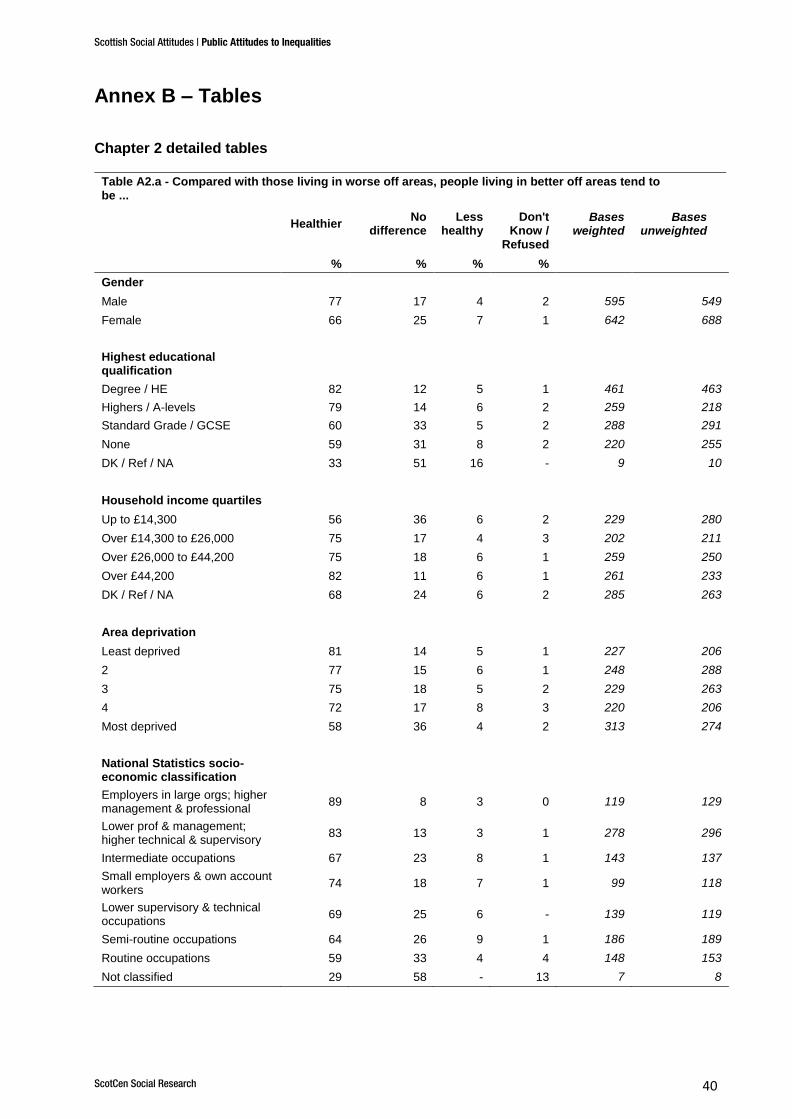
Scottish Social Attitudes | Public Attitudes to Inequalities
ScotCen Social Research 40
Annex B – Tables
Chapter 2 detailed tables
Table A2.a - Compared with those living in worse off areas, people living in better off areas tend to be ...
Healthier
No difference
Less healthy
Don't Know /
Refused
Bases weighted
Bases unweighted
% % % %
Gender
Male 77 17 4 2 595 549
Female 66 25 7 1 642 688
Highest educational qualification
Degree / HE 82 12 5 1 461 463
Highers / A-levels 79 14 6 2 259 218
Standard Grade / GCSE 60 33 5 2 288 291
None 59 31 8 2 220 255
DK / Ref / NA 33 51 16 - 9 10
Household income quartiles
Up to £14,300 56 36 6 2 229 280
Over £14,300 to £26,000 75 17 4 3 202 211
Over £26,000 to £44,200 75 18 6 1 259 250
Over £44,200 82 11 6 1 261 233
DK / Ref / NA 68 24 6 2 285 263
Area deprivation
Least deprived 81 14 5 1 227 206
2 77 15 6 1 248 288
3 75 18 5 2 229 263
4 72 17 8 3 220 206
Most deprived 58 36 4 2 313 274
National Statistics socio-economic classification
Employers in large orgs; higher management & professional
89 8 3 0 119 129
Lower prof & management; higher technical & supervisory
83 13 3 1 278 296
Intermediate occupations 67 23 8 1 143 137
Small employers & own account workers
74 18 7 1 99 118
Lower supervisory & technical occupations
69 25 6 - 139 119
Semi-routine occupations 64 26 9 1 186 189
Routine occupations 59 33 4 4 148 153
Not classified 29 58 - 13 7 8
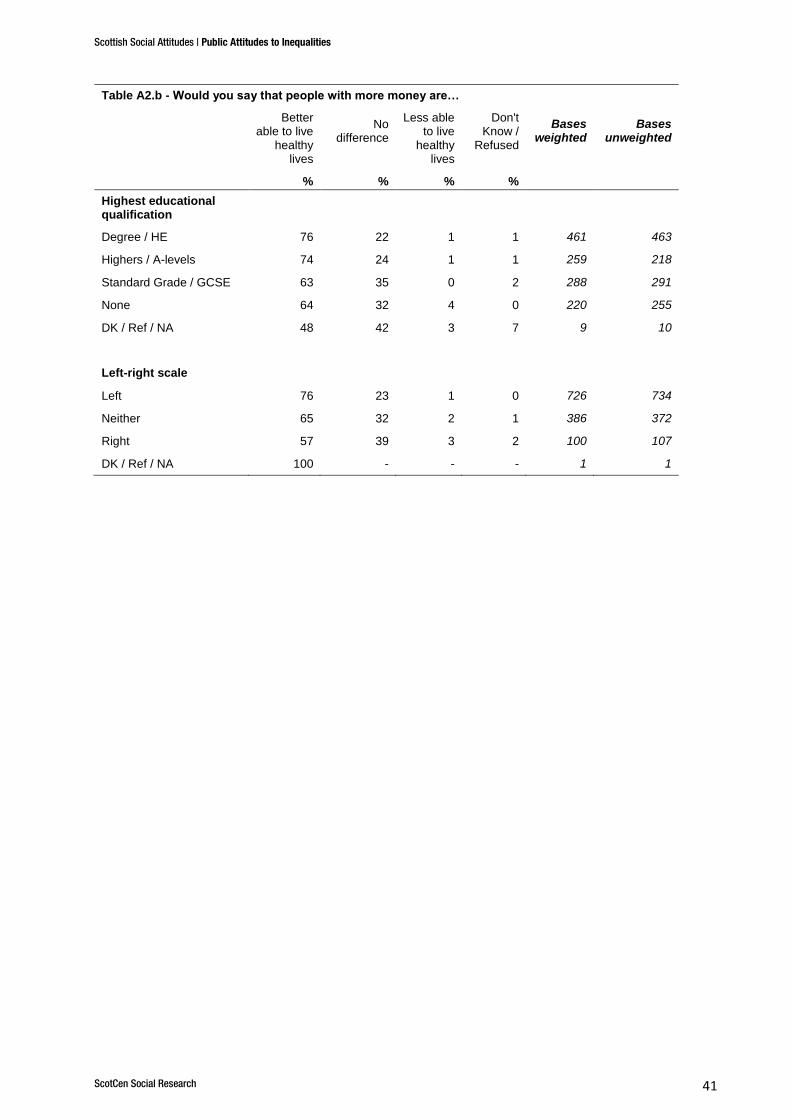
Scottish Social Attitudes | Public Attitudes to Inequalities
ScotCen Social Research 41
Table A2.b - Would you say that people with more money are…
Better able to live
healthy lives
No difference
Less able to live
healthy lives
Don't Know /
Refused
Bases weighted
Bases unweighted
% % % %
Highest educational qualification
Degree / HE 76 22 1 1 461 463
Highers / A-levels 74 24 1 1 259 218
Standard Grade / GCSE 63 35 0 2 288 291
None 64 32 4 0 220 255
DK / Ref / NA 48 42 3 7 9 10
Left-right scale
Left 76 23 1 0 726 734
Neither 65 32 2 1 386 372
Right 57 39 3 2 100 107
DK / Ref / NA 100 - - - 1 1
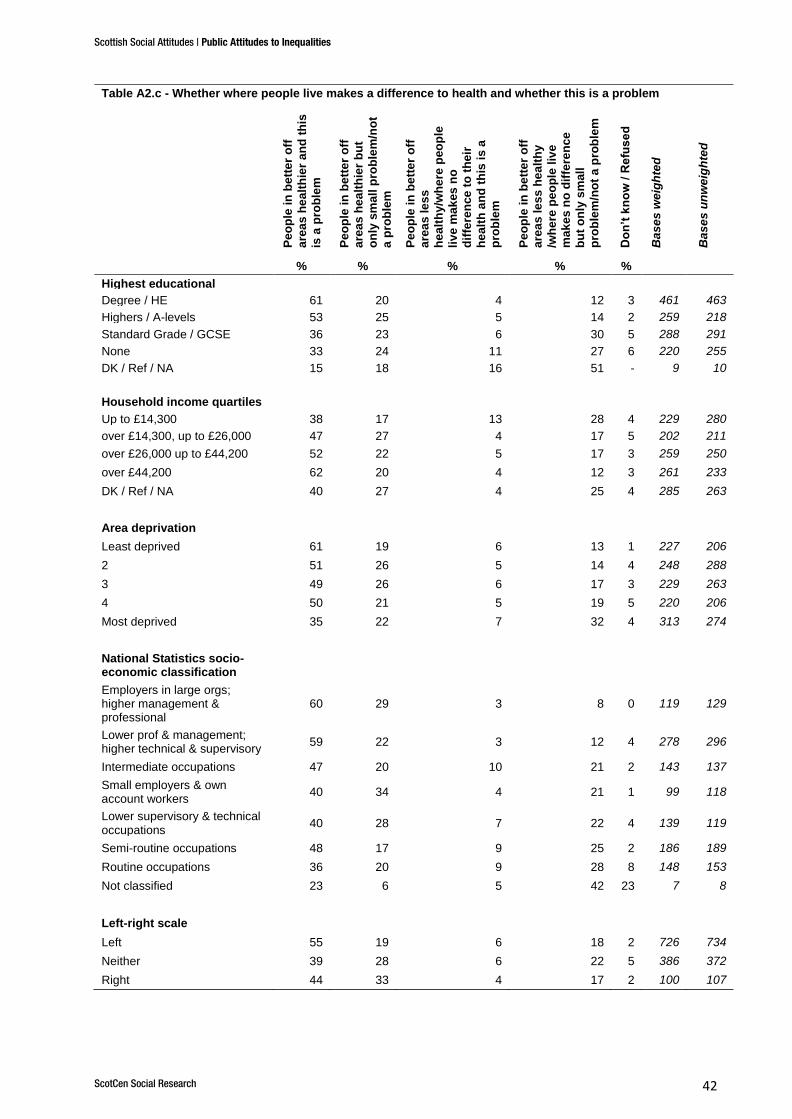
Scottish Social Attitudes | Public Attitudes to Inequalities
ScotCen Social Research 42
Table A2.c - Whether where people live makes a difference to health and whether this is a problem
Pe
op
le in
be
tte
r o
ff
are
as
he
alt
hie
r a
nd
th
is
is a
pro
ble
m
Pe
op
le in
be
tte
r o
ff
are
as
he
alt
hie
r b
ut
on
ly s
ma
ll p
rob
lem
/no
t
a p
rob
lem
Pe
op
le in
be
tte
r o
ff
are
as
le
ss
he
alt
hy/w
he
re p
eo
ple
liv
e m
ak
es
no
dif
fere
nce
to
th
eir
he
alt
h a
nd
th
is i
s a
pro
ble
m
Pe
op
le in
be
tte
r o
ff
are
as
le
ss
he
alt
hy
/wh
ere
pe
op
le l
ive
ma
ke
s n
o d
iffe
ren
ce
bu
t o
nly
sm
all
pro
ble
m/n
ot
a p
rob
lem
Do
n’t
kn
ow
/ R
efu
se
d
Ba
se
s w
eig
hte
d
Ba
se
s u
nw
eig
hte
d
% % % % %
Highest educational
qualification
Degree / HE 61 20 4 12 3 461 463
Highers / A-levels 53 25 5 14 2 259 218
Standard Grade / GCSE 36 23 6 30 5 288 291
None 33 24 11 27 6 220 255
DK / Ref / NA 15 18 16 51 - 9 10
Household income quartiles
Up to £14,300 38 17 13 28 4 229 280
over £14,300, up to £26,000 47 27 4 17 5 202 211
over £26,000 up to £44,200 52 22 5 17 3 259 250
over £44,200 62 20 4 12 3 261 233
DK / Ref / NA 40 27 4 25 4 285 263
Area deprivation
Least deprived 61 19 6 13 1 227 206
2 51 26 5 14 4 248 288
3 49 26 6 17 3 229 263
4 50 21 5 19 5 220 206
Most deprived 35 22 7 32 4 313 274
National Statistics socio-economic classification
Employers in large orgs; higher management & professional
60 29 3 8 0 119 129
Lower prof & management; higher technical & supervisory
59 22 3 12 4 278 296
Intermediate occupations 47 20 10 21 2 143 137
Small employers & own account workers
40 34 4 21 1 99 118
Lower supervisory & technical occupations
40 28 7 22 4 139 119
Semi-routine occupations 48 17 9 25 2 186 189
Routine occupations 36 20 9 28 8 148 153
Not classified 23 6 5 42 23 7 8
Left-right scale
Left 55 19 6 18 2 726 734
Neither 39 28 6 22 5 386 372
Right 44 33 4 17 2 100 107
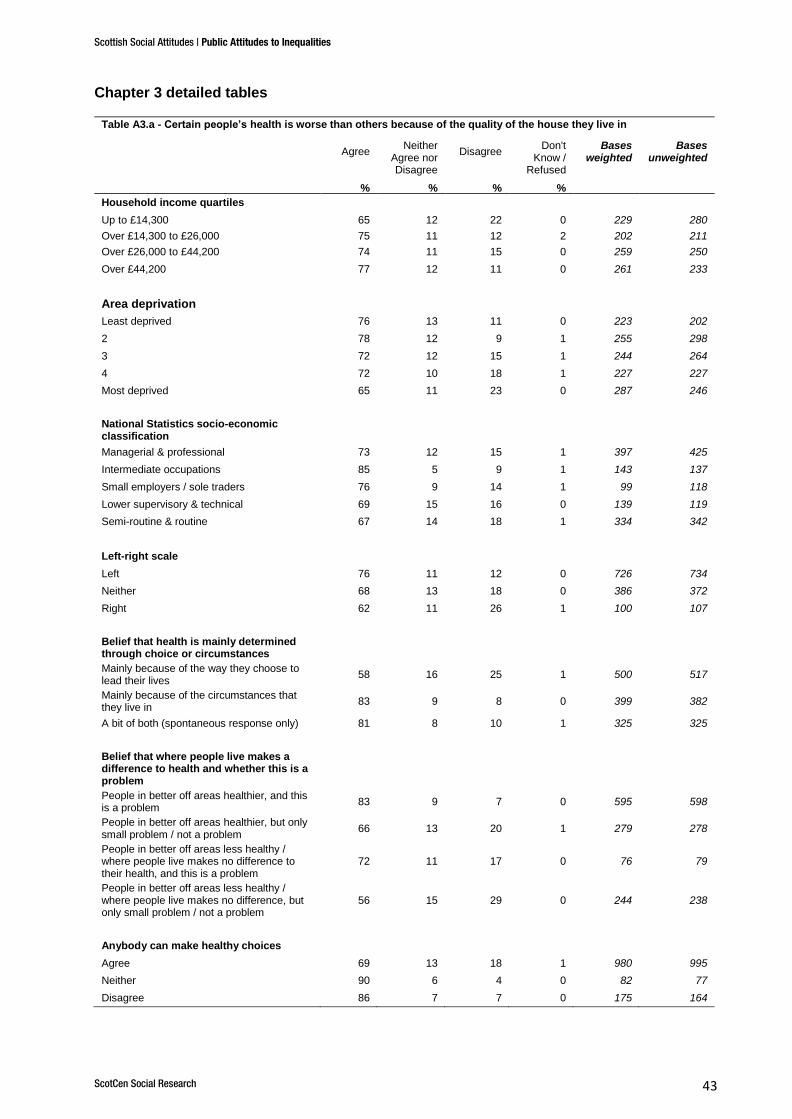
Scottish Social Attitudes | Public Attitudes to Inequalities
ScotCen Social Research 43
Chapter 3 detailed tables
Table A3.a - Certain people’s health is worse than others because of the quality of the house they live in
Agree
Neither Agree nor Disagree
Disagree Don't
Know / Refused
Bases weighted
Bases unweighted
% % % %
Household income quartiles
Up to £14,300 65 12 22 0 229 280
Over £14,300 to £26,000 75 11 12 2 202 211
Over £26,000 to £44,200 74 11 15 0 259 250
Over £44,200 77 12 11 0 261 233
Area deprivation
Least deprived 76 13 11 0 223 202
2 78 12 9 1 255 298
3 72 12 15 1 244 264
4 72 10 18 1 227 227
Most deprived 65 11 23 0 287 246
National Statistics socio-economic classification
Managerial & professional 73 12 15 1 397 425
Intermediate occupations 85 5 9 1 143 137
Small employers / sole traders 76 9 14 1 99 118
Lower supervisory & technical 69 15 16 0 139 119
Semi-routine & routine 67 14 18 1 334 342
Left-right scale
Left 76 11 12 0 726 734
Neither 68 13 18 0 386 372
Right 62 11 26 1 100 107
Belief that health is mainly determined through choice or circumstances
Mainly because of the way they choose to lead their lives
58 16 25 1 500 517
Mainly because of the circumstances that they live in
83 9 8 0 399 382
A bit of both (spontaneous response only) 81 8 10 1 325 325
Belief that where people live makes a difference to health and whether this is a problem
People in better off areas healthier, and this is a problem
83 9 7 0 595 598
People in better off areas healthier, but only small problem / not a problem
66 13 20 1 279 278
People in better off areas less healthy / where people live makes no difference to their health, and this is a problem
72 11 17 0 76 79
People in better off areas less healthy / where people live makes no difference, but only small problem / not a problem
56 15 29 0 244 238
Anybody can make healthy choices
Agree 69 13 18 1 980 995
Neither 90 6 4 0 82 77
Disagree 86 7 7 0 175 164
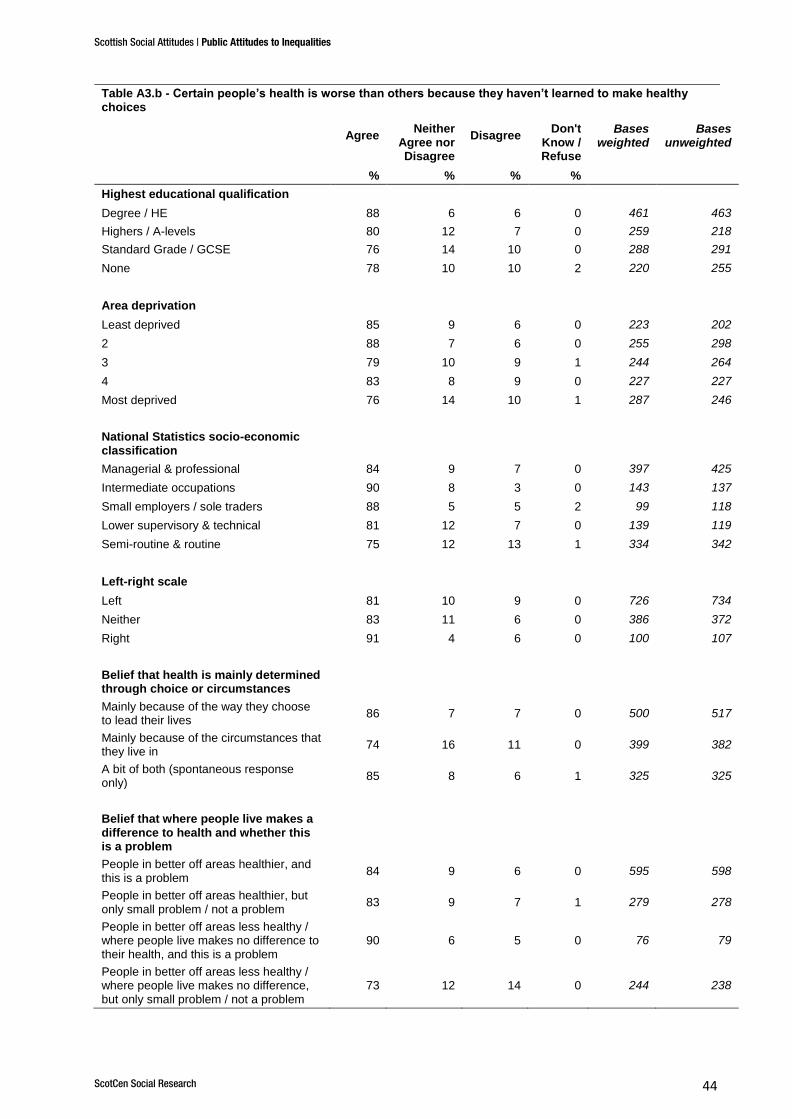
Scottish Social Attitudes | Public Attitudes to Inequalities
ScotCen Social Research 44
Table A3.b - Certain people’s health is worse than others because they haven’t learned to make healthy choices
Agree
Neither Agree nor Disagree
Disagree Don't
Know / Refuse
d
Bases weighted
Bases unweighted
% % % %
Highest educational qualification
Degree / HE 88 6 6 0 461 463
Highers / A-levels 80 12 7 0 259 218
Standard Grade / GCSE 76 14 10 0 288 291
None 78 10 10 2 220 255
Area deprivation
Least deprived 85 9 6 0 223 202
2 88 7 6 0 255 298
3 79 10 9 1 244 264
4 83 8 9 0 227 227
Most deprived 76 14 10 1 287 246
National Statistics socio-economic classification
Managerial & professional 84 9 7 0 397 425
Intermediate occupations 90 8 3 0 143 137
Small employers / sole traders 88 5 5 2 99 118
Lower supervisory & technical 81 12 7 0 139 119
Semi-routine & routine 75 12 13 1 334 342
Left-right scale
Left 81 10 9 0 726 734
Neither 83 11 6 0 386 372
Right 91 4 6 0 100 107
Belief that health is mainly determined through choice or circumstances
Mainly because of the way they choose to lead their lives
86 7 7 0 500 517
Mainly because of the circumstances that they live in
74 16 11 0 399 382
A bit of both (spontaneous response only)
85 8 6 1 325 325
Belief that where people live makes a difference to health and whether this is a problem
People in better off areas healthier, and this is a problem
84 9 6 0 595 598
People in better off areas healthier, but only small problem / not a problem
83 9 7 1 279 278
People in better off areas less healthy / where people live makes no difference to their health, and this is a problem
90 6 5 0 76 79
People in better off areas less healthy / where people live makes no difference, but only small problem / not a problem
73 12 14 0 244 238
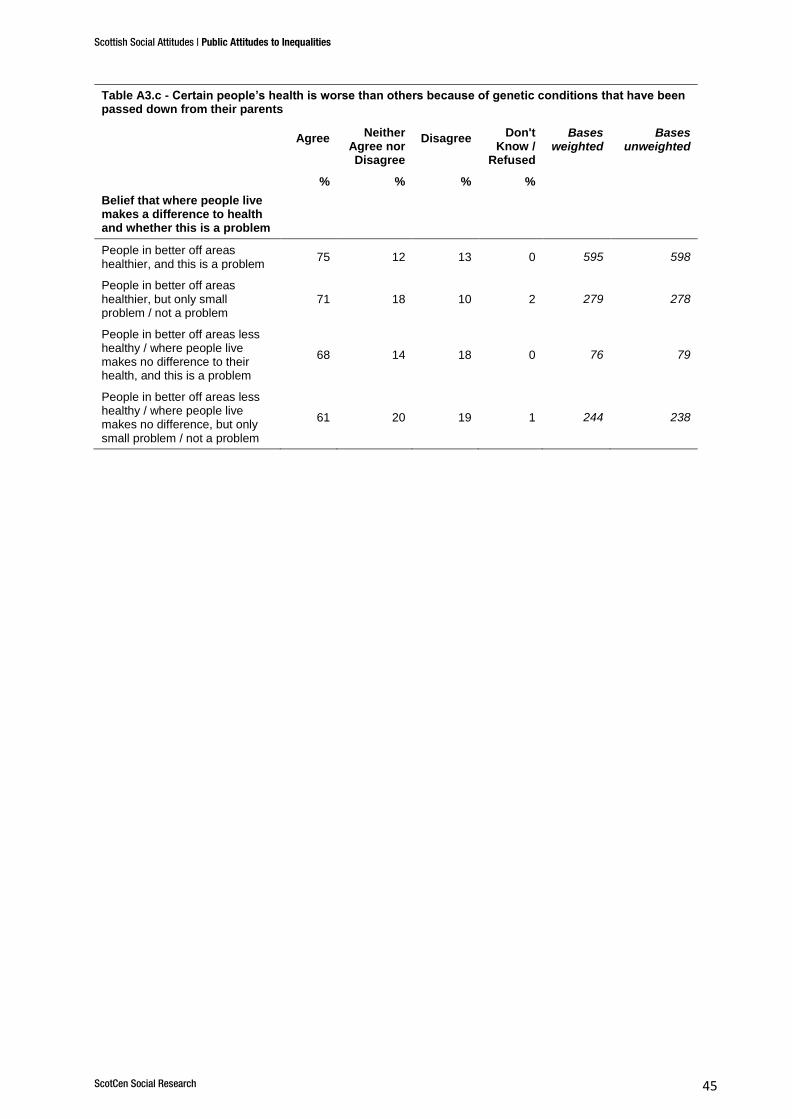
Scottish Social Attitudes | Public Attitudes to Inequalities
ScotCen Social Research 45
Table A3.c - Certain people’s health is worse than others because of genetic conditions that have been passed down from their parents
Agree
Neither Agree nor Disagree
Disagree Don't
Know / Refused
Bases weighted
Bases unweighted
% % % %
Belief that where people live makes a difference to health and whether this is a problem
People in better off areas healthier, and this is a problem
75 12 13 0 595 598
People in better off areas healthier, but only small problem / not a problem
71 18 10 2 279 278
People in better off areas less healthy / where people live makes no difference to their health, and this is a problem
68 14 18 0 76 79
People in better off areas less healthy / where people live makes no difference, but only small problem / not a problem
61 20 19 1 244 238
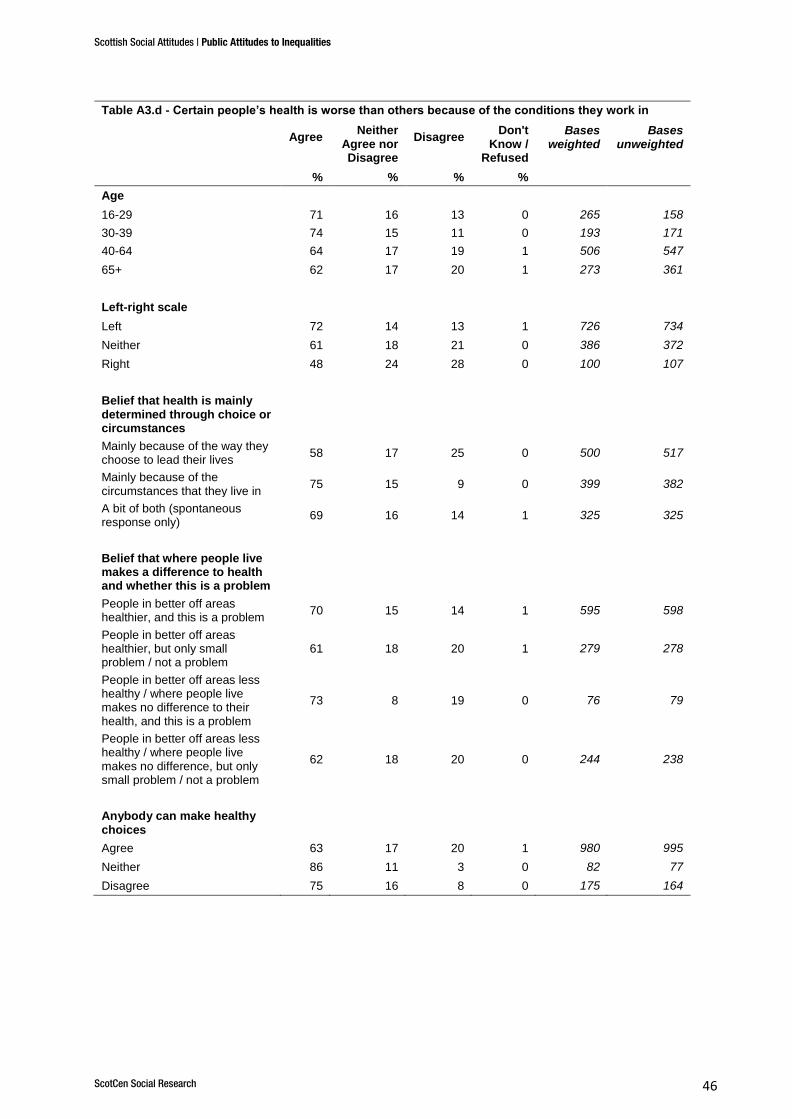
Scottish Social Attitudes | Public Attitudes to Inequalities
ScotCen Social Research 46
Table A3.d - Certain people’s health is worse than others because of the conditions they work in
Agree
Neither Agree nor Disagree
Disagree Don't
Know / Refused
Bases weighted
Bases unweighted
% % % %
Age
16-29 71 16 13 0 265 158
30-39 74 15 11 0 193 171
40-64 64 17 19 1 506 547
65+ 62 17 20 1 273 361
Left-right scale
Left 72 14 13 1 726 734
Neither 61 18 21 0 386 372
Right 48 24 28 0 100 107
Belief that health is mainly determined through choice or circumstances
Mainly because of the way they choose to lead their lives
58 17 25 0 500 517
Mainly because of the circumstances that they live in
75 15 9 0 399 382
A bit of both (spontaneous response only)
69 16 14 1 325 325
Belief that where people live makes a difference to health and whether this is a problem
People in better off areas healthier, and this is a problem
70 15 14 1 595 598
People in better off areas healthier, but only small problem / not a problem
61 18 20 1 279 278
People in better off areas less healthy / where people live makes no difference to their health, and this is a problem
73 8 19 0 76 79
People in better off areas less healthy / where people live makes no difference, but only small problem / not a problem
62 18 20 0 244 238
Anybody can make healthy choices
Agree 63 17 20 1 980 995
Neither 86 11 3 0 82 77
Disagree 75 16 8 0 175 164
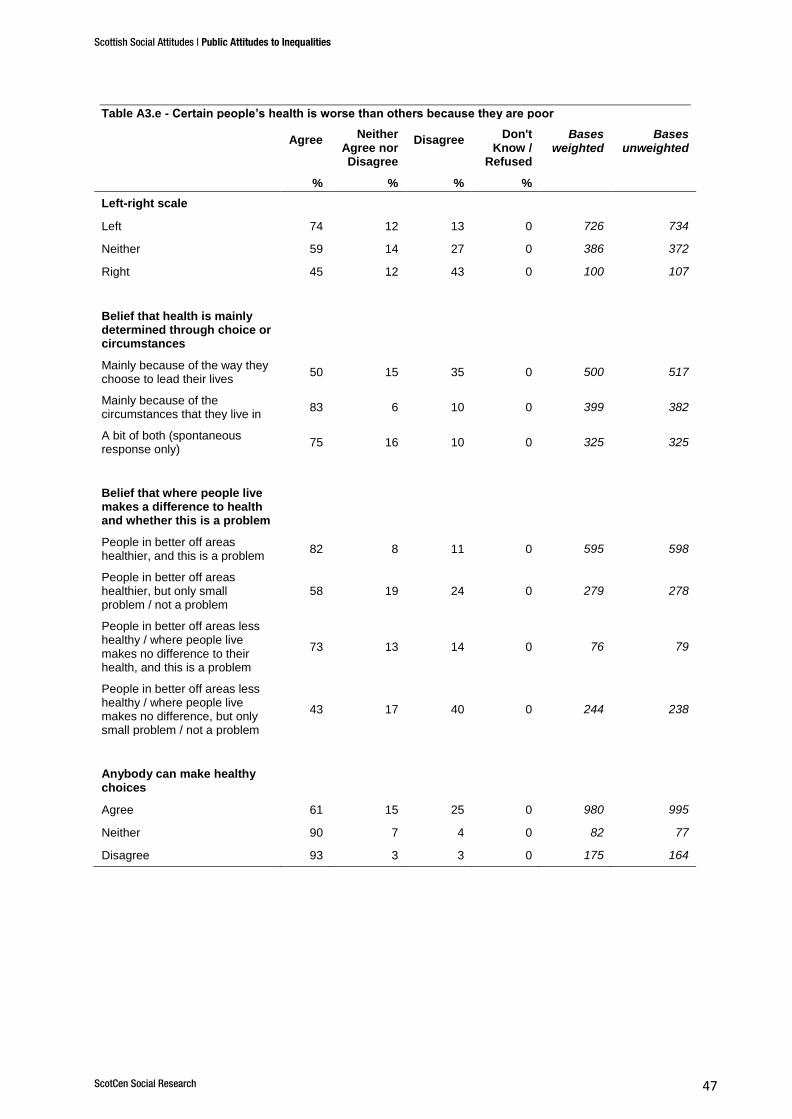
Scottish Social Attitudes | Public Attitudes to Inequalities
ScotCen Social Research 47
Table A3.e - Certain people’s health is worse than others because they are poor
Agree
Neither Agree nor Disagree
Disagree Don't
Know / Refused
Bases weighted
Bases unweighted
% % % %
Left-right scale
Left 74 12 13 0 726 734
Neither 59 14 27 0 386 372
Right 45 12 43 0 100 107
Belief that health is mainly determined through choice or circumstances
Mainly because of the way they choose to lead their lives
50 15 35 0 500 517
Mainly because of the circumstances that they live in
83 6 10 0 399 382
A bit of both (spontaneous response only)
75 16 10 0 325 325
Belief that where people live makes a difference to health and whether this is a problem
People in better off areas healthier, and this is a problem
82 8 11 0 595 598
People in better off areas healthier, but only small problem / not a problem
58 19 24 0 279 278
People in better off areas less healthy / where people live makes no difference to their health, and this is a problem
73 13 14 0 76 79
People in better off areas less healthy / where people live makes no difference, but only small problem / not a problem
43 17 40 0 244 238
Anybody can make healthy choices
Agree 61 15 25 0 980 995
Neither 90 7 4 0 82 77
Disagree 93 3 3 0 175 164
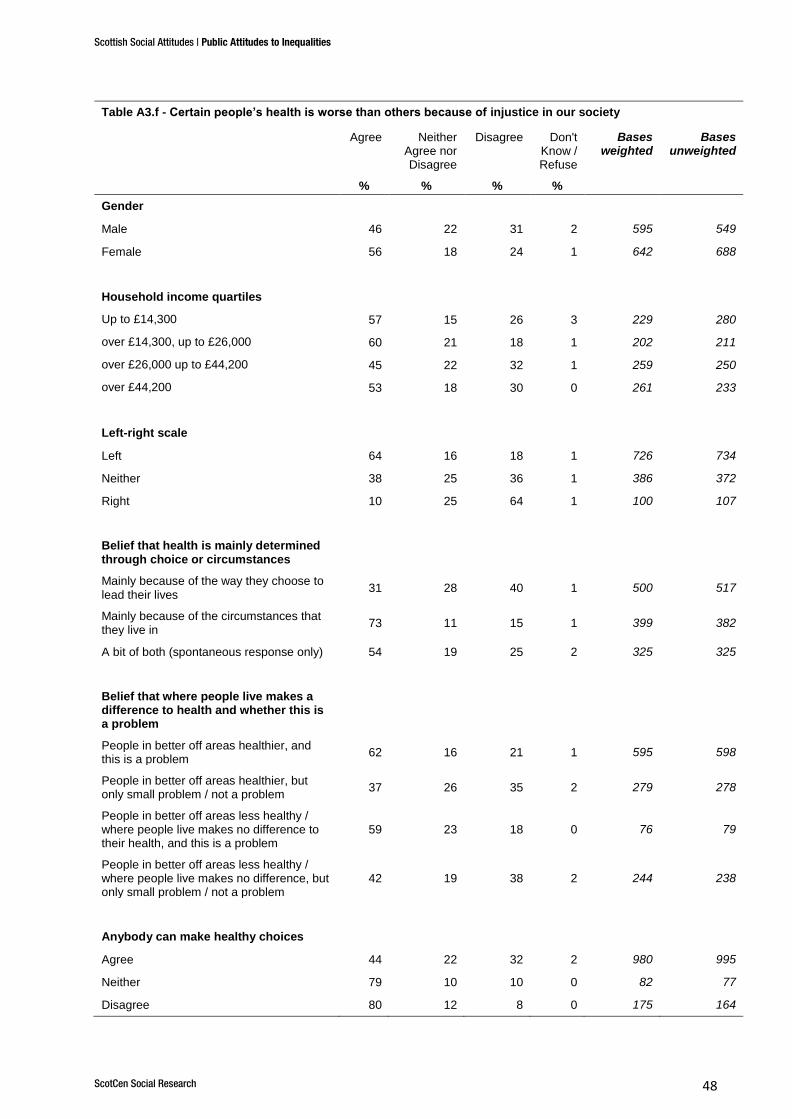
Scottish Social Attitudes | Public Attitudes to Inequalities
ScotCen Social Research 48
Table A3.f - Certain people’s health is worse than others because of injustice in our society
Agree Neither Agree nor Disagree
Disagree Don't Know / Refuse
d
Bases weighted
Bases unweighted
% % % %
Gender
Male 46 22 31 2 595 549
Female 56 18 24 1 642 688
Household income quartiles
Up to £14,300 57 15 26 3 229 280
over £14,300, up to £26,000 60 21 18 1 202 211
over £26,000 up to £44,200 45 22 32 1 259 250
over £44,200 53 18 30 0 261 233
Left-right scale
Left 64 16 18 1 726 734
Neither 38 25 36 1 386 372
Right 10 25 64 1 100 107
Belief that health is mainly determined through choice or circumstances
Mainly because of the way they choose to lead their lives
31 28 40 1 500 517
Mainly because of the circumstances that they live in
73 11 15 1 399 382
A bit of both (spontaneous response only) 54 19 25 2 325 325
Belief that where people live makes a difference to health and whether this is a problem
People in better off areas healthier, and this is a problem
62 16 21 1 595 598
People in better off areas healthier, but only small problem / not a problem
37 26 35 2 279 278
People in better off areas less healthy / where people live makes no difference to their health, and this is a problem
59 23 18 0 76 79
People in better off areas less healthy / where people live makes no difference, but only small problem / not a problem
42 19 38 2 244 238
Anybody can make healthy choices
Agree 44 22 32 2 980 995
Neither 79 10 10 0 82 77
Disagree 80 12 8 0 175 164
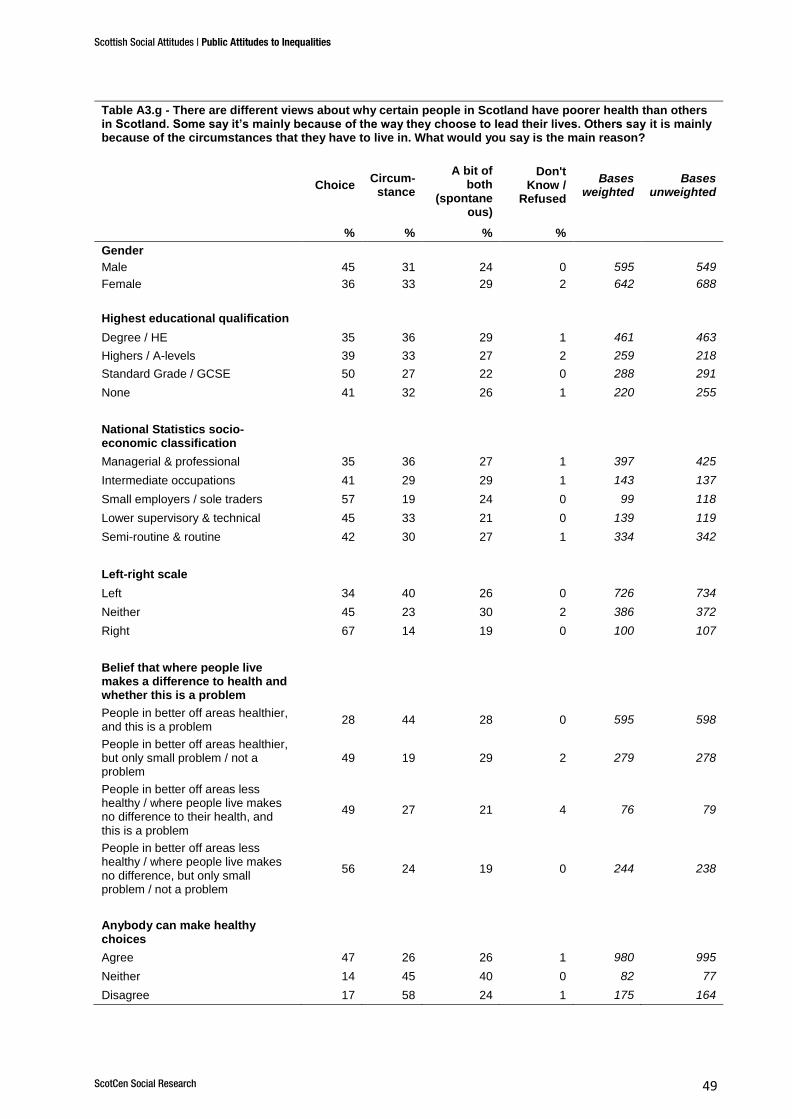
Scottish Social Attitudes | Public Attitudes to Inequalities
ScotCen Social Research 49
Table A3.g - There are different views about why certain people in Scotland have poorer health than others in Scotland. Some say it’s mainly because of the way they choose to lead their lives. Others say it is mainly because of the circumstances that they have to live in. What would you say is the main reason?
Choice Circum-
stance
A bit of both
(spontaneous)
Don't Know /
Refused
Bases weighted
Bases unweighted
% % % %
Gender
Male 45 31 24 0 595 549
Female 36 33 29 2 642 688
Highest educational qualification
Degree / HE 35 36 29 1 461 463
Highers / A-levels 39 33 27 2 259 218
Standard Grade / GCSE 50 27 22 0 288 291
None 41 32 26 1 220 255
National Statistics socio-economic classification
Managerial & professional 35 36 27 1 397 425
Intermediate occupations 41 29 29 1 143 137
Small employers / sole traders 57 19 24 0 99 118
Lower supervisory & technical 45 33 21 0 139 119
Semi-routine & routine 42 30 27 1 334 342
Left-right scale
Left 34 40 26 0 726 734
Neither 45 23 30 2 386 372
Right 67 14 19 0 100 107
Belief that where people live makes a difference to health and whether this is a problem
People in better off areas healthier, and this is a problem
28 44 28 0 595 598
People in better off areas healthier, but only small problem / not a problem
49 19 29 2 279 278
People in better off areas less healthy / where people live makes no difference to their health, and this is a problem
49 27 21 4 76 79
People in better off areas less healthy / where people live makes no difference, but only small problem / not a problem
56 24 19 0 244 238
Anybody can make healthy choices
Agree 47 26 26 1 980 995
Neither 14 45 40 0 82 77
Disagree 17 58 24 1 175 164
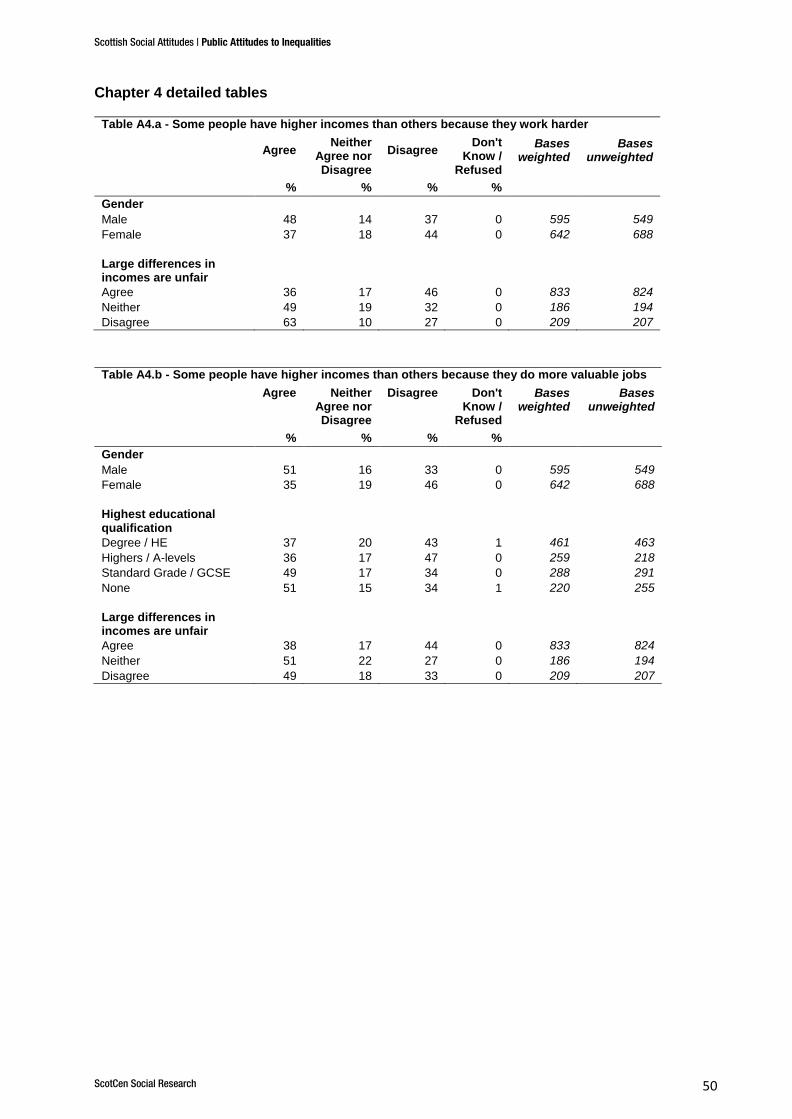
Scottish Social Attitudes | Public Attitudes to Inequalities
ScotCen Social Research 50
Chapter 4 detailed tables
Table A4.a - Some people have higher incomes than others because they work harder
Agree
Neither Agree nor Disagree
Disagree Don't
Know / Refused
Bases weighted
Bases unweighted
% % % %
Gender
Male 48 14 37 0 595 549
Female 37 18 44 0 642 688
Large differences in incomes are unfair
Agree 36 17 46 0 833 824
Neither 49 19 32 0 186 194
Disagree 63 10 27 0 209 207
Table A4.b - Some people have higher incomes than others because they do more valuable jobs
Agree Neither Agree nor Disagree
Disagree Don't Know /
Refused
Bases weighted
Bases unweighted
% % % %
Gender
Male 51 16 33 0 595 549
Female 35 19 46 0 642 688
Highest educational qualification
Degree / HE 37 20 43 1 461 463
Highers / A-levels 36 17 47 0 259 218
Standard Grade / GCSE 49 17 34 0 288 291
None 51 15 34 1 220 255
Large differences in incomes are unfair
Agree 38 17 44 0 833 824
Neither 51 22 27 0 186 194
Disagree 49 18 33 0 209 207
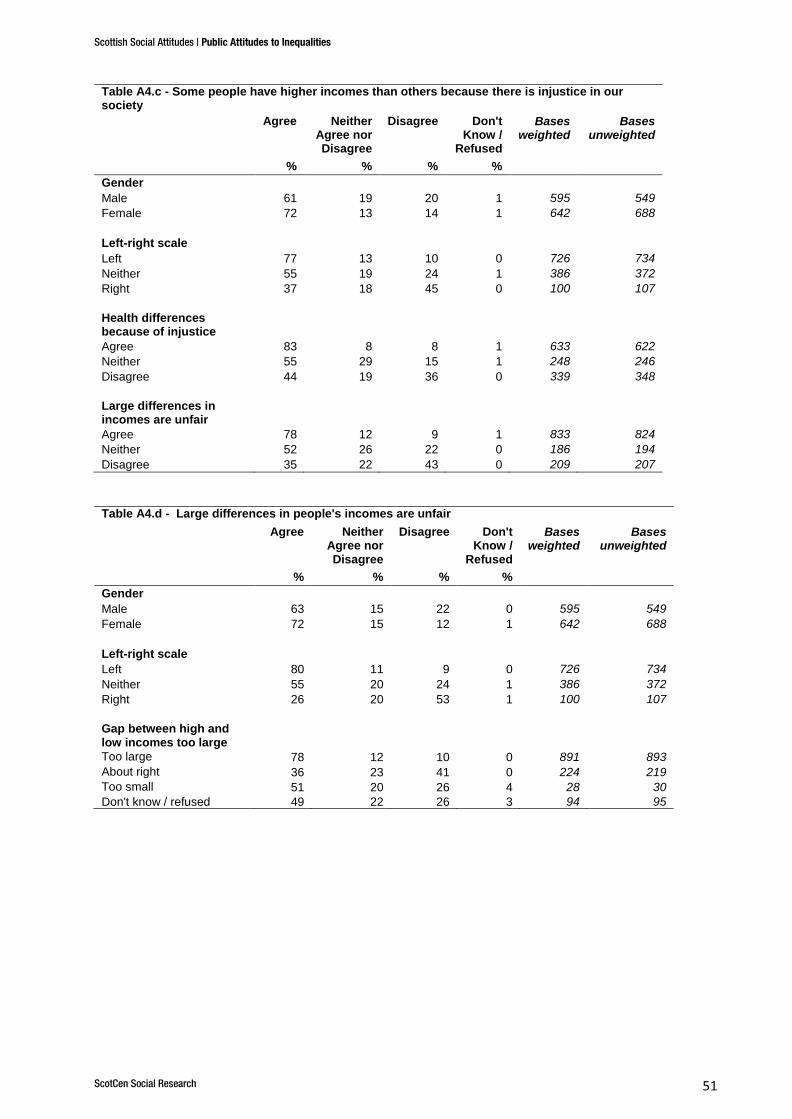
Scottish Social Attitudes | Public Attitudes to Inequalities
ScotCen Social Research 51
Table A4.c - Some people have higher incomes than others because there is injustice in our society
Agree Neither Agree nor Disagree
Disagree Don't Know /
Refused
Bases weighted
Bases unweighted
% % % %
Gender
Male 61 19 20 1 595 549
Female 72 13 14 1 642 688
Left-right scale
Left 77 13 10 0 726 734
Neither 55 19 24 1 386 372
Right 37 18 45 0 100 107
Health differences because of injustice
Agree 83 8 8 1 633 622
Neither 55 29 15 1 248 246
Disagree 44 19 36 0 339 348
Large differences in incomes are unfair
Agree 78 12 9 1 833 824
Neither 52 26 22 0 186 194
Disagree 35 22 43 0 209 207
Table A4.d - Large differences in people's incomes are unfair
Agree Neither Agree nor Disagree
Disagree Don't Know /
Refused
Bases weighted
Bases unweighted
% % % %
Gender
Male 63 15 22 0 595 549
Female 72 15 12 1 642 688
Left-right scale
Left 80 11 9 0 726 734
Neither 55 20 24 1 386 372
Right 26 20 53 1 100 107
Gap between high and low incomes too large
Too large 78 12 10 0 891 893
About right 36 23 41 0 224 219
Too small 51 20 26 4 28 30
Don't know / refused 49 22 26 3 94 95
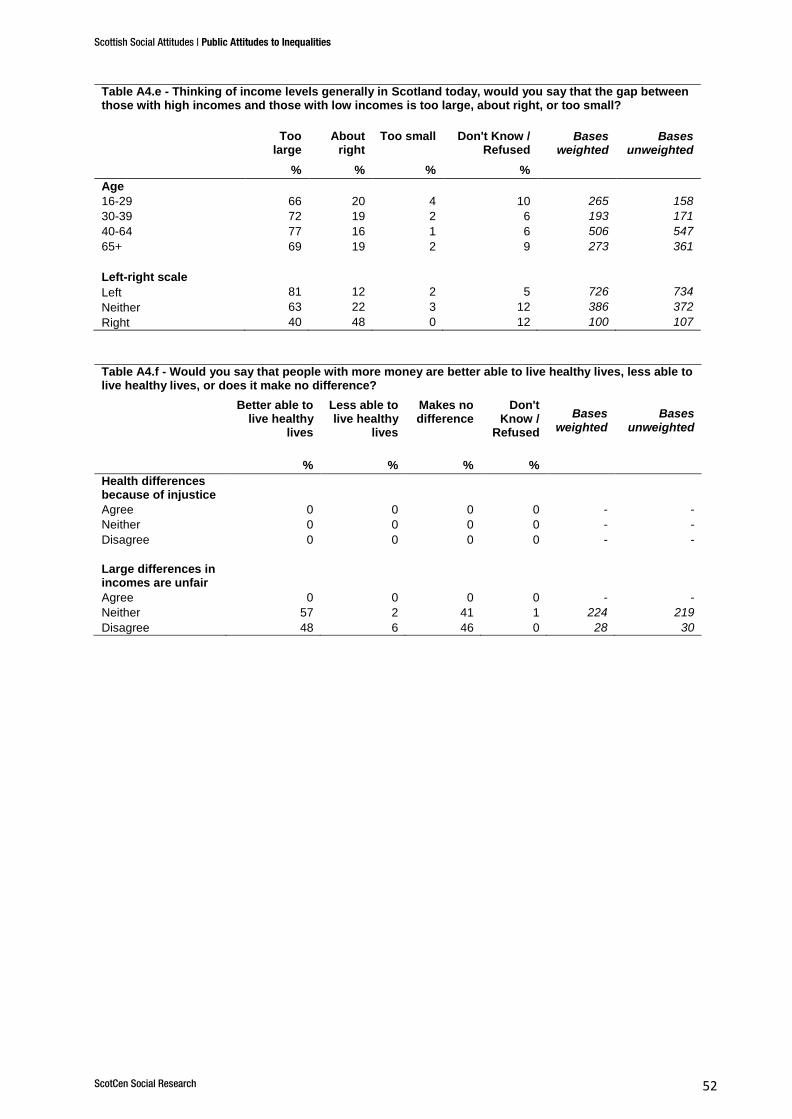
Scottish Social Attitudes | Public Attitudes to Inequalities
ScotCen Social Research 52
Table A4.e - Thinking of income levels generally in Scotland today, would you say that the gap between those with high incomes and those with low incomes is too large, about right, or too small?
Too large
About right
Too small Don't Know / Refused
Bases weighted
Bases unweighted
% % % %
Age
16-29 66 20 4 10 265 158
30-39 72 19 2 6 193 171
40-64 77 16 1 6 506 547
65+ 69 19 2 9 273 361
Left-right scale
Left 81 12 2 5 726 734
Neither 63 22 3 12 386 372
Right 40 48 0 12 100 107
Table A4.f - Would you say that people with more money are better able to live healthy lives, less able to live healthy lives, or does it make no difference?
Better able to live healthy
lives
Less able to live healthy
lives
Makes no difference
Don't Know /
Refused
Bases weighted
Bases unweighted
% % % %
Health differences because of injustice
Agree 0 0 0 0 - -
Neither 0 0 0 0 - -
Disagree 0 0 0 0 - -
Large differences in incomes are unfair
Agree 0 0 0 0 - -
Neither 57 2 41 1 224 219
Disagree 48 6 46 0 28 30
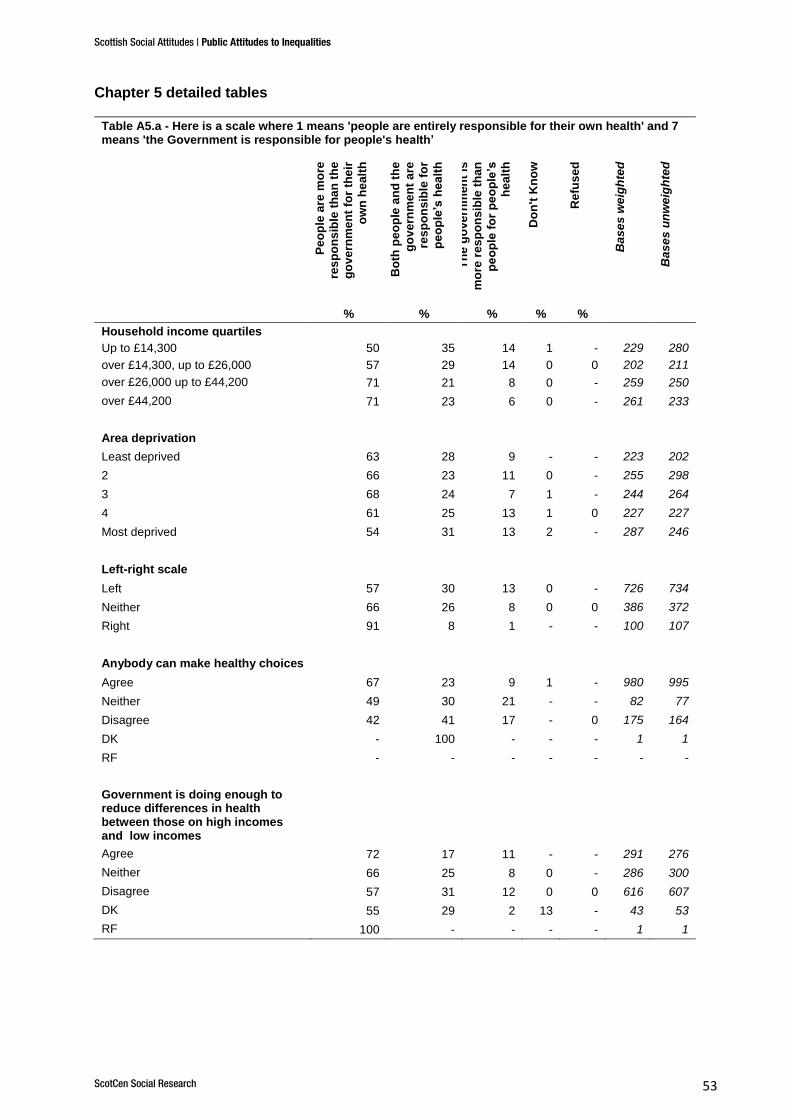
Scottish Social Attitudes | Public Attitudes to Inequalities
ScotCen Social Research 53
Chapter 5 detailed tables
Table A5.a - Here is a scale where 1 means 'people are entirely responsible for their own health' and 7 means 'the Government is responsible for people's health’
Pe
op
le a
re m
ore
res
po
ns
ible
th
an
th
e
go
ve
rnm
en
t fo
r th
eir
ow
n h
ea
lth
Bo
th p
eo
ple
an
d t
he
go
ve
rnm
en
t a
re
res
po
ns
ible
fo
r
pe
op
le’s
hea
lth
Th
e g
ove
rnm
en
t is
mo
re r
es
po
ns
ible
th
an
pe
op
le f
or
pe
op
le’s
he
alt
h
Do
n't
Kn
ow
Re
fus
ed
Ba
se
s w
eig
hte
d
Ba
se
s u
nw
eig
hte
d
% % % % %
Household income quartiles
Up to £14,300 50 35 14 1 - 229 280
over £14,300, up to £26,000 57 29 14 0 0 202 211
over £26,000 up to £44,200 71 21 8 0 - 259 250
over £44,200 71 23 6 0 - 261 233
Area deprivation
Least deprived 63 28 9 - - 223 202
2 66 23 11 0 - 255 298
3 68 24 7 1 - 244 264
4 61 25 13 1 0 227 227
Most deprived 54 31 13 2 - 287 246
Left-right scale
Left 57 30 13 0 - 726 734
Neither 66 26 8 0 0 386 372
Right 91 8 1 - - 100 107
Anybody can make healthy choices
Agree 67 23 9 1 - 980 995
Neither 49 30 21 - - 82 77
Disagree 42 41 17 - 0 175 164
DK - 100 - - - 1 1
RF - - - - - - -
Government is doing enough to reduce differences in health between those on high incomes and low incomes
Agree 72 17 11 - - 291 276
Neither 66 25 8 0 - 286 300
Disagree 57 31 12 0 0 616 607
DK 55 29 2 13 - 43 53
RF 100 - - - - 1 1
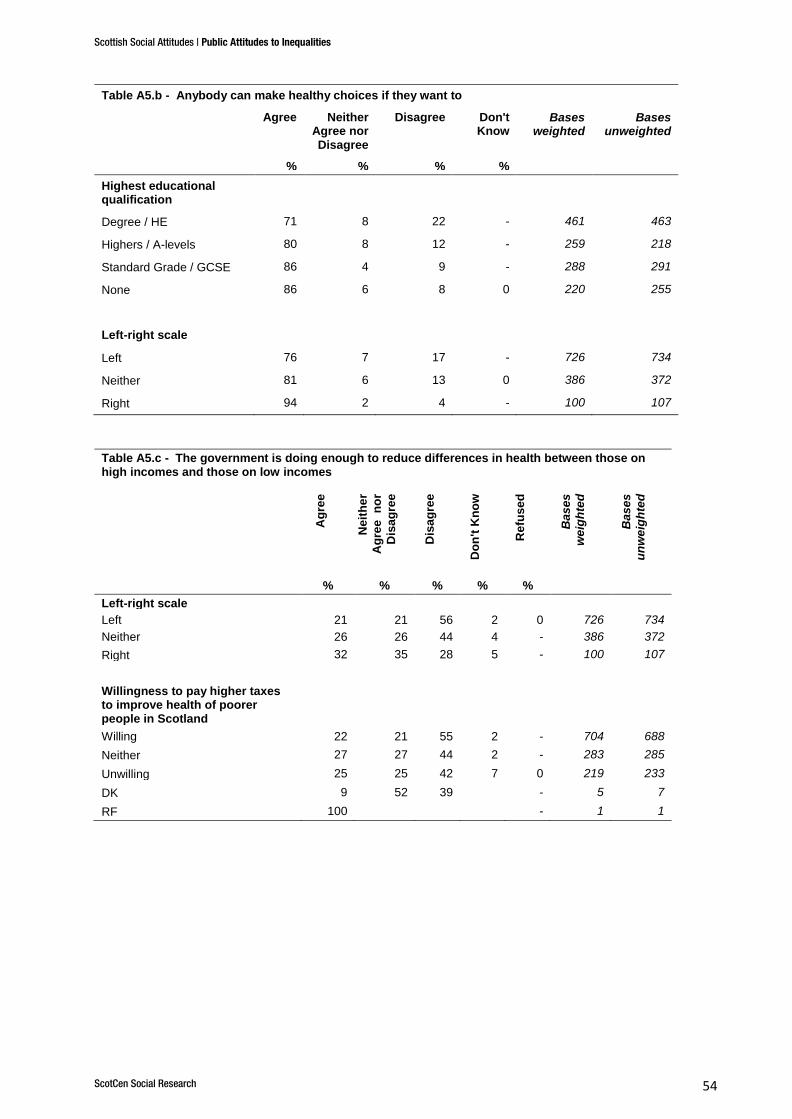
Scottish Social Attitudes | Public Attitudes to Inequalities
ScotCen Social Research 54
Table A5.b - Anybody can make healthy choices if they want to
Agree Neither Agree nor Disagree
Disagree Don't Know
Bases weighted
Bases unweighted
% % % %
Highest educational qualification
Degree / HE 71 8 22 - 461 463
Highers / A-levels 80 8 12 - 259 218
Standard Grade / GCSE 86 4 9 - 288 291
None 86 6 8 0 220 255
Left-right scale
Left 76 7 17 - 726 734
Neither 81 6 13 0 386 372
Right 94 2 4 - 100 107
Table A5.c - The government is doing enough to reduce differences in health between those on high incomes and those on low incomes
Ag
ree
Neit
he
r
Ag
ree
n
or
Dis
ag
ree
Dis
ag
ree
Do
n't
Kn
ow
Refu
se
d
Bas
es
we
igh
ted
Bas
es
un
we
igh
ted
% % % % %
Left-right scale
Left 21 21 56 2 0 726 734
Neither 26 26 44 4 - 386 372
Right 32 35 28 5 - 100 107
Willingness to pay higher taxes to improve health of poorer people in Scotland
Willing 22 21 55 2 - 704 688
Neither 27 27 44 2 - 283 285
Unwilling 25 25 42 7 0 219 233
DK 9 52 39 - 5 7
RF 100 - 1 1
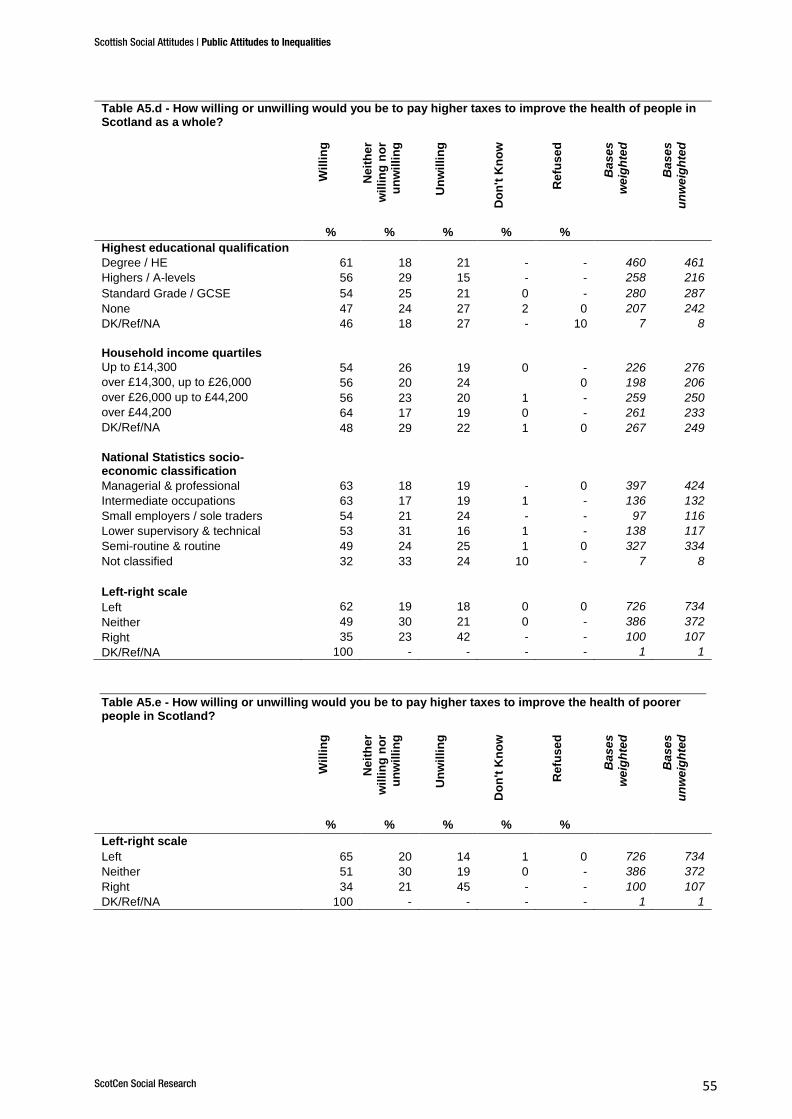
Scottish Social Attitudes | Public Attitudes to Inequalities
ScotCen Social Research 55
Table A5.d - How willing or unwilling would you be to pay higher taxes to improve the health of people in Scotland as a whole?
Wil
lin
g
Ne
ith
er
wil
lin
g n
or
un
wil
lin
g
Un
wil
lin
g
Do
n't
Kn
ow
Re
fus
ed
Ba
se
s
we
igh
ted
Ba
se
s
un
we
igh
ted
% % % % %
Highest educational qualification
Degree / HE 61 18 21 - - 460 461
Highers / A-levels 56 29 15 - - 258 216
Standard Grade / GCSE 54 25 21 0 - 280 287
None 47 24 27 2 0 207 242
DK/Ref/NA 46 18 27 - 10 7 8
Household income quartiles
Up to £14,300 54 26 19 0 - 226 276
over £14,300, up to £26,000 56 20 24 0 198 206
over £26,000 up to £44,200 56 23 20 1 - 259 250
over £44,200 64 17 19 0 - 261 233
DK/Ref/NA 48 29 22 1 0 267 249
National Statistics socio-economic classification
Managerial & professional 63 18 19 - 0 397 424
Intermediate occupations 63 17 19 1 - 136 132
Small employers / sole traders 54 21 24 - - 97 116
Lower supervisory & technical 53 31 16 1 - 138 117
Semi-routine & routine 49 24 25 1 0 327 334
Not classified 32 33 24 10 - 7 8
Left-right scale
Left 62 19 18 0 0 726 734
Neither 49 30 21 0 - 386 372
Right 35 23 42 - - 100 107
DK/Ref/NA 100 - - - - 1 1
Table A5.e - How willing or unwilling would you be to pay higher taxes to improve the health of poorer people in Scotland?
Wil
lin
g
Neit
he
r
wil
lin
g n
or
un
wil
lin
g
Un
wil
lin
g
Do
n't
Kn
ow
Refu
se
d
Bas
es
we
igh
ted
Bas
es
un
we
igh
ted
% % % % %
Left-right scale
Left 65 20 14 1 0 726 734
Neither 51 30 19 0 - 386 372
Right 34 21 45 - - 100 107
DK/Ref/NA 100 - - - - 1 1
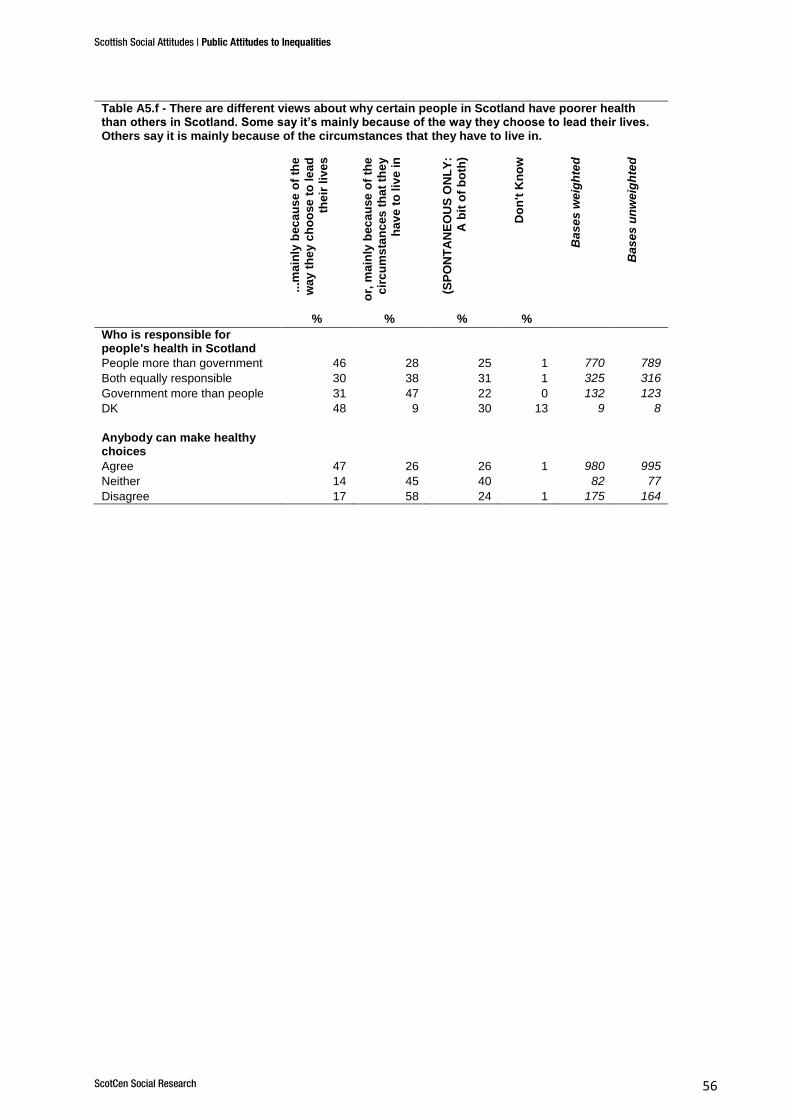
Scottish Social Attitudes | Public Attitudes to Inequalities
ScotCen Social Research 56
Table A5.f - There are different views about why certain people in Scotland have poorer health than others in Scotland. Some say it’s mainly because of the way they choose to lead their lives. Others say it is mainly because of the circumstances that they have to live in.
...m
ain
ly b
ec
au
se
of
the
wa
y t
he
y c
ho
ose
to
le
ad
the
ir l
ive
s
or,
ma
inly
bec
au
se
of
the
cir
cu
ms
tan
ces
th
at
the
y
ha
ve
to
liv
e i
n
(SP
ON
TA
NE
OU
S O
NL
Y:
A b
it o
f b
oth
)
Do
n't
Kn
ow
Ba
se
s w
eig
hte
d
Ba
se
s u
nw
eig
hte
d
% % % %
Who is responsible for people's health in Scotland
People more than government 46 28 25 1 770 789
Both equally responsible 30 38 31 1 325 316
Government more than people 31 47 22 0 132 123
DK 48 9 30 13 9 8
Anybody can make healthy choices
Agree 47 26 26 1 980 995
Neither 14 45 40 82 77
Disagree 17 58 24 1 175 164
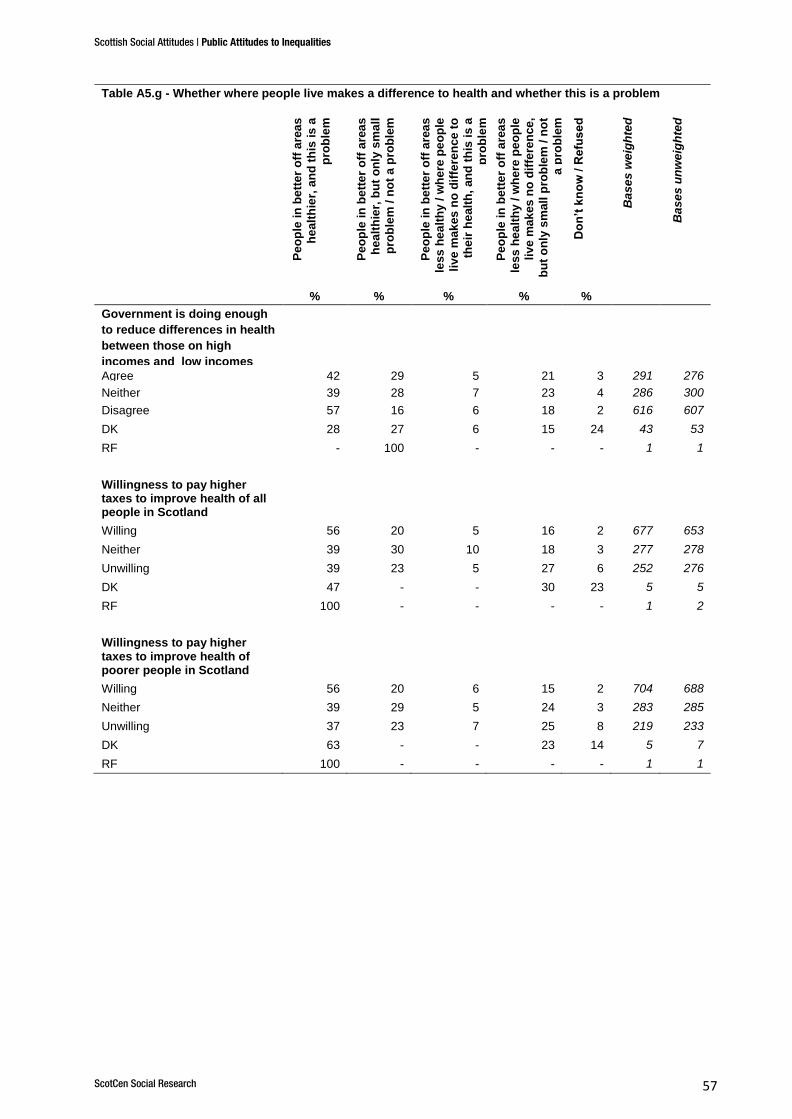
Scottish Social Attitudes | Public Attitudes to Inequalities
ScotCen Social Research 57
Table A5.g - Whether where people live makes a difference to health and whether this is a problem
Pe
op
le in
be
tte
r o
ff a
rea
s
he
alt
hie
r, a
nd
th
is is
a
pro
ble
m
Pe
op
le in
be
tte
r o
ff a
rea
s
he
alt
hie
r, b
ut
on
ly s
ma
ll
pro
ble
m / n
ot
a p
rob
lem
Pe
op
le in
be
tte
r o
ff a
rea
s
les
s h
ea
lth
y /
wh
ere
pe
op
le
liv
e m
ak
es
no
dif
fere
nce
to
the
ir h
ealt
h,
an
d t
his
is
a
pro
ble
m
Pe
op
le in
be
tte
r o
ff a
rea
s
les
s h
ea
lth
y /
wh
ere
pe
op
le
liv
e m
ak
es
no
dif
fere
nce
,
bu
t o
nly
sm
all
pro
ble
m /
no
t
a p
rob
lem
Do
n’t
kn
ow
/ R
efu
se
d
Ba
se
s w
eig
hte
d
Ba
se
s u
nw
eig
hte
d
% % % % %
Government is doing enough
to reduce differences in health
between those on high
incomes and low incomes
Agree 42 29 5 21 3 291 276
Neither 39 28 7 23 4 286 300
Disagree 57 16 6 18 2 616 607
DK 28 27 6 15 24 43 53
RF - 100 - - - 1 1
Willingness to pay higher taxes to improve health of all people in Scotland
Willing 56 20 5 16 2 677 653
Neither 39 30 10 18 3 277 278
Unwilling 39 23 5 27 6 252 276
DK 47 - - 30 23 5 5
RF 100 - - - - 1 2
Willingness to pay higher taxes to improve health of poorer people in Scotland
Willing 56 20 6 15 2 704 688
Neither 39 29 5 24 3 283 285
Unwilling 37 23 7 25 8 219 233
DK 63 - - 23 14 5 7
RF 100 - - - - 1 1