Embed Size (px)
Citation preview
1 October 2010
Public Comment Draft of High School Mathematics Model Courses Organization of this Section The high school Common Core State Standards (CCSS) approved by the Board of Elementary and Secondary Education (BESE) in July 2010 are organized into Conceptual Categories that specify the mathematics that all students should study in order to be college and career ready, with the additional mathematics standards that students should learn to prepare for Calculus or Advanced Statistics indicated with a “+”. The CCSS did not indicate how these standards could be organized into courses. In response to the need for model courses, Achieve (in partnership with the Common Core writ-ing team) convened a group of state mathematics experts, high school teachers, mathematics fa-culty from two and four year institutions, mathematics teacher educators, and workforce repre-sentatives (see Membership List attached). In August 2010 Achieve published Mathematics Ap-pendix A: Designing High School Mathematics Course Based on the Common Core State Stan-dards (available at the Common Core State Standards website http://www.corestandards.org/the-standards). Appendix A outlined possible approaches to organizing all of the standards without a “+” into coherent and rigorous courses in two course-taking pathways: 1) Traditional (Algebra I, Geometry, Algebra II) and 2) Integrated (Mathematics I, Mathematics II, and Mathematics III). Following the July BESE meeting and the publication of Appendix A, the Department of Elementary and Secondary Education (ESE) convened a committee of experts (see Membership List attached) to:
• review the Common Core high school standards by Conceptual Category and recommend additional standards to be added to the high school standards;
• review the model high school mathematics courses presented in Appendix A and make suggestions for revisions and additions to the courses presented in the two Pathways and embed any Massachusetts additional standards; and
• design two additional courses, Precalculus and Advanced Quantitative Reasoning, for students to study after completing one of the Pathways. These advanced courses are comprised of the “+” standards in the high school conceptual categories.
This document contains the committee’s recommendations for three model courses for each of the two Pathways based on the model courses designed by the Achieve team plus two advanced courses, Precalculus and Advanced Quantitative Reasoning, designed by the ESE committee. The additional Massachusetts standards embedded in the courses are coded beginning with MA (indicating Massachusetts); followed by 9-12 (indicating high school); conceptual category (N, A, F, G, or S), domain, and number of the standard. For example, MA.9-12.A.REI.3a is read: MA (Massachusetts additional standard), 9-12 (high school level), A (Algebra conceptual category), REI (Reasoning with Equations and Inequalities domain), 3a (standard number). With the exception of these additional standards, there have been NO CHANGES to the Common Core high school standards that were approved by the BESE in July 2010. This section includes a draft of the 8 high school model courses to be posted for public comment and we invite your feedback and suggestions.
2 October 2010
TABLE OF CONTENTS
Traditional Pathway: Algebra I 3 Geometry 10 Algebra II 16 Integrated Pathway: Mathematics I 23 Mathematics II 30 Mathematics III 38 Additional Courses: Precalculus 45
Advanced Quantitative Reasoning 50
3 October 2010
Traditional Pathway: High School Algebra I1
The fundamental purpose of Algebra I is to formalize and extend the mathematics that students learned in the middle grades. The course contains standards from the High School Conceptual Categories, many of which encompass types of expressions and functions that are beyond the scope of Algebra I. It is important to note, therefore, that the scope of Algebra I is limited to linear, quadratic, and exponential expressions and functions as well as some work with absolute value, step, and functions that are piecewise-defined; therefore, although a standard may include references to logarithms or trigonometry, those functions should not be included in the work of Algebra I students, rather they will be addressed in Algebra II. Reminders of this limitation are included as footnotes where appropriate in the Algebra I standards.
Algebra I has four critical areas that deepen and extend understanding of linear and exponential relationships by contrasting them with each other and by applying linear models to data that exhibit a linear trend. Students engage in methods for analyzing, solving and using quadratic functions. The Mathematical Practice Standards apply throughout the course and, together with the content standards, prescribe that students experience mathematics as a coherent, useful, and logical subject that makes use of their ability to make sense of problem situations. Critical Area 1: By the end of eighth grade, students have learned to solve linear equations in one variable and have applied graphical and algebraic methods to analyze and solve systems of linear equations in two variables. In this course students analyze and explain the process of solving an equation and justify the process used in solving a system of equations. Students develop fluency writing, interpreting, and translating between various forms of linear equations and inequalities, and using them to solve problems. They master the solution of linear equations and apply related solution techniques and the laws of exponents to the creation and solution of simple exponential equations. Critical Area 2: In earlier grades, students define, evaluate, and compare functions, and use them to model relationships between quantities. Students will learn function notation and develop the concepts of domain and range. They explore many examples of functions paying particular attention to linear, quadratic, and exponential functions, including sequences; they interpret functions given graphically, numerically, symbolically, and verbally, translate between representations, and understand the limitations of various representations. Students build on and extend their understanding of integer exponents to consider exponential functions. They compare and contrast linear and exponential functions, distinguishing between additive and multiplicative change. Students explore systems of equations and inequalities, and they find and interpret their solutions. They interpret arithmetic sequences as linear functions and geometric sequences as exponential functions. Critical Area 3: Students extend the laws of exponents to rational exponents and apply this new understanding of number; they strengthen their ability to see structure in and create quadratic and exponential expressions. They create and solve equations, inequalities, and systems of equations involving quadratic expressions. Students become facile with algebraic manipulation, including rearranging and collecting terms, factoring, identifying and canceling common factors in rational
1 Adapted from Appendix A: Designing High School Mathematics Course Based on the Common Core State Standards, http://www.corestandards.org/the-standards
4 October 2010
expressions. Students consider quadratic functions, comparing the key characteristics of quadratic functions to those of linear and exponential functions. They select from among these functions to model phenomena. Students learn to anticipate the graph of a quadratic function by interpreting various forms of quadratic expressions. In particular, they identify the real solutions of a quadratic equation as the zeros of a related quadratic function. Students expand their experience with functions to include more specialized functions—absolute value, step, and those that are piecewise-defined. Critical Area 4: Building upon prior students’ prior experiences with data, students explore a more formal means of assessing how a model fits data. Students use regression techniques to describe approximately linear relationships between quantities. They use graphical representations and knowledge of the context to make judgments about the appropriateness of linear models. With linear models, they look at residuals to analyze the goodness of fit.
5 October 2010
High School Algebra I Overview Number and Quantity
The Real Number System • Extend the properties of exponents to rational exponents. • Use properties of rational and irrational numbers.
Quantity • Reason quantitatively and use units to solve problems.
Algebra
Seeing Structure in Expressions • Interpret the structure of expressions • Write expressions in equivalent forms to solve problems
Arithmetic with Polynomials and Rational Expressions • Perform arithmetic operations on polynomials.
Creating Equations • Create equations that describe numbers or relationships
Reasoning with Equations and Inequalities • Understand solving equations as a process of
reasoning and explain the reasoning • Solve equations and inequalities in one variable • Solve systems of equations • Represent and solve equations and inequalities
graphically Functions
Interpreting Functions • Understand the concept of a function and use
function notation • Interpret functions that arise in applications in
terms of a context • Analyze functions using different representations
Building Functions • Build a function that models a relationship
between two quantities. • Build new functions from existing functions
Linear, Quadratic, and Exponential Models • Construct and compare linear, quadratic and
exponential models and solve problems • Interpret expressions for functions in terms of the
situation they model Statistics and Probability
Interpreting Categorical and Quantitative Data • Summarize, represent, and interpret data on a
single count or measurement variable • Summarize, represent, and interpret data on two
categorical and quantitative variables • Interpret linear models
Mathematical Practices 1. Make sense of problems and persevere in
solving them. 2. Reason abstractly and quantitatively. 3. Construct viable arguments and critique the
reasoning of others. 4. Model with mathematics. 5. Use appropriate tools strategically. 6. Attend to precision. 7. Look for and make use of structure. 8. Look for and express regularity in repeated
reasoning.
6 October 2010
Number and Quantity The Real Number System N.RN Extend the properties of exponents to rational exponents2
1. Explain how the definition of the meaning of rational exponents follows from extending the properties of integer exponents to those values, allowing for a notation for radicals in terms of rational exponents. For example, we define 51/3 to be the cube root of 5 because we want (51/3)3 = 5(1/3) x 3 to hold, so (51/3)3 must equal 5.
.
2. Rewrite expressions involving radicals and rational exponents using the properties of exponents. Use properties of rational and irrational numbers. 3. Explain why the sum or product of rational numbers is rational; that the sum of a rational number and an
irrational number is irrational; and that the product of a nonzero rational number and an irrational number is irrational.
Quantities N.Q Reason quantitatively and use units to solve problems. 1. Use units as a way to understand problems and to guide the solution of multi-step problems; choose and
interpret units consistently in formulas; choose and interpret the scale and the origin in graphs and data displays.*
2. Define appropriate quantities for the purpose of descriptive modeling.* 3. Choose a level of accuracy appropriate to limitations on measurement when reporting quantities.*
MA.9-12.N.Q.3a Describe the effects of approximate error in measurement and rounding on measurements and on computed values from measurements.
Algebra Seeing Structure in Expressions A.SSE Interpret the structure of expressions3
1. Interpret expressions that represent a quantity in terms of its context.*
a. Interpret parts of an expression, such as terms, factors, and coefficients.* b. Interpret complicated expressions by viewing one or more of their parts as a single entity. For example,
interpret P(1+r)n as the product of P and a factor not depending on P.* 2. Use the structure of an expression to identify ways to rewrite it. For example, see x4 – y4 as (x2)2 – (y2)2, thus
recognizing it as a difference of squares that can be factored as (x2 – y2)(x2 + y2). Write expressions in equivalent forms to solve problems 3. Choose and produce an equivalent form of an expression to reveal and explain properties of the quantity
represented by the expression.* a. Factor a quadratic expression to reveal the zeros of the function it defines.* b. Complete the square in a quadratic expression to reveal the maximum or minimum value of the
function it defines.* c. Use the properties of exponents to transform expressions for exponential functions. For example the
expression 1.15^t can be rewritten as (1.151/12)12t ≈ 1.01212t to reveal the approximate equivalent monthly interest rate if the annual rate is 15%.*
Arithmetic with Polynomials and Rational Functions A.APR Perform arithmetic operations on polynomials4
1. Understand that polynomials form a system analogous to the integers, namely, they are closed under the operations of addition, subtraction, and multiplication; add, subtract, and multiply polynomials.
Creating Equations5
Create equations that describe numbers or relationships A.CED
1. Create equations and inequalities in one variable and use them to solve problems. Include equations arising from linear and quadratic functions, and simple rational and exponential functions.*
2 Introduce rational exponents in simple situations; master in Algebra II 3 Algebra I is limited to linear, quadratic, and exponential expressions 4 For Algebra I, focus on polynomial expressions that simplify to linear or quadratic forms with a positive power of the variable. 5 Create linear, quadratic, and exponential (with integer domain) equations in Algebra I
7 October 2010
2. Create equations in two or more variables to represent relationships between quantities; graph equations on coordinate axes with labels and scales.*
3. Represent constraints by equations or inequalities6
4. Rearrange formulas to highlight a quantity of interest, using the same reasoning as in solving equations. For example, rearrange Ohm’s law V = IR to highlight resistance R.*
, and by systems of equations and/or inequalities, and interpret solutions as viable or non-viable options in a modeling context. For example, represent inequalities describing nutritional and cost constraints on combinations of different foods.*
Reasoning with Equations and Inequalities A.REI Understand solving equations as a process of reasoning and explain the reasoning 1. Explain each step in solving a simple equation as following from the equality of numbers asserted at the
previous step, starting from the assumption that the original equation has a solution. Construct a viable argument to justify a solution method.
Solve equations and inequalities in one variable 3. Solve linear equations and inequalities in one variable, including equations with coefficients represented by
letters. MA.9-12.A.REI.3a Solve linear equations and inequalities in one variable involving absolute value. 4. Solve quadratic equations in one variable.
a. Use the method of completing the square to transform any quadratic equation in x into an equation of the form (x – p)2 = q that has the same solutions. Derive the quadratic formula from this form.
b. Solve quadratic equations by inspection (e.g., for x2 = 49), taking square roots, completing the square, the quadratic formula and factoring, as appropriate to the initial form of the equation. Recognize when the quadratic formula gives complex solutions and write them as a ± bi for real numbers a and b.
MA.9-12.A.REI.4c Demonstrate an understanding of the equivalence of factoring, completing the square, or using the quadratic formula to solve quadratic equations.
Solve systems of equations 5. Prove that, given a system of two equations in two variables, replacing one equation by the sum of that equation
and a multiple of the other produces a system with the same solutions. 6. Solve systems of linear equations exactly and approximately (e.g., with graphs), focusing on pairs of linear
equations in two variables. 7. Solve a simple system consisting of a linear equation and a quadratic equation in two variables algebraically
and graphically. For example, find the points of intersection between the line y = –3x and the circle x2 + y2 = 3. Represent and solve equations and inequalities7
10. Understand that the graph of an equation in two variables is the set of all its solutions plotted in the coordinate plane, often forming a curve (which could be a line).
graphically
11. Explain why the x-coordinates of the points where the graphs of the equations y = f(x) and y = g(x) intersect are the solutions of the equation f(x) = g(x); find the solutions approximately, e.g., using technology to graph the functions, make tables of values, or find successive approximations. Include cases where f(x) and/or g(x) are linear, polynomial, rational, absolute value, exponential, and logarithmic functions.*
12. Represent and solve equations and inequalities graphically. Graph the solutions to a linear inequality in two variables as a half-plane (excluding the boundary in the case of a strict inequality), and graph the solution set to a system of linear inequalities in two variables as the intersection of the corresponding half-planes.
Functions Interpreting Functions F.IF Understand the concept of a function and use function notation 1. Understand that a function from one set (called the domain) to another set (called the range) assigns to each
element of the domain exactly one element of the range. If f is a function and x is an element of its domain, then f(x) denotes the output of f corresponding to the input x. The graph of f is the graph of the equation y = f(x).
2. Use function notation, evaluate functions for inputs in their domains, and interpret statements that use function notation in terms of a context.
6 Equations and inequalities in this standard should be limited to linear. 7 In Algebra I, functions are limited to linear, absolute value, and exponential functions for this standard
8 October 2010
3. Recognize that sequences are functions, sometimes defined recursively, whose domain is a subset of the integers. For example, the Fibonacci sequence is defined recursively by f(0) = f(1) = 1, f(n+1) = f(n) + f(n-1) for n≥ 1.
Interpret functions8
4. For a function that models a relationship between two quantities, interpret key features of graphs and tables in terms of the quantities, and sketch graphs showing key features given a verbal description of the relationship. Key features include: intercepts; intervals where the function is increasing, decreasing, positive, or negative; relative maximums and minimums; symmetries; end behavior; and periodicity.*
that arise in applications in terms of the context
5. Relate the domain of a function to its graph and, where applicable, to the quantitative relationship it describes. For example, if the function h(n) gives the number of person-hours it takes to assemble n engines in a factory, then the positive integers would be an appropriate domain for the function.*
6. Calculate and interpret the average rate of change of a function (presented symbolically or as a table) over a specified interval. Estimate the rate of change from a graph.*
Analyze functions9
7. Graph functions expressed symbolically and show key features of the graph, by hand in simple cases and using technology for more complicated cases.*
using different representations
a. Graph linear and quadratic functions and show intercepts, maxima, and minima.* b. Graph square root, cube root10
e. Graph exponential and logarithmic
, and piecewise-defined functions, including step functions and absolute value functions.*
11 functions, showing intercepts and end behavior, and trigonometric functions, showing period, midline, and amplitude.*12
8. Write a function defined by an expression in different but equivalent forms to reveal and explain different properties of the function.
a. Use the process of factoring and completing the square in a quadratic function to show zeros, extreme values, and symmetry of the graph, and interpret these in terms of a context.
b. Use the properties of exponents to interpret expressions for exponential functions. For example, identify percent rate of change in functions such as y = 1.02t, y = (0.97)t, y = (1.01)12t, y = (1.2)t/10, and classify them as representing exponential growth and decay.
MA.9-12.F.IF.8c Translate between different representations of functions and relations: graphs, equations point sets, and tabular.
9. Compare properties of two functions each represented in a different way (algebraically, graphically, numerically in tables, or by verbal descriptions). For example, given a graph of one quadratic function and an algebraic expression for another, say which has the larger maximum.
MA.9-12.F.IF.10. Given algebraic, numeric, and/or graphical representations of functions, recognize functions as polynomial, rational, logarithmic, exponential, or trigonometric.
Building Functions13
Build a function that models a relationship between two quantities F.BF
1. Write a function that describes a relationship between two quantities.* a. Determine an explicit expression, a recursive process, or steps for calculation from a context. b. Combine standard function types using arithmetic operations. For example, build a function that
models the temperature of a cooling body by adding a constant function to a decaying exponential, and relate these functions to the model.
2. Write arithmetic and geometric sequences both recursively and with an explicit formula, use them to model situations, and translate between the two forms.*
Build new functions from existing functions 3. Identify the effect on the graph of replacing f(x) by f(x) + k, k f(x), f(kx), and f(x + k) for specific values of k
(both positive and negative); find the value of k given the graphs. Experiment with cases and illustrate an
8 Limit to interpreting linear, quadratic, and exponential functions 9 In Algebra I, only linear, exponential, quadratic, absolute value, step, and piecewise functions are included in this cluster. 10 Do not include square root and cube root defined functions in Algebra I 11 Do not include logarithmic functions in Algebra I 12 Showing end behavior, and trigonometric functions, showing period, midline, and amplitude are not part of Algebra I 13 Functions are limited to linear, quadratic , and exponential in Algebra I
9 October 2010
explanation of the effects on the graph using technology. Include recognizing even and odd functions from their graphs and algebraic expressions for them.
4. Find inverse functions. a. Solve an equation of the form f(x) = c for a simple function f that has an inverse and write an
expression for the inverse. For example, f(x) =2x3 or f(x) = (x+1)/(x-1) for x ≠ 1. Linear, Quadratic, and Exponential Models F.LE Construct and compare linear, quadratic, and exponential models and solve problems 1. Distinguish between situations that can be modeled with linear functions and with exponential functions.*
a. Prove that linear functions grow by equal differences over equal intervals and that exponential functions grow by equal factors over equal intervals.*
b. Recognize situations in which one quantity changes at a constant rate per unit interval relative to another.*
c. Recognize situations in which a quantity grow or decays by a constant percent rate per unit interval relative to another.
2. Construct linear and exponential functions, including arithmetic and geometric sequences, given a graph, a description of a relationship, or two input-output pairs (include reading these from a table).*
3. Observe using graphs and tables that a quantity increasing exponentially eventually exceeds a quantity increasing linearly, quadratically, or (more generally) as a polynomial function.*
Interpret expressions for functions in terms of the situation they model 5. Interpret the parameters in a linear or exponential14
function in terms of a context.
Statistics and Probability S.ID Interpreting Categorical and Quantitative Data Summarize, represent, and interpret data on a single count or measurement variable 1. Represent data with plots on the real number line (dot plots, histograms, and box plots).* 2. Use statistics appropriate to the shape of the data distribution to compare center (median, mean) and spread
(interquartile range, standard deviation) of two or more different data sets.* 3. Interpret differences in shape, center, and spread in the context of the data sets, accounting for possible effects
of extreme data points (outliers).* 4. Use the mean and standard deviation of a data set to fit it to a normal distribution and to estimate population
percentages. Recognize that there are data sets for which such a procedure is not appropriate. Use calculators, spreadsheets, and tables to estimate areas under the normal curve.*
Summarize, represent, and interpret data on two categorical and quantitative variables 5. Summarize categorical data for two categories in two-way frequency tables. Interpret relative frequencies in the
context of the data (including joint, marginal, and conditional relative frequencies). Recognize possible associations and trends in the data.*
6. Represent data on two quantitative variables on a scatter plot, and describe how the variables are related.* a. Fit a function to the data; use functions fitted to data to solve problems in the context of the data. Use
given functions or choose a function suggested by the context. Emphasize linear, quadratic, and exponential models.*
b. Informally assess the fit of a function by plotting and analyzing residuals.* c. Fit a linear function for a scatter plot that suggests a linear association.*
Interpret linear models 7. Interpret the slope (rate of change) and the intercept (constant term) of a linear model in the context of the data. 8. Compute (using technology) and interpret the correlation coefficient of a linear fit. 9. Interpret linear models. Distinguish between correlation and causation.
14 Limit exponential function to the form f(x) = bx + k)
10 October 2010
Traditional Pathway: Geometry15
The fundamental purpose of the Geometry course is to formalize and extend students’ geometric experiences from the middle grades. Students explore more complex geometric situations and deepen their explanations of geometric relationships, presenting and hearing formal mathematical arguments. Important differences exist between this Geometry course and the historical approach taken in Geometry classes. For example, transformations are emphasized in this course. Close attention should be paid to the introductory content for the Geometry conceptual category found in the high school CCSS. The Mathematical Practice Standards apply throughout this course and, together with the content standards, prescribe that students experience mathematics as a coherent, useful, and logical subject that makes use of their ability to make sense of problem situations. The critical areas are as follows:
Critical Area 1: Students have prior experience with drawing triangles based on given measurements, performing rigid motions including translations, reflections, and rotations, and have used these to develop notions about what it means for two objects to be congruent. In this course, students establish triangle congruence criteria, based on analyses of rigid motions and formal constructions. They use triangle congruence as a familiar foundation for the development of formal proof. Students prove theorems—using a variety of formats including deductive and inductive reasoning and proof by contradiction—and solve problems about triangles, quadrilaterals, and other polygons. They apply reasoning to complete geometric constructions and explain why they work. Critical Area 2: Students apply their earlier experience with dilations and proportional reasoning to build a formal understanding of similarity. They identify criteria for similarity of triangles, use similarity to solve problems, and apply similarity in right triangles to understand right triangle trigonometry, with particular attention to special right triangles and the Pythagorean theorem. Students develop the Laws of Sines and Cosines in order to find missing measures of general (not necessarily right) triangles, building on students’ work with quadratic equations done in the first course. They are able to distinguish whether three given measures (angles or sides) define 0, 1, 2, or infinitely many triangles. Critical Area 3: Students’ experience with three-dimensional objects is extended to include informal explanations of circumference, area, and volume formulas. Additionally, students apply their knowledge of two-dimensional shapes to consider the shapes of cross-sections and the result of rotating a two-dimensional object about a line. Critical Area 4: Building on their work with the Pythagorean theorem in 8th grade to find distances, students use the rectangular coordinate system to verify geometric relationships, including properties of special triangles and quadrilaterals and slopes of parallel and perpendicular lines, which relates back to work done in the first course. Students continue their study of quadratics by connecting the geometric and algebraic definitions of the parabola.
15 Adapted from Appendix A: Designing High School Mathematics Course Based on the Common Core State Standards, http://www.corestandards.org/the-standards
11 October 2010
Critical Area 5: Students prove basic theorems about circles, with particular attention to perpendicularity and inscribed angles, in order to see symmetry in circles and as an application of triangle congruence criteria. They study relationships among segments on chords, secants, and tangents as an application of similarity. In the Cartesian coordinate system, students use the distance formula to write the equation of a circle when given the radius and the coordinates of its center. Given an equation of a circle, they draw the graph in the coordinate plane, and apply techniques for solving quadratic equations, which relates back to work done in the first course, to determine intersections between lines and circles or parabolas and between two circles. Critical Area 6: Building on probability concepts that began in the middle grades, students use the languages of set theory to expand their ability to compute and interpret theoretical and experimental probabilities for compound events, attending to mutually exclusive events, independent events, and conditional probability. Students should make use of geometric probability models wherever possible. They use probability to make informed decisions.
12 October 2010
Geometry Overview Number and Quantity
Quantity • Reason quantitatively and use units to solve problems
Geometry
Congruence • Experiment with transformations in the plane • Understand congruence in terms of rigid motions • Prove geometric theorems • Make geometric constructions
Similarity, Right Triangles, and Trigonometry • Understand similarity in terms of similarity in
terms of similarity transformations. • Prove theorems involving similarity • Define trigonometry ratios and solve problems
involving right triangles • Apply trigonometry to general triangles
Circles • Understand and apply theorems about circles • Find arc lengths and area of sectors of circles
Expressing Geometric Properties with Equations • Translate between the geometric description
and the equations for a conic section • Use coordinates to prove simple geometric
theorems algebraically Geometric Measurement and Dimension
• Explain volume formulas and use them to solve problems
• Visualize the relationship between two-dimensional and three-dimensional objects
Modeling with Geometry • Apply geometric concepts in modeling
situations Statistics and Probability
Conditional Probability and the Rules of Probability
• Understand independence and conditional probability and use them to interpret data
• Use the rules of probability to compute probabilities of compound events in a uniform probability model
Mathematical Practices 1. Make sense of problems and persevere
in solving them. 2. Reason abstractly and quantitatively. 3. Construct viable arguments and critique
the reasoning of others. 4. Model with mathematics. 5. Use appropriate tools strategically. 6. Attend to precision. 7. Look for and make use of structure. 8. Look for and express regularity in
repeated reasoning.
13 October 2010
Number and Quantity N.Q Quantity Reason quantitatively and use units to solve problems 2. Define appropriate quantities for the purpose of descriptive modeling.* 3. Choose a level of accuracy appropriate to limitations on measurement when reporting quantities.
MA.N.Q.3a. Describe the effects of approximate error in measurement and rounding on measurements and on computed values from measures.
Geometry Congruence G.CO Experiment with transformations in the plane 1. Know precise definitions of angle, circle, perpendicular line, parallel line, and line segment, based on the
undefined notions of point, line, distance along a line, and distance around a circular arc. 2. Represent transformations in the plane using, e.g., transparencies and geometry software; describe
transformations as functions that take points in the plane as inputs and give other points as outputs. Compare transformations that preserve distance and angle to those that do not (e.g., translation versus horizontal stretch).
3. Given a rectangle, parallelogram, trapezoid, or regular polygon, describe the rotations and reflections that carry it onto itself.
4. Develop definitions of rotations, reflections, and translations in terms of angles, circles, perpendicular lines, parallel lines, and line segments.
5. Given a geometric figure and a rotation, reflection, or translation, draw the transformed figure using, e.g., graph paper, tracing paper, or geometry software. Specify a sequence of transformations that will carry a given figure onto another.
Understand congruence in terms of rigid motions 6. Use geometric descriptions of rigid motions to transform figures and to predict the effect of a given rigid motion
on a given figure; given two figures, use the definition of congruence in terms of rigid motions to decide if they are congruent.
7. Use the definition of congruence in terms of rigid motions to show that two triangles are congruent if and only if corresponding pairs of sides and corresponding pairs of angles are congruent.
8. Explain how the criteria for triangle congruence (ASA, SAS, and SSS) follow from the definition of congruence in terms of rigid motions.
Prove geometric theorems 9. Prove theorems about lines and angles. Theorems include: vertical angles are congruent; when a transversal
crosses parallel lines, alternate interior angles are congruent and corresponding angles are congruent; points on a perpendicular bisector of a line segment are exactly those equidistant from the segment’s endpoints.
10. Prove theorems about triangles. Theorems include: measures of interior angles of a triangle sum to 180 degrees; base angles of isosceles triangles are congruent; the segment joining midpoints of two sides of a triangle is parallel to the third side and half the length; the medians of a triangle meet at a point.
11. Prove theorems about parallelograms. Theorems include: opposite sides are congruent, opposite angles are congruent, the diagonals of a parallelogram bisect each other, and conversely, rectangles are parallelograms with congruent diagonals. MA.G.CO.11a. Prove theorems about polygons. Theorems include: measures of interior and exterior angles,
properties of inscribed polygons. Make geometric constructions 12. Make formal geometric constructions with a variety of tools and methods (compass and straightedge, string,
reflective devices, paper folding, dynamic geometric software, etc.). Copying a segment; copying an angle; bisecting a segment; bisecting an angle; constructing perpendicular lines, including the perpendicular bisector of a line segment; and constructing a line parallel to a given line through a point not on the line.
13. Construct an equilateral triangle, a square, and a regular hexagon inscribed in a circle. Similarity, Right Triangles, and Trigonometry G.SRT Understand similarity in terms of similarity transformations 1. Understand similarity in terms of similarity transformations. Verify experimentally the properties of dilations
given by a center and a scale factor: a. A dilation takes a line not passing through the center of the dilation to a parallel line, and leaves a line
passing through the center unchanged.
14 October 2010
b. The dilation of a line segment is longer or shorter in the ratio given by the scale factor. 2. Given two figures, use the definition of similarity in terms of similarity transformations to decide if they are
similar; explain using similarity transformations the meaning of similarity for triangles as the equality of all corresponding pairs of angles and the proportionality of all corresponding pairs of sides.
3. Use the properties of similarity transformations to establish the AA criterion for two triangles to be similar. Prove theorems involving similarity 4. Prove theorems about triangles. Theorems include: a line parallel to one side of a triangle divides the other two
proportionally, and conversely; the Pythagorean Theorem proved using triangle similarity. 5. Use congruence and similarity criteria for triangles to solve problems and to prove relationships in geometric
figures. Define trigonometric ratios and solve problems involving right triangles. 6. Define trigonometric ratios and solve problems involving right triangles. Understand that by similarity, side
ratios in right triangles are properties of the angles in the triangle, leading to definitions of trigonometric ratios for acute angles.
7. Explain and use the relationship between the sine and cosine of complementary angles. 8. Use trigonometric ratios and the Pythagorean Theorem to solve right triangles in applied problems. Apply trigonometry to general triangles 9. (+) Derive the formula A = (1/2)ab sin(C) for the area of a triangle by drawing an auxiliary line from a vertex
perpendicular to the opposite side. 10. (+) Prove the Laws of Sines and Cosines and use them to solve problems. 11. (+) Understand and apply the Law of Sines and the Law of Cosines to find unknown measurements in right and
non-right triangles (e.g., surveying problems, resultant forces). Circles G.C Understand and apply theorems about circles 1. Prove that all circles are similar. 2. Identify and describe relationships among inscribed angles, radii, and chords. Include the relationship between
central, inscribed, and circumscribed angles; inscribed angles on a diameter are right angles; the radius of a circle is perpendicular to the tangent where the radius intersects the circle.
3. Construct the inscribed and circumscribed circles of a triangle, and prove properties of angles for a quadrilateral inscribed in a circle. MA.9-12.G.C.3a. Derive the formula for the relationship between the number of sides and sums of the
interior and sums of the exterior angles of polygons and apply to the solutions of mathematical and contextual problems.
4. (+) Construct a tangent line from a point outside a given circle to the circle. Find arc lengths and areas of sectors of circles 5. Find arc lengths and areas of sectors of circles. Derive using similarity the fact that the length of the arc
intercepted by an angle is proportional to the radius, and define the radian measure of the angle as the constant of proportionality; derive the formula for the area of a sector.
Expressing Geometric Properties with Equations G.GPE Translate between the geometric description and the equation for a conic section 1. Translate between the geometric description and the equation for a conic section. Derive the equation of a circle
of given center and radius using the Pythagorean Theorem; complete the square to find the center and radius of a circle given by an equation.
2. Derive the equation of a parabola given a focus and a directrix. Use coordinates to prove simple geometric theorems algebraically 4. Use coordinates to prove simple geometric theorems algebraically. For example, prove or disprove that a figure
defined by four given points in the coordinate plane is a rectangle; prove or disprove that the point (1, √3) lies on the circle centered at the origin and containing the point (0, 2).
5. Prove the slope criteria for parallel and perpendicular lines and use them to solve geometric problems (e.g., find the equation of a line parallel or perpendicular to a given line that passes through a given point).
6. Find the point on a directed line segment between two given points that partitions the segment in a given ratio. 7. Use coordinates to compute perimeters of polygons and areas of triangles and rectangles, e.g., using the distance
formula.*
15 October 2010
Geometric Measurement and Dimension G.GMD Explain volume formulas and use them to solve problems 1. Give an informal argument for the formulas for the circumference of a circle, area of a circle, volume of a
cylinder, pyramid, and cone. Use dissection arguments, Cavalieri’s principle, and informal limit arguments. 2. (+) Give an informal argument using Cavalieri’s principle for the formulas for the volume of a sphere and other
solid figures. 3. Use volume formulas for cylinders, pyramids, cones, and spheres to solve problems.* Visualize relationships between two-dimensional and three-dimensional objects 4. Identify the shapes of two-dimensional cross-sections of three-dimensional objects, and identify three-
dimensional objects generated by rotations of two-dimensional objects. Modeling with Geometry G.MG Apply geometric concepts in modeling situations 1. Use geometric shapes, their measures, and their properties to describe objects (e.g., modeling a tree trunk or a
human torso as a cylinder).* 2. Apply concepts of density based on area and volume in modeling situations (e.g., persons per square mile,
BTUs per cubic foot).* 3. Apply geometric methods to solve design problems (e.g., designing an object or structure to satisfy physical
constraints or minimize cost; working with typographic grid systems based on ratios).* MA.9-12.G.MG.4 Use dimensional analysis for unit conversion to confirm that expressions and equations make
sense.
16 October 2010
Traditional Pathway: Algebra II16
Building on their work with linear, quadratic, and exponential functions, students extend their repertoire of functions to include logarithmic, polynomial, rational, and radical functions
17
. Students work closely with the expressions that define the functions are facile with algebraic manipulations of expressions, and continue to expand and hone their abilities to model situations and to solve equations, including solving quadratic equations over the set of complex numbers and solving exponential equations using the properties of logarithms. The Mathematical Practice Standards apply throughout this course and, together with the content standards, prescribe that students experience mathematics as a coherent, useful, and logical subject that makes use of their ability to make sense of problem situations. The critical areas for this course are as follows:
Critical Area 1: A central theme is that the arithmetic of rational expressions is governed by the same rules as the arithmetic of rational numbers. Students explore the structural similarities between the system of polynomials and the system of integers. They draw on analogies between polynomial arithmetic and base-ten computation, focusing on properties of operations, particularly the distributive property. Connections are made between multiplication of polynomials with multiplication of multi-digit integers, and division of polynomials with long division of integers. Students identify zeros of polynomials, including complex zeros of quadratic polynomials, and make connections between zeros of polynomials and solutions of polynomial equations. The fundamental theorem of algebra is examined. Critical Area 2: Building on their previous work with functions, and on their work with trigonometric ratios and circles in Geometry, students now use the coordinate plane to extend trigonometry to model periodic phenomena. Critical Area 3: Students synthesize and generalize what they have learned about a variety of function families. They extend their work with exponential functions to include solving exponential equations with logarithms. They explore the effects of transformations on graphs of diverse functions, including functions arising in an application, in order to abstract the general principle that transformations on a graph always have the same effect regardless of the type of the underlying function. They identify appropriate types of functions to model a situation, they adjust parameters to improve the model, and they compare models by analyzing appropriateness of fit and making judgments about the domain over which a model is a good fit. The description of modeling as “the process of choosing and using mathematics and statistics to analyze empirical situations, to understand them better, and to make decisions” is at the heart of this unit. The narrative discussion and diagram of the modeling cycle should be considered when knowledge of functions, statistics, and geometry is applied in a modeling context. Critical Area 4: Students see how the visual displays and summary statistics they learned in earlier grades relate to different types of data and to probability distributions. They identify different ways of collecting data— including sample surveys, experiments, and simulations—and the role that randomness and careful design play in the conclusions that can be drawn.
16 Adapted from Appendix A: Designing High School Mathematics Course Based on the Common Core State Standards, http://www.corestandards.org/the-standards 17 In this course rational functions are limited to those whose numerators are of degree at most 1 and denominators of degree at most 2; rational functions are limited to square roots or cube roots of at most quadratic polynomials.
17 October 2010
Algebra II Overview Number and Quantity
The Real Number System • Extend the properties of exponents to rational exponents
Complex Number System • Perform arithmetic operations with complex
numbers • Use complex numbers in polynomial identities and
equations Vector and Matrix Quantities
• Perform operations on matrices and use matrices in applications
Algebra
Seeing Structure in Expressions • Interpret the structure of expressions • Write expressions in equivalent forms to solve problems
Arithmetic with Polynomials and Rational Expressions • Perform arithmetic operations on polynomials • Understand the relationship between zeros and factors of
polynomials • Use polynomial identities to solve problems • Rewrite rational expressions
Creating Equations • Create equations that describe numbers or
equations Reasoning with Equations and Inequalities
• Understand solving equations as a process of reasoning and explain the reasoning
• Represent and solve equations and inequalities graphically
Functions
Interpreting Functions • Interpret functions that arise in applications
in terms of a context • Analyze functions using different
representations Building Functions
• Build a function that models a relationship between two quantities
• Build new functions from existing functions Linear, Quadratic, and Exponential Models
• Construct and compare linear, quadratic, and exponential models and solve problems
Trigonometric Functions • Extend the domain of trigonometric
functions using the unit circle • Model periodic phenomena with
trigonometric functions • Prove and apply trigonometric identities
Mathematical Practices 1. Make sense of problems and persevere
in solving them. 2. Reason abstractly and quantitatively. 3. Construct viable arguments and critique
the reasoning of others. 4. Model with mathematics. 5. Use appropriate tools strategically. 6. Attend to precision. 7. Look for and make use of structure. 8. Look for and express regularity in
repeated reasoning.
18 October 2010
Statistics and Probability Interpreting Categorical and Quantitative Data
• Summarize, represent and interpret data on a single count of measurement variable
Making Inferences and Justifying Conclusions • Understand and evaluate random processes
underlying statistical experiments • Make inferences and justify conclusions
from sample surveys, experiments and observational studies
Using Probability to Make Decisions • Use probability to evaluate outcomes of
decisions
19 October 2010
Number and Quantity The Real Number System N.RN Extend the properties of exponents to rational exponents18
1. Explain how the definition of the meaning of rational exponents follows from extending the properties of integer exponents to those values, allowing for a notation for radicals in terms of rational exponents. For example, we define 51/3 to be the cube root of 5 because we want (51/3)3 = 5(1/3) x 3 to hold, so (51/3)3 must equal 5.
.
2. Rewrite expressions involving radicals and rational exponents using the properties of exponents. The Complex Number System N.CN Perform arithmetic operations with complex numbers 1. Know there is a complex number i such that i^2 = −1, and every complex number has the form a + bi with a
and b real. 2. Use the relation i2 = –1 and the commutative, associative, and distributive properties to add, subtract, and
multiply complex numbers. 3. (+) Perform arithmetic operations with complex numbers. Find the conjugate of a complex number; use
conjugates to find moduli and quotients of complex numbers. Use complex numbers in polynomial identities and equations 7. Solve quadratic equations with real coefficients that have complex solutions. 8. (+) Extend polynomial identities to the complex numbers. For example, rewrite x2 + 4 as (x + 2i)(x – 2i). 9. (+) Know the Fundamental Theorem of Algebra; show that it is true for quadratic polynomials. Vector Quantities and Matrices N.VM Perform operations on matrices and use matrices in applications 6. (+) Use matrices to represent and manipulate data, e.g., to represent payoffs or incidence relationships in a network. 8. (+) Add, subtract, and multiply matrices of appropriate dimensions. 12. (+) Work with 2 X 2 matrices as transformations of the plane, and interpret the absolute value of the determinant in terms of area. Algebra A.SSE Seeing Structure in Expressions Interpret the structure of expressions 1. Interpret expressions that represent a quantity in terms of its context.* 2. Use the structure of an expression to identify ways to rewrite it. For example, see x4 – y4 as (x2)2 – (y2)2, thus
recognizing it as a difference of squares that can be factored as (x2 – y2)(x2 + y2). Write expressions in equivalent forms to solve problems 4. Derive the formula for the sum of a finite geometric series (when the common ratio is not 1), and use the
formula to solve problems. For example, calculate mortgage payments.* Arithmetic with Polynomials and Rational Expressions A.APR Perform arithmetic operations on polynomials 1. Understand that polynomials form a system analogous to the integers, namely, they are closed under the
operations of addition, subtraction, and multiplication; add, subtract, and multiply polynomials. Understand the relationship between zeros and factors of polynomials 2. Know and apply the Remainder Theorem: For a polynomial p(x) and a number a, the remainder on division by
x – a is p(a), so p(a) = 0 if and only if (x – a) is a factor of p(x). 3. Identify zeros of polynomials when suitable factorizations are available, and use the zeros to construct a rough
graph of the function defined by the polynomial. Use polynomial identities to solve problems 4. Prove polynomial identities and use them to describe numerical relationships. For example, the polynomial
identity (x2 + y2)2 = (x2 – y2)2 + (2xy)2 can be used to generate Pythagorean triples.
18 Introduce rational exponents in simple situations; master in Algebra II
20 October 2010
5. (+) Know and apply that the Binomial Theorem gives the expansion of (x + y)n in powers of x and y for a positive integer n, where x and y are any numbers, with coefficients determined for example by Pascal’s Triangle. (The Binomial Theorem can be proved by mathematical induction or by a combinatorial argument.)
Rewrite rational expressions 6. Rewrite simple rational expressions in different forms; write a(x)/b(x) in the form q(x) + r(x)/b(x), where a(x),
b(x), q(x), and r(x) are polynomials with the degree of r(x) less than the degree of b(x), using inspection, long division, or, for the more complicated examples, a computer algebra system.
7. (+) Understand that rational expressions form a system analogous to the rational numbers, closed under addition, subtraction, multiplication, and division by a nonzero rational expression; add, subtract, multiply, and divide rational expressions.
Creating Equations A.CED Create equations that describe numbers or relationships 1. Create equations and inequalities in one variable and use them to solve problems. Include equations arising
from linear and quadratic functions, and simple rational and exponential functions.* 2. Create equations in two or more variables to represent relationships between quantities; graph equations on
coordinate axes with labels and scales.* 3. Represent constraints by equations or inequalities, and by systems of equations and/or inequalities, and
interpret solutions as viable or non-viable options in a modeling context. For example, represent inequalities describing nutritional and cost constraints on combinations of different foods.*
4. Rearrange formulas to highlight a quantity of interest, using the same reasoning as in solving equations. For example, rearrange Ohm’s law V = IR to highlight resistance R.*
Reasoning with equations and inequalities A.REI Understand solving equations as a process of reasoning and explain the reasoning 2. Solve simple rational and radical equations in one variable, and give examples showing how extraneous
solutions may arise. Represent and solve equations and inequalities graphically 11. Explain why the x-coordinates of the points where the graphs of the equations y = f(x) and y = g(x) intersect
are the solutions of the equation f(x) = g(x); find the solutions approximately, e.g., using technology to graph the functions, make tables of values, or find successive approximations. Include cases where f(x) and/or g(x) are linear, polynomial, rational, absolute value, exponential, and logarithmic functions.*
Functions Interpreting Functions F.IF Interpret functions that arise in applications in terms of the context 4. For a function that models a relationship between two quantities, interpret key features of graphs and tables in
terms of the quantities, and sketch graphs showing key features given a verbal description of the relationship. Key features include: intercepts; intervals where the function is increasing, decreasing, positive, or negative; relative maximums and minimums; symmetries; end behavior; and periodicity.*
5. Relate the domain of a function to its graph and, where applicable, to the quantitative relationship it describes. For example, if the function h(n) gives the number of person-hours it takes to assemble n engines in a factory, then the positive integers would be an appropriate domain for the function.*
6. Calculate and interpret the average rate of change of a function (presented symbolically or as a table) over a specified interval. Estimate the rate of change from a graph.*
Analyze functions using different representations 7. Graph functions expressed symbolically and show key features of the graph, by hand in simple cases and using
technology for more complicated cases.* b. Graph square root, cube root, and piecewise-defined functions, including step functions and absolute
value functions.* c. Graph polynomial functions, identifying zeros when suitable factorizations are available, and showing
end behavior.* e. Graph exponential and logarithmic functions, showing intercepts and end behavior, and trigonometric
functions, showing period, midline, and amplitude.* 8. Write a function defined by an expression in different but equivalent forms to reveal and explain different
properties of the function.
21 October 2010
MA.F.IF.8c. Translate between different representations of functions and relations: graphs, equations, point sets, and tables.
9. Compare properties of two functions each represented in a different way (algebraically, graphically, numerically in tables, or by verbal descriptions). For example, given a graph of one quadratic function and an algebraic expression for another, say which has the larger maximum.
Building Functions F.BF Build a function that models a relationship between two quantities 1. Write a function that describes a relationship between two quantities.*
b. Combine standard function types using arithmetic operations. For example, build a function that models the temperature of a cooling body by adding a constant function to a decaying exponential, and relate these functions to the model.
Build new functions from existing functions 3. Identify the effect on the graph of replacing f(x) by f(x) + k, k f(x), f(kx), and f(x + k) for specific values of k
(both positive and negative); find the value of k given the graphs. Experiment with cases and illustrate an explanation of the effects on the graph using technology. Include recognizing even and odd functions from their graphs and algebraic expressions for them.
4. Find inverse functions. a. Solve an equation of the form f(x) = c for a simple function f that has an inverse and write an expression
for the inverse. For example, f(x) =2(x3) or f(x) = (x+1)/(x-1) for x ≠ 1 (x not equal to 1). Linear, Quadratic, and Exponential Models F.LE Construct and compare linear, quadratic, and exponential models and solve problems. 4. For exponential models, express as a logarithm the solution to ab^(ct) = d where a, c, and d are numbers and
the base b is 2, 10, or e; evaluate the logarithm using technology.* Trigonometric Functions F.TF Extend the domain of trigonometric functions using the unit circle 1. Understand radian measure of an angle as the length of the arc on the unit circle subtended by the angle. 2. Explain how the unit circle in the coordinate plane enables the extension of trigonometric functions to all real
numbers, interpreted as radian measures of angles traversed counterclockwise around the unit circle. Model periodic phenomena with trigonometric functions 5. Choose trigonometric functions to model periodic phenomena with specified amplitude, frequency, and
midline.* Prove and apply trigonometric identities 8. Prove the Pythagorean identity (sin A)^2 + (cos A)^2 = 1 and use it to find sin A, cos A, or tan A, given sin A,
cos A, or tan A, and the quadrant of the angle. Statistics and Probability Interpreting Categorical and Quantitative Data S.ID Summarize, represent, and interpret data on a single count or measurement variable 4. Use the mean and standard deviation of a data set to fit it to a normal distribution and to estimate population
percentages. Recognize that there are data sets for which such a procedure is not appropriate. Use calculators, spreadsheets, and tables to estimate areas under the normal curve.
Making Inferences and Justifying Conclusions S.IC Understand and evaluate random processes underlying statistical experiments 1. Understand statistics as a process for making inferences about population parameters based on a random
sample from that population.* 2. Decide if a specified model is consistent with results from a given data-generating process, e.g., using
simulation. For example, a model says a spinning coin falls heads up with probability 0. 5. Would a result of 5 tails in a row cause you to question the model?*
Make inferences and justify conclusions from sample surveys, experiments and observational studies 3. Recognize the purposes of and differences among sample surveys, experiments, and observational studies;
explain how randomization relates to each.*
22 October 2010
4. Use data from a sample survey to estimate a population mean or proportion; develop a margin of error through the use of simulation models for random sampling.*
5. Use data from a randomized experiment to compare two treatments; use simulations to decide if differences between parameters are significant.*
6. Evaluate reports based on data.* Using Probability to Make Decisions S.MD Use probability to evaluate outcomes of decisions 6. (+) Use probabilities to make fair decisions (e.g., drawing by lots, using a random number generator).* 7. (+) Analyze decisions and strategies using probability concepts (e.g., product testing, medical testing, pulling a
hockey goalie at the end of a game).*
23 October 2010
Integrated Pathway: Mathematics I19
The fundamental purpose of Mathematics I is to formalize and extend the mathematics that students learned in the middle grades. The critical areas deepen and extend understanding of linear relationships, in part by contrasting them with exponential phenomena, and in part by applying linear models to data that exhibit a linear trend. Mathematics 1 uses properties and theorems involving congruent figures to deepen and extend understanding of geometric knowledge from prior grades. The course ties together the algebraic and geometric ideas studied. The Mathematical Practice Standards apply throughout each course and, together with the content standards, prescribe that students experience mathematics as a coherent, useful, and logical subject that makes use of their ability to make sense of problem situations. Critical Area 1: By the end of eighth grade students have had a variety of experiences working with expressions and creating equations. Students become facile with algebraic manipulation in much the same way that they are facile with numerical manipulation. Algebraic facility includes rearranging and collecting terms, factoring, identifying and canceling common factors in rational expressions and applying properties of exponents. Students continue this work by using quantities to model and analyze situations, to interpret expressions, and by creating equations to describe situations. Critical Area 2: In earlier grades, students define, evaluate, and compare functions, and use them to model relationships between quantities. Students will learn function notation and develop the concepts of domain and range. They move beyond viewing functions as processes that take inputs and yield outputs and start viewing functions as objects in their own right. They explore many examples of functions, including sequences; they interpret functions given graphically, numerically, symbolically, and verbally, translate between representations, and understand the limitations of various representations. They work with functions given by graphs and tables, keeping in mind that, depending upon the context, these representations are likely to be approximate and incomplete. Their work includes functions that can be described or approximated by formulas as well as those that cannot. When functions describe relationships between quantities arising from a context, students reason with the units in which those quantities are measured. Students build on and informally extend their understanding of integer exponents to consider exponential functions. They compare and contrast linear and exponential functions, distinguishing between additive and multiplicative change. They interpret arithmetic sequences as linear functions and geometric sequences as exponential functions. Critical Area 3: By the end of eighth grade, students have learned to solve linear equations in one variable and have applied graphical and algebraic methods to analyze and solve systems of linear equations in two variables. Building on these earlier experiences, students analyze and explain the process of solving an equation and to justify the process used in solving a system of equations. Students develop fluency writing, interpreting, and translating between various forms of linear equations and inequalities, and using them to solve problems. They master the solution of linear equations and apply related solution techniques and the laws of exponents to the creation and solution of simple exponential equations. Students explore systems of equations and inequalities, and they find and interpret their solutions. All of this work is grounded on understanding quantities and on relationships between them. Critical Area 4: Students’ prior experiences with data Is the basis for with the more formal means of assessing how a model fits data. Students use regression techniques to describe approximately linear relationships between quantities. They use graphical representations and knowledge of the context to make judgments about the appropriateness of linear models. With linear models, they look at residuals to analyze the goodness of fit. Critical Area 5: In previous grades, students were asked to draw triangles based on given measurements. They also have prior experience with rigid motions: translations, reflections, and rotations and have used these to develop notions about what it means for two objects to be congruent. Students establish triangle congruence criteria, based on analyses of rigid motions and formal constructions. They solve problems about triangles, quadrilaterals, and other polygons. They apply reasoning to complete geometric constructions and explain why they work.
19 Adapted from Appendix A: Designing High School Mathematics Course Based on the Common Core State Standards, http://www.corestandards.org/the-standards

24 October 2010
Critical Area 6: Building on their work with the Pythagorean Theorem in 8th grade to find distances, students use a rectangular coordinate system to verify geometric relationships, including properties of special triangles and quadrilaterals and slopes of parallel and perpendicular lines.
25 October 2010
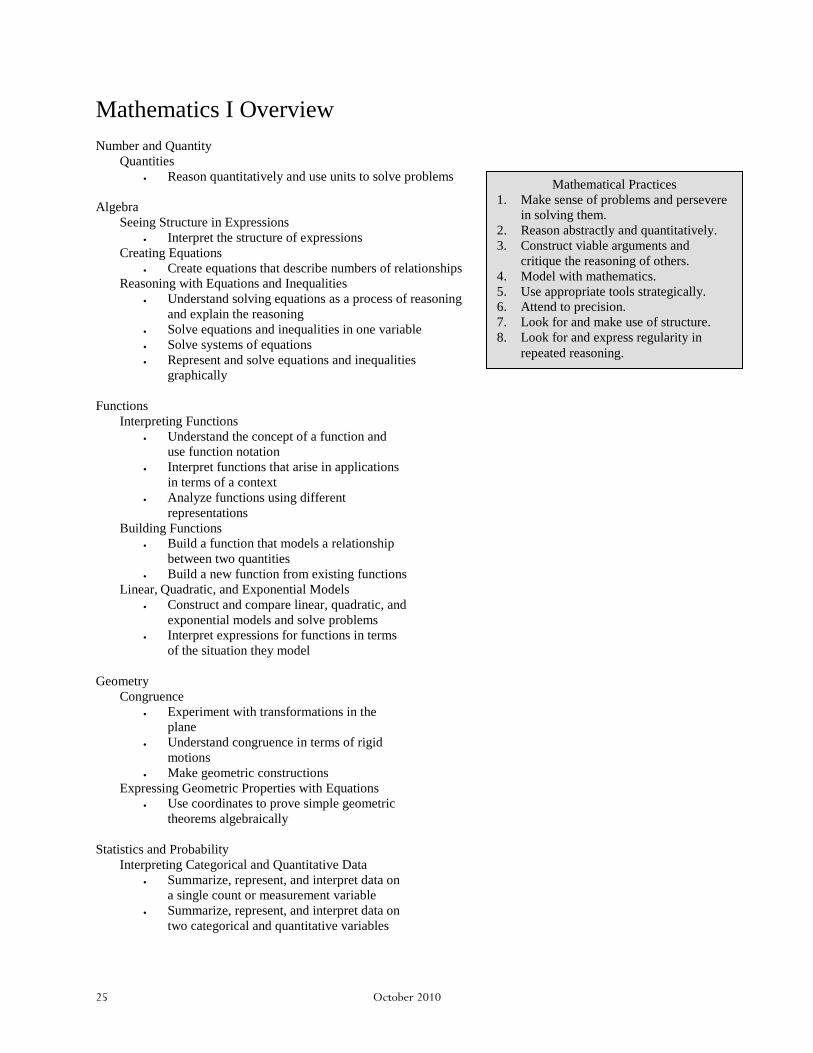
Mathematics I Overview Number and Quantity
Quantities • Reason quantitatively and use units to solve problems
Algebra
Seeing Structure in Expressions • Interpret the structure of expressions
Creating Equations • Create equations that describe numbers of relationships
Reasoning with Equations and Inequalities • Understand solving equations as a process of reasoning
and explain the reasoning • Solve equations and inequalities in one variable • Solve systems of equations • Represent and solve equations and inequalities
graphically Functions
Interpreting Functions • Understand the concept of a function and
use function notation • Interpret functions that arise in applications
in terms of a context • Analyze functions using different
representations Building Functions
• Build a function that models a relationship between two quantities
• Build a new function from existing functions Linear, Quadratic, and Exponential Models
• Construct and compare linear, quadratic, and exponential models and solve problems
• Interpret expressions for functions in terms of the situation they model
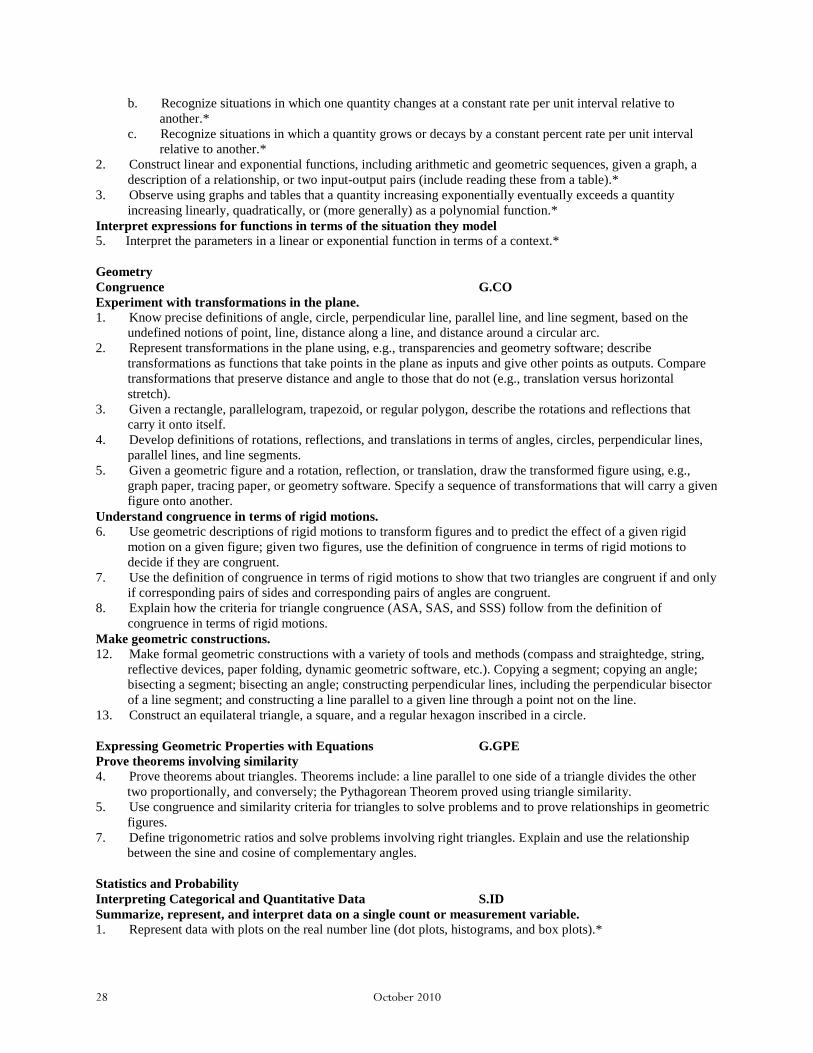
Geometry
Congruence • Experiment with transformations in the
plane • Understand congruence in terms of rigid
motions • Make geometric constructions
Expressing Geometric Properties with Equations • Use coordinates to prove simple geometric
theorems algebraically Statistics and Probability
Interpreting Categorical and Quantitative Data • Summarize, represent, and interpret data on
a single count or measurement variable • Summarize, represent, and interpret data on
two categorical and quantitative variables
Mathematical Practices 1. Make sense of problems and persevere
in solving them. 2. Reason abstractly and quantitatively. 3. Construct viable arguments and
critique the reasoning of others. 4. Model with mathematics. 5. Use appropriate tools strategically. 6. Attend to precision. 7. Look for and make use of structure. 8. Look for and express regularity in
repeated reasoning.
26 October 2010
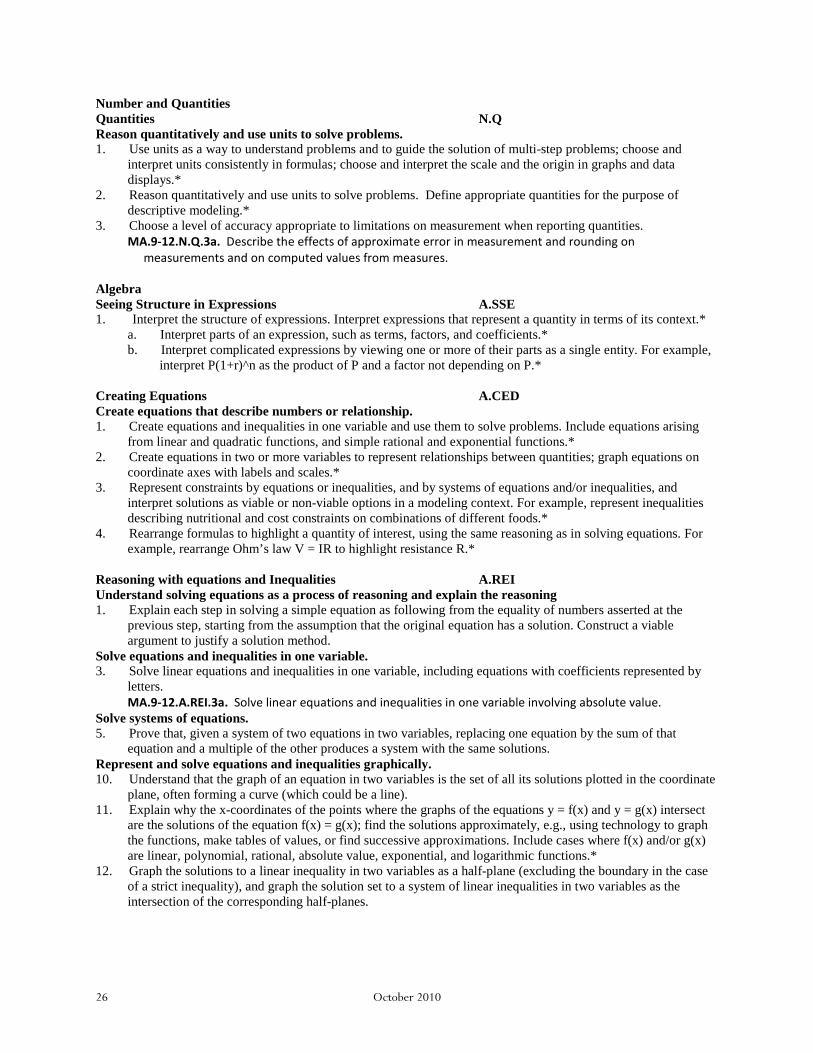
Number and Quantities Quantities N.Q Reason quantitatively and use units to solve problems. 1. Use units as a way to understand problems and to guide the solution of multi-step problems; choose and
interpret units consistently in formulas; choose and interpret the scale and the origin in graphs and data displays.*
2. Reason quantitatively and use units to solve problems. Define appropriate quantities for the purpose of descriptive modeling.*
3. Choose a level of accuracy appropriate to limitations on measurement when reporting quantities. MA.9-12.N.Q.3a. Describe the effects of approximate error in measurement and rounding on
measurements and on computed values from measures. Algebra Seeing Structure in Expressions A.SSE 1. Interpret the structure of expressions. Interpret expressions that represent a quantity in terms of its context.*
a. Interpret parts of an expression, such as terms, factors, and coefficients.* b. Interpret complicated expressions by viewing one or more of their parts as a single entity. For example,
interpret P(1+r)^n as the product of P and a factor not depending on P.* Creating Equations A.CED Create equations that describe numbers or relationship. 1. Create equations and inequalities in one variable and use them to solve problems. Include equations arising
from linear and quadratic functions, and simple rational and exponential functions.* 2. Create equations in two or more variables to represent relationships between quantities; graph equations on
coordinate axes with labels and scales.* 3. Represent constraints by equations or inequalities, and by systems of equations and/or inequalities, and
interpret solutions as viable or non-viable options in a modeling context. For example, represent inequalities describing nutritional and cost constraints on combinations of different foods.*
4. Rearrange formulas to highlight a quantity of interest, using the same reasoning as in solving equations. For example, rearrange Ohm’s law V = IR to highlight resistance R.*
Reasoning with equations and Inequalities A.REI Understand solving equations as a process of reasoning and explain the reasoning 1. Explain each step in solving a simple equation as following from the equality of numbers asserted at the
previous step, starting from the assumption that the original equation has a solution. Construct a viable argument to justify a solution method.
Solve equations and inequalities in one variable. 3. Solve linear equations and inequalities in one variable, including equations with coefficients represented by
letters. MA.9-12.A.REI.3a. Solve linear equations and inequalities in one variable involving absolute value.
Solve systems of equations. 5. Prove that, given a system of two equations in two variables, replacing one equation by the sum of that
equation and a multiple of the other produces a system with the same solutions. Represent and solve equations and inequalities graphically. 10. Understand that the graph of an equation in two variables is the set of all its solutions plotted in the coordinate
plane, often forming a curve (which could be a line). 11. Explain why the x-coordinates of the points where the graphs of the equations y = f(x) and y = g(x) intersect
are the solutions of the equation f(x) = g(x); find the solutions approximately, e.g., using technology to graph the functions, make tables of values, or find successive approximations. Include cases where f(x) and/or g(x) are linear, polynomial, rational, absolute value, exponential, and logarithmic functions.*
12. Graph the solutions to a linear inequality in two variables as a half-plane (excluding the boundary in the case of a strict inequality), and graph the solution set to a system of linear inequalities in two variables as the intersection of the corresponding half-planes.
27 October 2010
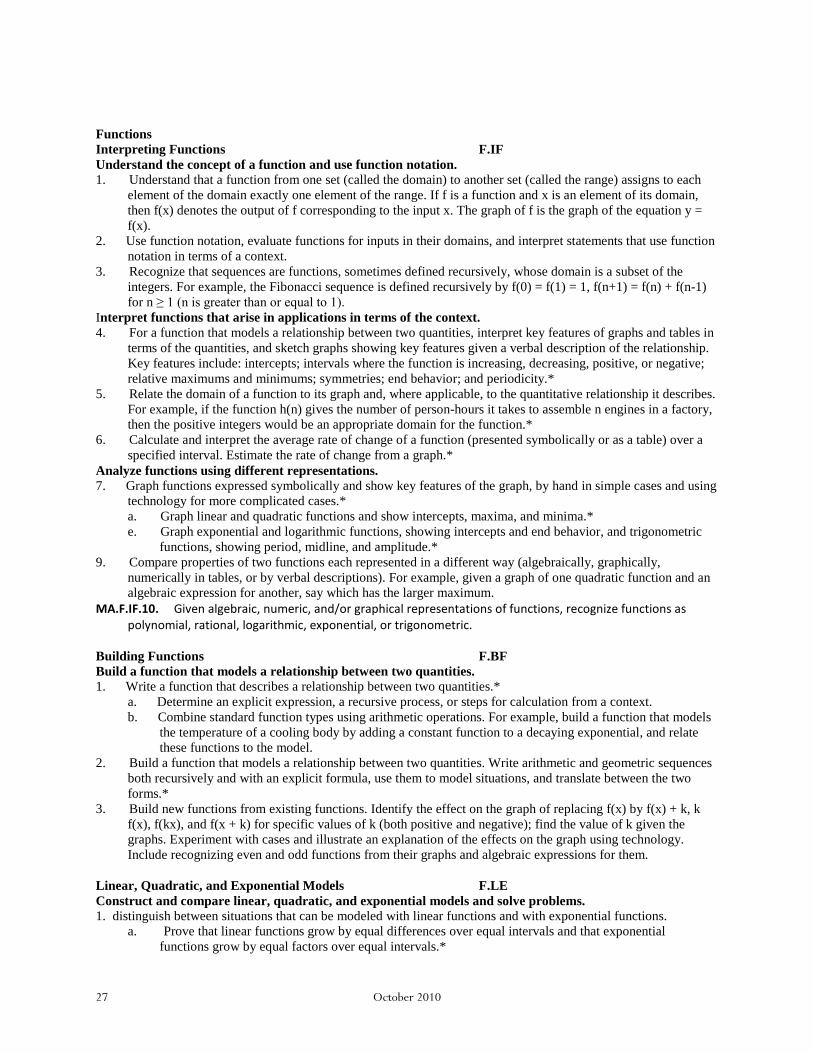
Functions Interpreting Functions F.IF Understand the concept of a function and use function notation. 1. Understand that a function from one set (called the domain) to another set (called the range) assigns to each
element of the domain exactly one element of the range. If f is a function and x is an element of its domain, then f(x) denotes the output of f corresponding to the input x. The graph of f is the graph of the equation y = f(x).
2. Use function notation, evaluate functions for inputs in their domains, and interpret statements that use function notation in terms of a context.
3. Recognize that sequences are functions, sometimes defined recursively, whose domain is a subset of the integers. For example, the Fibonacci sequence is defined recursively by f(0) = f(1) = 1, f(n+1) = f(n) + f(n-1) for n ≥ 1 (n is greater than or equal to 1).
Interpret functions that arise in applications in terms of the context. 4. For a function that models a relationship between two quantities, interpret key features of graphs and tables in
terms of the quantities, and sketch graphs showing key features given a verbal description of the relationship. Key features include: intercepts; intervals where the function is increasing, decreasing, positive, or negative; relative maximums and minimums; symmetries; end behavior; and periodicity.*
5. Relate the domain of a function to its graph and, where applicable, to the quantitative relationship it describes. For example, if the function h(n) gives the number of person-hours it takes to assemble n engines in a factory, then the positive integers would be an appropriate domain for the function.*
6. Calculate and interpret the average rate of change of a function (presented symbolically or as a table) over a specified interval. Estimate the rate of change from a graph.*
Analyze functions using different representations. 7. Graph functions expressed symbolically and show key features of the graph, by hand in simple cases and using
technology for more complicated cases.* a. Graph linear and quadratic functions and show intercepts, maxima, and minima.* e. Graph exponential and logarithmic functions, showing intercepts and end behavior, and trigonometric
functions, showing period, midline, and amplitude.* 9. Compare properties of two functions each represented in a different way (algebraically, graphically,
numerically in tables, or by verbal descriptions). For example, given a graph of one quadratic function and an algebraic expression for another, say which has the larger maximum.
MA.F.IF.10. Given algebraic, numeric, and/or graphical representations of functions, recognize functions as polynomial, rational, logarithmic, exponential, or trigonometric.
Building Functions F.BF Build a function that models a relationship between two quantities. 1. Write a function that describes a relationship between two quantities.*
a. Determine an explicit expression, a recursive process, or steps for calculation from a context. b. Combine standard function types using arithmetic operations. For example, build a function that models
the temperature of a cooling body by adding a constant function to a decaying exponential, and relate these functions to the model.
2. Build a function that models a relationship between two quantities. Write arithmetic and geometric sequences both recursively and with an explicit formula, use them to model situations, and translate between the two forms.*
3. Build new functions from existing functions. Identify the effect on the graph of replacing f(x) by f(x) + k, k f(x), f(kx), and f(x + k) for specific values of k (both positive and negative); find the value of k given the graphs. Experiment with cases and illustrate an explanation of the effects on the graph using technology. Include recognizing even and odd functions from their graphs and algebraic expressions for them.
Linear, Quadratic, and Exponential Models F.LE Construct and compare linear, quadratic, and exponential models and solve problems. 1. distinguish between situations that can be modeled with linear functions and with exponential functions.
a. Prove that linear functions grow by equal differences over equal intervals and that exponential functions grow by equal factors over equal intervals.*
28 October 2010
b. Recognize situations in which one quantity changes at a constant rate per unit interval relative to another.*
c. Recognize situations in which a quantity grows or decays by a constant percent rate per unit interval relative to another.*
2. Construct linear and exponential functions, including arithmetic and geometric sequences, given a graph, a description of a relationship, or two input-output pairs (include reading these from a table).*
3. Observe using graphs and tables that a quantity increasing exponentially eventually exceeds a quantity increasing linearly, quadratically, or (more generally) as a polynomial function.*
Interpret expressions for functions in terms of the situation they model 5. Interpret the parameters in a linear or exponential function in terms of a context.* Geometry Congruence G.CO Experiment with transformations in the plane. 1. Know precise definitions of angle, circle, perpendicular line, parallel line, and line segment, based on the
undefined notions of point, line, distance along a line, and distance around a circular arc. 2. Represent transformations in the plane using, e.g., transparencies and geometry software; describe
transformations as functions that take points in the plane as inputs and give other points as outputs. Compare transformations that preserve distance and angle to those that do not (e.g., translation versus horizontal stretch).
3. Given a rectangle, parallelogram, trapezoid, or regular polygon, describe the rotations and reflections that carry it onto itself.
4. Develop definitions of rotations, reflections, and translations in terms of angles, circles, perpendicular lines, parallel lines, and line segments.
5. Given a geometric figure and a rotation, reflection, or translation, draw the transformed figure using, e.g., graph paper, tracing paper, or geometry software. Specify a sequence of transformations that will carry a given figure onto another.
Understand congruence in terms of rigid motions. 6. Use geometric descriptions of rigid motions to transform figures and to predict the effect of a given rigid
motion on a given figure; given two figures, use the definition of congruence in terms of rigid motions to decide if they are congruent.
7. Use the definition of congruence in terms of rigid motions to show that two triangles are congruent if and only if corresponding pairs of sides and corresponding pairs of angles are congruent.
8. Explain how the criteria for triangle congruence (ASA, SAS, and SSS) follow from the definition of congruence in terms of rigid motions.
Make geometric constructions. 12. Make formal geometric constructions with a variety of tools and methods (compass and straightedge, string,
reflective devices, paper folding, dynamic geometric software, etc.). Copying a segment; copying an angle; bisecting a segment; bisecting an angle; constructing perpendicular lines, including the perpendicular bisector of a line segment; and constructing a line parallel to a given line through a point not on the line.
13. Construct an equilateral triangle, a square, and a regular hexagon inscribed in a circle. Expressing Geometric Properties with Equations G.GPE Prove theorems involving similarity 4. Prove theorems about triangles. Theorems include: a line parallel to one side of a triangle divides the other
two proportionally, and conversely; the Pythagorean Theorem proved using triangle similarity. 5. Use congruence and similarity criteria for triangles to solve problems and to prove relationships in geometric
figures. 7. Define trigonometric ratios and solve problems involving right triangles. Explain and use the relationship
between the sine and cosine of complementary angles. Statistics and Probability Interpreting Categorical and Quantitative Data S.ID Summarize, represent, and interpret data on a single count or measurement variable. 1. Represent data with plots on the real number line (dot plots, histograms, and box plots).*
29 October 2010
2. Use statistics appropriate to the shape of the data distribution to compare center (median, mean) and spread (interquartile range, standard deviation) of two or more different data sets.*
3. Interpret differences in shape, center, and spread in the context of the data sets, accounting for possible effects of extreme data points (outliers).*
Summarize, represent, and interpret data on two categorical and quantitative variables. 5. Summarize categorical data for two categories in two-way frequency tables. Interpret relative frequencies in
the context of the data (including joint, marginal, and conditional relative frequencies). Recognize possible associations and trends in the data.*
6. Represent data on two quantitative variables on a scatter plot, and describe how the variables are related.* a. Fit a function to the data; use functions fitted to data to solve problems in the context of the data. Use
given functions or choose a function suggested by the context. Emphasize linear, quadratic, and exponential models.*
b. Informally assess the fit of a function by plotting and analyzing residuals.* c. Fit a linear function for a scatter plot that suggests a linear association.*
Interpret linear models. 7. Interpret the slope (rate of change) and the intercept (constant term) of a linear model in the context of the
data.* 8. Compute (using technology) and interpret the correlation coefficient of a linear fit.* 9. Distinguish between correlation and causation.*
30 October 2010
Integrated Pathway: Mathematics II20
The focus of Mathematics II is on quadratic expressions, equations, and functions; comparing their characteristics and behavior to those of linear and exponential relationships from Mathematics I as organized into 5 critical areas. The need for extending the set of rational numbers arises and real and complex numbers are introduced so that all quadratic equations can be solved. The link between probability and data is explored through conditional probability and counting methods, including their use in making and evaluating decisions. The study of similarity leads to an understanding of right triangle trigonometry and connects to quadratics through Pythagorean relationships. Circles, with their quadratic algebraic representations, round out the course. The Mathematical Practice Standards apply throughout each course and, together with the content standards, prescribe that students experience mathematics as a coherent, useful, and logical subject that makes use of their ability to make sense of problem situations.
Critical Area 1: Students extend the laws of exponents to rational exponents and explore distinctions between rational and irrational numbers by considering their decimal representations. Students learn that when quadratic equations do not have real solutions the number system must be extended so that solutions exist, analogous to the way in which extending the whole numbers to the negative numbers allows x+1 = 0 to have a solution. Students explore relationships between number systems: whole numbers, integers, rational numbers, real numbers, and complex numbers. The guiding principle is that equations with no solutions in one number system may have solutions in a larger number system. Critical Area 2: Students consider quadratic functions, comparing the key characteristics of quadratic functions to those of linear and exponential functions. They select from among these functions to model phenomena. Students learn to anticipate the graph of a quadratic function by interpreting various forms of quadratic expressions. In particular, they identify the real solutions of a quadratic equation as the zeros of a related quadratic function. When quadratic equations do not have real solutions, students learn that that the graph of the related quadratic function does not cross the horizontal axis. They expand their experience with functions to include more specialized functions—absolute value, step, and those that are piecewise-defined. Critical Area 3: Students begin by focusing on the structure of expressions, rewriting expressions to clarify and reveal aspects of the relationship they represent. They create and solve equations, inequalities, and systems of equations involving exponential and quadratic expressions. Critical Area 4: Building on probability concepts that began in the middle grades, students use the languages of set theory to expand their ability to compute and interpret theoretical and experimental probabilities for compound events, attending to mutually exclusive events, independent events, and conditional probability. Students should make use of geometric probability models wherever possible. They use probability to make informed decisions. Critical Area 5: Students apply their earlier experience with dilations and proportional reasoning to build a formal understanding of similarity. They identify criteria for similarity of triangles, use similarity to solve problems, and apply similarity in right triangles to understand right triangle trigonometry, with particular attention to special right triangles and the Pythagorean Theorem. Students develop facility with geometric proof. They use what they know about congruence and similarity to prove theorems involving lines, angles, triangles, and other polygons. They explore a variety of formats for writing proofs.
20 Adapted from Appendix A: Designing High School Mathematics Course Based on the Common Core State Standards, http://www.corestandards.org/the-standards
31 October 2010
Mathematics II Overview Number and Quantity
The Real Number System • Extend the properties of exponents to
rational exponents • Use properties of rational and irrational
numbers The Complex Number Systems
• Perform operations on matrices and use matrices in applications
• Use complex numbers in polynomial identities and equations
Algebra Seeing Structure in Expressions
• Interpret the structure of expressions • Write expressions in equivalent forms to solve problems
Arithmetic with Polynomials and Rational Expressions • Perform arithmetic operations on polynomials
Creating Equations • Create equations that describe numbers of relationships
Reasoning with Equations and Inequalities • Solve equations and inequalities in one variable • Solve systems of equations
Functions Interpreting Functions
• Interpret functions that arise in applications in terms of a context
• Analyze functions using different representations
Building functions • Build a function that models a relationship
between two quantities • Build new functions from existing functions
Linear, Quadratic, and Exponential Models • Construct and compare linear, quadratic and
exponential models and solve problems Trigonometric Functions
• Prove and apply trigonometric identities Geometry
Congruence • Prove geometric theorems
Similarity, Right Triangles, and Trigonometry • Understand similarity in terms of similarity
transformations • Prove theorems involving similarity • Define trigonometric ratios and solve
problems involving right triangles Circles
• Understand and apply theorems about circles
• Find arc lengths and areas of sectors of circles.
Mathematical Practices 1. Make sense of problems and persevere
in solving them. 2. Reason abstractly and quantitatively. 3. Construct viable arguments and critique
the reasoning of others. 4. Model with mathematics. 5. Use appropriate tools strategically. 6. Attend to precision. 7. Look for and make use of structure. 8. Look for and express regularity in
repeated reasoning.
32 October 2010
Expressing Geometric Properties with Equations • Translate between the geometric description
and the equation for a conic section • Use coordinates to prove simple geometric
theorems algebraically Geometric Measurement and Dimension
• Explain volume formulas and use them to solve problems
Statistics and Probability Conditional Probability and the Rules of Probability
• Understand independence and conditional probability and use them to interpret data
• Use the rules of probability to compute probabilities of compound events in a uniform probability model
Using Probability to Make Decisions • Use probability to evaluate outcomes or
decisions
33 October 2010
Number and Quantity The Real Number System N.RN Extend the properties of exponents to rational exponents. 1. Explain how the definition of the meaning of rational exponents follows from extending the properties of
integer exponents to those values, allowing for a notation for radicals in terms of rational exponents. For example, we define 51/3 to be the cube root of 5 because we want (51/3)3 = 5(1/3) x 3 to hold, so (51/3)3 must equal 5.
2. Rewrite expressions involving radicals and rational exponents using the properties of exponents. Use properties of rational and irrational numbers. 3. Explain why the sum or product of rational numbers is rational; that the sum of a rational number and an
irrational number is irrational; and that the product of a nonzero rational number and an irrational number is irrational.
The Complex Number System N.CN Perform arithmetic operations with complex numbers. 1. Know there is a complex number i such that i2 = −1, and every complex number has the form a + bi with a and
b real. 2. Use the relation i2 = –1 and the commutative, associative, and distributive properties to add, subtract, and
multiply complex numbers. Use complex numbers in polynomial identities and equations. 7. Solve quadratic equations with real coefficients that have complex solutions. 8. (+) Extend polynomial identities to the complex numbers. For example, rewrite x2 + 4 as (x + 2i)(x – 2i). 9. (+) Know the Fundamental Theorem of Algebra; show that it is true for quadratic polynomials. Algebra Seeing Structure in Expressions A.SSE Interpret the structure of expressions. 1. Interpret expressions that represent a quantity in terms of its context.*
a. Interpret parts of an expression, such as terms, factors, and coefficients.* b. Interpret complicated expressions by viewing one or more of their parts as a single entity. For example,
interpret P(1+r)^n as the product of P and a factor not depending on P.* 2. Use the structure of an expression to identify ways to rewrite it. For example, see x4 – y4 as (x2)2 – (y2)2, thus
recognizing it as a difference of squares that can be factored as (x2 – y2)(x2 + y2). Write expressions in equivalent forms to solve problems. 3. Choose and produce an equivalent form of an expression to reveal and explain properties of the quantity
represented by the expression.* a. Factor a quadratic expression to reveal the zeros of the function it defines.* b. Complete the square in a quadratic expression to reveal the maximum or minimum value of the function
it defines.* c. Use the properties of exponents to transform expressions for exponential functions. For example the
expression 1.15t can be rewritten as [1.15(1/12)](12t) ≈ 1.012(12t) to reveal the approximate equivalent monthly interest rate if the annual rate is 15%.*
Arithmetic with Polynomials and Rational Expressions A.APR Perform arithmetic operations on polynomials. 1. Understand that polynomials form a system analogous to the integers, namely, they are closed under the
operations of addition, subtraction, and multiplication; add, subtract, and multiply polynomials. Creating Equations A.CED Create equations that describe numbers or relationship. 1. Create equations and inequalities in one variable and use them to solve problems. Include equations arising
from linear and quadratic functions, and simple rational and exponential functions.* 2. Create equations in two or more variables to represent relationships between quantities; graph equations on
coordinate axes with labels and scales.*
34 October 2010
3. Represent constraints by equations or inequalities, and by systems of equations and/or inequalities, and interpret solutions as viable or non-viable options in a modeling context. For example, represent inequalities describing nutritional and cost constraints on combinations of different foods.*
4. Rearrange formulas to highlight a quantity of interest, using the same reasoning as in solving equations. For example, rearrange Ohm’s law V = IR to highlight resistance R.*
Reasoning with Equations and Inequalities A.REI Solve equations and inequalities in one variable. 4. Solve quadratic equations in one variable.
a. Use the method of completing the square to transform any quadratic equation in x into an equation of the form (x – p)2 = q that has the same solutions. Derive the quadratic formula from this form.
b. Solve quadratic equations by inspection (e.g., for x2 = 49), taking square roots, completing the square, the quadratic formula and factoring, as appropriate to the initial form of the equation. Recognize when the quadratic formula gives complex solutions and write them as a ± bi for real numbers a and b.
MA.9-12.A.REI.4c Demonstrate an understanding of the equivalence of factoring, completing the square, or using the quadratic formula to solve quadratic equations.
Solve systems of equations. 7. Solve a simple system consisting of a linear equation and a quadratic equation in two variables algebraically
and graphically. For example, find the points of intersection between the line y = –3x and the circle x2 + y2 = 3.
Functions Interpreting Functions F.IF Interpret functions that arise in applications in terms of the context. 4. For a function that models a relationship between two quantities, interpret key features of graphs and tables in
terms of the quantities, and sketch graphs showing key features given a verbal description of the relationship. Key features include: intercepts; intervals where the function is increasing, decreasing, positive, or negative; relative maximums and minimums; symmetries; end behavior; and periodicity.*
5. Relate the domain of a function to its graph and, where applicable, to the quantitative relationship it describes. For example, if the function h(n) gives the number of person-hours it takes to assemble n engines in a factory, then the positive integers would be an appropriate domain for the function.*
6. Calculate and interpret the average rate of change of a function (presented symbolically or as a table) over a specified interval. Estimate the rate of change from a graph.*
Analyze functions using different representations. 7. Graph functions expressed symbolically and show key features of the graph, by hand in simple cases and
using technology for more complicated cases.* a. Graph linear and quadratic functions and show intercepts, maxima, and minima.* b. Graph square root, cube root, and piecewise-defined functions, including step functions and absolute
value functions.* 8. Write a function defined by an expression in different but equivalent forms to reveal and explain different
properties of the function. a. Use the process of factoring and completing the square in a quadratic function to show zeros, extreme
values, and symmetry of the graph, and interpret these in terms of a context. b. Use the properties of exponents to interpret expressions for exponential functions. For example, identify
percent rate of change in functions such as y = (1.02)t, y = (0.97)t, y = (1.01)(12t), y = (1.2)(t/10), and classify them as representing exponential growth and decay.
MA.F.IF.8c Translate between different representations of functions and relations: graphs, equations, point sets, and tables.
9. Compare properties of two functions each represented in a different way (algebraically, graphically, numerically in tables, or by verbal descriptions). For example, given a graph of one quadratic function and an algebraic expression for another, say which has the larger maximum.
MA.F.IF.10 Given algebraic, numeric, and/or graphical representations of functions, recognize functions as polynomial, rational, logarithmic, exponential or trigonometric.
35 October 2010
Building Functions F.BF Build a function that models a relationship between two quantities. 1. Write a function that describes a relationship between two quantities.*
a. Determine an explicit expression, a recursive process, or steps for calculation from a context. b. Combine standard function types using arithmetic operations. For example, build a function that models
the temperature of a cooling body by adding a constant function to a decaying exponential, and relate these functions to the model.
c. (+) Compose functions. For example, if T(y) is the temperature in the atmosphere as a function of height, and h(t) is the height of a weather balloon as a function of time, then T(h(t)) is the temperature at the location of the weather balloon as a function of time.
Build new functions from existing functions. 3. Identify the effect on the graph of replacing f(x) by f(x) + k, k f(x), f(kx), and f(x + k) for specific values of k
(both positive and negative); find the value of k given the graphs. Experiment with cases and illustrate an explanation of the effects on the graph using technology. Include recognizing even and odd functions from their graphs and algebraic expressions for them.
4. Find inverse functions. a. Solve an equation of the form f(x) = c for a simple function f that has an inverse and write an expression
for the inverse. For example, f(x) =2(x3) or f(x) = (x+1)/(x-1) for x ≠ 1 (x not equal to 1). Linear, Quadratic, and Exponential Models F.LE Construct and compare linear, quadratic, and exponential models and solve problems. 3. Observe using graphs and tables that a quantity increasing exponentially eventually exceeds a quantity
increasing linearly, quadratically, or (more generally) as a polynomial function.* Trigonometric Functions F.TF Prove and apply trigonometric identities. 8. Prove the Pythagorean identity (sin A)2 + (cos A)2 = 1 and use it to find sin A, cos A, or tan A, given sin A, cos
A, or tan A, and the quadrant of the angle. Geometry Congruence G.CO Prove geometric theorems. 9. Prove theorems about lines and angles. Theorems include: vertical angles are congruent; when a transversal
crosses parallel lines, alternate interior angles are congruent and corresponding angles are congruent; points on a perpendicular bisector of a line segment are exactly those equidistant from the segment’s endpoints.
10. Prove theorems about triangles. Theorems include: measures of interior angles of a triangle sum to 180 degrees; base angles of isosceles triangles are congruent; the segment joining midpoints of two sides of a triangle is parallel to the third side and half the length; the medians of a triangle meet at a point.
11. Prove theorems about parallelograms. Theorems include: opposite sides are congruent, opposite angles are congruent, the diagonals of a parallelogram bisect each other, and conversely, rectangles are parallelograms with congruent diagonals.
Similarity, right Triangles, and Trigonometry G.SRT Understand similarity in terms of similarity transformations 1. Verify experimentally the properties of dilations given by a center and a scale factor:
a. A dilation takes a line not passing through the center of the dilation to a parallel line, and leaves a line passing through the center unchanged.
b. The dilation of a line segment is longer or shorter in the ratio given by the scale factor. 2. Given two figures, use the definition of similarity in terms of similarity transformations to decide if they are
similar; explain using similarity transformations the meaning of similarity for triangles as the equality of all corresponding pairs of angles and the proportionality of all corresponding pairs of sides.
3. Use the properties of similarity transformations to establish the AA criterion for two triangles to be similar. Prove theorems involving similarity. 4. Prove theorems about triangles. Theorems include: a line parallel to one side of a triangle divides the other
two proportionally, and conversely; the Pythagorean Theorem proved using triangle similarity.
36 October 2010
5. Use congruence and similarity criteria for triangles to solve problems and to prove relationships in geometric figures.
Define trigonometric ratios and solve problems involving right triangles. 6. Understand that by similarity, side ratios in right triangles are properties of the angles in the triangle, leading
to definitions of trigonometric ratios for acute angles. 7. Explain and use the relationship between the sine and cosine of complementary angles. 8. Use trigonometric ratios and the Pythagorean Theorem to solve right triangles in applied problems. Circles G.C Understand and apply theorems about circles. 1. Prove that all circles are similar. 2. Identify and describe relationships among inscribed angles, radii, and chords. Include the relationship between
central, inscribed, and circumscribed angles; inscribed angles on a diameter are right angles; the radius of a circle is perpendicular to the tangent where the radius intersects the circle.
3. Construct the inscribed and circumscribed circles of a triangle, and prove properties of angles for a quadrilateral inscribed in a circle. MA.9-12-G.C.3a Derive the formula for the relationship between the number of sides and the sums of the
interior and the sums of the exterior angles of polygons and apply to the solutions of mathematical and contextual problems.
4. (+) Construct a tangent line from a point outside a given circle to the circle. Find arc lengths and areas of sectors of circles. 5. Derive using similarity the fact that the length of the arc intercepted by an angle is proportional to the radius,
and define the radian measure of the angle as the constant of proportionality; derive the formula for the area of a sector.
Expressing Geometric Properties with Equations G.GPE Translate between the geometric description and the equation for a conic section. 1. Derive the equation of a circle of given center and radius using the Pythagorean Theorem; complete the square
to find the center and radius of a circle given by an equation. 2. Derive the equation of a parabola given a focus and directrix. Use coordinates to prove simple geometric theorems algebraically. 4. For example, prove or disprove that a figure defined by four given points in the coordinate plane is a
rectangle; prove or disprove that the point (1, √3) lies on the circle centered at the origin and containing the point (0, 2).
6. Find the point on a directed line segment between two given points that partitions the segment in a given ratio. Geometric Measurement with Dimension G.GMD Explain volume formulas and use them to solve problems. 1. Give an informal argument for the formulas for the circumference of a circle, area of a circle, volume of a
cylinder, pyramid, and cone. Use dissection arguments, Cavalieri’s principle, and informal limit arguments. 3. Use volume formulas for cylinders, pyramids, cones, and spheres to solve problems.* Statistics and Probability Conditional Probability and the Rules of Probability S.CP Understand independence and conditional probability and use them to interpret data 1. Describe events as subsets of a sample space (the set of outcomes) using characteristics (or categories) of the
outcomes, or as unions, intersections, or complements of other events (“or,” “and,” “not”).* 2. Understand that two events A and B are independent if the probability of A and B occurring together is the
product of their probabilities, and use this characterization to determine if they are independent.* 3. Understand the conditional probability of A given B as P(A and B)/P(B), and interpret independence of A and
B as saying that the conditional probability of A given B is the same as the probability of A, and the conditional probability of B given A is the same as the probability of B.*
4. Construct and interpret two-way frequency tables of data when two categories are associated with each object being classified. Use the two-way table as a sample space to decide if events are independent and to approximate conditional probabilities. For example, collect data from a random sample of students in your
37 October 2010
school on their favorite subject among math, science, and English. Estimate the probability that a randomly selected student from your school will favor science given that the student is in tenth grade. Do the same for other subjects and compare the results.*
5. Recognize and explain the concepts of conditional probability and independence in everyday language and everyday situations. For example, compare the chance of having lung cancer if you are a smoker with the chance of being a smoker if you have lung cancer.*
Use the rules of probability to compute probabilities of compound events in a uniform probability model. 6. Find the conditional probability of A given B as the fraction of B’s outcomes that also belong to A, and
interpret the answer in terms of the model.* 7. Apply the Addition Rule, P(A or B) = P(A) + P(B) – P(A and B), and interpret the answer in terms of the
model.* 8. (+) Apply the general Multiplication Rule in a uniform probability model, P(A and B) = [P(A)]x[P(B|A)]
=[P(B)]x[P(A|B)], and interpret the answer in terms of the model.* 9. (+) Use permutations and combinations to compute probabilities of compound events and solve problems.*
38 October 2010
Integrated Pathway: Mathematics III21
It is in Mathematics III that students pull together and apply the accumulation of learning that they have from their previous courses, with content grouped into four critical areas. They apply methods from probability and statistics to draw inferences and conclusions from data. Students expand their repertoire of functions to include polynomial, rational, and radical functions
22
. They expand their study of right triangle trigonometry to include general triangles. And, finally, students bring together all of their experience with functions and geometry to create models and solve contextual problems. The Mathematical Practice Standards apply throughout each course and, together with the content standards, prescribe that students experience mathematics as a coherent, useful, and logical subject that makes use of their ability to make sense of problem situations.
Critical Area 1: Students see how the visual displays and summary statistics they learned in earlier grades relate to different types of data and to probability distributions. They identify different ways of collecting data— including sample surveys, experiments, and simulations—and the role that randomness and careful design play in the conclusions that can be drawn. Critical Area 2: The structural similarities between the system of polynomials and the system of integers are developed. Students draw on analogies between polynomial arithmetic and base-ten computation, focusing on properties of operations, particularly the distributive property. Students connect multiplication of polynomials with multiplication of multi-digit integers, and division of polynomials with long division of integers. Students identify zeros of polynomials and make connections between zeros of polynomials and solutions of polynomial equations. Rational numbers extend the arithmetic of integers by allowing division by all numbers except 0. Similarly, rational expressions extend the arithmetic of polynomials by allowing division by all polynomials except the zero polynomial. A central theme is that the arithmetic of rational expressions is governed by the same rules as the arithmetic of rational numbers. This critical area also includes and exploration of the Fundamental Theorem of Algebra Critical Area 3: Students develop the Laws of Sines and Cosines in order to find missing measures of general (not necessarily right) triangles. They are able to distinguish whether three given measures (angles or sides) define 0, 1, 2, or infinitely many triangles. This discussion of general triangles open up the idea of trigonometry applied beyond the right triangle—that is, at least to obtuse angles. Students build on this idea to develop the notion of radian measure for angles and extend the domain of the trigonometric functions to all real numbers. They apply this knowledge to model simple periodic phenomena. Critical Area 4: Students synthesize and generalize what they have learned about a variety of function families. They extend their work with exponential functions to include solving exponential equations with logarithms. They explore the effects of transformations on graphs of diverse functions, including functions arising in an application, in order to abstract the general principle that transformations on a graph always have the same effect regardless of the type of the underlying functions. They identify appropriate types of functions to model a situation, they adjust parameters to improve the model, and they compare models by analyzing appropriateness of fit and making judgments about the domain over which a model is a good fit. The description of modeling as “the process of choosing and using mathematics and statistics to analyze empirical situations, to understand them better, and to make decisions” is at the heart of this unit. The narrative discussion and diagram of the modeling cycle should be considered when knowledge of functions, statistics, and geometry is applied in a modeling context.
21 Adapted from Appendix A: Designing High School Mathematics Course Based on the Common Core State Standards, http://www.corestandards.org/the-standards 22 In this course, rational functions are limited to those whose numerators are of degree at most 1 and denominators are of degree at most 2; radical functions are limited to square roots or cube roots of at most quadratic polynomials.
39 October 2010
Overview Mathematics III Number and Quantity
The Complex Number System • Use complex numbers in polynomial
identities and equations Algebra
Seeing Structure in Expressions • Interpret the structure or expressions • Write expressions in equivalent forms to
solve problems Arithmetic with Polynomials and Rational Expressions
• Perform arithmetic operations on polynomials • Understand the relationship between zeros and factors of
polynomials • Use polynomial identities to solve problems • Rewrite rational expressions
Creating Equations • Create equations that describe numbers of relationships
Reasoning with Equations and Inequalities • Understand solving equations as a process of reasoning
and explain the reasoning • Represent and solve equations and inequalities
graphically Functions
Interpreting Functions • Interpret functions that arise in applications
in terms of a context • Analyze functions using different
representations Building Functions
• Build a function that models a relationship between two quantities
• Build new functions from existing functions Linear, Quadratic, and Exponential Models
• Construct and compare linear, quadratic, and exponential models and solve problems
Trigonometric Functions • Extend the domain of trigonometric
functions using the unit circle • Model periodic phenomena with
trigonometric functions Geometry
Similarity, Right Triangles, and Trigonometry • Apply trigonometry to right triangles
Geometric Measurement and Dimension • Visualize the relationship between two- and
three- dimensional objects Modeling with Geometry
• Apply Geometric concepts in modeling situations
Mathematical Practices 1. Make sense of problems and
persevere in solving them. 2. Reason abstractly and quantitatively. 3. Construct viable arguments and
critique the reasoning of others. 4. Model with mathematics. 5. Use appropriate tools strategically. 6. Attend to precision. 7. Look for and make use of structure. 8. Look for and express regularity in
repeated reasoning.
40 October 2010
Statistics and Probability
Interpreting Categorical and Quantitative Data • Summarize, represent, and interpret data on
a single or measurement variable Making Inferences and Justifying Conclusions
• Understand and evaluate random processes underlying statistical experiments
• Make inferences and justify conclusions from sample surveys experiments and observational studies.
Using Probability to Make Decisions • Use probabilities to evaluate outcomes
of decisions
41 October 2010
Number and Quantity The Complex Number System N.CN Use complex numbers in polynomial identities and equations. 8. (+) Extend polynomial identities to the complex numbers. For example, rewrite x^2 + 4 as (x + 2i)(x – 2i). 9. (+) Know the Fundamental Theorem of Algebra; show that it is true for quadratic polynomials. Algebra Seeing Structure in Expressions A.SSE Interpret the structure of expressions. 1. Interpret expressions that represent a quantity in terms of its context.*
a. Interpret parts of an expression, such as terms, factors, and coefficients.* b. Interpret complicated expressions by viewing one or more of their parts as a single entity. For example,
interpret P(1+r)n as the product of P and a factor not depending on P.* 2. Use the structure of an expression to identify ways to rewrite it. For example, see x4 – y4 as (x2)2 – (y2)2, thus
recognizing it as a difference of squares that can be factored as (x2 – y2)(x2 + y2). Write expressions in equivalent forms to solve problems. 4. Derive the formula for the sum of a finite geometric series (when the common ration is not 1), and use the
formula to solve problems. For example, calculate mortgage payments. Arithmetic with Polynomials and Rational Expressions A.APR Perform arithmetic operations on polynomials. 1. Understand that polynomials form a system analogous to the integers, namely, they are closed under the
operations of addition, subtraction, and multiplication; add, subtract, and multiply polynomials. 2. Understand the relationship between zeros and factors of polynomial. Know and apply the Remainder
Theorem: For a polynomial p(x) and a number a, the remainder on division by x – a is p(a), so p(a) = 0 if and only if (x – a) is a factor of p(x).
3. Understand the relationship between zeros and factors of polynomials. Identify zeros of polynomials when suitable factorizations are available, and use the zeros to construct a rough graph of the function defined by the polynomial.
Use polynomial identities to solve problems. 4. Prove polynomial identities and use them to describe numerical relationships. For example, the polynomial
identity (x2 + y2)2 = (x2 – y2)2 + (2xy)2 can be used to generate Pythagorean triples. 5. (+) Know and apply that the Binomial Theorem gives the expansion of (x + y)n in powers of x and y for a
positive integer n, where x and y are any numbers, with coefficients determined for example by Pascal’s Triangle. (The Binomial Theorem can be proved by mathematical induction or by a combinatorial argument.)
Rewrite rational expressions. 6. Rewrite simple rational expressions in different forms; write a(x)/b(x) in the form q(x) + r(x)/b(x), where a(x),
b(x), q(x), and r(x) are polynomials with the degree of r(x) less than the degree of b(x), using inspection, long division, or, for the more complicated examples, a computer algebra system.
7. (+) Understand that rational expressions form a system analogous to the rational numbers, closed under addition, subtraction, multiplication, and division by a nonzero rational expression; add, subtract, multiply, and divide rational expressions.
Creating Equations A.CED Create equations that describe numbers or relationship. 1. Create equations and inequalities in one variable and use them to solve problems. Include equations arising
from linear and quadratic functions, and simple rational and exponential functions.* 2. Create equations in two or more variables to represent relationships between quantities; graph equations on
coordinate axes with labels and scales.* 3. Represent constraints by equations or inequalities, and by systems of equations and/or inequalities, and
interpret solutions as viable or non-viable options in a modeling context. For example, represent inequalities describing nutritional and cost constraints on combinations of different foods.*
4. Rearrange formulas to highlight a quantity of interest, using the same reasoning as in solving equations. For example, rearrange Ohm’s law V = IR to highlight resistance R.*
Reasoning with Equations and Inequalities A.REI
42 October 2010
Understand solving equations as a process of reasoning and explain the reasoning. 2. Solve simple rational and radical equations in one variable, and give examples showing how extraneous
solutions may arise. Represent and solve equations and inequalities graphically. 11. Explain why the x-coordinates of the points where the graphs of the equations y = f(x) and y = g(x) intersect
are the solutions of the equation f(x) = g(x); find the solutions approximately, e.g., using technology to graph the functions, make tables of values, or find successive approximations. Include cases where f(x) and/or g(x) are linear, polynomial, rational, absolute value, exponential, and logarithmic functions.*
Functions Interpreting Functions F.IF Interpret functions that arise in applications in terms of the context. 4. For a function that models a relationship between two quantities, interpret key features of graphs and tables in
terms of the quantities, and sketch graphs showing key features given a verbal description of the relationship. Key features include: intercepts; intervals where the function is increasing, decreasing, positive, or negative; relative maximums and minimums; symmetries; end behavior; and periodicity.*
5. Relate the domain of a function to its graph and, where applicable, to the quantitative relationship it describes. For example, if the function h(n) gives the number of person-hours it takes to assemble n engines in a factory, then the positive integers would be an appropriate domain for the function.*
6. Calculate and interpret the average rate of change of a function (presented symbolically or as a table) over a specified interval. Estimate the rate of change from a graph.*
Analyze functions using different representations. 7. Graph functions expressed symbolically and show key features of the graph, by hand in simple cases and using
technology for more complicated cases.* b. Graph square root, cube root, and piecewise-defined functions, including step functions and absolute
value functions.* c. Graph polynomial functions, identifying zeros when suitable factorizations are available, and showing
end behavior.* e. Graph exponential and logarithmic functions, showing intercepts and end behavior, and trigonometric
functions, showing period, midline, and amplitude.* 8. Write a function defined by an expression in different but equivalent forms to reveal and explain different
properties of the function. a. Use the process of factoring and completing the square in a quadratic function to show zeros, extreme
values, and symmetry of the graph, and interpret these in terms of a context. b. Use the properties of exponents to interpret expressions for exponential functions. For example, identify
percent rate of change in functions such as y = (1.02)^t, y = (0.97)^t, y = (1.01)^(12t), y = (1.2)^(t/10), and classify them as representing exponential growth and decay.
9. Compare properties of two functions each represented in a different way (algebraically, graphically, numerically in tables, or by verbal descriptions). For example, given a graph of one quadratic function and an algebraic expression for another, say which has the larger maximum.
Building Functions F.BF Build a function that models a relationship between two quantities. 1. Write a function that describes a relationship between two quantities.*
b. Combine standard function types using arithmetic operations. For example, build a function that models the temperature of a cooling body by adding a constant function to a decaying exponential, and relate these functions to the model.
Build new functions from existing functions. 3. Identify the effect on the graph of replacing f(x) by f(x) + k, k f(x), f(kx), and f(x + k) for specific values of k
(both positive and negative); find the value of k given the graphs. Experiment with cases and illustrate an explanation of the effects on the graph using technology. Include recognizing even and odd functions from their graphs and algebraic expressions for them.
4. Find inverse functions. a. Solve an equation of the form f(x) = c for a simple function f that has an inverse and write an expression
for the inverse. For example, f(x) =2(x^3) or f(x) = (x+1)/(x-1) for x ≠ 1 (x not equal to 1).
43 October 2010
Linear, Quadratic, and Exponential Models F.LE Construct and compare linear, quadratic, and exponential models and solve problems. 4. For exponential models, express as a logarithm the solution to ab^(ct) = d where a, c, and d are numbers and
the base b is 2, 10, or e; evaluate the logarithm using technology.* Trigonometric Functions F.TF Extend the domain of trigonometric functions using the unit circle. 1. Understand radian measure of an angle as the length of the arc on the unit circle subtended by the angle. 2. Explain how the unit circle in the coordinate plane enables the extension of trigonometric functions to all real
numbers, interpreted as radian measures of angles traversed counterclockwise around the unit circle. Model periodic phenomena with trigonometric functions. 5. Choose trigonometric functions to model periodic phenomena with specified amplitude, frequency, and
midline.* Geometry Similarity, Right Triangles, and Trigonometry G.SRT Apply trigonometry to general triangles. 9. (+) Derive the formula A = (1/2)ab sin(C) for the area of a triangle by drawing an auxiliary line from a vertex
perpendicular to the opposite side. 10. (+) Prove the Laws of Sines and Cosines and use them to solve problems. 11. (+) Apply trigonometry to general triangles. Understand and apply the Law of Sines and the Law of Cosines to
find unknown measurements in right and non-right triangles (e.g., surveying problems, resultant forces). Geometric Measurement and Dimension G.GMD Visualize relationships between two-dimensional and three-dimensional objects. 4. Identify the shapes of two-dimensional cross-sections of three-dimensional objects, and identify three-
dimensional objects generated by rotations of two-dimensional objects. Modeling with Geometry G.MG Apply geometric concepts in modeling situations. 1. Use geometric shapes, their measures, and their properties to describe objects (e.g., modeling a tree trunk or a
human torso as a cylinder).* 2. Apply concepts of density based on area and volume in modeling situations (e.g., persons per square mile,
BTUs per cubic foot).* 3. Apply geometric methods to solve design problems (e.g., designing an object or structure to satisfy physical
constraints or minimize cost; working with typographic grid systems based on ratios).* MA.9-12.G.MG.4 Use dimensional analysis for unit conversion to confirm that expressions and equations make
sense.* Statistics and Probability Interpreting Categorical and Quantitative Data S.ID Summarize, represent, and interpret data on a single count or measurement variable. 4. Use the mean and standard deviation of a data set to fit it to a normal distribution and to estimate population
percentages. Recognize that there are data sets for which such a procedure is not appropriate. Use calculators, spreadsheets, and tables to estimate areas under the normal curve.*
Making Inferences and Justifying Conclusions S.IC Understand and evaluate random processes underlying statistical experiments. 1. Understand statistics as a process for making inferences about population parameters based on a random
sample from that population.* 2. Decide if a specified model is consistent with results from a given data-generating process, e.g., using
simulation. For example, a model says a spinning coin falls heads up with probability 0. 5. Would a result of 5 tails in a row cause you to question the model?*
Make inferences and justify conclusions from sample surveys, experiments, and observational studies. 3. Recognize the purposes of and differences among sample surveys, experiments, and observational studies;
explain how randomization relates to each.*

44 October 2010
4. Use data from a sample survey to estimate a population mean or proportion; develop a margin of error through the use of simulation models for random sampling.*
5. Use data from a randomized experiment to compare two treatments; use simulations to decide if differences between parameters are significant.*
6. Evaluate reports based on data.* Using Probability to Make Decisions S.MD Use probability to evaluate outcomes of decisions 6. (+) Use probabilities to make fair decisions (e.g., drawing by lots, using a random number generator).* 7. (+) Analyze decisions and strategies using probability concepts (e.g., product testing, medical testing, pulling a
hockey goalie at the end of a game).*
45 October 2010
Precalculus Precalculus combines the trigonometric, geometric, and algebraic techniques needed to prepare students for the study of calculus and strengthens their conceptual understanding of problems and mathematical reasoning in solving problems. Facility with these topics is especially important for students intending to study calculus, physics and other sciences, and engineering in college. As with the other courses, the Mathematical Practice Standards apply throughout this course, and together with the content standards, prescribe that students experience mathematics as a coherent, useful, and logical subject that makes use of their ability to make sense of problem situations.
Critical Area 1: Students continue their work with complex numbers. They perform arithmetic operations with complex numbers and represent them and the operations on the complex plane. The student will investigate and identify the characteristics of the graphs of polar equations, using graphing utilities. This will include classification of polar equations, the effects of changes in the parameters in polar equations, conversion of complex numbers from rectangular form to polar form and vice versa, and the intersection of the graphs of polar equations. Critical Area 2: Students expand their understanding of functions to include logarithmic and trigonometric functions. The student will investigate and identify the characteristics of exponential and logarithmic functions in order to graph these functions and solve equations and practical problems. This will include the role of e, natural and common logarithms, laws of exponents and logarithms, and the solution of logarithmic and exponential equations. They model periodic phenomena with trigonometric functions and prove trigonometric identities. Other trigonometric topics include reviewing unit circle trigonometry, proving trigonometric identities, solving trigonometric equations and graphing trigonometric functions.
Critical Area 3: Student will investigate and identify the characteristics of polynomial and rational functions and use these to sketch the graphs of the functions. They will determine zeros, upper and lower bounds, y-intercepts, symmetry, asymptotes, intervals for which the function is increasing or decreasing, and maximum or minimum points. Students translate between the geometric description and equation of conic sections. They deepen their understanding of the Fundamental Theorem of Algebra. Critical Area 4: The student will perform operations with vectors in the coordinate plane and solve practical problems using vectors. This will include the following topics: operations of addition, subtraction, scalar multiplication, and inner (dot) product; norm of a vector; unit vector; graphing; properties; simple proofs; complex numbers (as vectors); and perpendicular components.
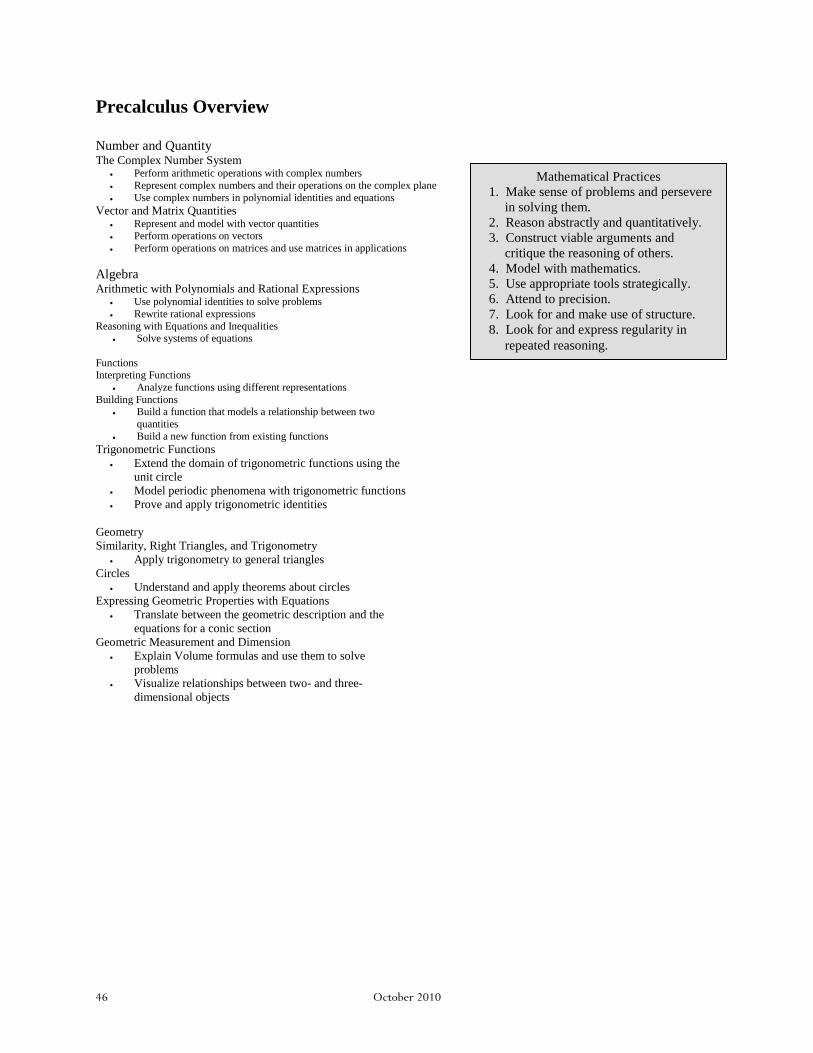
46 October 2010
Precalculus Overview Number and Quantity The Complex Number System
• Perform arithmetic operations with complex numbers • Represent complex numbers and their operations on the complex plane • Use complex numbers in polynomial identities and equations
Vector and Matrix Quantities • Represent and model with vector quantities • Perform operations on vectors • Perform operations on matrices and use matrices in applications
Algebra Arithmetic with Polynomials and Rational Expressions
• Use polynomial identities to solve problems • Rewrite rational expressions
Reasoning with Equations and Inequalities • Solve systems of equations
Functions Interpreting Functions
• Analyze functions using different representations Building Functions
• Build a function that models a relationship between two quantities
• Build a new function from existing functions Trigonometric Functions
• Extend the domain of trigonometric functions using the unit circle
• Model periodic phenomena with trigonometric functions • Prove and apply trigonometric identities
Geometry Similarity, Right Triangles, and Trigonometry
• Apply trigonometry to general triangles Circles
• Understand and apply theorems about circles Expressing Geometric Properties with Equations
• Translate between the geometric description and the equations for a conic section
Geometric Measurement and Dimension • Explain Volume formulas and use them to solve
problems • Visualize relationships between two- and three-
dimensional objects
Mathematical Practices 1. Make sense of problems and persevere
in solving them. 2. Reason abstractly and quantitatively. 3. Construct viable arguments and
critique the reasoning of others. 4. Model with mathematics. 5. Use appropriate tools strategically. 6. Attend to precision. 7. Look for and make use of structure. 8. Look for and express regularity in
repeated reasoning.
47 October 2010
Number and Quantity The Complex Number System N.CN Perform arithmetic operations with complex numbers. 3. (+) Find the conjugate of a complex number; use conjugates to find moduli and quotients of complex numbers. Represent complex numbers and their operations on the complex plane. 4. (+) Represent complex numbers on the complex plane in rectangular and polar form (including real and
imaginary numbers), and explain why the rectangular and polar forms of a given complex numbers represent the same number.
5. (+) Represent addition, subtraction, multiplication, and conjugation of complex numbers geometrically on the complex plane; use properties of this representation for computation. For example, ( ) 831
3=− i has modulus 2
and argument 120o. 6. (+) Calculate the distance between numbers in the complex plane as the modulus of the difference, and the
midpoint of a segment as the average of the numbers at its endpoints. Use complex numbers in polynomial identities and equations 8. (+) Extend polynomial identities to the complex numbers. For example, rewrite x2 + 4 as (x + 2i)(x – 2i). 9. (+) Know the Fundamental Theorem of Algebra; show that it is true for quadratic polynomials. Vector Quantities and Matrices N.VM Represent and model with vector quantities. 1. (+) Recognize vector quantities as having both magnitude and direction. Represent vector quantities by directed
line segments, and use appropriate symbols for vectors and their magnitudes (e.g., v, |v|, ||v||, v). 2. (+) Find the components of a vector by subtracting the coordinates of an initial point from the coordinates of a
terminal point. 3. (+) Solve problems involving velocity and the other quantities that can be represented by vectors. Perform operations on vectors. 4. (+) Add and subtract vectors.
a. (+) Add vectors end-to-end, component-wise, and by the parallelogram rule. Understand that the magnitude of a sum of two vectors is typically no the sum of the magnitudes.
b. (+) Given two vectors in magnitude and direction form, determine the magnitude and direction of their sum. c. (+) Understand vector subtraction v – w as v + (–w), where (–w) is the additive inverse of w, with the same
magnitude as w and pointing in the opposite direction. Represent vector subtraction graphically by connecting the tips in the appropriate order, and perform vector subtraction component-wise.
5. (+) Multiply a vector by a scalar. a. (+) Represent scalar multiplication graphically by scaling vectors and possibly reversing their direction;
perform scalar vectors and possibly reversing their direction; perform scalar multiplication component-wise, e.g., as c(vx,vy) = (cvx, cvy).
b. (+) Compute the magnitude of a scalar multiple cv using ||cv|| = |c|v. Compute the direction of cv knowing that when |c|v ≠ 0, the direction of cv is either along v (for c > 0) or against v (for c < 0).
Perform operations on matrices and use matrices in applications. 6. (+) Use matrices to represent and manipulate data, e.g., to represent payoffs or incidence relationships in a
network. 7. (+) Multiply matrices by scalars to produce new matrices, e.g., as when all of the payoffs in a game are doubled. 8. (+) Add, subtract, and multiply matrices of appropriate dimensions. 9. (+) Understand that, unlike multiplication of numbers, matrix multiplication for square matrices is not a
commutative operation, but still satisfies the associative and distributive properties. 10. (+) Understand that the zero and identity matrices play a role in matrix addition and multiplication similar to the
role of 0 and 1 in the real numbers. The determinant of a square matrix is nonzero if and only if the matrix has a multiplicative inverse.
11. (+) Multiply a vector (regarded as a matrix with one column) by a matrix of suitable dimensions to produce another vector. Work with matrices as transformations of vectors.
12. (+) Work with 2 x 2 matrices as transformations of the plane, and interpret the absolute value of the determinate in terms of area.
48 October 2010
Algebra Arithmetic with polynomials and rational expressions A.APR Use polynomial identities to solve problems 5. (+) Know and apply the Binomial Theorem for the expansion of (x + y)n in powers of x and y for a positive
integer n, where x and y are any numbers, with coefficients determined, for example, by Pascal’s Triangle.23
Rewrite rational expressions
6. Rewrite simple rational expressions in different forms; write a(x)/b(x) in the form q(x) + r(x)/b(x), where a(x), b(x), q(x), and r(x) are polynomials with the degree of r(x) less than the degree of b(x), using inspection, long division, or, for the more complicated examples, a computer algebra system.
7. (+) Understand that rational expressions form a system analogous to the rational numbers, closed under addition, subtraction, multiplication, and division by a nonzero rational expression; add, subtract, multiply, and divide rational expressions.
Reasoning with Equations and Inequalities A.REI Solve systems of equations 8. (+) Represent a system of linear equations as a single matrix equation in a vector variable. 9. (+) Find the inverse of a matrix if it exists and use it to solve systems of linear equations (using technology for
matrices of dimension 3 × 3 or greater). Functions Interpreting Functions F.IF Analyze functions using different representations 7. (+) Graph functions expressed symbolically and show key features of the graph, by hand in simple cases and
using technology for more complicated cases. d. (+) Graph rational functions, identifying zeros when suitable factorizations are available, and showing end
behavior. Building Functions F.BF Build a function that models a relationship between two quantities 1. Write a function that describes a relationship between two quantities.*
c. (+) Compose functions. For example, if T(y) is the temperature in the atmosphere as a function of height, and h(t) is the height of a weather balloon as a function of time, then T(h(t)) is the temperature at the location of the weather balloon as the function of time.
Build new functions from existing functions 4. Find inverse functions.
b. (+) Verify by composition that one function is the inverse of another. c. (+) Read values of an inverse function from a graph or a table, given that the function has an inverse. d. (+) Produce an invertible function from a non-invertible function by restricting the domain.
5. (+) Understand the inverse relationship between exponents and logarithms and use this relationship to solve problems involving logarithms and exponents.
Trigonometric Functions F.TF Extend the domain of trigonometric functions using the unit circle 3. (+) Use special triangles to determine geometrically the values of sine, cosine, tangent for π/3, π/4 and π/6, and
use the unit circle to express the values of sine, cosines, and tangent for x, π+x, and 2π-x in terms of their values for x, where x is any real number.
4. (+) Use the unit circle to explain symmetry (odd and even) and periodicity of trigonometric functions. Model periodic phenomena with trigonometric functions 6. (+) Understand that restricting a trigonometric function to a domain on which it is always increasing or always
decreasing allows its inverse to be constructed. 7. (+) Use inverse functions to solve trigonometric equations that arise in modeling contexts; evaluate the solutions
using technology, and interpret them in terms of the context. Prove and apply trigonometric identities 9. (+) Prove the addition and subtraction formulas for sine, cosine, and tangent and use them to solve problems. 23 The Binomial Theorem can be proved by mathematical induction or by a combinatorial argument.
49 October 2010
Geometry Similarity, right triangles, and trigonometry G.SRT Apply trigonometry to general triangles 9. (+) Derive the formula A = ½ ab sin(C) for the area of a triangle by drawing an auxiliary line form a vertex
perpendicular to the opposite side. 10. (+) prove the Laws of Sines and Cosines and use them to solve problems. 11. (+) Understand and apply the Laws of Sines and Cosines to find unknown measurements in right and non-right
triangles, e.g., surveying problems, resultant forces. Circles G.C Understand and apply theorems about circles 4. (+) Construct a tangent line from a point outside a given circle to the circle. Expressing Geometric Properties with Equations G.GPE Translate between the geometric description and the equation for a conic section 3. (+) Derive the equations of ellipses and hyperbolas given the foci and directrices. Geometric Measurement and Dimension G.GMD Explain volume formulas and use them to solve problems 2. (+) Give an informal argument using Cavalieri’s Principle for the formulas for the volume of a sphere and other
solid figures. Visualize relationships between two-dimensional and three-dimensional objects 4. Identify the shapes of two-dimensional cross-sections of three-dimensional objects, and identify three-
dimensional objects generated by rotations of two-dimensional objects.
50 October 2010
Advanced Quantitative Reasoning Because the standards for this course are (+) standards, students taking Mathematical Modeling and Decision Making will have completed the three courses Algebra I, Geometry and Algebra II in the traditional Pathway, or the three courses Mathematics I, II, and II in the Integrated Pathway. This course is designed as a mathematics course alternative to Precalculus. Students not preparing for Calculus are encouraged to continue their study of mathematical ideas in the context of real-world problems and decision making through the analysis of information, modeling change and mathematical relationships. As with the other courses, the Mathematical Practice Standards apply throughout this course, and together with the content standards, prescribe that students experience mathematics as a coherent, useful, and logical subject that makes use of their ability to make sense of problem situations.
Critical Area 1: Students will learn to become critical consumers of the quantitative data that surround them every day, knowledgeable decision makers who use logical reasoning, and mathematical thinkers who can use their quantitative skills to solve problems related to a wide range of situations. They will link classroom mathematics and statistics to everyday life, work, and decision-making, using mathematical modeling. They will choose and use appropriate mathematics and statistics to analyze empirical situations, to understand them better, and to improve decisions.
Critical Area 2: Through the investigation of mathematical models from real life situations, students will strengthen conceptual understandings in mathematics and further develop connections between algebra and geometry. Students will use geometry to model real-world problems and solutions. They will use the language and symbols of mathematics in representations and communication. Critical Area 3: Students will explore linear algebra concepts of matrices and vectors. They use vectors to model physical relationships to define, model, and solve real-world problems. Students draw, name, label, and describe vectors and perform operations with vectors and relate these components to vector magnitude and direction. They will use matrices in relationship to vectors and to solve problems.
51 October 2010
Advanced Quantitative Reasoning Overview Number and Quantity
Vector and Matrix Quantities • Represent and model with vector quantities • Perform operations on matrices and use matrices in
applications Algebra
Arithmetic with Polynomials and Expressions • Use polynomials to solve problems • Solve systems of equations
Functions
Trigonometric Functions • Extend the domain of trigonometric functions using the unit
circle • Model periodic phenomena with trigonometric functions
Geometry
Similarity, Right Triangles, and Trigonometry • Apply trigonometry to general triangles
Geometric Measurement and Dimension • Explain volume formulas and use them to solve
problems Statistics and Probability
Interpreting Categorical and Quantitative Data • Summarize, represent, and interpret data on two
categorical and quantitative variables • Interpret linear models
Making Inferences and Justifying Conclusions • Make inferences and justify conclusions from
sample surveys, experiments, and observational studies
Conditional Probability and the Rules of Probability • Use the rules of probability to compute
probabilities of compound events in a uniform probability model
• Calculate expected values and use them to solve problems
Mathematical Practices 1. Make sense of problems and persevere
in solving them. 2. Reason abstractly and quantitatively. 3. Construct viable arguments and
critique the reasoning of others. 4. Model with mathematics. 5. Use appropriate tools strategically. 6. Attend to precision. 7. Look for and make use of structure. 8. Look for and express regularity in
repeated reasoning.
52 October 2010
Number and Quantity Vectors and Matrix Quantities N.VM Represent and model with vector quantities 1. (+) Recognize vector quantities as having both magnitude and direction. Represent vector quantities by directed
line segments, and use appropriate symbols for vectors and their magnitudes (e.g., v, |v|, ||v||, v). 2. (+) Find the components of a vector by subtracting the coordinates of an initial point from the coordinates of a
terminal point. 3. (+) Solve problems involving velocity and the other quantities that can be represented by vectors. Perform operations on matrices and use matrices in applications. 6. (+) Use matrices to represent and manipulate data, e.g., to represent payoffs or incidence relationships in a
network. 7. (+) Multiply matrices by scalars to produce new matrices, e.g., as when all of the payoffs in a game are doubled. 8. (+) Add, subtract, and multiply matrices of appropriate dimensions. 9. (+) Understand that, unlike multiplication of numbers, matrix multiplication for square matrices is not a
commutative operation, but still satisfies the associative and distributive properties. 10. (+) Understand that the zero and identity matrices play a role in matrix addition and multiplication similar to the
role of 0 and 1 in the real numbers. The determinant of a square matrix is nonzero if and only if the matrix has a multiplicative inverse.
11. (+) Multiply a vector (regarded as a matrix with one column) by a matrix of suitable dimensions to produce another vector. Work with matrices as transformations of vectors.
12. (+) Work with 2 x 2 matrices as transformations of the plane, and interpret the absolute value of the determinate in terms of area.
Algebra Arithmetic with polynomials and rational expressions A.APR Use polynomial identities to solve problems 5. (+) Know and apply the Binomial Theorem for the expansion of (x + y)n in powers of x and y for a positive
integer n, where x and y are any numbers, with coefficients determined, for example, by Pascal’s Triangle.24
Reasoning with Equations and Inequalities A.REI Solve systems of equations 8. (+) Represent a system of linear equations as a single matrix equation in a vector variable. 9. (+) Find the inverse of a matrix if it exists and use it to solve systems of linear equations (using technology for
matrices of dimension 3 × 3 or greater). Functions Trigonometric Functions F.TF Extend the domain of trigonometric functions using the unit circle 3. (+) Use special triangles to determine geometrically the values of sine, cosine, tangent for π/3, π/4 and π/6, and
use the unit circle to express the values of sine, cosines, and tangent for x, π+x, and 2π-x in terms of their values for x, where x is any real number.
4. (+) Use the unit circle to explain symmetry (odd and even) and periodicity of trigonometric functions. Model periodic phenomena with trigonometric functions 5. Choose trigonometric functions to model periodic phenomena with specified amplitude, frequency, and
midline. 7. (+) Use inverse functions to solve trigonometric equations that arise in modeling contexts; evaluate the solutions
using technology, and interpret them in terms of the context. Prove25
9. (+) Prove the addition and subtraction formulas for sine, cosine, and tangent and use them to solve problems. and apply trigonometric identities
Geometry Similarity, right triangles, and trigonometry G.SRT Apply trigonometry to general triangles
24 The Binomial Theorem can be proved by mathematical induction or by a combinatorial argument. 25 Students should not be required to prove these identities, but should use them to solve problems
53 October 2010
11. (+) Understand and apply the Laws of Sines and Cosines to find unknown measurements in right and non-right triangles, e.g., surveying problems, resultant forces.
Circles G.C Understand and apply theorems about circles 4. (+) Construct a tangent line from a point outside a given circle to the circle. Expressing Geometric Properties with Equations G.GPE Translate between the geometric description and the equation for a conic section 3. (+) Derive the equations of ellipses and hyperbolas given the foci and directrices.
MA.9-12.G.GPE.3a Use equations and graphs of conic sections to model real-world problems. Geometric Measurement and Dimension G.GMD Explain volume formulas and use them to solve problems 2. (+) Give an informal argument using Cavalieri’s Principle for the formulas for the volume of a sphere and other
solid figures. Visualize relationships between two-dimensional and three-dimensional objects 4. Identify the shapes of two-dimensional cross-sections of three-dimensional objects, and identify three-
dimensional objects generated by rotations of two-dimensional objects. Modeling with Geometry G.MG Apply geometric concepts in modeling situations 3. Apply geometric methods to solve design problems (e.g., designing an object or structure to satisfy physical
constraints or minimize cost; working with typographic grid systems based on ratios). MA.9-12.G.MG.4. Use dimensional analysis for unit conversion to confirm that expressions and equations make
sense. Statistics and Probability Interpreting Categorical and Quantitative Data S.ID Interpret linear models 9. Distinguish between correlation and causation Making Inferences and Justifying Conclusions S.IC Make inferences and justify conclusions from sample surveys, experiments, and observational studies. 4. Use data from a sample survey to estimate a population mean or proportion; develop margin of error through
the use of simulation models for random sampling. 5. Use data from a randomized experiment to compare two treatments; sue simulations to decide if differences
between parameters are significant. 6. Evaluate reports based on data. Conditional Probability and the Rules of Probability S.CP Use the rules of probability to compute probabilities of compound events in a uniform probability model. 8. (+) Apply the general Multiplication Rule in a uniform probability model, P(A and B) = P(A) P(BA) = P(B)
P(AB), and interpret the answer in terms of the model. 9. (+) Use permutations and combinations to compute probabilities of compound events and solve problems. Using Probability to Make Decisions S.MD Calculate expected values and use them to solve problems 1. (+) Define a random variable for a quantity of interest by assigning a numerical value to each event in a sample
space; graph the corresponding probability distribution using the same graphical displays as for data distributions.*
2. (+) Calculate the expected value of a random variable; interpret it as the mean of the probability distribution.* 3. (+) Develop a probability distribution for a random variable defined for a sample space in which theoretical
probabilities can be calculated; find the expected value. For example, find the theoretical probability
54 October 2010
distribution for the number of correct answers obtained by guessing on all five questions of a multiple-choice test where each question has four choices, and find the expected grade under various grading schemes.*
4. (+) Develop a probability distribution for a random variable defined for a sample space in which probabilities are assigned empirically; find the expected value. For example, find a current data distribution on the number of TV sets per household in the United States, and calculate the expected number of sets per household. How many TV sets would you expect to find in 100 randomly selected households?*
Use probability to evaluate outcomes of decisions. 5. (+) Weigh the possible outcomes of a decision by assigning probabilities to payoff values and finding expected
values.* a (+) Find the expected payoff for a game of chance. For example, find the expected winnings from a state
lottery ticket or a game at a fast-food restaurant.* b (+) Evaluate and compare strategies on the basis of expected values. For example, compare a high-
deductible versus a low-deductible automobile insurance policy using various, but reasonable, chances of having a minor or a major accident.*
6. (+) Use probabilities to make fair decisions (e.g., drawing by lots, using a random number generator).* 7. (+) Analyze decisions and strategies using probability concepts (e.g., product testing, medical testing, pulling a
hockey goalie at the end of a game).*