Embed Size (px)
Citation preview

Public Company Limited
Opportunity Day
5 March 2014
IRPCWorld
The 4 great business’…
Leading to sustainable success
Disclaimer
This presentation material has been prepared solely for informational purposes only. IRPC is
furnishing it solely for use by prospective investors / analysts in the proposed event. IRPC makes no
representations or warranties as to the accuracy or completeness of such information. By accepting
this material each recipient agrees that IRPC shall not have any liability for any representations
(express or implied) contained in, or for any omissions from this presentation.
The information contained herein does not purport to be all-inclusive or to contain all of the
information that may be material to the recipient’s decision. Each recipient of the information and data
contained herein should perform its own independent investigation and analysis of the transaction
and the creditworthiness of IRPC . Reference in this Disclaimer to this shall include references to the Appendices (if any) hereto.
2

I. IRPC in Brief
II. 2013 Highlights
III. Operation & Financial Performance
IV. Industry Outlook
V. Strategic Direction
Agenda
3

1978• Incorporated as TPI with initial paid-up capital of THB
300 million
1995 • Listed on SET following an IPO, raising $367 million
1997 • Asian crisis began and declaration a debt moratorium
2005 • Successfully recapitalized and 61.5% of stake were
taken by MOF through PTT and other government-related bodies
2006 • Exited from the rehabilitation in April 2006
2013 • Registered Capital: 20,475 million shares
• Paid-up Capital: 20,434 million shares
• Foreign Limit <=49%
• Dividend Policy >= 25%
• Market Cap. THB 66.02 billion (Ranked 38th)
PTT, 38.5%
Government Saving Bank,
9.5%
Government Pension Fund,
6.4%
Vayupak, 0.1%Others, 45.5%
As of 6 March 2013
• Fully integrated from upstream to downstream in a single
complex
• In the Eastern Seaboard Area of Thailand, 200 Km. from
Bangkok and 30 Km. from Map Ta Phut
• Proximity to various transportation routes
- Deepest sea port in Thailand
- Major coastal highway (Sukhumvit Road)
Introduction to IRPC
Company Profile
IRPC Strategic Location
Shareholding Structure
4
As of 20 February 2014

5
Current Key Assets and Their Contributions
Refinery
Average net sales 2011 - 2013: THB 267,835 Million
• Capacity 215 KBD, Thailand 3rd largest oil refinery
• The largest lube base oils and asphalt production in Thailand with
320 KTA
Petrochemical
Deep Sea Port
Asset
Management
• Consist of upstream through downstream products:
- Olefins: HDPE, PP
- Styrenics: ABS, PS, EPS
- Aromatic: Toluene, Mix-xylenes, Benzene
Deep Sea Port
- The deepest sea port in Thailand with 2 Jetties: liquid and dry port
- Accommodate Very Large Crude Carriers (“VLCC”) up to 250 Kdwt
Tank farm (299 tanks)
- Chemical 140 million liter / Petroleum 2,000 million liter/ Lube
Base Oil 300 million liter
Power Plant
-New 220 Megawatts gas-fired power plant to reduce environmental
impact to community
-Existing 108 Megawatts coal & gas-fired power plant
-Supply both steam and electricity
Land & Estate
- Rayong 12,202 Rai / Others 3,559 Rai
Revenue/ EBITDA/Asset*
77% 52% 42%
21% 22% 40%
0.5% 4%
1.5% 22%
8%
10%
* Average year 2011 - 2013

6
• Bulk & Container Port
100,000 DWT
• Liquid & Chemical Port
250,000 DWT
• Total ~ 12,000 rai
(4,700 acre)
• Available for sale ~ 7,000 rai
(2,700 acre)
• Chemical 140 mio.L
• Petroleum 2,000 mio.L
• Lube Base Oil 300 mio.L
• Propylene 412 KTA
• Ethylene 360 KTA
• ABS/SAN 177 KTA
• PS 100 KTA
• EPS 30 KTA
• HDPE 140 KTA
• PP 475 KTA
• Crude Distillation Unit 215 KBD
• Reformer 14.4 KBD
• Hydro desulfurizer 24.9 KBD
• Lube Base Unit 33 KBD
• Deep Catalytic Cracking 18 KBD
CO
RE
BU
SIN
ES
SIN
FR
AS
TR
UC
TU
RE
Refinery Petrochemical
Utilities Port
Tank
• 2,000 Students
INDIRECT
SUPPORT
Land
IRPC Technological College
Refinery and Petrochemical Complexes
• Power Plant
- Electricity 342 MW
- Steam 620 T/hr
• Demin. Water 1,050 m3/hr
• Water Filtration 4,000 m3/hr
• Nitrogen 15,000 Nm3/hr
• Compressed Air 68,450 Nm3/hr

Ideal Assets for Adjacent Business: Land & Port
Ban KhaiRayong
2,207 rai (873 acre)
Eco Industrial Zone(EIZ) 6,062 rai (2,396 acre)EIZ 1 ~ 817 rai (323 acre)
EIZ 2 ~ 530 rai (209 acre)
EIZ 3 ~ 609 rai (241 acre)
EIZ 4 ~ 4,106 rai (1,623 acre)
Wang ChanRayong
565 rai (223 acre)
JanaSongkla
2,569 rai (1,016 acre)
Non-coreIRPC / IRPC OIL
Others:
Land, Port & Tank
outside Rayong
168 rai (66 acre)
Total ~ 12,000 rai
2
3
1
4
5
6
7Conversion ratio 2.529 rai : 1 acre
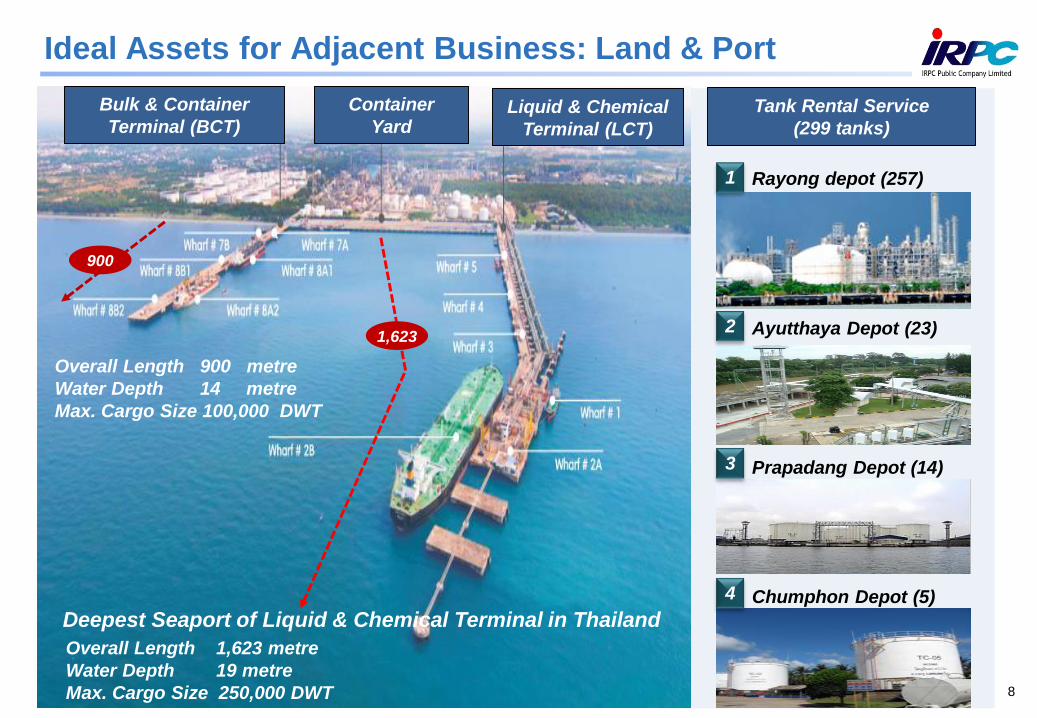
Ideal Assets for Adjacent Business: Land & Port
Rayong depot (257)
Liquid & Chemical
Terminal (LCT)
Overall Length 900 metre
Water Depth 14 metre
Max. Cargo Size 100,000 DWT
Overall Length 1,623 metre
Water Depth 19 metre
Max. Cargo Size 250,000 DWT
Deepest Seaport of Liquid & Chemical Terminal in Thailand
Ayutthaya Depot (23)
Chumphon Depot (5)
Prapadang Depot (14)
Container
Yard
Bulk & Container
Terminal (BCT)Tank Rental Service
(299 tanks)
1,623
900
1
2
3
4
8

I. IRPC in Brief
II. 2013 Highlights
III. Operation & Financial Performance
IV. Industry Outlook
V. Strategic Direction
Agenda
9

6.7 6.5 5.8 7.0
4Q12 4Q13 2012 2013
107 107 109106
66,418 74,769
283,668 282,649
4Q12 4Q13 2012 2013
2013 Overview
Overview of Business
1. In 2013, average Dubai price dropped to
$106/bbl from $109/bbl in 2012 largely
influenced by US budget and debt ceiling
battle, Shale Oil production, and easing of
geopolitical tensions.
2. Net sales were 282,649 MB, slightly
declining from 2012, by 0.4%, due to a
decrease of 6.7% in the product prices and
an increase of 6.3% in the sales volume.
3. The Market GIM was $7.0/bbl increasing
from $5.8/bbl in 2012 caused by the use of
domestic crude and better petrochemical
product spreads.
The Accounting GIM in 2013 rose to
$8.4/bbl from $6.3/bbl in 2012.
4. Net profit was 826 MB in 2013, compared to
net losses of 777 MB in 2012.
Revenue
(net Excise)
Dubai
Unit: USD/BBL
13%
0.4%
Market GIM
3%
(30)
784
(777)
826
4Q12 4Q13 2012 2013
Net Income
2,713% 206%
Unit:USD/BBL
Unit: MB
Unit: MB
21%
Accounting GIM
Unit: USD/BBL
27% 33%
7.08.9
6.38.4
4Q12 4Q13 2012 2013
10

1. As of 31 December 2013, 59% overall progress of Phoenix
Projects
2. UHV: 52%; Construction phase started; COD expected in
3Q15
2013 Highlights
Projects
Asset Utilization Enhancement
UHV ProjectProgress: 52% Under construction,
piling and foundation
Rx/Rg structure foundationConcrete Pedestal work
Concrete Foundation
work
U/G piping installation
work Control room building
Wang Chan district,
Rayong province
3,312 Rai
Wang Chan
11
1. In November 2013, ~ 3,312 Rai of land located in Wang Chan
district, Rayong province was sold for 596 MB.
2. In December 2013, 51% of total share in IRPC Clean Power
Company Limited was purchased by Global Power Synergy
Company Limited for 709 MB.

Outstanding Achievement in 2013
Operation
Marketing
• Continuously implemented Zero Unplanned Shutdown” &“Operational
Excellence” program with collaboration in PTT Group
• Increased plants efficiency & no serious injures throughout the year 2013
• Developed BHD, a premium-grade bio-diesel
• Installed Mercury Removal Unit, enable IRPC to process higher mercury crude
• Managed Hydrocarbon Loss: Save 594 MB per year from hydrocarbon loss
dropping from 0.86% to 0.53%
• Expanded “IRON System” to more than 80% of customers to improve
customer ordering system
• Collaborated with financial institutions to implement “E-Supply Chain”,
reducing risk of payment error from customers
• Penetrated into ASEAN market to get ready for AEC
• Increased sales to ASEAN countries from 15% in 2012 to 20% in 2013
12

Outstanding Achievement in 2013
Investment
Innovation
• Multi Product Pipeline (Diesel 10KBD, Jet 15KBD) between PTTGC and
IRPC allowed the two companies to exchange streams to create more synergy.
• EBSM Upgrading for ABS Specialties project increased production capacity of
styrene monomer (SM) from 200 KTA to 260 KTA.
• Oil Depot and Lube Blending expansion increased lube blending capacity
from 1 million litres/month to 6 million litres/month.
• More than 160 of innovation works in 2013. Here is just few examples of our
unlimited creativities.
1) PE Compound for “Geo-membrane”
2) PP for High Speed Raffia
3) PP Compound for Synthetic Rattan Fire
Retardant
4) Low Gas Emission Reinforcement PP
5) Halogen Free HIPS/PP for Electronic
Application
6) Polyethylene Catalyst Development
7) Wood Plastic Composite (WPC)
8) Advanced HA2PO Catalyst for Ultra High Molecular
Weight Polyethylene (UHMWPE) Production
9) Anti-dripping genX (non PFOA) graft latex
10) High gloss stability by using EBS in HG730 to
increase process ability and gloss stability
11) High stiffness and high clarify PP Extrusion PP 1150H
12) High flow high clarify Random Polypropylene 3342S
13
I. IRPC in Brief
II. 2013 Highlights
III. Operation & Financial Performance
IV. Industry Outlook
V. Strategic Direction
Agenda
14

0
20
40
60
80
100
120
140
160
180
200
$/BBL
Dubai
ULG 95
GAS OIL 0.05%
FUEL OIL
Mixed Performance of Petroleum Spread
Source: Platts, IRPC Analysis Team
Note: Starting Jan-13 onward Gas oil 0.05%s is used instead of Gas oil 0.5%s.
For comparison purpose, historical data is re-stated based on Gas oil 0.05%
• Crude oil price was relatively elevated in 4Q13 supported
by decline in the US crude inventory, extended political
turmoil, but faced downward pressure from QE3 tapering.
• ULG spread declined because of weaker demand from
Indonesia and Vietnam, and an increase in the supply
from refineries in Taiwan and China.
• Gasoil spread rose from the previous quarter due to a
rise in the seasonal demand from Asia, ME and Africa
combined with a decline in the exports from India due to
the unplanned shutdown.
• FO spread remained unfavorable since the demand from
marine logistic sector continued to be weak.
Mar’12
106106116AVG.
Dubai
Price.
1
10
710
Mar’13Dec’11
1Q12 2Q12 4Q12 1Q13 2Q13 3Q13 4Q13
Jun’12
Dubai
Sep’12
106
3Q12
0.04
Dec’12
107 107108
Jun’13
101 0.5
Sep’13
0.7 5
Dec’13
14.3 14.0 15.913.4
18.414.6 12.4
9.214.4 13.7
1Q12 2Q 3Q 4Q 1Q13 2Q 3Q 4Q Y12 Y13
18.1 17.621.2 19.4 19.6
16.8 17.3 17.7 19.1 17.9
1Q12 2Q 3Q 4Q 1Q13 2Q 3Q 4Q Y12 Y13
(0.5) (1.3) (2.4)
(9.0) (7.3)
(3.6)
(10.7) (10.4)
(3.3)
(8.0)
1Q12 2Q 3Q 4Q 1Q13 2Q 3Q 4Q Y12 Y'13
$/BBL
$/BBL
$/BBLGasoil-DB
HSFO-DB
ULG95-DB
15

Sliding Lube Base Oil Spreads
Source: Platts, ICIS, IRPC Analysis Team
• Lube base oil spread was stable as the demand was
seasonally sluggish towards the end of year. Moreover, there
was an increase in the export of from Russia to Asia.
• Asphalt spread declined significantly because of a demand
decrease from Indonesia, Malaysia, and Vietnam.
0
200
400
600
800
1,000
1,200
1,400
1,600
1,800
Sep11 Dec11 Mar12 Jun12 Sep12 Dec12 Mar13 Jun13 Sep13 Dec13
$/TONFO 180 3.5%S 500SN 150BS Asphalt
1Q12 2Q12 4Q12 2Q13 4Q134Q11 3Q12 1Q13 3Q13
500 621
497 460 421 494 518 509 519 486
1Q12 2Q 3Q 4Q 1Q13 2Q 3Q 4Q Y12 Y13
$/TON500SN – FO 180 3.5%S Spread
(99)
(32)(40)
15 (19)
(7) (3)(27)
(39)
(14)
1Q12 2Q 3Q Q4 1Q13 2Q 3Q 4Q Y12 Y13
$/TONAsphalt – FO 180 3.5%S Spread
16
0.7 1.0 2.0
0.2 0.3 0.5 0.9
2.0 1.4
1.5
1.4 1.2 2.0 1.4
2.7 2.4 3.5
1.6 1.6
2.5 2.3
4Q12 1Q13 2Q 3Q 4Q Y12 Y13
$/BBLMarket GRM
Lube Base
Refinery

Weaker Aromatics Spread
Source: Platts, ICIS, IRPC Analysis Team
• Toluene spread weakened as the demand from gasoline blending remained weak. Moreover, the demand for toluene as a
feedstock in China and India also dropped.
• Mixed-xylene significantly deteriorated due to a decrease in the demand for polyester, thereby adversely affecting the
demand for paraxylene and mixed-xylene.
500
600
700
800
900
1,000
1,100
1,200
1,300
1,400
1,500
Sep11 Dec11 Mar12 Jun12 Sep12 Dec12 Mar13 Jun13 Sep13 Dec13
$/TON Naphtha Benzene Toluene Mixed Xylene
1Q12 2Q12 4Q12 1Q13 2Q13 4Q134Q11
161 222
269
420 426 428
336 338 268
382
1Q12 2Q 3Q 4Q 1Q13 2Q 3Q 4Q Y12 Y13
$/TON
178 219 217
335 305 260
205 192 237 241
1Q12 2Q 3Q 4Q 1Q13 2Q 3Q 4Q Y12 Y13
$/TON
316 261
326
385 366 334 349
269 322 329
1Q12 2Q 3Q 4Q 1Q13 2Q 3Q 4Q Y12 Y13
$/TON
Benzene – Naphtha Spread
3Q12 3Q13
Toluene – Naphtha Spread MX – Naphtha Spread
17

Rising Olefin Spread
Source: Platts, ICIS, IRPC Analysis Team
• Polyolefin spreads were solid. The prices of HDPE and PP continued to surge on cost push pressure. Moreover, supply
from ME to Asia decreased due to disrupted production.
500
700
900
1,100
1,300
1,500
1,700
Sep11 Dec11 Mar12 Jun12 Sep12 Dec12 Mar13 Jun13 Sep13 Dec13
$/TON Naphtha Ethylene Propylene HDPE PP
1Q12 2Q12 4Q12 2Q13 4Q134Q11
230 291 285 341 434 405 397 480 287 429
145 203 143 107
87 179 171
110
149
137 374 494
428 449 521
585 568 590
436
566
1Q12 2Q 3Q 4Q 1Q13 2Q 3Q 4Q Y12 Y13
$/TON
HDPE-Ethylene –Naphtha Spread
3Q12
HDPE-Ethylene
Ethylene - NP
1Q13
261 391 342 303 345 439 412 420 324 404
147 161 187 216
236 175 184 177 178
193 408 551 529 519
581 614 596 597
502
597
1Q12 2Q 3Q 4Q 1Q13 2Q 3Q 4Q Y12 Y13
$/TON
PP-Propylene
Propylene - NP
3Q13
18
PP-Propylene –Naphtha Spread

Declining Styrenics Spread
Source: Platts, ICIS, IRPC Analysis Team
• PS spread retreated since PS price declined in line with the styrene monomer, driven by SM plants returning from unplanned
shutdown. Moreover, the PS demand also declined seasonally.
• ABS spread fell because of a drop in the ABS price, which was in turn caused by its weak demand, while naphtha price rose.
500
700
900
1,100
1,300
1,500
1,700
1,900
2,100
2,300
2,500
Sep11 Dec11 Mar12 Jun12 Sep12 Dec12 Mar13 Jun13 Sep13 Dec13
$/TON Naphtha SM ABS PS
1Q12 2Q12 4Q12 1Q13 2Q13 4Q134Q11 3Q12 3Q13
543 636 664 771 922 976 995 891 653
946
1Q12 2Q 3Q 4Q 1Q13 2Q 3Q 4Q Y12 Y13
$/TON
1,058 1,081
1,039 995 1,051 1,057 1,015 960 1,043 1,021
1Q12 2Q 3Q 4Q 1Q13 2Q 3Q 4Q Y12 Y13
$/TON
PS –Naphtha Spread
428 516 541 692 773 851 895
759 544
820
1Q12 2Q 3Q 4Q 1Q13 2Q 3Q 4Q Y12 Y13
$/TON
SM - Naphtha Spread ABS –Naphtha Spread
19
124 133 168 123 125 82
136
122 151 141
132 135
98
140
138 158 176
142 146 102
155
4Q12 1Q13 2Q 3Q 4Q Y12 Y13
$/TON Aromatic &Styrenics
Olefins
Market PTF
Petrochemical
Petroleum
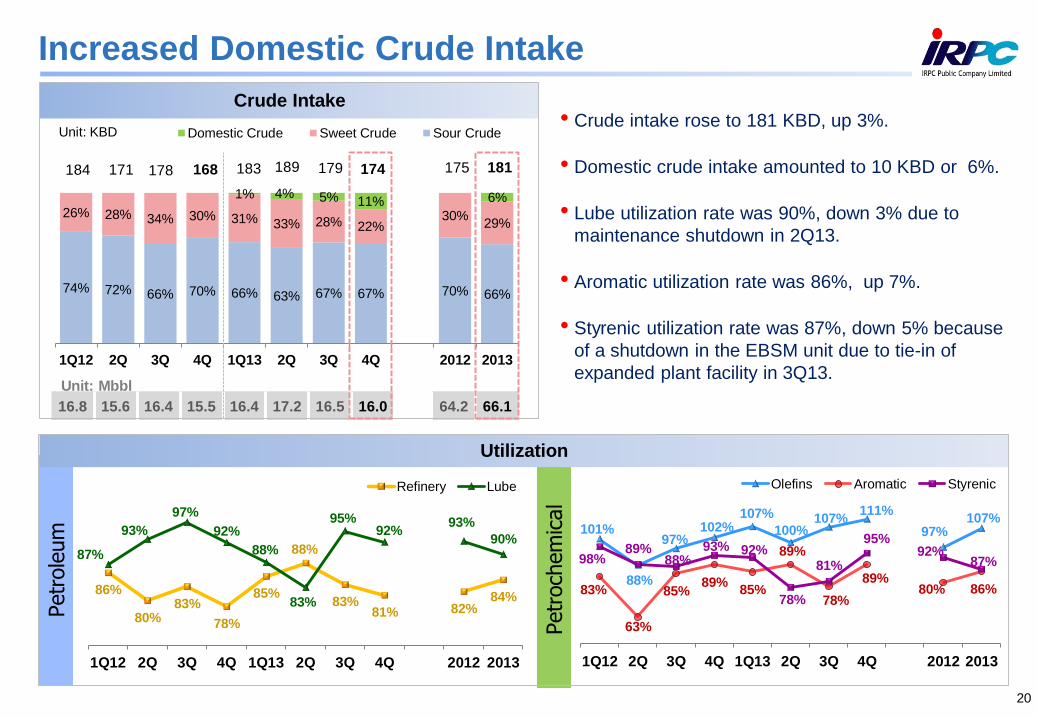
• Crude intake rose to 181 KBD, up 3%.
• Domestic crude intake amounted to 10 KBD or 6%.
• Lube utilization rate was 90%, down 3% due to
maintenance shutdown in 2Q13.
• Aromatic utilization rate was 86%, up 7%.
• Styrenic utilization rate was 87%, down 5% because
of a shutdown in the EBSM unit due to tie-in of
expanded plant facility in 3Q13.
Increased Domestic Crude Intake
Crude Intake
74% 72% 66% 70% 66% 63% 67% 67% 70% 66%
26% 28% 34% 30% 31% 33% 28% 22%30%
29%
1% 4% 5% 11% 6%
184 171 178 168 183 189 179 174 175 181
1Q12 2Q 3Q 4Q 1Q13 2Q 3Q 4Q 2012 2013
Domestic Crude Sweet Crude Sour CrudeUnit: KBD
16.8 15.6 16.4 15.5 16.4 17.2 16.5 16.0 64.2 66.1
101%
88%
97%102%
107%
100%107%
111%
97%107%
83%
63%
85%89%
85%
89%
78%
89%80% 86%
98%89%
88%93% 92%
78%
81%
95%92%
87%
1Q12 2Q 3Q 4Q 1Q13 2Q 3Q 4Q 2012 2013
Olefins Aromatic Styrenic
86%
80%83%
78%
85%
88%
83%81% 82%
84%
87%
93%
97%
92%
88%
83%
95%92%
93%
90%
1Q12 2Q 3Q 4Q 1Q13 2Q 3Q 4Q 2012 2013
Refinery Lube
Unit: Mbbl
Utilization
20

54%65% 58% 58% 62% 59% 61%
46%35% 42% 42% 38% 41% 39%
13.7 14.2 15.3 57.6
4Q12 1Q13 2Q 3Q 4Q 2012 2013
Sales Qty
Export
Domestic
14.9 14.8 59.2
64% 60% 63% 62%55%
64% 60%
36% 40% 37% 38% 45% 36% 40%
323 345 311 344 373 1,283
4Q12 1Q13 2Q 3Q 4Q 2012 2013
Sales Qty
Export
Domestic
1,372
86% 84% 86% 84% 83% 87% 84%
14% 16% 14% 16% 17% 13% 16%
15.8 17.1 17.7 17.6 17.8 66.1 70.2
4Q12 1Q13 2Q 3Q 4Q 2012 2013
Petrochem
Petroleum
Focus on Domestic Market
Petroleum
Petrochemical
Unit: Mbbl
Unit: KTon
Unit: Mbbl
21
China, 32%
Asia Ex China, 59%
Europe,
4%
Australia
, 3%
America
, 1%
Others,
1%
Singapore,
51%
Asia Ex
Singapore,
48%
Others,
1%
Export by Destination
Petroleum
85%
Sales Volume Structure
Domestic
61%
Export
39%
2013 Sale volume
70.2 Mbbl
Petrochemical
15%
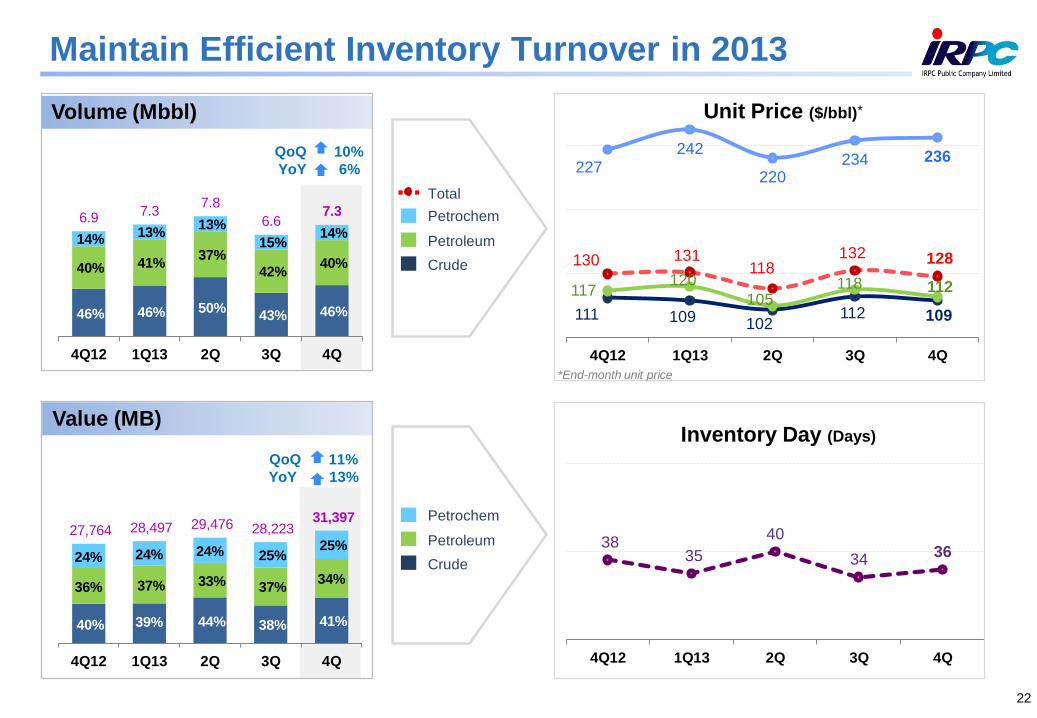
46% 46% 50% 43% 46%
40% 41% 37%
42%40%
14% 13%
13%
15%14%
6.97.3
7.8
6.67.3
4Q12 1Q13 2Q 3Q 4Q
40% 39% 44% 38% 41%
36% 37% 33% 37%34%
24% 24% 24% 25%25%
27,764 28,497 29,476 28,223 31,397
4Q12 1Q13 2Q 3Q 4Q
QoQ 10%
YoY 6%
QoQ 11%
YoY 13%
38 35
40
3436
4Q12 1Q13 2Q 3Q 4Q
Inventory Day (Days)
111 109 102 112 109
117 120
105 118 112
227242
220234 236
130 131 118
132 128
4Q12 1Q13 2Q 3Q 4Q
Unit Price ($/bbl)
Maintain Efficient Inventory Turnover in 2013
Value (MB)
Volume (Mbbl)
Petrochem
Petroleum
Crude
Petrochem
Petroleum
Crude
Total
*End-month unit price
*
22
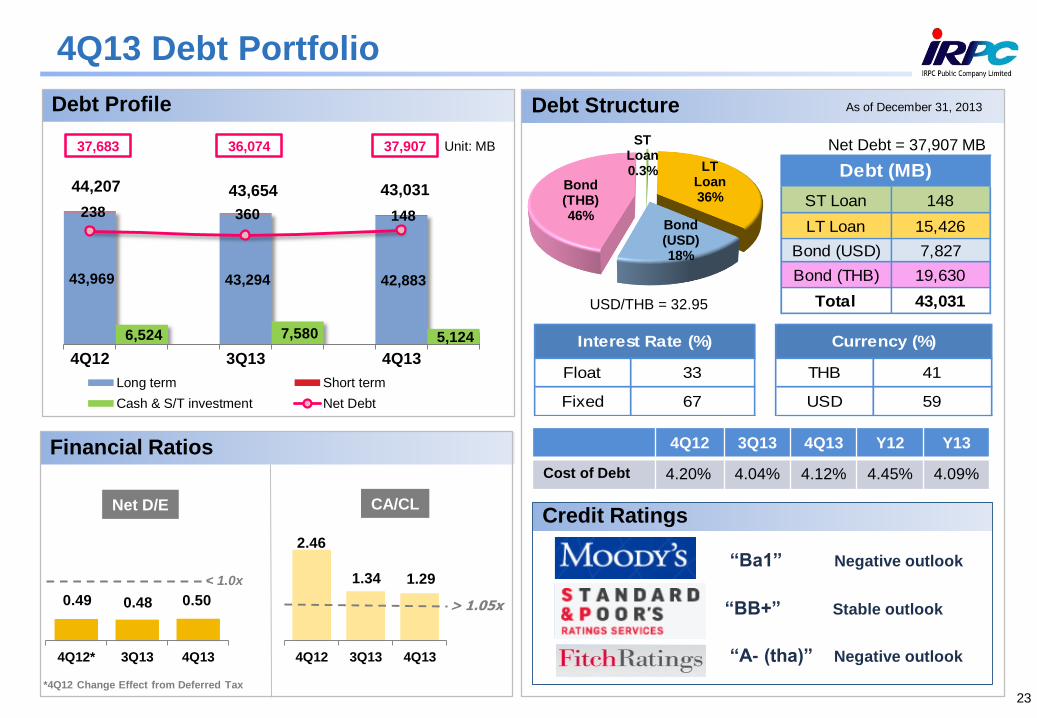
4Q13 Debt Portfolio
Float 33 THB 41
Fixed 67 USD 59
Currency (%) Interest Rate (%)
Net Debt = 37,907 MB
USD/THB = 32.95
Debt Structure As of December 31, 2013
ST Loan 148
LT Loan 15,426
Bond (USD) 7,827
Bond (THB) 19,630
Total 43,031
Debt (MB)
ST Loan0.3% LT
Loan36%
Bond (USD)18%
Bond (THB)46%
2.46
1.34 1.29
4Q12 3Q13 4Q13
> 1.05x0.49 0.48 0.50
4Q12* 3Q13 4Q13
*4Q12 Change Effect from Deferred Tax
< 1.0x
Net D/E CA/CL
Unit: MB
43,969 43,294 42,883
238 360 148
44,207 43,654 43,031
6,524 7,580 5,124
4Q12 3Q13 4Q13
Long term Short term
Cash & S/T investment Net Debt
37,683 36,074 37,907
4Q12 3Q13 4Q13 Y12 Y13
Cost of Debt 4.20% 4.04% 4.12% 4.45% 4.09%
“Ba1” Negative outlook
Credit Ratings
“BB+” Stable outlook
“A- (tha)” Negative outlook
Debt Profile
Financial Ratios
23

I. IRPC in Brief
II. 2013 Highlights
III. Operation & Financial Performance
IV. Industry Outlook
V. Strategic Direction
Agenda
24

Crude Oil and Petroleum Products Outlook
Key ProductsPrice
(2013)
Spread
(2013)2014 Outlook
Refinery ($/bbl) ($/bbl)
Dubai 106
ULG95 119.2 13.7
GAS OIL 0.05% 123.4 17.9
FO 97.5 (8.0)
Lube Base Oil ($/T) ($/T)
500 SN 1,105 486
150 BS 1,191 572
• Global oil demand grows by 1.31
MBD but supply disruption in ME
may be eased but by no means
certain. The crude oil price is
expected to be above $100 per
barrel.
• Slightly Petroleum product cracks
improve, led by middle distillate
and fuel oil driven by the demand
from transportation activities.
• Stable lube base oil market is
expected in 2014 as the
additional supply will be
alleviated by scheduled
shutdown throughout the year.
CompanyCapacity
(KT/Year)Timing
ADNOC 100 H1 2014
Chevron 1,200 Q1 2014
Sinopec 240 Mar-14
SK Lubricant 660 H2 2014
2014 Shutdown Schedule
Driving Determinants
25
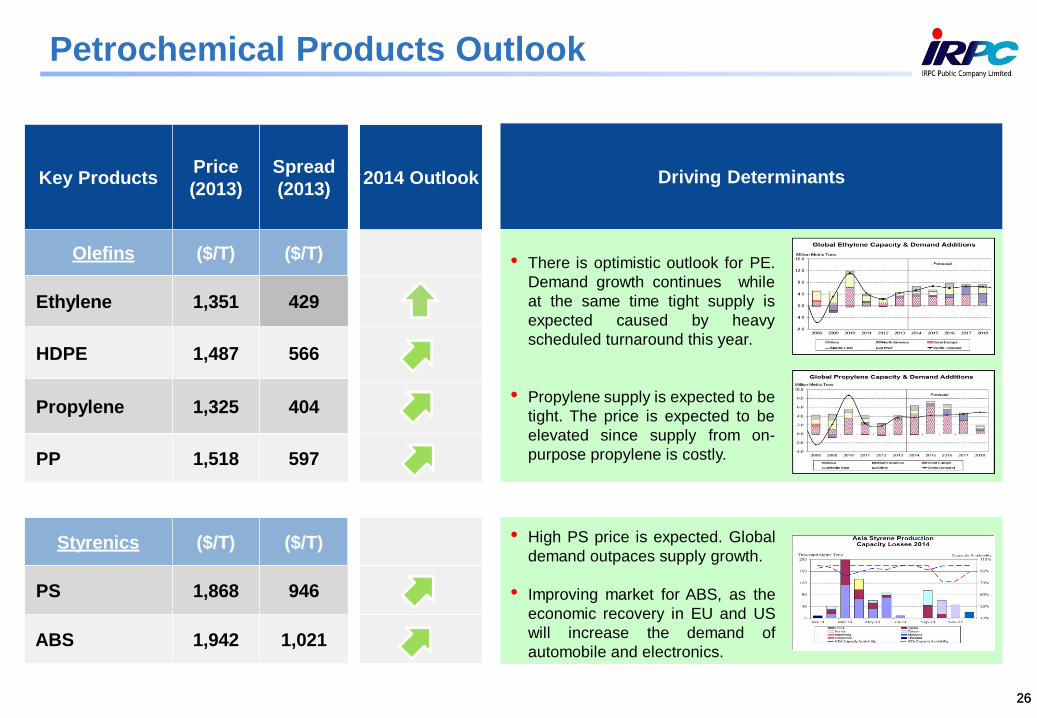
Petrochemical Products Outlook
26
Key ProductsPrice
(2013)
Spread
(2013)2014 Outlook
Olefins ($/T) ($/T)
Ethylene 1,351 429
HDPE 1,487 566
Propylene 1,325 404
PP 1,518 597
Styrenics ($/T) ($/T)
PS 1,868 946
ABS 1,942 1,021
• There is optimistic outlook for PE.
Demand growth continues while
at the same time tight supply is
expected caused by heavy
scheduled turnaround this year.
• Propylene supply is expected to be
tight. The price is expected to be
elevated since supply from on-
purpose propylene is costly.
• High PS price is expected. Global
demand outpaces supply growth.
• Improving market for ABS, as the
economic recovery in EU and US
will increase the demand of
automobile and electronics.
Driving Determinants
26

I. IRPC in Brief
II. 2013 Highlights
III. Operation & Financial Performance
IV. Industry Outlook
V. Strategic Direction
Agenda
27

Strategic Initiatives: Overview
Delta: 2014 Onwards
▪ Margin Improvement Initiatives
– Operational Excellence
– Commercial Excellence
– HR Excellence
▪ Acceleration of Assets
Utilization
– EIZ
– Bankai
– Dry port
▪ Domestic crude use up to
35,000 Barrel per day
Post-Phoenix: 2015 Onwards
▪ Adding up more value to
petrochemical feedstock from
UHV project
▪ Shifting product portfolio to be
specialty player through PTT
Group Partnership strategy
– PP compound
– Polyol
– AA/ SAP
– PX
– SM
Phoenix + : 2010 Onwards
▪ Transformation to support high
value added product growth
– CHP I
– PRP
– EBSM
– UHV
▪ Quick specialty capacity
expansion/ Grade shifts
– TDAE
– ABS6/SAN3
– HDPE-Pipe Grade
– UHMWPE
3
Structural Changes for
Specialty Growth
Quick Win Initiatives
for Cost Reduction
Margin Enhancement
Specialty Growth and
Move away from
heavy - asset company by
investing through JV
12
28

Post-PhoenixSpecialty Growth through JV
DeltaMargin Improvement Initiatives
Phoenix +Structural Changes for Specialty Growth
Product Yield
23%
8%
14%
10%
40%
38%
5%
10%
16%
21%
2%
5%
6%
2%
0%
20%
40%
60%
80%
100%
IRPC IRPC+UHV
Ethylene
Propylene
LPG
Naphtha +Reformate
Gasoline
Diesel/ JetFuel
Lube Oil
Fuel Oil
Market GIM ($/BBL)
Benefit
Progress 52%
UHV Project
as of Dec 2013
5.87.0
0369
1215
BAU Stock G/(L) Dom.Crude UHV Delta Prog.
2012A 2013A 2014B 2015B 2016B 2017B 2018B
$/bbl
Strategic Initiatives: UHV
29
• Increase propylene yield 320 KTA
• Heavy and cheaper crude processing
• COD : 3Q15
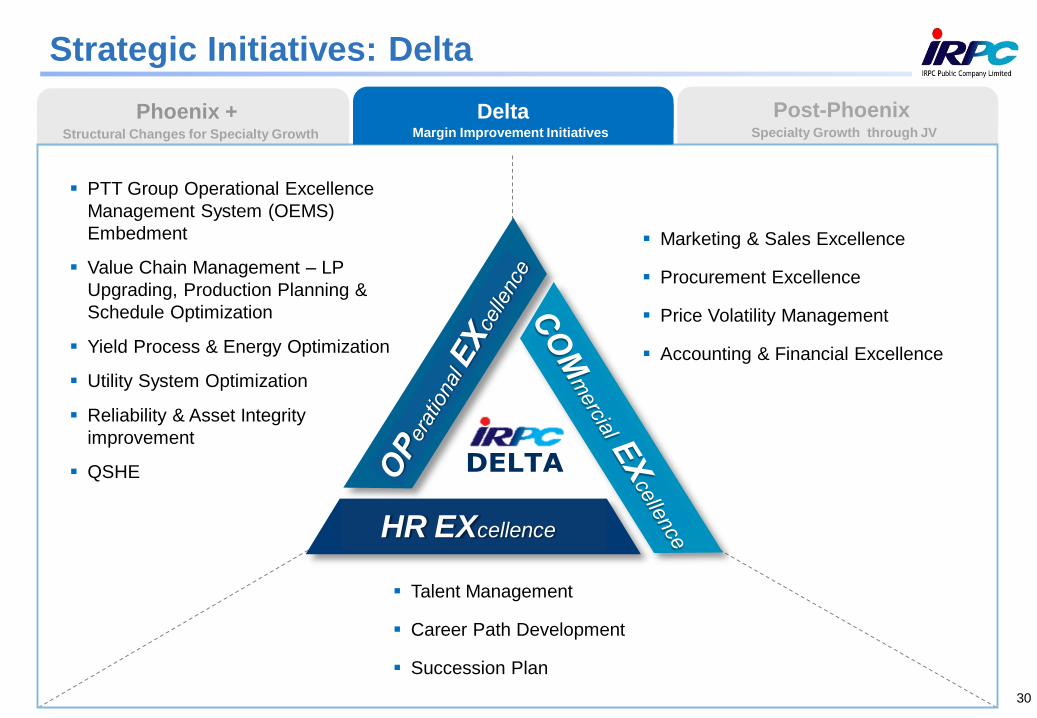
Strategic Initiatives: Delta
Organisation
DELTA
HR EXcellence
PTT Group Operational Excellence
Management System (OEMS)
Embedment
Value Chain Management – LP
Upgrading, Production Planning &
Schedule Optimization
Yield Process & Energy Optimization
Utility System Optimization
Reliability & Asset Integrity
improvement
QSHE
Marketing & Sales Excellence
Procurement Excellence
Price Volatility Management
Accounting & Financial Excellence
Talent Management
Career Path Development
Succession Plan
HR EXcellence
Post-PhoenixSpecialty Growth through JV
Phoenix +Structural Changes for Specialty Growth
DeltaMargin Improvement Initiatives
30

Strategic Initiatives: Delta
Post-PhoenixSpecialty Growth through JV
Phoenix +Structural Changes for Specialty Growth
1 2 3
DeltaMargin Improvement Initiatives
31

Strategic Initiatives: Post-Phoenix
Post-PhoenixSpecialty Growth through JV
Phoenix +Structural Changes for Specialty Growth
UHV 320 KTA
HDPE Pipe 120 KTA
UHMWPE 16 KTA
ACB 4 KTA
CC & C
PP Expansion +160 KTA
PX
SM 350 KTA
PPC 120 KTA
Polyol 100 KTA
AA/ SAP
BHD +2 mil.L/M
2014 2015 2016 2017 2018
AA 100KTA, SAP 80KTA
PX 1,214 KTA BZ 372 KTA
2.8 – 5.6 KTA
Ph
oen
ix +
Po
st
Ph
oen
ix
On-going & Approved Project
Study Project
65,000
MB
38,400
MB
DeltaMargin Improvement Initiatives
32
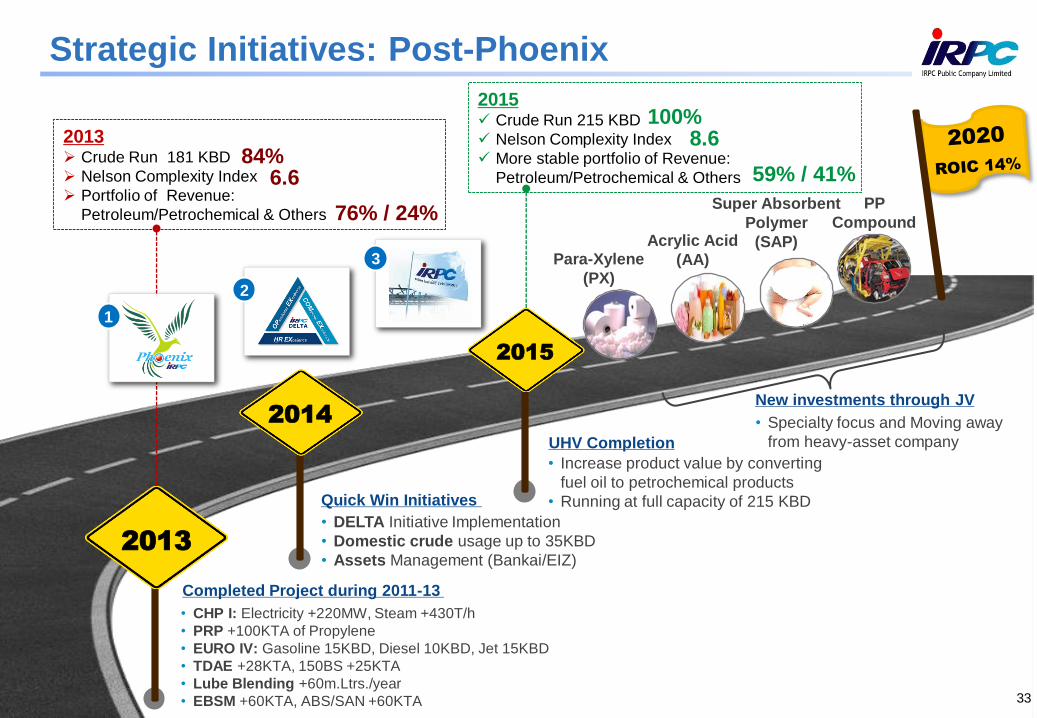
2014
• DELTA Initiative Implementation
• Domestic crude usage up to 35KBD
• Assets Management (Bankai/EIZ)
2015
• Increase product value by converting
fuel oil to petrochemical products
• Running at full capacity of 215 KBD
Para-Xylene
(PX)
Acrylic Acid
(AA)
Super Absorbent
Polymer
(SAP)
PP
Compound
New investments through JV
• Specialty focus and Moving away
from heavy-asset company
• CHP I: Electricity +220MW, Steam +430T/h
• PRP +100KTA of Propylene
• EURO IV: Gasoline 15KBD, Diesel 10KBD, Jet 15KBD
• TDAE +28KTA, 150BS +25KTA
• Lube Blending +60m.Ltrs./year
• EBSM +60KTA, ABS/SAN +60KTA
2013
Quick Win Initiatives
Completed Project during 2011-13
UHV Completion
2013 Crude Run 181 KBD
Nelson Complexity Index
Portfolio of Revenue:
Petroleum/Petrochemical & Others
3
2
2015 Crude Run 215 KBD
Nelson Complexity Index
More stable portfolio of Revenue:
Petroleum/Petrochemical & Others
76% / 24%
59% / 41%6.6
8.684%
100%
1
Strategic Initiatives: Post-Phoenix
33

34
The future begins now creating shared value
Q & A
Environment
Social
Education & Sports
Labor & Human Rights
Religion
Public Health

Thank You
Investor Relations Contact: [email protected]
Tel. 02-649-7380, Fax. 02-649-7379
Presentation is available at
www.irpc.co.th
Click “Presentations”
This presentation material has been prepared solely for informational purposes only. IRPC is furnishing it solely for use by prospective investors / analysts in
the proposed event. IRPC makes no representations or warranties as to the accuracy or completeness of such information. By accepting this material each
recipient agrees that IRPC shall not have any liability for any representations (express or implied) contained in, or for any omissions from this presentation.
The information contained herein does not purport to be all-inclusive or to contain all of the Information that may be material to the recipient’s decision. Each
recipient of the information and data contained herein should perform its own independent investigation and analysis of the transaction and the creditworthiness of IRPC . Reference in this Disclaimer to this shall include references to the Appendices (if any) hereto.