Embed Size (px)
Citation preview

Document of The World Bank
Report No: ICR2359
IMPLEMENTATION COMPLETION AND RESULTS REPORT (IBRD-73110)
ON A
LOAN
IN THE AMOUNT OF JAPANESE YEN 6,592.00 MILLION (US$64 MILLION EQUIVALENT)
TO THE
LAND BANK OF THE PHILIPPINES WITH THE GUARANTEE
OF THE REPUBLIC OF THE PHILIPPINES
FOR THE
MANILA THIRD SEWERAGE PROJECT
December 28, 2012
Philippines Sustainable Development Unit Sustainable Development Department East Asia and Pacific Region
Pub
lic D
iscl
osur
e A
utho
rized
Pub
lic D
iscl
osur
e A
utho
rized
Pub
lic D
iscl
osur
e A
utho
rized
Pub
lic D
iscl
osur
e A
utho
rized
Pub
lic D
iscl
osur
e A
utho
rized
Pub
lic D
iscl
osur
e A
utho
rized
Pub
lic D
iscl
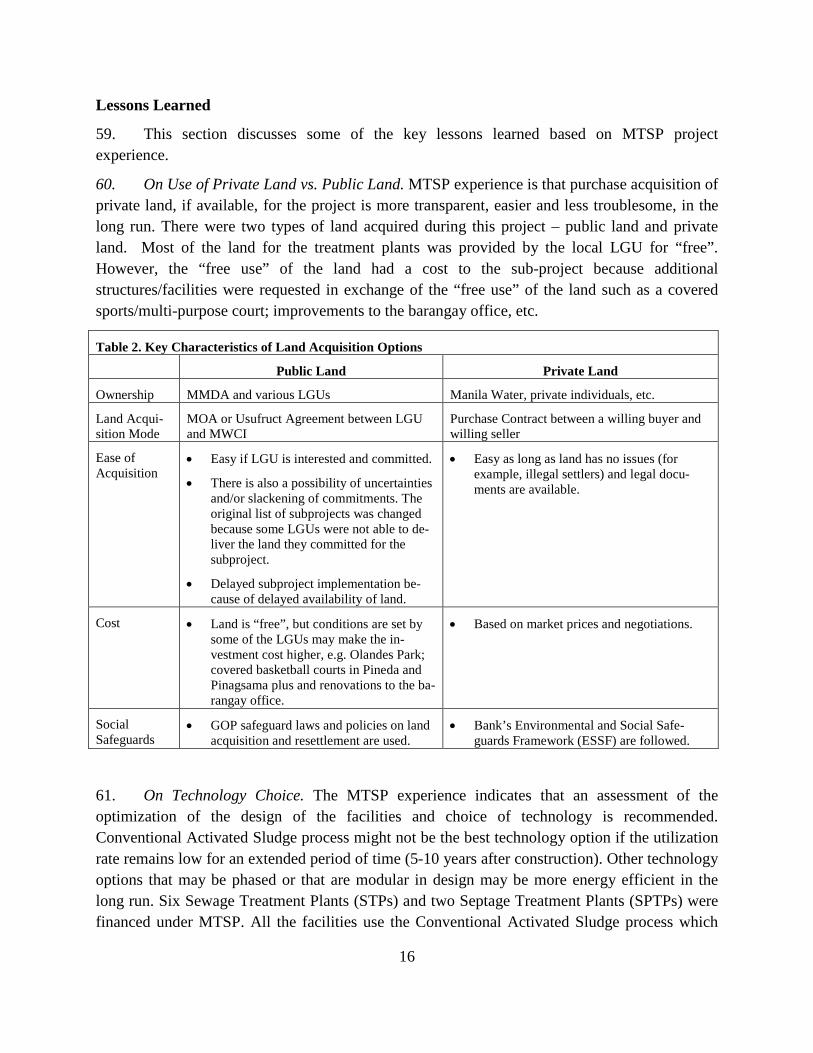
osur
e A
utho
rized
Pub
lic D
iscl
osur
e A
utho
rized

CURRENCY EQUIVALENTS
(Exchange Rate Effective November 2012)
Currency Unit = Peso
PHP42.05= US$1
PHP 1.00 = US$ 0.20
FISCAL YEAR
January 1 - December 31
ABBREVIATIONS AND ACRONYMS
BOD Biochemical Oxygen Demand BR Board Resolution BWC Bureau of Working Conditions (of DOLE) CAS Country Assistance Strategy CMR Compliance Monitoring Report CST Communal Septic Tank DAO Departmental Administrative Order DENR Department of Environment and Natural Resources DOF Department of Finance DOH Department of Health DOLE Department of Labor and Employment DPWH Department of Public Works and Highways DP Discharge Permit ECC Environmental Compliance Certificate EGF Environmental Guarantee Fund EIA Environmental Impact Assessment EIS Environmental Impact Statement EMP Environmental Management Plan EMoP Environmental Monitoring Plan EMB Environmental Management Bureau (of DENR) ESAF Environmental and Social Assessment Framework ESC Environmental Sanitation Certificate EU Environmental Unit FGD Focus Group Discussions FPA Fertilizer and Pesticides Authority FTI Food Terminal, Incorporated GEF Global Environment Facility GOP Government of the Republic of the Philippines IEC Information, Education and Communication IFC International Finance Corporation JICA Japan International Cooperation Agency JPY Japanese Yen LBP Land Bank of the Philippines LGU Local Government Unit (municipal or city government)

LLDA Laguna Lake Development Authority MM Metro Manila MMDA Metro Manila Development Authority MMT Multi–partite Monitoring Team MWCI Manila Water Company Inc. (East concession area) MWMP Metro Manila Wastewater Management Project (World Bank) MWSI Maynilad Water Services Inc. (West concession area) MWSS Metropolitan Waterworks and Sewerage System MTPDP Medium Term Philippine Development Plan MTSP Manila Third Sewerage Project MSSP Manila Second Sewerage Project MWSS-RO Metropolitan Waterworks and Sewerage System – Regulatory Office NEDA National Economic Development Authority OPEX Operating Expense PCO Pollution Control Officers PERP Preparedness and Emergency Response Plan PHP Philippine Peso PTO Permit to Operate RA Republic Act (a national law) RAP Resettlement Action Plan SIL Specific Investment Loan SMR Self-Monitoring Report STP Wastewater Treatment Plant SPTP Septage Treatment Plant PD Presidential Decree REA Regional Environmental Assessment USD United States Dollar US-EPA United States Environmental Protection Agency
Vice President : Pamela Cox
Country Director : Motoo Konishi
Sector Director : John A. Roome
Sector Manager : Ousmane Dione
Project Team Leader : Christopher C. Ancheta
ICR Primary Author : Wilfrido C. Barreiro

PHILIPPINES
Manila Third Sewerage Project
CONTENTS
Data Sheet A. Basic Information i B. Key Dates i C. Ratings Summary i D. Sector and Theme Codes ii E. Bank Staff iii F. Results Framework Analysis iii G. Ratings of Project Performance in ISRs viii H. Restructuring (if any) ix I. Disbursement Profile ix
Main Report 1. Project Context, Development Objectives and Design 1 2. Key Factors Affecting Implementation and Outcomes 5 3. Assessment of Outcomes 9 4. Assessment of Risk to Development Outcome 14 5. Assessment of Bank and Borrower Performance 14 6. Lessons Learned 16 7. Comments on Issues Raised by Borrower/Implementing Agencies/Partners 17 Annex 1. Project Costs and Financing 18 Annex 2. Outputs by Component 19 Annex 2A. Supplemental Table to F. Results Framework Analysis of the Data
Sheet
20 Annex 3. Economic and Financial Analysis 24 Annex 4. Bank Lending and Implementation Support/Supervision Processes 33 Annex 5. Environmental Safeguards Compliance Results 35 Annex 6. Social Safeguards Compliance Results 39 Annex 7. Summary of Borrower's ICR and/or Comments on Draft ICR 43 Annex 8. List of Supporting Documents 44 Annex 9. Background on Bank Involvement and Sector Reforms in Wastewater
Development in Metro Manila 45
Annex 10. MWCI Master Plan with Project Achievments 47
MAP


i
A. Basic Information
Country: Philippines Project Name: Manila Third Sewerage Project
Project ID: P079661 L/C/TF Number(s): IBRD-73110 ICR Date: 12/27/2012 ICR Type: Core ICR
Lending Instrument: SIL Borrower: LAND BANK OF THE PHILIPPINES
Original Total Commitment:
USD 64.00M Disbursed Amount: USD 40.56M
Revised Amount: USD 64.00M Environmental Category: A Implementing Agencies: Land Bank of the Philippines Manila Water Company Inc Cofinanciers and Other External Partners:
B. Key Dates
Process Date Process Original Date Revised / Actual Date(s)
Concept Review: 10/16/2003 Effectiveness: 03/06/2006 03/06/2006
Appraisal: 03/16/2005 Restructuring(s): 06/25/2010 01/17/2011
Approval: 06/21/2005 Mid-term Review: 01/08/2008 03/10/2008 Closing: 06/30/2010 06/30/2012
C. Ratings Summary
C.1 Performance Rating by ICR
Outcomes: Moderately Satisfactory Risk to Development Outcome: Moderate Bank Performance: Moderately Satisfactory Borrower Performance: Moderately Satisfactory

ii
C.2 Detailed Ratings of Bank and Borrower Performance (by ICR)
Bank Ratings Borrower Ratings
Quality at Entry: Moderately Satisfactory Government: Moderately Satisfactory
Quality of Supervision: Moderately Satisfactory Implementing Agency/Agencies: Moderately Satisfactory
Overall Bank Performance: Moderately Satisfactory Overall Borrower
Performance: Moderately Satisfactory
C.3 Quality at Entry and Implementation Performance Indicators
Implementation Performance
Indicators QAG Assessments (if any)
Rating
Potential Problem Project at any time (Yes/No):
No Quality at Entry (QEA):
None
Problem Project at any time (Yes/No):
No Quality of Supervision (QSA):
None
DO rating before Closing/Inactive status:
Moderately Satisfactory
D. Sector and Theme Codes
Original Actual
Sector Code (as % of total Bank financing)
Sanitation 50 50 Sewerage 50 50
Theme Code (as % of total Bank financing)
Other human development 20 20 Pollution management and environmental health 40 40 Urban services and housing for the poor 40 40
iii
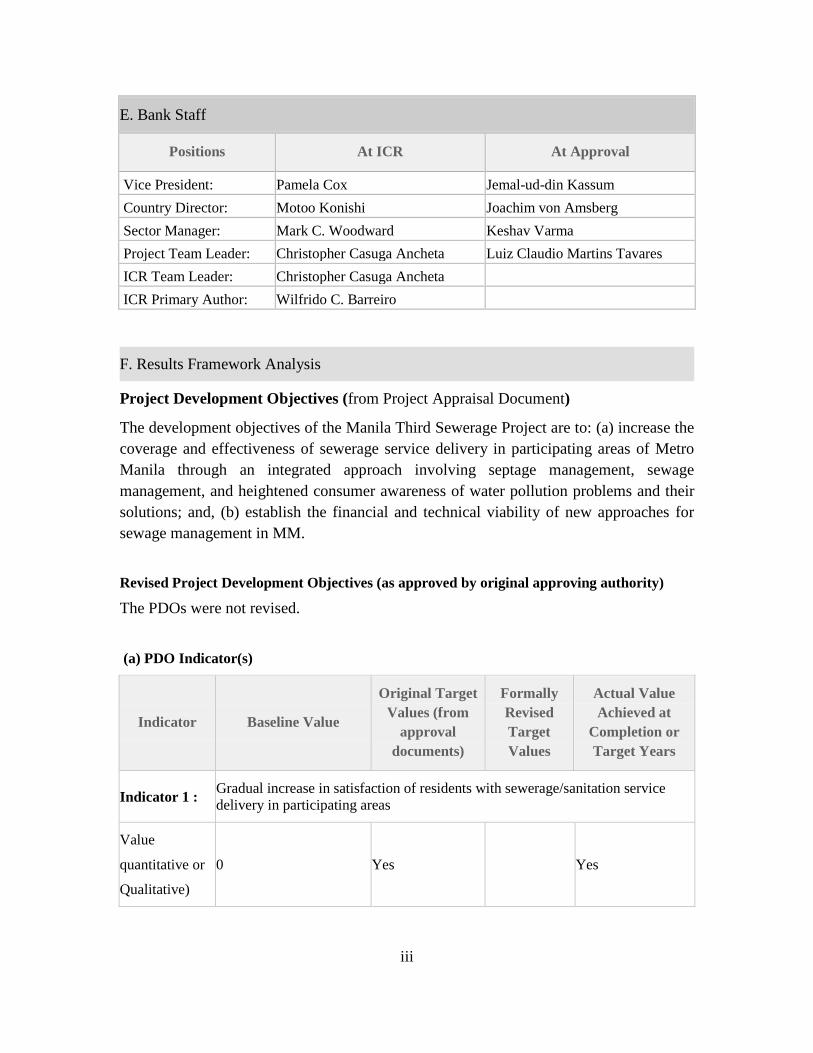
E. Bank Staff
Positions At ICR At Approval
Vice President: Pamela Cox Jemal-ud-din Kassum Country Director: Motoo Konishi Joachim von Amsberg Sector Manager: Mark C. Woodward Keshav Varma Project Team Leader: Christopher Casuga Ancheta Luiz Claudio Martins Tavares ICR Team Leader: Christopher Casuga Ancheta ICR Primary Author: Wilfrido C. Barreiro
F. Results Framework Analysis
Project Development Objectives (from Project Appraisal Document)
The development objectives of the Manila Third Sewerage Project are to: (a) increase the coverage and effectiveness of sewerage service delivery in participating areas of Metro Manila through an integrated approach involving septage management, sewage management, and heightened consumer awareness of water pollution problems and their solutions; and, (b) establish the financial and technical viability of new approaches for sewage management in MM.
Revised Project Development Objectives (as approved by original approving authority)
The PDOs were not revised.
(a) PDO Indicator(s)
Indicator Baseline Value
Original Target Values (from
approval documents)
Formally Revised Target Values
Actual Value Achieved at
Completion or Target Years
Indicator 1 : Gradual increase in satisfaction of residents with sewerage/sanitation service delivery in participating areas
Value
quantitative or
Qualitative)
0 Yes Yes
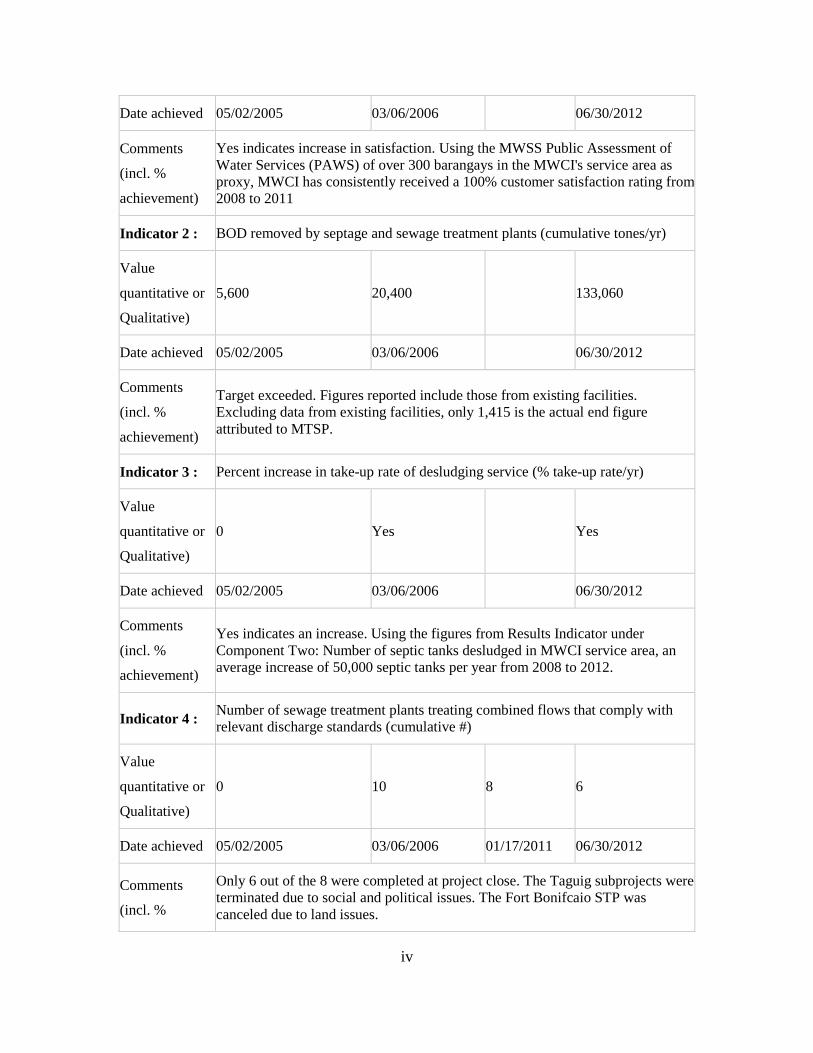
iv
Date achieved 05/02/2005 03/06/2006 06/30/2012
Comments
(incl. %
achievement)
Yes indicates increase in satisfaction. Using the MWSS Public Assessment of Water Services (PAWS) of over 300 barangays in the MWCI's service area as proxy, MWCI has consistently received a 100% customer satisfaction rating from 2008 to 2011
Indicator 2 : BOD removed by septage and sewage treatment plants (cumulative tones/yr)
Value
quantitative or
Qualitative)
5,600 20,400 133,060
Date achieved 05/02/2005 03/06/2006 06/30/2012
Comments
(incl. %
achievement)
Target exceeded. Figures reported include those from existing facilities. Excluding data from existing facilities, only 1,415 is the actual end figure attributed to MTSP.
Indicator 3 : Percent increase in take-up rate of desludging service (% take-up rate/yr)
Value
quantitative or
Qualitative)
0 Yes Yes
Date achieved 05/02/2005 03/06/2006 06/30/2012
Comments
(incl. %
achievement)
Yes indicates an increase. Using the figures from Results Indicator under Component Two: Number of septic tanks desludged in MWCI service area, an average increase of 50,000 septic tanks per year from 2008 to 2012.
Indicator 4 : Number of sewage treatment plants treating combined flows that comply with relevant discharge standards (cumulative #)
Value
quantitative or
Qualitative)
0 10 8 6
Date achieved 05/02/2005 03/06/2006 01/17/2011 06/30/2012
Comments
(incl. %
Only 6 out of the 8 were completed at project close. The Taguig subprojects were terminated due to social and political issues. The Fort Bonifcaio STP was canceled due to land issues.
v
achievement)
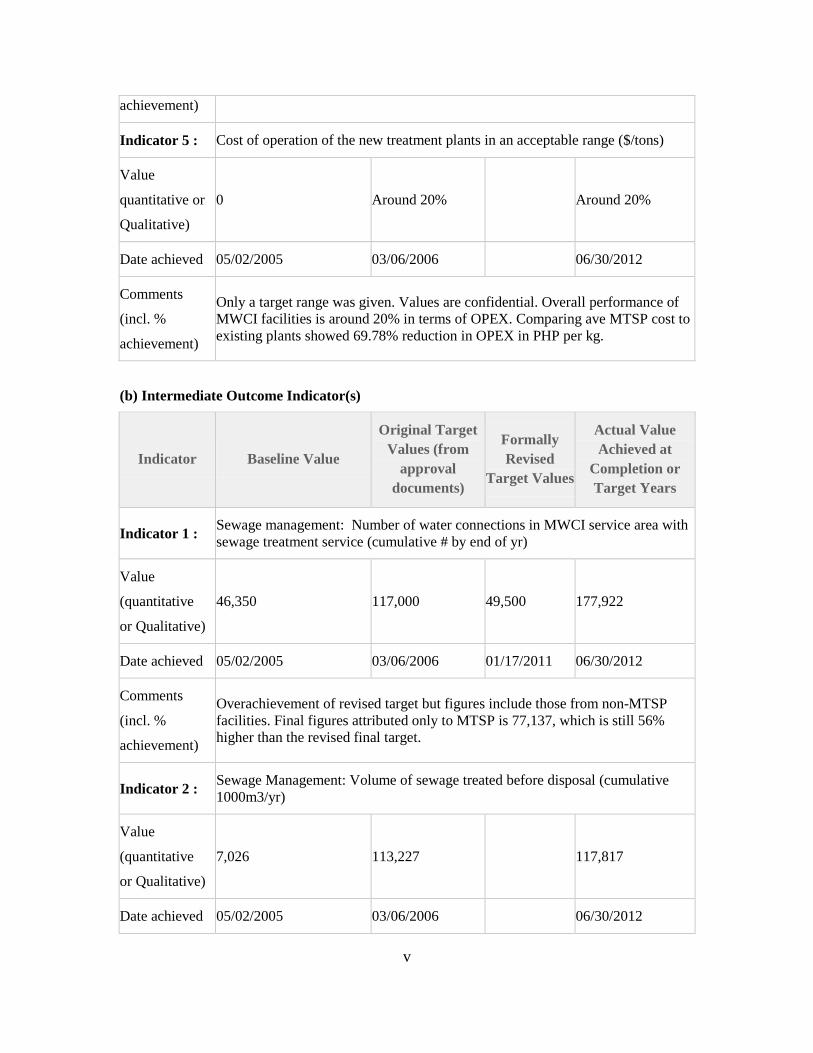
Indicator 5 : Cost of operation of the new treatment plants in an acceptable range ($/tons)
Value
quantitative or
Qualitative)
0 Around 20% Around 20%
Date achieved 05/02/2005 03/06/2006 06/30/2012
Comments
(incl. %
achievement)
Only a target range was given. Values are confidential. Overall performance of MWCI facilities is around 20% in terms of OPEX. Comparing ave MTSP cost to existing plants showed 69.78% reduction in OPEX in PHP per kg.
(b) Intermediate Outcome Indicator(s)
Indicator Baseline Value
Original Target Values (from
approval documents)
Formally Revised
Target Values
Actual Value Achieved at
Completion or Target Years
Indicator 1 : Sewage management: Number of water connections in MWCI service area with sewage treatment service (cumulative # by end of yr)
Value
(quantitative
or Qualitative)
46,350 117,000 49,500 177,922
Date achieved 05/02/2005 03/06/2006 01/17/2011 06/30/2012
Comments
(incl. %
achievement)
Overachievement of revised target but figures include those from non-MTSP facilities. Final figures attributed only to MTSP is 77,137, which is still 56% higher than the revised final target.
Indicator 2 : Sewage Management: Volume of sewage treated before disposal (cumulative 1000m3/yr)
Value
(quantitative
or Qualitative)
7,026 113,227 117,817
Date achieved 05/02/2005 03/06/2006 06/30/2012
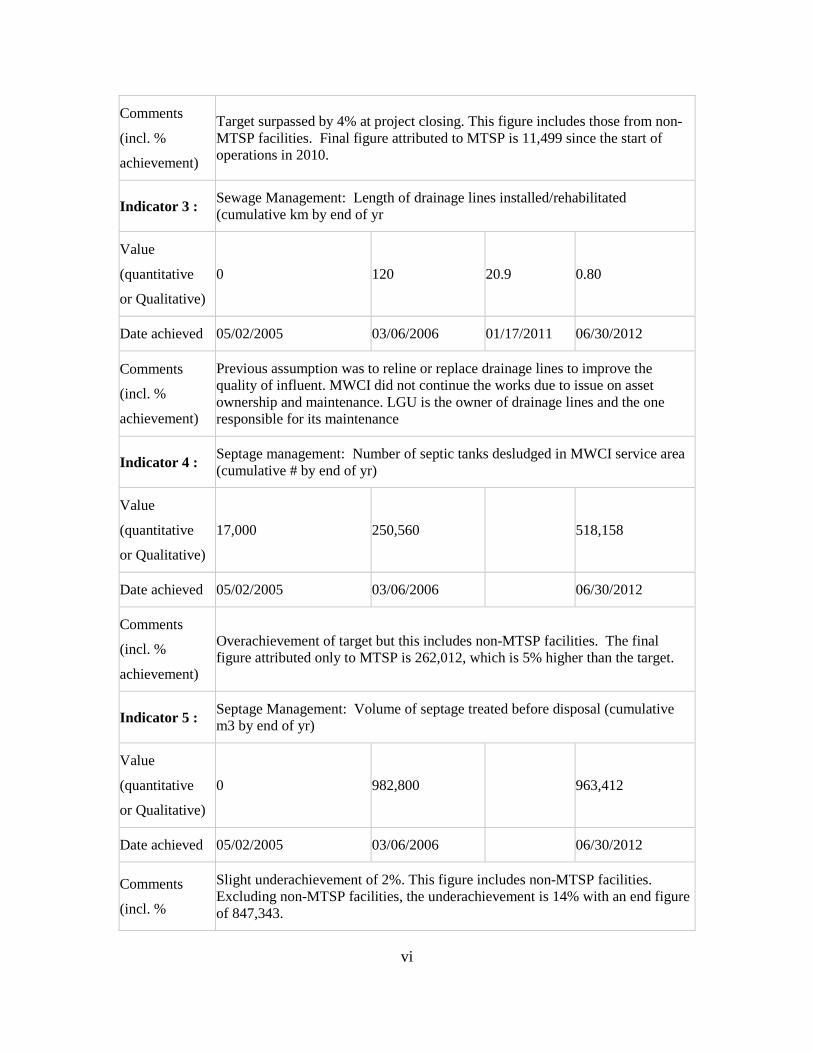
vi
Comments
(incl. %
achievement)
Target surpassed by 4% at project closing. This figure includes those from non-MTSP facilities. Final figure attributed to MTSP is 11,499 since the start of operations in 2010.
Indicator 3 : Sewage Management: Length of drainage lines installed/rehabilitated (cumulative km by end of yr
Value
(quantitative
or Qualitative)
0 120 20.9 0.80
Date achieved 05/02/2005 03/06/2006 01/17/2011 06/30/2012
Comments
(incl. %
achievement)
Previous assumption was to reline or replace drainage lines to improve the quality of influent. MWCI did not continue the works due to issue on asset ownership and maintenance. LGU is the owner of drainage lines and the one responsible for its maintenance
Indicator 4 : Septage management: Number of septic tanks desludged in MWCI service area (cumulative # by end of yr)
Value
(quantitative
or Qualitative)
17,000 250,560 518,158
Date achieved 05/02/2005 03/06/2006 06/30/2012
Comments
(incl. %
achievement)
Overachievement of target but this includes non-MTSP facilities. The final figure attributed only to MTSP is 262,012, which is 5% higher than the target.
Indicator 5 : Septage Management: Volume of septage treated before disposal (cumulative m3 by end of yr)
Value
(quantitative
or Qualitative)
0 982,800 963,412
Date achieved 05/02/2005 03/06/2006 06/30/2012
Comments
(incl. %
Slight underachievement of 2%. This figure includes non-MTSP facilities. Excluding non-MTSP facilities, the underachievement is 14% with an end figure of 847,343.

vii
achievement)
Indicator 6 : Percent of BOD reduction in the septic tanks in a sample not smaller than 0.5%/yr (% average reduction)
Value
(quantitative
or Qualitative)
Around 10% Around 20% Around 20%
Date achieved 05/02/2005 03/06/2006 06/30/2012
Comments
(incl. %
achievement)
Approximation only based on previous studies. Baseline 10% and the 20% reduction came from MTSP Feasibility Studies. No actual sampling done.
Indicator 7 : Institutional Strengthening: Number of people reached by public information campaign (#/yr)
Value
(quantitative
or Qualitative)
0 957,000 3,723,934
Date achieved 05/02/2005 03/06/2006 06/30/2012
Comments
(incl. %
achievement)
Target surpassed. MWCI intensified its program for public information campaign in view of the Supreme Court decision to clean up Manila Bay.
Indicator 8 : Institutional Strengthening: Percent increase in take-up rate of desludging service (% take-up rate/yr)
Value
(quantitative
or Qualitative)
0 Yes Yes
Date achieved 05/02/2005 03/06/2006 06/30/2012
Comments
(incl. %
achievement)
Yes indicates an increase. Based on Results Indicator under Component Two: Number of septic tanks desludged in MWCI service area, an average increase of 50,000 septic tanks per year from 2008 to 2012.
Indicator 9 : Institutional Strengthening: Prepared follow-up wastewater and sanitation

viii
program
Value
(quantitative
or Qualitative)
0 Yes Yes
Date achieved 05/04/2005 03/06/2006 06/30/2012
Comments
(incl. %
achievement)
'Yes' indicates there were follow-up programs. MWCI has done (1) wastewater reliability projects for existing facilities; (2) feasibility studies; (3) campaign to promote public awareness on Sanitation & Sewerage and (4) follow-up lending such as MWMP
G. Ratings of Project Performance in ISRs
No. Date ISR
Archived DO IP
Actual Disbursements
(USD millions)
1 05/19/2006 Satisfactory Satisfactory 0.00
2 12/06/2006 Satisfactory Satisfactory 3.31
3 06/21/2007 Satisfactory Satisfactory 8.18
4 05/20/2008 Satisfactory Satisfactory 12.42
5 05/05/2009 Satisfactory Moderately Satisfactory 17.41
6 06/18/2010 Satisfactory Satisfactory 30.23
7 12/06/2010 Moderately Satisfactory Satisfactory 31.40
8 10/25/2011 Moderately Satisfactory Moderately Satisfactory 36.57
9 08/07/2012 Moderately Unsatisfactory Moderately Satisfactory 39.40

ix
H. Restructuring (if any)
Restructuring Date(s)
Board Approved
PDO Change
ISR Ratings at Restructuring
Amount Disbursed at
Restructuring in USD millions
Reason for Restructuring & Key Changes Made
DO IP
06/25/2010 N S S 30.23 Extension of closing date from June 30, 2010 to June 30, 2012 to complete all project activities
01/17/2011 N MS S 31.40
1) deletion of 3 subcomponents (Ilaya, Manggahan and Tapayan); 2) addition of Fort Bonifacio STP; 3) revision of targets of outcome and results indicators affected by the deletion of STPs; 4) reallocation of loan proceeds among expenditure categories
I. Disbursement Profile


1
1. Project Context, Development Objectives and Design Context at Appraisal 1. Country and Macro Context. The Manila Third Sewage Project (MTSP) was prepared under the 2002-2005 Country Assistance Strategy (CAS) (Report No. 24042-PH). The CAS supported the Medium Term Philippine Development Plan (MTPDP) for 2001-2004 which set an overarching goal of reducing poverty, as modest economic growth and poor poverty reduction had characterized the economic situation in the Philippines, with population growth and urbanization being among the challenges to significantly reducing poverty and increasing access to basic services including water and sanitation. The CAS included a focus on efficient provision of services including water supply and sanitation. The subsequent CAS (Report 32141-PH) covering 2006-2008 aimed to support recognized successes in delivering public services by applying lessons from past engagement. MTSP (under preparation at the time) was noted in the CAS for both the investment financing and the regulatory capacity strengthening it would provide.
2. The macro-economic environment at this time was mixed. While the GDP growth rate in the Philippines between 2001 and 2006 was 4 to 5%, it was below both its regional neighbors (over 8% in the same period) and its perceived potential. In addition, a deteriorating fiscal environment resulted in increased government allocations to mandated expenditures crowding out allocations to economic and social services and public investments. Finally, the economic environment was impacted by the political environment of the period. The political and economic reforms that the Government of the Republic of Philippines (GOP) had undertaken in the 1990s were undermined by a series of scandals and allegations in the 2000s which created a perception of political instability. Metro Manila was an important economic center, accounting for 36% of GDP in 2003.
3. Sector Context. Water and sanitation issues had long been a development challenge for the Philippines, and Metro Manila in particular. To mitigate the environmental and health impact of water pollution, the GOP enacted water-related laws and policies over time. Enforcement, however, was weak due to inadequate resources, poor statistics, institutional fragmentation, and weak coordination between the central and local government units (LGUs). Water quality had been deteriorating in the Philippines and Metro Manila in particular due to population growth, urbanization and industrialization. Water had become critically constrained by the pollution of major rivers and surface water by untreated domestic and industrial wastewater. All waterways in Metro Manila were heavily polluted, with two key water courses – Marikina River and Pasig River – declared biologically dead. Residential sewage was the principal cause, followed by industries and solid waste dumped in the rivers. The Philippine Clean Water Act of 2004 (Republic Act No. 9275) provided an integrated, holistic, decentralized and participatory approach to abating and controlling water pollution. The Act required treatment of wastewater to ensure clean drinking water.

2
4. Rationale for Bank Involvement. The World Bank Group had supported water and sanitation sector investments and reforms for over two decades and was well-placed to continue providing financing and implementation support through MTSP. Through its earlier projects1, the Bank had contributed to expanding water and sanitation services, supporting sector policy reforms and building institutional capacity. The International Finance Corporation (IFC) had been an investor over the same period, including loans and an equity investment in MWCI. The results of the public-private partnership (PPP) efforts were considered to have both positive effects and replication opportunities.
5. The project also supported stated goals of the MTPDP, including pursuit of the Clean Water Act aimed to “immediately address our worsening water quality situation ...in Metro Manila” among other things. The MTPDP also noted the expected increase in sewerage and sanitation services from the Manila Second Sewerage Project (MSSP).
Original Project Development Objectives (PDO) and Key Indicators
6. The original PDOs, as approved, were to (a) increase the coverage and effectiveness of sewerage service delivery in participating areas of Metro Manila through an integrated approach involving septage management, sewage management, and heightened consumer awareness of water pollution problems and solutions; and (b) establish the financial and technical viability of new approaches for sewage management in Metro Manila.
7. The PAD Results Framework indicators were as follows:
PDO Indicators
To increase the coverage and effectiveness of sewerage service delivery in participating areas of Metro Manila through an integrated approach involving septage management, sewerage management, and heightened consumer awareness of water pollution problems and their solutions
• Gradual increase in satisfaction of residents with sewerage/sanitation service delivery in participating areas, including health incidences of diarrhea
• Total Biochemical Oxygen Demand (BOD) removed by the project (tons/yr)
• Percent increase in take-up rate of desludging services (% take-up rate/yr)
To establish the financial and technical viability of new approaches for sewerage management in Metro Manila
• Number of sewage treatment plants treating combined flows in a sustainable manner that comply with relevant discharge standards
• Cost of operation in an acceptable range
1 Manila Water Supply II, Ln 1615-PH (1978); Manila Sewerage and Sanitation Project, Ln 1814-PH (1980); Metropolitan Manila Water Distribution Project, Ln 2676-PH (1986); Angat Water Supply Optimization Project, Ln 3124-PH (1989); Water Supply and Sanitation Project, Ln 3242-PH (1990), Manila Second Sewerage Project, Ln 4019-PH (1996).

3
8. The PDOs were not changed.
Main Beneficiaries
9. The beneficiaries were identified as about 3.3 million Metro Manila residents and stakeholders in the MWCI service area supported by the project. Benefits included increased sewerage coverage from about 8% to 30%, increased sanitation services from around 1.5% to 100%, as well as reduced water pollution, improved public health and demonstration of the viability of the new approach to affordable sewerage management. An additional identified benefit was improved soil condition and crop yield expected from application of treated septage as fertilizer in the volcanic lahar-affected areas.
Original Components (as approved)
10. The MTSP had three components: • Sewage Management (US$52.4 million at appraisal) component included the
construction of ten (10) sewage treatment plants (STPs), upgrading of two communal septic tanks to secondary treatment plants, and rehabilitation and construction of collection networks;
• Septage Management (US$23.9 million at appraisal) component which included procurement of vehicles for pumping-out septage from septic tanks (fecal tankers) and two septage treatment plants (SPTPs);
• Institutional Strengthening (US$1.9 million at appraisal) component which included (a) the carrying out of a public information campaign on the benefits of sewerage and sanitation services, and on the best practices of proper disposal of sewage, and (b) assistance in preparation of follow-up programs for wastewater and sanitation improvements.
Revised Components and other significant changes
11. No revisions were made in the project components. However, through project restructuring, subcomponent changes were made, as well as revision to affected indicators and reallocation. MTSP was restructured twice mainly due to delays with subcomponents of the sewage management component. Both restructurings were approved at Management level.
12. The first restructuring was approved on June 25, 2010 granting a request for a 2-year extension of the MTSP closing date, from June 30, 2010 to June 30, 2012 to enable the completion of delayed Sewage Management Component sub-projects.
13. A second restructuring was approved on January 17, 2011. It included changes to the Sewage Management component which continued to experience implementation delays due to land issues and greater-than-anticipated technical difficulties. The key changes were (a) deletion of three STPs; (b) the addition of one STP identified as a replacement for those dropped; (c)

4
revision of targets of outcome and results indicators affected; and (d) reallocation of loan proceeds. See Table 1 for a summary of the subproject changes over the life of the project.
Table 1. Subproject Modifications
Sewage Management Components PAD Restructured ICR
Riverbanks system 1. Pineda/ Capitolyo (underground) Yes No change Completed 2. Ilaya (underground) Yes Dropped MWCI financing 3. Poblacion (above flood retention pond) Yes No change Completed
Sanitation for low-income communities 4. Pinagsama (Signal Village) Yes No change Completed 5. Manggahan Floodway Yes Dropped MWCI financing
Quezon City-Marikina (underground) upgrade 6. East Ave Yes No change Completed 7. Road 5 (Project 6) Yes No change Completed 8. Olandes No Added Completed
Taguig Systems 9. Tapayan Yes Dropped 10. Fort Bonifacio Taguig STP (Bay Breeze) Yes Added, then
Redesigned MWCI financing
Technical Assistance through the GEF
14. At the request of government, a grant of US$ 5.0 M was provided by the Global Environmental Facility (GEF) Pollution Reduction Investment Fund for Large Marine Ecosystems of East Asia in June 2007 to strengthen the policy environment in the provision of sewerage and sanitation services in Metro Manila as a companion project to MTSP. This grant sought to (a) identify impediments to cooperation among sector agencies, and to non-conventional investments in sewerage and sanitation; (b) assist MWSS in pursuing higher investments in sewerage and sanitation by its concessionaires, and in piloting suitable technology in septage disposal; and (c) help with project management, monitoring, evaluation and dissemination. The MTSP collaborated and benefited from the initial outputs of the grant particularly in the restructuring of the sewerage and sanitation tariff, and the development of consumer satisfaction survey instrument for sewerage and sanitation services.
5
2 Key Factors Affecting Implementation and Outcomes
Project Preparation, Design and Quality at Entry
15. Project Preparation: MTSP was the third project between the Bank and Philippines that focused on improving the delivery of sewerage and sanitation services in Metro Manila. Its preparation was supported by extensive background analysis gained through the MSSP under supervision at the time and previous Bank involvement. It was highly relevant and responded to MWSS priorities. It supported the CAS focus on efficient provision of basic services.
16. It benefitted from the experience gained in the previous projects and made efforts to identify and incorporate lessons learned. For example, its design approach to build and expand small treatment facilities in Metro Manila as a least cost solution was justified on an economic basis. In addition, this approach fit the land availability constraints and the lack of public support for large scale construction-related disruptions in Metro Manila. The institutional strengthening component was included because the importance of adequate public information was learned from previous experience, including an Inspection Panel complaint during MSSP which related to the disposal of septage in the ocean2. MTSP was designed to implement alternatives based on the ocean disposal experience. Further details on Bank involvement in Metro Manila wastewater development is provided in Annex 9.
17. Assessment of project design. Based on experience and available information at the time of appraisal, MTSP can be considered as appropriately designed. The Project Development Objectives, components, and organization were realistic and not overly complex. Although the water and sanitation sector in the Philippines was comprised of multiple organizations, the number involved in the project was limited and the proposed Borrower and Implementing Agency were long-standing Bank partners with capacity to comply with Bank policies and procedures. There were no co-financing agencies.
18. The three components covered a clearly defined geographic area with high population densities in need of services. It was designed to demonstrate innovative approaches that would have significant implications on the future development of sewerage and sanitation improvement projects in the entire country. The project design met Bank fiduciary, social and environmental safeguard policies, including public disclosure of all required documents. Stakeholder engagement took place and all consultations were documented by MWCI. The beneficiary communities actively cooperated with and participated in the public consultations.
19. Risk identification was adequate and a number of assessed risks affected project implementation and contributed to restructuring. However, it is not clear whether the proposed
2 The Inspection Panel subsequently concluded that the requester failed to meet eligibility criteria and did not recommend to Executive Directors a full investigation. See ICR 35539-PH for detail.

6
risk mitigation measures were put in place. For example, to mitigate risk that land purchase agreements were not signed, it was proposed that purchase agreements for key components were signed before appraisal which did not seem to have happened. Natural disaster was not identified as a risk. Given its vulnerability to natural disasters including tropical cyclones due to its geographical location, identification of natural disaster risk may have been warranted. Typhoon Ondoy and its aftermath in 2009 proved to be a factor in implementation delays and contributed to the need for restructuring. At the same time, it proved the appropriateness of the design of STPs constructed under the project.
20. There was no formal Quality at Entry review for the project. This ICR review concludes that Quality of Entry was Moderately Satisfactory.
Implementation
21. Implementation Arrangements. LBP and MWCI had experience implementing Bank-financed operations. LBP as the Borrower was responsible for ensuring that MWCI was in compliance with the terms of the legal agreements and covenants. MWCI was responsible for technical aspects of the project, from engineering studies and designs to public consultations and disclosures. MWCI was also responsible for submission of project progress reports. Project implementation progressed unevenly from the beginning, with the implementation of two components ahead of schedule early on while the third (and largest) component experienced delays, a dynamic that continued throughout the life of the project.
22. Restructuring was useful in addressing risks to achievement of project objectives but the length of time to finalize and process the restructuring negatively impacted its intended purpose of ensuring PDO achievement.
23. Mid-Term Review. The MTR was conducted in March 2008, slightly later than originally planned (January 2008). The key issues discussed were use of restructuring to address project delays and possible additional financing for newly identified activities.3 The MTR rated the project as Satisfactory and expected to address the causes of implementation delays through the agreed restructuring. The restructuring was only approved in January 2011, less than 18 months before the project closing date. The result was that one STP could not be completed by the closing date, and others were changed to MWCI internal financing. All STPs are expected to be completed. At project closing, six of the revised target of seven STPs were completed. The final ISR DO rating was Moderately Unsatisfactory due to the realization that one project PDO would not be fully achieved and a significant loan amount would be cancelled.
3 It was later agreed to begin preparations of a new project, the Manila Wastewater Management Project (MWMP) approved in May 2012.
7
24. Issues Affecting Implementation. Some of the key issues that affected project implementation were:
• Land Acquisition issues including delays or inability to sign land agreements in several planned sewage treatment project locations, and time needed to process resettlement of displaced persons in compliance with policy. Restructuring partially addressed this issue.
• Philippine Government Process which caused an effectiveness delay that got the project off to a later implementation start than planned and an extended length of time for finalization and submission to the Bank of the request for restructuring agreed during the MTR (March 2008) and not received by the Bank until November 2010. Approval by the Bank of the restructuring was subsequently delayed until January 2011 due to requirement for submission to Bank of latest audited financial statements of the LBP before processing the restructuring.
• Typhoon Ondoy, which struck the Philippines in September 2009, was a major unexpected event that factored into the slower-than-planned restructuring, but also illustrated the resilience of a well-designed septage treatment plant to a natural disaster of the scale of Ondoy. The aftermath of Typhoon Ondoy also contributed to the inability to complete the largest STP and consequently the loan cancellation processed at project closing.
• Political and social issues including cases of local opposition to proposed small scale sewerage treatment plants in their areas, political turn-over at the local level (mayors) and election-related decisions such as ban on excavations in the year prior to elections.
25. There was no formal Quality of Supervision review for the project. This ICR review concludes that Quality of Supervision was Moderately Satisfactory.
Monitoring and Evaluation (M&E) Design, Implementation and Utilization
26. The Monitoring and Evaluation (M&E) arrangements assigned responsibility for data collection to MWCI and required annual reporting updates.
27. The M&E framework could have been better designed in terms of selecting appropriate indicators and targets that were well-defined and measurable. Not all of the indicators had effective collection methods, available baseline, or were able to monitor progress to achievement of PDOs. Two out of the five outcome indicators did not have quantitative targets. Some indicators were open to interpretation, others lacked clarity (i.e. scope of coverage whether project or total MWCI concession area or how to assess “acceptable” cost of operation) or were confidential MWCI figures.
28. In terms of M&E implementation, the key performance indicators were collected from the different MWCI departments and the MWCI Program Management Department collected, analyzed and summarized the data in a report for submission to the World Bank and MWCI

8
management on an annual basis as required. There was frequent rotation of staff working on M&E and some concern on the accuracy and appropriateness of data reported. To illustrate, it was noted that some key indicators exceeded targets even though the indicators should have been affected by project implementation delays. No changes to the M&E framework or process were undertaken during implementation.
29. The institutional impact of M&E on MWCI was positive. To meet the M&E requirements of the project, MWCI obtained new equipment and technologies to evaluate the performance of its treatment plants. MWCI has a keen interest in assessing better ways to monitor its own performance and make decisions, including related to MTSP facility operations. For example, to effectively monitor the efficiency of the septage treatment plants, MWCI adopted the use of new technologies, such as Variable Frequency Drive (VFD). For BOD removal monitoring, MWCI included the upgrade of an additional pumping station in East Avenue project to comply with company reliability targets. In the case of Olandes STP, MWCI noted that the influent characteristics were lower than expected and adjusted chlorine levels. Based on continued MWCI motivation to monitor and manage using data, the expected future impact of M&E is positive.
Safeguards and Fiduciary Compliance
Fiduciary Safeguards Compliance
Overall rating on fiduciary safeguards compliance: Satisfactory 30. Fiduciary (Financial Management and Procurement) policies and procedures were generally complied with during the life of the project. The financial management shortcomings noted during the project life such the delayed submission of audited financial reports to the Bank as required by the loan agreement were addressed and resolved. The borrower addressed identified issues and there was no indication of substantial weaknesses in the overall control framework. The financial management system operated well with only moderate Bank supervision. LBP and MWCI were able to provide substantive financial management information. The overall procurement performance of the project was satisfactory although some difficulties were encountered. Procurement plans were prepared and updated regularly during implementation. MWCI enhance its capacity to handling procurement for large or complex contracts, in addition to assigning and training new procurement staff. Capacity limitations resulted in occasional delays and in one case retendering of a contract. Post review was conducted on sample contracts. Procurement records were maintained but not always in a well-organized and comprehensive manner.
Environmental and Social Safeguards Compliance during Project Implementation
Overall rating on environmental and social compliance: Satisfactory.
31. Environmental and social policies and procedures were complied with. MTSP was a Category A project, with OP/BP 4.01 Environmental Assessment and OP/BP 4.12 Involuntary

9
Resettlement triggered. All required EA assessments were done and disclosed. A Resettlement Action Plan (RAP) was prepared and complied with. The project had positive environment and social benefits by improving health and living conditions and the environment.
32. Most of the lands acquired were owned by the government, either by the LGU or by a government agency such as the DENR, MWSS, MMDA and FTI. These lands were provided by the government free or by arrangement for the wastewater treatment project. Only one privately-owned property – for the North Septage Treatment Plant in San Mateo, Rizal – was acquired through a willing seller-willing buyer arrangement.
33. Environmental compliance monitoring arrangements included both internal and external audits. A third party auditor conducted regular monitoring of compliance to ECC conditions and EMP commitments. In addition, all environmental permits were secured and appropriately upda-ted as required. A detailed assessment of MTSP’s compliance with environmental requirements is in Annex 5.
Post-completion Operation/Next Phase
34. The transition to post-completion operation is expected to be seamless. MWCI will operate and maintain the facilities and equipment constructed or procured under MTSP. As the operator for the east zone, it is in their interest to sustain and even enhance the improvements. MWCI has been an effective and reliable service provider. The risk that the improvements will not be sustained is considered low. Mechanisms for regular review and adjustments of tariff are in place. There are systems in place and a culture among MWCI staff and managers on the need to cut costs which will ensure the viability of the improvements. Environmental monitoring and planning, as well as regular consultation with customers and residents, have been institutionalized within MWCI.
35. The approval of the successor project, a US$275 million loan for the Metro Manila Wastewater Management Project (MWMP) will ensure that the Bank can continue contributing to sustaining the benefits of MTSP. The MWMP expands support to MWCI in the east zone and MWSI in the west zone. The lessons learned from MTSP were incorporated in the MWMP project design. To illustrate, the concessionaires are now very careful in the selection and acquisition of project sites, and using the willing-seller- willing-buyer approach that proved most effective under MTSP. At project launch, all project sites except one had been secured with proper documentation under finalization.
3 Assessment of Outcomes
Relevance of Objectives, Design and Implementation
36. The project’s objectives, design and implementation remain highly relevant to the Philippines and Metro Manila today. Addressing water and sanitation issues and the effects of urbanization are included in the 2004-2010 MTPDP and aligned with the CAS objective of better
10
public service delivery increasing access to safe drinking water and sanitation services inter alia. The efforts that began with the passage of the 2004 Clean Water Act were reinforced by the 2008 the Supreme Court order to clean up Manila Bay. As the capital region, Metro Manila has significant influence on the national agenda on water and environmental quality. MWMP incorporated lessons from MTSP and is positioned as part of the Bank’s broader program of support for Metro Manila urban renewal which includes work on flood management, disaster risk management, and slum upgrading.
Achievement of Project Development Objectives
37. The overall achievement of the Project Development Objectives is rated Moderately Satisfactory. 38. The achievement of the PDOs is rated as Moderately Satisfactory. Of the two PDOs, one was fully achieved and one was partially achieved. Three of the five PDO indicators were satisfactory while two were not as a direct result of the lower than targeted completion of STPs. Achievement of the PDOs and the five indicators is discussed in the following paragraphs.
PDO - Increasing coverage and effectiveness of sewage services in Metro Manila. This PDO was partially achieved. The sanitation investments (North and South Septage Treatment Plants) were completed early and sanitation coverage increased from 1.5% to 100%, entirely attributable to the project. The sewerage investments, however, did not achieve full coverage. Six of the seven STPs agreed in the restructuring were completed. The sewerage coverage of MWCI increase increased from 3 percent in 2003 to 24% in 2011 (target is 30% by 2012); MTSP accounts for 3% of sewerage coverage in 2011.
Indicator – Gradual increase in satisfaction of residents with sewerage/sanitation service delivery in participating areas. This indicator had no baseline and only a yes or no measurement. MWSS client surveys received 100% satisfaction rates. In addition, there is widespread affirmation of health and environmental benefits to beneficiaries.
Indicator – BOD removed by sewage and septage treatment plants. The targets were not achieved. This is attributable to the lower than projected STPs completed (6 out of 7 of which 3 were operating and 3 were being commissioned at project closing).
Indicator - Percent increase in take-up rate of desludging services. Desludging increased at a satisfactory pace.
PDO - Establishing the financial and technical viability of new approaches for sewage services in Metro Manila. This PDO was achieved. The positive innovative approaches used have been widely recognized, including a project innovation award from the International Water Association (IWA) in 2010 for the Olandes STP. A highly significant value of the project was its demonstration effect of alternate institutional and technical approaches to sewerage and sanitation services delivery that comply with environmental standards. MTSP piloted the use of combined sewer and drainage systems in the Philippines, and applied a decentralized approach to

11
the delivery of sewerage services. It introduced innovative designs that addressed land availability constraints. It expanded the practice of safe disposal of treated septage as soil conditioner in lahar-laden areas in the north of Manila. These project aspects provided significant insights that were incorporated in the design of the successor project, MWMP. The approach will also have high relevance for improvement of the design and implementation of wastewater projects outside of Manila and in Southeast Asia, in general.
Indicator - Number of sewage treatment plants treating combined flows in a sustainable manner that complies with relevant discharge standards. The completion of six STPs out of eight targeted resulted in lack of achievement of this indicator. The STPs were operating at a lower than capacity levels.
Indicator - Cost of operation in an acceptable range. This indicator had no baseline and only a target range. The target of about 20% was reached.
Efficiency
The Efficiency rating is Moderately Satisfactory.
39. During project preparation, least cost analysis was applied to both the overall design approach in the MWCI concession area and to the choice of project designs and priority sewerage and sanitation investments for the individual subprojects. The initial designs of the subprojects were to be refined further following comments made at appraisal that were directed at increasing coverage and improving effectiveness. While it was clear that there were benefits particularly relating to environmental and health improvements, they could not be reliably quantified. No economic rate of return estimated for the project during appraisal. The project supported the 2003 rate rebasing agreements, and therefore investments had to be within the approved tariff levels.
40. The economic rates of return of the subprojects funded under the sewage and sanitation management components (98% of total project cost) were calculated. Project benefits consist of environmental benefits attributed to a reduction in BOD loading in the receiving water bodies, land appreciation particularly for the riverbanks subprojects, and health benefits from the septage management subprojects. Costs included capital investment and operation and maintenance costs, net of tax and contractors’ profits. Based on this analysis, five subprojects had positive economic rates of return and three had negative rates of return. The negative rates of return were due to higher actual investment costs with final designs reflecting more accurate cost estimates and definite construction approaches, and lower benefits due to lower utilization rates than projected. The overall economic rate of return calculated for the project is over 30%.
41. Cost recovery. The Concession Agreement is designed to ensure full cost recovery (excluding loan transaction costs), and allows cross subsidy between water and sewerage/sanitation through the ‘rate rebasing’ exercise every five years. Part of the MTSP costs were included in the 2003 rate rebasing, and the balance in the 2008 rate rebasing, to be repaid

12
over the life of the Concession Agreement (2022). In 2008, the government approved a 15-year extension of the concession period up to 2037 to mitigate the impact on the tariffs of increased investments in water and wastewater improvement projects, and to allow the concessionaires to pursue the mandate imposed by government to accelerate implementation of wastewater projects to comply with the 2004 Clean Water Act and the 2008 Supreme Court Decision on the clean-up of Manila Bay. This meant that the recovery of the MTSP costs likewise extended to 2037. Economic and financial analysis are detailed in Annex 3.
Overall Outcome Rating
42. Taking into consideration the relevance, PDO achievement and efficiency, the outcome is rated Moderately Satisfactory. Highly relevant projects require well-designed PDOs and indicators with a well-functioning M&E implementation. Efficiency of Bank investments contributing to a broader effort is not always easily quantified.
43. Other factors affecting the overall outcome rating include • Low loan utilization (62%) despite a two-year loan extension primarily due restructuring
delays and Typhoon Ondoy’s impact on government and MWCI which did not readily allow replacement of non-moving STPs, and resulted in the payment of commitment fees by MWCI.
• When accounting for only MTSP components, the achievement of outcome indicators was mixed, and tended to be below target. The project’s support for the overall MWCI program, and the innovative designs and approaches it introduced provided invaluable insights to MWCI and the successor project.
• Subprojects that were operating at less than full capacity based on a 2011 population and demand survey; however, five subprojects are projected to reach full capacity ahead of time
• Cost recovery being extended to 2037.
Justification of Overall Outcome Rating
44. Combining the relevance, the achievement of PDOs, and efficiency, an overall outcome rating of Moderately Satisfactory is given. The justifications are provided in the respective sections above.
Overarching Themes, Other Outcomes and Impacts
Poverty Impact, Gender Aspects, and Social Development
45. Poverty Impact. MTSP has direct poverty impact. Increased access to clean water and sanitation reduces risk of disease and improves quality of life. The Pineda STP in Pasig is located in a poor to low-income community along the Pasig River where residents have attributed the following benefits and improvements to the project - cleaner environment, river water has no foul smell and natural color; increased fish population. There is increased awareness of the households to maintain this environment and also an appreciation of the free septic tank cleaning service.

13
46. Gender Aspects. MTSP benefits all residents but women in particular. Health issues such as diarrhea, cholera, skin diseases, urinary tract infection and other water-borne diseases are caused by contaminated water sources, dirty canals, creeks and rivers; wastewater and rain flooded streets; toilets that are difficult to flush or are overflowing are household problems which, in, have to generally taken care of by women. The reduction in such issues from improved sanitation increases time for income-generating activities and/or for doing other household chores.
47. Social Development. The contributions of the project to social development include the following: • Increased awareness and consciousness of individuals, households and communities on
household and community sanitation practices and associated health benefits. • Successful cooperation and close interaction among households, communities and local
authorities (LGUs) in environmental sanitation involved. • Better integration of services such as wastewater management, solid waste management,
clean drinking water and others focused on the need for clean and healthy communities. • Reduction in local government spending for health services and disease control, freeing
funds for other meaningful development projects. • Provision of recreational and social facilities increased social acceptability of the project and
heightened the awareness of the community about wastewater treatment and the need to keep their environment clean.
Institutional Change/Strengthening
48. The MTSP had impact on internal institutional arrangements at MWCI. A Stakeholder Affairs Office was established within MWCI to handle all activities which involve the participation and feedback from community stakeholders throughout the life of the project. Before MTSP, communities and residents were only involved at the start (public consultations) and end (inauguration) of the project. Secondly, all matters related to investment projects used to be handled only by the Program Management Department. During MTSP, other MWCI departments were harnessed to support various aspects of investment projects (e.g., Land, Stakeholder Affairs, and Strategy).
Other Unintended Outcomes and Impacts
49. There were several unintended outcomes noted observed, including: • MWCI received the 2010 Project Innovation Honors Award (Small Projects Category) for
the Olandes Sewage Treatment Plant. This award was given by the International Water Association (IWA) to recognize excellence and innovation in water engineering projects worldwide. Amongst other criteria, award selection was based on “social, economic and sustainable design and the future value to the water engineering profession”. The introduction of the MTSP facilities in the communities sparked a revival of urban renewal activities, particularly in Olandes and Pineda. Riverbanks were cleaned. Although there were added costs involved in redesigning and constructing the facilities, the improvements in other
14
community facilities (multi-purpose covered courts, parks, barangay office renovations, etc.) promoted even more social activities and interactions.
• Awareness and demand for sanitation and improved environmental conditions in the beneficiary communities increased. Additional improvements at the household-level sanitation facilities were noted within the community.
Summary of Findings of Beneficiary Survey and Stakeholder Workshops
50. Three focus group discussions (FGDs) were conducted in Pineda STP, Pasig; in Poblacion STP in Makati; and in North Septage Treatment Plant, San Mateo, and Rizal in June 2012. Overall, the findings and conclusions from the FGDs were positive. See Annex 6 for details.
4 Assessment of Risk to Development Outcome 51. This ICR rates risks to the sustainability of the development outcomes as moderate. Under the current institutional arrangements, MWCI has been operating effectively under the strict regulatory arrangements. Tariffs have regularly been adjusted following the provisions of the concession contract. MWCI is a well-managed, technically competent and financially stable institution that has demonstrated risk management capability.
52. There are some nonetheless risks to sustainability. First, increased unpredictability in weather patterns and accompanying floods are a cause of natural disaster risk. Flood control infrastructure in Manila in general is still undergoing massive rehabilitation and is not expected to be completed in the next 20 years. Second, land issues may continue to pose risk for expansion of sewage and sanitation services given the population density, difficulty in finalizing land transactions, and local resistance to some projects. Thirdly, low utilization rates for completed projects may be an indication of sustainability risk.
5 Assessment of Bank and Borrower Performance
Bank Performance
53. Bank performance during the preparation is rated Moderately Satisfactory. MTSP was prepared by the task team supervising MSSW. This contributed to project design based on latest lessons from experience. There was adequate due diligence in the proposed implementation arrangements reflected in the shift of borrower from MWSS to LBP in view of the concession. The preparation aspects which could have been done better were a) the M&E framework; b) the asset ownership issue with respect to the drainage pipes was not identified during preparation; and c) greater focus on preparing needed land acquisition agreements.
Quality of Supervision
54. Bank performance during implementation is rated Moderately Satisfactory. Fiduciary and safeguards policies were carefully assessed during the supervision missions. The
15
inadequacies in the M&E framework were noted during the various supervision missions; but minimal actions were taken to clarify the vague and unclear indicators and absence of baselines and targets. Task leader turn-over was high but does not seem to have negatively impacted implementation.
Justification of Rating for Overall Bank Performance
55. Throughout the project, the task team followed the overall project status, with attention to the status of the subprojects. It worked closely with MWCI to address lagging projects. In addition to regular technical support, the project had good fiduciary, environment and social safeguards monitoring and compliance reporting. The Bank provided immediate support to GOP and the project after Typhoon Ondoy and worked to reflect needed changes into the affected subprojects.
Borrower Performance
56. The performance of Government, represented specifically by the Department of Finance (DOF) and the National Economic Development Authority (NEDA) is considered Moderately Satisfactory. Government provided a generally supportive enabling environment for the project to succeed, including institutional, regulatory and pricing reforms. At the same time, bureaucratic delays between agencies caused delays in project implementation and restructuring as summarized earlier.
57. The Implementing Agencies (LDB, MSSW and MWCI) are rated Moderately Satisfactory. MWCI demonstrated commitment to achieving PDOs as they were aligned with their obligations under their concession agreement which they were motivated to achieve. The implementation arrangements (financial management, governance, procurement, reimbursements, compliance with covenants) and appointment of key staff was done in a timely manner. There was a distinct focus and effort placed on beneficiary and stakeholder consultations and involvement. Some implementation issues, however, could have been addressed in a more timely manner. More realism about the ability to resolve land acquisition issues would also have been beneficial.
Justification of Rating for Overall Borrower Performance
58. The counterpart institutions and agencies had adequate capacity to implement the project as well as sufficient familiarity with Bank policies and procedures. There were, nonetheless, delays in aspects of project implementation and restructuring due to slow internal processing on the side of the Borrower. The Borrower recognized subprojects that were lagging and worked with the Bank to address them. Some issues expected to be resolved, such as land agreements for some important subprojects, were unable to be resolved by project closing, resulting in under-achievement of PDO and partial loan cancellation. Overall, the performance of the borrower and implementing agencies is rated Moderately Satisfactory.
16
Lessons Learned
59. This section discusses some of the key lessons learned based on MTSP project experience.
60. On Use of Private Land vs. Public Land. MTSP experience is that purchase acquisition of private land, if available, for the project is more transparent, easier and less troublesome, in the long run. There were two types of land acquired during this project – public land and private land. Most of the land for the treatment plants was provided by the local LGU for “free”. However, the “free use” of the land had a cost to the sub-project because additional structures/facilities were requested in exchange of the “free use” of the land such as a covered sports/multi-purpose court; improvements to the barangay office, etc.
Table 2. Key Characteristics of Land Acquisition Options
Public Land Private Land
Ownership MMDA and various LGUs Manila Water, private individuals, etc.
Land Acqui-sition Mode
MOA or Usufruct Agreement between LGU and MWCI
Purchase Contract between a willing buyer and willing seller
Ease of Acquisition
• Easy if LGU is interested and committed.
• There is also a possibility of uncertainties and/or slackening of commitments. The original list of subprojects was changed because some LGUs were not able to de-liver the land they committed for the subproject.
• Delayed subproject implementation be-cause of delayed availability of land.
• Easy as long as land has no issues (for example, illegal settlers) and legal docu-ments are available.
Cost • Land is “free”, but conditions are set by some of the LGUs may make the in-vestment cost higher, e.g. Olandes Park; covered basketball courts in Pineda and Pinagsama plus and renovations to the ba-rangay office.
• Based on market prices and negotiations.
Social Safeguards
• GOP safeguard laws and policies on land acquisition and resettlement are used.
• Bank’s Environmental and Social Safe-guards Framework (ESSF) are followed.
61. On Technology Choice. The MTSP experience indicates that an assessment of the optimization of the design of the facilities and choice of technology is recommended. Conventional Activated Sludge process might not be the best technology option if the utilization rate remains low for an extended period of time (5-10 years after construction). Other technology options that may be phased or that are modular in design may be more energy efficient in the long run. Six Sewage Treatment Plants (STPs) and two Septage Treatment Plants (SPTPs) were financed under MTSP. All the facilities use the Conventional Activated Sludge process which

17
provides continuous flow aerobic treatment. As of August 2012, both SPTPs were operational while three out of six STPs are now operational. Civil works for the remaining three STP’s have been completed and are in varying stages of commissioning.
62. The option to use Conventional Activated Sludge process is a safe choice since it is proven technology and is robust in performance i.e. it can absorb shock loads. It is a conventional treatment process which provides stable treatment efficiency when operated properly. MWCI also has a long experience in operating Conventional Activated Sludge process facilities. However, the influent flows of the STPs come from combined sewage flows (4) and separate sewage flows (2). Total hydraulic capacity of the STPs is 54 MLD. Treatment efficiency reported by MWCI is between 96-97% efficient. This means that the STP achieves its designed effluent compliance targets 96-97% of the time. This is related to the relatively low utilization rates of the facilities, between 35 – 79%. The SPTPs also have low utilization rates of between 17-37%. Given these low rates of utilization, treatment efficiencies are expected to be high. The technology choice was based on expectation of high population density.
6 Comments on Issues Raised by Borrower/Implementing Agencies/Partners 63. Draft copies of this ICR were discussed and comments from the Borrower/Implementing Agencies/Partners were received and included in this Report. The Borrower’s ICR is still under preparation.

18
Annex 1. Project Costs and Financing (a) Project Cost by Component (in USD Million equivalent)
Components Appraisal Estimate (USD millions)
Actual/Latest Estimate (USD
millions) Percentage of
Appraisal
Sewage Management 46.10 33.80 73.31
Septage Management 20.90 17.00 81.33
Institutional Strengthening 1.90 0.80 42.10
Land Acquisition 0.60
Total Baseline Cost 69.50 51.00 73.38
Physical Contingencies 5.60 0.00 0.00
Price Contingencies 3.10 0.00 0.00
Total Project Costs 78.20 51.00 65.21
Front-end fee PPF 0.00 0.00 0.00
Front-end fee IBRD 0.30 0.00 0.00
Total Financing Required 84.40 51.00 60.42
(b) Financing
Source of Funds Type of Co-financing
Appraisal Estimate
(USD millions)
Actual/Latest Estimate
(USD millions)
Percentage of Appraisal
Borrower 20.40 10.48 51.37
International Bank for Reconstruction and Development 64.00 40.56 63.31

19
Annex 2. Outputs by Component
Project Component 1.The Sewage Management Component included the construction of sewage treatment plants, interceptor sewers, and pumping stations, repair of existing drainage, and upgrading of communal septic tanks to provide secondary treatment.
Name of Subproject PAD Restructuring ICR Riverbanks system Capitolyo/Pineda Yes No change Completed Ilaya Yes Replaced with
Fort Bonifacio MWCI financing
Poblacion (Makati) Yes No change Completed Sanitation for low-income communities Pinagsama (Signal Village) Yes No change Completed Manggahan Floodway Yes Dropped MWCI financing Marikina System Olandes (originally Quezon City Marikina system)
No Added Completed
Quezon City systems upgrade East Ave Yes No change Completed Road 5 (Project 6) Yes No change Completed Taguig Systems Hagonoy Yes Dropped MWCI financing Labasan Taguig Yes Merged/expanded MWCI financing Fort Bonifacio/(Taguig Central STP Baybreeze)
Yes Merged/expanded MWCI financing
Project Component 2. The Septage Management Component provided vehicles for pumping out septage from septic tanks (fecal tankers) and support construction of septage treatment plants.
Subproject Revised Status 1. North SPTP (San Mateo) n/a Completed 2. South SPTP (FTI) n/a Completed 3. Purchase of Vacuum trucks n/a Completed
Project Component 3. The Institutional Strengthening Component would enhance the proposed project investments through (a) a public information campaign on the environmental benefits of sewage and sanitation services and best practices for the proper disposal of sewage, and (b) support for preparation of follow-up programs for sewage and sanitation improvements. MWCI has done (1) wastewater reliability projects for existing facilities to prevent downtime; (2) feasibility studies including the Master plan of Marikina, Quezon City and San Juan; (3) potluck campaigns (to promote public awareness on sewerage and sanitation services) and (4) the follow-up lending project is Metro Manila Wastewater Project (MWMP).

20
Annex 2a: Supplemental Table to F. Results Framework Analysis of the Data Sheet (MTSP)
Results Indicators Actual Values Component One: Sewage Management Baseline 2005 2006 2007 2008 2009 2010 2011 2012 Target Number of water connections in MWCI service area with sewage treatment service (in #/year). (Total; attributable to MTSP and non-MTSP facilities)
46,350 46,251 46,631 46,523 50,623 50,800 74,030 119,021 177,922 49,500
% increase (decrease) 0.82% -0.23% 8.8% 0.35% 46% 61% 49% MTSP only 0 5,120 19,761 77,137 49,500
% increase (decrease) 286% 290% Comments. Target surpassed, based on revised target, but figures include those from non-MTSP facilities. Final figure attributed only to MTSP is 77,137, 56% higher than the revised final target.
Baseline 2005 2006 2007 2008 2009 2010 2011 2012 Target
Volume of sewage treated before disposal (m3/year); (total; attributable to MTSP and non-MTSP facilities)
7,026 15,512 32,576 53,413 73,499 92,081 111,345 117,817 117,817 113,227
% increase (decrease) 110% 64% 38% 25% 21% 6% -0- MTSP only 1,827 7,318 9,206 11,499 113,227
% increase (decrease) 301% 26% 25% Comments. Target slightly surpassed by 4% at project end. However, this figure includes those from non-MTSP facilities. Final figures attributed to MTSP only are 11,499 as the STPs started operations in 2010.

21
Results Indicators Actual Values
Baseline 2005 2006 2007 2008 2009 2010 2011 2012 Target
Length of drainage lines installed or rehabilitated
0 0.80 120
Comments. This was not achieved since the indicator was not applicable after restructuring. Previous assumption was to reline or replace drainage lines to improve the quality of influent. MWCI did not continue the works due to issue on asset ownership and maintenance. LGU is the owner of the drainage lines and the one responsible for the maintenance. Component Two: Septage Management Baseline 2005 2006 2007 2008 2009 2010 2011 2012 Target Number of septic tanks de-sludged in MWCI service area (#/year); (total; attributable to MTSP and non-MTSP facilities)
17,000
106,015 151,037 256,146 314,529 379,884 436,350 488,497 518,158 250,560
% increase (decrease) 42% 70% 23% 21% 15% 12% 6% MTSP only 58,383 123,738 180,204 232,351 262,012 250,560
% increase (decrease) 112% 46% 29% 13% Comment. Target surpassed, but the figures previously reported included non-MTSP facilities. The final figure attributed only to MTSP is 262,012, which is 5% still higher than the target.
Baseline 2005 2006 2007 2008 2009 2010 2011 2012 Target
Volume of septage treated before disposal (m3/year); (total; attributable to MTSP and non-MTSP facilities)
0 116,069 324,127 533,437 709,187 870,077 963,412 982,800
% increase (decrease) 179% 65% 33% 23% 11%

22
Results Indicators Actual Values MTSP only 0 208,058 417,368 593,118 754,008 847,343 982,800
% increase (decrease) 100% 42% 27% 12% Comment. Slight underachievement of 2%. This figure includes non-MTSP facilities. Excluding non-MTSP facilities, the underachievement is 14% with an end figure of 847,343.
Baseline 2005 2006 2007 2008 2009 2010 2011 2012 Target
Percentage of BOD reduction in the septic tanks in a sample not smaller than 0.5%/year; (% aver reduction)
Around 10%
baseline studies done
Around 20%
Comment. The 10% baseline and 20% reduction target are assumptions from a previous MTSP Feasibility Study done in 2004. No actual sampling/measurements have been done to establish the baseline; to establish the target; and to determine the final result. Component Three: Institutional Strengthening Baseline 2005 2006 2007 2008 2009 2010 2011 2012 Target
Number of people reached by public information campaign (#/year)
0 987,980 1,023,225 1,281,181 1,508,097 3,723,934 957,090
% increase (decrease) 4% 25% 18% Comment. Baseline 2005 2006 2007 2008 2009 2010 2011 2012 Target
Percent increase in take-up rate of desludging service (% take-up rate /year) ; (total; attributable to MTSP and non-MTSP facilities)
42% 70% 23% 21% 15% 12% 6%
MTSP only 112% 46% 29% 13%

23
Results Indicators Actual Values Comment. No quantitative value in the PAD. We compute the increase using the figures from Results Indicator under Component Two: No. of septic tanks desludged in MWCI service area. A 6% increase was achieved from 2011 to 2012 (total -MTSP and non-MTSP) and 13% for MTSP facilities only.
Baseline 2005 2006 2007 2008 2009 2010 2011 2012 Target
Prepared follow-up wastewater and sanitation programs
Yes Yes Yes
Comment. Yes indicates that there were follow-up programs. MWCI has done (1) wastewater reliability projects for existing facilities to prevent downtime; (2) feasibility studies including the Master Plan of Marikina, Quezon City and San Juan; (3) sharing (TOKA TOKA) campaign to promote public awareness on sewerage and sanitation services and (4) the follow-up lending project is MWMP.
24
Annex 3. Economic and Financial Analysis
Approach followed by the economic analysis at appraisal
The economic analysis applied at appraisal was least cost analysis which also guided the overall design approach of MWCI in providing sewerage and sanitation services in the east concession area. While the project clearly had benefits particularly relating to envi-ronmental and public health improvements, they could not be reliably quantified. Least cost analysis was applied in the context of ‘rate rebasing’ which is a five-yearly exercise during the concession period. The ‘rate rebasing’ exercise allows the concessionaires to reset the tariff based on agreements reached with government on actual performance in the previous five-year period, performance targets set for the next period, and an agreed Appropriate Discount Rate (ADR). The proposed tariff is then subjected to public hearing and political acceptability, and once a final tariff is agreed, coverage targets and service levels are adjusted as necessary. At the time of appraisal, MTSP was supporting service coverage targets and tariffs approved in the 2003 rate rebasing exercise.
The agreements reached on sewerage and sanitation services in the 2003 rate rebasing exercise were an attempt to address institutional and implementation issues encountered in the past of trying to implement a centralized, separate sewerage system in Metro Manila. The issues included (a) the need to acquire significant land to host large sewage treatment plants and to install separate sewer systems, which would have resulted in additional cost to the tariff of P10 per cum. (2000 prices) deemed to be politically unacceptable, (b) a low willingness to pay for sewerage services, (c) a lack of available land and the high cost of acquisition where land was available, (d) low tolerance of local governments for traffic and community disruptions in the installation of sewer networks, (e) unclear enforcement of sewerage connections, and (f) other factors such as termination of ocean disposal of septage. The revised approach adopted in 2003 reversed the trend of service coverage targets in the 1997 Concession Agreement with the targets for sewerage services substantially decreasing, and compensated with an increase in sanitation services. The government also allowed the use of combined sewage-drainage systems and the application of a decentralized approach involving regional/sub catchments and small capacity treatment plants spread out across the municipalities, as service coverage targets were area-based. This revised approach was estimated to cost P4.00 per m3 (2004 prices), a more politically-acceptable level at that time.
Given that service coverage targets would have to be met within the approved tariffs, de-sign and implementation of subprojects had to be the least cost possible. The identification of sites for sewage management projects and determination of project scope were based on land availability with priority given on land owned by local governments and other government agencies (i.e., MWSS, MMDA, and DENR). Design of sewage treatment plants (STPs) considered the topography and lay out of existing drainage

25
systems, DENR standards of effluent discharge, and cost-efficient technologies. Efforts were made during appraisal to maximize catchment areas, increase concentration of influents to maximize treatment efficiency, and introduce innovative designs that addressed the constraints posed by limitations on land availability through building on synergies with ongoing and planned projects on flood control, housing developments and urban renewal. Septage management subprojects were based on meeting the sanitation targets set for 2011 and standards for safe disposal of treated septage. Treated septage would be applied in lahar-affected areas in the north of Manila as soil conditioner; building on the practice adopted by MWCI after ocean disposal was discontinued under MSSP. Septage was to be treated to mitigate any possible health impacts on the population of the disposal sites, and according to standards aligned with local environmental practices and reflecting global standards (i.e., US-EPA standards).
The benefits identified at appraisal were reduction in BOD load in the surrounding rivers and creeks, public health benefits and improvement in well-being, improvement in land condition in lahar-affected areas, and institutional benefits through approaches on sewage management.
Assessment of efficiency at completion Efficiency in the use of the loan
58% of the loan was disbursed as of loan closing date despite a two-year extension. The undisbursed portion of the loan was related to the sewage management component. This amount would have been used for the development of Taguig Central Sewage Project (Baybreeze) involving the construction of a 40 MLD STP, the largest STP that would have been funded under this project, and its corresponding sewer network, and Taguig Northeast Sewerage Project (Fort Bonifacio STP) with a treatment capacity of 10 MLD. However, these subprojects encountered political and land acquisition issues that delayed project completion beyond the loan closing date. The economic benefits from the Taguig subprojects not reached under MTSP are planned for MWCI funding. Full utilization of the loan and realization of economic and financial benefits might have been possible had the project been implemented under a programmatic approach rather than through a SIL which requires a priori identification of specific investments to be funded. The SIL was less flexible for replacement of non-moving STPs with non-problematic ones without going through formal government approval processes which normally take time. Also, a consequence of the underutilization of funds was the payment of commitment fees4 by MWCI. Commitment charges are real costs absorbed by MWCI.
4 The commitment fee is an annual fee paid by the Borrower. For this project, it was estimated at 0.85% of the undisbursed portion of the loan for the first four years of the loan, and at 0.75%, thereafter.
26
Achievement of outcome indicators
The performance of project outcome indicators is mixed when accounting only for MTSP and not the global performance of MWCI. In terms of BOD removed by sewage and septage treatment plants, MTSP added to installed capacity of 88%; current installed capacity is 10,523 tons per year including 5,600 tons per year at project start. The target was 20,400 tons per year, indicating only 52% achievement. Accounting for MTSP only, the achievement of the target was 33%. In terms of increase in take-up rate of desludging services, MTSP contributed significantly to overall performance. MTSP contributed to an annual increase of 50%, on the average, for the period covering 2009 to 2012. The annual targets on the number of STPs were not achieved throughout the project period due to delays in land acquisition. Operating costs of new plants were 70% lower than those of the existing plants, achieving the target of 20% reduction.
On the outcome indicators by component, with the exception of the component on institutional strengthening where all targets were achieved, the performance of the components on sewage and septage management is weak when accounting for MTSP facilities only. For sewage management, the number of water connections with sewage treatment service in the east concession was achieved for the most part of the project period, of which MTSP contributed about 22% on the average. With regard to volume of sewage treated before disposal, MTSP contributed 7%, on the average, of the overall annual performance. For septage management, the annual targets on number of septic tanks desludged in the MWCI area were surpassed throughout the project period, and MTSP contributed to 38%, on the average, to MWCI’s overall annual performance. In contrast, the annual targets on volume of septage treated before disposal were not reached at all, although MTSP contributed to 80%, on the average, of MWCI’s overall annual performance.
MTSP’s contribution to the overall improvement in the water quality was not expected to be significant even at appraisal given its relatively low financing proportion to MWCI. The higher value of the project was to be on the demonstration effect of alternative institutional and technical approaches to delivery of sewerage and sanitation services while complying with environmental standards, which it did by providing invaluable insights to MWCI and the successor project, MWMP.
Design and cost variances in the subprojects
There were 14 subprojects identified for funding at appraisal for sewage and septage management. At restructuring, four STPs in Taguig were consolidated into one STP, and two other STPs were dropped due to lack of land as well as political and land acquisition issues that could not be resolved within the project implementation period. Thus, eight were implemented under the project, of which six were STPs and two SPTPs. Those funded underwent design and substantial cost changes during project implementation.

27
The increase in cost from the time of appraisal to implementation was mainly due to final designs reflecting more accurate cost estimates and definite construction approaches; project costs at appraisal were based on project concepts and feasibility studies. There was also an increase in treatment capacity in some of the treatment plants from the original designs (see Table A3-1 below).
TABLE A3-1 - DESIGN AND COST VARIANCES OF THE SUBPROJECTS
Sub-projects
Cost variance Design capacity of plants Treatment process
Cost @ 2008 rate rebasing
Estimated cost of com-
pletion
Remarks Proposed Actual Remarks Proposed Actual Remarks
Riverbanks Se-werage Project (Poblacion, Ila-ya, Pineda/ Capitolyo)
P235 M P278 M for only 2 STPs
Cost increased by 18% funding 2 STPs rather than planned 3 STPs; Pineda STP – P90 M;
Poblacion STP – P188 M; Ilaya STP was dropped from the project.
Average dry wea-ther flow – 7,815 m3/d for 3 STPs
Average dry wea-ther flow – 15,000 m3/d for 2 STPs
Total treatment capacity doubled based on updated projec-tions.
Sequen-cing batch reactor (SBR)
Conventio-nal activa-ted sludge (CAS)
Based on least cost op-tion that re-sulted from bidding
Sanitation for Low-income Communities (Pinagsama, east of Manggahan)
P403 M P211 M for only 1 STP
Updated cost covers only Pinagsama STP; Manggahan STP was dropped from the project.
13.9 MLD for 2 STPs
8 MLD for Pinagsama only
SBR Modified CAS due to space limitations
Based on least cost option that resulted from bidding
QC – Marikina Sewerage System (Olandes)
P161 M P231 M Cost increased by 43%.
10 MLD 10 MLD No change
SBR CAS Based on least cost op-tion that re-sulted from bidding
Upgrading of Existing Sani-tation Systems (East Avenue, Road 5)
P 440 M P504 M Cost increased by 15%;
East Avenue – P379 M; Road 5 – P126 M
East Avenue – 15 MLD;
Road 5 – 3.5 MLD
East Avenue – 17 MLD;
Road 5 – 4 MLD
Treatment capacity slightly increased.
SBR CAS Based on least cost option that resulted from bidding
Septage Treatment Plants (North SPTP, South SPTP)
P190 M P668 M Cost increased by 252%.
North SPTP – 586 m3/d; South SPTP – 815 m3/d + 2,000 m3/d STP
North SPTP – 586 m3/d; South SPTP – 815 m3/d + 2,000 m3/d STP
No change
SBR CAS Based on least cost option that resulted from bidding
Source: MWCI

28
Utilization rates
In terms of actual and projected utilization rates, five plants are estimated to reach full capacity ahead of the design year of 2022, advancing benefits from the investments. Three others ( Olandes STP, Road 5 STP, and South SpTP) may be operating at less than full capacity throughout the concession period based on UP-NEC’s recent survey on population and water demand conducted in 2011 (see Table A3-2 below). For the South SpTP, negotiations are underway with MWSI, the west zone concessionaire, and small-scale private septic tank cleaning contractors to use the plant on a fee basis. This will take up the slack in the utilization of the plant. For Olandes and Road 5 STPs, MWCI intends to monitor population growth in the coverage areas, and in time, make the necessary investments to maximize utilization of the plants.
TABLE A3-2: UTILIZATION RATES, MTSP SUBPROJECTS Subprojects 2012 2013 2014 2015 2037
Riverbanks Sewerage System
Pineda/Capitolyo (Pasig city) STP 79% 100% 100% 100% 100%
Poblacion (Makati city) STP 0% 100% 100% 100% 100%
Sanitation for Low income Communities
Pinagsama (Taguig city) STP 0% 100% 100% 100% 100%
Quezon City – Marikina City Sewerage System
Olandes STP 35% 39% 40% 40% 39%
Upgrading of Existing Sanitation Systems
East Avenue (Quezon city) STP 55% 97% 100% 100% 100%
Road 5 (Quezon city) STP 0% 77% 79% 80% 87%
Septage Management
North (San Mateo) SPTP 37% 84% 91% 100% 100%
South (FTI Complex) SPTP 17% 38% 40% 42% 52%
Source: MWCI
Economic rates of return (ERR) of subprojects
The project will potentially benefit close to 4 million people in the east concession area as against 3.3 million estimated at appraisal once all plants are made operational. The project contributed to increasing sewerage coverage of MWCI from 3% in 2003 to 24% in 2011 (target is 30% by 2012); MTSP accounts for 3% of sewerage coverage in 2011. Sanitation coverage increased from 1.5% to 100%, with the increase entirely attributable to the project.
Economic rates of return of the sewage and sanitation management subprojects (98% total project cost) were estimated. Project benefits consist of environmental benefits

29
attributed to a reduction in BOD loading in the receiving water bodies, land appreciation particularly for the riverbanks subprojects, and health benefits for the septage management subprojects. Costs included investment and operation and maintenance costs, net of tax and contractors’ profits. On a per subproject basis, five garnered positive economic rates of return and three, negative rates of return (see Table A3-3). The negative rates of return were due to higher actual investment costs arising from final designs reflecting more accurate cost estimates and definite construction approaches, and lower benefits due to lower utilization rates than projected. The economic rate of return for the entire project is over 30% (see Table A3-4).
Table A3-3: Economic rates of return by subproject
Sub-projects
Design Capacity (m3/d)
Population Served by 2037 (projected)
Pop. Equiv. based on plant design capacity5
Economic Investment Cost (PHP m)6
ERR
Riverbanks Sewerage System Pineda/Capitolyo (Pasig city) STP 4,000 38,462 38,462 66.7 48% Poblacion (Makati city) STP 11,000 105,770 105,770 139.8 39% Sanitation for Low income Communities Pinagsama (Taguig city) STP 8,000 76,924 76,924 150.5 -13% Quezon city – Marikina city Sewerage System Olandes STP 10,000 37,7447 96,154 171.9 28% Upgrading of Existing Sanitation Systems East Avenue (Quezon city) STP 16,700 160,056 160,056 281.6 -1% Road 5 (Quezon city) STP 4,000 33,5358 38,462 93.7 -10% Septage Management North (San Mateo) SPTP 586 1,010,037 1,010,037 204.5 38%
South (FTI Complex) SPTP 814 2,526,1269 4,850,242 292.3 41% STP 2,000 Total 56,800 3,988,654 6,376,10710 33%
Source of raw data: MWCI
5Population Equivalent (PE) is defined by the Department of Environment and Natural Resources (DENR) as 1 PE=34 g BOD5 per capita per day; 1 PE=130 litres per day. 6The economic investment cost is the financial investment net of 12% VAT and 20% contractor’s profit. 7Plant utilization is estimated to reach only 39% by 2037 based on UP-NEC population and demand survey of 2011. Estimated population served could change if the assumption of per capita water consumption is changed based on new surveys or updated population projections. 8Plant utilization is estimated to reach only 87% by 2037 based on UP-NEC population and demand survey of 2011. 9Plant utilization is estimated to reach only 52% by 2037 based on UP-NEC population and demand survey of 2011. 10This is number of population that would benefit if Olandes and Road 5 STPs, and South SPTP would operate at full capacity.

30
Environmental benefits. Environmental benefits are difficult to measure. Benefits were estimated based on willingness to pay for improved water quality, and using as proxy, the environmental fee of 20% of basic water bill. In the calculations, per capita water consumption was assumed at 130 liters per day, a return rate for wastewater of 80%, and a tariff of P25 per m3 (the average for 2011). Only consumers in the catchment area of the STP were included in the calculations, although benefits are expected to accrue to a larger population.
Increase in value of land. Land appreciation was included among the benefits of the riverbanks subprojects, as the clean-up of the surrounding environment and the waterways had turned the adjacent areas of the riverbanks into potential commercial properties including the development of parks and promenades. The area of influence was calculated by multiplying the length of the riverbank that would benefit from the project by 15 meters moving inland from the edge of the river. A land value of about P4, 000/m2 (US$100) was assumed, a conservative estimate given the price paid by the concessionaires for land for the STPs in the successor project. An annual increase in land values of 1% for the next 10 years was assumed.11 Again, while the calculations are limited, benefits are expected to accrue to the entire catchment area of the subprojects.
Health benefits. Health benefits were estimated for the septage treatment plants. Benefits would come from reduced risk of people coming in contact with raw wastewater from overflowing septic tanks. The impacts of poor sanitation on health, water, tourism, and other welfare impacts were estimated for the Philippines to be in the order of US$1.4 billion per year, equivalent to 1.5% of gross domestic product in 2005.12 Health impacts represented 72% of total economic costs, and these include health care costs, productivity costs due to adult and child sickness and premature mortality, and 23% accounted for the impact on water resources. For purposes of these calculations, a per capita sanitation benefit of US$44 was assumed which include only health impacts.13 Benefits were assumed to grow by 2% a year to represent the increase in the level of incomes. BOD elimination from septage treatment plants was assumed to be 10% of sanitation benefits.
11 This is based on global empirical evidence cited in the Project Appraisal Document of the successor project, Manila Wastewater Management Project. 12 Source: Economic Impacts of Sanitation in the Philippines, Water and Sanitation Program – East Asia and the Pacific, World Bank, 2008 13Calculated using Gross Domestic Product purchasing power parity (PPP) of US$392.7 billion (estimate for 2011), population of 95 million (estimate for 2011), and a peso-dollar exchange rate of P42.50. The source of data for GDP at PPP values and population is the World Bank.

31
TABLE A3-4: ECONOMIC COST-BENEFIT ANALYSIS (IN REAL PHP)
Capital Expen-
ses
O&M Expen-
ses
Environ-mental
Benefits
EXTERNALITIES
Costs Benefits Net
Economic Benefits
Health Benefits
Land Ap-preciation
Avoided Losses
A B C D E1
2006 98 - - - - 98 - (98)
2007 351 - - - - 351 - (351)
2008 143 - - - - 143 - (143)
2009 263 17 - 264 - 280 264 (16)
2010 359 25 - 223 - 384 223 (160)
2011 128 37 39 168 62 164 268 104
2012 61 66 37 230 223 126 490 364
2013 - 186 106 528 226 186 859 673
2014 - 190 107 569 228 190 904 713
2015
196 108 623 230 196 962 766
2016
197 109 643 232 197 984 787
2017
200 110 682 235 200 1,027 827
2018
201 110 705 237 201 1,052 851
2019
203 110 730 239 203 1,079 876
2020
204 109 754 242 204 1,105 901
2021
205 109 775 244 205 1,128 923
2022
206 109 803 246 206 1,158 952
2023
206 109 820 246 206 1,175 969
2024
207 109 849 246 207 1,203 997
2025
208 110 872 246 208 1,228 1,019
2026
208 110 886 246 208 1,242 1,034
2027
207 110 905 246 207 1,261 1,054
2028
207 110 925 246 207 1,281 1,073
2029
207 110 945 246 207 1,301 1,093
2030
209 111 967 246 209 1,324 1,115
2031
208 111 982 246 208 1,340 1,131
2032
207 111 1,004 246 207 1,361 1,153
2033
207 111 1,026 246 207 1,383 1,175
2034
208 111 1,048 246 208 1,405 1,196

32
2035
208 112 1,068 246 208 1,426 1,217
2036
208 112 1,091 246 208 1,449 1,241
2037
208 112 1,115 246 208 1,473 1,264
TOTAL 1,401 5,249 2,821 22,198 6,334 6,651 31,354 24,703
Economic Internal Rate of Return 33 % Assumptions: Cost figures based on actual costs where available; otherwise, the figures are projected. Actual investment costs based on the average peso to dollar conversion at the time of disbursement which is P45.10. Tariff rate of P25.11 per m3 is the average for 2011 for MWCI concession area. Projected operations and maintenance (O&M) costs are based on 2011 prices. Capital costs are net of value added tax of 12% and contractors’ profit of 20%. O&M costs are net of VAT
Cost Recovery. The Concession Agreement is designed to ensure full cost recovery (excluding loan transaction costs such as interest and commitment charges), with an allowable (and necessary) cross subsidy between water and sewerage/sanitation. This is done through the ‘rate rebasing’ exercise every five years, as discussed above. The 2003 rate rebasing approved a tariff of P9.31 per cubic meter based on a weighted average calculation. Of this amount, net of VAT, P0.59 was attributed to the recovery of part of the MTSP costs out of a total cost of P1.79 per cum. estimated at appraisal. The approved ADR in 2003 rate rebasing was 10.4%, equivalent to the financial rate of return of MWCI investments for the period reviewed and projected. The remaining balance of the actual MTSP costs was to be included in the 2008 rate rebasing, and repaid over the period extending to 2022, the end of the concession period. The approved ADR in 2008 was 9.3%. In 2008, the government approved a 15-year extension of the concession period up to 2037 to mitigate the impact on the tariffs of increased investments in water and wastewater improvement projects, and to allow the concessionaires to pursue the mandate imposed by government to accelerate implementation of wastewater projects to comply with the 2004 Clean Water Act and the 2008 Supreme Court Decision on the clean-up of Manila Bay. This meant that the recovery of the MTSP costs would likewise extend to 2037.

33
Annex 4. Bank Lending and Implementation Support/Supervision Processes (a) Task Team members
Names Title Unit Responsibility/
Specialty
Lending
Luiz Claudio Martins Tavares Sr Water and Sanitation Specialist EAP Task Leader (approval)
Mei Wang Sr. Counsel LEG Legal Aspects
Preselyn Abella Senior Finance Officer CTRLN FM and Disbursement
Minerva S. Espinosa-Apurada Program Assistant SASDO Support
Rene SD. Manuel Senior Procurement Specialist EAPPR Procurement
Jitendra J. Shah Lead Environmental Specialist ECSS3 Safeguards
Maya Gabriela Q. Villaluz Senior Operations Officer EASPS
Supervision
Mara K. Warwick Sr. Urban Environment Specialist EAP Task Leader
Mario Alejandro Suardi Sr. Water and Sanitation Specialist EAP Task Leader
Christopher Ancheta Sr. Sanitary Engineer EASPS Task Leader
Preselyn Abella Senior Finance Officer CTRLN
Aldo Baietti Lead Infrastructure Specialist EASIN
Aisha Lanette N. De Guzman Financial Management Specialist EAPFM
Mingyuan Fan Sr Sanitary Engineer EASCS
Samuel Haile Selassie Senior Procurement Specialist EAPPR
Demilour Reyes Ignacio Program Assistant EACPF
Isabel Duarte A. Junior Program Assistant EASIN
Victoria Florian S. Lazaro Operations Officer EASPS
Gia Mendoza Program Assistant
Cecilia D. Vales Lead Procurement Specialist EAPPR
Maya Gabriela Q. Villaluz Senior Operations Officer EASPS
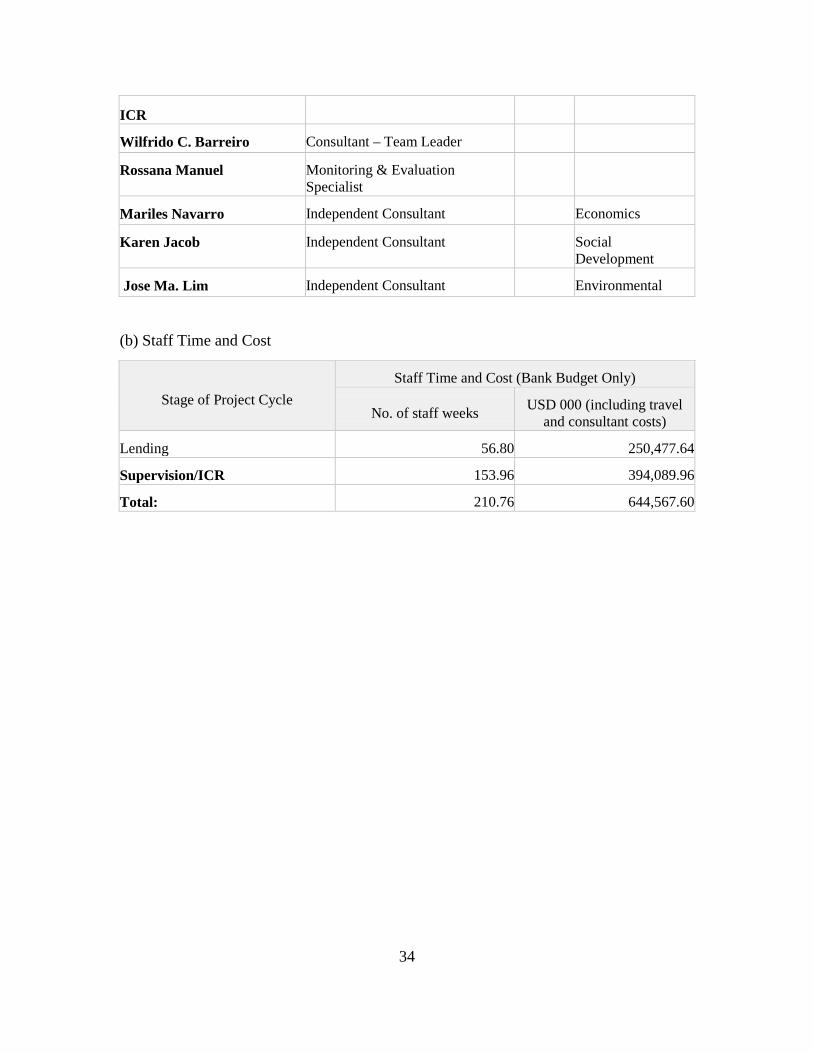
34
ICR
Wilfrido C. Barreiro Consultant – Team Leader
Rossana Manuel Monitoring & Evaluation Specialist
Mariles Navarro Independent Consultant Economics
Karen Jacob Independent Consultant Social Development
Jose Ma. Lim Independent Consultant Environmental
(b) Staff Time and Cost
Stage of Project Cycle Staff Time and Cost (Bank Budget Only)
No. of staff weeks USD 000 (including travel and consultant costs)
Lending 56.80 250,477.64
Supervision/ICR 153.96 394,089.96
Total: 210.76 644,567.60

35
Annex 5. Environmental Safeguards Compliance Results
Following Bank guidelines, the MTSP was classified as Category A project because of potential environmental and social issues associated with infrastructure works and the operation of the wastewater treatment facilities. Environmental Assessment (OP/BP/GP 4.01) and Involuntary Resettlement (OP/BP 4.12) were triggered. An environmental impact statement (EIS) was prepared by MWCI along with an environmental and social assessment framework. In addition, a regional environmental assessment (REA) with a strategic recommendation to strengthen overall wastewater management in Metro Manila was made a complimenting strategy document to the MTSP.
MWCI also prepared a Land Acquisition, Resettlement and Rehabilitation Policy out of which several project-specific resettlement action plans were developed.
An extensive monitoring program was included in the EMP to address the long-term impact of sludge/septage disposal to lahar areas14. Prior to entry, MWCI studies indicated that the disposal of septage and sludge in lahar areas as soil conditioners improved the nutrient content of the soil and has brought benefits to farmers through increase agricultural yield. No adverse impacts have been reported with the strict application of proper selection criteria for disposal site selection and application methods based on US-EPA standards.
Potential adverse environmental impacts during project construction and operation were identified and addressed by the EMP and EMoP. Monitoring, auditing and reporting pro-cedures related to EA implementation, covering biophysical and socio-economic parame-ters, were described in the EMP.
The Environmental Compliance Certificate (ECC) was secured by MWCI from the DENR on April 12, 2005, a few months prior to the project implementation.
Environmental compliance monitoring arrangements included both internal and external audits. A third party auditor conducts regular monitoring of compliance to ECC conditions and EMP commitments. In addition, all environmental permits are secured and appropriately updated as required. The overall environmental compliance rating is satisfactory. The Tables below present the assessment of MTSP’s compliance to Philippine environmental requirements.
14 “Lahar areas” refer to some areas north of Metro Manila where thick ashes from the1991 eruption of Mt. Pinatubo settled and which have since been rendered marginally-productive.
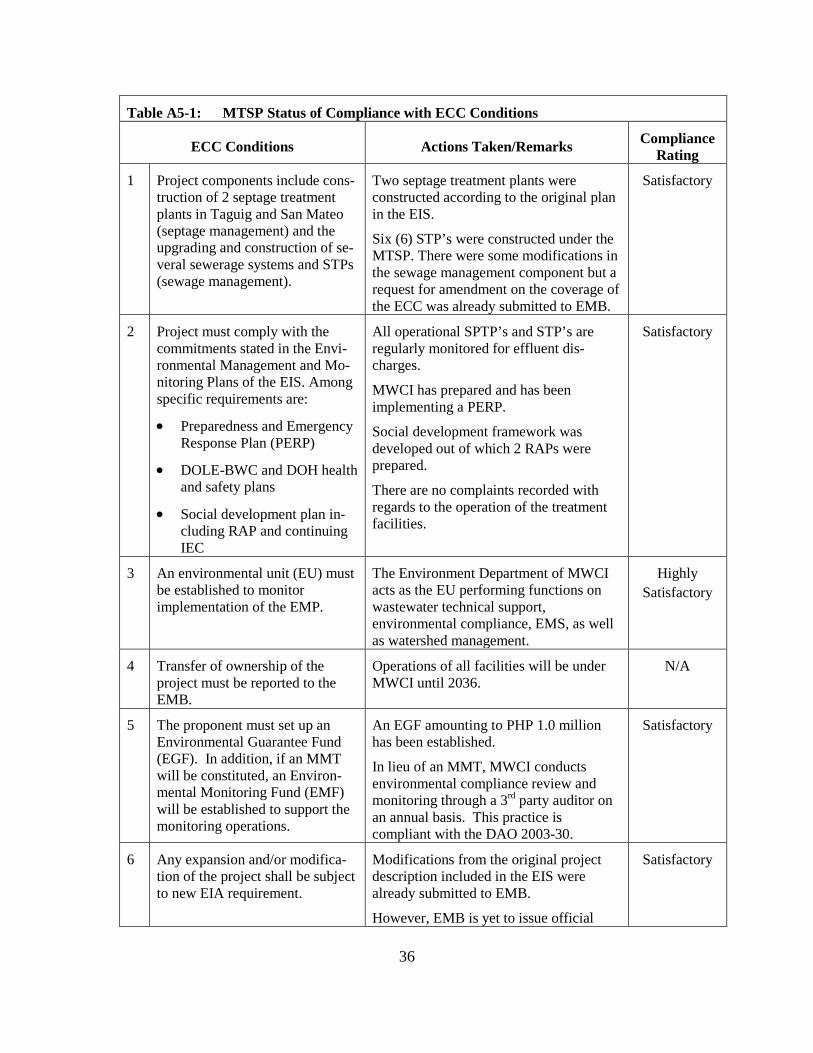
36
Table A5-1: MTSP Status of Compliance with ECC Conditions
ECC Conditions Actions Taken/Remarks Compliance Rating
1 Project components include cons-truction of 2 septage treatment plants in Taguig and San Mateo (septage management) and the upgrading and construction of se-veral sewerage systems and STPs (sewage management).
Two septage treatment plants were constructed according to the original plan in the EIS. Six (6) STP’s were constructed under the MTSP. There were some modifications in the sewage management component but a request for amendment on the coverage of the ECC was already submitted to EMB.
Satisfactory
2 Project must comply with the commitments stated in the Envi-ronmental Management and Mo-nitoring Plans of the EIS. Among specific requirements are:
• Preparedness and Emergency Response Plan (PERP)
• DOLE-BWC and DOH health and safety plans
• Social development plan in-cluding RAP and continuing IEC
All operational SPTP’s and STP’s are regularly monitored for effluent dis-charges. MWCI has prepared and has been implementing a PERP. Social development framework was developed out of which 2 RAPs were prepared. There are no complaints recorded with regards to the operation of the treatment facilities.
Satisfactory
3 An environmental unit (EU) must be established to monitor implementation of the EMP.
The Environment Department of MWCI acts as the EU performing functions on wastewater technical support, environmental compliance, EMS, as well as watershed management.
Highly Satisfactory
4 Transfer of ownership of the project must be reported to the EMB.
Operations of all facilities will be under MWCI until 2036.
N/A
5 The proponent must set up an Environmental Guarantee Fund (EGF). In addition, if an MMT will be constituted, an Environ-mental Monitoring Fund (EMF) will be established to support the monitoring operations.
An EGF amounting to PHP 1.0 million has been established. In lieu of an MMT, MWCI conducts environmental compliance review and monitoring through a 3rd party auditor on an annual basis. This practice is compliant with the DAO 2003-30.
Satisfactory
6 Any expansion and/or modifica-tion of the project shall be subject to new EIA requirement.
Modifications from the original project description included in the EIS were already submitted to EMB. However, EMB is yet to issue official
Satisfactory

37
Table A5-1: MTSP Status of Compliance with ECC Conditions
ECC Conditions Actions Taken/Remarks Compliance Rating
letter amendment to the ECC.
7 Sludge generated by the project shall be disposed properly and a detailed disposal plan shall be submitted to EMB.
Sludge from most operational STPs is transferred to the SPTPs for further pro-cessing prior to disposal to lahar areas. This method is approved both by EMB (through the ECC) and DOH (through an ESC). For some STPs, the sludge contractors have their own dewatering facilities. In this case, the sludge is directly processed in the contractors’ facility. The sludge and bio-solids from SPTPs are registered with FPA as soil conditioners.
Satisfactory
8 An agreement between MMDA and MWCI must be formalized for the use of the flood regulation ponds in Taguig and Taytay areas.
The use of the retardation ponds was not pursued under the MTSP. This was already communicated to EMB as part of the component modifications.
N/A
9 An abandonment plan must be formulated and submitted to EMB prior to any STP de-commissio-ning.
No project facility is scheduled for decommissioning or abandonment.
N/A
10 The ECC will be revoked if the project has not started within 5 years from the date of the ECC issuance.
The project has been implemented within the prescribed timeframe.
Satisfactory
Overall Rating on Compliance to ECC commitments Satisfactory

38
TABLE A5-2: MTSP COMPLIANCE WITH EXISTING PHILIPPINE ENVIRONMENTAL REGULATIONS
Applicable Laws Permit Required Actions Taken by MWCI Compliance
Assessment RA 9275 (Clean Water Act)
Discharge Permit
San Mateo SPTP and all operational STPs have secured discharge permits indicating compliance with effluent standards. During the DP renewal of the SPTP in Taguig, arrears from the previous operator of the STP (which was upgraded under the MTSP) were discovered by LLDA. The renewal of the DP is still being withheld by LLDA pending the settlement of these arrears. Aside from this issue, the effluent coming from this SPTP is meeting the prescribed standards.
Satisfactory
PD 1586(EIA Law)
ECC The project has a valid ECC and MWCI submits regular compliance reports (CMR & SMR) to EMB.
Satisfactory
RA 6969(Toxic Wastes Law)
Hazardous Waste (HW) Generator ID
All operational sites have secured required permits and HW IDs from EMB. MWCI is compliant to all the registration re-quirements on chemical and chemical wastes use, handling and disposal.
Highly Satisfactory
LLDA BR 1996-033 on Develop-ment Clearance)
LLDA Clea-rance
All facilities within the jurisdiction of LLDA have secured their LLDA development clea-rances.
Satisfactory
RA 8749(Clean Air Act)
Permit to Operate
All operational facilities have secured permit to operate (PTO) for air pollution source installa-tion.
Satisfactory
DAO 1992-26(PCO require-ment)
PCO accre-ditation
MWCI has designated accredited PCOs to all its facilities (both operational and under cons-truction).
Satisfactory
PD 856(Sanitation Code)
Environmen-tal Sanitation Clearance
All facilities, which store, handle, transport, treat and dispose sludge and bio-solids have secured their ESC from DOH.
Satisfactory
Overall Rating on Environmental Compliance Satisfactory

39
Annex 6. Social Safeguards Compliance Results
A. Land Acquisition Two of the eight sub-project sites had occupants who were requested to relocate prior to land negotiations and project implementation.
• There were eleven (11) households (46 persons) at the site of the North Septage Treatment in San Mateo who were allowed by the former owner to reside in the property. When the owner informed the occupants that he was selling the property, the occupants were requested to relocate. MWCI prepared an ARAP and provided relocation assistance to all the displaced households.
• The site of the 4,000 m3 capacity Road 5 Sewage Treatment Plant was formerly a communal septic tank owned and operated by MWSS. In 1975, a resident adjacent the property leased an unused section of the land from MWSS. On April 2008, MWSS officially terminated the lease contract for non-payment of the lease rentals and the need of the project for land. In addition, another occupant of the MWSS property was a former MWSS employee. He built a house on top of the communal septic tanks. And through the years, the occupant and his relatives relocated to the property and built houses. By the time the sub-project was identified to be implemented in 2005, there were 12 households illegally occupying the land. These 12 households were considered non-poor. They were issued notifications to vacate the property. MWSS with assistance from an Inter-Agency Committee composed of Urban Poor Affairs, Presidential Commission on Urban Poor, Commission on Human Rights and the Housing and Urban Development Coordinating Council initiated the relocation activities following government policies and standards for resettlement and relocation. Consultation meetings and relocation financial assistance were provided using the standard financial assistance package per displaced household of PHP 22,500 (based on daily minimum wage of 60 days) and free transport/hauling of movable properties from origin to place of relocation.
Below is a summary of the land acquisition activities under MTSP.
TABLE A6-1: SUMMARY OF LAND ACQUISITION FOR MTSP
Sub-project Land Type(Public / Private)
Land Acquisition Arrangement
Social Safeguards Compliant?
1 Pineda Sewage Treatment Plant, Pasig
Public Land owned by Pasig City
Memo of Agreement with Pasig LGU
Yes
2 Olandes Sewage Treatment Plant, Marikina
Public Land owned by Marikina City
Memo of Agreement with Marikina LGU
Yes
3 Pinagsama Sewage Treat- Public Land owned Memo of Agreement Yes
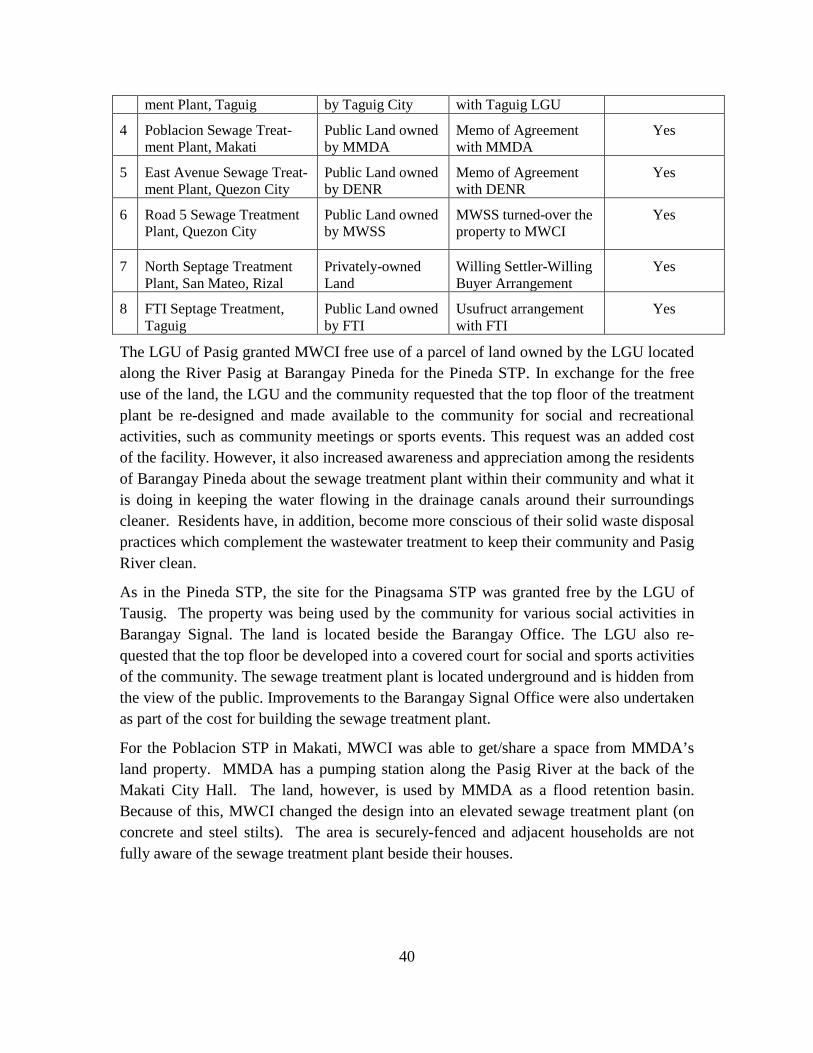
40
ment Plant, Taguig by Taguig City with Taguig LGU 4 Poblacion Sewage Treat-
ment Plant, Makati Public Land owned by MMDA
Memo of Agreement with MMDA
Yes
5 East Avenue Sewage Treat-ment Plant, Quezon City
Public Land owned by DENR
Memo of Agreement with DENR
Yes
6 Road 5 Sewage Treatment Plant, Quezon City
Public Land owned by MWSS
MWSS turned-over the property to MWCI
Yes
7 North Septage Treatment Plant, San Mateo, Rizal
Privately-owned Land
Willing Settler-Willing Buyer Arrangement
Yes
8 FTI Septage Treatment, Taguig
Public Land owned by FTI
Usufruct arrangement with FTI
Yes
The LGU of Pasig granted MWCI free use of a parcel of land owned by the LGU located along the River Pasig at Barangay Pineda for the Pineda STP. In exchange for the free use of the land, the LGU and the community requested that the top floor of the treatment plant be re-designed and made available to the community for social and recreational activities, such as community meetings or sports events. This request was an added cost of the facility. However, it also increased awareness and appreciation among the residents of Barangay Pineda about the sewage treatment plant within their community and what it is doing in keeping the water flowing in the drainage canals around their surroundings cleaner. Residents have, in addition, become more conscious of their solid waste disposal practices which complement the wastewater treatment to keep their community and Pasig River clean.
As in the Pineda STP, the site for the Pinagsama STP was granted free by the LGU of Tausig. The property was being used by the community for various social activities in Barangay Signal. The land is located beside the Barangay Office. The LGU also re-quested that the top floor be developed into a covered court for social and sports activities of the community. The sewage treatment plant is located underground and is hidden from the view of the public. Improvements to the Barangay Signal Office were also undertaken as part of the cost for building the sewage treatment plant.
For the Poblacion STP in Makati, MWCI was able to get/share a space from MMDA’s land property. MMDA has a pumping station along the Pasig River at the back of the Makati City Hall. The land, however, is used by MMDA as a flood retention basin. Because of this, MWCI changed the design into an elevated sewage treatment plant (on concrete and steel stilts). The area is securely-fenced and adjacent households are not fully aware of the sewage treatment plant beside their houses.

41
B. Post-Project Consultation Meetings Results Three Focus Group Discussions (FGDs) were conducted in Pineda STP, Pasig; in Pob-lacion STP in Makati; and in North Septage Treatment Plant, San Mateo, and Rizal in June 2012.Findings from the FGDs follow:
a) Pineda STP, Pasig
Around 14 persons from Barangay Pineda representing the households and a Barangay official attended the FGD which was conducted in the morning of June 19, 2012. The venue of the FGD was at the 2nd floor of the Pineda STP which was made into a basketball court which the local residents particularly the youth are using for their social and sports activities.
The following are the feedback gathered about their experiences with the project:
• Cleaner environment. The Pasig River looks cleaner and does not emit foul smell any longer. They enjoy sitting along the riverbank boardwalk during early evenings be-cause the bad smell of the River is gone.
• Fishes are coming back because the River is clean and alive again. One of the fishermen caught 10 kilos of tilapia (St. Peter’s fish) the other day within 4-5 hours. The fishes were sold to the market. On some days, shrimps are also caught from the River. The group attributes this to the project.
• Households are more conscious of their solid waste disposal, by not throwing these to the canals, creek and river.
• They are happy with the ‘free desludging’ of household septic tanks. It is easier to flush their toilets. No more overflowing toilets.
b) Poblacion STP, Makati
Around 25 persons, representing the barangays of Poblacion, Valenzuela and Olympia, covered by the Poblacion STP attended the consultation meeting on June 19, 2012. Also in attendance was a representative from the Makati Business Sector. The venue of the consultation meeting was at the office of the Poblacion STP, MMDA pumping station compound, Makati City.
A briefing about the wastewater treatment was presented by the Plant Manager. She mentioned that around 20,000 persons are currently being served by the STP but the intention is to expand its coverage to include parts of Bel-Air Village and Barangay Sta. Cruz.
After the discussion, attendees of the consultation meeting went around the treatment plant to observe the wastewater treatment process – from raw sewage to the effluent being drained to the Pasig River.

42
The following were the reactions and feedbacks gathered during the consultation meeting:
• They were not aware of the wastewater management project or of the STP that was built. They thought that the construction activities were related to MMDA’s flood control and since the land is fenced they don’t see what is happening on the other side of the fence.
• Neighboring households said that they have not noticed it because they do not smell anything bad coming from the treatment plant.
• Some households whose houses are along the Pasig River commented that they have noticed that the Pasig River’s color is improving, i.e. not as black as before. Even the bad smell from the river has reduced.
• Customers were not even aware of the 20% wastewater charge included in their water bill. They commented that there was an increase in the water bill but they are not really complaining. When they realized that the 20% increase was for wastewater treatment, they said that this is acceptable because this amount is much lesser compared to the cost of septic tank dislodging which is around PHP 3,000-5,000.
• The representative from the Makati Business Sector expressed support for the project because it also supports the interests of the commercial sector, which is, keeping Makati clean and attractive for businesses.
c) North Septage Plant, San Mateo, Rizal
Around 10 persons attended the consultation meeting held at the North Septage Plant in San Mateo, Rizal. Most of the attendees came from the neighboring newly-developed low-cost housing villages.
A short briefing about the North Septage Plant was presented by the Plant Manager. According to the presentation, the septage plant is serving around 1 million residents in Balara, Cubao, Marikina and Rizal. However, its services have yet to reach the population of San Mateo where the SPTP is located.
The following are the reactions and feedback during the consultation meeting:
• They are not aware of the septage treatment plant. They said that they thought it is a water supply plant of “NAWASA” (they are not even aware of Manila Water).
• Some of the attendees were present to apply for service connections because their current water supply (provided by the village) costs around 10 times higher compared to the water supply of “NAWASA” (Manila Water).
• They do not smell; no bad odors emanate from the STP.
• At the end of the discussions, the attendees expressed and requested MWCI to pro-vide both water and sewerage services because most of them are dismayed with the water and sanitation services poorly and expensively provided by the private land developers.

43
Annex 7. Summary of Borrower's ICR and/or Comments on Draft ICR
(The Borrower’s ICR is still under preparation.)

44
Annex 8. List of Supporting Documents
1. Philippines: Country Assistance Strategy Fiscal Year 2003-05
2. GEF- Manila Third Sewerage Project, Project Appraisal Document, 2007
3. GEF- Manila Third Sewerage Project, Implementation Status and Results Report No. 4, March 12, 2011
4. GEF- Manila Third Sewerage Project, Implementation Status and Results Report No. 5, January 20, 2012
5. Manila Third Sewerage Project Appraisal Document, 2005
6. Manila Third Sewerage Project Aide Memoire, Pre Appraisal Mission, January 24- February 05, 2004
7. Manila Third Sewerage Project Aide Memoire, Preparation Mission, November 2004
8. Manila Third Sewerage Project Aide Memoire, Pre-Appraisal Mission, 2005
9. Manila Third Sewerage Project Aide Memoire, Supervision Mission, November 20-24, 2006
10. Manila Third Sewerage Project Aide Memoire, Supervision Mission, May 22-24, 2007
11. Manila Third Sewerage Project Aide Memoire, Supervision Mission, November 2007
12. Manila Third Sewerage Project Aide Memoire, Mid-Term Review Mission, March 10-17, 2008
13. Manila Third Sewerage Project Aide Memoire, Supervision Mission, March 10-23, 2009
14. Manila Third Sewerage Project Aide Memoire, Discussions on a New Project, Sept 23 – Nov 24, 2012
15. Manila Third Sewerage Project Aide Memoire, Supervision Mission April 26- May 06, 2010
16. Manila Third Sewerage Project Aide Memoire, Supervision Mission Sept 15-Nov 09, 2010
17. Manila Third Sewerage Project Aide Memoire, Supervision Mission, May 23- August 24, 2011
18. Manila Third Sewerage Project Aide Memoire, Supervision Mission, April 20-May 24, 2012
19. Third Party Environmental Compliance Audit for the Manila Third Sewerage Project covering July 2010 to December 2010
20. Third Party Environmental Compliance Audit for the Manila Third Sewerage Project covering July 2011 to December 2011
21. Third Party Environmental Compliance Audit for the Manila Third Sewerage Project covering January to June 2012

45
Annex 9 Background on Bank Involvement and Sector Reforms in Wastewater Development in Metro Manila
MTSP was the third in a series of Bank involvement in the development of sanitation and sewerage for Metro Manila. It is interesting to see the shifts and progression in the approaches used. It is useful to gain a fuller perspective of the value MTSP brought to the sector and the role the Bank has played in this transformation and learning.
Bank involvement in wastewater management in Metro Manila
The First Sewerage and Sanitation Management Project (FSSMP) for Metro Manila in the mid-1980s was the first major activity of the Bank. The technical approach adopted for this project involved the development on a large centralized wastewater management facility. This project experienced major issues with respect to high capital and operating costs, right-of-way and land availability. Because of sustainability issues, it had minimal impact on improved wastewater services.
Following this experience, the Bank and MWSS then developed in the mid-1990s the Manila Sanitation and Sewerage Management Project (MSSMP) which focused on septage management. This approach assumed that significant improvements can be achieved by making sure that septic tanks were optimally functioning.
This Manila Third Sewerage Project (MTSP), developed in the mid 2000s shifted focus on smaller decentralized treatment systems with a heavy dose of community involvement in the development of the process.
Finally, the follow-on project, the Metro Manila Wastewater Management Project, continues the emphasis on community consultation and involvement, but with larger capacity (but still decentralized) treatment plants and expansion of the “catchment” areas.
The evolution and transformation of these series of projects clearly demonstrate the significance of lessons learned and adapting innovative strategies and approaches for future projects and sector reform. A closer study of this evolution and lessons learned can have a significant impact on the approaches to be used in developing sewerage and sanitation in other urban areas in the country, and even in South East Asia.
Wastewater Management Strategy and the Concession Contracts The early years of the Manila concessions were also marked by significant shifts in wastewater strategy for MM. The performance targets for sewerage and sanitation ser-vices in the original concession agreements signed in 1997 were based on an overall mas-ter plan prepared by JICA for MWSS in 1996 (i.e., before privatization). This plan inclu-ded the provision of large, highly-centralized sewerage collection and treatment systems in MM. This may have been suitable if the provision of these services had remained in

46
the public sector. After privatization, however, it became clear that implementation of this “centralized” approach and the concessionaires’ compliance with the concession agreement coverage and performance targets would be extremely difficult to implement and achieve.
The main challenges of the “centralized” plan included a lack of available land for the proposed centralized treatment plants, the large capital investment required for such sys-tems, un-willingness of the public to pay for the proposed extensive new system, and the unwillingness of local government units to accept disruptions from major construction.
The concession agreements allow renegotiation of performance targets and tariffs every five years during rate rebasing. In 2002, while preparing its submission for the first rate rebasing in 2003, MWCI proposed to adjust its service targets and master plan to respond to the sewerage and sanitation implementation constraints. MWCI’s new approach proposed maximizing the use of existing or upgraded sewage treatment facilities and provision of new, small-scale systems serving clearly defined densely populated areas. This was coupled with an expansion of maintenance services for individual septic tanks.
During the 2003 rate rebasing discussions, the Government agreed that the 1997 performance targets for sewerage should be reduced in order to ensure affordable tariffs and overcome implementation constraints. As a result, the 2003 rate rebasing agreements decreased sewerage targets and as some compensation, increased sanitation targets. At the same time, the Government agreed that sewerage alternatives (e.g., combined systems15) could be considered for MM.
The GOP and the private operators-concessionaires have since gained a fuller and practical understanding of the impact of privatization and the public’s willingness to accept and pay for water, sewerage, and sanitation services. As a result, there has been an evolution in planning since the start of the concessions in 1997. This has resulted in major changes in the performance targets on which the concessionaires’ earlier investment programs are based.
15Combined sewers provide one pipe for both surface water drainage and for sewage, which is required to first pass through septic tank to remove solids. Hygienically superior separate systems provide separate pipes for each service.

Annex 10
47
Pineda STP
Road 5 STP
East Avenue STP
Pinagsama STP
Olandes STP
Poblacion STP

For detail,see IBRD 33863
Noyaliches
Obando
SantoCristo
Montalban
Antipolo
Angono
TaytayCainta
Bacoor
MANILA
Imus
General Trias
Dasmarinas
Biñan
San Vicente
Cavite City
SanPedro
CALOOCANCITY
(NORTH)
VALENZUELAUPPER
QUEZONCITY
LOWERQUEZON
CITY
M A R I K I N A
MALABON
NAVOTAS
CALOOCANCITY
(SOUTH)
MANILASANJUAN
MANDA-LUYONG PASIG
TAYTAY
CAINTA
OBANDO
ANTIPOLO
SAN MATEO
RODRIGUEZ
SAN JOSE DEL MONTE
MAKATI
CAVITECITY
BACOOR
IMUS
KAWIT
NOVELETAROSARIO
PATEROS
PASAYCITY TAGUIG
PARAÑAQUE
LASPIÑAS
MUNTINGLUPA
BULACAN PROVINCE
RIZAL
PROVINCE
M E T R OM A N I L A
CAVITE PROVINCE
LAGUNAPROVINCE
Tano
gRi
ver
Mat
eo
Rive
r
Wawa River
NovaLiches
Reservoir
Laguna Bay
Manila
Bay
Pura
y River
Pasig River
121°00'
14°40'
14°30'
14°20'
14°40'
14°30'
121°10'
121°00' 121°10'
EAST SERVICEEAST SERVICEAREA OFAREA OF
MANILA WATERMANILA WATERCOMPANY, INC.COMPANY, INC.
WEST SERVICEWEST SERVICEAREA OFAREA OF
MANILA WATERMANILA WATERSERVICES, INC.SERVICES, INC.
EAST SERVICEAREA OF
MANILA WATERCOMPANY, INC.
WEST SERVICEAREA OF
MANILA WATERSERVICES, INC.
Ilocos
CordilleraAdmin.Region
CagayanValley
Central Luzon
National Capital RegionArea of Map
at right.Calabarzon
Mimaropa
Bicol
Western Visayas
CentralVisayas
Eastern Visayas
WesternMindanao
NorthernMindanao
SouthernMindanao
CentralMindanao
Caraga
Autonomous Regionin Muslim Mindanao
San Fernando
Quezon
Tuguegarao
BaguioSan Fernando
Legaspi
Tacloban
Cebu
Butuan
DavaoCotabato
Cagayande Oro
Iligan
Iloilo
Zamboanga
MANILA
MALAYSIA
Celebes Sea
Moro
Sulu Sea
Leyte Gulf
Visayan
Sea
Mindoro Strait
SibuyanSea
Phi l ippine
Sea
Babuyan Channel
Luzon Strai t
Gulf
DavaoGulf
MindanaoSea
BatanIslands
BabuyanIslands
PolilloIslands
LubangIslands
Catanduanes
TicaoSibuyanTablas
Busuanga
SemiraraIslands
CuyoIslands
Culion
Linapacah
Dumaran
Bugsuk
Balabac
Cagayan Sulu
Tawi-Tawi
Sulu
Basilan
Mindanao
CamiguinSiquijor
Negros
Panay
Bohol
Cebu Leyte
SamarMasbate
Marinduque
BuriasMindoro
Palawan
Luzon
Dinagat
Siargao
Sarangani
20°N
10°N
15°N
10°N
15°N
5°N125°E
120°E
120°E
125°E
PHILIPPINES
0 2 4 6
KILOMETERS0 50 100
0 50 100 Miles
150 Kilometers
APRIL 2005
IBRD 33862
REGION CAPITALS
NATIONAL CAPITAL
RIVERS
REGION BOUNDARIES
INTERNATIONAL BOUNDARIES
CONCESSION BOUNDARIES
SERVICE AREAS
SELECTED CITIES
NATIONAL CAPITAL
MUNICIPAL BOUNDARIES
METRO MANILA BOUNDARY
NATIONAL CAPITAL REGION BOUNDARY
PROVINCE BOUNDARIES
This map was produced by the Map Design Unit of The World Bank. The boundaries, colors, denominations and any other information shown on this map do not imply, on the part of The World Bank Group, any judgment on the legal status of any territory, o r any endorsemen t or a c c e p t a n c e o f s u c h boundaries.
PHILIPPINES
MANILA THIRD SEWERAGE PROJECTCONCESSION AREAS