Embed Size (px)
Citation preview
Pub
lic D
iscl
osur
e A
utho
rized
Pub
lic D
iscl
osur
e A
utho
rized
Pub
lic D
iscl
osur
e A
utho
rized
Pub
lic D
iscl
osur
e A
utho
rized
Pub
lic D
iscl
osur
e A
utho
rized
Pub
lic D
iscl
osur
e A
utho
rized
Pub
lic D
iscl
osur
e A
utho
rized
Pub
lic D
iscl
osur
e A
utho
rized
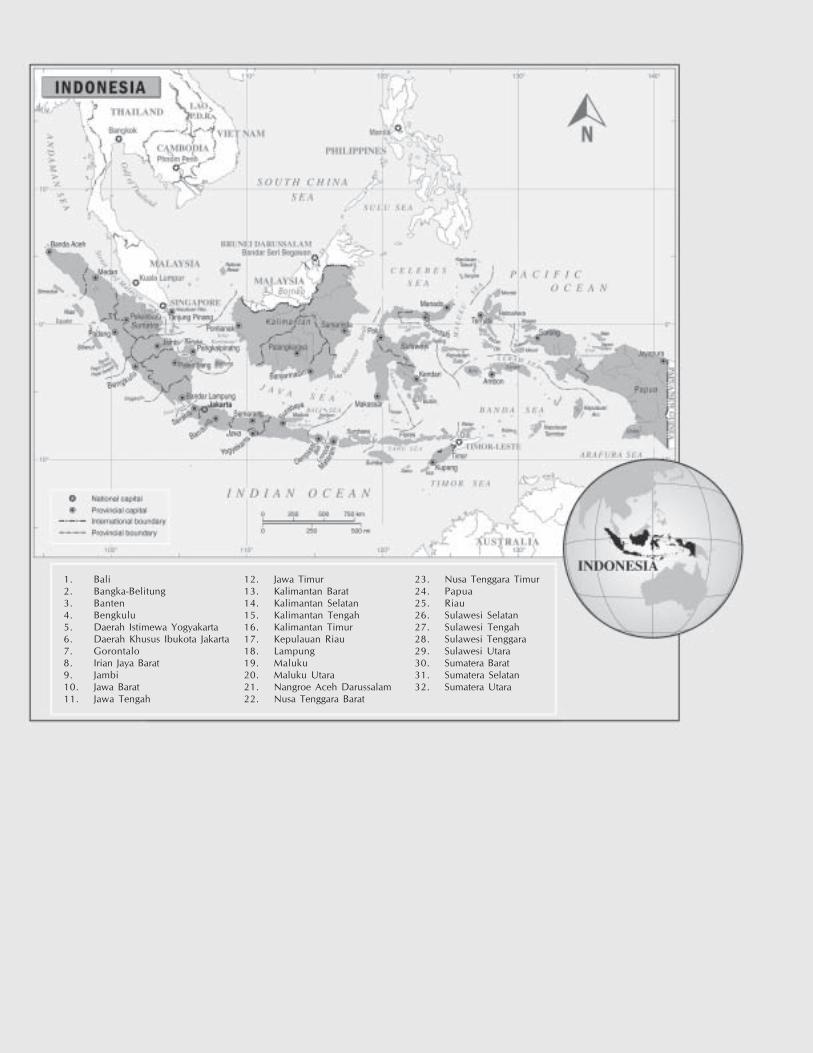
1. Bali2. Bangka-Belitung3. Banten4. Bengkulu5. Daerah Istimewa Yogyakarta6. Daerah Khusus Ibukota Jakarta7. Gorontalo8. Irian Jaya Barat9. Jambi10. Jawa Barat11. Jawa Tengah
12. Jawa Timur13. Kalimantan Barat14. Kalimantan Selatan15. Kalimantan Tengah16. Kalimantan Timur17. Kepulauan Riau18. Lampung19. Maluku20. Maluku Utara21. Nangroe Aceh Darussalam22. Nusa Tenggara Barat
23. Nusa Tenggara Timur24. Papua25. Riau26. Sulawesi Selatan27. Sulawesi Tengah28. Sulawesi Tenggara29. Sulawesi Utara30. Sumatera Barat31. Sumatera Selatan32. Sumatera Utara
Averting an Infrastructure Crisis:A Framework for Policy and Action


THE WORLD BANK OFFICE JAKARTA.
Jakarta Stock Exchange Building Tower II/12th. Fl.Jl. Jend. Sudirman Kav. 52-53Jakarta 12910.Tel: (6221) 5299-3000.Fax: (6221) 5299-3111.Website: www.worldbank.or.id
THE WORLD BANK.
1818 H Street N.W.Washington, D.C. 20433, U.S.A.Tel: (202) 458-1876.Fax: (202) 522-1557/1560.Email: [email protected]: www.worldbank.org
A copublication of the World Bank East-Asia Infrastructure Departmentand Indonesia Country Program
Printed in June 2004
Cover and book design: Arif Wicaksono - Grha Info Kreasi
All photographs used in this publications are from Jez O'Hare Photography,except photos on page 12 and 41 (World Bank collection) and somephotos on the cover (see below)
Cover photographs: Power Line; © Jez O'Hare. Bus Passenger; © Jez O'Hare.The photographs of children, old woman, and telephone-man are fromWorld Bank collection.
This volume is a product of the staff of the World Bank. The findings,interpretations, and conclucions expressed herein do not necessarily reflectthe views of the Board of Executive Directors of the World Bank or thegovernments they represent.
The World Bank does not guarantee the accuracy of the data included inthis work. The boundaries, colors, denominations, and other informationshown on any map in this work do not imply any judgment on the part ofthe World Bank concerning the legal status of any territory or theendorsement or acceptance of such boundaries.
v
ForewordCountries around the world are again recognizing the crucial role of infrastructure in promoting development. Strong infrastructureprograms spur economic growth, create jobs, and help improve the quality of life. Neglect of infrastructure, in contrast, acts as adrag on growth and job creation, and perpetuates poverty.
In today’s Indonesia, due to the economic crisis of 1998-2002 and other factors, the state of infrastructure is a hindrance rather thana help to development. Risks of power outages are discouraging investors in new factories, traffic congestion is eroding the qualityof urban life, and longer travel times are making businesses uncompetitive as they seek to get their goods to market. Forty sevenpercent of households are still not connected to the grid, and 6,000 villages lack electricity altogether. Forty five percent ofhouseholds suffer unsanitary conditions and 22 percent have no access to safe water. As a result health conditions and workerproductivity compare unfavorably with comparator countries.
The good news is that Indonesia is well positioned to reverse this situation. Recent macroeconomic successes imply that financialshortages are easing, and new legislation and policies offer the possibility of better managed infrastructure and a renewed role forprivate investment in the sector. This report Averting an Infrastructure Crisis: A Framework for Policy and Action has been preparedto support the Government’s efforts to take advantage of this opportunity. It has been developed in close collaboration withBappenas and other key agencies. It complements the ‘Infrastructure Book’, developed under BAPPENAS to provide a long terminfrastructure development scenario that encompasses all major infrastructure sectors.
The path ahead will not be easy. Policy reforms will need to be implemented firmly, and investment in infrastructure will need tobe increased by an amount equivalent to 2 percent of GDP per year. Money cannot substitute for policy and institutional reforms,or vice versa. Both are required, and both public and private sectors will need to play a larger role. The report provides optionsrather than blueprints. The main report addresses cross-cutting issues that affect all infrastructure sectors. Background reports areavailable on roads, telecommunications, electric power, water supply and sanitation.
The World Bank is privileged to work in partnership with the Government as it works for deeper and more equitable development.We stand ready to further support the efforts of the Government to implement an ambitious infrastructure reform agenda.
Finally, the report attempts to provide an integrated approach to infrastructure development that goes beyond sector-specific issues.This cross-sectoral analysis forms the first part of the report (first six chapters). It draws on a study of four specific sectors –namelytelecommunications, power, water supply and sanitation, and roads, which are presented in the second part of the report (fourbackground sector reports). Similar approaches are being undertaken for other Asian countries. In addition, a thematic infrastructurestrategy report undertaken in collaboration with JBIC and the ADB, will also cover the emerging challenges facing the whole EastAsia region. We hope that this effort will enhance our understanding of infrastructure issues in East Asia and thus help policy makersthroughout the region.
Andrew D. Steer Christian DelvoieCountry Director, Indonesia Director, Infrastructure DepartmentEast Asia and Pacific Region East Asia and Pacific Region
Averting an Infrastructure Crisis: A Framework for Policy and Actionvi
AcknowledgmentThis report was prepared by a core team led by Ani Dasgupta and consisting of Michel Kerf (co-team leader), David Hawes, andAndre Bald. The following people formed the larger team and contributed to or drafted parts of the report: Migara Jayawardena,Phil Gray, Bill Paterson, Peter Roberts, Mohammad Farhandi, Geoffrey Read, Tenzin Norbhu, Peter Smith, Phil Lam, DemetriosPapathanasiou, Ann Thomas, Janelle Plummer, Jan Drozdz, Menno Pradhan, P S Srinivas, Naseer Rana, and Jonathan Walters. Thereport was prepared under the overall guidance of Christian Delvoie, Director, East Asia and Pacific Infrastructure Department andAndrew Steer, Country Director, Indonesia.
The report benefited from consultation and advice from numerous reviewers including: Antonio Estache, Jenifer Wishart, ChristinaE. Malmberg Calvo, Vivien Foster, C. Fallert Kessides (as peer reviewers); Bert Hofman, Jit Bajpai, Keshav Varma, Juinhui Wu, JoelHellman, Rick Pollard, Yoichiro Ishihara, Albert Wright, John Besant Jones, Jonathan Halpern, Cecilia Briceno, Axel Baumler,Barbara Lee, Homi Kharas, Arvind Gupta, Jeffrey Gutman, Michel Bellier, Baher El Hifnawy, Hatim Hajj, Alberto Nogales, LuizTavares, Songsu Choi, Raja Iyer, Hiroaki Suzuki, Ming Zhang, Noureddine Berrah, Robert Taylor, Barry Trembath, Elisa Muzzini,Abhas Kumar Jha, and Mark Baird. Editorial and production support was provided by Melissa Morris.
We would like to thank the Norwegian Trust Fund for Private Sector and Infrastructure for financial support for this project, andMarianne Bergstrom for her good natured support.
This report was developed in close collaboration with Bappenas and Committee for Acceleration of InfrastructureInvestments (KKPPI) in Indonesia. Many staff from these departments provided invaluable advice, and we wouldlike to especially thank Suyono Dikun, Deputy Minister for Infrastructure, BAPPENAS; Jinny Katuuk, DeputyMinister for Fiscal and Economic Decentralization and Infrastructure Development, Coordinating Ministry forEconomic Affairs; and Bambang Susantono, Assistant Deputy for Communication and Telecommunication,Coordinating Ministry for Economic Affairs for their support and guidance. This report complements the“Infrastructure Indonesia: before, during and after the crisis, (2003)”, edited by Mr Dikun and developed byBAPPENAS which seeks to provide a long term infrastructure development scenario and encompasses all majorinfrastructure sectors.
KKPPI organized four workshops to discuss the background sector papers with a diverse group of sectoral experts.We would like to acknowledge the contribution from all of the participants of these workshops. Our understandingof each sector was greatly enhanced by their candid examination of the bottlenecks and solutions from a variety ofperspectives. These events brought together over 100 of the leading experts from government agencies, the privatesector, the NGO and academic communities, and the press. The background sector papers are included at the endof this report. The discussion from these workshops shaped our report, and the positive feedback prompted us toco-host with KKPPI a larger national conference to share and discuss the cross-cutting policy issues emerging fromour analysis of Indonesia’s infrastructure. Conclusions and comments from this conference shaped the mainreport. We want to thank Mr Susantono for taking the initiative to arrange these events and Hardini Puspasari andSri Oktorini for handling the logistical details.
vii
Table of ContentForeword vAcknowledgment vi
OverviewIntroduction 1The Problem 2Towards a Solution 4Need for Action on Multiple Fronts 6The Way Forward 15
Chapter 1Achievements, Challenges,and OpportunitiesIntroduction 17The Infrastructure Challenge 18Public Management of Infrastructure 26Business Environment for Infrastructure 27Corruption 28Financing Challenge 29
Chapter 2Improving Public Managementof InfrastructureIntroduction 31Commercializing, Corporatizing and Privatization 32Making Decentralization Work 34Evolving Role of the Center 39Recommendations 43
Chapter 3Restoring Private ParticipationIntroduction 49Private Infrastructure Investment in the 1990s 52The Promise of Private Service Provision 53Setting Objectives 54Ensuring the Financial Sustainability of Service Provision 55Maximizing Competitive Discipline 57Balancing Users and Operators’ Interests through
Adequate Regulation 62Allocating and Managing Risks 64Public Support for Private Projects 67Recommendations 73
Chapter 4Getting a Grip on CorruptionIntroduction 75Anatomy of Corruption in the Infrastructure Sectors 76Recommendations 85
Chapter 5Mobilizing Finance for InfrastructureDevelopmentIntroduction 89Financing Gap 90Options for Bridging the Financing Gap 91Targeting Public Finances to Protect the Poor 98Recommendations 102
Chapter 6The Way Forward: Prioritizing ReformsIntroduction 105International Comparisons 106Estimated Impacts of Certain Reforms 107Prioritizing Reforms 110
List of Abbreviations 229End Notes 231Bibliography 239
viii Averting an Infrastructure Crisis: A Framework for Policy and Action
List of FiguresFigure 1. Total Infrastructure Expenditures
($US Billions, nominal) 2Figure 2. Access to Infrastructure by Income for 'Safe Water' 3Figure 3. Central Government Development Spending
(US$ Billions) 4Figure 4. Private Participation in Infrastructure ($US millions) 8Figure 5. Filling the Gap - Infrastructure Spending (% of GDP) 11Figure 6. Infrastructure Spending as a % of GDP) 11
Figure 1.1. Fewer firms are set up(percentage in total companies) 21
Figure 1.2. Growth and Infrastructure Investment(% of GDP) 21
Figure 1.3. Household Access to Safe Waterby Income (%) 22
Figure 2.1. Improving Government Performance 46
Figure 3.1. Private Participation in Infrastructure (1990 – 2002) 52Figure 3.2. Private Participation in Infrastructure (1990 - 2002) 52Figure 3.3. Process for Deciding Whether to Provide
Fiscal Support 68
Figure 5.1. Infrastructure Investment (% of GDP) 90Figure 5.2. Structural Change (% of Economic Activity) 90Figure 5.3. Central and Local Development Spending
on Infrastructure as a % of GDP (Current 1993) 92Figure 5.4. Local Government Development Spending
by Sectors, 2000-2002 92Figure 5.5. Central Development Spending on Infrastructure
as a % of GDP (Current) 93Figure 5.6. Central Government Development Spending
(US$ Billions) 93Figure 5.7. Fiscal Consolidation 94
List of TablesTable 1. Infrastructure Performance 2Table 2. Sector Issues 3
Table 1.1. Infrastructure Service Delivery– Power and Telecom 18
Table 1.2. Infrastructure Service Delivery– Water, Sanitation and Roads 18
Table 1.3. Urbanization in East Asia 22
Table 3.1. Main Forms and Potential Benefits of InfrastructurePrivatization 53
Table 3.2. Options Most Likely to Address GovernmentObjectives 70
Table 6.1. Business Environment 106Table 6.2. Estimates of Cost and Benefits of Reforms 107
List of Text BoxesBox 1. taking action – on Public Management 7Box 2. taking action – on Restoring Private Participation 10Box 3. taking action – on Tackling Corruption 11Box 4. taking action – Mobilizing Finance for Infrastructure
Development 14
Box 1.1. Infrastructure and the Business Climate 20
Box 2.1. Financing Schemes to Pursue National Objectives inDecentralized Contexts: The State RevolvingFund Model 36
Box 2.2. Financing Schemes Using Apex Institutions to Select“Good” Projects - The case of FINDETER in Colombia 37
Box 3.1. Achieving Economies of Scale in Waterand Sanitation in Brazil 61
Box 3.2. Assessing the Fiscal Impact of ColombianGovernment Guarantees 71
Box 3.3. South Africa – Taking into Account Public ExpenditureImpact of Public-private Partnerships in Infrastructure 72
Box 4.1. Procurement in the Second Sulawesi UrbanDevelopment Project 79
Box 4.2. Year-end moves to protect budgets 83
Box 5.1. Using Pension Funds in Chile to Finance Infrastructure 96Box 5.2. Malaysia: The Case of the Employees Provident Fund 97Box 5.3. Cross-subsidizing New Connections Under
the Buenos Aires Water and Sanitation Concession 100Box 5.4. Output-based Aid Scheme to Extend the Teledensity
in Chile 101
Table of Content
ix
Background Sector Report IElectric PowerIntroduction 121Policy and Institutional Framework 124Sector Structure and Ownership 126Investment Needs and Financing 129Sector Performance 131Main Sector Issues 133The Way Forward 137
Annex I.1Cost Benefit Analysis – Electric Power 140
Background Sector Report IITelecommunicationsIntroduction 149Policy and Institutional Framework 150Sector Structure and Ownership 151Investment and Financing 153Sector Performance 154Main Issues 156The Way Forward 158
Annex II.1Cost Benefit Analysis – Telecommunications 160
Background Sector Report IIIRoad and Road TransportOverview 171Policy and Institutional Framework 173Sector Structure and Ownership 174Investment and Financing 175Sector Performance 178Main Issues 180The Way Forward 182
Annex III.1Cost Benefit Analysis – Road and Road Transport 190
Background Sector Report IVWater Supply and SanitationOverview 193PART A: WATER SUPPLY
Policy and Institutional Framework (Water) 195Sector Structure and Ownership (Water) 196Investment and Financing (Water) 199Sector Performance (Water) 200Main Sector Issues (Water) 202
PART B: SANITATIONPolicy and Institutional Framework (Sanitation) 204Sector Structure and Ownership (Sanitation) 204Investment and Financing (Sanitation) 205Main Sector Issues (Sanitation) 208The Way Forward ( Water and Sanitation) 209
Annex IV.1Legislation relevant to water supplyand sanitation service provision 216
Annex IV.2Principal agencies involved in policy formulationand implementation 217
Annex IV.3The Jakarta Concessions 218
Annex IV.4Financial Recovery Action Plan (FRAP) 219
Annex IV.5Corporatization of PDAMs 221
Annex IV.6Cost Benefit Analysis – Water Supply 222
Table of Content
x Averting an Infrastructure Crisis: A Framework for Policy and Action
List of FiguresFigure II.1. Indonesian Telecommunications Sector Structure 153Figure Annex II.1.01. Model simulation - Price elasticity 162Figure Annex II.1.02. Local Market Price vs. Time 163Figure Annex II.1.03. Local Market Quantity Demanded
over Time 164Figure Annex II.1.04. Local Market Change in Consumer
Surplus over Time 164Figure Annex II.1.05. National Long Distance Market Price
over Time 165Figure Annex II.1.06. National Long Distance Market Quantity
Demanded over Time 166Figure Annex II.1.07. National Long Distance Market Change
in Consumer Surplus over Time 166Figure Annex II.1.08. International Long Distance Market
Price over Time 167Figure Annex II.1.09. International Long Distance Market
Quantity Demanded over Time 168Figure Annex II.1.10. International Long Distance Market
Change in Consumer Surplus over Time 168Figure Annex II.1.11. Aggregate Change in Consumer Surplus
over Time 168
Figure III.1. Public Expenditure on National, Provincialand District Roads (current prices) 175
Figure III.2. Public Expenditure on National, Provincial andDistrict Roads (constant 2002 prices) 175
Figure III.3. Adequacy and Allocation of Resources for RoadPreservation 180
Figure III.4. Economically Warrented Road Capacity ExpansionProgram for Java Strategic Network 2000-2030 183
Figure Annex III.1.01 191
Figure IV.1. Sector Structure and Ownership 196Figure IV.2. Key Issues for future action in the water sector 202Figure IV.3. Key Issues for future action in the sanitation sector 208
List of TablesTable I.1: Main Legal and Regulatory Provisions 124Table I.2: Electrification Rates (%) 131Table I.3. Quality of Electricity Supply (Scale of 1-7), 2002 132Table I.4. Transmission and Distribution Losses (%) 132Table I.5. The Way Forward 141Table Annex I.1.01. Cost to sector due to power shortage 145
Table II.1. Key Reforms Introduced by Law 36/1999 150Table II.2. Allocation of Policy and Regulatory Responsibilities 151Table II.3. Telkom and Indosat – Transition to two Full-Service
Providers 151Table II.4 Investment in KSO Regions 152Table II.5. ICT Expenditures as a Share of GDP in Selected
Countries 153Table II.6. Teledensities in Selected Countries 155Table II.7. Internet Use in Selected Countries 2001 155Table II.8. Telephone Faults per 100 Lines per month 155Table II.9. Telephone Main Lines per Employee 155Table II.10. Fixed and Analog Cellular Fees 2001 156Table II.11. Fixed and Analog Cellular Fees as Percentage
of Per Capita GNI 2001 156Table II.12. The Way Forward 159Table Annex II.1.01. NPV of the Change in Consumer Surplus by
Segment (in Millions) 160Table Annex II.1.02. % Change in Price for Local Segment 163Table Annex II.1.03. Model Result - Local Market Segment 163Table Annex II.1.04. Local Market Average Total Call Minutes 164Table Annex II.1.05. Local Market Change in Consumer
Surplus (in Millions) 164Table Annex II.1.06. % Change in Price for National Long
Distance Segment 165Table Annex II.1.07. Model Result DLD Market Segment 165Table Annex II.1.08. National Long Distance Market Average
Total Call Minutes 166Table Annex II.1.09. National Long Distance Market Change
in Consumer Surplus (in Millions) 166Table Annex II.1.10. % Change in Price for International Long
Distance Segment 167Table Annex II.1.11. Model Result - ILD Market Segment 167Table Annex II.1.12. International Long Distance Market
Average Total Call Minutes 167Table Annex II.1.13. International Long Distance Market
Change in Consumer Surplus (in Millions) 167Table Annex II.1.14. Aggregate Change in Consumer Surplus
(in Millions) 168
Table III.1. Classification of Roads and Allocation ofResponsibilities for Development and Maintenance 172
Table III.2. Main Legal and Regulatory Provisions 172Table III.2. Main Legal and Regulatory Provisions 172
Table of Content
xi
Table III.3. Allocation of Policy and Regulatory Responsibilities 173Table III.4. Length of the Public Non-Tolled Road Network (Km) 174Table III.5. Regional Shares of Classified Road Network,
Land Area and Population, 2000 (%) 174Table III.6. Governmental Expenditures on Roads,
1984/85-1999/2000 176Table III.7. Total Road Network 178Table III.8. Paved Roads as % of Total Road Length (including
District roads) 178Table III.9. Condition of the Kabupaten Road Network by
Construction Type, 2002 178Table III.10. Road Accident Fatalities, 2001 178Table III.11. Condition of the National and Provincial Road
Network by Region, 2001 (%) 179Table III.12. Government Expenditure on Roads,
Millions 1999 USD 180Table III.13. Projected Road Agency and Road User Costs
by Budget Level 180Table III.14. The Way Forward 188Table Annex III.1.01. NPV of the Change in Consumer Surplus by
Segment (in Millions) 190Table Annex III.1.02. Projected Road Agency and Road User Costs
Assuming 80% Efficiency 191
Table IV.1. Estimated distribution in urban areas 197Table IV.2. Estimated distribution in rural areas 197Table IV.3. Coverage Statistics for PERPAMSI Member PDAMs 197Table IV.4. Sewerage Coverage 204Table IV.5. The Way Forward - WATER 214Table IV.6. The Way Forward – SANITATION 215Table Annex IV.1.01.Legislation relevant to water supply
and sanitation service provision 216Table Annex IV.2.01.Water Supply 217Table Annex IV.2.02.Sewerage 217Table Annex IV.6.01.Summary of Model Results (US$ Millions) 224Table Annex IV.6.02.% Change in Tariffs Needed to Cover Costs 224Table Annex IV.6.03. Inputs and Assumptions 225Table Annex IV.6.04.Model Outcomes 226Table Annex IV.6.05.Scenario 1 - Status Quo:
Maintain current service level 227Table Annex IV.6.06.Scenario 2 - Partial Reform:
Maintain current service level 227Table Annex IV.6.07.Scenario 2 - Partial Reform: Reinvest
additional revenue to expand access 227Table Annex IV.6.08.Scenario 3 - Full Reform:
Maintain current service level 227Table Annex IV.6.09.Scenario 3 - Full Reform: Reinvest
additional revenue to expand access 227Table Annex IV.6.10.Sensitivity Analysis Comparison 228Table Annex IV.6.11.Summary of Model Results (US$ Millions) 228Table Annex IV.6.12.% Change in Tariffs Needed to Cover Costs 228
List of Text BoxesBox I.1. Integrating Captive Power Plants (CPPs) in the
Power Sector 127Box I.2. What About Using Captive Power to Increase
Reliability? 135Box I.3. Indonesia IPP Debacle 136
Box Annex IV.3.01. Targets vs. achievements in the twoconcession areas 218
Table of Content
Averting an Infrastructure Crisis:A Framework for Policy and Actionov
ervi
ew
1
Indonesia is turning a corner, from crisis management towards growth.For the first time, after the crisis, Indonesia is able to focus on longer-termdevelopment policies. Reversing the trend of deteriorating infrastructureis one of the top priorities. How did Indonesia, a country that hadsuccessfully used infrastructure development as a path out of poverty andtowards economic growth, find itself struggling in almost everyinfrastructure sector? Infrastructure played a key role in driving growthand poverty reduction in the 30 years prior to the 1997 crisis. But followingthe crisis, the government had to focus on fixing more immediate problemssuch as currency devaluation, capital flight, and an unstable political andsocial environment. The government had to reduce development spending,and infrastructure suffered across the board. Indonesia’s infrastructurequality ranks among the lowest in the region and is affecting growth, povertyreduction, foreign investment, and the environment.
Indonesia has recovered from the crisis, and the government is wellpositioned to refocus on infrastructure. Recent progress – such as fiscalconsolidation, political stability, and some improvement of the regulatoryframework – sets the stage for Indonesia to move beyond the currentinfrastructure impasse. To avert a major infrastructure crisis, further actionis urgent. Additional infrastructure investments of about 2% of GDP arerequired in the short and medium-term. But additional spending alone isnot enough, the government will also have to address the longer termissues of improving public management, the regulatory environment, andworking out the complications from decentralization.
Public infrastructure invest-ment has dropped sharplysince the crisis — from $8billion USD in 1994, to $1.5billion in 2002.
2
Averting an Infrastructure Crisis:A Framework for Policyand Action
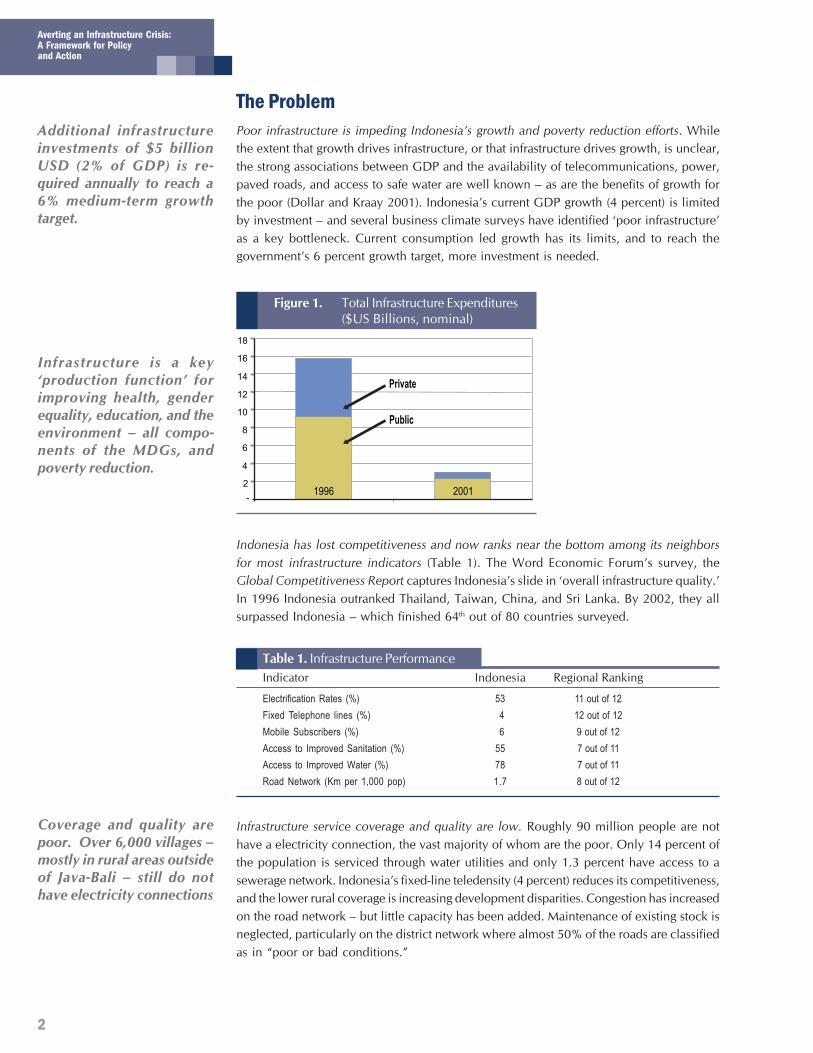
The ProblemPoor infrastructure is impeding Indonesia’s growth and poverty reduction efforts. Whilethe extent that growth drives infrastructure, or that infrastructure drives growth, is unclear,the strong associations between GDP and the availability of telecommunications, power,paved roads, and access to safe water are well known – as are the benefits of growth forthe poor (Dollar and Kraay 2001). Indonesia’s current GDP growth (4 percent) is limitedby investment – and several business climate surveys have identified ‘poor infrastructure’as a key bottleneck. Current consumption led growth has its limits, and to reach thegovernment’s 6 percent growth target, more investment is needed.
Infrastructure is a key‘production function’ forimproving health, genderequality, education, and theenvironment – all compo-nents of the MDGs, andpoverty reduction.
Figure 1. Total Infrastructure Expenditures($US Billions, nominal)
-
2
4
6
8
10
12
14
16
18
1996 2001
Private
Public
Indonesia has lost competitiveness and now ranks near the bottom among its neighborsfor most infrastructure indicators (Table 1). The Word Economic Forum’s survey, theGlobal Competitiveness Report captures Indonesia’s slide in ‘overall infrastructure quality.’In 1996 Indonesia outranked Thailand, Taiwan, China, and Sri Lanka. By 2002, they allsurpassed Indonesia – which finished 64th out of 80 countries surveyed.
Table 1. Infrastructure PerformanceIndicator Indonesia Regional Ranking
Electrification Rates (%) 53 11 out of 12Fixed Telephone lines (%) 4 12 out of 12Mobile Subscribers (%) 6 9 out of 12Access to Improved Sanitation (%) 55 7 out of 11Access to Improved Water (%) 78 7 out of 11Road Network (Km per 1,000 pop) 1.7 8 out of 12
Infrastructure service coverage and quality are low. Roughly 90 million people are nothave a electricity connection, the vast majority of whom are the poor. Only 14 percent ofthe population is serviced through water utilities and only 1.3 percent have access to asewerage network. Indonesia’s fixed-line teledensity (4 percent) reduces its competitiveness,and the lower rural coverage is increasing development disparities. Congestion has increasedon the road network – but little capacity has been added. Maintenance of existing stock isneglected, particularly on the district network where almost 50% of the roads are classifiedas in “poor or bad conditions.”
Additional infrastructureinvestments of $5 billionUSD (2% of GDP) is re-quired annually to reach a6% medium-term growthtarget.
Coverage and quality arepoor. Over 6,000 villages –mostly in rural areas outsideof Java-Bali – still do nothave electricity connections
3
Overview
Table 2. Sector Issues
Water and Sanitation Telecommunications
• Water access is low – 22% of the population do not • Fixed line access is the lowest in the region –have access to “improved” water, and only 14% only 4% of the population, mostly in urban areas,are connected to PDAMs is covered
• Sanitation service is lacking – only 1.3% of the • Massive investment is needed, but funding ispopulation are reached by a sewerage network a challenge – raising teledensity 1% will cost •
• PDAMs are struggling – over 2/3 operate in the $330 millionred, unaccounted for water is over 40%, and • The mobile sector continues to expand,tariffs are well below costs averaging 77% annual growth since 1995
Power Roads and Road Transport
• Access is low - 43% of population is without power • Spending has declined – from 22% of the national(roughly 90 million people, of which 90% are poor) development budget in 1993, to 11% in 2000
• Connection costs are 33% higher in rural areas • Maintenance is lacking – the proportion of road• Investment needs are high – an estimated budget for maintenance reduced from 30% to
US $15-17 billion is required before 2012 for below 10% from 1985 to 2000an additional 9,700 MW of capacity, expanded • Congestion is a problem – significant capacitytransmission, and distribution for 1.6 million expansion is needed, but little has been added,connections annually and urbanization trends will only increase the
problem
Infrastructure is critical to support rapid urbanization trends. More than 60 million people(from 80 million in 2000 to 140 million in 2020) will be added to Indonesia’s urbanpopulation in the next two decades. The primary urban areas in the country already sufferfrom lack of clean water, sanitation and adequate urban transportation. Yet, urban areasare the key drivers of the economy – contributing 70 percent of non-oil. Additionally,providing basic services to the large numbers of urban poor (over 13 million were belowthe poverty line in 2002) must be a focus of Indonesia’s poverty reduction strategy.
Poor infrastructure has reduced the quality of life and the environment. The lack of seweragesystems and solid waste facilities have caused widespread contamination of surface andground water, as well as the destruction of sensitive eco-systems. During the dry season,10% of the river flow of the Brantas river (the direct source of Surabaya’s water supply)consist of untreated industrial wastewater. Further, about half of Surabaya’s solid wasteand most of the human waste are dumped into the river. These conditions are commonthroughout Indonesia, and are the prime reason Indonesia has the highest incidence oftyphoid in East Asia.
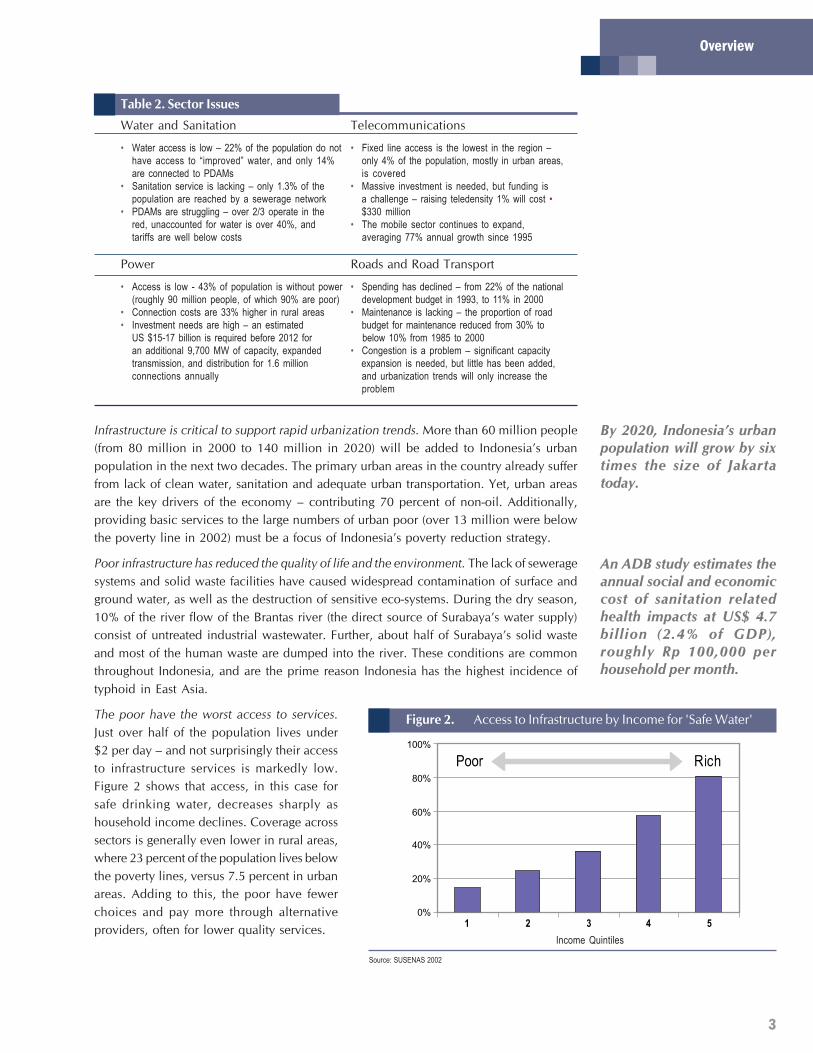
The poor have the worst access to services.Just over half of the population lives under$2 per day – and not surprisingly their accessto infrastructure services is markedly low.Figure 2 shows that access, in this case forsafe drinking water, decreases sharply ashousehold income declines. Coverage acrosssectors is generally even lower in rural areas,where 23 percent of the population lives belowthe poverty lines, versus 7.5 percent in urbanareas. Adding to this, the poor have fewerchoices and pay more through alternativeproviders, often for lower quality services.
By 2020, Indonesia’s urbanpopulation will grow by sixtimes the size of Jakartatoday.
0%
20%
40%
60%
80%
100%
1 2 3 4 5
Figure 2. Access to Infrastructure by Income for 'Safe Water'
Income Quintiles
Source: SUSENAS 2002
An ADB study estimates theannual social and economiccost of sanitation relatedhealth impacts at US$ 4.7billion (2.4% of GDP),roughly Rp 100,000 perhousehold per month.
4
Averting an Infrastructure Crisis:A Framework for Policyand Action
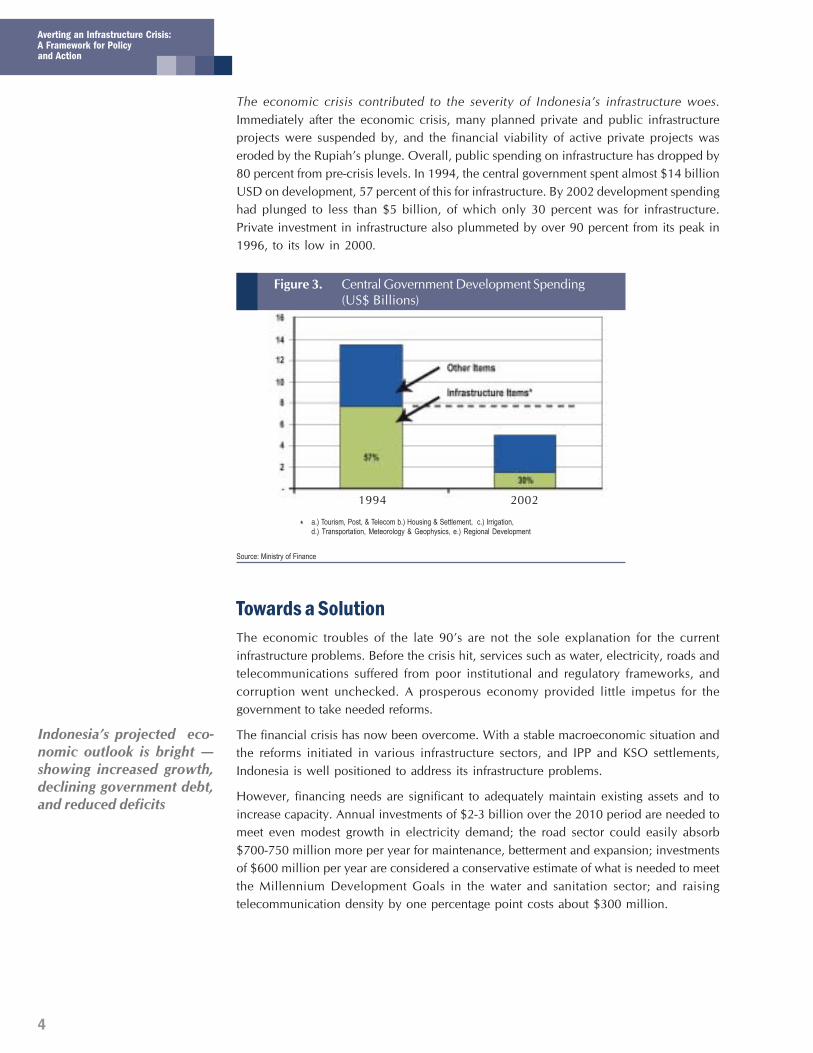
The economic crisis contributed to the severity of Indonesia’s infrastructure woes.Immediately after the economic crisis, many planned private and public infrastructureprojects were suspended by, and the financial viability of active private projects waseroded by the Rupiah’s plunge. Overall, public spending on infrastructure has dropped by80 percent from pre-crisis levels. In 1994, the central government spent almost $14 billionUSD on development, 57 percent of this for infrastructure. By 2002 development spendinghad plunged to less than $5 billion, of which only 30 percent was for infrastructure.Private investment in infrastructure also plummeted by over 90 percent from its peak in1996, to its low in 2000.
Figure 3. Central Government Development Spending(US$ Billions)
* a.) Tourism, Post, & Telecom b.) Housing & Settlement, c.) Irrigation,d.) Transportation, Meteorology & Geophysics, e.) Regional Development
Source: Ministry of Finance
1994 2002
Towards a SolutionThe economic troubles of the late 90’s are not the sole explanation for the currentinfrastructure problems. Before the crisis hit, services such as water, electricity, roads andtelecommunications suffered from poor institutional and regulatory frameworks, andcorruption went unchecked. A prosperous economy provided little impetus for thegovernment to take needed reforms.
The financial crisis has now been overcome. With a stable macroeconomic situation andthe reforms initiated in various infrastructure sectors, and IPP and KSO settlements,Indonesia is well positioned to address its infrastructure problems.
However, financing needs are significant to adequately maintain existing assets and toincrease capacity. Annual investments of $2-3 billion over the 2010 period are needed tomeet even modest growth in electricity demand; the road sector could easily absorb$700-750 million more per year for maintenance, betterment and expansion; investmentsof $600 million per year are considered a conservative estimate of what is needed to meetthe Millennium Development Goals in the water and sanitation sector; and raisingtelecommunication density by one percentage point costs about $300 million.
Indonesia’s projected eco-nomic outlook is bright —showing increased growth,declining government debt,and reduced deficits
5
Overview
Infrastructure has been an integral part of the agenda for policy makers in the past fewyears. This has resulted in various reform initiatives, including the following:
• a modern electricity law was adopted in 2002, implementing regulations have beenprepared, electricity tariffs have been increased substantially, and contentious issueswith the Independent Power Producers have been settled;
• a new oil and natural gas law was passed, that introduced downstream competitionand market pricing;
• the water sector has seen progress in implementing a debt work out program tostrengthening PDAMs’ finances; and
• in telecommunications, a new law adopted in 1999 paved the way for the progressiveintroduction of competition in all market segments, and dramatic growth in thenumber mobile subscribers since 1997 has been accompanied by solid increases inthe number of fixed lines in service, public payphones, teleshops, and internet shops.
Despite the significance of the reforms, the resulting overall impact has been rather limited.A key impediment is the lack of an overall government strategy for infrastructure andpredictable policies in these critical infrastructure sectors. For example, most of the keylaws that were passed still do not have implementing regulations. In addition, credibilityof public policies from the point of view of the private investors remains historically low.
6
Averting an Infrastructure Crisis:A Framework for Policyand Action
Indonesia must address the various facets of this policy-credibility issue in order to attractthe financial resources that its infrastructure sectors currently lack. In particular, moreefficient management of public infrastructure assets will help contain costs and optimizeuse of public funds; with progressive implementation of cost-covering tariffs, internallygenerated funds could be made available for investment; and an overall environmentmore conducive to private participation would help rekindle the interest of private financiersfor Indonesian infrastructure. Such reforms will take time, however, and a substantialfinancing gap is likely to remain. In order to fill this gap, government spending oninfrastructure will have to increase. In addition, steps can be taken to promote greatermobilization of domestic savings for infrastructure investment, and better targeting ofpublic resources towards the poor.
Need for Action on Multiple FrontsImproving Public Management of InfrastructureMost of Indonesia’s infrastructure is still developed and managed by the public sector,and this will remain the case for some time to come. Hence, better public managementof infrastructure will have by far the most positive impact. However, the role played bythe public sector will change in three major ways. First, Indonesia has moved tocommercialize and corporatize delivery and management of key public infrastructure,hence, the role is changing from provision to regulation (discussed in the next section).Second, Indonesia has launched an ambitious decentralization program that has transferredmany responsibilities relating to infrastructure provision to sub-national entities. Third,and in part as a consequence of the above two changes, the role of central agencies withrespect to infrastructure is evolving, thus requiring the Government to rethink how itcoordinates policy and strategic planning.
Rethinking the Role of Central Authorities
In the road sector, for example, what is needed is an effective National Roads Strategy. Astrategy that is understood by all, with a clear financing plan, clear articulation ofresponsibilities, clear links between planning, new investments, management of use andmaintenance, and a clear path ahead for capacity building and institutional reform. To dothis, the central government will have to quickly readjust its role to the post decentralizationenvironment. In addition to decentralization, many government agencies will now haveto move from being a service provider to a facilitator, as greater corporitization andprivatization is introduced. Emphasis is needed on policy formulation and support tolocal authorities rather than on design and implementation of civil works, or on directprovision of services. These new functions need to be defined with precision for each ofthe main sector ministries, and organizational structures and staffing needs will need tobe reviewed accordingly.
Indonesia also faces the challenge of redefining its mechanisms for coordinating policyand strategy for infrastructure development in an environment with more dispersed roles.In the past, Bappenas prepared the national five-year development plans and, along withthe Coordinating Ministry for the Economy and Industry (EKUIN), also coordinatedIndonesia’s policy development and reform initiatives. Currently, Bappenas, whose powersare now more circumscribed, functions as a planning advisor for those committees, andthe Coordinating Ministry of Economic Affairs (EKUIN’s successor) focuses more on short
Today, responsibilities forinfrastructure provision andoperating decisions arewidely dispersed between aproliferation of special pur-pose coordination commit-tees – several of which haveoverlapping roles.
7
Overview
term implementation matters. A key challenge for Indonesia is to craft a framework forcoordinating policy and strategic planning in an environment with a much wider dispersionof responsibilities than in the past.
Making Decentralization Work
In 2001, Indonesia launched a “big bang” decentralization program. The legislative andregulatory provisions needed to implement such a program are still incomplete. In theinfrastructure sectors, decentralization has created uncertainty as to which level ofgovernment is responsible for the provision of various services. The situation is exacerbatedby the fact that some decentralization implementing regulations are inconsistent withothers, as well as with existing national sector regulations. Capacity within the localgovernments also needs to be developed so that they can effectively provide servicescommensurate with their new responsibilities.
The way in which financial resources have so far been transferred to decentralized authoritiesis unsatisfactory. First, the current allocation of resources between regions tends toexacerbate rather than reduce regional inequalities. Modifying the current allocation ofresources is political and difficult – but in the present situation, many poorer regionsreceive just enough to pay wages and are left with little funding for infrastructure or othertypes of expenditures. In addition, the central government lacks instruments to promotethe pursuit of national objectives by local authorities. Funds available for matching grantschemes are very limited. In addition, at present two distinct matching grant mechanisms,with different application and evaluation criteria, and different terms and conditions arein use, these need to be harmonized. Finally, the current framework for regional governmentborrowing is unduly restrictive. Local governments should be encouraged to borrow fromthe market. This will require, among others, modern financial management at the locallevel and institutions that can rate local government credit worthiness. This is muchneeded, as constraints on financial transfers from the center and on borrowing opportunitieshave already led some regional governments to impose arbitrary fees and taxes that tendto introduce economic distortions and conflict with national legislation.
Box 1. Taking action – on Public Management• The role, organization and staffing of main sector ministries need to reflect the new decentralized environment.
Overall policy planning and coordination functions also need to be strengthened.• The government needs to expand its efforts to operate on a commercial basis. PDAMs especially need
attention to be more transparent, and to operate more autonomously from local governments.• UU22/1999 and earlier sector laws should be amended to better define the role and responsibilities
between the levels of government, and for infrastructure provision. The provinces need to be empoweredto play a much stronger coordinating role vis-à-vis municipalities.
• Procedures for on-lending of foreign loans need to be streamlined by amending KMK.35. (the policy thatgoverns local borrowing) The current bottom-up process is complex, and has the potential to impede thechanneling of funds for urgent and justified infrastructure at the sub-national level.
Restoring Private ParticipationIndonesia needs to mobilize private investments for infrastructure if it wants to rapidlyimprove service coverage, maintain international competitiveness, and support theexpanding economy. There has been a substantial decline in private participation ininfrastructure in Indonesia after a dramatic increase in the first half of the 1990’s, (Figure
Coordinating between the400 local governments andmunicipalities will necessi-tate empowering provincialgovernments to have alarger role.
Decentralization has exacer-bated regional inequalities –budget receipts per capitafor rich regions are 30 timeshigher than the poorest re-gions.
8
Averting an Infrastructure Crisis:A Framework for Policyand Action
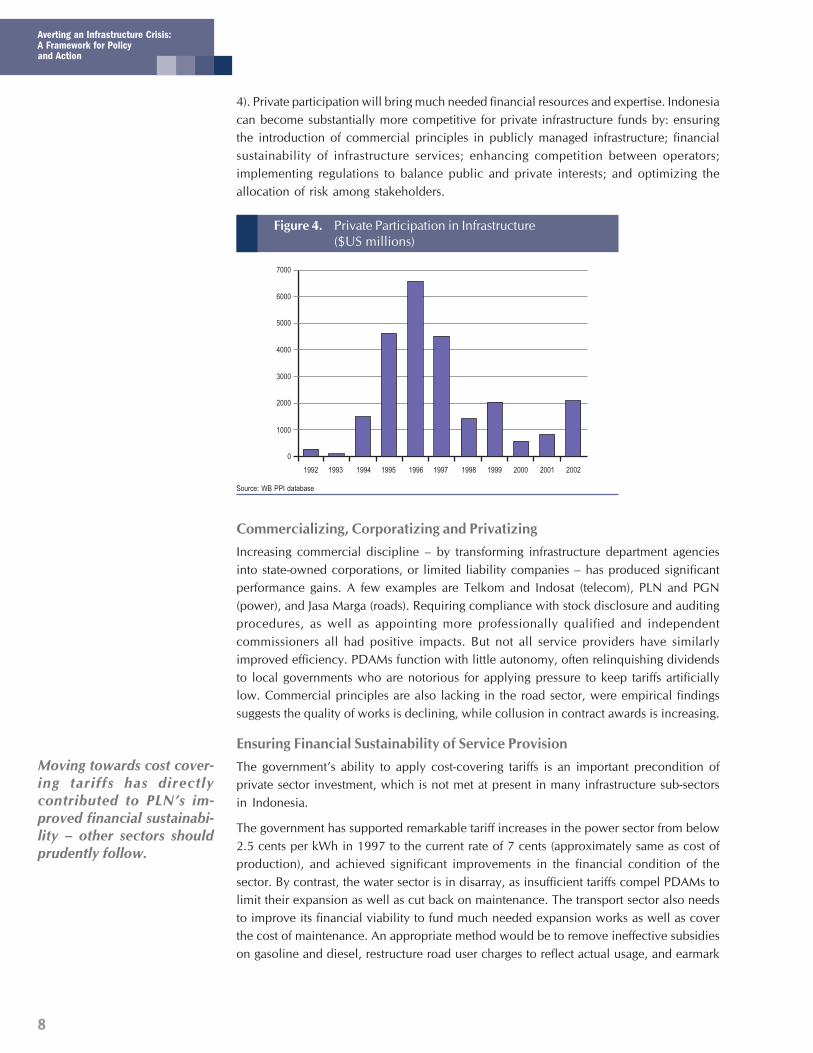
4). Private participation will bring much needed financial resources and expertise. Indonesiacan become substantially more competitive for private infrastructure funds by: ensuringthe introduction of commercial principles in publicly managed infrastructure; financialsustainability of infrastructure services; enhancing competition between operators;implementing regulations to balance public and private interests; and optimizing theallocation of risk among stakeholders.
Commercializing, Corporatizing and PrivatizingIncreasing commercial discipline – by transforming infrastructure department agenciesinto state-owned corporations, or limited liability companies – has produced significantperformance gains. A few examples are Telkom and Indosat (telecom), PLN and PGN(power), and Jasa Marga (roads). Requiring compliance with stock disclosure and auditingprocedures, as well as appointing more professionally qualified and independentcommissioners all had positive impacts. But not all service providers have similarlyimproved efficiency. PDAMs function with little autonomy, often relinquishing dividendsto local governments who are notorious for applying pressure to keep tariffs artificiallylow. Commercial principles are also lacking in the road sector, were empirical findingssuggests the quality of works is declining, while collusion in contract awards is increasing.
Ensuring Financial Sustainability of Service ProvisionThe government’s ability to apply cost-covering tariffs is an important precondition ofprivate sector investment, which is not met at present in many infrastructure sub-sectorsin Indonesia.
The government has supported remarkable tariff increases in the power sector from below2.5 cents per kWh in 1997 to the current rate of 7 cents (approximately same as cost ofproduction), and achieved significant improvements in the financial condition of thesector. By contrast, the water sector is in disarray, as insufficient tariffs compel PDAMs tolimit their expansion as well as cut back on maintenance. The transport sector also needsto improve its financial viability to fund much needed expansion works as well as coverthe cost of maintenance. An appropriate method would be to remove ineffective subsidieson gasoline and diesel, restructure road user charges to reflect actual usage, and earmark
Moving towards cost cover-ing tariffs has directlycontributed to PLN’s im-proved financial sustainabi-lity – other sectors shouldprudently follow.
Figure 4. Private Participation in Infrastructure($US millions)
Source: WB PPI database
7000
6000
5000
4000
3000
2000
1000
0
1992 1993 1994 1995 1996 1997 1998 1999 2000 2001 2002
9
Overview
these funds to cover sector expenditures. Charges for international telecommunicationsare expected to decrease due to enhanced competition in the sector but the price of localcalls are currently below costs and will have to rise in the future. It is important that anyfuture tariff increases in infrastructure sectors be phased in cautiously with correspondingimprovements in services. Ensuring social acceptance of these reforms, where the rationaleand timing are clearly articulated to the public, is also critical for the long-term success inthe sector.
Maximizing Competition
Indonesia has not fully taken advantage of the benefits of competition, yet the intensity ofcompetitive pressures is one of the most important determinants of performance ininfrastructure service provision. The scope for ‘head to head’ competition in the market –where consumers can choose their supplier, and suppliers compete to serve them – varies.However, the one market where competition is easily feasible, telecommunication, it hasbeen postponed. Similarly in power, Indonesia Power and PLN continue to operate moreas partners than head-to-head competitors. Consequently, power is more costly than itwould be with competition. Indonesia’s new 2002 electric power law does howeverrecognize the potential for competition in generation and supply, and provides for itsprogressive introduction on a regional basis.
When direct, head-to-head competition is not feasible, competition for the market (e.g.franchise bidding) can be used to select operators. However, numerous opportunitieshave been lost in Indonesia: water supply concessions have been awarded through directnegotiations; numerous unsolicited IPP projects were also negotiated quickly and non-transparently; and the same practices are widespread in the toll road sector. The cost forthe Indonesian economy has been enormous – when a number of IPP projects werefinally competitively tendered, the offered tariff was well below the previously negotiatedone for similar projects.
Finally, competitive discipline can be derived from yardstick competition, wherebyregulators use comparative performance data from other similar enterprises to regulatemonopoly network industries. This is a tool that has been used effectively by variouscountries, especially in sectors characterized by the existence of multiple operators holdingmonopolistic positions in different regions. Some fragmented efforts have been made inIndonesia to introduce yardstick competition in the water distribution sector, but muchmore systematic efforts should be undertaken in that sector and elsewhere.
Establishing Adequate Regulation
Sound regulation is needed for private participation as it promotes economic efficiency,fosters innovation, and creates incentive for system expansion. A credible regulatory body,however, needs autonomy and independence to perform its function. This can be achievedby providing regulators with distinct statutory authority, appointing them for fixed-terms,preventing their removal except in predefined circumstances, and providing funding throughlevies on the regulated industry.
Indonesia is at an early stage in developing its regulatory agencies and more effort isneeded to develop adequate, independent regulatory bodies. To move forward, thegovernment must appoint the regulators, issue and implement the regulations stated inthe laws, and provide these agencies with adequate resources so that they can begin toestablish a track record. Regulation by contract will have to be the norm in the interim.
Indonesia’s mobile phonemarket is the best example ofcompetitiveness (and conse-quently private investment),and consumers have bene-fited from better technology,more choices, and lowerprices.
Laws have been passed inboth the telecommunicationand energy sector that ena-bles the creation of regula-tory entities.
10
Averting an Infrastructure Crisis:A Framework for Policyand Action
Allocating and Managing Risk
Rewards for investors are commensurate with risks – but Indonesia’s reputation as acountry, filled with red tape, a weak judicial system, arbitrary taxes, and corruption hasmade many investors reluctant to invest. Their reluctance also stems from political andeconomic events beyond their control. But if these services were to be provided by thepublic sector instead, the government would, in fact, be implicitly bearing all of the risks.Therefore, the government should develop a framework for identifying and assessing variousinvestment risks, and a methodology to help determine which are acceptable to undertake.Involving the Ministry of Finance in this process would also better ensure that the expectedfiscal exposure of risk sharing arrangements are properly evaluated and financially feasible.
Box 2. Taking action – on Restoring Private Participation• Amendments to Keppres 7 (or a similar regulation) need to be completed, and supplemented with a sound
policy framework on public support for private projects, including a framework for realistic risk allocationbetween public and private sector.
• Develop a comprehensive plan to restore tariffs to cost-reflective levels, and improve on socializing tariffchanges to the public.
• Develop sector-by-sector plans for restructuring and promoting competition – with the adoption of competitivetendering as the norm for all PPI projects, and benchmarking mainstreamed as a means to pressure localmonopolies
Tackling CorruptionCorruption remains pervasive in Indonesia, and despite the government’s attempts toaddress the issue, little progress has been made. The post-Soeharto and post-decentralizationenvironment is often perceived to have made matters worse, as corruption is more diffused,and even “less effective” in producing intended results. Corruption is a major factordetermining investor confidence. Indonesia’s ranking, well below its neighbors (China,Thailand, Philippines, and Vietnam) in Transparency International’s Corruption PerceptionIndex (CPI), illuminates some of the reasons for its lagging investment climate.
Infrastructure presents ‘opportunities’ for rent seekers at every stage, from projectidentification and negotiation, to implementation and operation. The results are costly–a significant amount of public funds are lost annually through corrupt procurement practicesin Indonesia. Eliminating corruption requires fundamental changes in the accountabilityframework that will take considerable time to design and implement. However, there aresignificant opportunities for reducing corruption in the infrastructure sectors in the shortterm – these require limiting rent-seeking opportunities, improving detection, increasingthe consequences of being caught, and creating incentives for non-corrupt behavior.
Box 3. taking action – on Tackling Corruption• Considerable effort has gone into improved procurement regulations for central and regional government
by replacing Keppres 18/2000 with Keppres 80/2003. The new regulation establishes an Institution forDevelopment of Public Procurement Policy (LPKPP), requires procurement certification for bid committees,removes pre-qualification for contracts below $6 million, and introduces ‘integrity pacts’ for suppliers andcontractors. Keppres 80 a positive step – but the government needs to work out the many unresolveddetails to ensure implementation and enforcement are carried through.
• The revision to Kepress 7/1998 on Public Private Partnerships for Infrastructure Provision is overdue. Thisis needed to improve guidelines for project identification and more transparent and competitive solicitationof private partners.
Indonesia ranked 138th outof 146 countries in the 2002World Investment Report forForeign Direct Investment.
Indonesia ranked 122 out of133 countries on the Cor-ruption Perception Index(CPI)
But curbing corruption is notimpossible – by increasingcompetition with improvedcomplaint mechanisms andadvertising, a recent WorldBank infrastructure projectin Bali has saved almost 20%of the government owner’sestimate in procurement.
11
Overview
Mobilizing Finance for InfrastructureThe reforms discussed above will help address, to some extent, the lack of financing thatcurrently affects the provision of infrastructure. Cost covering tariffs, in particular, areultimately key to ensure financial sustainability. But all such reforms will take time andthere will therefore remain, a significant financing gap. This can, in part, be filled fromthree sources: increased government spending, greater mobilization of domestic savings,and better targeting of public resources towards the poor.
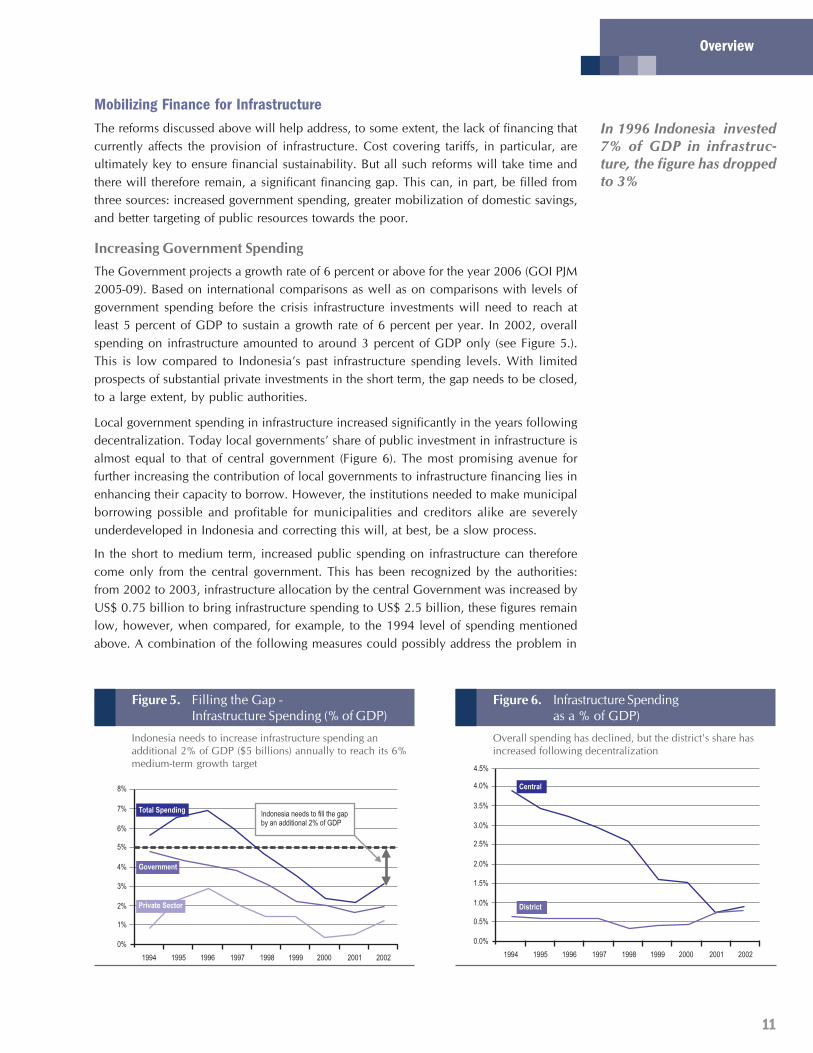
Increasing Government SpendingThe Government projects a growth rate of 6 percent or above for the year 2006 (GOI PJM2005-09). Based on international comparisons as well as on comparisons with levels ofgovernment spending before the crisis infrastructure investments will need to reach atleast 5 percent of GDP to sustain a growth rate of 6 percent per year. In 2002, overallspending on infrastructure amounted to around 3 percent of GDP only (see Figure 5.).This is low compared to Indonesia’s past infrastructure spending levels. With limitedprospects of substantial private investments in the short term, the gap needs to be closed,to a large extent, by public authorities.
Local government spending in infrastructure increased significantly in the years followingdecentralization. Today local governments’ share of public investment in infrastructure isalmost equal to that of central government (Figure 6). The most promising avenue forfurther increasing the contribution of local governments to infrastructure financing lies inenhancing their capacity to borrow. However, the institutions needed to make municipalborrowing possible and profitable for municipalities and creditors alike are severelyunderdeveloped in Indonesia and correcting this will, at best, be a slow process.
In the short to medium term, increased public spending on infrastructure can thereforecome only from the central government. This has been recognized by the authorities:from 2002 to 2003, infrastructure allocation by the central Government was increased byUS$ 0.75 billion to bring infrastructure spending to US$ 2.5 billion, these figures remainlow, however, when compared, for example, to the 1994 level of spending mentionedabove. A combination of the following measures could possibly address the problem in
In 1996 Indonesia invested7% of GDP in infrastruc-ture, the figure has droppedto 3%
Figure 5. Filling the Gap -Infrastructure Spending (% of GDP)
Indonesia needs to increase infrastructure spending anadditional 2% of GDP ($5 billions) annually to reach its 6%medium-term growth target
6%
5%
4%
3%
2%
1%
0%
1994 1995 1996 1997 1998 1999 2000 2001 2002
7%
8%
Total Spending
Government
Private Sector
Indonesia needs to fill the gapby an additional 2% of GDP
Figure 6. Infrastructure Spendingas a % of GDP)
Overall spending has declined, but the district's share hasincreased following decentralization
3.0%
2.5%
2.0%
1.5%
1.0%
0.5%
0.0%
1994 1995 1996 1997 1998 1999 2000 2001 2002
3.5%
4.0% Central
4.5%
District
12
Averting an Infrastructure Crisis:A Framework for Policyand Action
the medium term. First, the central government needs to increase its overall revenueenvelope, especially through increased compliance. Second, existing allocation in non-performing sectors could be directed towards infrastructure (for example, various fuelsubsidies account for nearly 2 percent of GDP). Finally, the impressive fiscal consolidationof the last few years has created some space for increased borrowing. Indonesia’s debt toGDP ratio is steadily decreasing and the deficit has been kept to a bare minimum. Thisdiscipline has resulted in upgrades by investment rating agencies. Government can borrowat below 7 percent in the market today and, as discussed in the next section, the domesticmarket is relatively un-tapped for infrastructure related borrowing. However, beforeborrowing from the market, the Government should maximize the use of cheaper donorfunds first.
Mobilizing Domestic FinanceDomestic funds are the key to the long-term health of infrastructure finance. Three largeretirement funds (for police and defense personnel, for civil servants, and for employeesin the private sector and in SOEs), several hundreds of funds established by individualemployers for their employees and the life insurance sector have combined assets ofabout Rp. 100 trillion contributed by almost 26 million participants.
Various steps can be taken to increase the flow of domestic fund to infrastructure.International experience shows that contractual savings institutions, notably pensionschemes (which are allowed to invest in non-governmental assets) are essential instrumentsto channel domestic savings into infrastructure financing. Pension funds and insurancecompanies have long-lived liabilities denominated in local currency, making themparticularly suited for investing in infrastructure instruments that provide returns in local
13
Overview
currency over long periods of time. The Indonesian Government should therefore considermodification of the investment regulations that govern institutions such as the pensionfunds and insurance firms in order to enable such institutions to invest in infrastructuresecurities. It cannot be overemphasized, however, that an attractive investment climatefor infrastructure is a precondition for tapping domestic capital markets; institutionalreform in the capital markets alone will achieve little. It is also absolutely crucial thatfund managers have incentives – and be free to – make investment decisions on the basisof commercial rather than political considerations.
To develop products that these funds can invest in, the central Government may considerusing public resources to strengthen the capacity of sub-national entities – especiallymunicipalities – to borrow on the local markets. The Government of Colombia, forexample, created a municipal finance institution, Findeter, designed to promote longterm lending from commercial banks to municipalities. A bank that made a long termloan to a municipality can borrow from Findeter up to 85 percent of the loan at subsidizedrates. This facilitates access by municipalities to commercial loans while relying on theproject appraisal skills of commercial banks (banks are liable to Findeter if their borrowersdefault). To the extent possible, government schemes for municipal finance should involvethe financial sector in allocating credit and sharing risk. This in turn requires that localbanks possess sufficient capacity in assessing the expected returns of projects. Finally,municipal finance schemes can only be viable if municipalities have a positive and roughlypredictable revenue stream through taxes, services charge, ect.
To bring together supply and demand, the Government will have to focus on creating orupgrading certain aspects of financial market infrastructure. Establishing a sound governmentbond market – in which sovereign issues in domestic currency of various maturities areissued at predictable regular intervals is another important aspect of market infrastructure:a well functioning government debt market allows the creation of benchmark bond priceswhich would then form the basis on which instruments of different risks can be priced.Lastly, a sound legal framework and credible dispute resolution mechanisms are key toattracting long-term investments from private sources.
Protecting the PoorCross-subsidization between users of infrastructure services is very common in Indonesia.However, current cross-subsidization schemes in Indonesia present major drawbacks;
• they are not well targeted at the poor and tend to subsidize the already low variableconsumption costs of existing users while the poor often have no access to the service;
• they entail rather large resource transfers and therefore introduce important allocationdistortions,
• and they force a given service provider to operate transfers between different categoriesof its own users, therefore requiring that monopolistic arrangements be maintained toprevent new entrants from “stealing” the customers who are currently over-chargedand who provide the source of the cross-subsidies.
Cross-subsidization schemes should be better targeted at the truly poor – e.g. existingusers could contribute part of the costs of expanding the system to reach new users. Inaddition, to breaking up monopolies, the government could impose a uniform levy on allcompanies participating in the market and redistribute those resources to the operatorswho provide services to the poor.
Sound and credible creditrating institutions whichwould provide an independ-ent assessment to investorsof the risks and returnsoffered by the bonds areimportant players in thisprocess.
14
Averting an Infrastructure Crisis:A Framework for Policyand Action
Among the mechanisms that rely on taxpayers to subsidize certain services, output-basedsubsidies can be most precisely targeted at poor users. Since service providers receive thesubsidy only after actual delivery of the desired services, such schemes enhance theoperators’ incentives to perform. Indonesia has started to explore such schemes in thepower sector. It should also design such schemes in ways that maximize competitivepressures between operators. This can be done by organizing competitive bidding processesto identify, on the basis of the lowest subsidy required, the operator that will have theright to provide the subsidized services. The Government could also establish a system of“portable subsidies,” whereby operators compete for customers and any operator thatprovides the agreed upon service to the targeted population receives a pre-determinedsubsidy.
Box 4. Taking action – Mobilizing Finance for InfrastructureDevelopment
• Indonesia needs to increase investments in infrastructure by about 2 percent of GDP. In the short/mediumterm, increased spending by the central government will be required to bridge this gap. This would bepossible through a combination of: improved tax collection, re-allocation of unproductive spending, andincrease in borrowing made possible by the impressive fiscal consolidation.
• Steps should be taken to tap domestic savings for infrastructure investments.• To the extent that cross-subsidy schemes remain necessary in the short term to enable the poor to have
access to infrastructure, they should be more limited and better targeted at the truly poor
The Way ForwardIndonesia has already started to undertake ambitious reforms in infrastructure. At thesame time, the severity of current and potential future problems can not be underestimated.The reform agenda is potentially huge and no government can possibly address all issuessimultaneously. There are limits, for example, to the number of new laws that can possiblybe simultaneously drafted and then considered by the DPR. Also, tariffs cannot be increasedall at once given the strain that it would put on household budgets. In addition, theGovernment has already committed to give high priority to an ambitious agenda of policyand legal reform measures included in the White Paper. In light of these constraints, thisreport attempts to prioritize between reform measures.
There are no simple solutions ahead. But we believe that any strategy will need to focuson three pillars: First, better public management, planning and consistent policies forinfrastructure development will be key to reestablish credibility, service provision andimpact on the population. The new decentralization agenda lends added complexity tothis agenda. Second, while the public sector is likely to remain dominant in manyinfrastructure sectors, steps will need to be taken to re-attract the private sector in order toprovide vital expertise, foster competition (or appropriate regulation) to improve efficiency,and because the financing constraints will remain large for some time. Finally, efficiencyin implementing public projects will be key to improve impacts. This will require aconsistent drive to improve transparency, competitive bidding and root out corrupt practices,which are prevalent in infrastructure projects throughout the world and also in particularin many sectors in Indonesia.
Over the short to medium term, we envisage a financing gap of around two to threepercent of GDP to fully reestablish infrastructure expenditures to the level required to
Output-based schemes linkthe payment of the subsidyto the effective provision, byan operator, of the servicethat qualifies for obtainingthe subsidy.
It is imperative for Indonesiato press forward on the pathof reform if infrastructure isto foster rather than hinderits fragile economic recoveryand its efforts to tacklepoverty.
15
Overview
both support growth prospects, and to expand the provision of basic infrastructure servicesto the population. This is a conservative estimate, but we believe it is within reach withappropriate policies and improved efficiency. Indonesia has made impressive progress infiscal consolidation over the last few years, and additional measures are identified toreach this goal. While increased public spending will be key, especially to reach the poorand lagging areas, this should not be considered a substitute for policy reforms, but acomplement. In addition, this should also provide a good platform to develop moresustainable forms of mobilizing long term funding from domestic financing sources.
Without minimizing the challenges ahead, we are therefore optimistic about the future.A feasible path exists, and the government is aware of what needs to be done. The reportdoes not attempt to provide a blueprint for such a path, as searching for this path, includingsequencing of actions, priorities for investments, and building constituencies for reforms,is by nature a political exercise. Rather, it tries to highlight key issues that the decisionmakers may want to consider when preparing and implementing their next steps. Key inthis regard will simply be a consistency of signals and determination in forging ahead.We are honored to have been associated to this effort through this report and stand readyto assist in implementing it.

Achievements, Challenges,and Opportunitiesc
ha
pte
r1
17
ndonesia’s past economic achievements are commendable. Theeconomy grew impressively for 30 years until the 1997 financial crisis.The poverty headcount during the period of 1975 to 1995 declined from64.3 to 11.4 percent. Despite the hardships endured as a result of thefinancial crisis, the fiscal consolidation policies that followed are widelyviewed as sound. The infrastructure sector was a significant factor thatpaved the way for poverty reduction and economic development. GivenIndonesia’s dependence on infrastructure to reduce poverty and developin the past, one must ask why the infrastructure sectors are substantiallylagging behind today?
It would be inaccurate to blame the financial crisis as the sole reason forthe current state of the infrastructure sector in Indonesia. The issues in thesector arise from a complex set of issues rather than a single uniqueincident. The sector has required substantial structural and institutionalimprovements for quite some time, but the economic boom prior to thecrisis overshadowed the urgency of the reforms. Adequate public policieson infrastructure were never put in place and as a result, the sector is nowunable to attract the necessary investments. With the economy now poisedto rebound, Indonesia’s infrastructure sector is at a cross roads, and itsactors face a unique opportunity to implement the much needed reformsin time to sustain the recovery.
This report analyses the sector and suggests that the lack of quick progressacross the infrastructure sectors will affect Indonesia’s ability to achieveeconomic growth targets and further reduce poverty. It recognizes theconsiderable progress made thus far, but contends that reforms have
I Infrastructure was signifi-cant for Indonesia's gains inpoverty reduction and eco-nomic development.
The past economic boomovershadowed the urgencyfor infrastructure sector re-forms.
18
Achievements, Challenges,and Opportunities
Averting an Infrastructure Crisis: A Framework for Policy and Action
been insufficient, scattered, and uncoordinated. Hence, the overall benefits from thesereforms are limited with little generated momentum. The report calls for a large scale,well coordinated reform effort to overcome the current infrastructure challenges. Althoughthe authorities now recognize the importance of improving the sector, the true scale ofthe challenge may not be clear, especially at different levels of government. Hence, thesolutions are not discussed and deliberated at the appropriate levels. The issues are usuallystill dealt with a single sectoral view that produces short-term, uncoordinated solutionswith artificial boundaries.
A close examination reveals that there are many similar issues across the infrastructuresectors, therefore requiring cross sectoral solutions. Common issues that transcend individualinfrastructure sectors include a lack of credibility to mobilize private investments, poorpublic management, insufficient user charges, inadequate financing, difficultdecentralization challenges, and weak governance. The government now faces anopportunity to press forward with an organized effort to address these cross-cutting issueswhich will help a majority of the sectors to reap synergistic benefits. This report strives toidentify and analyze these cross-sector issues, and to present the policy maker withrecommendations to confront and solve them. The concluding chapter illustrates the wayforward by identifying the most pressing cross-sector reforms that are needed. In addition,the final chapter summarizes the key sector-specific improvements discussed in four separatereports that accompany this report, which are specifically focused on electric power, roadand road transportation, water and sanitation and telecom-munications.
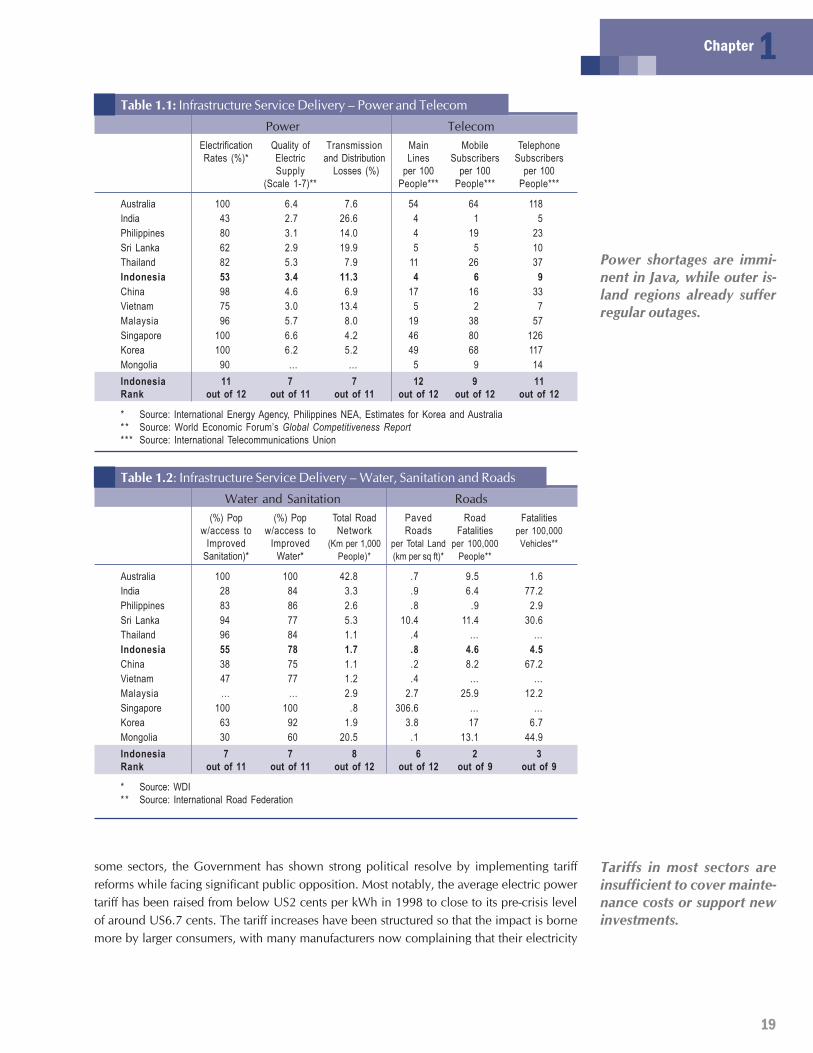
The Infrastructure ChallengeImproving Access and Quality of ServiceIndonesia faces major challenges in its infrastructure sectors as it seeks to consolidate andaccelerate its still fragile economic recovery, improve its international competitiveness,and increase access to basic public services. Symptoms of these challenges are found inevery infrastructure sector. Roads in and around major cities are heavily congested throughoutthe day, while many inter-urban and rural roads are in poor and deteriorating condition.Jakarta’s urban transport system is severely stressed, with poorly-maintained and highlyoverloaded buses jostling for scarce road space, while its sparse suburban railway systemis underutilized. The prospect of imminent power shortages hangs over Java while manyouter island regions are suffering regular outages. PLN has recently been adding newcustomers at rates exceeding 1 million per year but has so far managed to connect onlyslightly over half of all households, although many more have informal connections vianeighbors. Far fewer household have access to piped potable water, let alone to publicsewage systems. While the picture is brighter in the telecommunications sector, whichhas seen explosive growth in mobile phone use since the market opened, Indonesia’steledensity lags well behind that of its neighbors and low internet connectivity carrieswith it the threat of being left on the wrong side of the digital divide. Summary comparativeperformance indicators in the four sectors are presented in Table 1.1 and Table 1.2 below.
In seeking to address these challenges through mobilizing the required investment, theGovernment is forced to confront the sensitive issue of tariffs. Tariffs in many sectors havelong been well below the level needed to support new investment, and the Rupiah’s sharpdecline in value in 1997-98 and subsequent rise in inflation made the situation worse. In
There are common issuesfacing all infrastructure sec-tors that can be addressedthrough cross sectoral solu-tions.
Indonesia's infrastructureperformance lags behind theregion.
19
Chapter 1Table 1.1: Infrastructure Service Delivery – Power and Telecom
Power TelecomElectrification Quality of Transmission Main Mobile TelephoneRates (%)* Electric and Distribution Lines Subscribers Subscribers
Supply Losses (%) per 100 per 100 per 100(Scale 1-7)** People*** People*** People***
Australia 100 6.4 7.6 54 64 118India 43 2.7 26.6 4 1 5Philippines 80 3.1 14.0 4 19 23Sri Lanka 62 2.9 19.9 5 5 10Thailand 82 5.3 7.9 11 26 37Indonesia 53 3.4 11.3 4 6 9China 98 4.6 6.9 17 16 33Vietnam 75 3.0 13.4 5 2 7Malaysia 96 5.7 8.0 19 38 57Singapore 100 6.6 4.2 46 80 126Korea 100 6.2 5.2 49 68 117Mongolia 90 … … 5 9 14Indonesia 11 7 7 12 9 11Rank out of 12 out of 11 out of 11 out of 12 out of 12 out of 12
* Source: International Energy Agency, Philippines NEA, Estimates for Korea and Australia* * Source: World Economic Forum’s Global Competitiveness Report*** Source: International Telecommunications Union
Table 1.2: Infrastructure Service Delivery – Water, Sanitation and Roads
Water and Sanitation Roads(%) Pop (%) Pop Total Road Paved Road Fatalities
w/access to w/access to Network Roads Fatalities per 100,000Improved Improved (Km per 1,000 per Total Land per 100,000 Vehicles**
Sanitation)* Water* People)* (km per sq ft)* People**
Australia 100 100 42.8 .7 9.5 1.6India 28 84 3.3 .9 6.4 77.2Philippines 83 86 2.6 .8 .9 2.9Sri Lanka 94 77 5.3 10.4 11.4 30.6Thailand 96 84 1.1 .4 … …Indonesia 55 78 1.7 .8 4.6 4.5China 38 75 1.1 .2 8.2 67.2Vietnam 47 77 1.2 .4 … …Malaysia … … 2.9 2.7 25.9 12.2Singapore 100 100 .8 306.6 … …Korea 63 92 1.9 3.8 17 6.7Mongolia 30 60 20.5 .1 13.1 44.9Indonesia 7 7 8 6 2 3Rank out of 11 out of 11 out of 12 out of 12 out of 9 out of 9
* Source: WDI* * Source: International Road Federation
some sectors, the Government has shown strong political resolve by implementing tariffreforms while facing significant public opposition. Most notably, the average electric powertariff has been raised from below US2 cents per kWh in 1998 to close to its pre-crisis levelof around US6.7 cents. The tariff increases have been structured so that the impact is bornemore by larger consumers, with many manufacturers now complaining that their electricity
Power shortages are immi-nent in Java, while outer is-land regions already sufferregular outages.
Tariffs in most sectors areinsufficient to cover mainte-nance costs or support newinvestments.
20
Achievements, Challenges,and Opportunities
Averting an Infrastructure Crisis: A Framework for Policy and Action
rates are higher than elsewhere in the region (see Box 1.1 for business concerns regardinginfrastructure). The Government has also moved to assist the poor by simultaneouslyimplementing an output based subsidy scheme where PLN is compensated for providingpower to very small users at sub-commercial rates. But further tariff increases will likelybe necessary to finance the massive investments required to serve a projected doubling ofdemand by 2010, especially if PLN is unable to conclude new gas sales agreementsquickly and is forced to burn more oil. However, with elections scheduled for 2004, thefinal quarterly power tariff increase planned for 2003 has been cancelled. Concerns aboutpossible social unrest have previously led to the postponement or restriction of tariffincreases for other services, including water, phone, and rail transport. The poorest urbandwellers nonetheless pay much more per liter for their water than do those who are muchbetter off. For many cash-strapped operators, continuing low tariffs have necessitatedsubstantial cut-backs in maintenance and deferral of well justified new investments. Thisin turn is translating into poorer and sometimes less safe services for those who alreadyhave access and, of course, into longer waits for those who don’t.
Box 1.1: Infrastructure and the Business ClimateIndonesia’s business and investment climate is increasingly being perceived to be less competitive than itsASEAN neighbors since the boom-years before the 1997 economic crisis. The tenuous legal environment,uncertain political climate, lack of security, growing competition from China and Vietnam, concerns overtaxes, customs, and labor issues have all contributed to Indonesia’s decline as a premier business location.But among these issues, infrastructure remains on the mind and in the investment calculus of local and foreignbusinesses.
The Jakarta Japan Club (JJC) – whose membership includes almost 400 businesses working in Indonesia– identified the key issues that were “necessary to conduct business and increase foreign investment inIndonesia” through a survey of Japanese companies. Of the JJC’s ten priority areas – ranging from security(#1), taxes (#2) labor issues (#4), and human resources (#10) – two concerned infrastructure. Improving theEnergy Supply (#7) was a critical step, notably expanding and increasing supply, implementing distributionfacility development plans, and reliability. Improving Industrial Infrastructure (#8), specifically access roadsfrom production centers to harbors and airports, as well as correcting the expensive harbor fees (identified asthe most expensive and noncompetitive among ASEAN countries) was also a key priority. The JJC does notspeak for Indonesia’s diverse business community, but its concerns are in-line with those of local businesses.
A recent series of focus group discussions conducted by the World Bank (Oct 2003) with the private sectorthroughout East Java highlighted similar concerns. While policy issues such as licensing and labor wereidentified as the top business constraints, infrastructure was also a priority. Like the JJC survey, largeenterprises identified poor road maintenance, issues of access to industrial estates, insufficient power supply,and expensive but insufficient water supply as their main infrastructure problems. Small businesses identifiedthe impacts of road congestion on transporting goods, as well as the need for businesses to supply their owncaptive power to compensate for unreliable supply.
Source: JJC survey and WB Jakarta FGD survey results (draft)
But even with a firm resolve on tariffs and cost recovery, it will take time to accelerate theflow of new investment to needed levels. Public budgets are tightly constrained andGovernment has to strike a careful balance between fiscal prudence and expanded investment.And it must do this at a time when it is still striving to improve the implementation of arapidly planned and implemented decentralization program that has radically shiftedfunctional responsibilities and expenditure assignments. Restoring private investment ininfrastructure on a significant scale holds the promise of relieving the burden on publicfinancing. High priority needs to be given accordingly to measures for improving Indonesia’sstubbornly poor investment climate and, within this, to the difficult task of improving theattractiveness of infrastructure investment. But such efforts will not bear fruit overnight, in
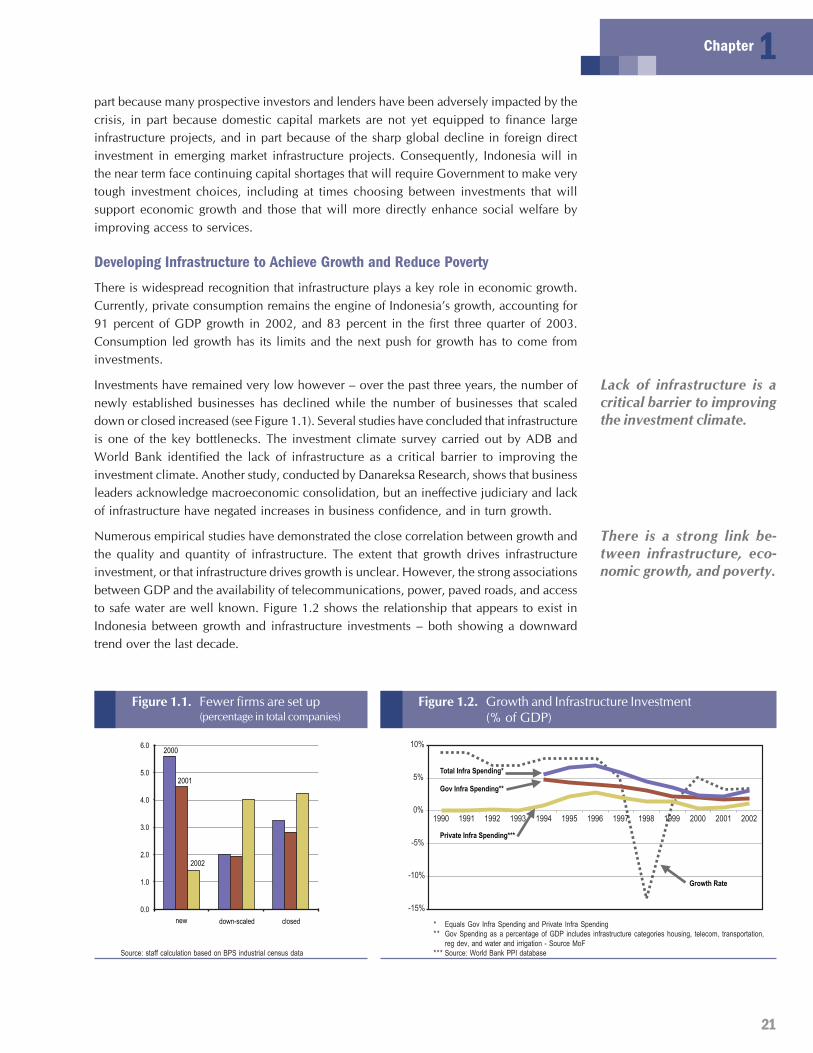
21
Chapter 1part because many prospective investors and lenders have been adversely impacted by thecrisis, in part because domestic capital markets are not yet equipped to finance largeinfrastructure projects, and in part because of the sharp global decline in foreign directinvestment in emerging market infrastructure projects. Consequently, Indonesia will inthe near term face continuing capital shortages that will require Government to make verytough investment choices, including at times choosing between investments that willsupport economic growth and those that will more directly enhance social welfare byimproving access to services.
Developing Infrastructure to Achieve Growth and Reduce PovertyThere is widespread recognition that infrastructure plays a key role in economic growth.Currently, private consumption remains the engine of Indonesia’s growth, accounting for91 percent of GDP growth in 2002, and 83 percent in the first three quarter of 2003.Consumption led growth has its limits and the next push for growth has to come frominvestments.
Investments have remained very low however – over the past three years, the number ofnewly established businesses has declined while the number of businesses that scaleddown or closed increased (see Figure 1.1). Several studies have concluded that infrastructureis one of the key bottlenecks. The investment climate survey carried out by ADB andWorld Bank identified the lack of infrastructure as a critical barrier to improving theinvestment climate. Another study, conducted by Danareksa Research, shows that businessleaders acknowledge macroeconomic consolidation, but an ineffective judiciary and lackof infrastructure have negated increases in business confidence, and in turn growth.
Numerous empirical studies have demonstrated the close correlation between growth andthe quality and quantity of infrastructure. The extent that growth drives infrastructureinvestment, or that infrastructure drives growth is unclear. However, the strong associationsbetween GDP and the availability of telecommunications, power, paved roads, and accessto safe water are well known. Figure 1.2 shows the relationship that appears to exist inIndonesia between growth and infrastructure investments – both showing a downwardtrend over the last decade.
Figure 1.2. Growth and Infrastructure Investment(% of GDP)
* Equals Gov Infra Spending and Private Infra Spending** Gov Spending as a percentage of GDP includes infrastructure categories housing, telecom, transportation,
reg dev, and water and irrigation - Source MoF*** Source: World Bank PPI database
-15%
-10%
-5%
0%
5%
10%
Growth Rate
Private Infra Spending***
Total Infra Spending*
Gov Infra Spending**
1990 1991 1992 1993 1994 1995 1996 1997 1998 1999 2000 2001 2002
Figure 1.1. Fewer firms are set up(percentage in total companies)
Source: staff calculation based on BPS industrial census data
0.0
1.0
2.0
3.0
4.0
5.0
6.0
new down-scaled closed
2000
2001
2002
Lack of infrastructure is acritical barrier to improvingthe investment climate.
There is a strong link be-tween infrastructure, eco-nomic growth, and poverty.
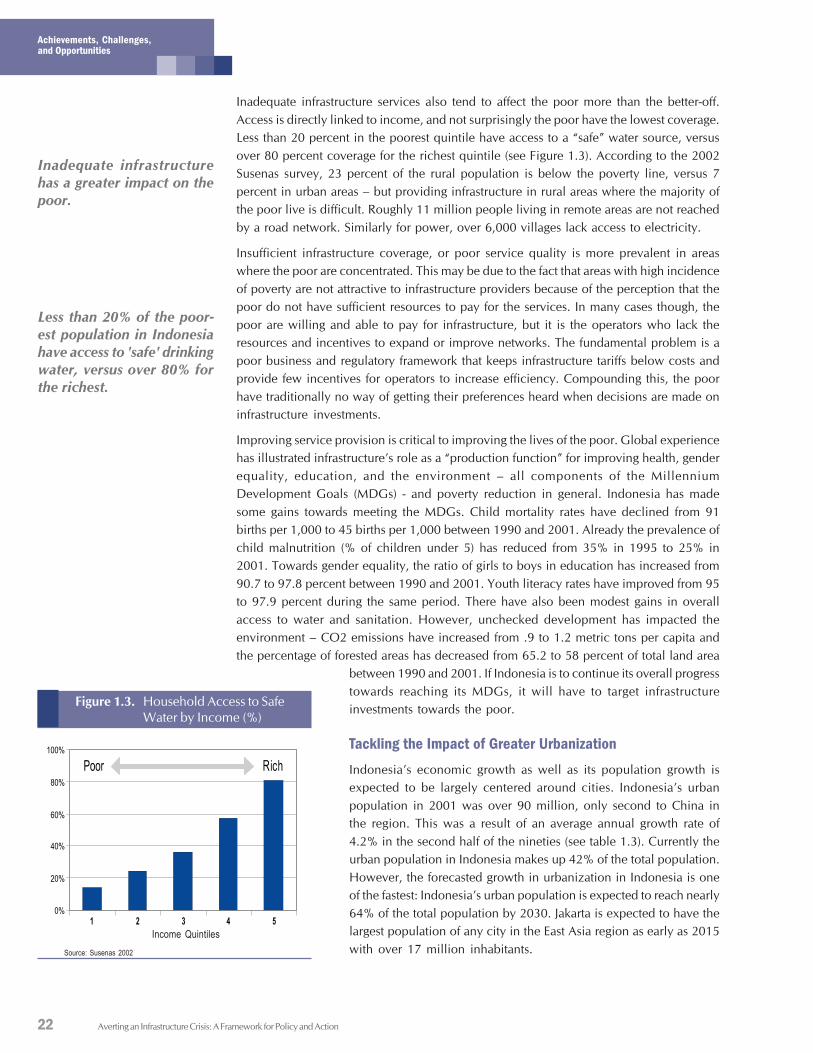
22
Achievements, Challenges,and Opportunities
Averting an Infrastructure Crisis: A Framework for Policy and Action
Inadequate infrastructure services also tend to affect the poor more than the better-off.Access is directly linked to income, and not surprisingly the poor have the lowest coverage.Less than 20 percent in the poorest quintile have access to a “safe” water source, versusover 80 percent coverage for the richest quintile (see Figure 1.3). According to the 2002Susenas survey, 23 percent of the rural population is below the poverty line, versus 7percent in urban areas – but providing infrastructure in rural areas where the majority ofthe poor live is difficult. Roughly 11 million people living in remote areas are not reachedby a road network. Similarly for power, over 6,000 villages lack access to electricity.
Insufficient infrastructure coverage, or poor service quality is more prevalent in areaswhere the poor are concentrated. This may be due to the fact that areas with high incidenceof poverty are not attractive to infrastructure providers because of the perception that thepoor do not have sufficient resources to pay for the services. In many cases though, thepoor are willing and able to pay for infrastructure, but it is the operators who lack theresources and incentives to expand or improve networks. The fundamental problem is apoor business and regulatory framework that keeps infrastructure tariffs below costs andprovide few incentives for operators to increase efficiency. Compounding this, the poorhave traditionally no way of getting their preferences heard when decisions are made oninfrastructure investments.
Improving service provision is critical to improving the lives of the poor. Global experiencehas illustrated infrastructure’s role as a “production function” for improving health, genderequality, education, and the environment – all components of the MillenniumDevelopment Goals (MDGs) - and poverty reduction in general. Indonesia has madesome gains towards meeting the MDGs. Child mortality rates have declined from 91births per 1,000 to 45 births per 1,000 between 1990 and 2001. Already the prevalence ofchild malnutrition (% of children under 5) has reduced from 35% in 1995 to 25% in2001. Towards gender equality, the ratio of girls to boys in education has increased from90.7 to 97.8 percent between 1990 and 2001. Youth literacy rates have improved from 95to 97.9 percent during the same period. There have also been modest gains in overallaccess to water and sanitation. However, unchecked development has impacted theenvironment – CO2 emissions have increased from .9 to 1.2 metric tons per capita andthe percentage of forested areas has decreased from 65.2 to 58 percent of total land area
between 1990 and 2001. If Indonesia is to continue its overall progresstowards reaching its MDGs, it will have to target infrastructureinvestments towards the poor.
Tackling the Impact of Greater UrbanizationIndonesia’s economic growth as well as its population growth isexpected to be largely centered around cities. Indonesia’s urbanpopulation in 2001 was over 90 million, only second to China inthe region. This was a result of an average annual growth rate of4.2% in the second half of the nineties (see table 1.3). Currently theurban population in Indonesia makes up 42% of the total population.However, the forecasted growth in urbanization in Indonesia is oneof the fastest: Indonesia’s urban population is expected to reach nearly64% of the total population by 2030. Jakarta is expected to have thelargest population of any city in the East Asia region as early as 2015with over 17 million inhabitants.
Figure 1.3. Household Access to SafeWater by Income (%)
Source: Susenas 2002
Inadequate infrastructurehas a greater impact on thepoor.
Less than 20% of the poor-est population in Indonesiahave access to 'safe' drinkingwater, versus over 80% forthe richest.
0%
20%
40%
60%
80%
100%
1 2 3 4 5
Income Quintiles
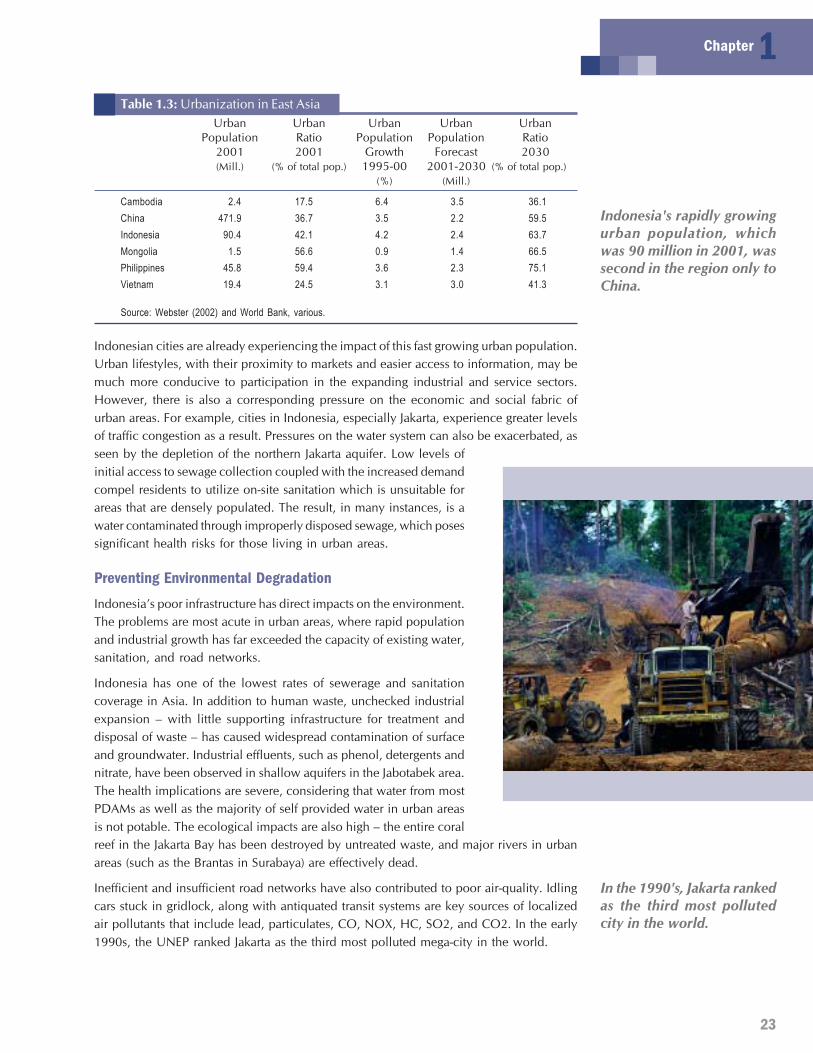
23
Chapter 1Table 1.3: Urbanization in East Asia
Urban Urban Urban Urban UrbanPopulation Ratio Population Population Ratio
2001 2001 Growth Forecast 2030(Mill.) (% of total pop.) 1995-00 2001-2030 (% of total pop.)
(%) (Mill.)
Cambodia 2.4 17.5 6.4 3.5 36.1China 471.9 36.7 3.5 2.2 59.5Indonesia 90.4 42.1 4.2 2.4 63.7Mongolia 1.5 56.6 0.9 1.4 66.5Philippines 45.8 59.4 3.6 2.3 75.1Vietnam 19.4 24.5 3.1 3.0 41.3
Source: Webster (2002) and World Bank, various.
Indonesian cities are already experiencing the impact of this fast growing urban population.Urban lifestyles, with their proximity to markets and easier access to information, may bemuch more conducive to participation in the expanding industrial and service sectors.However, there is also a corresponding pressure on the economic and social fabric ofurban areas. For example, cities in Indonesia, especially Jakarta, experience greater levelsof traffic congestion as a result. Pressures on the water system can also be exacerbated, asseen by the depletion of the northern Jakarta aquifer. Low levels ofinitial access to sewage collection coupled with the increased demandcompel residents to utilize on-site sanitation which is unsuitable forareas that are densely populated. The result, in many instances, is awater contaminated through improperly disposed sewage, which posessignificant health risks for those living in urban areas.
Preventing Environmental DegradationIndonesia’s poor infrastructure has direct impacts on the environment.The problems are most acute in urban areas, where rapid populationand industrial growth has far exceeded the capacity of existing water,sanitation, and road networks.
Indonesia has one of the lowest rates of sewerage and sanitationcoverage in Asia. In addition to human waste, unchecked industrialexpansion – with little supporting infrastructure for treatment anddisposal of waste – has caused widespread contamination of surfaceand groundwater. Industrial effluents, such as phenol, detergents andnitrate, have been observed in shallow aquifers in the Jabotabek area.The health implications are severe, considering that water from mostPDAMs as well as the majority of self provided water in urban areasis not potable. The ecological impacts are also high – the entire coralreef in the Jakarta Bay has been destroyed by untreated waste, and major rivers in urbanareas (such as the Brantas in Surabaya) are effectively dead.
Inefficient and insufficient road networks have also contributed to poor air-quality. Idlingcars stuck in gridlock, along with antiquated transit systems are key sources of localizedair pollutants that include lead, particulates, CO, NOX, HC, SO2, and CO2. In the early1990s, the UNEP ranked Jakarta as the third most polluted mega-city in the world.
Indonesia's rapidly growingurban population, whichwas 90 million in 2001, wassecond in the region only toChina.
In the 1990's, Jakarta rankedas the third most pollutedcity in the world.
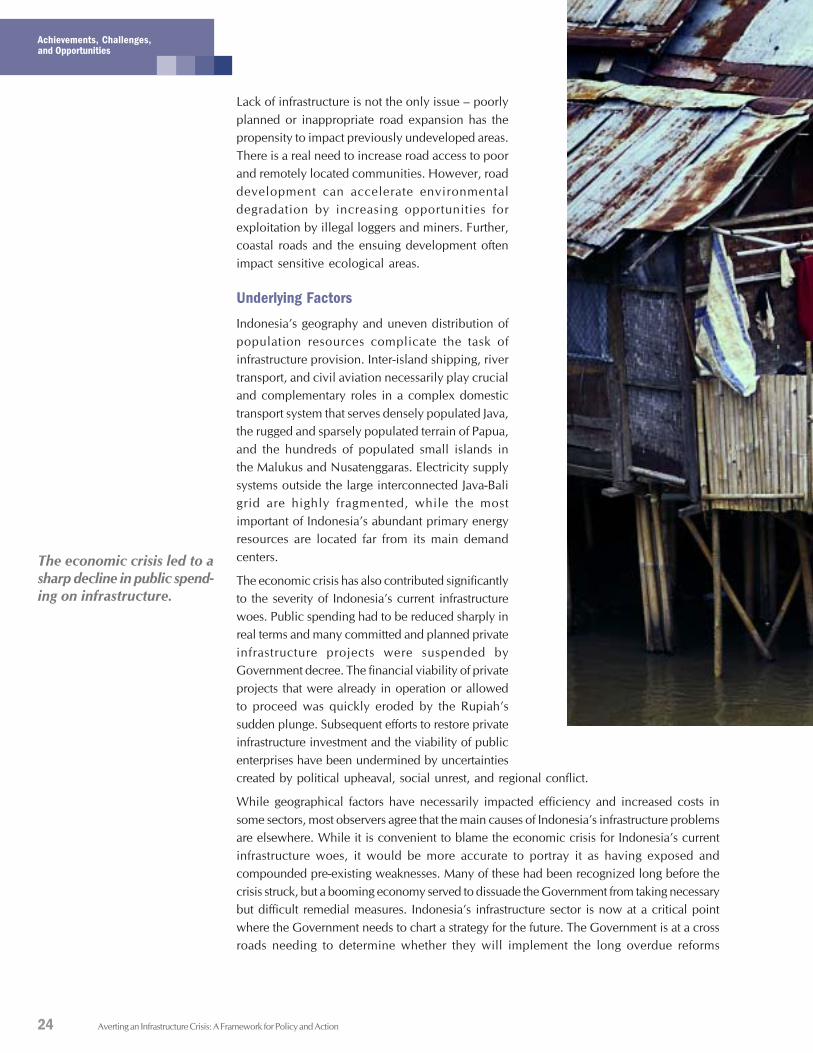
24
Achievements, Challenges,and Opportunities
Averting an Infrastructure Crisis: A Framework for Policy and Action
Lack of infrastructure is not the only issue – poorlyplanned or inappropriate road expansion has thepropensity to impact previously undeveloped areas.There is a real need to increase road access to poorand remotely located communities. However, roaddevelopment can accelerate environmentaldegradation by increasing opportunities forexploitation by illegal loggers and miners. Further,coastal roads and the ensuing development oftenimpact sensitive ecological areas.
Underlying FactorsIndonesia’s geography and uneven distribution ofpopulation resources complicate the task ofinfrastructure provision. Inter-island shipping, rivertransport, and civil aviation necessarily play crucialand complementary roles in a complex domestictransport system that serves densely populated Java,the rugged and sparsely populated terrain of Papua,and the hundreds of populated small islands inthe Malukus and Nusatenggaras. Electricity supplysystems outside the large interconnected Java-Baligrid are highly fragmented, while the mostimportant of Indonesia’s abundant primary energyresources are located far from its main demandcenters.
The economic crisis has also contributed significantlyto the severity of Indonesia’s current infrastructurewoes. Public spending had to be reduced sharply inreal terms and many committed and planned privateinfrastructure projects were suspended byGovernment decree. The financial viability of privateprojects that were already in operation or allowedto proceed was quickly eroded by the Rupiah’ssudden plunge. Subsequent efforts to restore privateinfrastructure investment and the viability of publicenterprises have been undermined by uncertaintiescreated by political upheaval, social unrest, and regional conflict.
While geographical factors have necessarily impacted efficiency and increased costs insome sectors, most observers agree that the main causes of Indonesia’s infrastructure problemsare elsewhere. While it is convenient to blame the economic crisis for Indonesia’s currentinfrastructure woes, it would be more accurate to portray it as having exposed andcompounded pre-existing weaknesses. Many of these had been recognized long before thecrisis struck, but a booming economy served to dissuade the Government from taking necessarybut difficult remedial measures. Indonesia’s infrastructure sector is now at a critical pointwhere the Government needs to chart a strategy for the future. The Government is at a crossroads needing to determine whether they will implement the long overdue reforms
The economic crisis led to asharp decline in public spend-ing on infrastructure.
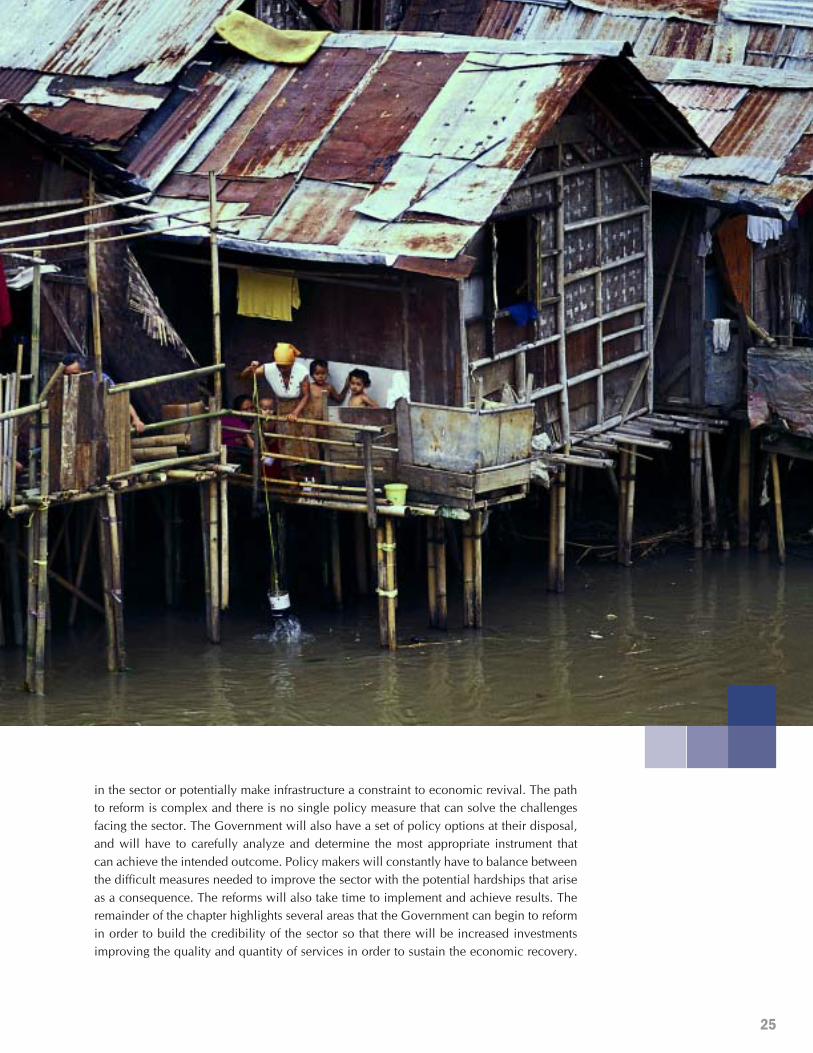
25
Chapter 1
in the sector or potentially make infrastructure a constraint to economic revival. The pathto reform is complex and there is no single policy measure that can solve the challengesfacing the sector. The Government will also have a set of policy options at their disposal,and will have to carefully analyze and determine the most appropriate instrument thatcan achieve the intended outcome. Policy makers will constantly have to balance betweenthe difficult measures needed to improve the sector with the potential hardships that ariseas a consequence. The reforms will also take time to implement and achieve results. Theremainder of the chapter highlights several areas that the Government can begin to reformin order to build the credibility of the sector so that there will be increased investmentsimproving the quality and quantity of services in order to sustain the economic recovery.
26
Achievements, Challenges,and Opportunities
Averting an Infrastructure Crisis: A Framework for Policy and Action
Public Management of InfrastructureThe quality of public management differs markedly across the sectors. PLN is a technicallycompetent and reasonably sophisticated corporation whose reports have long been auditedby international firms. Its main weaknesses are in the areas of finance and treasurymanagement, where it is already striving to make needed improvements. It has been ableto manage quite successfully rapid system expansion across Indonesia’s diverse regions,connecting over 1 million new customers a year during the 1990s. As with any largepublic monopoly there is scope for improving efficiency, but PLN is nonetheless a wellmanaged public utility. The road and water sectors are composed of a large number ofagencies whose technical capacities and governance regimes are far weaker than PLNs. Intelecommunications, the private sector plays the larger role, where one SOE (Indosat) isnow majority privatized, and the other (Telkom) is listed on the NYSE and LSE (althoughhaving problems with the former), and where technological convergence is deepeningcompetition.
Decentralization has added a new dimension by assigning sector government functions toregions that previously had no role in these sectors. While the regions have long hadpublic works units to plan and implement road programs, they do not yet have units tohandle newly assigned functions, for example, for power (some licensing and planningresponsibilities) and for small ports and airports. While the PDAMs are corporations, itwould not be appropriate –in terms of managerial capacity or performance—to groupmany of them with PLN, PGN or Telkom. In the case of the regional public works units,large expenses have been incurred to build capacity, but this is not reflected in the qualityof planning or implementation of works due to poor incentive and widespread corruption.
Decentralization has alteredthe roles of infrastructureprovision across all levels ofgovernment.
27
Chapter 1The counterpart Law on Fiscal Decentralization (Law 25/1999) seeks to ensure regionalgovernments will have the financial resources that are necessary to implement theirexpanded roles. Aggregate local revenue generation capacity of regional governments isrelatively small, however, with around 90 percent of regional government spending financedthrough central government transfers. Most regions are searching for new revenue sources,with some imposing taxes and levies that are inconsistent with prevailing laws andregulations.1 But with large regional disparities and an equalizing block grant mechanism(DAU) that is not yet functioning as intended, many regions have limited funds availablefor infrastructure provision after meeting their wage bills. A conditional special purposecapital grants program (DAK), which is partially intended to finance small infrastructureinvestments, is being implemented for the first time in 2003 and offers a potentiallyimportant means of using central government resources to improve expenditure prioritizationand governance at the local level. However, the amount of funding now being transferredthrough the DAK is small relative to the total amount conveyed through the DAU andother revenue sharing arrangements from such sources as the exploitation of natural resourcesand property taxes. In the meantime, Government is still working to operationalizeprocedures for on-lending and on-granting of foreign loans that were introduced by Ministerof Finance Decree KMK.35 in January 2003. These procedures are complex and delayswith their implementation could impede the timely flow of donor resources to the regionsfor infrastructure and other programs.
In this environment, integration of planning and coordination of implementation posesformidable challenges. These are most evident in sectors where responsibilities are dividedboth horizontally and vertically, as with roads. During the Soeharto era, Bappenas playeda key role in inter-agency coordination as well as in national development planning.Today, the picture is less clear. Bappenas still has responsibility for national developmentplanning while the Coordinating Minister for Economic Affairs is responsible forcoordinating overall implementation of the economic program. In addition, several Minister-level committees have been established to coordinate activities in specific areas. Theseinclude the Committee on Policy for the Acceleration of Infrastructure Development(KKPPI), sector-specific committees on power and telecommunications, and a cross-sectorcommittee on rural infrastructure development. This already complicated situation is setto change further, with the recently enacted State Finance Law having defined away keyplanning roles of Bappenas and with a proposed law on national development planningnow under discussion.
Business Environment for InfrastructureThe institutional and regulatory environment pertaining specifically to infrastructure isnot conducive to efficient service provision by private operators. Deep-rooted institutionaland regulatory problems can be traced to the 1945 Constitution, which requires productiveactivities that impact the lives of the public to be controlled by the State. This was longinterpreted to mean that infrastructure services must be provided exclusively by the publicsector. Laws gave wide-ranging monopoly powers to State-owned enterprises (SOEs) andconsequently made little provision for economic regulation. Authority to set tariffs wastypically vested with the President and entirely discretionary, while sector departmentscommonly combined the roles of policy-maker, regulator and shareholder representative.In the absence of any form of competition, many enterprises became – not surprisingly –inefficient, unresponsive, corrupt, and heavily dependent on government for their financing.
Local government spendingon infrastructure increasedfollowing decentralization,and is now equivalent to cen-tral government levels.
Private infrastructure inves-tors find the current businessenvironment too risky.
28
Achievements, Challenges,and Opportunities
Averting an Infrastructure Crisis: A Framework for Policy and Action
And Government in turn appeared to be more concerned about protecting these enterprisesthan the public they serve.
This regulatory and institutional framework was ill-suited to accommodate for the entryof the private sector when the need was first recognized in the mid-1980s. Adjustmentswere made, but typically in a manner that assigned government functions to SOEs andprovided very limited modalities for private investment. Partial privatization proceededin the telecommunications sector, but Government was reluctant to relinquish control.For the most part private investors cooperated with incumbent public enterprises throughconcessions, BOT, BOO, and other contractual arrangements. The governance frameworkwas weak, facilitating the flood of unsolicited and often ill-conceived project proposalsinvolving politically connected local partners that characterized the latter years of theSoeharto era. During the mid-1990s, unsolicited projects shaped sector planning andprogramming rather than vice-versa, with many contracts embodying risk allocations thatcreated large contingent liabilities for the public sector. The subsequent dramatic failureand consequent large public costs of such projects has led many elements of civil societyto demand a return to the original interpretation of the Constitution.
Government is now seeking to restore private investment in infrastructure, but the responsethus far has been fairly muted except in the telecommunications sector. Pre-crisis concernsrelating to the regulatory framework and absence of a functioning eminent domainmechanism for land acquisition remain. Confidence in the sector has further eroded afterthe crisis due to renegotiation of IPP contracts, persistent disputes with water concessionsand contracts, and the failure of local courts to execute an international arbitration award.In the present climate, investors are also reluctant to participate in infrastructure provisionbecause of the poor credit-worthiness of SOE off-takers coupled with Government’sunderstandable reluctance to provide guarantees. International investors, lenders andinsurers, in particular, are less interested in infrastructure projects in emerging marketsthan they were during the mid-1990s. The bursting of the 3-G telecom’s bubble, coupledwith the collapse of Enron and the sharp decline in the share values of other leadinginfrastructure companies, has led many overseas firms to refocus on consolidating in theirhome markets and divesting overseas portfolios. Indonesia, with its stubbornly high countryrisk rating, is currently attracting very little foreign direct investment, even in sectors thatoffer rapid payback, let alone in infrastructure. At the same time, high domestic interestrates coupled with difficulties in mobilizing long-term finance pose problems for prospectivelocal infrastructure investors.
CorruptionIndonesia still has to tackle corruption, collusion, and nepotism effectively. According tothe latest Corruption Perception Index published by Transparency International (TI),Indonesia ranks 122nd out of 133 countries. With a rating of 1.9 out of 10, Indonesia hasthe lowest score in East Asia except for Myanmar. While post-Soeharto governments haveaccorded high priority to eradicating corruption, their efforts appear to have beenunsuccessful: in 2001 Transparency International assigned an identical score of 1.9 toIndonesia. In fact, while there is a perception among households that the overall level ofcorruption has remained more or less the same over the past few years, the view inbusiness circles tends to be that corruption is becoming more diffuse and “less effective”at delivering the intended outcomes following the recent moves toward decentralization.
Indonesia ranks at the bot-tom of the Transparency In-ternational's Corruption Per-ception Index.
29
Chapter 1In an environment where corruption is rife, infrastructure sectors are typically affectedvery heavily. Opportunities for extracting rents are abundant at all stages of infrastructureprojects, from project identification and negotiation through to implementation andoperation. The costs to the economy are very high and unsustainable: Government andstate enterprises together are currently procuring about $7 billion total per year withinfrastructure accounting for a major share and there are indications that up to 30 percentof the amount may be stolen through corrupt practices.
Financing ChallengePLN has estimated a need for annual power sector investments of US$2-3 billion duringthe period up to 2010 to meet what would, relative to past trends, be modest growth indemand. The capital costs of providing new phone lines continues to fall, but raisingteledensity is still expected to cost more than US$300 million per point. The road sectorcould easily absorb US$ 700-750 million per year for maintenance, betterment andexpansion of the classified public network, with additional funding needed to developtoll roads in densely trafficked corridors. Massive investments will also be needed in thewater and sanitation sector if Indonesia is to reach its Millennium Development Goals,with US$ 600 million per year being considered a conservative estimate. Overall investmentsneed are in fact likely to be higher, because the above estimates do not fully take intoaccount factors such as the rapid rate of urbanization in Indonesia.
Effectively tackling the issues mentioned previously willprogressively help to bridge the financing gap. Lower corruptionlevels, clearer allocation of responsibilities, and an improvedinstitutional and regulatory framework for infrastructure combinedwith improved public management practices would reduce the costsof infrastructure service provision and would go some way towardproviding private investors with the confidence that they need toconsider re-investing in Indonesia’s infrastructure. As mentionedpreviously, these reforms will take time, and therefore, measuresneed to be implemented to mobilize funding the for sector in theshort-term. Furthermore, structural reforms in the sector are not asubstitute for a well designed long-term finance strategy. In thenear-term the Government can resort to increased spending in theinfrastructure sector and upgrading key features of the financialmarkets. In the long-run, however, the sector will have to rely onmobilizing domestic capital, especially savings, towards the sectorin addition to attracting back foreign investors. As long as theGovernment is financing the infrastructure sector, it would be usefulto achieve poverty related objectives by channeling resources in amanner that ensures affordable access to the poor.
Massive investments are re-quired across infrastructuresectors. The energy sectoralone requires US$ 2-3 bil-lion annually.
Averting an Infrastructure Crisis: A Framework for Policy and Action30
Improving Public Managementof Infrastructurec
ha
pte
r2
31
The majority of Indonesia’s infrastructure continues to be developedand managed by the public sector, although private sector participationhas increased in recent years. The manner in which infrastructure ismaintained and operated, however, varies among sectors. Over the pasttwo decades, three major transformations have been taking place whichhave diminished the roles of the central sector ministries and departmentsbut also greatly increased their complexity and the need for effective inter-agency coordination.
Indonesia has moved to commercialize, corporatize and – in someinstances – privatize the delivery and management of public infrastructurebeginning in the early 1980s. Some forms of infrastructure that werepreviously provided directly by sector departments or departmentalagencies (Perjans) were transformed into state-owned corporations (Perums)while more recently many Perums have been transformed into profit-oriented limited liability state-owned companies (Perseros).2 National andregional monopolies are being unbundled in some instances, as a part ofa wider SOE reform and privatization program. The reforms have includedthe creation of subsidiaries (e.g. PLN and Pelindos II and III) and the saleof stakes in parent or subsidiary enterprises (e.g. Telkom and Indosat, andcontainer terminal subsidiaries at Jakarta and Surabaya ports).
Most of the infrastructureservices will remain in thehands of the public sector inthe near future.
32
Improving Public Managementof Infrastructure
Averting an Infrastructure Crisis: A Framework for Policy and Action
The Government has moved to complement reforms by separating responsibilities forsector policy formulation, regulation, and SOE ownership. In 1997, a Ministry of StateEnterprises (MOSE) was established to take over the ownership of SOEs or shareholderfunctions that had previously been handled by sector ministries on behalf of the MOF.Although the process was interrupted when MOSE was abolished and then re-established,progress has been made in improving corporate governance as well as their corporatecultures. More recently, the enactment of Law 22 on Oil and Natural Gas in 2001 hasenabled the Government to establish non-ministerial bodies to assume the regulatoryfunctions previously handled by Directorate Generals for the sectors. Three such agenciescurrently exist, namely the downstream oil and gas regulatory agency, the electricitymarket supervisory agency, and the telecommunications regulatory agency. None of theentities are adequately staffed and fully functional, however. Furthermore, there is a lackof clarity between the responsibility and authority of the regulatory agencies and thevarious General Directorates.
Indonesia has decentralized many of the functions and responsibilities related toinfrastructure provision that were previously handled by central sector departments. Whilelimited transfer of responsibilities was made during the 1990s in areas such as road andtraffic transport, Indonesia began to implement a large scale ‘big bang’ decentralizationeffort in January 2001 with the application of its laws on regional autonomy.3 The actualmagnitude of the changes has varied considerably between sectors. In the case oftelecommunications, the scope of decentralized authority is very limited while sectorssuch as power, ports, and airports have devolved considerable responsibilities to theregions. In other sectors such as roads, regional governments already had considerableauthority, and long established agencies (Dinas) have adequate capacity to assume additionalobligations.
This chapter assesses briefly how these major changes have impacted the developmentand performance of the infrastructure sectors, and considers how the Government mayconsolidate and build upon recent achievements. It also explores the changing role ofBappenas and its implications for coordinating policy and strategic planning.
Commercializing, Corporatizing and PrivatizationMost of Indonesia’s main infrastructure services are no longer provided and manageddirectly by central or regional government departments or agencies.4 The most significantsectors are now corporatized and managed by Persero enterprises. They include5:
• PT PLN (power)• PT PGN (gas transmission and distribution)• PT Telkom and PT Indosat (basic telecoms)• PT Angkasa Pura I and II (the major airports)• PT Pelindo I-IV (the major seaports)• PT KA (railway services)• PT ASDP (ferry terminals and services)• PT Jasa Marga (toll roads).
Many of these Perseros transformed from Perums during the mid 1990s, and a keyprecondition was to be operationally profitable. Perseros have greater managerial autonomy,but must also conform to tougher financial management requirements. They are also ableto better compete with the private sector for qualified workers since they can now offermarket-based compensation.
33
Chapter 2As Perseros, the performance of these enterprises and the responsiveness to customersappear to have improved significantly.6 The improvements are most evident in enterprisesthat have been partly privatized or permitted to access the domestic capital market, inpart because of the more stringent audit and disclosure requirements of the stock exchange.7
Telkom, Indosat, PLN, PGN and Jasa Marga are all traded in the stock market. Althoughthey fall short of being world class, these Perseros have enhanced their performance andhave a steadily improving record of corporate governance. In contrast, the enterprises inthe transport sector lag in performance, due to their low regulated tariffs or poor pastinvestments as well as the limited pressure they have faced to implement reforms. Forexample, the organizational structure of PT KA – which was initially a Perjan but latertransformed to a Perjan and then to a Persero during the 1990s – has changed very littlesince the era of the steam locomotive.8 In the absence of clearly defined profit centers orbusiness units, the company has continued to maintain railway lines and to operateservices that are commercially unviable.
During the 1980s and early 1990s, sector departments often viewed SOEs under theirjurisdiction as sources for supplementing their budgets and for providing jobs for seniorstaff. SOEs were commonly expected to finance activities such as the overseas travel ofministers and their staffs, conferences and workshops, and office equipment. Boards ofCommissioners were frequently filled by senior officials from sector departments, whileless senior officials were regularly appointed to full-time director level positions. Therefore,it would be common, for example, for the Director General for Electricity to be Chairmanof the Board of Commissioners for PLN or for the DG of Land Transport to hold theequivalent position in PT KA. These practices are being gradually phased out by MOSE,which is seeking to make companies fully accountable for their financial performanceand to make Boards of Commissioners more professionally competent and independent.Privatization has reinforced this effort, as many private shareholders require that businessprofessionals be appointed to Boards of Commissioners and to key director level positions(particularly finance). Progress made thus far is encouraging, although a significant furthereffort is still needed in this regard.
The situation is different in the water and sanitation sector, since these services are providedby regional utilities. The public road network is also administered at the state level and itconstitutes one of the State’s largest physical investments. The sector, however, is notmanaged on a commercial basis. There has been very little progress in making road userspay for the costs they impose, or towards earmarking proceeds to provide a stream ofoperational revenue, despite many years of discussions regarding these issues. Instead,heavy commercial vehicles that are more prone to damage roads receive implicit financialsupport for their road use in the form of subsidized fuel or relatively low vehicle taxes.Responsibilities for asset management in the sector are divided among central, provincial,kabupaten and kota governments. While Indonesia has developed an impressive set ofroad asset management tools for the different parts of the network, it is apparent thatthese are not being utilized effectively and that allocation of funds across networks,regions and works programs is consequently sub-optimal.9 Since governance in the sectoris weak, there is evidence of poor quality of works and pervasive collusion in contractawards.. In recent years, Government has begun to explore the possibility of establishinga system of road funds and road boards as a means of commercializing the managementof road assets and also to increase stakeholder involvement. While this effort is promising,strong leadership and very effective coordination of the large number of agencies andinvolved stakeholders will be needed to move forward.
The performance andresponsiveness of Perseroenterprises have improvedsignificantly.
34
Improving Public Managementof Infrastructure
Averting an Infrastructure Crisis: A Framework for Policy and Action
Making Decentralization WorkPrior to granting more autonomy to the regions in January 2001, Indonesia was a multi-tiered but highly centralized state. Around 90 percent of total government revenues accruedto the central government, while its agencies and deconcentrated regional offices (Kanwils)were responsible for over 80 percent of the public expenditure. Powers were heavilyconcentrated in central ministries and agencies, who had little accountability to localcommunities. Local consumers also had a limited ability to influence central authoritydecisions regarding public service provision. As a result, there were increasing calls forrevenue sharing between the central, regional, and local governments for some time. In1999, Laws on Regional Governance and on Fiscal Balance between Central and RegionalGovernments were drafted and enacted in little over one year, and important supportingregulations were rapidly implemented during the following eighteen months to stay onschedule. Predictions that the extremely ambitious agenda and timetable will result incatastrophic breakdown in service delivery proved unfounded, and overall, theimplementation proceeded smoothly. Nevertheless, numerous problems have arisen, andvarious aspects of the decentralization process require further rethinking and refinement.10
Law 22 provides for autonomous regions to be responsible for government functions in allsectors except for foreign affairs, defense and security, justice, monetary and fiscal affairs,and religion. The central government, however, retained the responsibility for macropolicy on planning and control of national development and a number of other areas.11 Itfurther confers responsibility for eleven ‘sectors’ including public works (which encompassesroads) and communications (which if defined by the span of control of MOC encompassesair, land and sea transport, and telecommunications), to the kabupatens and kotas.
The ‘Big Bang’ decentraliza-tion gave regions the respon-sibilities for all sectors ex-cept foreign affairs, defenseand security, justice, mon-etary and fiscal affairs, andreligion.
Prior to granting more au-tonomy to the regions, about90 percent of governmentrevenues accrued at the cen-tral level.
35
Chapter 2Notable in Law 22 is the very limited powers accorded to provinces vis-ŕ-vis the kabupatensand kotas. Provinces are given a dual role of being deconcentrated representatives of thecenter as well as being autonomous regions in their own right. However, their roles asautonomous regions are comparatively narrow and weak, and are limited mainly to functionsand responsibilities that span the boundaries of the kabupatens and kotas in their territories.There are compelling arguments for strengthening their responsibilities in some areas, andin particular for empowering provinces to play a more pro-active role in promoting andfacilitating inter-kabupaten /kota cooperation in fields such as urban transportation andsolid waste management. Providing the provinces greater decision-making authorityregarding the transfer of funds is a method that can broaden their influence on localgovernments.
Government Regulation 25 of 2000 (PP25/2000) elaborates the provisions of Law 22 bydefining the functions that are assigned to the center and to the provinces, with all otherfunctions being deemed to belong to the kabupatens and kotas. The specificity and clarityregarding how functions are devolved to different levels of government varies amongsectors. In the case of telecommunications, the center’s functions are defined simply asregulation of the national telecommunications system. By contrast, the equivalent functionin the transport sector is specified as setting standards, issuing licenses, setting tariffs, etc.The assignments specified in PP25/2000 are also not entirely consistent with the provisionsof Law 22, and in many instances differ considerably from the assignments stipulated inthe respective sector laws. In several instances, this ambiguity is exacerbated by the differentterminologies employed for regional and sector regulations. In moving forward, it isimportant that the Government further clarify the functions that would better serve thepopulation when provided through a decentralized mechanism, and ensure that theseresponsibilities are transferred to the appropriate decentralized level. The degree ofdecentralization or the level of government with responsibility for a particular infrastructureservice would need to be determined by the specific characteristics in the sector such asthe economies of scale and exclusivity of markets.
The potential impact of decentralization varies among infrastructure sectors. In the case oftelecoms, primary authority continues to reside in the center, although the succinct mannerin which PP 25/2000 defines its role could be interpreted to leave kabupatens and kotaswith some scope for entry. There has been comparatively little change in the allocation offunctions for public water supply and sanitation inasmuch as the kabupatens and kotashave long had significant responsibilities in this area.12 While decentralized authoritieshave likewise long played a significant role in the provision and maintenance of roadinfrastructure and in the management of road traffic and transport, their powers and obligationshave been considerably expanded by Law 22 with kabupatens and kotas now having authorityto decide spending priorities for their respective networks.13 The regions, and in particularthe kabupatens and kotas, have also been assigned important new responsibilities in thepower sector, while they have been granted authority for small ports and airports for thefirst time. With the exception of the power sector, these changes are yet to be reflected innew or amended sector laws.14 In several instances, such as for small ports and airports,central departments have expressed concern about the lack of local capacity to assumenewly decentralized responsibilities and the required transfers of authority have stalled as aresult. It is important to ensure technical support for local governments so that they are ableto provide services commensurate with their new responsibilities. As a result, nationalassistance may be necessary to assist local entities to develop their capacity. Various
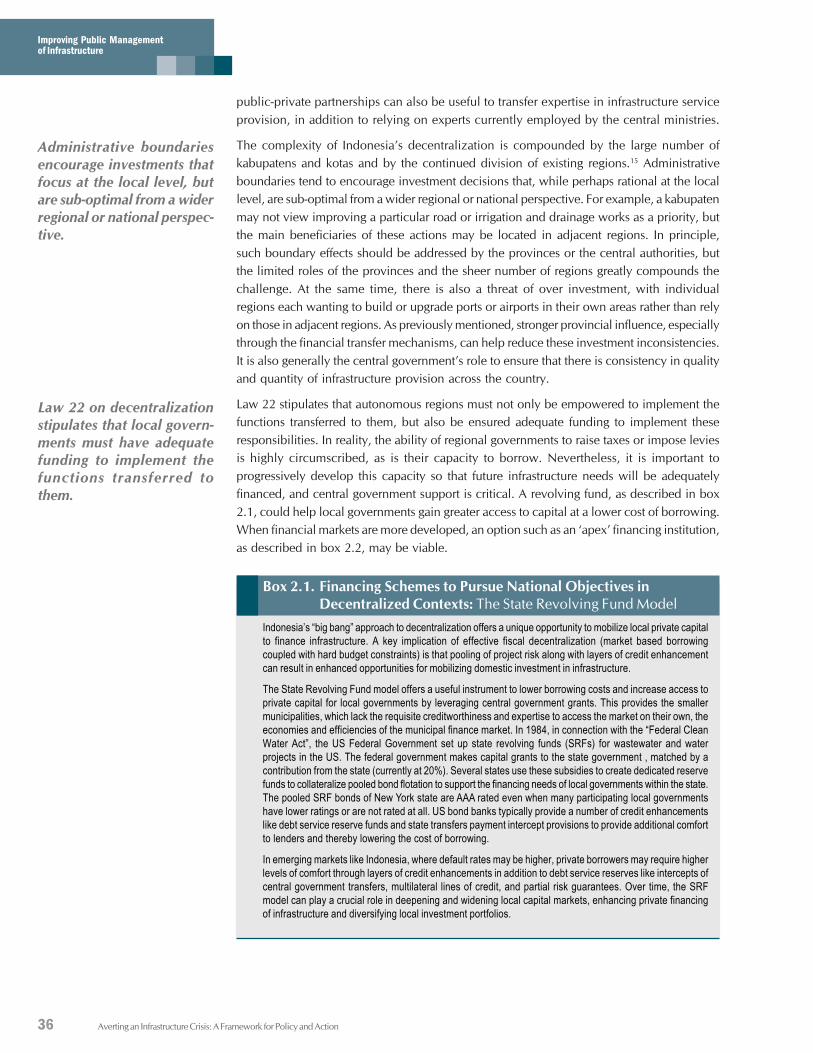
36
Improving Public Managementof Infrastructure
Averting an Infrastructure Crisis: A Framework for Policy and Action
public-private partnerships can also be useful to transfer expertise in infrastructure serviceprovision, in addition to relying on experts currently employed by the central ministries.
The complexity of Indonesia’s decentralization is compounded by the large number ofkabupatens and kotas and by the continued division of existing regions.15 Administrativeboundaries tend to encourage investment decisions that, while perhaps rational at the locallevel, are sub-optimal from a wider regional or national perspective. For example, a kabupatenmay not view improving a particular road or irrigation and drainage works as a priority, butthe main beneficiaries of these actions may be located in adjacent regions. In principle,such boundary effects should be addressed by the provinces or the central authorities, butthe limited roles of the provinces and the sheer number of regions greatly compounds thechallenge. At the same time, there is also a threat of over investment, with individualregions each wanting to build or upgrade ports or airports in their own areas rather than relyon those in adjacent regions. As previously mentioned, stronger provincial influence, especiallythrough the financial transfer mechanisms, can help reduce these investment inconsistencies.It is also generally the central government’s role to ensure that there is consistency in qualityand quantity of infrastructure provision across the country.
Law 22 stipulates that autonomous regions must not only be empowered to implement thefunctions transferred to them, but also be ensured adequate funding to implement theseresponsibilities. In reality, the ability of regional governments to raise taxes or impose leviesis highly circumscribed, as is their capacity to borrow. Nevertheless, it is important toprogressively develop this capacity so that future infrastructure needs will be adequatelyfinanced, and central government support is critical. A revolving fund, as described in box2.1, could help local governments gain greater access to capital at a lower cost of borrowing.When financial markets are more developed, an option such as an ‘apex’ financing institution,as described in box 2.2, may be viable.
Box 2.1. Financing Schemes to Pursue National Objectives inDecentralized Contexts: The State Revolving Fund Model
Indonesia’s “big bang” approach to decentralization offers a unique opportunity to mobilize local private capitalto finance infrastructure. A key implication of effective fiscal decentralization (market based borrowingcoupled with hard budget constraints) is that pooling of project risk along with layers of credit enhancementcan result in enhanced opportunities for mobilizing domestic investment in infrastructure.
The State Revolving Fund model offers a useful instrument to lower borrowing costs and increase access toprivate capital for local governments by leveraging central government grants. This provides the smallermunicipalities, which lack the requisite creditworthiness and expertise to access the market on their own, theeconomies and efficiencies of the municipal finance market. In 1984, in connection with the “Federal CleanWater Act”, the US Federal Government set up state revolving funds (SRFs) for wastewater and waterprojects in the US. The federal government makes capital grants to the state government , matched by acontribution from the state (currently at 20%). Several states use these subsidies to create dedicated reservefunds to collateralize pooled bond flotation to support the financing needs of local governments within the state.The pooled SRF bonds of New York state are AAA rated even when many participating local governmentshave lower ratings or are not rated at all. US bond banks typically provide a number of credit enhancementslike debt service reserve funds and state transfers payment intercept provisions to provide additional comfortto lenders and thereby lowering the cost of borrowing.
In emerging markets like Indonesia, where default rates may be higher, private borrowers may require higherlevels of comfort through layers of credit enhancements in addition to debt service reserves like intercepts ofcentral government transfers, multilateral lines of credit, and partial risk guarantees. Over time, the SRFmodel can play a crucial role in deepening and widening local capital markets, enhancing private financingof infrastructure and diversifying local investment portfolios.
Administrative boundariesencourage investments thatfocus at the local level, butare sub-optimal from a widerregional or national perspec-tive.
Law 22 on decentralizationstipulates that local govern-ments must have adequatefunding to implement thefunctions transferred tothem.
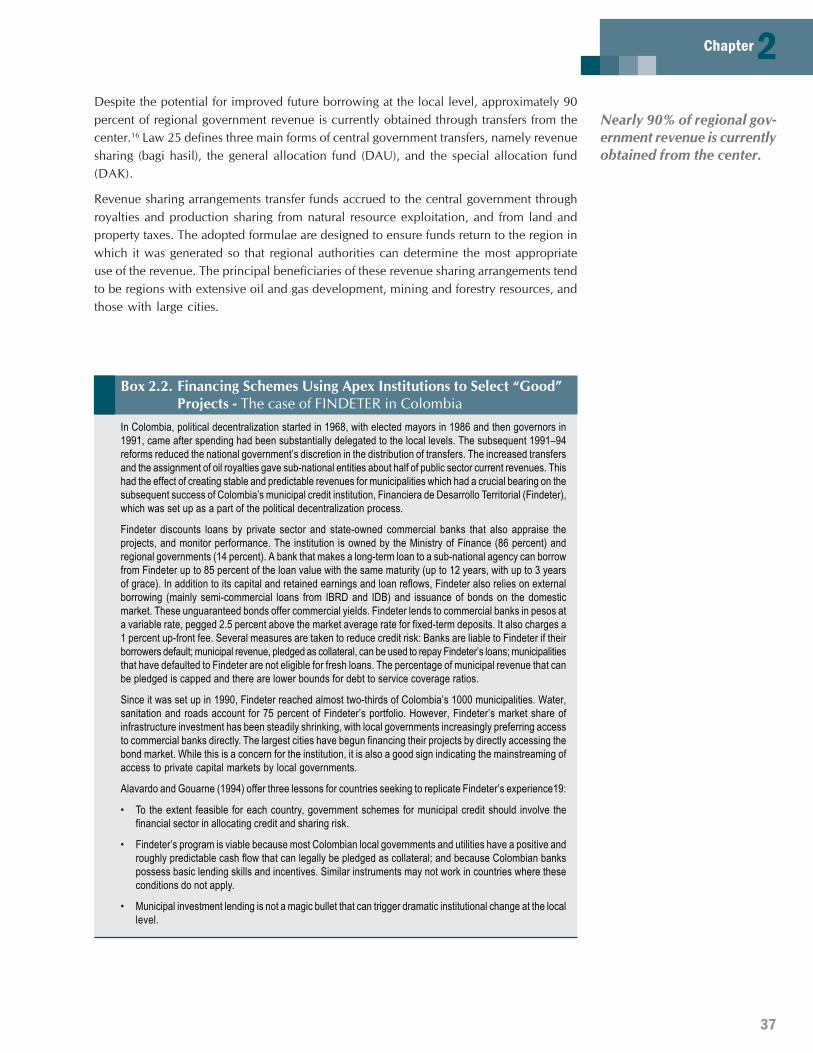
37
Chapter 2Despite the potential for improved future borrowing at the local level, approximately 90percent of regional government revenue is currently obtained through transfers from thecenter.16 Law 25 defines three main forms of central government transfers, namely revenuesharing (bagi hasil), the general allocation fund (DAU), and the special allocation fund(DAK).
Revenue sharing arrangements transfer funds accrued to the central government throughroyalties and production sharing from natural resource exploitation, and from land andproperty taxes. The adopted formulae are designed to ensure funds return to the region inwhich it was generated so that regional authorities can determine the most appropriateuse of the revenue. The principal beneficiaries of these revenue sharing arrangements tendto be regions with extensive oil and gas development, mining and forestry resources, andthose with large cities.
Box 2.2. Financing Schemes Using Apex Institutions to Select “Good”Projects - The case of FINDETER in Colombia
In Colombia, political decentralization started in 1968, with elected mayors in 1986 and then governors in1991, came after spending had been substantially delegated to the local levels. The subsequent 1991–94reforms reduced the national government’s discretion in the distribution of transfers. The increased transfersand the assignment of oil royalties gave sub-national entities about half of public sector current revenues. Thishad the effect of creating stable and predictable revenues for municipalities which had a crucial bearing on thesubsequent success of Colombia’s municipal credit institution, Financiera de Desarrollo Territorial (Findeter),which was set up as a part of the political decentralization process.
Findeter discounts loans by private sector and state-owned commercial banks that also appraise theprojects, and monitor performance. The institution is owned by the Ministry of Finance (86 percent) andregional governments (14 percent). A bank that makes a long-term loan to a sub-national agency can borrowfrom Findeter up to 85 percent of the loan value with the same maturity (up to 12 years, with up to 3 yearsof grace). In addition to its capital and retained earnings and loan reflows, Findeter also relies on externalborrowing (mainly semi-commercial loans from IBRD and IDB) and issuance of bonds on the domesticmarket. These unguaranteed bonds offer commercial yields. Findeter lends to commercial banks in pesos ata variable rate, pegged 2.5 percent above the market average rate for fixed-term deposits. It also charges a1 percent up-front fee. Several measures are taken to reduce credit risk: Banks are liable to Findeter if theirborrowers default; municipal revenue, pledged as collateral, can be used to repay Findeter’s loans; municipalitiesthat have defaulted to Findeter are not eligible for fresh loans. The percentage of municipal revenue that canbe pledged is capped and there are lower bounds for debt to service coverage ratios.
Since it was set up in 1990, Findeter reached almost two-thirds of Colombia’s 1000 municipalities. Water,sanitation and roads account for 75 percent of Findeter’s portfolio. However, Findeter’s market share ofinfrastructure investment has been steadily shrinking, with local governments increasingly preferring accessto commercial banks directly. The largest cities have begun financing their projects by directly accessing thebond market. While this is a concern for the institution, it is also a good sign indicating the mainstreaming ofaccess to private capital markets by local governments.
Alavardo and Gouarne (1994) offer three lessons for countries seeking to replicate Findeter’s experience19:
• To the extent feasible for each country, government schemes for municipal credit should involve thefinancial sector in allocating credit and sharing risk.
• Findeter’s program is viable because most Colombian local governments and utilities have a positive androughly predictable cash flow that can legally be pledged as collateral; and because Colombian bankspossess basic lending skills and incentives. Similar instruments may not work in countries where theseconditions do not apply.
• Municipal investment lending is not a magic bullet that can trigger dramatic institutional change at the locallevel.
Nearly 90% of regional gov-ernment revenue is currentlyobtained from the center.
38
Improving Public Managementof Infrastructure
Averting an Infrastructure Crisis: A Framework for Policy and Action
The DAU is a general purpose unconditional equalization grant, required to equal 25percent of APBN receipts in aggregate from domestic sources (net of revenue sharing). Intotal, revenue sharing measures and the DAU represent approximately one-third of APBNreceipts from domestic sources. The DAU is intended to provide an equalized amount offunding so that regional governments can provide basic public services to a nationallyconsistent standard. However, the manner in which it is currently applied tends to exacerbaterather than reduce regional inequalities.17 As a result, many of the poorer regions, whoalso face incompressible wage bills, have very little discretionary funds available to financeinfrastructure and other needs. These spending needs can be considerable since manyregions inherited poorly maintained infrastructure (e.g. roads) and other facilities (e.g.schools and health centers) which require substantial investments to restore.
The DAK is a special purpose conditional grant implemented in 2003, whose funding isstill comparatively small.18 The central government identifies the regions for receiving thegrants and also determines the purpose of its use. The DAK, by law and regulations, isintended to fund investment activities, particularly those that have spill-over benefits.The grant is restricted from being used for recurrent and administrative expenses. In orderto obtain DAK grants, regions are required to provide counterpart funding, which is currently10 percent of the grant amount. In 2003, the major part of the DAK funding was allocatedfor funding maintenance backlogs, with around two-thirds of the total being allocated tothe road and irrigation sectors. The DAK is not intended to be a substitute for a properlyimplemented DAU, and in any case is not funded to a level that would enable it to fulfillsuch a role.
The shortcomings in the intergovernmental fiscal transfer system are compounded byconstraints on regional government borrowing as well as on-lending procedures of foreignloans to the regions. The on-lending procedures are stipulated in MOF decree KMK.35issued in January 2003, which is still in the process of being implemented. In the past, aconsiderable part of Government’s borrowing from multilateral and bilateral lenders hadbeen channeled to the regions for infrastructure projects, particularly for roads and watersupply. KMK.35 has the laudable aim of making on-lending demand driven, with regionsbeing required to submit extensively documented project proposals for review by a centralevaluation team. In addition to defining the procedures and criteria for on-lending, thedecree also establishes an on-granting channel for projects that are deemed to beeconomically sound but not commercially viable via cost recovery. KMK.35 states thatregions must contribute counterpart funds from their discretionary resources, with theamount varying according to the financial capacity of the region. This creates in effect aparallel channel to the DAK, raising the possibility that the central government could beoffering two matching grant mechanisms for similar types of investments, but with differentapplication and evaluation criteria and varying terms and conditions. Up to this point intime, no foreign financing has been processed utilizing the KMK.35 procedures. For futureapplication, there is also a need for clarity regarding how investments will be classified aseither cost-recoverable or not. Regions will lose the opportunity to finance infrastructureprojects through this mechanism until the governing policies and procedures are furtherclarified.
The above constraints create strong pressures for regions to mobilize additional revenuesfrom local sources. While desirable in principle, this is leading to the arbitrary impositionof distortionary or inappropriate fees and taxes that conflict with the provisions of Law18/Law34.19 The impact of such practices is already evident as some regions impose a form of
No foreign financing has yetbeen processed using the on-lending arrangements inKMK.35.
General purpose grants(DAU), in its current form,tends to exacerbate regionalinequalities.
Conditional grants (DAK) areinsufficiently funded and arestill mostly allocated formaintenance backlogs ratherthan new investments.
39
Chapter 2VAT on mobile phone calls and many others impose transport levies including fees onthe movement of goods through their territories.
Evolving Role of the CenterThe fundamental changes mentioned previously in this chapter are reshaping the challengesby redefining the duties and functions of central sector departments. They also require theGovernment to rethink how it coordinates strategic planning and policy formulation in anera in which it has far less direct control over investment and operating decisions.
In order to perform their evolving roles effectively, the key sector departments – MSRI,MOC and MEMR – will need to redefine their missions, adapt their staffing levels andskill mixes, and adjust their organization structures accordingly. The extent and nature ofthe changes will vary considerably between departments as well among sectors. In principle,MSRI – which was previously the Ministry of Public Works (MPW) faces the most complexchallenges. Initially created as a construction department, MPW developed strong planningand programming capacities and the previous scope of its activities encompass spatialplanning as well as numerous other sector development planning credentials.Decentralization, however, has both diminished its role as an organization that implementscivil works and also reduced its authority as a planning entity. The department has alreadyundergone a radical restructuring effort, eventually being transformed into MSRI. Duringthis transition, MSRI managed to align its structure to operate in the current decentralizedenvironment, while many of its staff were distributed better by being assigned to ‘functionalpools’. It is important to note that this transformation occurred despite various proposalsover the years to abolish the department and distribute its functions to other entities. Forexample, it has been suggested that the agency responsible for roads (Bina Marga / DGRI)could be a part of MOC and the agency responsible for water resources and irrigation(DGSDA) could join the Department of Agriculture. Such options will likely be consideredagain as Indonesia contemplates the overall structure of the central government before theappointment of the next Cabinet in 2004.
The Ministry of Energy and Mineral Resources has also undergone some reorganization inrecent years to adapt to decentralization. The ministry now has a reduced role in themining sector, while they are anticipating further changes resulting from the implementationof the new electricity and oil and natural gas laws.20 Further adjustments within DirectoratesGeneral are likely to be needed as, for example, the Electricity Market Supervisory Agencybecomes operational and the new bottom-up arrangements for preparing nationalelectrification plans (RUKN) are implemented. Furthermore, it would be prudent to expandthe role of the Center for Energy Information into that of a comprehensive central energypolicy unit.21
The MOC has arguably faced the greatest change in role and responsibilities of the threecore infrastructure departments. The creation of MOSE has resulted in the elimination ofMOC’s oversight responsibilities for some 20 diverse infrastructure SOEs22. Likewise, themandate for decentralization calls for the transfer of responsibilities for the hundreds ofsmall ports and airports that have been managed by MOC’s directorate generals. In thetelecommunication sector, the creation of a non-ministerial regulatory agency will narrowthe role of the DG for Posts and Telecommunications.23 Moreover, there may also becompelling reasons to establish non-ministerial regulatory agencies for the transport sectorin the future. The role of the MOC is also changing in other aspects. Globalization necessitates
The MOC has faced thegreatest change in their rolesand responsibility.
Key sector departments willhave to adapt to their chang-ing roles, by redefining theirmission, adjusting their struc-ture, and transforming theirstaffing needs.
40
Improving Public Managementof Infrastructure
Averting an Infrastructure Crisis: A Framework for Policy and Action
rapid improvements of the communication and logisticalinfrastructure, which will require MOC to be a nimblepolicymaker and facilitator. Decentralization, on the otherhand, is creating demand from regional governments forguidance and assistance in areas such as urban transportmanagement and planning. These challenges are dauntingbecause while there have at various times been proposalsfor radical restructuring of the MOC, the actual changesimplemented over the past two decades have beencomparatively minor.24
In addition to rethinking the role and organization ofthe individual sector ministries, Indonesia also faces thechallenge of redefining its framework for coordinatingpolicy and strategy for infrastructure development.Responsibilities for infrastructure provision and operatingdecisions are now far more widely dispersed than theywere in the past while globalization and democratizationrequire that infrastructure services must be far moreresponsive to the evolving demands of users. Under theSoeharto regime, Indonesia was among the most centrallymanaged countries. Bappenas, given overall oversight,guided and coordinated the development of national five-year development plans and sector development programs(REPELITAs). They were also responsible for approvingindividual projects and annual development budgets.Sector departments were given guidelines for preparingproposals for programs and projects, which were thensubmitted to Bappenas for review, amendments, andconsolidation.
Regional governments previously had very little discretionover infrastructure provision, with the exceptions beingin the roads and water supply sectors. With very littlerevenue from their own sources, the regions dependedon loans and grants from the center to fund investmentsin these sectors. By far the major portion of suchinvestments were financed by foreign loans or purpose-specific Inpres grants. Bappenas had overall authority todecide allocations to sectors, individual regions, and individual projects, while sectordepartments managed and oversaw the detailed planning and design. In other sectors,infrastructure was provided exclusively by one or more SOEs (e.g. electric power, telecoms)or by a combination of SOEs and government agencies (e.g. railways, ports, airports). Untilthe late 1990s, the infrastructure Perums were heavily dependent on GOI for their investmentfinancing, with assets typically being financed from the APBN development budget andtransferred as an increase in the State’s equity participation. Regional entities were notpermitted to borrow internationally without the consent of GOI or through one of itstransfer mechanisms. Regional governments also had very limited scope for securing financingfrom domestic banks and capital markets. These limitations were relaxed during the 1990s
Policy coordination will alsohave to evolve with a rede-fined framework and a strat-egy for infrastructure deve-lopment.
41
Chapter 2
when many Perums transformed into Perseros. Those who were financially stable– suchas Telkom and PLN – were permitted to issue bonds and borrow from domestic banks, orto make primary share issues as part of privatization transactions.
In the early days of the Soeharto era, Bappenas also coordinated Indonesia’s policydevelopment and reform initiatives. However, as the reform agenda became more complex,this role was shared with the Coordinating Ministry for the Economy and Industry (EKUIN).A series of major cross-agency reforms were embodied in complex Deregulation Packages
42
Improving Public Managementof Infrastructure
Averting an Infrastructure Crisis: A Framework for Policy and Action
(Paket Deregulasi), each of which involved the preparation and issuance of many newregulations and decrees by several agencies. The first and perhaps most radical of thesewas Inpres 4 of 1985, which was designed to improve the flow of goods through majorports and whose major provision was to remove the authority of the customs office toprocess large import shipments. The package comprised three Government regulations,five Presidential Decrees and instructions, several joint ministerial decrees, and morethan twenty decrees of the Minister of Finance and Minister of Communications, all ofwhich were issued in a period of one week.
The landscape is now changed and Bappenas’ powers are much more circumscribed. TheREPELITA has been replaced by PROPENAS, which is less specific in its programprescriptions and target-setting, while DIP project documents no longer require Bappenasapproval. The 2003 State Finance Law, which provides for consolidation of routine anddevelopment budgets and for medium term expenditure frameworks to supplant the currentform of national development planning, does not define or indicate the future role ofBappenas. The role of EKUIN’s successor, the Coordinating Ministry of Economic Affairs(CMEA), has also been changing. There is a now an increased need for effective inter-agency coordination and interaction, but achieving this goal has proved to be difficult.Recognizing the need for more collaborative processes, there has been a proliferation ofspecial purpose coordination committees. These include, for example, the Committee onPolicy for Accelerating Infrastructure Development, a Committee on PLN Rehabilitationand IPP Renegotiation, and a Committee on Rural Infrastructure Development, all chairedby the Coordinating Ministers. Bappenas tends to oversee the overall functions of manyof these Committees while CMEA itself tends to focus more on short term implementationmatters. Several of the committees have potentially overlapping roles, and the sheer numberof them and bureaucratic territoriality tends to complicate their effective functioning.
Bappenas’ powers are sig-nificantly circumscribedsince the Soeharto era.
43
Chapter 2RecommendationsWhile implementing regulations have yet to be issued, the State Finance Law wouldappear to pave the way for the Ministry of Finance to play a more pro-active role indecision-making on matters relating to infrastructure sector restructuring and regulatoryreform. Government should be seeking ways to reduce the State’s fiscal exposure in theinfrastructure sectors, through promoting structural reforms and private participationarrangements that lead to increased private investment, and to the transfer of commercialrisks to private parties. However, it would be unrealistic to expect sector ministries orutilities to make fiscal exposure a major criterion for choosing between alternative marketstructures or alternative forms of private participation. South Africa provides an interestingmodel in this context by having established a Private Participation in Infrastructure Unitin its National Treasury. This ensures that the ministry with overall fiscal oversight is alsoresponsible for driving implementation of private participation in infrastructure. Privateparticipation has been brought into the ambit of the country’s medium term expenditureframework (MTEF), and sector ministries are expected to demonstrate how risks are to bemanaged, performance measured and value for money maximized in their large infrastructureprojects and programs, if they are to be approved in their MTEF budgets. This in turn hasrequired sector ministries to optimize risk allocation between private and public partiesat the planning stage of infrastructure projects.
The key conclusions and recommendations stemming from the above are that:
• Government’s efforts to commercialize, corporatize and privatize the provision ofinfrastructure services and to separate responsibilities for policy formulation, regulationand ownership of public enterprises have had a positive impact overall and should beconsolidated and expanded.
• Decentralization has irreversibly changed the manner in which Indonesia is governed,but further actions are needed to better define the responsibilities of the differentlevels of government, to improve the implementation of financial transfers from thecenter, to promote effective inter-region cooperation, to build the capacities of regionalagencies, and to prevent imposition of inappropriate taxes and levies.
• The task of the central government has changed dramatically over the last decade orso, with the reduction in its ability to directly manage infrastructure provision. Thegovernment should now review the roles and organization of individual sector ministriesand rethink the arrangements for coordinating policy and strategic planning.
Commercialization and CorporatizationThe most important infrastructure sector from the standpoint of pressing ahead withcommercialization and corporatization is roads, where there are compelling argumentsfor the progressive introduction of a soundly based user-pays regime for infrastructure useand the establishment of a system of road funds and road boards. MSRI has alreadyundertaken considerable preparatory work in this area, and there is scope in the near termfor moving ahead with pilot schemes pending the implementation of desirable legalreforms. A draft road sector law is currently in Parliament.
More generally there are considerable opportunities for deepening the commercializationand corporatization of infrastructure SOEs, particularly in the transport sector. For example,the railway sector should move to rationalize the business of PTKA. An initial step in this
44
Improving Public Managementof Infrastructure
Averting an Infrastructure Crisis: A Framework for Policy and Action
direction would be to exit from businesses such as some freight services that clearly lackcommercial viability, and restructure itself on line-of-business principles. Likewise, JasaMarga should be relieved of its toll road authorization function and restructured so itoperates as a commercially oriented toll road corporation. These changes should also besupported by further strengthening of MSOE’s shareholder capacity, continuing the attemptsto further improve the professional capacities of SOE Boards of Commissioners, and theestablishment of a credible non-ministerial regulatory authority.
At the regional level, there is a pressing need to corporatize the PDAMs and to improvethe governance framework within which they operate. A new law on regional enterprises(BUMDs) is currently being drafted which will provide an opportunity to implementpolicies that will enable and require PDAMs to operate at arms length from DPRDs andregional governments in a professional, transparent and fully accountable manner. Animproved regulatory arrangement for water supply is also urgently needed to further supportthis effort.
Privatization is a useful means of improving enterprise performance, but infrastructurereforms in this regard need to be carefully designed and implemented. The overarchinggoal of privatization should be to support efforts to provide expanded and better publicservices in a more efficient and sustainable manner. Therefore, the objectives of privatizationshould be clearly defined and then articulated to consumers in an effort to ‘socialize’ thereform measures. It is also desirable that any restructuring and rehabilitation needed toenable more effective competition along with adequate regulatory arrangements be institutedprior to privatizing SOEs.
DecentralizationThe Government has recognized the need better define roles and responsibilities of thedifferent levels of government, including those related to infrastructure sectors. Preparationsare underway to amend UU22/1999 and its implementing regulations and to replace anumber of earlier sector laws, including those for roads, road traffic and transport, railways,ports and shipping, and civil aviation.25 It will be important to consider expanding therole of provinces as autonomous regions, as a part of this process. This would include ,for example, the functions related to the management of small ports and airports, and toplanning activities in the power sector. Providing more discretion to provinces on howfinancial transfers are made can increase their influence with local governments. Thecentral government and the provinces will have to take greater responsibility in ensuringthe consistency of infrastructure service provision across the country as well.
There should also be an effort to increase the technical capacities of various local entitiesso they can better select and implement investments, and improve the quality of servicesto consumers. Central government support will be crucial, especially for local governmentsthat have limited technical capacity and also lack adequate accountability. Partnershipswith the private sector, through joint ventures, investments, or twinning arrangementscan be useful for upgrading local capacity. Specialists that are currently based in centralministries can play a critical role in this process.
Government has also recognized the need to increase the fiscal capacity of regionalgovernments to implement their assigned functions, whether through enhancing their powersto collect taxes and charges or through improvements to the intergovernmental fiscal transfersystem. While the key changes needed – such as improving the DAU formulation – are
45
Chapter 2properly outside the scope of this report, there are three topics that merit mention in thespecific context of improving the delivery of infrastructure services. The first two relate tothe mechanisms for on-lending / on-granting of foreign loans and channeling of specialgrants (the DAK) and are to some extent related, while the third relates to the impositionof inappropriate taxes and levies.
The on-lending procedures established by MOF Decree KMK.35 are designed amongothers to discourage imprudent borrowing by the regions. While it incorporates manydesirable features, the complex bottom-up process adopted has the potential, if appliedrigidly, to impede the channeling of funds for urgent and well justified infrastructure andother investments at the sub-national level. Moreover, there are also questions concerningthe appropriateness of its on-granting mechanism inasmuch as this creates a special purposeconditional grants channel that parallels the DAK, but with different procedures andterms. Government has acknowledged the need to amend KMK.35 and there is a strongcase for streamlining procedures for dealing with loans that would finance projects withcomponents in many regions and for integrating its on-granting channel with the DAK.
Given the limited discretionary financing capacities of most regions, the DAK potentiallyhas a critically important role to play in funding infrastructure development at the regionallevel and in promoting improved efficiency in infrastructure management. There arecompelling arguments for increasing the volume of funding allocated for the DAK, and formaking the allocation process more ‘bottom-up’ in line with the intent of PP104/2000. Themost promising avenues for increasing DAK funding would be to shift deconcentratedfunding currently being channeled through sector departments for what are properly regionalgovernment functions, and to use the DAK as the mechanism by which GOI transfers theproceeds of foreign loan and grant proceeds as special purpose grants under KMK.35.
There is also considerable scope for using the DAK as a means of promoting improvementsin the efficiency of infrastructure spending at the sub-national level. In particular, theDAK should be used to stimulate investments for projects (e.g. flood control) whosebenefits are likely to be enjoyed in significant measure by those in neighboring regions,and to foster inter-region cooperation in fields such as solid waste management whereconsequent scale efficiencies could be expected to significantly reduce costs. There arealso compelling arguments for using the DAK to finance much-needed institutionaldevelopment and capacity building at the kabupaten / kota level, although this wouldlikely require amendment to PP 104/2000.
The imposition of inappropriate taxes and charges by regional governments can adverselyimpact the efficient provision and use of public infrastructure. Law 34/2000 empowersthe Minister of Finance to revoke regional government regulations (Perdas) that are deemedto be inconsistent with the public interest or to conflict with higher level regulations (andspecifically Law 18/1997). Regional Governments are required to submit Perdas establishingnew taxes and charges to the center for review within 15 days of their ratification, withthe center then having the right to reject these within a period of one month. In practice,neither side has been able to comply with these time limits, with the result that theMinister of Finance was in December 2002 revoking Perdas that had been issued morethan a year earlier. Many of the 173 Perdas that had been canceled up to December 2002involved charges on truck operators for the use of road infrastructure. However, feedbackfrom infrastructure providers suggests that regional governments continue to find innovativenew charges sooner than MOF can review and make decisions regarding them, and thatregions are not complying promptly when ordered to revoke inappropriate regulations.
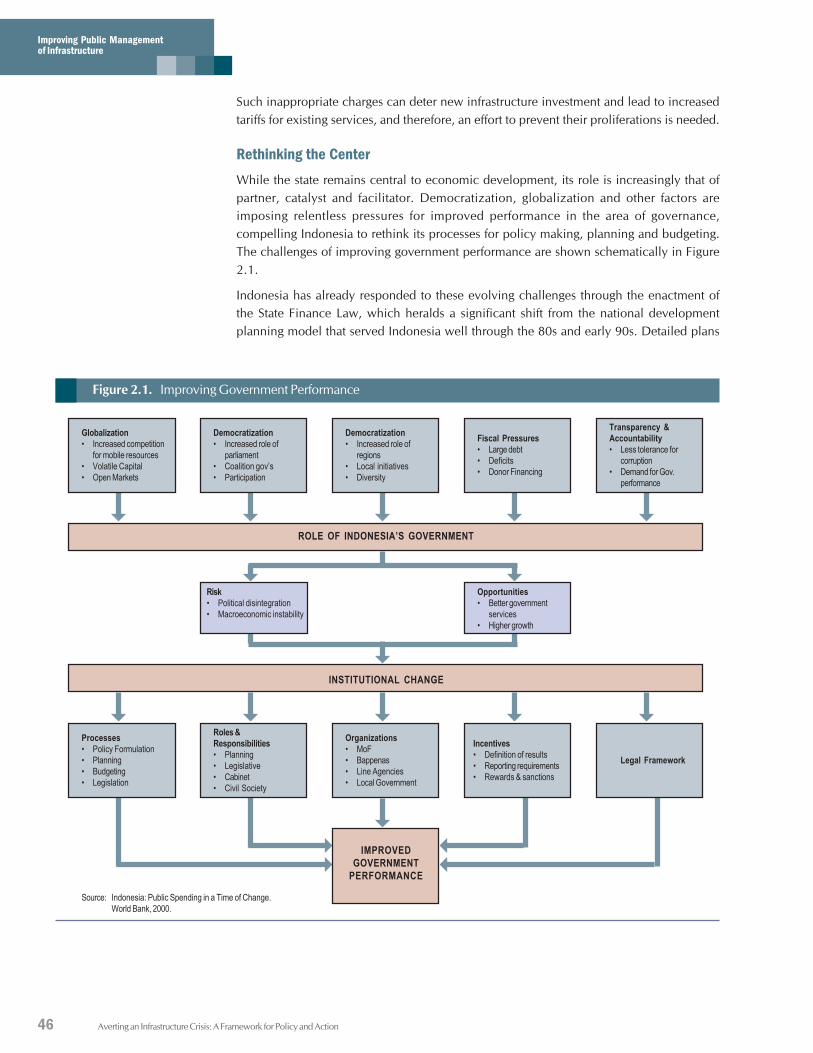
46
Improving Public Managementof Infrastructure
Averting an Infrastructure Crisis: A Framework for Policy and Action
Such inappropriate charges can deter new infrastructure investment and lead to increasedtariffs for existing services, and therefore, an effort to prevent their proliferations is needed.
Rethinking the CenterWhile the state remains central to economic development, its role is increasingly that ofpartner, catalyst and facilitator. Democratization, globalization and other factors areimposing relentless pressures for improved performance in the area of governance,compelling Indonesia to rethink its processes for policy making, planning and budgeting.The challenges of improving government performance are shown schematically in Figure2.1.
Indonesia has already responded to these evolving challenges through the enactment ofthe State Finance Law, which heralds a significant shift from the national developmentplanning model that served Indonesia well through the 80s and early 90s. Detailed plans
Figure 2.1. Improving Government Performance
Source: Indonesia: Public Spending in a Time of Change.World Bank, 2000.
Globalization• Increased competition
for mobile resources• Volatile Capital• Open Markets
Democratization• Increased role of
parliament• Coalition gov’s• Participation
Democratization• Increased role of
regions• Local initiatives• Diversity
Fiscal Pressures• Large debt• Deficits• Donor Financing
Transparency &Accountability• Less tolerance for
corruption• Demand for Gov.
performance
Processes• Policy Formulation• Planning• Budgeting• Legislation
Roles &Responsibilities• Planning• Legislative• Cabinet• Civil Society
Organizations• MoF• Bappenas• Line Agencies• Local Government
Incentives• Definition of results• Reporting requirements• Rewards & sanctions
Risk• Political disintegration• Macroeconomic instability
Opportunities• Better government
services• Higher growth
ROLE OF INDONESIA’S GOVERNMENT
IMPROVEDGOVERNMENT
PERFORMANCE
INSTITUTIONAL CHANGE
Legal Framework
47
Chapter 2for implementing the new law are now being prepared, with particular attention beinggiven to integrating improved processes for strategic policy formulation and developmentplanning with the preparation of medium-term expenditure frameworks and annual agencywork programs and budgets. As indicated above, it will be important to position themanagement of public risks associated with private provision of infrastructure withinthese processes. This definition of processes will in turn provide the basis for deciding theresponsibilities of individual agencies. While there are no ready-made solutions foraddressing these issues, many other countries have shifted from centrally planned tomarket-driven economies in recent years, and Indonesia can likely benefit from theirexperience. With a new Cabinet expected to take office in October 2004, there is now anopportunity to start identifying and assessing possible options with a view to havingpreliminary proposals available for consideration by the incoming President.
Averting an Infrastructure Crisis: A Framework for Policy and Action48
RestoringPrivate Participationc
ha
pte
r3
49
n December 2002, Government sold a further 42 percent stake in theinternational and mobile telecommunications operator, PT Indosat, toSingapore Technologies Telemedia (STT), bringing the level of privateownership to 85 percent. STT’s bid valued Indosat’s shares at around 50percent above their current price on the Jakarta and New York StockExchanges, with the total payment being around US$627 million. Comingjust two months after the Bali bombing and following a competitive processthat had been explained in the press, there were reasonable grounds forGovernment to anticipate some praise for this transaction. Instead it cameunder heavy criticism for selling a strategic national asset, lack oftransparency, and its choice of buyer.
Just a short distance from Indosat’s head office is a building that symbolizesIndonesia’s ambivalent attitude toward the private sector. PT Sarinah is astrategically positioned but visibly run-down department store. Ownedby the State, it has stagnated while modern privately owned stores havemushroomed around it. Although long an obvious privatization candidate– the retail market is booming while Sarinah under-performs and plays nospecial social role26 — reasons continue to be found for keeping it underpublic ownership. Not surprisingly, resistance to private participation onthe ‘commanding heights’ of the infrastructure economy is considerablystronger.
IPrivate sector is weary ofinvesting in Indonesia, buttheir expertise and funding isbadly needed in the infra-structure sector.
50
RestoringPrivate Participation
Averting an Infrastructure Crisis: A Framework for Policy and Action
There are several reasons for this. First, many interpret Indonesia’s constitution to requirethat basic infrastructure be provided directly by the State through government or publicenterprises. Second, the legacy of the 1990s has led the public understandably to equateprivate participation with crony participation and corruption. Third, and linked with this,the public has little trust in the capacity of public institutions to contract with andregulate private operators. While surveys also reveal general distrust of key State institutions,public provision nonetheless tends to be seen better option than private provision. Inshort, there are currently few political champions of private participation while thosewho oppose it enjoy strong and vocal support.27
In seeking to attract private infrastructure investors, Indonesia will need to understandand respond to their expectations and concerns. Infrastructure presents particular challengesinsomuch as initial investments tend to be large and lumpy, growth in capacity utilizationis often slow with correspondingly long pay-back periods, and tariff increases are generallysocially sensitive. Special measures are needed to reconcile these features with privateinvestors’ desire for predictable and secure returns. International experience has shownthat, with sound policies, regulatory frameworks and competent institutions, risks can bereduced and appropriately allocated so as to make infrastructure projects attractive evenfor conservative investors such as pension funds. But private funding will be scarce andfinancially prohibitive where these conditions are not met.
Viewed in this context, Indonesia’s infrastructure sectors are unattractive for many investorsbecause risks are perceived to be too high. The underlying causes for this include:
• Regulatory arrangements and tariff policies are not conducive to private investment.By way of example, power and phone tariffs are decided by Government in consultationwith the DPR, with decisions being significantly influenced by political considerations.Likewise, initial tolls for toll roads are confirmed until construction is complete,while automatic toll adjustment has not been permitted.
• Institutional capacities are weak and procedures are cumbersome. Together thesetranslate into high up-front and operating costs. For example, it took several years tocomplete the Terms of Agreement for Indonesia’s first independent power producer(IPP), with the cost of technical, legal and financial advisors for preparatory workamounting to several million dollars. Private providers of infrastructure have alsocomplained for years about the difficulties acquiring land and securing right-of-ways.At the sub-national level, many agencies have insufficient expertise to promptlynegotiate credible concession agreements with private groups.
• Domestic financial institutions can contribute little. Domestic capital markets andbanks are unable to mobilize long-term Rupiah financing for major infrastructureprojects, and international financing poses exchange rate risks except in cases whererevenues are also denominated in foreign currency.
• The judicial system is corrupt. The judicial system in Indonesia, which is the avenueof final recourse, has a very poor reputation as a fair arbiter in solving disputes. Arecent decision not to execute an international arbitration award has exacerbatedoverseas investor’s concerns regarding the credibility of the judiciary.
51
Chapter 3• Public ‘off-takers’ are considered poor credit risks. Even before the crisis, Pertamina
and its production sharing contractors required gas sales agreements with PLN to bebacked by stand-by letters of credit on State-owned banks. The subsequent renegotiationof PLN’s IPP contracts, which were backed only by ‘comfort letters’, has promptedprospective investors to seek more robust backing for payment obligations.
Consequently, many investors, lenders, and insurers remain cautious about the infrastructuresector despite potentially attractive business opportunities. Other countries are perceivedto have stronger government commitments and offer environments for infrastructureinvestment that are less risky. Furthermore, there are other non-infrastructure investmentopportunities in Indonesia that offer more secure returns.
The Indonesian Government recognizes these challenges and is moving to address them.This chapter first reviews Indonesia’s past achievements in attracting private sector interestin infrastructure. It then discusses the benefits that the country could derive from a resurgenceof private investors and operators in the sector. Finally, it identifies the steps that Indonesiacan take to progressively establish an environment more conducive to private participationin infrastructure so that overall welfare benefits of their participation can be maximized.
Many Indonesians expect in-frastructure services to beprovided by the publicsector, and view private par-ticipation with skepticism.
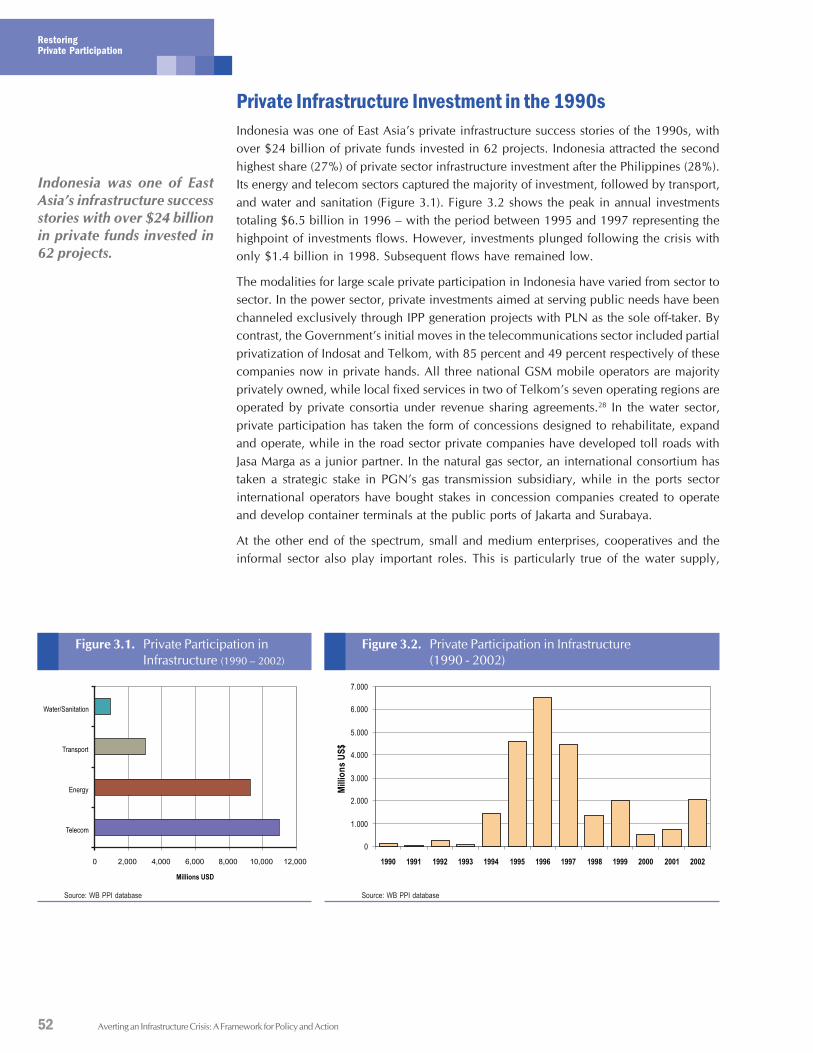
52
RestoringPrivate Participation
Averting an Infrastructure Crisis: A Framework for Policy and Action
Private Infrastructure Investment in the 1990sIndonesia was one of East Asia’s private infrastructure success stories of the 1990s, withover $24 billion of private funds invested in 62 projects. Indonesia attracted the secondhighest share (27%) of private sector infrastructure investment after the Philippines (28%).Its energy and telecom sectors captured the majority of investment, followed by transport,and water and sanitation (Figure 3.1). Figure 3.2 shows the peak in annual investmentstotaling $6.5 billion in 1996 – with the period between 1995 and 1997 representing thehighpoint of investments flows. However, investments plunged following the crisis withonly $1.4 billion in 1998. Subsequent flows have remained low.
The modalities for large scale private participation in Indonesia have varied from sector tosector. In the power sector, private investments aimed at serving public needs have beenchanneled exclusively through IPP generation projects with PLN as the sole off-taker. Bycontrast, the Government’s initial moves in the telecommunications sector included partialprivatization of Indosat and Telkom, with 85 percent and 49 percent respectively of thesecompanies now in private hands. All three national GSM mobile operators are majorityprivately owned, while local fixed services in two of Telkom’s seven operating regions areoperated by private consortia under revenue sharing agreements.28 In the water sector,private participation has taken the form of concessions designed to rehabilitate, expandand operate, while in the road sector private companies have developed toll roads withJasa Marga as a junior partner. In the natural gas sector, an international consortium hastaken a strategic stake in PGN’s gas transmission subsidiary, while in the ports sectorinternational operators have bought stakes in concession companies created to operateand develop container terminals at the public ports of Jakarta and Surabaya.
At the other end of the spectrum, small and medium enterprises, cooperatives and theinformal sector also play important roles. This is particularly true of the water supply,
0
1.000
2.000
3.000
4.000
5.000
6.000
7.000
1990 1991 1992 1993 1994 1995 1996 1997 1998 1999 2000 2001 2002
Mill
ion
sU
S$
Figure 3.2. Private Participation in Infrastructure(1990 - 2002)
Source: WB PPI database
Figure 3.1. Private Participation inInfrastructure (1990 – 2002)
Source: WB PPI database
0 2,000 4,000 6,000 8,000 10,000 12,000
Telecom
Energy
Transport
Water/Sanitation
Millions USD
Indonesia was one of EastAsia’s infrastructure successstories with over $24 billionin private funds invested in62 projects.
53
Chapter 3sanitation and solid waste sectors, where the informal sector is an active service provider.Likewise small enterprises and cooperatives also participate in the power sector, includingin micro generation and local distribution.
The Promise of Private Service ProvisionIndonesia needs private sector participation in infrastructure because they bring vitalresources and expertise. In addition, and perhaps more importantly, the conditions foreffective service provision – by any operator, public or private – that have been discussedin chapter 2 are more likely to be met under private provision. This is because attractingthe private sector requires the Government to credibly commit to developing the type ofbusiness environment that is needed, by any operator, for efficient service provision.
In particular, private provision can help establish an arm’s length relationship betweenservice providers and public authorities, thereby relieving political pressures that impedeefficient service delivery. This arrangement often results in stronger government commitmentsto cost covering tariffs which give operators an better opportunity for financial sustainability.In the absence of such a commitment, private companies would be reluctant to participatein a market where they are exposed to commercial and investment risk. Private provision ofinfrastructure services can be useful, however, since private managers operate undercommercial principles, with greater flexibility in staffing and increased diligence in efficiencygains such as improved collections and greater cost savings. These improvements stimulatefurther private capital investment, foster management expertise, and encourage technologyadoption. Private provision can also offer improved services through greater competition, aswell as an opportunity to better allocate risks between public and private sectors.
The scope of the potential benefits of private participation mentioned previously variesdepending upon the specific option that is selected – ranging from management contractsto full divestiture. Management contracts theoretically result in the fewest benefits, whiledivestiture of state owned enterprises can achieve the full range of benefits from privatesector involvement. The key characteristics of each form of private participation and itspotential benefits are presented below and summarized in Table 3.1.
Table 3.1. Main Forms and Potential Benefits of Infrastructure Privatization
Management Upstream DownstreamContract Lease BOT/ BOT/ Divestiture
concession concession
Management expertise X X X X XTariff discipline X X XAccess to private capital X X XCapital market development X X XPotential capital revenues X
Note:• Management Contract. Under a management contract, a private firm manages the operations of a state-owned business without
committing investment capital or accepting commercial risks. If the firm is empowered to implement reforms and given incentives for goodperformance or penalties for bad performance, management capacity will develop so as to maximize profitability.
• Leases. Under a lease, a private firm operates and maintains a state-owned business at its own commercial risk, with income beingderived directly from tariffs. Except for agreed maintenance obligations, the lessee is not required to commit investment capital. Thisformat has the merit of requiring governments to impose tariffs that more than cover operations and maintenance costs and of providingincentives to reduce costs and improve payment collection. It can help achieve improved utilization of existing assets but will not assistin expanding capacity.
54
RestoringPrivate Participation
Averting an Infrastructure Crisis: A Framework for Policy and Action
• Upstream BOT/Concession.29 Under an ‘upstream’ contract, a private firm (e.g. power generator or bulk water supplier) takes commer-cial risk and accepts investment obligations to build or rehabilitate as part of an agreement to supply to a downstream off-taker. Predictablerevenue flows, sound management, and adequate separation from public authorities can facilitate access to private capital. Suchschemes can be attractive to operators insofar as they are one step removed from end-users and the collection of tariffs. While the upstreamoperator has an interest in ensuring that the downstream off-taker performs efficiently, its financial insulation makes it less concerned tosee cost-covering end-user tariffs, especially if the off-taker’s payments are guaranteed by the government.
• Downstream BOT/Concession. Under a ‘downstream’ contract, a private operator is involved in supplying a service – such as poweror water – directly to end-users. Although contractually comparable to ‘upstream’ contracts, such schemes force governments to committo tariff discipline because the private operator’s financial viability is dependent primarily on cost-covering tariffs. Without such commit-ment, private operators will not participate.
• Divestiture involves the sale of Government’s shares in a state-owned enterprise and is arguably the strongest form of private partici-pation. Sales of stakes to strategic partners will normally have the merits of bringing specialized technology and managerial expertise.IPOs on the other hand brings the disciplines of stock exchange listing, including stringent reporting and disclosure requirements, andcan distribute individual share ownership broadly across the population
While privatization has been on Indonesian Government’s agenda since the late 1980s,there has been limited progress in infrastructure sectors except telecommunications. Inthe case of Indosat and Telkom, the Governments decision not only to privatize, but listthe companies in the New York Stock Exchange has resulted in considerable gains. Thishas subjected the two companies to stringent international reporting and disclosurestandards, with both companies consequently being rated as among the best managedfirms listed on the Jakarta Stock Exchange. In other sectors – notably ports and gastransmission – privatization has so far been limited to the sale of stakes in subsidiaryconcession companies and strategic partners, although preparations are now underway foran IPO in PGN by the end of 2003.
Upstream BOT/BOO/concession contracts are the most common form of privateparticipation in Indonesia, mostly in the power and water sectors. There is considerablescope for expanding the use of downstream contracts, including in the water sector, so asto promote operational efficiency as well as tariff discipline. Downstream contracts arecurrently used in the toll road sector but tolls have not increased to cover costs in theabsence of such a contractual provision. It will be desirable in this context to ensure thatgovernment agencies and public enterprises are well informed of the different contractualmodels and their respective advantages and disadvantages.
Setting ObjectivesAs a first step in its effort to attract private sector interest, the Government will need toclearly define its objectives for promoting private participation and articulate this toconsumers. It will then need to demonstrate to potential investors that it can establish anenvironment conducive to private participation while assuring a skeptical public that ithas the capacity to prevent any abuse of market power, by providing credible regulationsand enabling effective competition.
Once objectives are determined and a strategy is agreed upon, a public information effortto ‘socialize’ the impact is essential. Several Governments – Northern Ireland is an example- have opted to use the internet for such purposes.
Some countries have gone still further to recognize the link between PPI and publicexpenditure reform, making PPI programs explicit, key components of these reform programs.The South African Government, for example, has established a PPI Unit in its NationalTreasury, thereby ensuring that the ministry with overall fiscal oversight is also responsiblefor driving implementation of PPI. PPI has been included in the country’s medium termexpenditure framework (MTEF), and sector ministries are expected to demonstrate how
55
Chapter 3risks are to be managed, performance measured and value for money maximized in theirlarge infrastructure projects and programs, before they are approved in their MTEF budgets.This in turn has required sector ministries to incorporate PPI options for infrastructureprojects at the planning stage, many of which have moved into procurement andimplementation phases as PPI models. As sector ministries have become more comfortablewith the approach, private participation has expanded from traditional infrastructure projectsto include social programs in sectors such as health and education. These lessons couldbe highly relevant for Indonesia as it moves to implement the 2003 State Finance Law.
It must also be recognized that the opportunities for sound private participationopportunities in infrastructure should not be limited to large investments. As previouslynoted, Indonesia has demonstrated extensive and effective small scale private involvementin sectors such as water supply and sanitation, and should look to harness suchentrepreneurial resources to support other sectors such as rural electrification.
Ensuring the Financial Sustainability of Service ProvisionA sufficient level of tariffs is essential for sustaining infrastructure services. Privateenterprises pay particular attention to tariff levels since they are vital for earning an adequatereturn on their investments. In most infrastructure sectors in Indonesia, there is a need toraise tariffs so that service provision can be financially sustainable. For many consumers,however, tariff increases will create hardship by further raising the substantial share ofincome they already spend on infrastructure services. In Indonesia, decisions on key tariffscontinue to be made by Government rather than by regulatory agencies. Recently thecentral government implemented needed tariff increases, most notably for power andfuel, despite substantial public opposition. However, several other previously approvedincreases, of telephone tariffs and fuel prices scheduled for January 2003 and of powertariffs scheduled for October 2003, were postponed. This has caused concern amongexisting and potential investors regarding the government’s commitment towards financialsustainability in the infrastructure sector. Therefore, it is important to implement a carefullyplanned set of tariff reforms while clearly articulating to consumers the need for thereforms and addressing consequent social and distributional impacts.
Financial viability is critical for providing efficient infrastructure services to consumers.Therefore, service providers need to recover their costs, ideally by charging those who usethe services. Alternatively, costs can also be recovered through general tax revenues orinternational donor funds – implicitly paid by domestic tax payers or international taxpayers respectively. In order to be financially sustainable, it is important to have users ortax payers pay for maintenance and operations at a minimum. It is likely that serviceproviders will cutback on maintenance and/or expansion in the absence of such financing,which will eventually lead to access constraints and a degradation of service quality.
The situation is most alarming in the water supply sector, where most PDAMs are financiallyfragile. Current tariffs are too low to cover recurrent operation and maintenance costs, andthe financial situations in many PDAMs are too weak to fund network expansion. Thefinancial situation is further undermined by the fact that many local governments continueto extract funds from utilities through ‘dividends in advance’. As a result, many PDAMshave reduced their spending on operations and maintenance which has contributed to highlevels of ‘unaccounted for water’ that average between 40 and 50 percent. The quality
56
RestoringPrivate Participation
Averting an Infrastructure Crisis: A Framework for Policy and Action
of water service has also deteriorated. In some instances, PDAMs have reduced the amountof chemicals they use to treat water, which has increased the possibility of water-bornediseases. Most PDAMs have ceased servicing their debts to Government, which has limitedtheir access to new funding for required investments. The poor access and service of manyPDAMs, therefore, require nearly 80% of the population to rely on self-provisioning orthe informal sector obtain water.
PLN has made substantial improvements since the crisis, although its financial conditionremains fragile. The utility has attained a low debt-equity ratio which reduces its interestcharges, while arrangements have been made to obtain Government compensation forcharging mandated low tariffs from small customers30. Recent tariff increases have greatlyimproved the cash flow situation, enabling PLN to finance a new circa 800 MW gasturbine plant using its own reserves. The current tariff level of about US 6.7 cents/kWhwas reached after ten consecutive quarterly increases bringing it to a pre-crisis level. Thecurrent tariff level is close to being sufficient to cover long-run marginal costs in thesector. It will be important to consolidate recent reforms, and issue the implementingregulation for the new Electricity Law. One important aspect of the regulations should bea mechanism for automatic tariff adjustment.
The situation in the telecommunication sector is more complex. Operators are reasonablyefficient and profitable, and are able to finance their expansion by mobilizing bank loans orbonds. Tariffs for international services are high in comparison with other countries, andthere is scope for considerable price reductions. The removal of exclusivities enjoyed byTelkom and Indosat, however, have already prompted them to offer services with sizeablediscounts.31 The situation is different for domestic long charges, which tend to be high,while charges for local service are quite low. This is a consequence of the Government’simplicit policy of requiring those who could afford long distance calls to cross-subsidizemonthly subscription charges and local calls. This was easily managed when Telkom enjoyedexclusivity on domestic fixed access and long distance services. However, the introductionof a duopoly system – seen as the first step in a move towards full competition in the market
– requires tariffs to be rebalanced in order to make investments in fixedaccess networks more attractive. The Government initially made aprovision to address this by announcing a 15 percent average tariffincrease in January 2003, but then subsequently deferred itsimplementation. In the mobile telecommunication sector, growth isstrongest in the pre-paid card segment, since it is difficult for individualsto obtain post-paid accounts without additional financial guarantees.Willingness to pay is nonetheless high, notwithstanding the fact thatpre-paid rates are higher than post-paid charges, and that the less well-off are therefore paying higher rates for their calls.
The situation of informal and community-based infrastructure servicesis quite different since there is less direct interference from publicauthorities. These services tend to be driven by consumer demand andare consequently responsive to users’ needs. Therefore, communitiesare often willing to contribute to construction costs and support costcovering tariffs. This reinforces feedback from consumer organizationsthat indicates users’ willingness to accept significant tariff increasesprovided that: (i.) the justification is convincing; (ii.) the provider isperceived to be efficient and not corrupt; (iii.) the provider
PDAMs finances are weak-ened by low tariffs, makingnetwork expansion difficult.
57
Chapter 3shows commitment to improving service quality; and (iv.) the increases are announcedwell ahead of their implementation and phased-in progressively so that household budgetscan be adjusted. The recent series of substantial power tariff increases was accepted inpart because of an effective media campaign and in part because Government requiredPLN to improve its performance and publish information on its achievements.
Maximizing Competitive DisciplinePrivate participation yields best results where there is effective competition among providers.In the economist’s ideal world, constant market pressures ensure efficient delivery ofquality products and services to consumers at prices that are just enough to enable producersto earn a sufficient return on their investments. Less efficient firms will exit the marketwhile others with potential to succeed will enter. The mobile phone market provides agood example of how intense competition among manufacturers can result in rapidtechnological innovations and cost reductions. It also exemplifies how competition amongretailers can lower prices for consumers.
The infrastructure sectors have characteristics – including very high fixed costs – thatmake them generally less amenable to intense competition. However, recent advances intechnology have enabled competition to be introduced in such sectors that were previouslyseen as natural monopolies. The scope for ‘head to head’ competition in the market –where consumers can choose their supplier, and suppliers compete to serve them - varieswithin sectors as well as between market segments. Such competition tends to feasible insectors and markets segments where:
• variable costs are high relative to fixed costs, thus limiting economies of scale;
• services are excludable, thus making it possible to charge for them;
• there are few externalities, positive or negative associated with the provision of theservice;
• political and strategic concerns are limited.
Carefully designed sector restructuring, driven and overseen by government, can maximizethe scope for head-to-head competition by unbundling market segments with differentcharacteristics and thereby maximize the potential benefits of private participation. Forexample, many countries have unbundled their power sectors so as to enable head-to-head competition in power generation and in retail supply to small customers. However,infrastructure markets are more complex and require careful design and proper regulation.A competitive power generation market, for example, requires a sufficient number of‘players’, a robust transmission system, clearly defined market rules, and competentprofessional institutions to manage system operations and payments. Likewise, head-to-head competition among mobile phone operators also needs to be supported byinterconnection arrangements and cross-payment systems.
In many sectors and segments economies of scale preclude head-to-head competitionbetween service providers. Notable examples include ‘pipes and wires’ businesses suchas power and gas transmission and distribution, and urban water supply. In many cases ,it does not make sense to duplicate highly capital intensive networks, and therefore, thesenatural monopolies are relegated to the public sector. There is still a scope, however, to
Private participation yieldsbest results when thereis competition among pro-viders.
58
RestoringPrivate Participation
Averting an Infrastructure Crisis: A Framework for Policy and Action
achieve some of the benefits of private participation,which can be attained through competition for themarket. For example, ‘franchise bidding’32 can enableperiodic competitive discipline through the bidding outof rights to operate services under concessions or otherforms of agreements.
The public sector can also be reluctant to relinquish directcontrol and select operators through competitive processes.The selection of projects and operators prior to the crisiswas in fact particularly opaque and non-competitive. Whilethe attendant risks were acknowledged by the economicministries, it was not until January 1998 – when the privatesector interest in further infrastructure investments waned–that Keppres 7 of 1998 was issued to establish some basic‘rules of the game’. A requirement of this decree is thatall proposed for private participation be subject to thoroughtechnical, economic, and financial pre-feasibility studies.It also requires that private participation will also besolicited on a competitive basis. Key decision-making rolesin the procurement process were accorded to theGovernment’s Procurement Evaluation Team (TEP) fornational projects and to provincial Governors for regionalprojects.
Subsequent changes in the Government departmentstructure, including the decentralization of publicresponsibilities and the disbanding of the ProcurementEvaluation Team, have cast doubt on the continuingvalidity of Keppres 7. The KKPPI Committee was taskedtwo years ago with drafting a revised Decree, but progressis delayed due to issues related to the draft’s consistencywith existing sector laws. In the meantime, there areindications of a return to practices that characterized theSoeharto era, with some private groups again proposingunsolicited infrastructure projects of questionable meritand some government agencies again showing interestto negotiate deals directly with them. While the desireto complete such deals is understandable, it will likely undermine the Government’sbroader efforts to build public trust in a credible and transparent private infrastructureprogram.
There are compelling reasons for adhering to a firm policy of requiring competition inprivate participation at this stage of Indonesia’s economic recovery, despite mixed viewsas to how best to handle unsolicited proposals. Investments should be selected based onsound pre-feasibility studies and also be identified as high priority in sector developmentplans. Such processes should provide comfort to investors and government agencies, whowill be better able to refute claims that contracts were secured through corrupt practices.
59
Chapter 3
60
RestoringPrivate Participation
Averting an Infrastructure Crisis: A Framework for Policy and Action
Conversely, investors who seek to conclude deals through direct negotiation with theGovernment must recognize the possibility of their contracts coming under intense scrutinyin the future.
Competitive discipline can also be derived through yardstick competition, wherebyregulators use comparative performance data from other similar enterprises to regulatemonopoly network industries.33 Yardstick competition applies pressure to under-performingservice providers by comparing them with other suppliers of the same service using variousmeasures of performance and efficiency (i.e. price, maintenance cost per km of main,leakage levels, etc.). In unbundled sectors, it gives companies incentives to check theperformance of their suppliers. Shareholders and customers also have better informationabout company performance. Such comparative assessments exert pressure on managersto improve their company’s performance. Although no service provider operates underthe same circumstances and the process requires reliable data, yardstick competition mayincrease performance and efficiency of service providers in Indonesia.34
The telecommunications sector has been least affected by physical and administrativeboundaries and by social sensitivities regarding tariffs. Consequently, in Indonesia as inother countries, it leads the field in terms of competition and private investment, withbenefits to both users and investors.
Since the mid-1990s, three national GSM operators,35 all now fully or majority privatelyowned, have been competing head-to-head in the cellular mobile market. Their efforts toincrease market share have contributed to explosive growth. From around 2000, VOIPoperators began to encroach on the Indosat-Satelindo international call duopoly, whilethe impending termination of ‘exclusivities’ promises far more intense competition – anddownward pressure on tariffs – as Telkom enters the market.36 The ending of exclusivitieswill enable the newly merged Indosat and Satelindo to become a competitor with Telkomon domestic local and long-distance services, although this may take some time.37 Perhapsmore significantly, technological convergence is quickly blurring the distinction betweenmobile and fixed services, with GSM operators now complaining about unfair competitionfrom Telkom’s new radio-based fixed access service, which offers high data transmissionspeed and voice quality and provides various value-added services at the same tariff as theconventional fixed-line service. The broadband cable and ISP markets are also competitive,with Telkom and Indosat again being major players but with other operators havingsignificant shares in specific niches or regions.
At the other end of the spectrum, the organization of urban water distribution services hasbeen shaped by administrative limitations, while bulk water supplies have been shaped bywatershed boundaries. In some large metropolitan cities, such as greater Surabaya,responsibility for water distribution is shared among several PDAM’s. There are limitedprospects for economies of scale due to the over 300 PDAMs in existence. Each PDAMfunctions as a poorly regulated local monopoly making inefficiency inevitable. Opportunitiesfor introducing efficiency-enhancing competition have been foregone as water supplyconcessions were awarded to private consortia through direct negotiations, including notablythe two concessions awarded in Jakarta. Efforts to benchmark performance are fragmented.Faced with similar problems, the UK during the 1970s restructured its many small municipallyorganized water and sanitation utilities into 10 regional water and sanitation authoritiesorganized around river basins. This generated significant scale economies and also pavedthe way for yardstick competition. Box 3.1 highlights the experience in Brazil, wheremunicipal authorities continue to have constitutional responsibility for provision of water
The telecom sector inIndonesia leads the field incompetition and privateinvestment, with benefits toboth users and investors.
61
Chapter 3and sanitation services, and where many have opted to delegate upwards to a state-levelwater company which provides services to numerous municipalities.38
Box 3.1. Achieving Economies of Scale in Water and Sanitationin Brazil
In Brazil, until the 1970s, municipalities were responsible for the public provision of water supply andsanitation. Suppliers were municipal water and drainage companies, each with different financial andadministrative structures. Insufficient supply and a weak institutional structure in terms of organization,financial resources, and planning plagued municipal water companies, and made it difficult to increase supplyand meet increasing demands.
These problems led to the creation and implementation of Brazil’s National Water and Sanitation System in theearly 1970s, which consisted of the National Water Supply and Sanitation Plan (Planasa), the NationalHousing Bank, and the Employment Guarantee Fund. Concurrently, Brazil’s State Water and SanitationCompanies (CESBs) were set up in every Brazilian state and were responsible for construction, operation,and maintenance. In order for CESBs to operate in their respective states, they had to obtain municipalconcessions to run the services under long term contracts because the Brazilian Constitution states that thepower to grant water and sanitation concessions belongs to the municipalities.
The larger system and resulting economies of scale, along with the favorable performance of the economy,increased amount of funds available, and practice of cross subsidies, all helped services expand quickly. In1980, Planasa covered 42 percent of Brazil’s total population. By 1990, even though the total populationincreased by 23 percent, Planasa’s coverage rose to 57 percent.
Source: Brazil Ministry of Foreign Relations.
The toll road sector can claim Indonesia’s first significant private infrastructure project,the Ciawi– Tanjung Priok link of Jakarta’s inner ring road, which was constructed in themid-1980s. Like many projects that followed, however, this was directly negotiated witha group linked to the Soeharto family. The Government subsequently decided that all tollroads should be developed by the private sector, but stopped short of requiring competitivesolicitation and selection. Although efforts were made later in the Soeharto era to establishcompetitive bidding procedures, these were not implemented in a transparent manner.Politically connected groups continued to secure approval for their unsolicited projects.A recent study, funded by PPIAF,39 has developed comprehensive recommendations forrestructuring the toll road sector, including proposals for improved project packaging andcompetitive tendering, with the specific goal of promoting sustainable private investment.
The Power sector has experienced the highest cost in terms of foregone competitiveopportunities. Indonesia started to explore options for power sector restructuring in 1990as it was embarking on solicitation of proposals for its first IPP project, Paiton 1. At thattime a further five IPP projects had been identified for competitive tendering based onPLN’s least-cost expansion plan, and selection processes had commenced when in 1992Presidential Decree (Keppres) 37/1992 opened the door to a flood of unsolicited proposals.Politically connected local partners were able to ensure that their projects were negotiatedquickly, although aggregate capacity commitments quickly exceeded PLN’s projected needsand plant locations were not consistent with transmission system capacity. In the absenceof competitive tendering, tariffs were high relative to those achieved in countries thatadopted more transparent processes. This was demonstrated when a number of Java IPPprojects were finally tendered, with the offered tariff for Tanjung Jati A being well belowthose previously negotiated for other similar projects.
While the merits of sector restructuring to enable head-to-head competition in generationand in retail supply were recognized, little progress was made and some decisions that
By foregoing competitivepractices, the power sectorin Indonesia missed manyopportunities to lowerpower purchase costs.
62
RestoringPrivate Participation
Averting an Infrastructure Crisis: A Framework for Policy and Action
were taken with regards to the sector have arguably complicated the next steps in theprocess. In 1994, PLN’s Java-Bali generation plants were transferred to two subsidiarycompanies (now Indonesia Power and PJB) with a view to their early privatization.Fortunately the privatization did not proceed as international experience has shown, amongothers, that: (i.) having two dominant generation companies will not enable effectivecompetition; (ii.) restructuring and privatization should desirably start with downstreamretail supply businesses so as to ensure credit-worthy buyers for the Genco’s bulk power;and (iii.) restructuring of partly privatized businesses is usually more difficult thanrestructuring of full SOEs.40 Indonesia Power and PJB continue to be fully owned by PLNand in practice continue to operate more as partners than head-to-head competitors.
Indonesia’s new electric power law, Law 20/2002, recognizes the potential for competitionin generation and supply, and provides for its progressive introduction on a regional basis ascircumstances allow. It also reflects a sound understanding of the principles that shouldguide sector restructuring and specifies preconditions that must be met before a region canbe declared open to competition in generation. These include among others, adequacy ofretail tariffs to provide a commercial return, adequacy of competition in primary energysupply, presence of sufficiently capable and reasonably balanced generators, and adequacyof other parts of the system to support competition. The law also permits regional unbundling,which needs to be implemented with careful consideration to the trade-off that exists betweenbetter accountability to consumers and a reduction of economies of scale.
Government’s program for implementing the new law is contained in its Blueprint publishedin April 2003.41 This outlines a strategy for unbundling the key Java-Madura-Bali (JAMALI)grid into generation, transmission distribution and other businesses so as to enable limitedgeneration-side competition to commence from September 2007.42 PLN for its part hasconducted detailed modeling studies to assess how the unbundling and regrouping of JAMALIgeneration assets might best be handled, although there is as of yet no consensus on theprecise nature and sequencing of the steps to be taken or their timing. Properly designed andimplemented, the efficiency benefits of restructuring should be considerable.43
In summary, Indonesia has so far taken very limited advantage of the benefits thatcompetition can deliver in its infrastructure sectors. While the opportunities for expandinghead-to-head competition are fairly limited, especially in the near term, it is useful toprogressively move towards such a system. In the meantime, competition for the marketshould replace direct negotiation wherever feasible, while benchmarking should bemainstreamed as a mechanism for exerting pressures on incumbent local monopolies toimprove their performance.
Balancing Users and Operators’ Intereststhrough Adequate RegulationCompetent and transparent regulation is a prerequisite for successful private participationin infrastructure, particularly in those sectors and business segments where head-to-headcompetition is possible. Regulation is needed to promote economic efficiency and tocorrect for market failures stemming from participants having excessive market power.Good regulatory institutions improve the investment climate of the sectors they overseeby promoting broader participation, fostering innovations in service provision, and creatingincentives to expand access to customers.
63
Chapter 3The overarching challenge of regulatory policy is to balance economic efficiency andsocial equity in the provision of services. On the one hand, sustainable provision ininfrastructure services requires pricing regimes that allow for reasonable returns oninvestment. On the other hand, ignoring social concerns will risk consumer discontent.Regulators accordingly require a degree of independence from political influences, butneed to also respond to policies of an elected government. In order to achieve this balance,a number of countries have successfully applied formal arrangements that include:
• providing the regulatory agency with a distinct statutory authority, free of ministerialcontrol;
• prescribing in advance the criteria for appointments and mandating the participation ofboth the executive and legislative branches of government in the appointment process;
• appointing regulators for fixed periods and prohibiting their removal, except for clearlydefined due causes;
• funding the agency’s operation with user fees or levies on the regulated industry at alevel that allows adequate remuneration of regulators and their staff.
Measures for holding regulators accountable and their actions transparent include:
• specifying the duties, responsibilities, rights and obligations of regulatory agencies inlaws;
• allowing for judicial review of regulatory decisions;
• mandating reporting and monitoring procedures by legislative oversight committees;
• requiring publication of decisions and allowing for reviews by interested parties.
The use of well-specified contracts for service provision allows for the gradual developmentof regulatory capabilities. Discretion can be limited initially, with emphasis placed onmonitoring and enforcement functions. Explicit policies governing the behavior ofinfrastructure operators in a sector, the scope for competition, and the setting andadjustment of tariffs on the basis of clear and simple formulas, all can narrow the scopeof regulation, reduce regulatory discretion, and prepare the ground for transferring broaderresponsibilities to regulatory bodies as their capacity increases. In the near term, it isevident that regulation through contract will be the likely option in Indonesia, in partbecause there will be comparatively little scope for head-to-competition outside thetelecommunications sector. In sectors such as toll roads and water supply, regulationthrough contract should be considered. It is important that contracts be carefully designedto facilitate the regulatory function and allow for expanded competition in the future.
Indonesia is still in the very early stages of establishing regulatory institutions for itsinfrastructure sectors. The first infrastructure sector law to include reference to non-ministerialregulation was the 1999 Telecommunications Law. The law itself is silent on the matter butthe Elucidation, which is considered part of the law, permits the Minister to delegate hisregulatory powers to a regulatory body without providing further elaboration. There hasbeen strong pressure from the DPR and the industry to establish an embryonic regulatoryagency on the basis of this law, particularly because of the acknowledgement by the DirectorGeneral of Posts and Telecommunication that it lacks the capacity to regulate the industryin its current form. As a result, the Indonesia Telecommunication Regulatory Agency wasestablished by ministerial decree in July 2003. The agency is a hybrid entity which isheaded by the Directorate Generals of Posts and Telecommunications and includes a small
Indonesia is still in the veryearly stages of establishingregulatory institutions for itsinfrastructure sectors.
64
RestoringPrivate Participation
Averting an Infrastructure Crisis: A Framework for Policy and Action
committee of industry professionals. Its powers are limited and there would appear to beno provision for funding needed to employ specialist staff and consultants.
The 2001 Oil and Natural Gas Law and the 2002 Electricity Law in contrast both haveexplicit provisions for the creation of regulatory agencies along lines that are fully consistentwith the principles listed above. In the oil and natural gas sector, the downstream regulatorybody (referred to as Batur) has already been established. The agency, however, is not yetfunctioning as the Law’s implementing Government Regulation on downstream businesses– which will define the licensing and other rules the agency will oversee – has not yet beenissued. Its duties include ensuring competition in the supply of petroleum fuels – a dauntingtask in the absence of any move to restructure Pertamina’s present absolute monopoly – aswell as regulating the transportation of gas by open-access pipeline and the setting of gasprices for small consumers. In the power sector, the Government Regulation on the ElectricityMarket Supervisory Agency (EMSA) has just recently been established but appointments arenot expected to be made until early 2004. This agency will have regulatory jurisdiction onlyin regions declared open to competition, while regulatory authority for non-competitionregions will be shared among the different levels of government. As for oil and natural gas,the implementing Government Regulations that will define EMSA’s duties and powers inmore detail have still to be issued. For both sectors, a priority should be to issue andimplement the regulations, and enable the regulatory agencies to recruit competentprofessionals so they can begin to establish a track-record.
Regulation in water and sanitation poses particular challenges because the sector isfragmented. To be effective, a regulatory system should have a clear demarcation ofresponsibilities among national, provincial or municipal regulators, and sector ministries.When attempting to identify a proper balance between regional and central regulatoryauthority, careful consideration should be given to factors such as the technicalsophistication required, the availability of local expertise at reasonable cost, and theincreased likelihood of industry ‘capture’ as an agency’s jurisdictional scope becomesmore limited. The creation of a single economic regulatory authority for water and sanitationacross the country would greatly simplify the regulatory function. Decentralized actorssuch as municipal governments should preferably be responsible for monitoringperformance, setting local standards, dealing with customer complaints, and moregenerally, for ensuring accountability to local citizens. In the event that there are multipleagencies, a clear assignment of responsibilities and jurisdictions is needed to ensure thatvarious regulatory aspects are consistently regulated by the same agency.
Allocating and Managing RisksInvestors and lenders seek rewards commensurate with perceived risks, but projects becomeuntenable when these risks are too high. Infrastructure projects pose particular risks thatare compounded by an unfavorable overall investment climate. Following the onset ofthe economic crisis, Indonesia has been viewed as a high risk country, with a performanceranking at 138th out of 146 countries surveyed in the 2002 World Investment Report forForeign Direct Investment (FDI). Investors’ main concerns include bureaucratic red-tape,a dysfunctional judicial system, excessive increases in minimum wages, arbitrary impositionof taxes and levies by local governments, and pervasive corruption. Banks have remainedrisk averse and have shown only limited interest in new corporate lending includingfinancing infrastructure projects.
The World InvestmentReport by Foreign DirectInvestment (FDI) ranksIndonesia's risk profile at138th out of the 146 coun-tries surveyed.
65
Chapter 3The Government of Indonesia is committed to improving the investment climate, as illustratedby the measures included in the IMF exit ‘White Paper’. But, changing investor perceptionswill take time and efforts will be needed in the interim to reduce risks at the sector and theproject levels. Previous sections have identified the importance of improving the regulatoryenvironment as well as promoting greater transparency in the project award process. Thesereforms should be complimented with better allocation and mitigation of investment risks.The guiding principle in this process is that risks should generally be borne by the party bestable to assess, control, and manage them (or by the party with the best access to hedginginstruments, greatest ability to diversify the risks, or lowest cost of bearing them).
During the Soeharto era, there was a tendency for the public sector to assume too muchrisk in its contracts with private providers. However, before discussing this aspect furtherit is important to understand the nature of the risks in the individual sectors. The prospectiveinvestors and lenders for the first IPP projects on Java faced formidable challenges. PLNhad the monopoly on supplying power to the public, but no control over its retail tariff.It was subject to direction by Government on its investment planning and also dependedon the public sector for much of its investment financing. PLN did control plant dispatch,but had a vested interest in maximizing the use of their own generation plants. Consequently,IPP developers insisted on robust take-or-pay agreements as a precondition for undertakinginvestments due to concerns that PLN may: (a) over-estimate future demand growth andcommit to excess new generation capacity; (b) fail to sufficiently develop the transmissionsystem to fully utilize the new generation capacity; and (c) fail to prioritize plant dispatchbased on economic merit. Developers also insisted that tariff payments to them bedenominated in US dollars. This measure was taken because investors had to rely onforeign financing since the domestic financial markets were unable to mobilize fundingat the required scale. Another reason was the fact that the primary energy source in manyinstances were either internationally traded (e.g. coal) or priced in foreign currency (e.g.geothermal steam).
If the Government had insisted on tariffs being computed directly inRupiah, as would seem to be implied by Keppres 37/1992, it isunlikely that these projects would have been financed by privateinvestors . Financial closure on Paiton I had already taken over a yearto finalize after the PPA was signed. The Government, during thistime, was firm in resisting pressure from developers to provide anexplicit sovereign guarantee for PLN’s payment obligations, but insteadagreed to sign a support letter compelling PLN to meet their contractualobligations. Could the Government or PLN have negotiated betterterms? The tariffs could have most certainly been better negotiated,by relying on more competitive practices instead of entertainingunsolicited proposals by politically connected investors. It may havebeen difficult, however, to arrange for a more favorable risk sharingarrangement since Paiton I was the first such project. However, itcan be argued that the Government should have negotiated betterterms for subsequent projects instead of relying on the Paiton Iagreement as a model. Although PLN subsequently sought to improvethe risk allocation on some deals, politically connected projectdevelopers were generally effective in being able to obtain favorableterms similar to earlier agreements.
66
RestoringPrivate Participation
Averting an Infrastructure Crisis: A Framework for Policy and Action
As the Government seeks to restore private infrastructure investment, it is useful to assessthe current risks that exist in different sectors. In the power sector, there is evident privateinterest in new IPP projects and in supply of gas to PLN. No IPP projects have yet beenoffered through competitive tender but direct negotiations are in progress on a number ofnew expansion projects. The overall country risk environment remains less favorable than inthe mid-1990s and PLN’s financial situation, though much improved, is still fragile. Passageof the new electricity law is viewed positively by investors, but in the absence of implementingregulations and a credible functioning regulatory agency, there is considerable uncertaintyregarding its likely impact. Meanwhile, the cancellation of the previously agreed 2003fourth quarter power tariff increase has raised concerns about Government’s ability toimplement tariff increases that may be needed in the future. The renegotiation of existingIPP contracts have also made investors nervous. As a result, developers and lenders for newIPP projects are seeking more robust support for PLN obligations than was provided in thepast. Therefore, the question arises as to which risks the Government should bear? There isalso a need to identify the type of support the MOF would be willing to provide to directlynegotiated projects in the absence of a framework and strategy for financing investments inthe sector. Securing early agreement on private financing for a major new generation plantwould undoubtedly help Indonesia’s efforts to avert possible near term power shortages andperhaps also encourage other investors to return. On the other hand, the absence ofcompetitive tendering may provoke justifiable public concerns that power prices will againbe inflated due to non-transparent and politically motivated arrangements .
In the telecommunications sector, the risk situation is more straightforward as there isless government intervention. Investors will determine their expansion needs based onbusiness segments that offer the most attractive and secure returns. This is also based onan expectation that tariffs will remain unchanged in the near-term. Although investmentsinto the sector are expected to continue, it is unlikely that the pace will be sufficient toclose the teledensity gap with neighboring countries. It is likely that investments intorural areas where returns are lower, will also be slow to develop.
Investment prospects in the toll road sector, especially from domestic private investors,appear promising despite the high risks. The Government, however, will have to carefullyselect projects and proceed to address some of these crucial risks. Key issues include theregulatory risks related to the setting of initial tariffs and their subsequent adjustment, andto the multiple roles of Jasa Marga. Land acquisition also poses serious risks in the absenceof an effective eminent domain mechanism. Financing risks could be reduced by packagingthe development of new links with concessions to operate adjoining links that alreadygenerate a solid cash flow. It will also be important to award contracts through transparentand competitive tendering as the toll road sector in Indonesia is perceived to be corrupt.
The water supply sector presents the most complex challenges. Regional governmentscontinue to extract cash from PDAMs in the form of ‘dividends in advance’ despite mostutilities incurring losses. PDAMs are best able to assess, control, and manage operationalrisks since they are closest to the end user but they bear only a small part of the cost ofpoor performance. Their main source of financing is in the form of loans from the centralgovernment, and over 60 percent of the more than 400 loans are in arrears. The centralgovernment retains all the contingent liabilities which gives PDAMs and regionalgovernments little incentive to manage in a financially sustainable manner. In suchcircumstances, private investors will be extremely reluctant to accept commercial risks,and therefore, would not be keen to enter into downstream contracts.
Although an electricity lawhas been passed, the imple-menting regulations anda credible regulatory agencyhave yet to be established.
Investment prospects in thetoll road sector appear prom-ising despite high risks.
67
Chapter 3
Public Support for Private ProjectsPublic support for private infrastructure projects can improve economic efficiency byremedying market failures, including those attributable to Government’s own actions, andby helping to achieve distributional objectives such as extending services to poorcommunities.44 As used here, public support involves the provision of some form of director indirect subsidy from a government budget whose level is just sufficient to enable aservice to be provided on a commercially viable and sustainable basis by an efficient privateoperator. Such public support should be distinguished from forms of public participationthat are expected to yield satisfactory financial returns for the providing entity.
Indonesia has often viewed infrastructure services as being provided exclusively by eitherthe public sector or through private providers. The basic road network is seen as a publicgood and has been financed entirely from government budgets, while toll roads are seen asprivate and are expected to be financed entirely by the private sector. The concept of public-private partnerships recognizes, however, that there can be merits in involving privateinvestors and operators in the provision of public services. These options may not becommercially viable, and therefore may not attract private financing or be sustainable throughuser tariffs. By way of example, two options for increasing road capacity in an alreadyheavily congested arterial corridor may be to either widen the existing public road or todevelop a new restricted access road. Analysis may show that building the more costly newroad is preferable on economic grounds when all externalities are considered, but
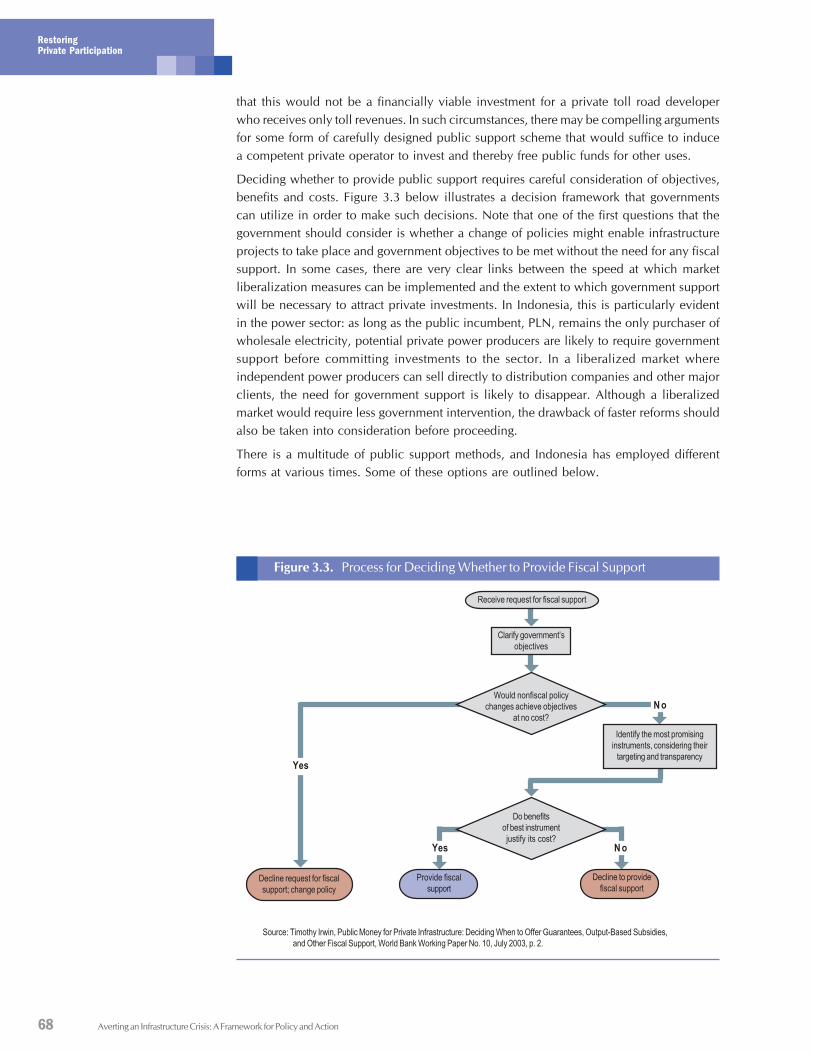
68
RestoringPrivate Participation
Averting an Infrastructure Crisis: A Framework for Policy and Action
that this would not be a financially viable investment for a private toll road developerwho receives only toll revenues. In such circumstances, there may be compelling argumentsfor some form of carefully designed public support scheme that would suffice to inducea competent private operator to invest and thereby free public funds for other uses.
Deciding whether to provide public support requires careful consideration of objectives,benefits and costs. Figure 3.3 below illustrates a decision framework that governmentscan utilize in order to make such decisions. Note that one of the first questions that thegovernment should consider is whether a change of policies might enable infrastructureprojects to take place and government objectives to be met without the need for any fiscalsupport. In some cases, there are very clear links between the speed at which marketliberalization measures can be implemented and the extent to which government supportwill be necessary to attract private investments. In Indonesia, this is particularly evidentin the power sector: as long as the public incumbent, PLN, remains the only purchaser ofwholesale electricity, potential private power producers are likely to require governmentsupport before committing investments to the sector. In a liberalized market whereindependent power producers can sell directly to distribution companies and other majorclients, the need for government support is likely to disappear. Although a liberalizedmarket would require less government intervention, the drawback of faster reforms shouldalso be taken into consideration before proceeding.
There is a multitude of public support methods, and Indonesia has employed differentforms at various times. Some of these options are outlined below.
Decline request for fiscalsupport; change policy
Do benefitsof best instrumentjustify its cost?
Decline to providefiscal support
Provide fiscalsupport
Yes
Yes N o
Figure 3.3. Process for Deciding Whether to Provide Fiscal Support
Receive request for fiscal support
Clarify government’sobjectives
Would nonfiscal policychanges achieve objectives
at no cost?
Identify the most promisinginstruments, considering their
targeting and transparency
N o
Source: Timothy Irwin, Public Money for Private Infrastructure: Deciding When to Offer Guarantees, Output-Based Subsidies,and Other Fiscal Support, World Bank Working Paper No. 10, July 2003, p. 2.
69
Chapter 3Output-Based Aid (OBA)45
Indonesia has long supported the delivery of public services by subsidizing inputs to theirproduction. PLN and public transport operators continue to benefit from subsidized fuel,while the state-owned rail and bus companies have previously depended on the Governmentto provide rolling stock and vehicles as equity. Such subsidies have been largely ineffectivein achieving many of their objectives, partly because they were poorly targeted towards theintended beneficiaries. These subsidies also reduced the incentive for more efficient operations.For example, the subsidy on diesel has mostly benefited private truckers rather than poorconsumers. Cheap fuels also reduce incentives for better engine maintenance. Moreover,some input subsidies have caused significant market distortions, such as PLN’s preferenceto utilize highly subsidized diesel fuel instead of more economically efficient fuels.
Many governments are now turning to output-based subsidies to achieve their developmentalobjectives and Indonesia has also started to move down this path. The compensation paidto PLN for supplying power to very small customers at sub-commercial tariffs is oneexample. Another is the public service obligation (PSO) scheme adopted for PTKA’seconomy class passenger services, although this is not yet fully implemented.
In order to derive maximum benefits from output-based subsidy schemes, public authoritiesmust design them properly. In particular, the intended beneficiaries must be clearly identifiedand the service to be provided must be very precisely defined. It is essential that competitionbe introduced between the different service providers. Monitoring and evaluationarrangements must also be carefully designed to ensure payments are made on the basis ofcontracted outputs that are actually delivered to consumers. These points will be discussedagain in Chapter 5 when highlighting the government’s financial interventions in favor ofpoor infrastructure users.
Capital ContributionsOne of the simplest means by which Government can support an investment project is bycontributing capital as an equity infusion or by providing a loan at market or subsidizedrates. By participating in financing the investment, the government takes a direct stake inits success, which in turn may help reinforce tariff discipline. However, caution is neededto ensure that private equity investors provide a sufficient proportion of the financing soas to fully commit to the success of the venture.
Making up-front capital contributions to private infrastructure investments will be politicallydifficult for Indonesia in the current budget-constrained environment given the competingclaims of other sectors. While Government could in principle raise money through capitalmarkets, such public sector borrowing may “crowd out” other private investments by raisinginterest rates. It could also resort to borrowing from international financial institutions,with the incurred sovereign debt being invested as equity or on-lent as a project loan.However, this would also squeeze out borrowing for other purposes at the margin.
Contingent FinancingInfrastructure developers often look to Governments to share the risk burden of investments.Such requests most commonly concern risks related to Government’s own political orregulatory actions, such as expropriation or refusal to implement a tariff adjustment inaccordance with contractual provisions. For Indonesia, PLN payment risk has long been akey issue for both IPPs and gas suppliers. Elsewhere, project developers have sought andobtained traffic guarantees for toll roads and other transport infrastructure projects.
Output-based subsidies sup-port PLN charge sub-com-mercial tariffs for very smallelectricity customers.
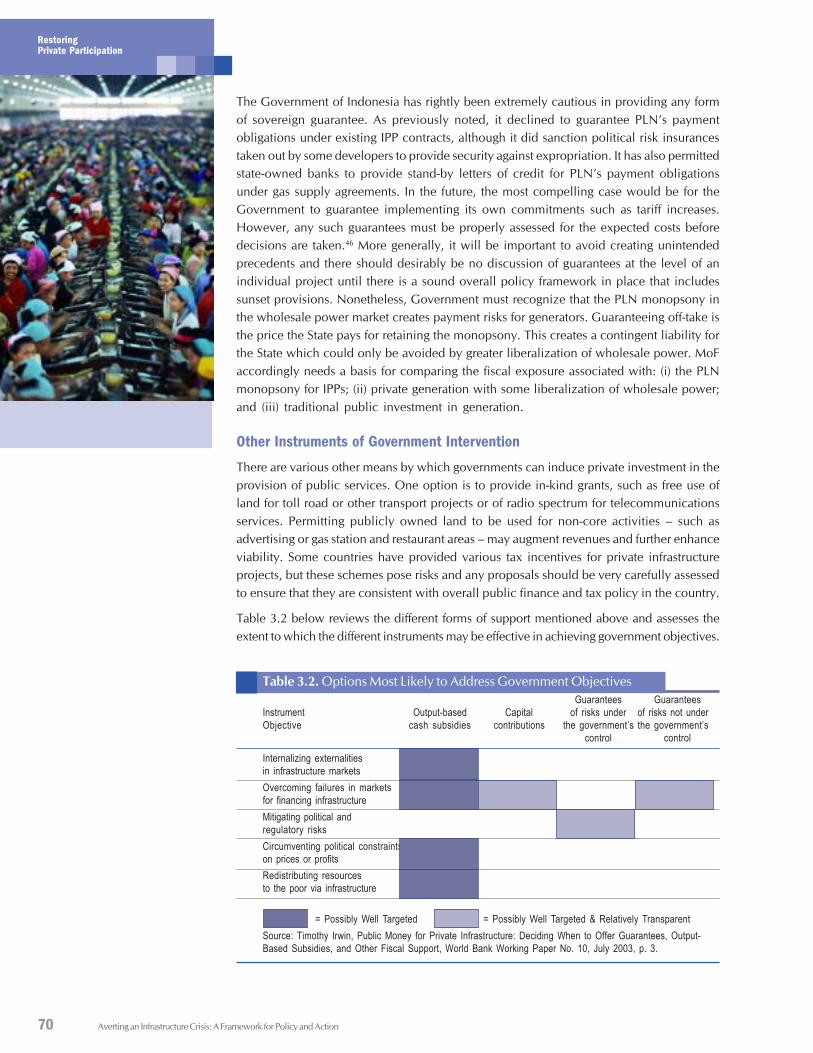
70
RestoringPrivate Participation
Averting an Infrastructure Crisis: A Framework for Policy and Action
The Government of Indonesia has rightly been extremely cautious in providing any formof sovereign guarantee. As previously noted, it declined to guarantee PLN’s paymentobligations under existing IPP contracts, although it did sanction political risk insurancestaken out by some developers to provide security against expropriation. It has also permittedstate-owned banks to provide stand-by letters of credit for PLN’s payment obligationsunder gas supply agreements. In the future, the most compelling case would be for theGovernment to guarantee implementing its own commitments such as tariff increases.However, any such guarantees must be properly assessed for the expected costs beforedecisions are taken.46 More generally, it will be important to avoid creating unintendedprecedents and there should desirably be no discussion of guarantees at the level of anindividual project until there is a sound overall policy framework in place that includessunset provisions. Nonetheless, Government must recognize that the PLN monopsony inthe wholesale power market creates payment risks for generators. Guaranteeing off-take isthe price the State pays for retaining the monopsony. This creates a contingent liability forthe State which could only be avoided by greater liberalization of wholesale power. MoFaccordingly needs a basis for comparing the fiscal exposure associated with: (i) the PLNmonopsony for IPPs; (ii) private generation with some liberalization of wholesale power;and (iii) traditional public investment in generation.
Other Instruments of Government InterventionThere are various other means by which governments can induce private investment in theprovision of public services. One option is to provide in-kind grants, such as free use ofland for toll road or other transport projects or of radio spectrum for telecommunicationsservices. Permitting publicly owned land to be used for non-core activities – such asadvertising or gas station and restaurant areas – may augment revenues and further enhanceviability. Some countries have provided various tax incentives for private infrastructureprojects, but these schemes pose risks and any proposals should be very carefully assessedto ensure that they are consistent with overall public finance and tax policy in the country.
Table 3.2 below reviews the different forms of support mentioned above and assesses theextent to which the different instruments may be effective in achieving government objectives.
Table 3.2. Options Most Likely to Address Government ObjectivesGuarantees Guarantees
Instrument Output-based Capital of risks under of risks not underObjective cash subsidies contributions the government’s the government’s
control control
Internalizing externalitiesin infrastructure marketsOvercoming failures in marketsfor financing infrastructureMitigating political andregulatory risksCircumventing political constraintson prices or profitsRedistributing resourcesto the poor via infrastructure
= Possibly Well Targeted = Possibly Well Targeted & Relatively TransparentSource: Timothy Irwin, Public Money for Private Infrastructure: Deciding When to Offer Guarantees, Output-Based Subsidies, and Other Fiscal Support, World Bank Working Paper No. 10, July 2003, p. 3.
71
Chapter 3In addition to assessing the accuracy and transparency of different instruments, governmentsalso need to be able to estimate their costs. Estimating the overall cost of providingsupport to infrastructure projects may present some degree of difficulty when such supportdoes not take the form of a cash subsidy (to calculate the cost of in-kind grants, one needsto assess their opportunity costs for example), when support is pledged for a long periodof time (questions may arise as to the appropriate value of the discount rate), and whenthe actual level of support needed depends upon uncertain events (for example, in orderto assess the cost of a capital contribution by the government, one has to estimate theexpected returns on the capital invested; the cost of a government guarantee, for its part,will depend upon the probability that the risk will be called). In addition, once a decisionhas been made to provide a given form of support, government accounting processes areusually ill-designed to track the cost of that obligation over time. Indonesia’s budget, forexample, will reflect the expected cost of direct cash subsidies. In the absence of accrualaccounting, it will not, on the other hand, reflect the opportunity cost of in-kind grants orthe expected cost of uncertain forms of support such as guarantees. A variety of techniqueshave, however, been developed to estimate the cost of such obligations. The cost for thegovernment of providing debt to a project can be calculated by comparing the conditionsof the loan with those that are imposed by commercial lenders for similar projects; thecost of an equity contribution can be estimated by using models, such as the capital-assetpricing model (CAPM), that estimate the appropriate compensation for bearing risk; andsince granting a guarantee is generally equivalent to granting a put option to the beneficiary,the cost of such instruments can be estimated through the use of option pricing techniques.Some countries, such as Columbia, are using such techniques to estimate the cost ofpublic support to infrastructure projects and are incorporating the results in their budgetprocesses, as described in more detail in Box 3.2.
Box 3.2. Assessing the Fiscal Impact of Colombian GovernmentGuarantees
In the mid 1990s, the government of Colombia undertook an innovative project to measure the expected fiscalcosts of the risks it bore in three private infrastructure projects: the El Cortijo–El Vino toll road, atelecommunications joint venture, and a power-sector project.Using techniques developed to price financial options, the study simulated possible outcomes in eachproject, by making assumptions about the way the key variables evolved over time (for example, do theyroughly follow a random walk or do they have a tendency to revert to a mean), the expected growth ratesof those variables, and their variability.In the case of the toll-road, for example, the government had given a guarantee that would top-up the privateoperator’s revenue if traffic fell below a certain level. By making assumptions about the evolution of trafficvolumes, their expected growth, and volatility, the study estimated that the government could expect to payabout $3 million as a result of the guarantee. The study also identified that the government bore someconstruction-cost risk in the toll-road project and estimated that the government could expect to pay about $1million as a result.In the power-sector project, on the other hand, the government’s biggest exposure to risk came fromguaranteeing the obligations of a financially precarious state-owned utility that had agreed to purchase theoutput of the private generator. If retail electricity prices were too low to pay for the wholesale power, thegovernment would have to step in. The study estimated the expected cost of these obligations at about $52million.Since then, the government has introduced a general policy requiring the identification and quantification ofguarantee obligations, and government agencies entering into guarantees must now make up-front paymentsto a “contingent fund” to cover the estimated cost of the liabilities. The Colombian debt-management officemust approve the method used to quantify the liabilities.
Source: Timothy Irwin, Public Money for Private Infrastructure: Deciding When to Offer Guarantees, Output-Based Subsidies, and Other Fiscal Support, World Bank Working Paper No. 10, July 2003, p. 20.
72
RestoringPrivate Participation
Averting an Infrastructure Crisis: A Framework for Policy and Action
Finally, the identity, incentives and information of those in charge of making decisionson public support will be key determinants of the quality of such decisions. It is important,for example, to ensure that those who have an interest in minimizing the costs ofgovernment support are involved in the decision-making process alongside those whohave an interest in ensuring that a particular project is undertaken. It is important as wellto ensure that key tradeoffs between different forms of support are considered prior totaking decisions. This in turn means that decision makers must have the authority toconsider such trade-offs (e.g. to determine whether policy reforms alone could enable avaluable project to go forward, or whether fiscal support is needed and if so what specificinstrument would be most appropriate) as well as expertise on a wide range of optionsthat is needed to make informed decisions. One practical recommendation for Indonesiawould be to ensure that the Ministry of Finance – which has incentives to minimize thecost of government support to infrastructure and the broad perspective needed to assesstrade-offs between different options - is involved in key decisions affecting the supportthat the Government provides to infrastructure projects. South Africa, for example, hasimplemented such a model, as described in Box 3.3 below.
Box 3.3. South Africa – Taking into Account Public Expenditure Impactof Public-private Partnerships in Infrastructure
Some countries have recognized the links between private participation in infrastructure (PPI) and publicexpenditure reform, and made PPI programs explicit and important components of their broader publicexpenditure reform programs. The South African Government, for example, has established a specialist PPIUnit in its National Treasury, thereby ensuring that the ministry with overall fiscal oversight is also responsiblefor driving implementation of PPI. In fact, PPI has been brought into the ambit of the country’s medium termexpenditure framework (MTEF), and sector ministries are expected to demonstrate how risks are to bemanaged, performance measured and value for money maximized in their large infrastructure projects andprograms, if they are to be approved in their MTEF budgets. Increasingly, this has meant that sectorministries have had to incorporate PPI options for infrastructure projects at the planning stage, many of whichhave moved into procurement and implementation phases as PPI models. Interestingly, as the sectorministries have become more comfortable with the approach, private participation has expanded fromtraditional infrastructure projects to include social programs in sectors such as health and education.
Source: Michael Schur, World Bank
73
Chapter 3RecommendationsIf Indonesia is to develop its infrastructure at the pace needed to support rapid economicgrowth, maintain international competitiveness, and quickly improve service coverageand access, it will need to mobilize large scale private sector participation in the keysectors on a sustainable and efficient basis. This will require concerted and carefullycoordinated efforts to develop and implement a sound over-arching strategy. The keyelements of such a strategy should ideally include:
• Defining, publishing and socializing basic goals and policies for private participation;
• Developing sector-by-sector plans for restructuring and promoting competition, withcompetitive tendering being adopted as the norm for all new PPI projects andbenchmarking being mainstreamed as a means of pressuring local monopoly businessesto improve their performance;
• Completing the process of sector law revision, accelerating the issue of implementingregulations, and moving ahead with establishing and empowering non-ministerialregulatory agencies;
• Developing a carefully prioritized and systematic plan for reducing risk perceptions,which include streamlining procedures, a better documenting and communicatingpolicy, and regulatory achievements.
• Completing and issuing the amended Keppres 7 and supplementing it with a soundpolicy framework on public support for private projects. Such a framework shouldensure that the implications of all possible alternatives (including the adoption ofpolicy and market reforms that might eliminate the need for public support) are dulyconsidered. This in turn requires that the authorities with the mandate and incentivesto carefully consider such issues are key participants in the decision-making process.Finally, the cost of government support needs to be adequately estimated and reflectedin budgets.
• Developing a comprehensive plan to restore tariffs to cost-reflective levels and toexplain the rationale for increases to the public.
• Investing in building capacity as part of the process of empowering government agenciesto respond to the challenge of dealing efficiently with private infrastructure developers,and communicating effectively with the public regarding PPI issues.

Averting an Infrastructure Crisis: A Framework for Policy and Action74
Getting a Gripon Corruptionc
ha
pte
r4

75
Transparency International’s (TI) latest Corruption Perceptions Index,published in October 2003, ranks Indonesia in 122nd place out of 133countries assessed. Its rankings are based on survey data from businesspeople, academics and risk analysts in various countries. Singapore wasranked 5th, Hong Kong was ranked 14th , Malaysia 37th, China 66th,Thailand 70th, Philippines 92nd, and Vietnam 100th. In short, Indonesiacompared poorly with regional competitors.
TI’s 2003 complementary International Global Corruption Barometer(GCB) survey47 of 47 countries indicates that almost 80 percent ofIndonesians believe corruption affects political life very significantly. Whenasked to nominate just one of eleven institutions from which they wouldmost like to eradicate corruption, an overwhelming 33 percent selectedthe judicial courts. A further 16 percent identified political parties, while11 percent indicated public utilities, and 10 percent suggested the policeforce. Over 55 percent of Indonesians perceived that corruption affectsthe culture and values of society in a significant manner, and 33 percentsaid that it affects their personal and family life. Interestingly only 16 percentviewed corruption affecting the business environment in a significant way,suggesting their perception that businesses manage to pass on these coststo consumers. This assessment is broadly in line with various surveysreported in the domestic press and with anecdotal information. Althoughthe country-specific data are not available, the GCB survey also confirmsthat the poor suffer disproportionately as a result of corruption. Thosesurveyed in Indonesia did feel optimistic, however, that the situation wouldimprove, with about 55 percent expecting corruption to decrease in thefuture.
Almost 80 percent ofIndonesians surveyed believecorruption has significantimpacts on political life.
76
Getting a Gripon Corruption
Averting an Infrastructure Crisis: A Framework for Policy and Action
While post-Soeharto governments have accorded high priority to eradicating corruption,collusion and nepotism (KKN), there is little indication that their efforts to date have hadany significant impact. Indonesia’s corruption score of 1.9 in the TI 2001 CorruptionsPerception Index did not improve in the 2003 survey, and very few countries scoredlower. There is a clear perception among business professionals that corruption is becomingmore diffused and ‘less effective’ in terms of it providing protection or delivering intendedoutcomes. It appears that corruption during the Soeharto era was more structured andsystematic as compared with the present decentralized environment in which many differentagents extract rents from businesses.
Many have looked to decentralization as a means of promoting increased accountability.Decentralization brings those responsible for public service delivery much closer to users,thus increasing the scope for users to discipline decision-makers for poor performance orcorruption. It is much too early to assess whether this will happen in Indonesia and theinformation currently available does not provide a clear and consistent assessment. Manypress reports as well as the central government often suggest that local officials are usingtheir new responsibilities towards corrupt ends. This is confirmed by BPK audit results,which suggest a worrisome trend in both local and provincial levels. However, theGovernance and Decentralization Survey (GDS), conducted by Gajah Mada University inmid-2002 in 177 regions, showed that a large majority of households believes that thelevel of theft, bribes and, illegal levies has remained the same as before decentralization.However, this may simply reflect trends in bribes paid by households rather than byinvestors. This survey also showed that the general public perceives the incidence ofcorruption to be highest in government procurement.
The infrastructure sectors have long been fertile territory for corruption in both developedand developing countries. While public interest tends to be most easily captured byreports of malfeasance in the implementation of mega-projects, opportunities for extractingrents are abundant – and exploited – in most facets of infrastructure provision. The coststo the economy and society can be enormous and unsustainable. This chapter provides abrief description of corruption as it affects the infrastructure sectors in Indonesia and
outlines what Government is and could be doing to address theseissues. The latter discussion focuses on remedial actions that arereasonably specific to infrastructure provision and does not delveinto broader fields such as reform of the judicial system.48
This chapter is limited to describing practices that provideopportunities for corruption and to illustrating how these have beenexploited. In describing such generic practices or activities there isno intention to suggest that any specific project that might fit withinthe broad characterizations has been subject to corrupt activity.
Anatomy of Corruption in the InfrastructureSectorsOpportunities for corruption arise at most stages of the infrastructureproject cycle, starting with project identification and continuingthrough the implementation and operation phases. While themodalities can differ in some respects depending on whether theproject developer is public or private, the basic practices are broadlysimilar.
After decentralization, cor-ruption is perceived as morediffused and pervasive.
Infrastructure has long beenfertile territory for corrup-tion.
77
Chapter 4Identifying ProjectsInfrastructure projects should be properly identified, defined and prioritized through soundlybased planning and programming processes. In practice, project identification can provideopportunities for corruption in both public and private sector projects. In the publicsector, the most significant opportunities involve procurement by SOEs and governmentagencies of highly specialized products from overseas. Local agents often offer inducementsto generate orders, while suppliers arrange for the necessary financing. Once such ‘supplierdriven’ orders are approved, deals can be made at marked-up prices since the combinationof narrow technical specifications and financing tied to the suppliers preclude effectivecompetition. Such schemes are most easily arranged in sectors, such as railways, powerand telecommunications, which utilize highly specialized mechanical and electricalequipment whose specifications can be tailored to fit the products of a particular supplier.They can be particularly inefficient since they tend to result in over-purchasing as well asover-pricing. By providing financing for important but weak domestic industries, donor/exporters may be inadvertently facilitating such corrupt practices.
There are some indications that such practices may be declining among SOEs that aresubject to meaningful market pressures. This is particularly the case among those SOEsthat have been partly privatized or permitted to seek financing from banks and the domesticcapital market. The series of SOE performance audits commissioned by MOF may alsohave contributed by highlighting deficiencies in the planning and project identificationprocesses. However, anecdotal information suggests that the problem still persists andthat domestic banks may now be playing a larger role in financing such schemes.
In the case of private provision, unsolicited proposals provide clear opportunities forcorruption, as developers define the project they wish to undertake. During the Soehartoera, a local partner’s political connections or financial pay-offs would often ensure thatits proposal would be quickly approved. Where formal review procedures existed, forexample in the power sector, these normally would be followed. Thus, for example,sponsors of a number of unsolicited IPP projects were able during the mid-1990s tosecure Letters of Preliminary Approval notwithstanding objections from some seniorministers. It should be noted in this context that the interest of connected local firms toparticipate in projects promoted by international developers may be enhanced by ‘carriedinterest’ arrangements under which the international developers would finance the equityparticipation of the local partners and be repaid from the project’s dividend stream.
In principle, unsolicited proposals can contribute to sound infrastructure developmentprograms by enabling the private sector to provide innovative solutions for meetinginfrastructure needs. Many countries have explicit procedures for handling such proposalswithin their planning processes. However, a number of unsolicited proposals submittedfor power, transport and water supply projects in Indonesia have not included any specialinnovative merit while many have been inconsistent with current sector and spatialdevelopment plans and policies.
Awarding and Negotiating ContractsIndonesia’s public procurement system, which encompasses the processes of preparingspecifications, inviting bids, selecting winners, and negotiating contacts, is widely believedto be the principal source where public funds are illegally extracted. Infrastructureprocurement make up a major share of the approximately $7 billion total annual goods,
Unsolicited proposals forinfrastructure developmenttend to be driven by privateinterests rather than thecommon good of the public.
78
Getting a Gripon Corruption
Averting an Infrastructure Crisis: A Framework for Policy and Action
works and services procured by government and state enterprises. The amount that isextracted through corrupt practices may be as high as 30 percent.
Indonesia’s current public procurement regulations are defined in Keppres 18/2000, whichapplies to purchases under all government budgets. In addition the 1999 ConstructionLaw includes provisions that relate specifically to procurement of civil works and relatedconsulting services. There is no single organization that is formally responsible fordevelopment and implementation oversight of procurement policy, but by default thisrole has been shared by Bappenas and Kimpraswil. Government procurement is managedby Project Managers (Pimpros), who are selected by a senior official of the implementingagency (e.g. the Secretary General of a sector department). Pimpros in turn appoint TenderCommittees to manage the procurement process from its inception through to contractaward. The positions on these ad hoc committees, which usually have 5 or more members,are generally filled by staff from the more junior ranks of the civil service.49
Keppres 18/2000, while an improvement on previous decrees, is weak in several importantrespects. Perhaps most importantly, it facilitates a restricted level of competition because it:
• calls for “fair competition” among firms of “equal standing”, thereby allowing subjectivejudgments to be made on which firms will qualify;
• permits preferential treatment for local small and medium enterprises for contractsbelow certain values, thus contravening the ‘one-country : one-market’ principle andprecluding the benefits of nation-wide competition;
• provides considerable discretion to use less-than-fully-competitive procurementmethods such as “shopping” and “direct contracting”;
• establishes ‘soft’ requirements for advertising or announcing tenders (or contractawards).
Keppres 18/2000 also fails to establish procedures to handle complaints from aggrievedbidders or apply mandatory sanctions for firms and officials found guilty of colluding orpartaking in other malpractices.
Public procurement is administered in an environment that provides limited rewards forefficiency and honesty or penalties for corruption. Collusion between officials andcontractors is widespread , with the more commonly employed practices being:
• Restrictive specifications.As noted earlier, specifications for certain types of public procurements can be tailoredto fit those of a particular manufacturer’s product. This is most easily done for complexand highly specialized equipment where a carefully written specification mighteffectively rule out all but a favored supplier. For example, requiring a particularprocessor configuration for railway or traffic signals may greatly constrain the numberof bidders. However, there have also been instances of government agencies issuingtechnical guidelines for commonly purchased items, such as vehicles, that have beentaken directly from a particular manufacturer’s brochure. It is also possible to structurethe specifications for straightforward civil works packages so as to create opportunitiesfor corruption. This may involve deliberately under-scoping certain types of work soas to create opportunities for profitable contract amendments during implementation.50
• Restricting bidders.Many techniques have been used to discourage or prevent meaningful competition inthe bidding process and thereby facilitate collusion between officials and one or more
Infrastructure make up amajor share of the US$7 bil-lion annually procured by thepublic sector - making it aprime target for corruptpractices.
The current PresidentialDecree (Keppres 18/2000)governing procurement is animprovement over previousdecrees, but is still weak inpromoting competition.
79
Chapter 4favored bidders. The more common practices include dividing works or procurements— for example, sections of road works, into very small packages, limiting or otherwisemanipulating bid advertising, shortening bid submission periods, and manipulatingpre-qualification processes. Thus, for example, road works are commonly sliced upinto small sections so as to discourage or preclude large contractors from bidding,while the World Bank has many times received copies of procurement noticessupposedly placed in phony newspapers. Likewise pre-qualification has commonlybeen employed as a pre-registration system for limiting participation to a small groupof colluding bidders. Such practices allow all bidders to submit over-priced bids,with the winner sharing its excess profits with the project management and otherbidders. Recent investigations have shown that local branches of business associations,such as the Contractors Association (Gapensi), often play an ambiguous role in suchcollusive efforts.
• Fixing the evaluation.
When some of the previously mentioned practices are not successful, tendercommittees may find themselves under pressure to reject one or more firms that haveunder-bid the favored contractor. This should in principle be difficult under procedureswhere the firm submitting the lowest priced conforming bid is declared the winner.However, there have been numerous instances when tender committees disqualifylow bids as being unresponsive for inconsequential typing and other minor errors andomissions. While many such attempts have been thwarted, especially under foreign-financed projects, it is likely that many others are undetected and cost the governmentsubstantial amounts of money.
An illustration of the systematic nature of such practices is provided in Box 4.1, whichsummarizes pertinent findings of a recent fiduciary review by the World Bank of theSecond Sulawesi Urban Development project.51
Box 4.1. Procurement in the Second Sulawesi Urban DevelopmentProject:
A fiduciary review of the procurement processes for a sample of 26 contracts financed by the World Bankunder the Second Sulawesi Urban Development Project revealed evidence of manipulation designed to givethe appearance of competition. The winners appear to have been pre-selected in most cases. The reviewfindings, which covered procurements in four cities, included :• The participation of a large number of companies within a single ownership cluster suggests the creation
of “shell” companies. A “shell” company involves the appointment of nominal directors who are withoutany real organizational powers or functions, and merely sign documents on behalf of the company.
• The similarities between the bid proposals of the winning and losing bidders are consistent with thepossibility of government officials having pre-arranged winners. Certification from the industry association,GAPENSI, was a condition of participation in the bidding process and all bidders were indeed GAPENSImembers. Similarities between bid prices were indicative of the bidders having access to the unit pricedetails of the Owner’s Estimate in advance of preparing their bids.
• The contents of the bid documents indicate that bidders were not individually represented at the pre-qualification or bid selection meetings but rather that a single representative acted for multiple companies.This is consistent with the finding that companies from the same ownership cluster submitted the winningand losing bids for the same package.
• Instances were noted where the most competitive bidder was excluded from further evaluation. This isconsistent with the possibility that administrative or weak technical grounds were found to excludecompetitive bidders from the selection process.
World Bank Office, Jakarta
80
Getting a Gripon Corruption
Averting an Infrastructure Crisis: A Framework for Policy and Action
As noted in Chapter 3, Indonesia has comparativelylittle experience in soliciting and evaluating competingproposals for private sector participation projects sincemost of these in Indonesia have been unsolicited ordirectly negotiated. There have, however, been a numberof important exceptions – including in the power andtoll roads sectors – where proposals have been solicitedthrough reasonably well-designed processes on the basisof carefully prepared bidding documents. One notableexample was the Tanjung Jati A 1,300 MW coal-firedIPP project, which attracted bids from severalinternational consortia and yielded a tariff significantlylower than those for similarly sized plants that werenot awarded through fully competitive processes.52 Itis worth noting in this context that raising the tariff fora large IPP base-load plant by just one-tenth of a UScent per kWh will increase its annual revenues byseveral million US dollars.53 In the absence of effectivecompetition, those negotiating on behalf of the publicsector often have no meaningful benchmarks on whichto assess the minimum feasible tariff level. Thechallenges are far more complex, for example, ininvestments such as integrated urban toll roads andlight rail projects than for an IPP plant for which someindicative capital cost and tariff benchmarks areavailable. As the scope for inflating prices increases,opportunities for corrupt practices also expand.
Financing the InvestmentFor conventional public sector projects, the source offunding can have an important bearing on theopportunities for corrupt practices inasmuch as it mayinfluence the scope for effective competition andincrease or diminish the prospects for stringentsupervision. Thus, for example, at the sub-national level,it may be easier to inhibit competition when a projectis financed entirely from the region’s own discretionaryAPBD resources than when it is financed with, say,conditional Special Allocation grants (DAK) from theAPBN. Thus, under the DAK, recipients are required to follow technical guidelines set bythe respective sector ministries, with project implementation also being subject tomonitoring and evaluation by the center. In the case of road projects, the 2003 DAKconditions require the use of nationally approved planning and implementation guidelinesand standards, while the education sector has gone much further by requiring publicparticipation and oversight of school rehabilitation works through the involvement ofregional education boards in project prioritization and school committees and localcommunities in project implementation.
The contract for Tanjung Jati,a 1,300 MW power plant,was awarded through a com-petitive process, and yieldeda significantly lower tariffthan other unsolicited invest-ments.

81
Chapter 4
Involvement of external financiers can have both positive and negative impacts. Internationalagencies such as World Bank and ADB have fiduciary obligations that require them to usetheir best efforts to ensure that all project components are designed appropriately and thatgoods, works and services are procured competitively and transparently and implementedproperly. This task is relatively straightforward for projects involving, for example, theconstruction of high voltage power transmission lines but extremely challenging in thecase, for example, of projects involving large numbers of small and geographically scatteredurban infrastructure investments. Thus, the former might involve just a handful of largevalue packages with precise performance specifications capable of attracting intense
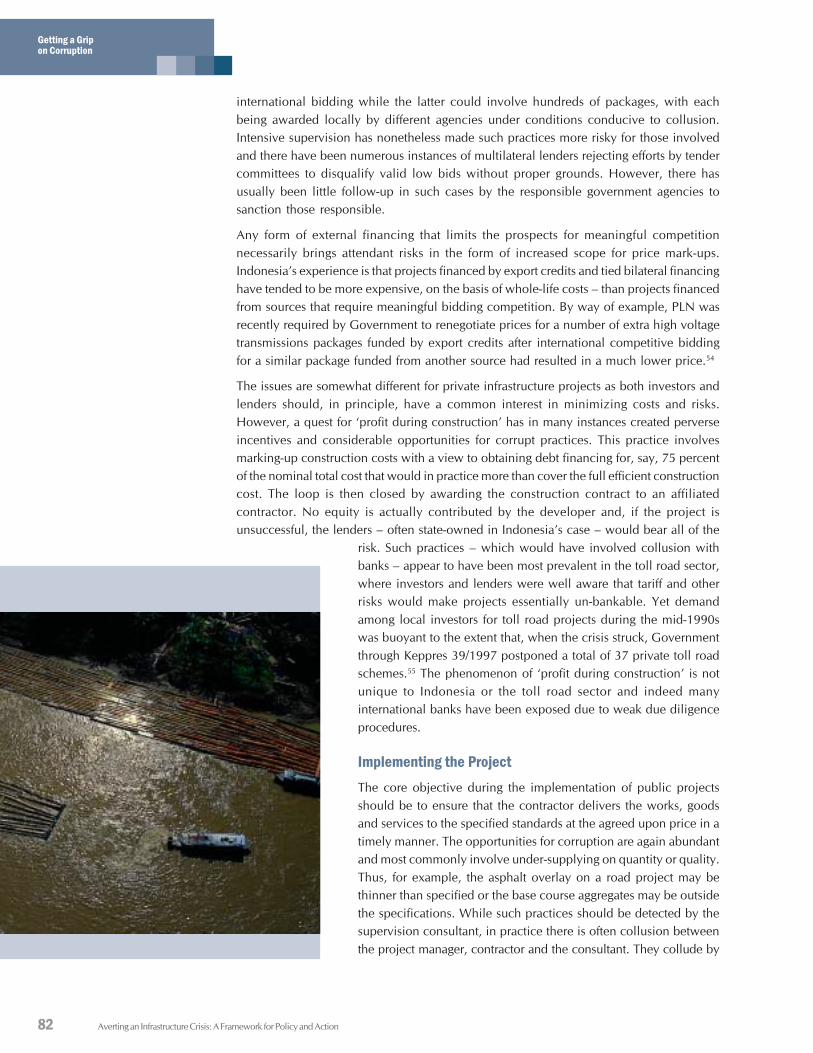
82
Getting a Gripon Corruption
Averting an Infrastructure Crisis: A Framework for Policy and Action
international bidding while the latter could involve hundreds of packages, with eachbeing awarded locally by different agencies under conditions conducive to collusion.Intensive supervision has nonetheless made such practices more risky for those involvedand there have been numerous instances of multilateral lenders rejecting efforts by tendercommittees to disqualify valid low bids without proper grounds. However, there hasusually been little follow-up in such cases by the responsible government agencies tosanction those responsible.
Any form of external financing that limits the prospects for meaningful competitionnecessarily brings attendant risks in the form of increased scope for price mark-ups.Indonesia’s experience is that projects financed by export credits and tied bilateral financinghave tended to be more expensive, on the basis of whole-life costs – than projects financedfrom sources that require meaningful bidding competition. By way of example, PLN wasrecently required by Government to renegotiate prices for a number of extra high voltagetransmissions packages funded by export credits after international competitive biddingfor a similar package funded from another source had resulted in a much lower price.54
The issues are somewhat different for private infrastructure projects as both investors andlenders should, in principle, have a common interest in minimizing costs and risks.However, a quest for ‘profit during construction’ has in many instances created perverseincentives and considerable opportunities for corrupt practices. This practice involvesmarking-up construction costs with a view to obtaining debt financing for, say, 75 percentof the nominal total cost that would in practice more than cover the full efficient constructioncost. The loop is then closed by awarding the construction contract to an affiliatedcontractor. No equity is actually contributed by the developer and, if the project isunsuccessful, the lenders – often state-owned in Indonesia’s case – would bear all of the
risk. Such practices – which would have involved collusion withbanks – appear to have been most prevalent in the toll road sector,where investors and lenders were well aware that tariff and otherrisks would make projects essentially un-bankable. Yet demandamong local investors for toll road projects during the mid-1990swas buoyant to the extent that, when the crisis struck, Governmentthrough Keppres 39/1997 postponed a total of 37 private toll roadschemes.55 The phenomenon of ‘profit during construction’ is notunique to Indonesia or the toll road sector and indeed manyinternational banks have been exposed due to weak due diligenceprocedures.
Implementing the ProjectThe core objective during the implementation of public projectsshould be to ensure that the contractor delivers the works, goodsand services to the specified standards at the agreed upon price in atimely manner. The opportunities for corruption are again abundantand most commonly involve under-supplying on quantity or quality.Thus, for example, the asphalt overlay on a road project may bethinner than specified or the base course aggregates may be outsidethe specifications. While such practices should be detected by thesupervision consultant, in practice there is often collusion betweenthe project manager, contractor and the consultant. They collude by
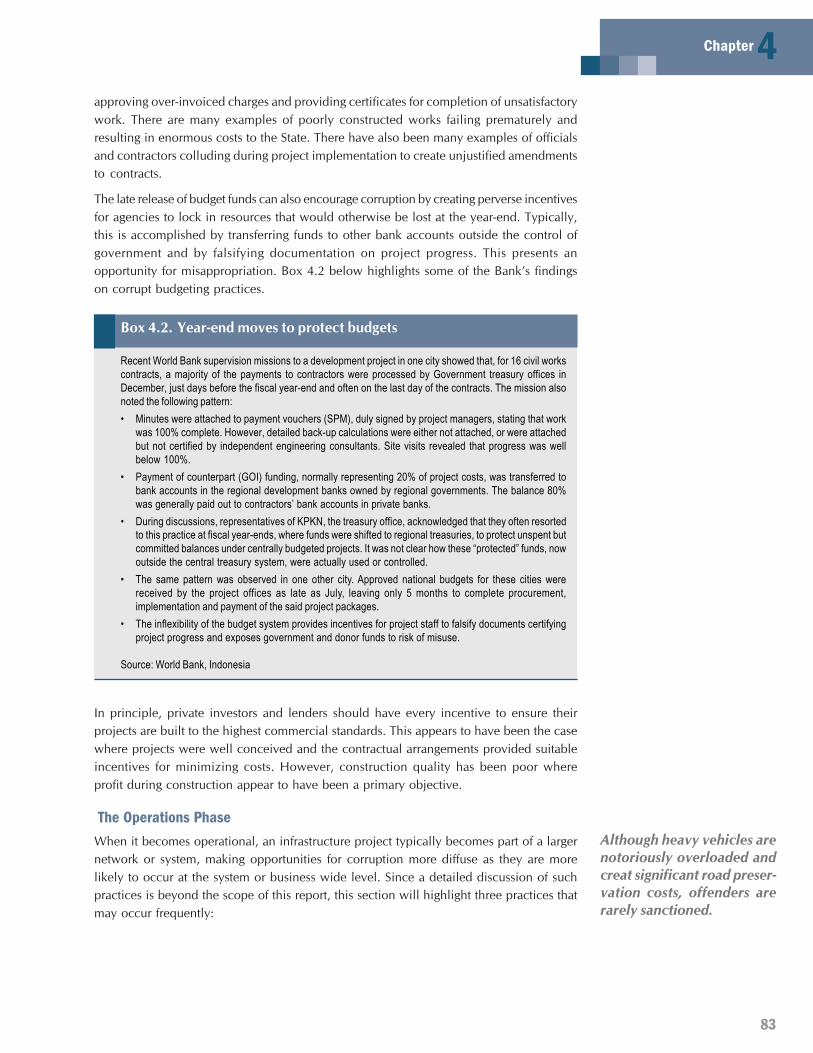
83
Chapter 4approving over-invoiced charges and providing certificates for completion of unsatisfactorywork. There are many examples of poorly constructed works failing prematurely andresulting in enormous costs to the State. There have also been many examples of officialsand contractors colluding during project implementation to create unjustified amendmentsto contracts.
The late release of budget funds can also encourage corruption by creating perverse incentivesfor agencies to lock in resources that would otherwise be lost at the year-end. Typically,this is accomplished by transferring funds to other bank accounts outside the control ofgovernment and by falsifying documentation on project progress. This presents anopportunity for misappropriation. Box 4.2 below highlights some of the Bank’s findingson corrupt budgeting practices.
Box 4.2. Year-end moves to protect budgets
Recent World Bank supervision missions to a development project in one city showed that, for 16 civil workscontracts, a majority of the payments to contractors were processed by Government treasury offices inDecember, just days before the fiscal year-end and often on the last day of the contracts. The mission alsonoted the following pattern:• Minutes were attached to payment vouchers (SPM), duly signed by project managers, stating that work
was 100% complete. However, detailed back-up calculations were either not attached, or were attachedbut not certified by independent engineering consultants. Site visits revealed that progress was wellbelow 100%.
• Payment of counterpart (GOI) funding, normally representing 20% of project costs, was transferred tobank accounts in the regional development banks owned by regional governments. The balance 80%was generally paid out to contractors’ bank accounts in private banks.
• During discussions, representatives of KPKN, the treasury office, acknowledged that they often resortedto this practice at fiscal year-ends, where funds were shifted to regional treasuries, to protect unspent butcommitted balances under centrally budgeted projects. It was not clear how these “protected” funds, nowoutside the central treasury system, were actually used or controlled.
• The same pattern was observed in one other city. Approved national budgets for these cities werereceived by the project offices as late as July, leaving only 5 months to complete procurement,implementation and payment of the said project packages.
• The inflexibility of the budget system provides incentives for project staff to falsify documents certifyingproject progress and exposes government and donor funds to risk of misuse.
Source: World Bank, Indonesia
In principle, private investors and lenders should have every incentive to ensure theirprojects are built to the highest commercial standards. This appears to have been the casewhere projects were well conceived and the contractual arrangements provided suitableincentives for minimizing costs. However, construction quality has been poor whereprofit during construction appear to have been a primary objective.
The Operations PhaseWhen it becomes operational, an infrastructure project typically becomes part of a largernetwork or system, making opportunities for corruption more diffuse as they are morelikely to occur at the system or business wide level. Since a detailed discussion of suchpractices is beyond the scope of this report, this section will highlight three practices thatmay occur frequently:
Although heavy vehicles arenotoriously overloaded andcreat significant road preser-vation costs, offenders arerarely sanctioned.
84
Getting a Gripon Corruption
Averting an Infrastructure Crisis: A Framework for Policy and Action
• Failure to protect infrastructure.Some types of infrastructure, particularly road pavements, can be damaged throughimproper use. In Indonesia, over loading is estimated to increase road preservationcosts by 20-60 percent.56 Many roadside weighbridges, however, manage to identifyfew offenders. It is estimated that between 30 and 100 percent of heavy vehicles areoverloaded — the most serious offenders being trucks carrying logs, aggregates andother bulk products. It has been recognized since the early 1980s — when all ofIndonesia’s weighbridges were ordered to be shut down for a lengthy period — thatthe underlying problem is corruption. Weighbridge operators accept bribes from smalloperators while larger ones employ military or police security to exempt themselvesfrom inspection. In fact trucks operated by the army and police cooperatives areamong the offenders in many instances.
• Failure to optimize infrastructure use.
Sometimes even relatively small scale corruption can have a large impact on theefficiency of infrastructure provision. For example, traders pay small bribes toenforcement officials to allow them to operate stalls and kiosks in areas that contributeto roadside friction and cause significant congestion. Likewise, route licensing practicesthat force bus and pick-up operators to use public terminals where legal and illegallevies are collected can also cause intense congestion in urban centers.
• Failure to optimize revenue collection.
Unaccounted for output is a major issue for Indonesia’s PDAMs, many of which areable to collect payments from customers for only 50-60 percent of the treated waterthey put into the distribution system, and for PLN, which estimates that it loses
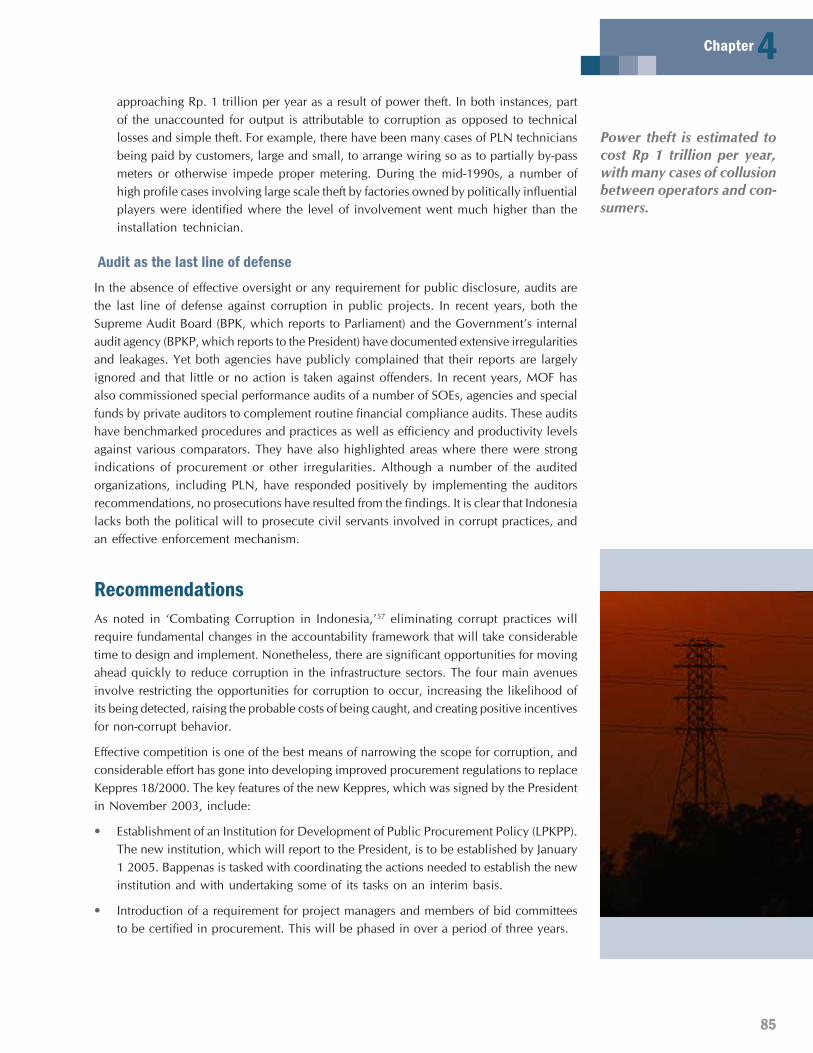
85
Chapter 4approaching Rp. 1 trillion per year as a result of power theft. In both instances, partof the unaccounted for output is attributable to corruption as opposed to technicallosses and simple theft. For example, there have been many cases of PLN techniciansbeing paid by customers, large and small, to arrange wiring so as to partially by-passmeters or otherwise impede proper metering. During the mid-1990s, a number ofhigh profile cases involving large scale theft by factories owned by politically influentialplayers were identified where the level of involvement went much higher than theinstallation technician.
Audit as the last line of defenseIn the absence of effective oversight or any requirement for public disclosure, audits arethe last line of defense against corruption in public projects. In recent years, both theSupreme Audit Board (BPK, which reports to Parliament) and the Government’s internalaudit agency (BPKP, which reports to the President) have documented extensive irregularitiesand leakages. Yet both agencies have publicly complained that their reports are largelyignored and that little or no action is taken against offenders. In recent years, MOF hasalso commissioned special performance audits of a number of SOEs, agencies and specialfunds by private auditors to complement routine financial compliance audits. These auditshave benchmarked procedures and practices as well as efficiency and productivity levelsagainst various comparators. They have also highlighted areas where there were strongindications of procurement or other irregularities. Although a number of the auditedorganizations, including PLN, have responded positively by implementing the auditorsrecommendations, no prosecutions have resulted from the findings. It is clear that Indonesialacks both the political will to prosecute civil servants involved in corrupt practices, andan effective enforcement mechanism.
RecommendationsAs noted in ‘Combating Corruption in Indonesia,’57 eliminating corrupt practices willrequire fundamental changes in the accountability framework that will take considerabletime to design and implement. Nonetheless, there are significant opportunities for movingahead quickly to reduce corruption in the infrastructure sectors. The four main avenuesinvolve restricting the opportunities for corruption to occur, increasing the likelihood ofits being detected, raising the probable costs of being caught, and creating positive incentivesfor non-corrupt behavior.
Effective competition is one of the best means of narrowing the scope for corruption, andconsiderable effort has gone into developing improved procurement regulations to replaceKeppres 18/2000. The key features of the new Keppres, which was signed by the Presidentin November 2003, include:
• Establishment of an Institution for Development of Public Procurement Policy (LPKPP).The new institution, which will report to the President, is to be established by January1 2005. Bappenas is tasked with coordinating the actions needed to establish the newinstitution and with undertaking some of its tasks on an interim basis.
• Introduction of a requirement for project managers and members of bid committeesto be certified in procurement. This will be phased in over a period of three years.
Power theft is estimated tocost Rp 1 trillion per year,with many cases of collusionbetween operators and con-sumers.
86
Getting a Gripon Corruption
Averting an Infrastructure Crisis: A Framework for Policy and Action
• Removal of restrictions which required that bidders be certified by business associationsand / or be domiciled within the region making the procurement.
• Removal of the requirement for pre-qualification for contracts below Rp. 50 billion(about $6.2 million).
• Introduction of a requirement for suppliers, contractors and consultants to sign ‘integritypacts’.
• Introduction of explicit prohibitions against collusive practices, along with thespecification of minimum sanctions.
• Clearer definition of conflicts of interest and expanded definition of informationdisclosure requirements.
The provisions of the new Keppres apply to procurements by both central and regionalgovernments.
The Government is also preparing a new Keppres to replace Keppres 7/1998 on Public-Private Partnerships for Infrastructure Provision. This is expected, among others, to establishsound guidelines and procedures for the identification of projects to be offered for privateparticipation and for the transparent competitive solicitation of private partners.
Expanded information disclosure, coupled with expanded public participation and improvedfinancial compliance, technical and performance auditing, offer the best prospects forincreasing the probability of detecting corruption. While a major part of infrastructureexpenditures are now managed by regional governments and public enterprises, central
87
Chapter 4government can play a vital role, for example, by establishing stringent informationdisclosure requirements for procurement activities and by publishing information oninformation disclosure compliance. Publication might be pioneered appropriately byposting on the internet expanded information on the implementation of projects financedby DAK grants so as to supplement the basic data on grant allocations provided by MOF.Such additional data could provide the basis for benchmarking the transparency of planningand implementation performance and might usefully include the results of inspectionsand technical audits. These measures need to be complemented by tough sanctions forthose found to have engaged in corrupt practices, together with effective procedures forensuring that such sanctions are properly applied and published.
Creating positive incentives to eliminate corruption from the infrastructure sectors willrequire Government to rethink the way it operates. One avenue that merits considerationwould involve publishing examples of best practices – for example of expanded procurementinformation disclosure – on the internet. Consideration might also be given to establishingcompetitions for good practice, for example in the planning and implementation of DAKgrants. In some instances there may also be opportunities for restructuring the implementationof government functions so as to facilitate their implementation by the private sector underarrangements that provide soundly designed financial incentives for effective and transparentperformance. One example of such an approach now being piloted in Sumatra involves theprivate operation of road-side weighbridges under a scheme that allows enforcementperformance to be evaluated against secure weigh-in-motion data.
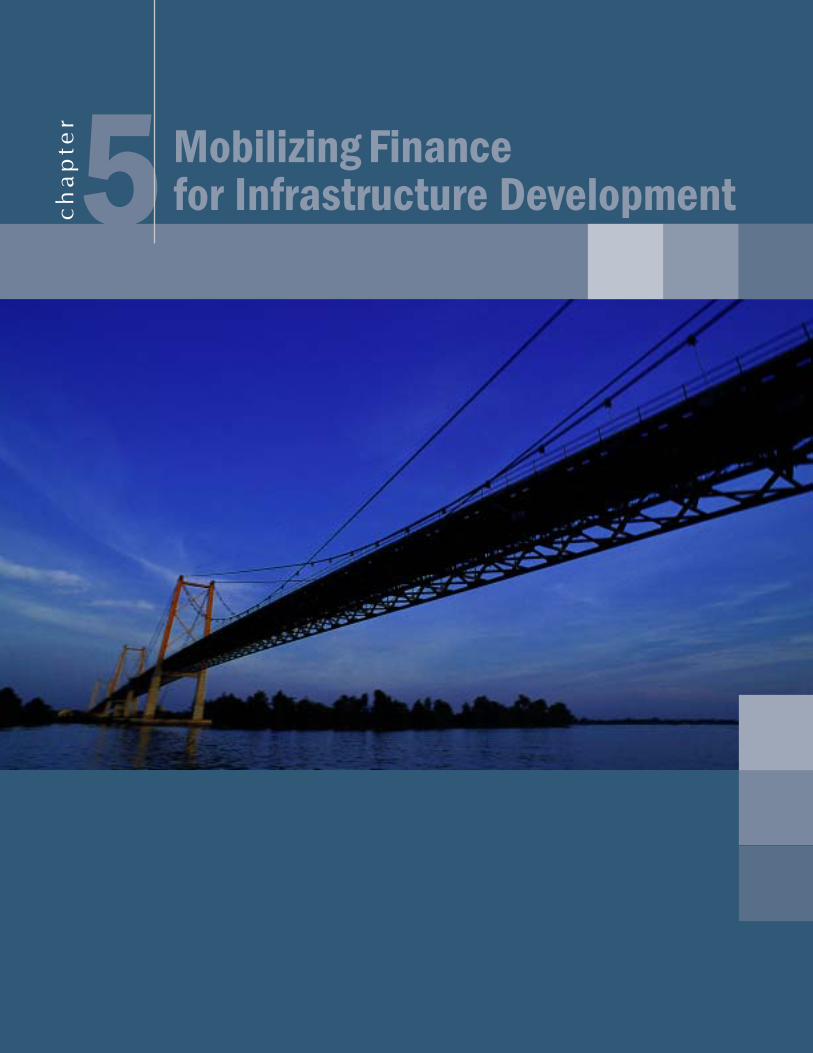
Averting an Infrastructure Crisis: A Framework for Policy and Action88
Mobilizing Financefor Infrastructure Developmentc
ha
pte
r5
89
The reforms discussed in the preceding chapters will progressivelyimprove the investment climate for infrastructure in Indonesia, and as aresult help mobilize financing for the sector. The effects of these reforms,however, will not be felt immediately, and therefore a substantial financinggap is expected to remain in the medium-term. This chapter first identifiesthe gap in financing. It stresses that a carefully designed long-term financingstrategy is needed. At the same time, it is important to note that increasedspending alone is not a sustainable way of improving infrastructureservices. Instead, a coordinated effort where expenditure complementssector reforms is needed to revive the sector. The chapter then reviewspotential funding sources, including both international and domesticsources. Options for mobilizing domestic financing are discussed in moredetail. Finally, the chapter discusses how the increased financing can bebest spent by government to achieve its development objectives, includingpro-poor growth. While detailed technical recommendations will call formore analysis than can be provided in the present report, a broad outlineof the steps that could be taken in these three areas is presented below.
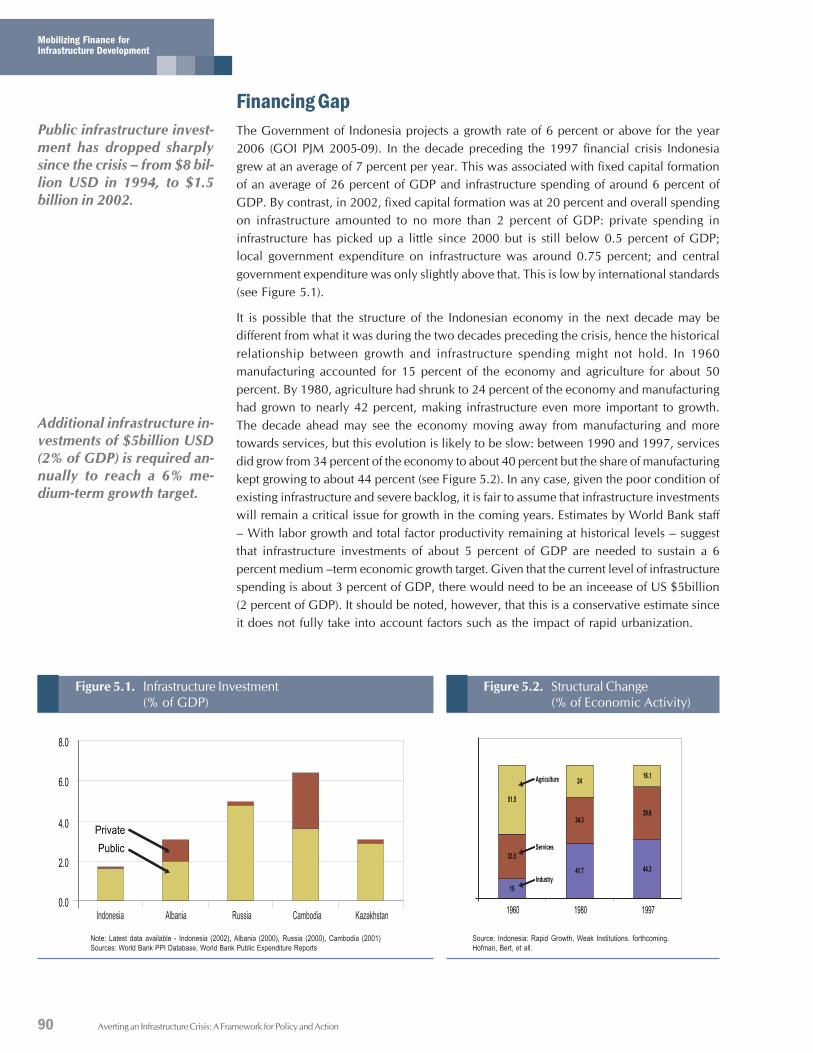
90
Mobilizing Finance forInfrastructure Development
Averting an Infrastructure Crisis: A Framework for Policy and Action
Financing GapThe Government of Indonesia projects a growth rate of 6 percent or above for the year2006 (GOI PJM 2005-09). In the decade preceding the 1997 financial crisis Indonesiagrew at an average of 7 percent per year. This was associated with fixed capital formationof an average of 26 percent of GDP and infrastructure spending of around 6 percent ofGDP. By contrast, in 2002, fixed capital formation was at 20 percent and overall spendingon infrastructure amounted to no more than 2 percent of GDP: private spending ininfrastructure has picked up a little since 2000 but is still below 0.5 percent of GDP;local government expenditure on infrastructure was around 0.75 percent; and centralgovernment expenditure was only slightly above that. This is low by international standards(see Figure 5.1).
It is possible that the structure of the Indonesian economy in the next decade may bedifferent from what it was during the two decades preceding the crisis, hence the historicalrelationship between growth and infrastructure spending might not hold. In 1960manufacturing accounted for 15 percent of the economy and agriculture for about 50percent. By 1980, agriculture had shrunk to 24 percent of the economy and manufacturinghad grown to nearly 42 percent, making infrastructure even more important to growth.The decade ahead may see the economy moving away from manufacturing and moretowards services, but this evolution is likely to be slow: between 1990 and 1997, servicesdid grow from 34 percent of the economy to about 40 percent but the share of manufacturingkept growing to about 44 percent (see Figure 5.2). In any case, given the poor condition ofexisting infrastructure and severe backlog, it is fair to assume that infrastructure investmentswill remain a critical issue for growth in the coming years. Estimates by World Bank staff– With labor growth and total factor productivity remaining at historical levels – suggestthat infrastructure investments of about 5 percent of GDP are needed to sustain a 6percent medium –term economic growth target. Given that the current level of infrastructurespending is about 3 percent of GDP, there would need to be an inceease of US $5billion(2 percent of GDP). It should be noted, however, that this is a conservative estimate sinceit does not fully take into account factors such as the impact of rapid urbanization.
Figure 5.1. Infrastructure Investment(% of GDP)
Note: Latest data available - Indonesia (2002), Albania (2000), Russia (2000), Cambodia (2001)Sources: World Bank PPI Database, World Bank Public Expenditure Reports
Figure 5.2. Structural Change(% of Economic Activity)
Source: Indonesia: Rapid Growth, Weak Institutions. forthcoming.Hofman, Bert, et all.
0.0
2.0
4.0
6.0
8.0
Indonesia Albania Russia
Private
Public
Cambodia Kazakhstan
15
41.7 44.3
33.5
34.339.6
51.5
2416.1
1960 1980 1997
Agriculture
Industry
Services
Public infrastructure invest-ment has dropped sharplysince the crisis – from $8 bil-lion USD in 1994, to $1.5billion in 2002.
Additional infrastructure in-vestments of $5billion USD(2% of GDP) is required an-nually to reach a 6% me-dium-term growth target.
91
Chapter 5Options for Bridging the Financing GapThere are four main sources through which infrastructure development can be financed :
• User charges that are reinvested;
• International capital markets;
• Public financing, through government budgetary resources; and
• Domestic capital markets.
User charges are a key source of infrastructure financing, particularly in well developedutilities. In many mature private utilities, internally generated funds can account for up to70% of investment funds.58 In order to generate those funds, tariffs must be set at adequatelevels, which is not the case at present in Indonesia. As mentioned earlier, tariffs willneed to be raised. But, the impact of such reforms on the capacity of utilities generatefunds needed for investment will only be felt progressively. Tariff increases will indeedhave to be gradual to take into account residential users’ capacity and willingness to payand to ensure that commercial and industrial consumers remain internationally competitive.
Infrastructure can also be financed through international capital via private investors andlenders as well as international development agencies. Private financiers have been reluctantto finance infrastructure in Indonesia after the difficulties they faced in the aftermath ofthe crisis. Many infrastructure projects in Indonesia have been renegotiated, and the weaklegal system creates little recourse for investors59. Indonesia’s international credit rating –while improving – is still below investment grade. In addition, foreign investment ininfrastructure projects in developing countries has been declining globally as perceivedrisks in emerging market investments have increased. In the last two years, however,Indonesia has experienced a small increase in inflow of private capital. Although thistrend is expected to continue, a lack of policy and regulatory predictability will be animpediment from significant financial flows into infrastructure. Therefore, sector reformsare critically needed if Indonesia is to rely on international capital markets for infrastructurefinance, and such reforms will take some time. Multilateral and bilateral developmentagencies, such as the IBRD, ADB, and JBIC, can be a useful source of loans during thereform period, but can only cover a minor portion of the infrastructure requirements.
Since the two options just discussed will not mobilize sufficient financing to meetinfrastructure demand, Indonesia will have to resort to fulfilling the investment fundingneeds through other means. This can include gaining maximum leverage from increasedgovernment spending in the short-term, and seeking to mobilize greater domestic capitalfor the future. These two potential sources are discussed in the next sections.
Increasing Public FinancingLocal government spending in infrastructure increased in the years following decentralization.Today local government’s share of public investment in infrastructure is almost equal tothat of central government (see Figure 5.3).
In the last three years for which data is available, local governments allocated approximately50 percent of their revenue for infrastructure compared to about 30 percent for centralgovernment (see Figure 5.4). This allocation is unlikely to increase substantially. Interestingly,there is some evidence of under spending by local governments, but once again, moresystematic budgeting and implementation would only increase local government spending
Foreign investment in infra-structure projects in devel-oping countries has declinedglobally.
After decentralization, localgovernments’ share of pub-lic investment in infrastruc-ture is almost equal to thecentral government’s.
Public spending on infra-structure will need to in-crease in the short-term ifIndonesia is to reach itsgrowth target.
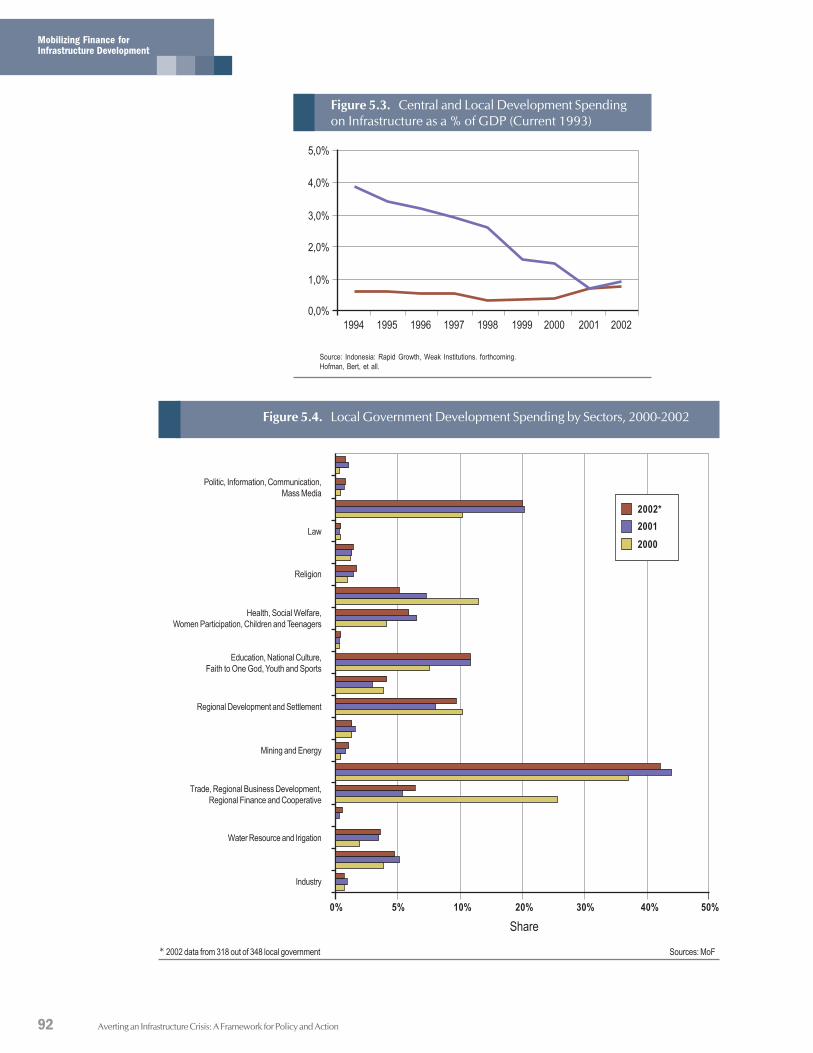
92
Mobilizing Finance forInfrastructure Development
Averting an Infrastructure Crisis: A Framework for Policy and Action
Figure 5.3. Central and Local Development Spendingon Infrastructure as a % of GDP (Current 1993)
Source: Indonesia: Rapid Growth, Weak Institutions. forthcoming.Hofman, Bert, et all.
1994 1995 1996 1997 1998 1999 2000 2001 20020,0%
1,0%
2,0%
3,0%
4,0%
5,0%
Figure 5.4. Local Government Development Spending by Sectors, 2000-2002
Sources: MoF
Politic, Information, Communication,Mass Media
Law
Religion
Health, Social Welfare,Women Participation, Children and Teenagers
Education, National Culture,Faith to One God, Youth and Sports
Regional Development and Settlement
Mining and Energy
Trade, Regional Business Development,Regional Finance and Cooperative
Water Resource and Irigation
Industry
0% 5% 10% 20% 30% 40% 50%
Share
2002*20012000
* 2002 data from 318 out of 348 local government
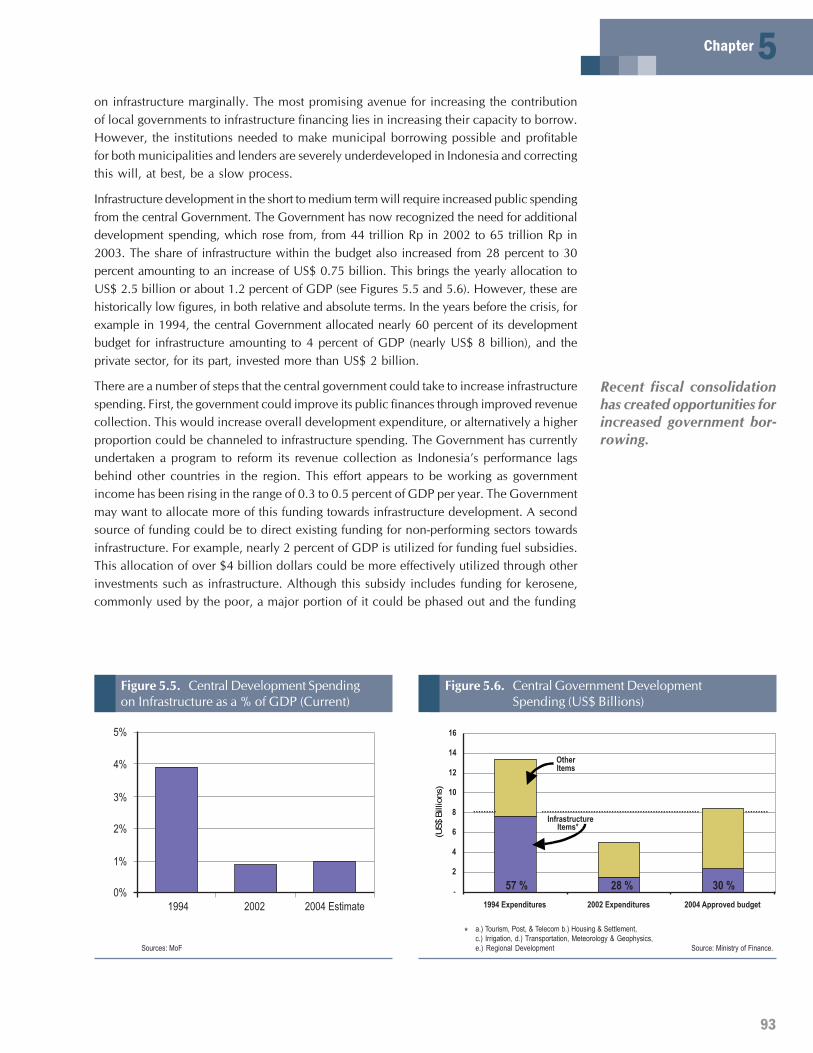
93
Chapter 5on infrastructure marginally. The most promising avenue for increasing the contributionof local governments to infrastructure financing lies in increasing their capacity to borrow.However, the institutions needed to make municipal borrowing possible and profitablefor both municipalities and lenders are severely underdeveloped in Indonesia and correctingthis will, at best, be a slow process.
Infrastructure development in the short to medium term will require increased public spendingfrom the central Government. The Government has now recognized the need for additionaldevelopment spending, which rose from, from 44 trillion Rp in 2002 to 65 trillion Rp in2003. The share of infrastructure within the budget also increased from 28 percent to 30percent amounting to an increase of US$ 0.75 billion. This brings the yearly allocation toUS$ 2.5 billion or about 1.2 percent of GDP (see Figures 5.5 and 5.6). However, these arehistorically low figures, in both relative and absolute terms. In the years before the crisis, forexample in 1994, the central Government allocated nearly 60 percent of its developmentbudget for infrastructure amounting to 4 percent of GDP (nearly US$ 8 billion), and theprivate sector, for its part, invested more than US$ 2 billion.
There are a number of steps that the central government could take to increase infrastructurespending. First, the government could improve its public finances through improved revenuecollection. This would increase overall development expenditure, or alternatively a higherproportion could be channeled to infrastructure spending. The Government has currentlyundertaken a program to reform its revenue collection as Indonesia’s performance lagsbehind other countries in the region. This effort appears to be working as governmentincome has been rising in the range of 0.3 to 0.5 percent of GDP per year. The Governmentmay want to allocate more of this funding towards infrastructure development. A secondsource of funding could be to direct existing funding for non-performing sectors towardsinfrastructure. For example, nearly 2 percent of GDP is utilized for funding fuel subsidies.This allocation of over $4 billion dollars could be more effectively utilized through otherinvestments such as infrastructure. Although this subsidy includes funding for kerosene,commonly used by the poor, a major portion of it could be phased out and the funding
Figure 5.5. Central Development Spendingon Infrastructure as a % of GDP (Current)
Sources: MoF
Figure 5.6. Central Government DevelopmentSpending (US$ Billions)
* a.) Tourism, Post, & Telecom b.) Housing & Settlement,c.) Irrigation, d.) Transportation, Meteorology & Geophysics,e.) Regional Development
1994 2002 2004 Estimate0%
1%
2%
3%
4%
5%
-
2
4
6
8
10
12
14
16
1994 Expenditures 2002 Expenditures 2004 Approved budget
(US$
Billions)
OtherItems
57 %
InfrastructureItems*
30 %28 %
Source: Ministry of Finance.
Recent fiscal consolidationhas created opportunities forincreased government bor-rowing.
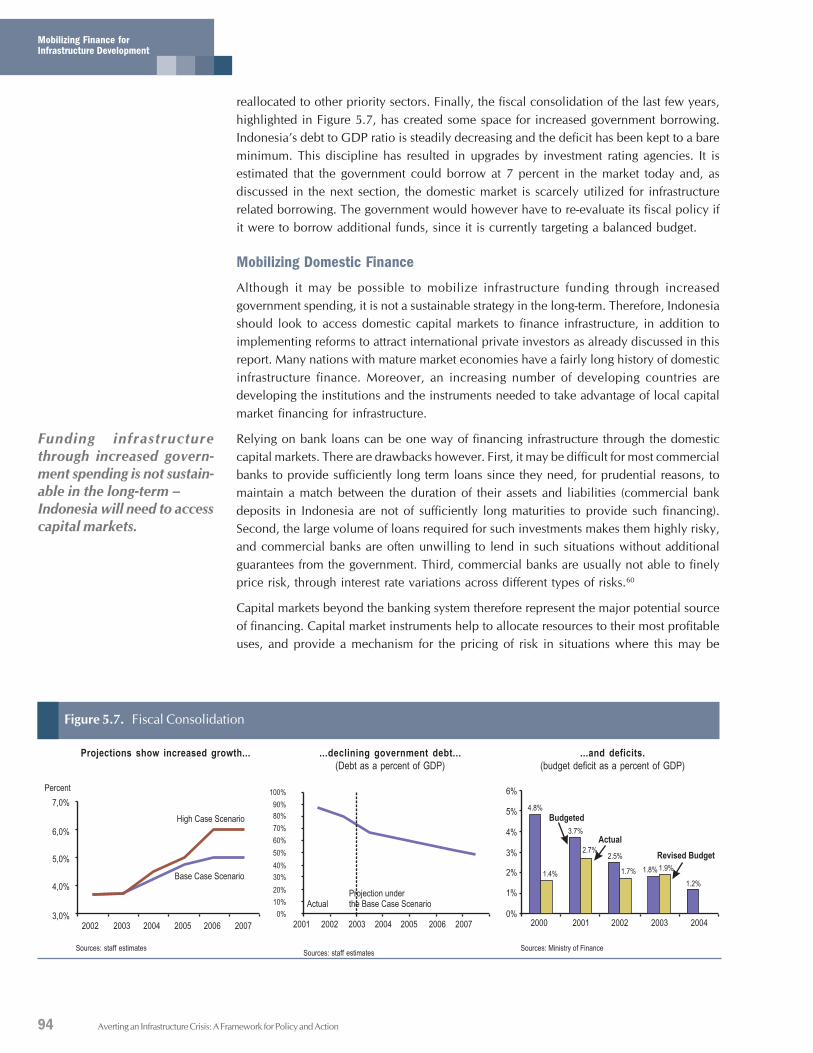
94
Mobilizing Finance forInfrastructure Development
Averting an Infrastructure Crisis: A Framework for Policy and Action
reallocated to other priority sectors. Finally, the fiscal consolidation of the last few years,highlighted in Figure 5.7, has created some space for increased government borrowing.Indonesia’s debt to GDP ratio is steadily decreasing and the deficit has been kept to a bareminimum. This discipline has resulted in upgrades by investment rating agencies. It isestimated that the government could borrow at 7 percent in the market today and, asdiscussed in the next section, the domestic market is scarcely utilized for infrastructurerelated borrowing. The government would however have to re-evaluate its fiscal policy ifit were to borrow additional funds, since it is currently targeting a balanced budget.
Mobilizing Domestic FinanceAlthough it may be possible to mobilize infrastructure funding through increasedgovernment spending, it is not a sustainable strategy in the long-term. Therefore, Indonesiashould look to access domestic capital markets to finance infrastructure, in addition toimplementing reforms to attract international private investors as already discussed in thisreport. Many nations with mature market economies have a fairly long history of domesticinfrastructure finance. Moreover, an increasing number of developing countries aredeveloping the institutions and the instruments needed to take advantage of local capitalmarket financing for infrastructure.
Relying on bank loans can be one way of financing infrastructure through the domesticcapital markets. There are drawbacks however. First, it may be difficult for most commercialbanks to provide sufficiently long term loans since they need, for prudential reasons, tomaintain a match between the duration of their assets and liabilities (commercial bankdeposits in Indonesia are not of sufficiently long maturities to provide such financing).Second, the large volume of loans required for such investments makes them highly risky,and commercial banks are often unwilling to lend in such situations without additionalguarantees from the government. Third, commercial banks are usually not able to finelyprice risk, through interest rate variations across different types of risks.60
Capital markets beyond the banking system therefore represent the major potential sourceof financing. Capital market instruments help to allocate resources to their most profitableuses, and provide a mechanism for the pricing of risk in situations where this may be
3,0%
4,0%
5,0%
6,0%
7,0%
2002 2003 2004 2005 2006
High Case Scenario
Base Case Scenario
Percent
2007
0%
20%
60%
70%
90%
2001 2003 2004 2005 2006 2007
Actual
2002
10%
30%
40%
50%
80%
100%
Projection underthe Base Case Scenario
0%
1%
2%
3%
4%
2000 2003 2004
Budgeted
20022001
5%
6%
Actual
4.8%
1.4%
3.7%
2.7%2.5%
1.7% 1.8% 1.9%
1.2%
Revised Budget
Figure 5.7. Fiscal Consolidation
Sources: staff estimates Sources: staff estimates Sources: Ministry of Finance
Projections show increased growth... ...declining government debt...(Debt as a percent of GDP)
...and deficits.(budget deficit as a percent of GDP)
Funding infrastructurethrough increased govern-ment spending is not sustain-able in the long-term –Indonesia will need to accesscapital markets.
95
Chapter 5important and potentially difficult. Many advanced countries have made use of capitalmarkets for the financing of their infrastructure requirements, through both bond andequity issues. In recent years, a growing number of developing countries have alsodeveloped the securities markets and long-term savings institutions which have allowedthem to tap domestic markets for infrastructure finance. Indonesia has yet to exploit thesemarkets to their full potential.
It cannot be overemphasized, however, that an attractive investment climate for infrastructureis a precondition for accessing domestic capital markets. Therefore, reforms discussed in theprevious chapters are an important component of the strategy to generate infrastructurefinance through the domestic markets, and they need to be implemented simultaneously.
The Role of Contractual Savings Institutions
Indonesia has a pool of long-term domestic funds that it could tap for financing itsinfrastructure requirements if sector and policy reforms ensured a more certain return forinvestors. Indonesia has three large retirement funds – ASABRI (pension fund for thepolice, civilian and military defense personnel), TASPEN (pension fund for civil servants),and JAMSOSTEK (provident fund for employees in the private sector and in SOEs) –created in 1966, 1969, and 1992 respectively. In addition, over 300 employers in Indonesiahave retirement funds for their employees. As of December 2002, the combined assets ofthese retirement funds totaled approximately Rp. 73 trillion. The life insurance sector inIndonesia is another source of long term domestic resources, and had assets of about Rp.26 trillion as of December 2002. These institutions have a combined total of 26 millionparticipants with assets amounting over Rp. 100 trillion that can be potentially mobilizedfor investments including infrastructure. These assets are likely to grow further in value inthe future given that participation in many retirement programs are mandatory, and thatthe relatively young labor force in Indonesia is unlikely to draw on these accounts soon.
Indonesia has a pool of long-term domestic funds that itcould tap for financing, butit will need to implementsector and policy reforms toattract these investors.
96
Mobilizing Finance forInfrastructure Development
Averting an Infrastructure Crisis: A Framework for Policy and Action
These resources have not always been well managed. The governance, regulation andsupervision, and investment policies of pension funds have been poor and not tied in tothe overall development priorities of the country. Both TASPEN and ASABRI are poorlyfunded relative to their benefit obligations, and hence, are proving to be increasing drainson the national budget instead of being sources of long-term capital.61 ASABRI is controlledby the Ministry of Defense, TASPEN is overseen by the Ministry of Finance, whileJAMSOSTEK is under the purview of the Ministry of Manpower and Transmigration. Thefirst two entities are effectively unsupervised, while JAMSOSTEK and the employers’pension funds are supervised by the Ministry of Finance. All pension funds have sufferedfrom a lack of transparency and disclosure, weak management information systems andinternal corporate governance, and political influence over their investments. The vastmajority of the assets in these retirement funds are invested in short-term bank deposits –a clearly sub-optimal use of these funds. A relatively small proportion of these assets isinvested in the capital markets and other private securities. There has been almost noinvolvement of these funds in financing infrastructure.
The life insurance sector has faced similar problems that have been compounded sincethe financial crisis. Indonesia has over 60 life insurance firms – most of them small andpoorly capitalized. The investments of these firms were adversely affected by the crisis,but many weak firms continued to operate since their premium payments were able tocover any claims. These firms have also faced criticism similar to private banks for poorgovernance. Investments of these firms are also in short-term assets exposing them toasset-liability mismatches and roll-over risk. Regulation and supervision of insurancecompanies has been historically weak.
Box 5.1. Using Pension Funds in Chile to Finance Infrastructure
To increase investment in infrastructure during the early 1990s, Chile's government introduced a concessionprogram to attract private capital into the transport infrastructure sector, covering roads and highways,bridges, tunnels, and airports. The program has managed to attract over US$3.6 billion in private investmentfor infrastructure.Chile was the first Latin American country to allow pension funds to be invested in infrastructure projects. In1981, Chile had replaced its bankrupt pay-as-you-go retirement system with a fully funded system ofindividual retirement accounts managed by the private sector. By 2001, more than 95 percent of Chileanworkers had joined the system; the pension funds have accumulated $36 billion in assets; and the averagereal rate of return has been 10.9 percent per year.Initially, pension funds were legally constrained from investing in infrastructure projects. In particular, the lackof investment grade rating for bonds or other financial instruments issued by concession companies was anobstacle. In order to facilitate investments from pension funds and insurance companies legal changes tofinancial and infrastructure regulations were introduced between during the mid-90s. These reforms, amongother things, enabled pension funds and insurance companies to invest in bonds without history. As a resultof these reforms, a new long-term financial instrument, the Infrastructure Bond, was created. The typicalinfrastructure bond offered a 20-year fixed rate bond denominated in Unidades de Fomentos (UFs) – aninflation-adjusted unit of account used in Chile with a AAA local rating and a monoline guarantee . The bondsare sold exclusively to local private investors, including local pension funds, and they have been continuouslyoversubscribed.Of the 16 toll road concessions awarded, 11 have opted for the alternative of Infrastructure Bonds, 3 havefinanced through bank loans and 2 concessions have not yet decided their financing structure. Thedevelopment of the infrastructure bond market was assisted by the fact that in 1995 Chile achieved an “A-“credit rating, creating an opportunity for monoline insurance of bond issuances. In November 1998, theconsortium handling the upgrade of the Talca-Chillan stretch of the nation's main thoroughfare, Route 5, issuedthe first US$150 million in infrastructure bonds. Till mid-2002, a total of US$963 million of infrastructure bondshad been issued in five offerings. The concession program is now being expanded to fund private investmentin jails and urban infrastructure.
97
Chapter 5Chile and Malaysia are two developing countries that have been able to successfullymobilize their domestic capital markets to help fund infrastructure projects (see Boxes5.1 and 5.2). One key enabling factor, in both of these cases, was the development ofcontractual savings institutions, notably pension schemes, that were allowed to invest innon-governmental assets. Given the long-term liabilities of pension schemes (the pensionbenefits of retirees), and the fact that this liability is in domestic currency, it is importantto develop these institutions to mobilize local currency instruments for financinginfrastructure. The experiences of Chile, Malaysia and other emerging economies alsoillustrate some pre-conditions that are critical before financing from contractual savingsinstitutions can be readily accessed. These conditions include, for example: (i) the existenceof appropriately designed and funded social security systems, which do not crowd out thedevelopment of contractual saving institutions, where individuals participate in governmentfunded retirement schemes expecting a greater pay-off; (ii) regulatory regimes that encourageinnovation and efficiency, and avoid widespread mistrust between contractual savingsinstitutions and their customers; (iii) existence of borrowers and market makers who canunderwrite and repackage complex financial offerings to allow contractual savingsinstitutions to participate in infrastructure transactions; and (iv) stable macroeconomicconditions which support the predictability of the operations of pension funds and insurancecompanies.
Box 5.2. Malaysia: The Case of the Employees Provident Fund
Malaysia has also actively encouraged the state-run provident fund – the Employees Provident Fund (EPF)– to participate in infrastructure development. EPF was created in order to establish a social security andpension system for employed workers and provide old-age, survivor and disability benefits. The Fundreceives its contributions from the employee (9% of earnings) and the employer (12% of payroll). As ofDecember 2002, EPF controlled total assets of RM 208 billion. Malaysia’s local market investors, and inparticular EPF, have been very active in infrastructure projects, since the early 80s, when the governmentallowed private participation in infrastructure, and launched a divestiture program to reduce budgetary andmanagement obligations and to promote competition.The US$8.0 billion Kuala Lumpur International Airport, sold $2.2 billion in Islamic bonds. These bonds, andalso the ones for the Shah Alam expressway (US$510 million) were placed mainly with local institutionalinvestors. The YTL power project was the first IPP contract awarded in Malaysia . The YTL project wasfinanced in its entirety by local markets. The company borrowed RM 3.1 billion (US$967 million) in twotranches: (i) A RM 1.5 billion fixed rate 10% 10-year bond subscribed by EPF (which purchased the bondissue in its entirety). The bonds were rated AA3 by the Rating Agency of Malaysia, based on the project’scontractual arrangements and feasibility. (ii) RM 1.6 billion floating rate term loan underwritten by BankBumiputra and United Malaysian Banking Corp. Project equity, which was financed 100% by YTL during theconstruction period, was then partially sold off to a number of local investors, including Tenaga. Other majorprojects that raised significant resources from local sources include the Lumut Power project and the North-South Expressway. EPF has also invested in the Sikap Power project, Kuala Lumpur City Centre TwinTower, and the Light Rail Transit. In 2000, Malaysia raised almost $2.6 billion in domestic bonds for projectfinance. Similar amounts are estimated to have been raised annually since. The Government also worked on creating an enabling environment for financial institutions to undertakeinvestments in infrastructure. It created a liquidity facility – Cagamas Berhad – in 1986 that allowed financialinstitutions to dispose of their housing loan portfolios and raise liquidity, a part of which, in turn was investedin infrastructure. It initiated a process of issuing long-dated government debt securities through regularauctions, thereby enabling the creation of benchmarks for pricing. The Rating Agency of Malaysia (RAM)was also established and regulations on the issuance of securitized debt offerings required that acceptableratings be obtained.
Contractual savings institu-tions, such as pension funds,can be a useful source oflong-term domestic financefor infrastructure.
98
Mobilizing Finance forInfrastructure Development
Averting an Infrastructure Crisis: A Framework for Policy and Action
Upgrading Key Features of the Financial Mar-kets Infrastructure
Many of the steps outlined to marshal domestic financemay take some time to take effect as noted earlier. Improvingmany of the features of the financial markets is also along term proposition, and a detailed analysis of the neededreforms are beyond the scope of this report. However,several key measures can be taken in the near-term toimprove the efficiency of domestic capital markets andfacilitate the mobilization of domestic savings for financeinfrastructure projects. One such measure would be toenforce accounting, auditing and disclosure standards. Theestablishment of credible credit rating institutions wouldalso be valuable to investors as this would give them accessto independent assessments of risks and returns offered bybonds. Enabling greater tradability of shares in infrastructurecompanies is another step that can enhance resource flowsinto the sector. In addition, mandatory disclosure of reliableinformation about financial intermediaries may enhanceinvestor participation in equity markets.
Other longer-term financial market upgrades can includeimplementing regulations that instill investor confidencein brokers and other capital market intermediaries in orderto encourage investment and trading in the stock market.Establishing a sound government bond market is anotherimportant step. This may involve concentrating debtmaturities in a small set of standardized and liquidbenchmark issues, moving to an auction-based systemrun according to internationally accepted principles ratherthan syndicated issues, setting a predictable issuingcalendar, and establishing futures contracts ongovernment debt. A well functioning government debtmarket allows the creation of benchmark bond prices,which would then form the basis on which instrumentsof different risks can be priced.
The tax regime can also significantly influence theaccumulation and flow of private capital. Stamping and withholding taxes, as well asrelated registration fees, can often discourage new issuance and can create barriers to entryfor trading on the secondary market. Lastly, a sound legal framework and credible disputeresolution mechanisms are key to attracting long-term investments from private sources.
Targeting Public Finances to Protect the PoorChapter 1 describes the disproportional impact of inadequate infrastructure on the poor.The Government in Indonesia has a unique opportunity now to channel the investmentsit will make in the infrastructure sector to ensure that the poor have expanded access to
99
Chapter 5
improved services. It will be crucial, however, to make sure that government efforts inthat area do not undermine the efficiencies gained through other reforms. The remainderof the chapter identifies measures that can help the government achieve this balance.
Contributions by Better-off UsersIn theory, targeted lump-sum payments collected through general taxation should distortconsumption patterns less than cross subsidies between users. In practice, however, taxand subsidy reform is often a long-term endeavor, and generally requires considerablepolicy coordination between government agencies. In such cases, cross-subsidizationbetween users may represent the best near-term option, albeit on a temporary basis. In the
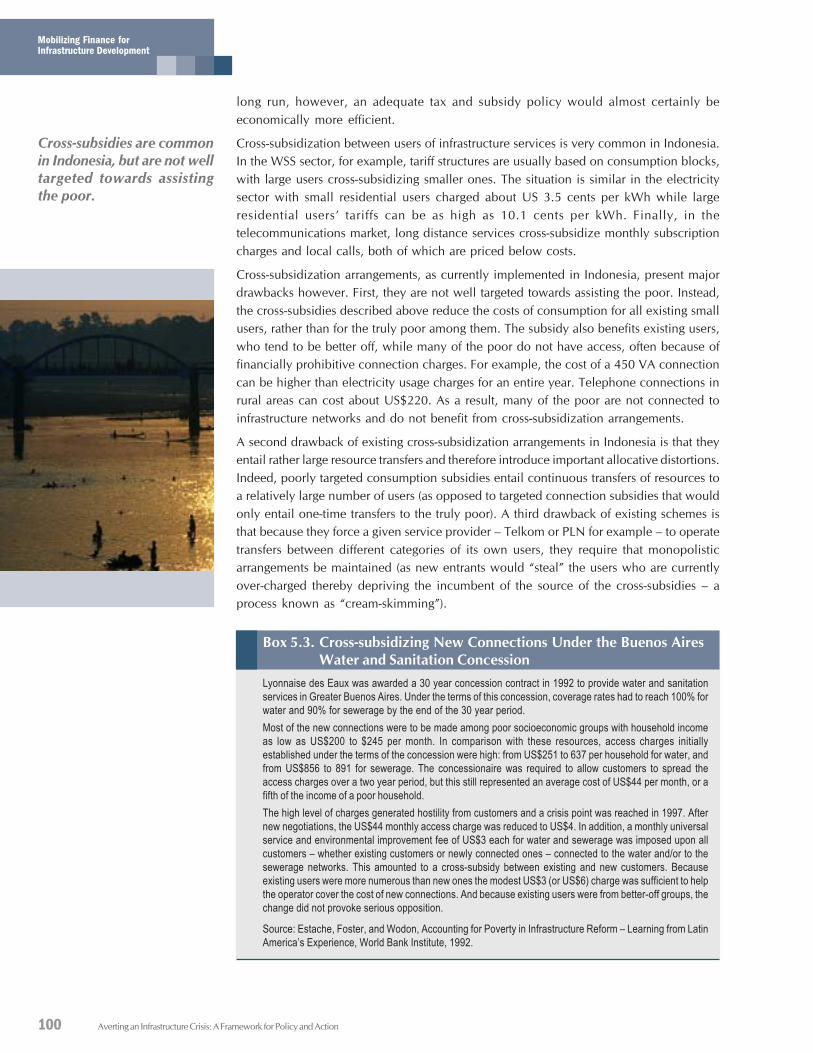
100
Mobilizing Finance forInfrastructure Development
Averting an Infrastructure Crisis: A Framework for Policy and Action
long run, however, an adequate tax and subsidy policy would almost certainly beeconomically more efficient.
Cross-subsidization between users of infrastructure services is very common in Indonesia.In the WSS sector, for example, tariff structures are usually based on consumption blocks,with large users cross-subsidizing smaller ones. The situation is similar in the electricitysector with small residential users charged about US 3.5 cents per kWh while largeresidential users’ tariffs can be as high as 10.1 cents per kWh. Finally, in thetelecommunications market, long distance services cross-subsidize monthly subscriptioncharges and local calls, both of which are priced below costs.
Cross-subsidization arrangements, as currently implemented in Indonesia, present majordrawbacks however. First, they are not well targeted towards assisting the poor. Instead,the cross-subsidies described above reduce the costs of consumption for all existing smallusers, rather than for the truly poor among them. The subsidy also benefits existing users,who tend to be better off, while many of the poor do not have access, often because offinancially prohibitive connection charges. For example, the cost of a 450 VA connectioncan be higher than electricity usage charges for an entire year. Telephone connections inrural areas can cost about US$220. As a result, many of the poor are not connected toinfrastructure networks and do not benefit from cross-subsidization arrangements.
A second drawback of existing cross-subsidization arrangements in Indonesia is that theyentail rather large resource transfers and therefore introduce important allocative distortions.Indeed, poorly targeted consumption subsidies entail continuous transfers of resources toa relatively large number of users (as opposed to targeted connection subsidies that wouldonly entail one-time transfers to the truly poor). A third drawback of existing schemes isthat because they force a given service provider – Telkom or PLN for example – to operatetransfers between different categories of its own users, they require that monopolisticarrangements be maintained (as new entrants would “steal” the users who are currentlyover-charged thereby depriving the incumbent of the source of the cross-subsidies – aprocess known as “cream-skimming”).
Box 5.3. Cross-subsidizing New Connections Under the Buenos AiresWater and Sanitation Concession
Lyonnaise des Eaux was awarded a 30 year concession contract in 1992 to provide water and sanitationservices in Greater Buenos Aires. Under the terms of this concession, coverage rates had to reach 100% forwater and 90% for sewerage by the end of the 30 year period.Most of the new connections were to be made among poor socioeconomic groups with household incomeas low as US$200 to $245 per month. In comparison with these resources, access charges initiallyestablished under the terms of the concession were high: from US$251 to 637 per household for water, andfrom US$856 to 891 for sewerage. The concessionaire was required to allow customers to spread theaccess charges over a two year period, but this still represented an average cost of US$44 per month, or afifth of the income of a poor household.The high level of charges generated hostility from customers and a crisis point was reached in 1997. Afternew negotiations, the US$44 monthly access charge was reduced to US$4. In addition, a monthly universalservice and environmental improvement fee of US$3 each for water and sewerage was imposed upon allcustomers – whether existing customers or newly connected ones – connected to the water and/or to thesewerage networks. This amounted to a cross-subsidy between existing and new customers. Becauseexisting users were more numerous than new ones the modest US$3 (or US$6) charge was sufficient to helpthe operator cover the cost of new connections. And because existing users were from better-off groups, thechange did not provoke serious opposition.
Source: Estache, Foster, and Wodon, Accounting for Poverty in Infrastructure Reform – Learning from LatinAmerica’s Experience, World Bank Institute, 1992.
Cross-subsidies are commonin Indonesia, but are not welltargeted towards assistingthe poor.
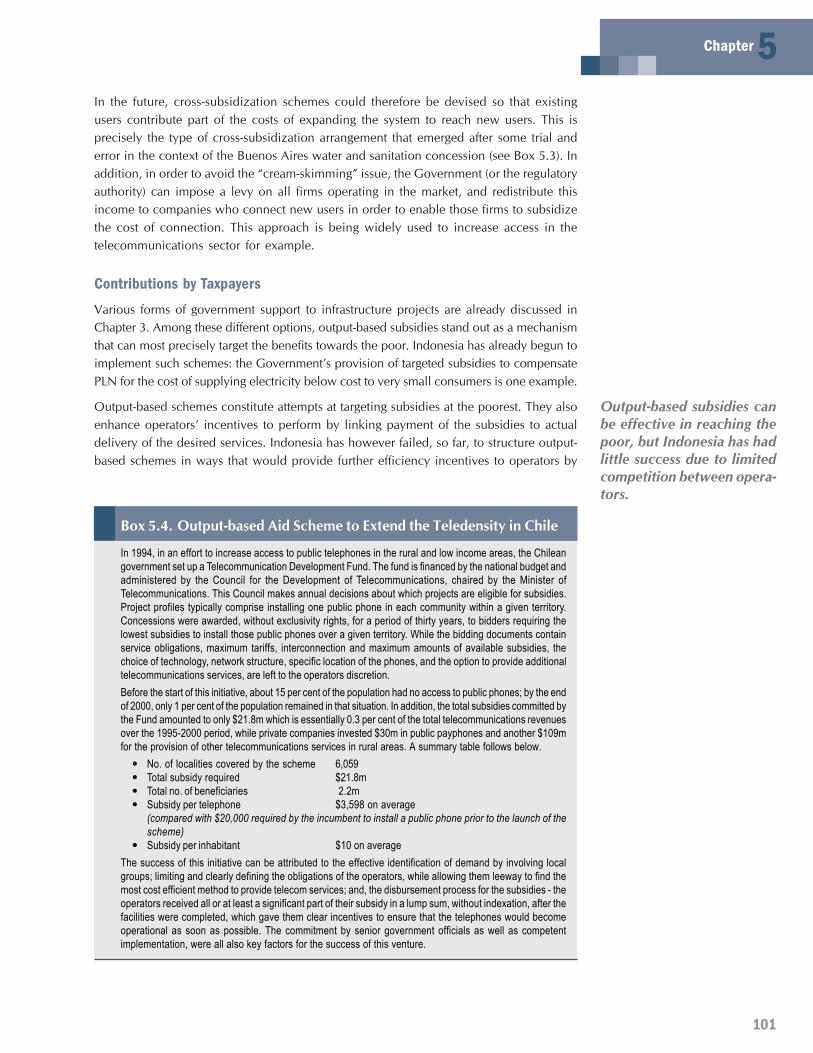
101
Chapter 5In the future, cross-subsidization schemes could therefore be devised so that existingusers contribute part of the costs of expanding the system to reach new users. This isprecisely the type of cross-subsidization arrangement that emerged after some trial anderror in the context of the Buenos Aires water and sanitation concession (see Box 5.3). Inaddition, in order to avoid the “cream-skimming” issue, the Government (or the regulatoryauthority) can impose a levy on all firms operating in the market, and redistribute thisincome to companies who connect new users in order to enable those firms to subsidizethe cost of connection. This approach is being widely used to increase access in thetelecommunications sector for example.
Contributions by TaxpayersVarious forms of government support to infrastructure projects are already discussed inChapter 3. Among these different options, output-based subsidies stand out as a mechanismthat can most precisely target the benefits towards the poor. Indonesia has already begun toimplement such schemes: the Government’s provision of targeted subsidies to compensatePLN for the cost of supplying electricity below cost to very small consumers is one example.
Output-based schemes constitute attempts at targeting subsidies at the poorest. They alsoenhance operators’ incentives to perform by linking payment of the subsidies to actualdelivery of the desired services. Indonesia has however failed, so far, to structure output-based schemes in ways that would provide further efficiency incentives to operators by
Box 5.4. Output-based Aid Scheme to Extend the Teledensity in Chile
In 1994, in an effort to increase access to public telephones in the rural and low income areas, the Chileangovernment set up a Telecommunication Development Fund. The fund is financed by the national budget andadministered by the Council for the Development of Telecommunications, chaired by the Minister ofTelecommunications. This Council makes annual decisions about which projects are eligible for subsidies.Project profiles typically comprise installing one public phone in each community within a given territory.Concessions were awarded, without exclusivity rights, for a period of thirty years, to bidders requiring thelowest subsidies to install those public phones over a given territory. While the bidding documents containservice obligations, maximum tariffs, interconnection and maximum amounts of available subsidies, thechoice of technology, network structure, specific location of the phones, and the option to provide additionaltelecommunications services, are left to the operators discretion.Before the start of this initiative, about 15 per cent of the population had no access to public phones; by the endof 2000, only 1 per cent of the population remained in that situation. In addition, the total subsidies committed bythe Fund amounted to only $21.8m which is essentially 0.3 per cent of the total telecommunications revenuesover the 1995-2000 period, while private companies invested $30m in public payphones and another $109mfor the provision of other telecommunications services in rural areas. A summary table follows below.
• No. of localities covered by the scheme 6,059• Total subsidy required $21.8m• Total no. of beneficiaries 2.2m• Subsidy per telephone $3,598 on average
(compared with $20,000 required by the incumbent to install a public phone prior to the launch of thescheme)
• Subsidy per inhabitant $10 on averageThe success of this initiative can be attributed to the effective identification of demand by involving localgroups; limiting and clearly defining the obligations of the operators, while allowing them leeway to find themost cost efficient method to provide telecom services; and, the disbursement process for the subsidies - theoperators received all or at least a significant part of their subsidy in a lump sum, without indexation, after thefacilities were completed, which gave them clear incentives to ensure that the telephones would becomeoperational as soon as possible. The commitment by senior government officials as well as competentimplementation, were all also key factors for the success of this venture.
Output-based subsidies canbe effective in reaching thepoor, but Indonesia has hadlittle success due to limitedcompetition between opera-tors.
102
Mobilizing Finance forInfrastructure Development
Averting an Infrastructure Crisis: A Framework for Policy and Action
maximizing competitive pressures. Such competitive pressures can be introduced byorganizing competitive bidding processes to identify, on the basis of the lowest subsidyrequired, the operator that will receive the public subsidy in exchange for providing theservice. Processes of this type have been used to promote expansion of thetelecommunications network in Chile (see Box 5.4).
It is also possible to structure output-based aid schemes in ways that maximize directcompetition between operators. In order to achieve this objective, public authorities needto establish a system of “portable subsidies”, whereby any operator that provides theagreed upon service (e.g. establishment of an electricity connection) to members of thetargeted population receives a pre-determined subsidy (e.g. pre-determined amount perelectricity connection actually installed). Australia, for example, has launched two regionalpilot schemes whereby new telecommunications operators can compete directly with theincumbent, Telstra, for access to funds earmarked for the provision of pre-determinedloss-making services. In these two regions, users are thus able to choose among competinguniversal service providers.
RecommendationsIndonesia needs to increase infrastructure investments by about 2 percent of GDP in orderto sustain growth rates of 6 percent per year. Closing this gap is undoubtedly a difficultchallenge. We argued above that in addition to the measures discussed in previous chapters– aimed at improving the public management of infrastructure, restoring privateparticipation, and combating corruption - the Government should explore the three followingoptions: increasing government spending on infrastructure, promoting greater mobilizationof domestic savings, and targeting public resources more accurately towards the poor.
In the short-medium term, a substantial part of the infrastructurefinancing gap can only be bridged by increased central Governmentspending. In order to achieve this objective, the central governmentcould take the following steps: (i) increasing the overall revenue envelope;(ii) redirecting unproductive subsidies towards infrastructure financing;and (iii) increasing government borrowing to finance infrastructure – apolicy made possible by the impressive fiscal consolidation thatIndonesia has successfully implemented over the last few years.
As far as promoting the mobilization of domestic savings is concerned,an essential precondition is to establish an attractive investment climatefor infrastructure. Beyond this, the Government should consider whetherspecific measures may promote the effective involvement of contractualsavings institutions in the financing of infrastructure projects. Such stepsmight include: (i) checking whether the investment regulations thatgovern pension funds and insurance firms should be modified in orderto enable such institutions to invest in infrastructure securities; (ii)designing social security systems that do not crowd out the developmentof contractual saving institutions; (iii) adopting regulatory regimes thatprotect those who entrust their savings to contractual savings institutions;and (iv) maintaining stable macroeconomic conditions. On the demandside, the central Government may consider using public resources to
103
Chapter 5strengthen the capacity of sub-national entities – especially municipalities – to borrow onthe local markets. Finally the Government will need to focus on creating or upgradingcertain aspects of financial market infrastructure, including: setting up sound and crediblecredit rating institutions; developing a sound government bond market; and establishingcredible dispute resolution mechanisms.
The government should also aim at targeting scarce public finance more accurately towardsincreasing access by the poor to infrastructure. At present, Indonesia relies mostly oncross-subsidies to try to improve infrastructure access among the poor. However, thecurrent system could be much improved by targeting such subsidies more accurately totruly benefit the poor (e.g. existing users could contribute part of the costs of expandingthe system to reach new users). In addition, cross-subsidization could be made compatiblewith competitive market structures by funding the scheme through a levy imposed on allcompanies participating in the market. Alternatively, subsidies can be funded by taxpayers.In both cases, the key is to ensure that providers have strong incentives to deliver servicesefficiently. Indonesian authorities could meet this objective by disbursing subsidies onlywhen outputs have actually been delivered to targeted beneficiaries and by promotingcompetition between various service providers.
Averting an Infrastructure Crisis: A Framework for Policy and Action104
ch
ap
ter6 The Way Forward:
Prioritizing Reforms
105
The preceding chapters (as well as the sector-specific chapters presented at the end of thepresent study) propose a detailed menu of reforms. It is clear, however, that not all proposedreforms can be carried out in parallel. First, some of the proposed reforms involve publicexpenditures (e.g. to relieve congestion in the transport network) and public funding is limited.Second, some of the proposed reforms are politically challenging (e.g. price increases inwater; or elimination of the fuel subsidy) and there is a limit to the number of politicallychallenging reforms that can be undertaken at any given time. Finally, there is a limit to thecapacity of public authorities to manage multiple reform processes. Therefore, this chapterattempts to provide a framework that can be useful in setting priorities.
The prioritizing process can be guided by the following three criteria: (i) internationalcomparisons that can provide insight as to where Indonesia’s performance lags behind thatof regional competitors; (ii) estimates of the overall economic impact of the proposed reforms;and (iii) estimates of the distributional impacts of the reforms among different categories ofstakeholders. It is important to realize that none of these criteria should be used as the solebasis on which to justify undertaking a particular reform or investment. At the most, takentogether, they provide indicative inputs that policymakers can use for choosing priorities.The following is a short description of the three criteria, including a brief mention of theirrespective limitations:
• If Indonesia’s businesses are to be internationally competitive, Indonesia’s infrastructureshould be broadly on par with that of its regional competitors. However, improvementsto infrastructure standards should be carried out only to the extent that they are relevantfor Indonesia’s growth and the well being of its people. The objective should not be tosolely attempt to “measure-up” to other countries without regard to the local context. Forexample, low level of access to improved water sources may not be a significant criteriawhere abundant high quality fresh water is available.
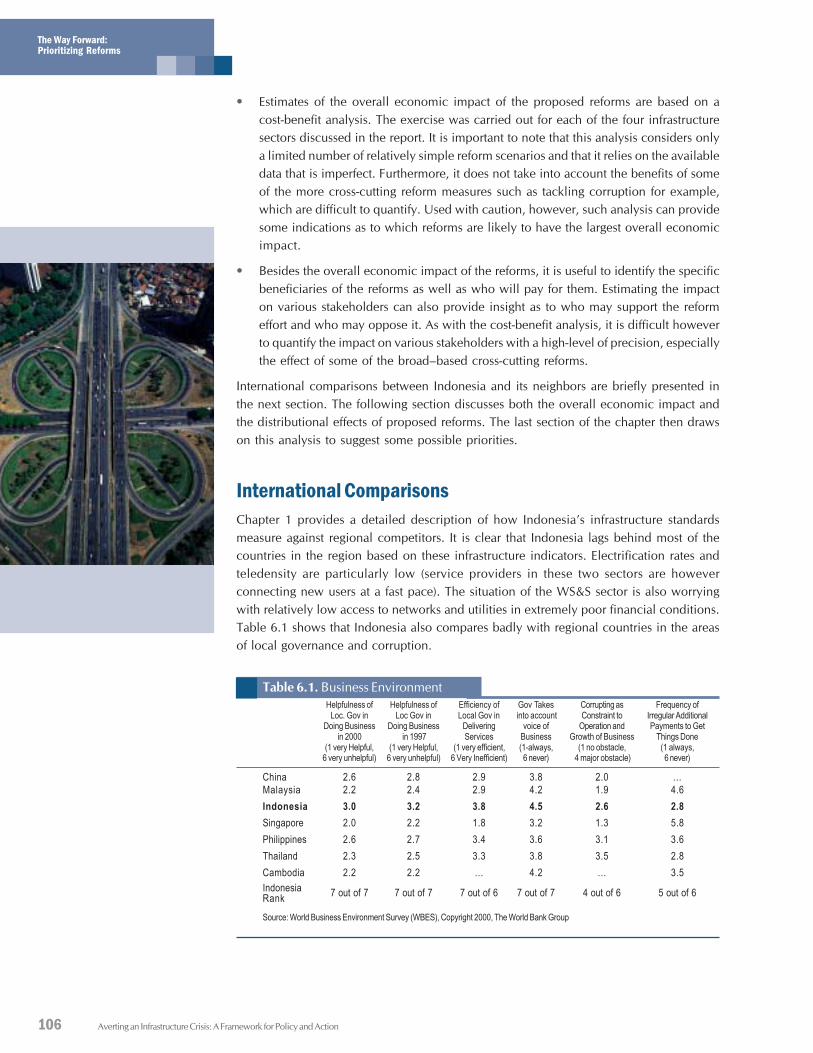
106
The Way Forward:Prioritizing Reforms
Averting an Infrastructure Crisis: A Framework for Policy and Action
• Estimates of the overall economic impact of the proposed reforms are based on acost-benefit analysis. The exercise was carried out for each of the four infrastructuresectors discussed in the report. It is important to note that this analysis considers onlya limited number of relatively simple reform scenarios and that it relies on the availabledata that is imperfect. Furthermore, it does not take into account the benefits of someof the more cross-cutting reform measures such as tackling corruption for example,which are difficult to quantify. Used with caution, however, such analysis can providesome indications as to which reforms are likely to have the largest overall economicimpact.
• Besides the overall economic impact of the reforms, it is useful to identify the specificbeneficiaries of the reforms as well as who will pay for them. Estimating the impacton various stakeholders can also provide insight as to who may support the reformeffort and who may oppose it. As with the cost-benefit analysis, it is difficult howeverto quantify the impact on various stakeholders with a high-level of precision, especiallythe effect of some of the broad–based cross-cutting reforms.
International comparisons between Indonesia and its neighbors are briefly presented inthe next section. The following section discusses both the overall economic impact andthe distributional effects of proposed reforms. The last section of the chapter then drawson this analysis to suggest some possible priorities.
International ComparisonsChapter 1 provides a detailed description of how Indonesia’s infrastructure standardsmeasure against regional competitors. It is clear that Indonesia lags behind most of thecountries in the region based on these infrastructure indicators. Electrification rates andteledensity are particularly low (service providers in these two sectors are howeverconnecting new users at a fast pace). The situation of the WS&S sector is also worryingwith relatively low access to networks and utilities in extremely poor financial conditions.Table 6.1 shows that Indonesia also compares badly with regional countries in the areasof local governance and corruption.
Table 6.1. Business EnvironmentHelpfulness of Helpfulness of Efficiency of Gov Takes Corrupting as Frequency of
Loc. Gov in Loc Gov in Local Gov in into account Constraint to Irregular AdditionalDoing Business Doing Business Delivering voice of Operation and Payments to Get
in 2000 in 1997 Services Business Growth of Business Things Done(1 very Helpful, (1 very Helpful, (1 very efficient, (1-always, (1 no obstacle, (1 always,
6 very unhelpful) 6 very unhelpful) 6 Very Inefficient) 6 never) 4 major obstacle) 6 never)
China 2.6 2.8 2.9 3.8 2.0 …Malaysia 2.2 2.4 2.9 4.2 1.9 4.6Indonesia 3.0 3.2 3.8 4.5 2.6 2.8Singapore 2.0 2.2 1.8 3.2 1.3 5.8Philippines 2.6 2.7 3.4 3.6 3.1 3.6Thailand 2.3 2.5 3.3 3.8 3.5 2.8Cambodia 2.2 2.2 … 4.2 … 3.5IndonesiaRank 7 out of 7 7 out of 7 7 out of 6 7 out of 7 4 out of 6 5 out of 6
Source: World Business Environment Survey (WBES), Copyright 2000, The World Bank Group
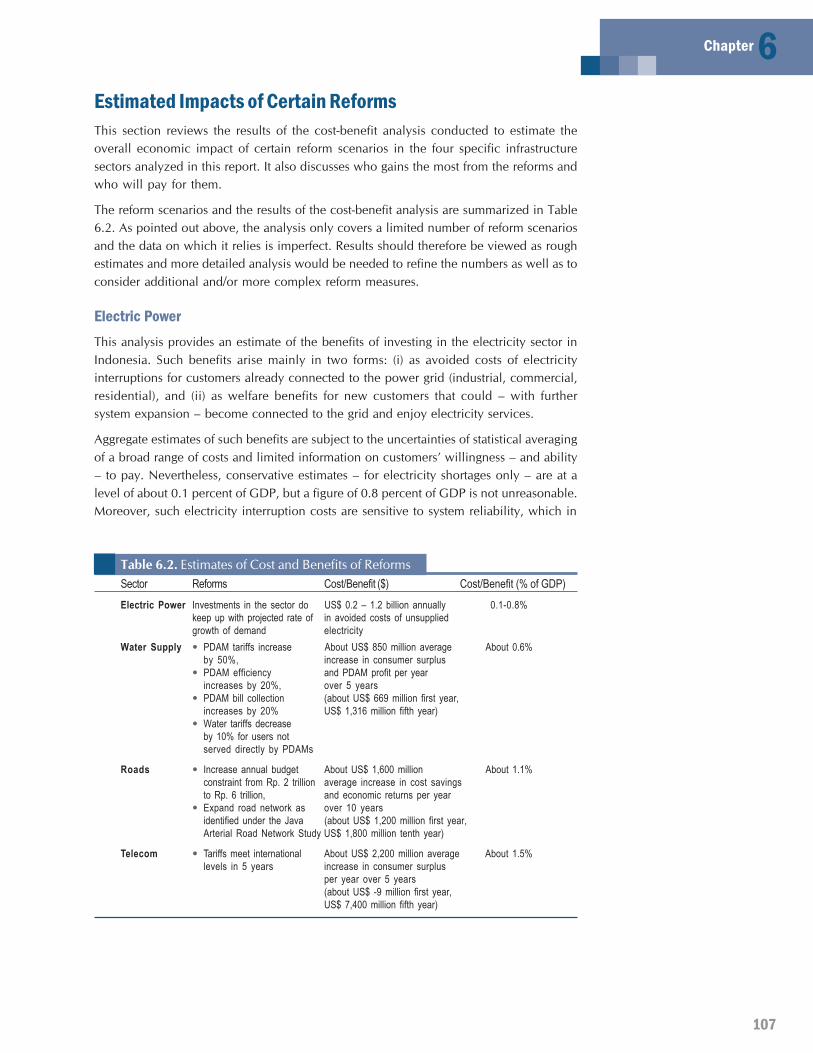
107
Chapter 6Estimated Impacts of Certain ReformsThis section reviews the results of the cost-benefit analysis conducted to estimate theoverall economic impact of certain reform scenarios in the four specific infrastructuresectors analyzed in this report. It also discusses who gains the most from the reforms andwho will pay for them.
The reform scenarios and the results of the cost-benefit analysis are summarized in Table6.2. As pointed out above, the analysis only covers a limited number of reform scenariosand the data on which it relies is imperfect. Results should therefore be viewed as roughestimates and more detailed analysis would be needed to refine the numbers as well as toconsider additional and/or more complex reform measures.
Electric PowerThis analysis provides an estimate of the benefits of investing in the electricity sector inIndonesia. Such benefits arise mainly in two forms: (i) as avoided costs of electricityinterruptions for customers already connected to the power grid (industrial, commercial,residential), and (ii) as welfare benefits for new customers that could – with furthersystem expansion – become connected to the grid and enjoy electricity services.
Aggregate estimates of such benefits are subject to the uncertainties of statistical averagingof a broad range of costs and limited information on customers’ willingness – and ability– to pay. Nevertheless, conservative estimates – for electricity shortages only – are at alevel of about 0.1 percent of GDP, but a figure of 0.8 percent of GDP is not unreasonable.Moreover, such electricity interruption costs are sensitive to system reliability, which in
Table 6.2. Estimates of Cost and Benefits of ReformsSector Reforms Cost/Benefit ($) Cost/Benefit (% of GDP)Electric Power Investments in the sector do US$ 0.2 – 1.2 billion annually 0.1-0.8%
keep up with projected rate of in avoided costs of unsuppliedgrowth of demand electricity
Water Supply • PDAM tariffs increase About US$ 850 million average About 0.6%by 50%, increase in consumer surplus
• PDAM efficiency and PDAM profit per yearincreases by 20%, over 5 years
• PDAM bill collection (about US$ 669 million first year,increases by 20% US$ 1,316 million fifth year)
• Water tariffs decreaseby 10% for users notserved directly by PDAMs
Roads • Increase annual budget About US$ 1,600 million About 1.1%constraint from Rp. 2 trillion average increase in cost savingsto Rp. 6 trillion, and economic returns per year
• Expand road network as over 10 yearsidentified under the Java (about US$ 1,200 million first year,Arterial Road Network Study US$ 1,800 million tenth year)
Telecom • Tariffs meet international About US$ 2,200 million average About 1.5%levels in 5 years increase in consumer surplus
per year over 5 years(about US$ -9 million first year,US$ 7,400 million fifth year)
108
The Way Forward:Prioritizing Reforms
Averting an Infrastructure Crisis: A Framework for Policy and Action
turn is directly related to overall investments in the sector. Should investments in thesector not keep up with the rate of growth for projected electricity demand, system reliabilityis bound to deteriorate resulting in considerable costs that will likely adversely impact thecountry’s investment climate and macroeconomic conditions. If, on the contrary, reliabilityin the system is improved as a result of the reforms and investments proposed, this willdirectly benefit existing consumers, and more broadly, the economy as a whole. Theenvisaged increase in access at a rate of about 1 million new connections annually (afigure consistent with the performance achieved over the past few years), will, for its part,most likely benefit the rural poor who are now lacking access to the grid.
WaterThe analysis reveals a NPV gain in consumer surplus and PDAM profit of about US$1,752 million over 5 years (or an average of US$ 350 million per year) if PDAMs increasetariffs by 50 percent, efficiency by 20 percent, and bill collection by 20 percent. Anadditional gain of about US$ 500 million per year in consumer surplus results if waterprices decrease by 10 percent for the 85 percent of the population not directly served byPDAMs. Thus, the potential, cumulative annual gain is in the order of US$ 850 million(US$ 350 million + US$ 500 million). In this model, the change in consumer surplus iscumulative (i.e. it is computed by comparing consumer surplus during any given yearwith consumer surplus prior to the reforms). As the model assumes that additional profitsare reinvested to expand the network, new connections bring additional profit and thechange in consumer surplus reaches higher levels every year.
Based on the currently regressive shortage of access, it can be inferred that a significantnumber of the new connections will be to those consumers who are in the bottom twoincome quintiles. Therefore, it can be estimated that the poorest income groups canbenefit from as much as 60% of the new connections. Existing consumers, for their part,bear the cost of higher tariffs (but may benefit from improvements in service quality).
It is important to recognize that the analysis ignores some significant elements and requiresnumerous assumptions. First, the consumer surplus analysis only takes price changes intoaccount. It does not consider the impact (on health, consumer surplus etc.) of the substantialimprovement in water quality and service that users enjoy as they move from alternativesources of water to a PDAM direct connection. Second, it also does not consider the potentialbenefits of reform in the sanitation sector. Finally, PDAMs’ performances vary significantlyand the figures used in the analysis are only best estimates of “representative” figures.
RoadsThe cost-benefit analysis conducted in the road sector shows that increasing the annualpreservation budget constraint from Rp. 2 trillion (US$ 215 million) to Rp. 6 trillion (US$644 million) saves about US$ 1,150 million of agency and user costs. Those who usesecondary and tertiary roads stand to benefit the most from improved maintenance, sincethese roads are those that suffer most from insufficient maintenance. Moreover, expandingthe road network as advised in the Java Arterial Road Network study (JARNs) results in anadditional US$ 450 million of economic gains. These gains increase annually as newinvestments are made every year and each investment yields a given rate of return. Themajority of the gains result from reducing the cost of future congestion (for more detail onthe costs of congestion, please refer to the Strategic Expenditure Planning Model (SEPM)and the JARNs study).

109
Chapter 6The main beneficiaries of the priority expansion works identified in the report are expectedto be the users of the main arteries and primary networks. It is important to note, however,that most of these expansions will need to be funded by tax payers, and proper selectionof projects will be key to maximizing the benefits.
TelecomThe telecom cost benefit analysis quantifies the change in consumer surplus resultingfrom tariff changes and steady state growth in the local, national long distance, andinternational long distance segments. The analysis reveals an average annual gain of aboutUS$ 2,200 million if tariffs reach international levels in five years. Given that Indonesianinternational long distance tariffs are significantly higher than the international standard,the international long distance segment accounts for the overwhelming majority of thegain in consumer surplus. Consumers who use international long distance services willstand to benefit the most, with increases in consumer surplus of up to US$ 14 billion overfive years, depending on the level of reforms. Users of domestic long distance servicesstand to gain as much as US$50 million to US$300 million in consumer surplus. Consumerswho now use local telephone services, on the other hand, will face tariffs based oneconomic costs, and as a result, their current benefits may be reduced by as much asUS$4 billion.
Note that over time, technological change would likely reduce telecom tariffs even in theabsence of any reforms. However, the model considers that changes in tariffs are entirelydue to reform. It is likely, therefore, that the model overestimates the (positive) impact ofreforms.
110
The Way Forward:Prioritizing Reforms
Averting an Infrastructure Crisis: A Framework for Policy and Action
Prioritizing ReformsThe international performance comparisons and the estimates of overall and distributionalimpacts of reforms discussed above can shed some light on the areas that appear todeserve priority attention:
• Indonesia suffers from a very poor investment climate characterized by unclear allocationof responsibilities among public authorities, insufficient strategic planning andcoordination capacity, high political and regulatory risks, and high levels of corruption.
• Despite rapid increases in the number of residential and commercial connections,access to electricity still compares unfavorably with that of other countries. In addition,brownouts and blackouts, whose costs for the economy are very large, are becomingmore widespread and the situation will deteriorate fast if nothing is done urgently toincrease generation capacity and remedy transmission and distribution bottlenecks.
• The WSS sector is in very poor condition and substantial welfare benefits would begained both from increasing the number of house connections and from improving,even marginally, the efficiency of service provision for the large majority of thepopulation that will remain unconnected to the main network in the near future.
• The performance of the road sector, at present, is relatively good when compared tothe situation in neighboring countries. The enormous welfare benefits that would bederived from the implementation of an aggressive expansion program do reveal,however, that addressing congestion issues is becoming an urgent issue.
• Finally, Indonesia is also lagging behind its neighbors in telecommunications accessand the benefits derived from catching up with international best practice would beconsiderable. However, important steps have already been taken (not least theintroduction of vibrant competition in the mobile market) that increase the likelihoodthat the rapid improvements that have been witnessed in the past few years will besustained in the future.
For each of the areas listed above, the present report suggests a number of priority reformmeasures. This prioritization effort is informed by the discussion of the various prioritizationcriteria presented above. In addition, an attempt is made at taking into account the degreeof political and technical complexity associated with specific reforms in order to try todevise a reform agenda that is realistic. This agenda remains very ambitious, however,and appropriate phasing and coordination will be very important. Also, the need toadequately explain to the population at large why the reforms are needed well ahead ofimplementation, rather than after the event, cannot be over-emphasized. Note that,according to the proposed reform agenda, public financial resources would be spentprimarily in the power, WSS and road sectors while overall price increases would betargeted mainly to the WSS - and to a lesser extent – to the road sector.
Cross-sector IssuesSix areas require priority attention:
1. The Government of Indonesia needs to take steps to tackle some of the issues associatedwith the decentralization process:
• The allocation of responsibilities between different levels of government needs tobe clarified: the assignments specified in the different regulations that implement
111
Chapter 6the decentralization program are not always fully consistent and furtherinconsistencies exist between these regulations and the sector regulations.
• The provinces need to be empowered to play a much stronger coordinating rolevis-ŕ-vis municipalities. This is all the more urgent since the number of separatelocal governments is steadily increasing, which in turn raises the number ofexternalities and coordination issues that need to be addressed.
• Effective capacity building at the local level is required, especially in the roadand power sectors where local authorities have been given substantial additionalresponsibilities.
• Procedures for on-lending of foreign loans need to be streamlined and processharmonization is needed as far as on-granting mechanisms are concerned, asthere are at present two distinct processes with different application and evaluationcriteria and different terms and conditions.
• There are, in addition, powerful arguments for increasing the volume of resourcesallocated by Government grant funding in order to increase the flow of resourcesto the poorest regions and to promote inter-region cooperation for infrastructureprojects characterized by high externalities (at the regional level) and by higheconomies of scales. At the same time, there is a need to intensify efforts toprevent the proliferation of illegal taxes by regional governments.
2. Indonesia needs to rethink the role of central authorities in two main respects:
• The role, organizational structures and staffing needs of the main sector ministriesneed to be reviewed, with emphasis on policy formulation and support to localauthorities rather than on planning and implementation of civil works and directprovision of services.
• A conceptual framework needs to be developed for coordinating policy and strategicplanning in an environment characterized by much wider dispersion ofresponsibilities than in the past.
3. In order to re-attract private investors and operators in infrastructure – and in order tomaximize benefits from private participation – the following measures would beneeded:
• Priorities, for improving the overall investment climate, include the difficult taskof reforming the legal system (in particular to reduce the incidence of corruption),and to facilitate the securing of land and rights of way by private operators.
• Tariff increases are most urgent in the WSS sector. In the road sector, road usercharges need to be restructured to reflect actual road usage more closely as wellas earmarked to cover road expenditures, and the current subsidy on gasoline andautomotive diesel oil will need to be eliminated. In the power sector,implementation of a comprehensive gas sector strategy is crucial to ensure accessto reasonably priced gas for electricity generation if the need for substantialelectricity retail price increases is to be avoided in the future. Finally, in thetelecommunications sector, fixed local tariffs will need to be progressively raisedto better reflect costs. All price increases will however need to be phased inprogressively, and they should be accompanied by improvements in service qualityas well as by an effective information campaign to explain the reasons for theincreases to the public.
112
The Way Forward:Prioritizing Reforms
Averting an Infrastructure Crisis: A Framework for Policy and Action
• Head to head competition should be introduced without delay in fixedtelecommunications, it should be introduced as planned in electricity generation,and it should be encouraged between small scale providers in all infrastructuresectors. When head to head competition is not feasible, competition for themarket should, as a rule, be used to select operators. Finally, competitive disciplinecan be derived from yardstick competition, whereby regulators use comparativeperformance data from other similar enterprises to regulate monopoly networkindustries.
• Indonesia has so far taken only timid steps toward creating adequate regulatoryinstitutions for infrastructure. Substantial reforms are needed to turn the embryonictelecommunications agency that exists at present into a competent and autonomousregulator. And while the 2001 Oil and Natural Gas Law and 2002 Electricity Lawboth provide for the creation of full-fledged regulators, a regulatory body hasbeen established but is not yet functioning in the oil and natural gas sector andone still remains to be established in the electricity sector. The WSS sector, for itspart, still lacks a comprehensive and consistent regulatory framework.
• Indonesia also needs to adopt a sound policy framework on public support forprivate projects. Decision makers need to be able to assess the pros and cons ofall possible alternatives (including the adoption of policy and market reformsthat might eliminate the need for public support). They also need to be able toestimate the cost of such support and ensure that such cost is adequately reflectedin public accounts. Among other measures aimed at meeting such objectives,Indonesia might want to consider involving the Ministry of Finance – which hasincentives to minimize the cost of government support to infrastructure and thebroad perspective needed to assess trade-offs between different options - in keydecisions affecting the support that the Government provides to infrastructureprojects.
4. While steps have already been taken and while the task isundoubtedly daunting, the Indonesian Government has no choicebut to redouble efforts to defeat corruption:
• New procurement regulations have been adopted inNovember 2003. Additional regulations, currently inpreparation, are now needed to promote the transparentcompetitive selection of private partners for privateinfrastructure projects.
• The elimination of barriers to entry into infrastructure marketsand further reliance on direct competition between providersof infrastructure services would also narrow the scope forcorruption. Additional steps could be taken as well topromote information disclosure. These measures need to becomplemented by the effective implementation of toughsanctions for those found to have engaged in corrupt practices.
5. Indonesia needs to increase investments in infrastructure by about2 percent to sustain projected growth rates of about 6 percentper year. The various measures listed above would go some waytoward bridging that financing gap. Implementation will take
113
Chapter 6time however and the gap is therefore likely to remain at least in the short-mediumterm. The Government of Indonesia could take steps on two additional fronts tomobilize additional resources for infrastructure:
• The Government should consider increasing spending in infrastructure. In fact, inthe short-medium term, much of the infrastructure financing gap will need to becovered by increased investments by the central Government. Improved taxcollection, an area where Indonesia performs badly compared to neighboringcountries, would help. So would the re-allocation of some unproductive spending(e.g. on fuel subsidies) to infrastructure. Finally, the impressive fiscal consolidationof the last few years – characterized by declining debt and budget deficit - hascreated some space for increased borrowing.
• Steps should also be taken to tap domestic savings for infrastructure investments.An essential precondition is the establishment of an attractive investment climatefor infrastructure where profitable investment opportunities do exist in the sectorand where investors are free to make decisions on the basis of sound commercialcriteria. Additional measures might include: (i) considering whether the regulatoryframework applicable to contractual savings institutions might need to be modifiedin order to enable such institutions to effectively contribute to infrastructurefinancing; (ii) designing social security systems that do not crowd out thedevelopment of contractual saving institutions; (iii) adopting regulatory regimesthat protect those who entrust their savings to those institutions; and (iv)maintaining the macroeconomic stability which supports the predictability ofoperations of contractual savings institutions. The Government may also considerusing public resources to strengthen the capacity of sub-national entities –especially municipalities – to borrow on the local markets. To the extent possible,government schemes for municipal finance should involve the financial sector inallocating credit and sharing risk. Finally, the Government would also have tofocus on creating or upgrading certain aspects of financial market infrastructure,for example by establishing adequate credit rating institutions, a sound governmentbond market, and credible dispute resolution mechanisms.
6. It is essential to devise mechanisms that will enable the poor to have access toinfrastructure services:
• To the extent that cross-subsidy schemes remain necessary in the short term, theyshould be more limited and better targeted at the truly poor (e.g. existing userscould contribute part of the costs of expanding the system to reach new users). Inaddition, they need to be restructured to be compatible with competitive marketstructures (e.g. instead of relying on the incumbent to cross-subsidize the provisionof services to different categories of users, the government could impose a uniformlevy on all companies participating in the market and redistribute those resourcesto the operators who provide services to the poor).
• The Government could opt to channel more of the subsidies intended to help thepoor access and consume infrastructure services through output based mechanisms.It should also design such schemes in ways that maximize competitive pressuresbetween operators (e.g. by organizing competitive bidding processes to identify,on the basis of the lowest subsidy required, the operator that will have the rightto provide the subsidized services).
114
The Way Forward:Prioritizing Reforms
Averting an Infrastructure Crisis: A Framework for Policy and Action
Electric Power1. The most pressing priority in the electric power sector is to adopt implementing
regulations for the 2002 Electricity Law including credible tariff regulations,establishment of the regulatory authority, and adoption of licensing procedures.
2. Given the imminent shortage of natural gas for generating power, the Governmentalso needs to issue regulations related to the 2001 Oil and Gas Law and develop acomprehensive gas sector strategy that includes a rational gas pricing policy (access toreasonably-priced gas is essential to limit the cost of electricity generation and staveoff the need for substantial retail price increases in the future).
3. The Government should be commended for having already started the process ofpartially privatizing PGN. PLN restructuring should proceed according to theGovernment’s sector blueprint.
4. In addition, steps could be taken immediately to enable auto-generators and othersmall electricity producers to distribute to third parties and to establish an appropriateframework to enable them to sell power to PLN or to gain non-discriminatory accessto PLN’s grid to deliver power to other customers as the producers choose.
5. Determining the speed at which market liberalization should take place is one of themain issues facing decision-makers today, and one that will require further carefulanalysis and consideration. Trade offs exist between, on the one hand, the risksassociated with a hasty implementation of complex reform measures, and, on theother hand, the costs incurred because of the reduced incentives for efficiency and theGovernment liabilities generally associated with monopolistic market structures.
6. Further study is also needed to better ascertain the potential of existing captive capacityand to determine which policies and regulatory framework would maximize thecontribution that captive power can make to the development of the sector as a whole.
Water Supply and SanitationPriorities regarding water supply include:
1. Developing an enabling framework to revitalize the sector. Two key objectives wouldbe to revise the allocation of responsibilities in the sector, and to promote the progressiveadoption of sustainable, cost-covering, tariffs (e.g. a national body could be set up toprovide – and publish - advice to local governments on price setting issues).
2. Carrying out a widespread program of PDAM reform, which would include: therestructuring and rescheduling of PDAM debt; corporatization; merging unviablePDAMs; and promoting private sector involvement – especially by local operators –inter alia through the development of adequate regulatory arrangements.
3. Expanding network coverage to meet growing urban demands. Additional resources(including multi-lateral and bi-lateral funding) will need to be passed on to reform-minded PDAMs and local governments to help achieve agreed targets by 2015.
4. Capitalizing on the potential of alternative water providers. The elimination of PDAMs’exclusivity rights, the effective prohibition of anti-competitive practices by PDAMsand by existing vendors, capacity building initiatives aimed at supporting small-scaleoperators, and improving the interface with formal utility provision would all contributeto achieving this objective.
115
Chapter 6
5. Encouraging community-managed provision. The policy framework developed throughWASPOLA needs to be disseminated, an appropriate financing strategy aimed atincreasing access for the poor in rural areas needs to be developed, and capacitybuilding initiatives need to be implemented at the local level.
6. Regulating household self-provision. This would include the establishment of an adequateregulatory regime to ensure quality and minimize environmental impact, as well as thedevelopment of a strategy enabling a future transition to the network system.
Priorities regarding sanitation include:
1. Developing a nation-wide sanitation campaign. This would include measures aimed atsecuring political will, a strategy to ensure that the public is aware of the benefits ofimproved sanitation, and the development of a national sanitation policy and strategy.
2. Developing the institutional and policy framework. This framework will need, interalia, to clarify responsibilities at the central and at the local level, with emphasis – atthe central level – on establishing appropriate standards, mobilizing funding, andassisting local governments, and – at the local level – on developing a multi-providerstrategy, establishing a local regulatory framework, maintaining political will,andbuilding implementation capacity.
116
The Way Forward:Prioritizing Reforms
Averting an Infrastructure Crisis: A Framework for Policy and Action
3. Ensuring pro-active interventions by public authorities, in particular to address thepresent chronic under-investment, to regulate on-site sanitation and prepare thetransition from on-site to network sewerage in large cities, to enhance and replicatecommunity initiatives, and to capitalize on – and regulate – the activities of small-scale private providers.
Roads1. While tax revenues are limited, a strong case can be made for adequately funding
high return capacity expansion projects in the road sector. A recent study of Java’sarterial road network identified a program of upgrading projects whose first yeareconomic rate of return would be 20 percent or more. The investments requiredwould exceed past levels of funding however (the study’s recommended expenditureprogram for the period 2002-2010 foresaw an increase from Rp. 0.5 trillion in 2002to 1 trillion in 2007 and a stabilization of expenditures at that level through 2010).Improved access to remote communities is a priority as well. Given the high costs,these developments cannot compete with other investments in the road sector on thebasis of economic returns and other criteria need to be developed to identify priorityprojects and conditions for government support.
2. Road maintenance, for its part, must progressively become financially self-sustaining.This requires that the current subsidy on gasoline be eliminated and that road userfees be restructured to reflect actual road usage more closely and earmarked to financethe maintenance of the road network. Road funds, and road boards, should beestablished to finance and manage the maintenance of the existing network. Theallocation of road expenditures for maintenance work needs to be improved, interalia through more effective use of existing tools such as the Indonesia Road
Management System. Finally, steps need to betaken to ensure that road works yield bettervalue for money (e.g. road funds need to relyon competitive and transparent procurementprocesses, independent technical and financialaudits should become mandatory, and output-based contracting should be introduced).
3. The institutional and regulatory frameworkfor toll roads needs to be strengthened:Regulatory and operational roles of JasaMarga should be separated to allow it tooperate as a viable company; a nationalIndonesian toll road authority should beestablished that is responsible for conces-sion agreements; an appropriately struc-tured formula should enable the automaticadjustment of toll rates; transparent andcompetitive procedures need to be im-plemented for soliciting bids for toll roadprojects; issues of land acquisition andrights of way need to be addressed; and
117
Chapter 6sound policies are needed to determine the conditions under which government supportshould be extended to toll road projects. Provision for many of these changes willneed appropriately reflected in the draft amendments to the 1980 Road Law nowbeing prepared by MSRI, and in a new Government Regulation on Toll Roads thatwill replace GR 8/1990.
4. Law 13/1980 on Roads and Law 14/192 on Road Traffic and transport are currentlybeing amended. Preparation of a comprehensive roadmap for the road and road transportsector should be prepared to identify with precision the policy and institutional reformsthat should be reflected in the new laws. It is essential, in particular, that the newlaws provide a more conducive environment for private participation, inter alia byintroducing an improved framework for the development and operations of toll roadsand by creating the legal basis for the introduction of road funds.
Telecommunications1. A first priority is to intensify and entrench pro-competitive policies in the sector.
Telkom’s and Indosat’s remaining exclusive rights should be eliminated as soon aspossible and the Government might want to take specific steps to increase competitionin basic telephony services. To facilitate increased competition in the local market,the rebalancing of local and long distance tariffs needs to take place (the Governmentshould, in particular, fully implement the 45% tariff increase over 3 years alreadyagreed with the DPR). Establishing an adequate interconnection regime and improvingthe licensing and radio spectrum management are other important pro-competitionmeasures that need to be adopted.
2. The existing regulatory body needs to be substantially strengthened. BRTI needs to beprotected from undue government and industry pressure. It also needs to receive theresources required to recruit highly qualified professionals and to engage world classprofessional advisors as needed.
3. In order to increase access to telecommunications services in rural areas, theGovernment should rely on output-based schemes rather than on direct publicinvestments.
4. The 1999 sector blueprint should be reviewed to emphasize the importance ofcompetition and autonomous regulation, and reflect the adopted policies on tariffs,interconnection, universal service obligations, and radio spectrum management. Anew telecommunications law could be drafted afterwards, in line with the revisedsector blueprint.
5. Finally, institutional reforms are needed to ensure that the measures identified above(the importance of which has been recognized for a long time by Indonesian publicauthorities) are effectively implemented. One approach would be to use an existingor new ministerial-level interdepartmental committee, chaired by the CoordinatingMinistry for Economic Affairs, to begin implementation planning. The committeewould need to be given instructions, resources and target dates to reviewtelecommunications development policies and issues, undertake consultations, andbegin development of specific plans to implement the key reforms identified above.


BackgroundSector Reports I-IV

Averting an Infrastructure Crisis: A Framework for Policy and Action120
IElectric Powerse
ct
or
121
T he ultimate soundness of a power sector is measured by its ability to supply electricity to allcustomers reliably and efficiently. In the case of Indonesia, the sector also needs to expand
power rapidly to the remaining 40% of the population without it – 90 % of whom are poor. Despitethe Government’s commendable efforts over the past few years which have resolved some of the keysector issues, Indonesia’s power sector at this juncture can still make significant strides in all threeareas – reliability, efficiency and access.
ReliabilityOverall, the reliability is borderline; while the economy will not slow to any great degree or grind toa halt due to power supply interruptions, the system would surely benefit from a comfortable, safemargin of reliability. This assessment is based on relatively rigorous analyses of how the system willfunction as demand increases. Based on these analyses, Indonesia’s sporadic power shortages willpersist, particularly in the outer islands, but major, long duration blackouts are not imminent unlessinvestment halts completely over the next three-four years (which is unlikely). If such blackouts dooccur, they will most likely be due to inadequate or insufficient physical infrastructure resulting froman inability to meet financing needs. An additional threat to increasing reliability is the constraint ondelivery of natural gas to the sector.
It is estimated that demand will grow by an average of 6% per year between 2004-2012. Thiscorresponds to a total of US$16-US$18 billion in investment needs: US$12-US$12.5 billion forgeneration, US$2.5-US$3.5 billion for transmission and US$1.7-US$2 billion for distribution. A failureto meet these needs will result in insufficient or inadequate physical infrastructure and decreasedreliability.
122
Electric Power
Averting an Infrastructure Crisis: A Framework for Policy and Action
The bulk of funds will have to come from private sector (domestic orinternational) rather than PLN’s internal cash reserves or multilateral/bilateral lending and guarantees. PLN’s finances are precarious, despite 10consecutive quarterly tariff increases, which has brought the average rateto 7 cents/kwh. This level is unlikely to rise next year, due to elections.Even after the election, it would be difficult to hike the average tariff muchmore. Given the tariff increase limitation and other constraints discussedin the text, PLN’s contribution from its own resources could not be morethan US$3 billion from 2004-2012. Second, multilateral/bilateralcontributions to PLN’s capital investments from 2004-2012 will be anestimated US$2-US$2.5 billion (this is in addition to the ongoing andcommitted projects). Thus, the balance will need to come from the privatesector, either domestic or international.
However, Indonesian investors have not been major contributors to theenergy sector in the past, partly because the domestic capital market isunderdeveloped. Thus, it is estimated that domestic capital will accountonly for US$1-US$1.5 billion from 2004-2012. The bulk (about US$10-US$11 billion) will have to be international capital, but two obstaclesexist. First, investors globally have pulled back from the energy sector, andsecond, they insist on full Government guarantees, which the Governmentis reluctant to provide.
To break this impasse, Indonesia must develop a new framework forsharing the risks. The first step is to more accurately understand investors’expectations about risks and risk-sharing. Also, the Government needs toexpedite to create the regulatory agency and to promulgate the newregulations, and provide clear signals on the future direction of the sectorstructure including for outside Java-Bali; these actions will substantiallyreduce investors’ estimates of the risks.
With US$ 14 billion in contingent liabilities, Indonesia’s priority shouldbe to minimize future contingent liability by unbundling the risks theGovernment assumes, and by devising mechanisms by which some ofthese risks can gradually shift to the private sector. The Government shouldoffer performance guarantees when needed – to overcome perceived countryrisk problems (associated with the projects) – but not for risks that arepurely commercial.
Another threat to increasing reliability is the constraint of natural gasdelivery to the power sector. It is expected oil use will decline to about halfits current level by 2010. As the oil consumption in the power sectordeclines, coal and natural gas consumption will rise. While coal willcontinue to play an increasingly important role in the power sector, themain issue is the availability of natural gas. Although the country has largereserves of gas, its domestic use has been constrained, most importantlydue to the flawed price structure. Under the present cost-value pricestructure, major distortions exists which have slowed the growth of thegas industry and are a disincentive for producers to supply gas to thedomestic market.
EfficiencyWhile it is difficult to determine if PLN’s inefficiencies stem from itspractices or Government actions/policies, PLN consultants found thatample room exists for improvements—as is true of other utilities in theregion. PLN’s inefficiencies reportedly were US$600-US$800 million ayear. Responding to the consultants’ report, PLN began an Efficiency DriveProgram three years ago to review its operations and has since improvedsome of its practices. Power sector efficiency is also measured by examiningthe losses; PLN’s losses are 12%, which is in the mid-range for the utilitiesin the region.
Increasing efficiency is also possible through sector reform. In September2002, Indonesia passed its first modern electricity legislation (Law No. 20)that provides for a market-based operation that takes into accountenvironmental, energy conservation, safety and diversification issues withina competitive market. Also, the law states that an independent regulatoryagency (EMSA) be established within one year of its enactment (by September2003), funded by the Government and fees from licenses. The EMSA’sproposed structure and responsibilities seem sound, although it has notyet been established.
PLN, a limited liability company, is partially unbundled. Recent restructuringincluded (a) placing new plants under a new (third) generation subsidiary;(b) dividing the transmission company (P3B) into two separate units; and(c) creating PLN IPP Trader company to handle all IPP matters, as well asa proxy for a single-buyer model (SBM). To further unbundle andcorporatize its activities, PLN arranged (a) binding contracts between thetwo subsidiaries and the single buyer (SB) unit, (b) transmission serviceagreements between the transmission company and the SB unit, and (c) abulk power supply agreement between the SB unit and distributioncompanies.
Given PLN’s organizational changes and the law’s provisions, broadly,two alternatives can be envisioned for the sector’s structure: The single-buyer model (SBM), or multi-buyer, multi-seller (MBMS) model, with thepossibility of an interim wholesale competition (WSC). Considering thearray of the requirements for moving to what appear to be a MBMS modelunder the Law, it is difficult to see how they could be met in the next four-six years. When all elements are taken into account, a practical (and likely)approach for now would be to insure (a) an effective SBM is establishedwith the necessary regulations issued, (b) the EMSA is up and running, and(c) the sector experiments with a small-scale MBMS model, and graduallydevelops a more mature one over the next several years.
AccessOverall, the country’s rate of electrification is about 53%, which meanssome 90 million people still do not have access to electricity. Per capitaannual consumption at 380 kwh is among the lowest in the region and theshare of biomass in total energy is about 32%, one of the region’s highest.Although the low rate of electrification is a major problem, and calls for anaccelerated plan to expand the residential supply, meeting the demand ofthe remaining unserved population in Indonesia will be difficult–largelydue to the country’s geography and the location of rural populations.
In Java Bali, where over 96% of the villages are electrified, expansionmainly involves “intensification” within the existing network, and
123
IBackgroundSector Report
the pace of electrification is faster than outside Java-Bali. If PLN continuesconnections at the present pace, Java-Bali’s electrification will approach95%-98% in about 13-15 years. However, outside Java-Bali, only about70% of villages are electrified, and it will take significantly longer to provideresidents with power. Further, connections costs for outside Java-Bali are,on average, about 33% higher than for Java-Bali. Therefore, it is not expectedthat Indonesia will approach 100% electrification any time soon.
Expansion in rural areas outside Java Bali (and some of the rural areaswithin Java Bali), need and should not rely entirely on PLN’s gridconnections. Once a clear power sector structure for outside Java Bali isdesigned, and regulations are issued for grid and tariff codes, together withrecent decentralization laws, several options will exist with which toaccelerate electrification in the rural areas outside Java-Bali. To assessthese options, a rural electrification strategy must be devised which wouldestablish optimal electrification schemes and targets, particularly for areasthat cannot be supplied through grids for many years.
Self-generated (captive) power plays an important role in supplying electricityto various sectors of the economy. While estimates vary, Indonesia hasabout 15,000 MW of installed self generation capacity which produceabout 44000 GWh electricity. Although theoretically this could supplementthe country’s electricity supply significantly, a closer look at the structureof the captive power capacity and utilization presents major technical andbusiness-philosophy issues that limit the extend that these plants can beexpected to supply power to national grid. Nonetheless, the captive power’srole in the sector will continue and therefore it is important that Indonesiaprepare a strategy to integrate them into the sector.
The Way ForwardThe most pressing issue is for the Government to promulgate theimplementing regulations for the 2002 Electricity Law, since these are keyto resolving most pending issues. The draft has been in an advanced stagefor over a year. While all eight regulations need to be promulgated in thenear future, the most critical are those that establish the regulatory agency(Electricity Market Supervisory Agency—EMSA), set tariffs (including thewheeling charges) and adopt licensing procedures. Once EMSA is established,the Government should immediately fund and staff the agency and appointits top staff—which was supposed to have occurred by last September.
Given the imminent shortage of natural gas for generating power, theGovernment should issue regulations related to the 2001 Oil and GasLaw. Also, it needs to develop a comprehensive gas sector strategy thatwould include (a) introducing a rational gas pricing policy, and (b)restructuring and partially privatizing PGN. (Studies on both these topicsare on-going and should be available in the next six months).
Once tariff regulations are issued, policy makers and regulators need toaddress three tariff issues. These include: (a) providing a more accurateand quantifiable definition for the term “economic value” – as it applies inthe Law to the sale price of electricity (tariff); it must also define the term“reasonable profit”; (b) providing a formula to automatically adjust electricityprices and a firm date to apply it; (c) resolving the matter of the two majorcross-subsidies (from high and medium to low voltage consumers, andfrom Java-Bali to outside Java-Bali consumers). With regard to the firstcross-subsidy issue, the Government needs to articulate its policy and,
together with the regulators and PLN, agree on a permanent mechanism tohandle it. With the second, since the law provides for applying a levy forthis purpose (to the transmission and distribution systems in areas wherecompetition exists, in order to build systems in less developed areas), theGovernment and regulators must issue the necessary regulations and,together with PLN, create mechanisms for applying them.
PLN must develop an investment plan, including a core plan, for betweennow and 2012, along with criteria for forecasting demand, fundingrequirements, sources of funds (particularly from PLN’s internal cash),and the implications if goals are not met. Additionally, the Government/PLN must finalize settlement on the remaining five IPPs, settle litigationwith the Karaha Bodas IPP, and assess the lessons from the Indonesian IPPprogram, so as to incorporate them when preparing the risk-sharing policy.
To close the gap with private investors, Government must hold the agreed-upon meetings with the private sector/stakeholders together with WBG,ADB and JBIC so as to (a) detail recent progress in the power sector, (b)provide a realistic assessment of the sector including the regulations andregulatory agency, and the structure both within and outside Java-Bali and(c) more fully understand the private sector’s concerns.
Government must (a) unbundle the risks associated with future PPAs andadopt a formal risk allocation/sharing policy along the lines recommendedin the report, to minimize contingent liability, and (b) begin devisingpolicy on the treatment of contingent liability in the national account.
To improve sector efficiency, PLN must update its efficiency program,describing its accomplishments and the timeframe for resolving remainingissues identified by its consultants, in a format that can be quantified andmonitored. Furthermore, Government must set clear guidelines—consistentwith the Law, implementing regulations and the current direction of thesector, including existing and firmly planned infrastructure—about its intenton the medium and long term structure of the sector, with respect to thesingle-buyer (SBM) or multi-buyer, multi-seller market model (MBMS),and a timeframe for introducing them. It must also articulate policy for theelectricity sector outside Java-Bali, where widespread commercially viableoperations are not envisaged in the near future.
This report’s recommendations with respect to the structure of the sector forJava-Bali is to ensure that (a) an effective SBM, with regulations to support it,is established, and that the regulatory agency is functioning (SBM must beregulated with respect to bulk supply tariffs and the least-cost solution fortransmission and generation); also, that (b) the sector experiments with asmall-scale MBMS model, and subsequently develop a mature MBMS overthe next several years—provided that in the meantime PLN movesaggressively to improve its efficiency, fully unbundling and corporatizing itsfunctions. With respect to timeframe, Indonesia’s transition to a MBMS
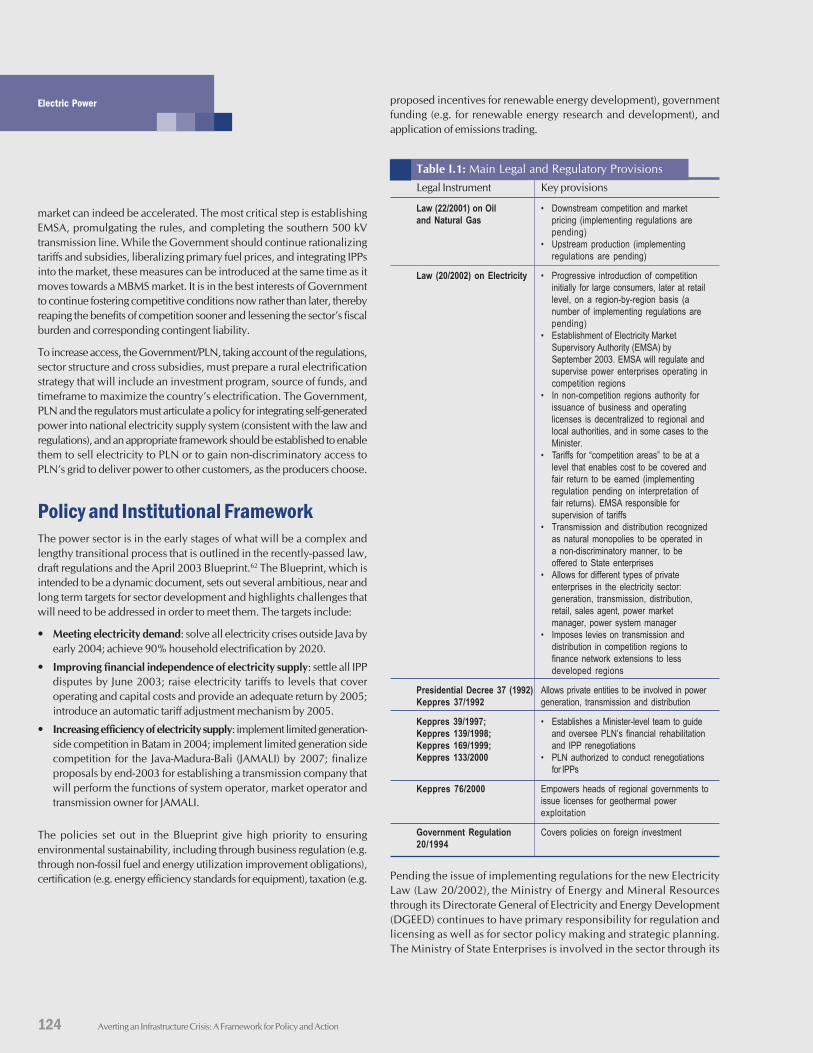
124
Electric Power
Averting an Infrastructure Crisis: A Framework for Policy and Action
market can indeed be accelerated. The most critical step is establishingEMSA, promulgating the rules, and completing the southern 500 kVtransmission line. While the Government should continue rationalizingtariffs and subsidies, liberalizing primary fuel prices, and integrating IPPsinto the market, these measures can be introduced at the same time as itmoves towards a MBMS market. It is in the best interests of Governmentto continue fostering competitive conditions now rather than later, therebyreaping the benefits of competition sooner and lessening the sector’s fiscalburden and corresponding contingent liability.
To increase access, the Government/PLN, taking account of the regulations,sector structure and cross subsidies, must prepare a rural electrificationstrategy that will include an investment program, source of funds, andtimeframe to maximize the country’s electrification. The Government,PLN and the regulators must articulate a policy for integrating self-generatedpower into national electricity supply system (consistent with the law andregulations), and an appropriate framework should be established to enablethem to sell electricity to PLN or to gain non-discriminatory access toPLN’s grid to deliver power to other customers, as the producers choose.
Policy and Institutional FrameworkThe power sector is in the early stages of what will be a complex andlengthy transitional process that is outlined in the recently-passed law,draft regulations and the April 2003 Blueprint.62 The Blueprint, which isintended to be a dynamic document, sets out several ambitious, near andlong term targets for sector development and highlights challenges thatwill need to be addressed in order to meet them. The targets include:
• Meeting electricity demand: solve all electricity crises outside Java byearly 2004; achieve 90% household electrification by 2020.
• Improving financial independence of electricity supply: settle all IPPdisputes by June 2003; raise electricity tariffs to levels that coveroperating and capital costs and provide an adequate return by 2005;introduce an automatic tariff adjustment mechanism by 2005.
• Increasing efficiency of electricity supply: implement limited generation-side competition in Batam in 2004; implement limited generation sidecompetition for the Java-Madura-Bali (JAMALI) by 2007; finalizeproposals by end-2003 for establishing a transmission company thatwill perform the functions of system operator, market operator andtransmission owner for JAMALI.
The policies set out in the Blueprint give high priority to ensuringenvironmental sustainability, including through business regulation (e.g.through non-fossil fuel and energy utilization improvement obligations),certification (e.g. energy efficiency standards for equipment), taxation (e.g.
proposed incentives for renewable energy development), governmentfunding (e.g. for renewable energy research and development), andapplication of emissions trading.
Table I.1: Main Legal and Regulatory Provisions
Legal Instrument Key provisions
Law (22/2001) on Oil • Downstream competition and marketand Natural Gas pricing (implementing regulations are
pending)• Upstream production (implementing
regulations are pending)
Law (20/2002) on Electricity • Progressive introduction of competitioninitially for large consumers, later at retaillevel, on a region-by-region basis (anumber of implementing regulations arepending)
• Establishment of Electricity MarketSupervisory Authority (EMSA) bySeptember 2003. EMSA will regulate andsupervise power enterprises operating incompetition regions
• In non-competition regions authority forissuance of business and operatinglicenses is decentralized to regional andlocal authorities, and in some cases to theMinister.
• Tariffs for “competition areas” to be at alevel that enables cost to be covered andfair return to be earned (implementingregulation pending on interpretation offair returns). EMSA responsible forsupervision of tariffs
• Transmission and distribution recognizedas natural monopolies to be operated ina non-discriminatory manner, to beoffered to State enterprises
• Allows for different types of privateenterprises in the electricity sector:generation, transmission, distribution,retail, sales agent, power marketmanager, power system manager
• Imposes levies on transmission anddistribution in competition regions tofinance network extensions to lessdeveloped regions
Presidential Decree 37 (1992) Allows private entities to be involved in powerKeppres 37/1992 generation, transmission and distribution
Keppres 39/1997; • Establishes a Minister-level team to guideKeppres 139/1998; and oversee PLN’s financial rehabilitationKeppres 169/1999; and IPP renegotiationsKeppres 133/2000 • PLN authorized to conduct renegotiations
for IPPs
Keppres 76/2000 Empowers heads of regional governments toissue licenses for geothermal powerexploitation
Government Regulation Covers policies on foreign investment20/1994
Pending the issue of implementing regulations for the new ElectricityLaw (Law 20/2002), the Ministry of Energy and Mineral Resourcesthrough its Directorate General of Electricity and Energy Development(DGEED) continues to have primary responsibility for regulation andlicensing as well as for sector policy making and strategic planning.The Ministry of State Enterprises is involved in the sector through its
125
IBackgroundSector Report
role as shareholder of PLN, and has primary responsibility for overseeingPLN’s performance and guiding its corporate restructuring and privatization.Regional governments have until recently had no role in the sector andfew have yet started to undertake functions that are assigned to them underthe new law.
Until the regulations are promulgated, Authority to set the basic electricitytariff (TDL) remains with the President. During the Suharto era thePresident’s authority was absolute, but decisions are now taken only afterextensive discussion within Cabinet and consultation with the DPR. Priorto the crisis the level of the average retail tariff was determined primarilyby financial covenants on World Bank and ADB loans, and specifically arequirement to achieve an 8% rate of return (ROR) on revalued fixedassets in operation.
Policies and procedures for private participation in the sector were definedby Presidential Decree 37 of 1992 (Keppres 37/1992), which stipulatedthat private entities could be involved in power generation, transmissionand distribution.63 This decree paved the way for unsolicited projectproposals, gave preference to the build-own-operate (BOO) model, requiredtariffs to be expressed in Rupiah and approved by the Minister, andprohibited Government from guaranteeing invested equity or debt serviceobligations. Keppres 76/2000 empowers heads of regional government toissue licenses to exploit geothermal resources.
The key change to be introduced by Law 20/2002 is that its transitionalprovisions stipulate that at least one region should be applying competitionin generation within five years and that an Electricity Market SupervisoryAgency (EMSA) should be established within one year. The law stressesthat EMSA will be independent, funded through a Government-allocatedbudget and fees from licenses.
The decision for a region to shift to a competitive market structure isrequired to be made by Government Regulation and to have regard toregion-specific factors such as adequacy of retail tariffs to provide acommercial return, adequacy of competition in primary energy supply,presence of sufficient capable and reasonably balanced generators, andthe capacity of other parts of the system to support competition. The EMSAis required to be in place and the market rules and codes adopted beforecompetition can commence. The ‘wires’ businesses of transmission anddistribution are recognized as natural monopolies that must be operatedin an open and non-discriminatory manner, and are required to be offeredin the first instance to State enterprises.
Any enterprise wishing to participate in the supply of electricity to thepublic is required to hold a business license (IUPL). Seven main businesstypes are identified, namely: generation, transmission, distribution, retail,sales agent, power market operator, and power system operator.64
Enterprises wishing to provide power for their own use are required toobtain an operating license (IO).
Law 20/2002’s provisions with respect to planning, licensing, regulationand supervision differ for competition and non-competition regions. TheEMSA will be responsible for regulating and supervising power enterprisesoperating in competition regions. Its duties will include preventing unhealthycompetition, regulating retail tariffs for customers with low voltageconnections, regulating tariffs for transmission and distribution systemuse, issuing business licenses, arranging public consultation and establishingcomplaints handling procedures, facilitating dispute resolution, supervisingimplementation of business license conditions, and imposing administrativesanctions for license violations. It will also be responsible for defining theboundaries of competition areas and for establishing market rules and the
transmission grid code. The EMSA will be accountable to the President,with its members being appointed by the President with the approval ofthe DPR.
In non-competition regions, authority for licensing and regulation will bedivided among the different levels of government. A bupati (district head)/walikota (mayor) may issue business and operating licenses for enterpriseswhose activities are located entirely within the kabupaten (district) / kota(municipality) and not connected to the national grid. Likewise a governormay issue licenses for enterprises whose activities span kabupaten or kotaboundaries but are located entirely with a province and not connected tothe national grid. Authority to issue licenses for enterprises whose activitiesspan provincial boundaries and / or are connected to the national grid willcontinue to reside with the minister.65
For competition regions, Law 20/2002 provides for the price of bulkpower supplied to consumers connected at high and medium voltage tobe set by fair competition, with EMSA having the role of market supervisor.However where there is a ‘single buyer’ structure, the EMSA is required toregulate tariffs for all consumer categories. In non-competition regions,tariffs are to be set by central or regional government according to theirlicensing authority. In regulating power prices or tariffs, the responsibleentity is required to consider factors including production costs, enterpriseefficiency, quality and reliability of supply, industry and commercial norms,scarcity and characteristics of primary energy sources used, and affordability.
Overall responsibility for sector strategic planning is vested in government.Regional governments are required to prepare Regional ElectrificationPlans (RUKD) and central Government is required to prepare a NationalElectrification Plan (RUKN) based on the RUKDs and inputs from civilsociety. More detailed Power System Development Plans (RPSTL) arerequired to be prepared by the Power System Manager (PSM) in the caseof competition regions and by the responsible State enterprise in the caseof non-competition regions.
Law 2/2002 includes provision for imposition of levies on transmissionand distribution facilities in competition regions and requires that theproceeds be used to finance the development of transmission anddistribution networks in less developed regions.66 The law also stipulatesthat Government and regional governments shall provide funds for thedevelopment of power supply facilities to assist the less privileged, to serveless developed and isolated areas, and to support village electrification.
126
Electric Power
Averting an Infrastructure Crisis: A Framework for Policy and Action
Sector Structure and OwnershipPT Pelayanan Listrik Negara (PLN)PLN is a Persero (a limited liability, almost-integrated utility), consisting ofPLN Pusat (its holding company), two wholly–owned subsidiaries that aregeneration companies (Indonesia Power and PJB), one strategic businessunit (SBU) that is a transmission company (P3B) and five SBUs that aredistribution companies. Retail operations are run through retail businessunits. This organization was designed to separate policy and strategicdecision making from operations. The former is conducted through aBoard of Directors consisting of five directors (one each for generation,transmission and distribution, retail and commercial, finance and humanresources) as well as the president of the company.
PLN is accountable to the (a) Ministry of State-Owned Enterprise, which isthe Government’s designated corporate owner of PLN, (b) Ministry ofEnergy and Mineral Resources, which makes energy policy and issuesregulations, and (c) Ministry of Finance, which is the financial owner ofPLN. The Government’s daily oversight of PLN is conducted by a Board ofCommissioners whose members include representatives of the threeministries and others.
Further features of its structure include the following: (a) in preparing forfuture multi-generation companies, PLN is placing the new plants under anew (third) generation subsidiary; (b) the transmission company (P3B) isdivided into two units: One owns, operates and maintains the transmissionassets, while the second deals with system operations, including dispatchand scheduling; and (c) PLN has created an IPP Trader company, as wellas a proxy for a single-buyer model (SBM) for administering the contractswith the two generation subsidiaries and for billing the five distributionunits.
To move forward to full corporatization of its generation, transmissionand distribution, PLN has arranged (a) binding contracts between the twosubsidiaries and the single buyer (SB) unit, (b) transmission serviceagreements between the transmission company and the SB unit, and (c) abulk power supply agreement between the SB unit and distributioncompanies. However, licenses for generation, transmission, distributionand the SB companies/units have not yet been issued: The regulation forlicenses needs to be issued first, and EMSA is not in place yet.
PLN’s installed generating capacity has grown from less than 800MW inthe mid 1970s to around 20,800MW by end-2002. The public supply hasbeen augmented over the past four years by the commissioning of IPPplants with capacity totaling around 3,050MW. The JAMALI grid accountsfor around 18,600MW, including around 2,850MW of IPP capacity.
The Independent Power Producer (IPP) ProgramIn 1990 Indonesia solicited bids for its first IPP projects, Paiton I andPaiton II in East Java, with both bidders ultimately being awarded contracts.The Power Purchase Agreement (PPA) for Paiton I was signed in February1994 and financial closing was achieved some fourteen months later, justdays after the signing of the PPA for Paiton II. In the interim Keppres 37/1992 had unleashed a flood of unsolicited project proposals, enabling 26PPAs and Energy Sales Contracts (ESCs) to be signed by the time the crisisstruck in mid-1997.67 These agreements covered some 10,800 MW capacityand a projected investment of circa US$13-US$14 billion, with developerssecuring ‘support’ letters under which Government committed to causePLN to meet its contractual obligations.68
A declining step tariff structure was adopted for Paiton I and several of the11 geothermal IPP plants, while agreements for other plants provided forfully levelized tariffs. Power purchase tariffs typically comprised fourcomponents: capacity, fixed operation and maintenance, energy, andvariable operation and maintenance. Expressed as a composite, the lowesttariff was around US 5.75 cents for the competitively solicited Tanjung JatiA (coal, 1,320 MW). At the other end of the range, initial period tariffs forPaiton I and most geothermal plants with declining step structures wereabove US 8 cents (and hence well above the prevailing average retail tariff,even before account was taken of system losses).
When the Rupiah commenced its sharp decline, the Government movedquickly to postpone or put on hold many major power and otherinfrastructure projects. Keppres 39/1997, issued in September 1997,allowed 9 power projects to proceed in accordance with their PPAs / ESCsbut caused others, in whole or in part, to be postponed or subject toreview.69 PLN later announced its intention to renegotiate all contractswith IPPs and in the interim to make payments at a pre-crisis rate of Rp.2,450 to the US$.
As of March 2003, PLN had reached agreement on amended tariffs andterms and conditions with 14 IPPs, of which seven have operating plants.Five of these – Paiton I (Coal, 1230 MW), Paiton II (Coal, 1220 MW),Gunung Salak (Geothermal, 197 MW), Drajat (Geothermal 72MW) andCikarang (CCGT, 348 MW) – are on Java, while two – Sengkang (CCGT,135 MW) and Pare Pare (Diesel, 60MW) – are on Sulawesi. Renegotiatedtariffs are mostly in the range US 4.2 - 4.93 cents, with the exception beingthe diesel-fueled Pare-Pare plant at around US 5.5 cents. In at least oneinstance, an amended agreement provides for extension of the originalconcession period while several include provision for payment of accruedarrears. The Tanjung Jati B project (Coal, 1320 MW), whose constructionwas halted by the crisis, is a special case and has been restructured as abuild, lease and transfer scheme with PLN as operator and with Governmentproviding support through a liquidity facility. This plant now is scheduledto come on stream in 2006.70
Negotiations have been concluded for a further five geothermal IPPs ofwhich Wayang Windu (Java, 110MW) is in operation and Dieng (Java,60MW) is close to being in operation. Field exploration and developmenthas commenced at the other three, namely Patuha (Java), Sarulla (NorthSumatra), and Bedugal (Bali). However, final steps to complete the processhave yet to be taken. Seven contracts have been closed out and one is inprocess of litigation.71
127
IBackgroundSector Report
Captive PowerIndonesia has substantial supply of captive power. Unfortunately, aconsistent set of reliable data and information regarding the capacity of thecaptive power plants (CPPs) and their utilization do not exit, partly becausemore than 60% of the plants are small and scattered around the country(in about 10,000 companies). However, it is estimated that the country’sinstalled capacity of CPPs in 2003 was about 15,000 MW, and that theplants generated about 44,000 GWh of electricity.72
A CPP is constructed by an industry or commercial entity to producepower for its own use. These plants developed in Indonesia becausevarious sectors—particularly manufacturing—found that electrical powerfrom the grid was either unavailable or unreliable(although the price ofdiesel oil was heavily subsidized, this “incentive” factor did not play animportant rule in the growth of CPPs). Industrial sector began to installdiesel generators during 1980s. CP capacity grew by 4%-5% a year duringthis decade. By the end of the decade and into the early 1990s, as industrialoutput soared and PLN’s power shortages became more frequent, CPgrew even more rapidly, at an average rate of 9% a year.
Since 1994, their growth dropped to 3.5%–4% a year, largely becausePLN’s supply had become more reliable. Where more plants wereconstructed, it was largely due to increase in co-generation capacity, whichproduce both power and heat at a very competitive price. In fact, it isexpected that while the relative importance of captive power will decline,companies will continue to build co-generation plants.
However, CPPs will, for many reasons, continue to play an important rolein the sector. First, it is expected that manufacturing will continue toexpand, and industries will use CPPs , particularly in co-generation. Second,a realistic future scenario will almost certainly present a restructured powersector, with open access to new entrants as well as regulations for wheelingcharges to sell to a third party, and to trade electricity in a multi-buyer,multi-seller (MBMS) market. In such a market, some of the larger CPPsmight choose to spin off and form electricity supply subsidiaries to theirindustrial parent companies. Last, some of the geographical areas in thecountry will still not have access to PLN’s grid in the foreseeable future,and could use the CPPs to meet their electricity needs. All these factor willgive new momentum to the CPPs, which can then act as catalysts—openingthe sector to more competition and accelerating the development of theMBMS market.
Therefore, it is important that Indonesia prepare for a future that includesCPPs, devising a strategy to incorporate them into the sector (see the BoxI.1).
Primary Energy SupplyIndonesia is richly endowed with fossil fuels and with hydro, geothermal,and other renewable energy resources. While the most abundant resourcesare located in the outer islands, Java nonetheless has significant oil, naturalgas, hydro and geothermal resources. The pattern of primary energy use bythe power sector has been significantly influenced by Government policies,and in particular by the pricing of petroleum fuels. These have favored theuse of oil for power generation and in 2001 some 37% of PLN’s installedcapacity was oil-fueled.
Box I.1. Integrating Captive Power Plants (CPPs)in the Power Sector
It is important that Indonesia devise a strategy to integrates CPPs into thesector. This will require (a) obtaining a better understanding of theirphysical and operational status, (b) preparing well-defined policies tointegrate them into the sector; and (c) issuing the regulations for the CPPs(which include those for the wheeling charges, a vital step for the CPPsto sell their excess electricity to the grid).Such policies must respond to the CPP owners’ concerns, includingmechanism to share the risk if fuel becomes unavailable, and reasonableprovisions for wheeling, transmission and distribution loss charges forCPPs that sell their excess electricity.Equally important, the policies must consider the impact of the CPPs onthe sector. Some of the issues they must address are (1) concern aboutthe reliability of the CPP power supply to the grid as a source of “firm”power, given their small size and industrially-geared operations, (2) theenvironmental impacts of the CPPs, given the type of fuel they use (i.e.mainly diesel) and the high emissions per unit of production compared tolarger plants, and (3) the revenue impact on the sector, since CPPs aremostly in manufacturing, which produces higher revenues for the utilitydue to higher tariffs and less administrative work (ie. more efficient billingand collection systems).Fortunately, the recently-enacted electricity law includes provisions for“own interest” generation: It formalizes the present liberal licensing policyby allowing prospective CPP owners to apply for “operating licenses” fromthe regents, mayors, governors and the Ministry of Energy and MineralResources (MEMR), depending on their size and location. The law alsoallows those who hold operating licenses in “competition areas” to sellexcess electricity by obtaining licenses from the regulatory agency; in thenon-competition areas, excess electricity can be sold by obtaining licensesfrom authorized provincial officials, or from the MEMR, as indicated above.Further, the law states that transmission and distribution grids must be“open to all.” Thus, in principle, no laws prevent the CPPs from supplyingtheir excess electricity to PLN through the grid, or to third parties, eitherthrough PLN’s grid or through an independent transmission line.However, rules and regulations—which have not yet been developed—must clarify important issues. These include wheeling charges,transmission and distribution losses, limits on the CPPs’ capacity (ifany), cost recovery for connecting to the grid, “banking” electricity, andproviding guidelines/price for the “firm” and “unfirm” supply.Some of these issues have far-reaching implications and must beaddressed by the regulatory agency that has not yet been created. Forexample, should wholesale consumers/distributors be allowed to havetheir own generation plants and thus avoid transmission charges? If theanswer is yes, it would increase the potential for stranded costs (seesection VII.2.b). Also, allowing major customers to build generation plantswould not be fully in line with the single buyer model (see section VII.2.b).Thus, the Bank recommends that the Government initiate a study toreview and update the information related to the country’s CPPs. Oncethis is accomplished, the Government should sharpen and better articulatethe policies so they are compatible with the recently-passed law andissue the necessary regulations with respect to own-interest powergeneration.
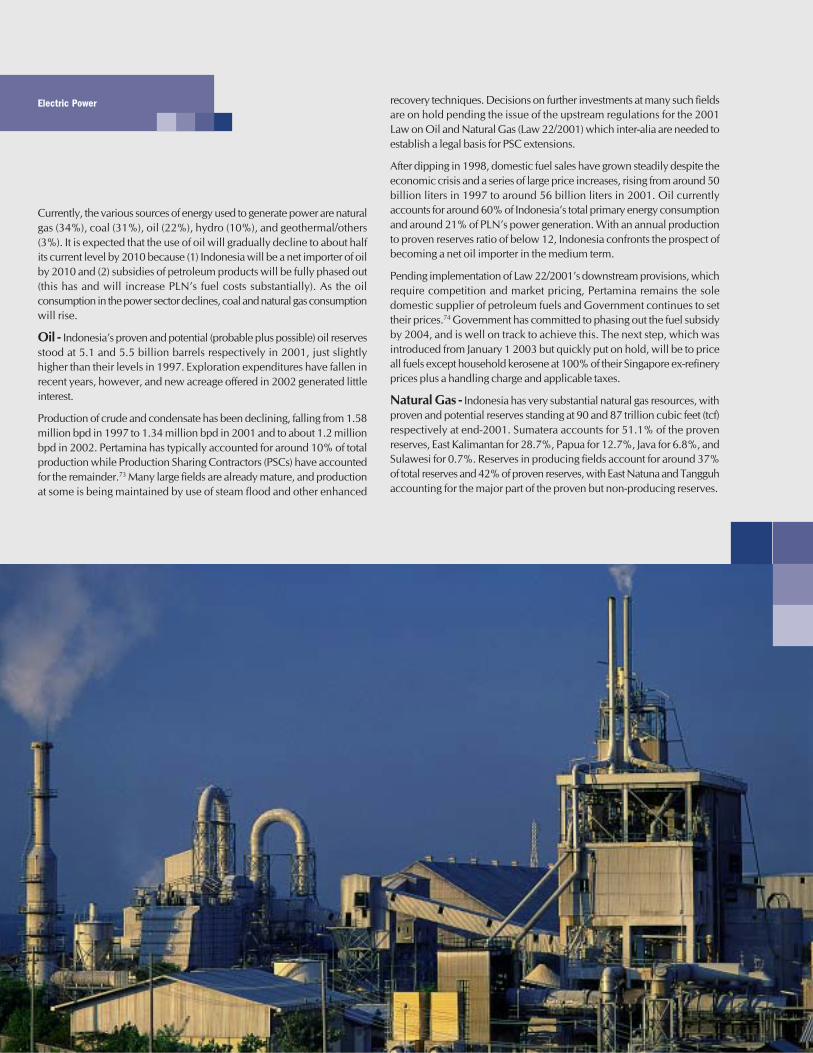
128
Electric Power
Averting an Infrastructure Crisis: A Framework for Policy and Action
Currently, the various sources of energy used to generate power are naturalgas (34%), coal (31%), oil (22%), hydro (10%), and geothermal/others(3%). It is expected that the use of oil will gradually decline to about halfits current level by 2010 because (1) Indonesia will be a net importer of oilby 2010 and (2) subsidies of petroleum products will be fully phased out(this has and will increase PLN’s fuel costs substantially). As the oilconsumption in the power sector declines, coal and natural gas consumptionwill rise.
Oil - Indonesia’s proven and potential (probable plus possible) oil reservesstood at 5.1 and 5.5 billion barrels respectively in 2001, just slightlyhigher than their levels in 1997. Exploration expenditures have fallen inrecent years, however, and new acreage offered in 2002 generated littleinterest.
Production of crude and condensate has been declining, falling from 1.58million bpd in 1997 to 1.34 million bpd in 2001 and to about 1.2 millionbpd in 2002. Pertamina has typically accounted for around 10% of totalproduction while Production Sharing Contractors (PSCs) have accountedfor the remainder.73 Many large fields are already mature, and productionat some is being maintained by use of steam flood and other enhanced
recovery techniques. Decisions on further investments at many such fieldsare on hold pending the issue of the upstream regulations for the 2001Law on Oil and Natural Gas (Law 22/2001) which inter-alia are needed toestablish a legal basis for PSC extensions.
After dipping in 1998, domestic fuel sales have grown steadily despite theeconomic crisis and a series of large price increases, rising from around 50billion liters in 1997 to around 56 billion liters in 2001. Oil currentlyaccounts for around 60% of Indonesia’s total primary energy consumptionand around 21% of PLN’s power generation. With an annual productionto proven reserves ratio of below 12, Indonesia confronts the prospect ofbecoming a net oil importer in the medium term.
Pending implementation of Law 22/2001’s downstream provisions, whichrequire competition and market pricing, Pertamina remains the soledomestic supplier of petroleum fuels and Government continues to settheir prices.74 Government has committed to phasing out the fuel subsidyby 2004, and is well on track to achieve this. The next step, which wasintroduced from January 1 2003 but quickly put on hold, will be to priceall fuels except household kerosene at 100% of their Singapore ex-refineryprices plus a handling charge and applicable taxes.
Natural Gas - Indonesia has very substantial natural gas resources, withproven and potential reserves standing at 90 and 87 trillion cubic feet (tcf)respectively at end-2001. Sumatera accounts for 51.1% of the provenreserves, East Kalimantan for 28.7%, Papua for 12.7%, Java for 6.8%, andSulawesi for 0.7%. Reserves in producing fields account for around 37%of total reserves and 42% of proven reserves, with East Natuna and Tangguhaccounting for the major part of the proven but non-producing reserves.
129
IBackgroundSector Report
Proven reserves have increased significantly in recent years and it is likelythat considerably more gas will be discovered as the market develops andinvestments in pipeline infrastructure encourage increased exploration.
Natural gas production has ranged between 2.8 – 3.2 tcf per year between1995 and 2001, with the highest levels being recorded in 1996 and 1997.Pertamina has been producing about 10% of the total while six PSCsaccount for most of the remainder. Around 20% of total production isaccounted for by the producer’s own use, flaring and re-injection. In2001, sales totaled around 6.2 billion cubic feet per day (bcfd) of whichtwo thirds went for export as LNG or LPG. Power generation accountedfor about 0.6 bcfd, or 30% of total domestic consumption.
The pattern of domestic consumption has been greatly influenced byGovernment directions on gas pricing, with Pertamina in the past havingbeen required to supply gas at very low prices to industries — notably steeland fertilizer – that were deemed to be of strategic importance. PLN’smain gas supplies are priced in the vicinity of US$ 2.50 per MMBTUinclusive of pipeline tariff. Most domestic contracts provide for a flat tariffover time, and only one major domestic contract (for the Duri steam floodenhanced oil recovery project) provides for indexation to the price ofcrude.
Securing supplies of natural gas for power generation is urgently requiredfor the cost-efficient operation of PLN’s power plants and to re-inviteprivate investments for power generation. According to its own estimates,PLN is incurring extra costs at the rate of Rp. 342 per kWh by using dieselinstead of natural gas as a fuel in its power plants. According to PLN,switching the fuel for the existing power plants that currently run on dieselto natural gas, would results in annual savings of Rp. 8-10 trillion. If theadditional capacity being planned for in West Java is also taken into accountthe costs of inadequate gas supply are substantial and have a further negativeimpact to PLN’s financial standing.
Coal - Indonesia’s coal reserves are estimated to exceed 38 billion tons,much of which is low grade lignite that will not be economically workablein the foreseeable future. Mine-able reserves, which are located mainly inSouth Sumatera and East Kalimantan, totaled around 5.4 billion tons atend-2001, with low-sulphur sub-bituminous grades accounting for 4.6billion tons and bituminous / anthracite grades for 0.8 billion tons.Production has increased dramatically over the last decade, reaching 92million tons in 2001 of which 64 million tons was exported. Virtually allproduction is now from open pit mines, with most of the large minesbeing in East Kalimantan. Illegal mining has been a growing problem, andin the absence of effective enforcement mechanisms several coal producershave been forced to reach accommodations with illegal operators exploitingtheir production areas.
Power generation accounts for more than two thirds of domestic coalconsumption, with the main users being PLN’s Suralaya plant (3,400MW) and the PLN and IPP plants at the Paiton complex (3,250MW).Supplies for Suralaya are sourced mainly from the State-owned BukitAsam mine in South Sumatera while coal for Paiton comes mainly fromKalimantan. Domestic prices are basically set by the international market,although in some regions small producers do not have the option ofexporting and are essentially captive to PLN.
Coal will continue to play an increasingly important role in the powersector. Indonesia, which is the third largest exporter of coal, will have anample supply for domestic use, as long as PLN pays competitive prices toobtain it. We expect the percentage of coal used to generate power willincrease from its current level (31%) to 38%-40% by 2010/2012.
Geothermal - Indonesia’s ‘ring of fire’ volcanic belt contains over 200prospective locations for geothermal energy development. Total geothermalenergy potential is estimated at 19.7GWe. Java accounts for over a quarterof total potential, most of the proven reserves of 1.8GWe, and all but22MW of the 790 MW of installed capacity.
Hydro - Indonesia has an estimated 75 GWe hydropower potential,95% of which is off-Java. Total installed capacity of hydropower plantswas around 4.2 GW in 2000, with PLN accounting for around 3 GW.
Investment Needs and FinancingTo estimate the finances required in the sector, it is necessary to forecastgrowth in demand and the criteria for a comfortable/safe margin ofreliability, and then determine the required sector investment.75
Demand ForecastPLN’s installed capacity at the end 2002 was 20,800 MW, which included3,050 MW from the IPPs. Java–Bali had a capacity of 18,600 MW (including2,850 from the IPPs), and the balance was outside the area. Peak capacityat the end of 2002 was 13,850 MW. These numbers do not include areported 13,000-15,000 MW of self-generated (i.e., captive power).
Prior to the regional crisis, electricity sales in Java-Bali grew 12%-16% ayear, and the elasticity of demand was 1.7–1.9. While the crisis firstdampened demand (-1.4% in 1998), peak load bounced back in 1999 and2000, growing by 12% and 11%, respectively. This was mainly due to thesuppressed demand resulting from cutbacks related to the initial shock,particularly in industry. In 2001 and 2002, demand growth stabilized atabout 6%-7% a year, partly as the result of ten quarterly tariff hikes, whichdampened industrial demand again.
PLN has a fairly elaborate system for forecasting demand, which includesestimating electricity sales to the residential, commercial, industrial andpublic sectors, and to each major region (eg. West Java and East Java), andthen aggregates these estimates to obtain total demand. Sales for eachsector are forecast from the historical elasticity between estimated annualenergy sales and annual growth of sectoral aggregate expenditures. Tothese figures are added the estimated
130
Electric Power
Averting an Infrastructure Crisis: A Framework for Policy and Action
energy sales to new customers in each sector, using the historical relationbetween the number of new customers and sectoral GDP. This totalforecast is then converted into system peak-load demand through anestimated load factor which historically has moved between a narrowrange of 70%-71.5%.
In one approach, the Bank’s GDP forecast was applied to PLN’smethodology: Peak load growth averaged about 7% for a base case and10% for the high case, for the 2002-2006 period.76 In another, a lowestimate was developed assuming PLN’s financial constraints would limitits customer connections to about to 650,000 per year, and graduallyincrease to one million by the end of 2005. Under a high scenario, it wasassumed that PLN would reach the pre-crisis level of 1.7 millionconnections a year, beginning in 2005. The peak load average growth wasabout 5.3% and 8.7% respectively. For the purpose of this analysis, a“composite” value of 6% average growth between 2004-2012 was usedas the base case forecast (i.e. which was drawn from among several sourcesand scenarios). Peak load demand growth for each year was also calculated.Allowances were made for de-rated capacity, long-term outages andconstrained capacities in order to arrive at the necessary installed capacityand corresponding additional generation requirements.77
This approach is not a substitute for a model that would include some ofthe post-crisis recovery efforts and other factors that will continue to affectelectricity demand for the next few years, such as suppressed demand,captive power, and absolute/relative movements in energy product prices.Besides, forecasting demand in Indonesia is complicated by several factors,such as that (a) industries and some businesses switch back and forthbetween using their own “captive power” (i.e. self-generated power) andgrid power, and (b) it is difficult to make a strong correlation betweenenergy sales and GDP growth in Indonesia since the post-crisis economydoes not necessarily offer a realistic indicator of demand growth. However,the forecast based on the above analysis should still offer a reasonablyaccurate picture of the low, high and base cases when considering theoverall supply/demand balance.
Investment NeedsUsing a base case forecast, the new generation capacity needed to securethe system is estimated at about 14,000 MW between now and 2012. Theestimated cost is about US$12-US$12.5 billion. To expand the transmissionnetwork, the investment needed—assuming that all existing projects willbe completed and their funds secured—between now and 2012 is anestimated US$2.5-US$3.5 billion. To expand the distribution system withabout 1.6 million connections a year, the investment needed is an estimatedUS$1.7-US$2 billion between now and 2012. Therefore, the abovecomponents will require total investments from now to 2012 of aboutUS$16-US$18 billion.78
Investment FinancingThree sources could be tapped to finance such an investment program: (a)PLN’s internal cash reserves; (b) multilateral/bilateral lending andguarantees; and (c) private sector investors, either through domestic orinternational markets.
PLN’s Internal Cash Reserves - PLN’s finances continue to beprecarious and several elements must hold together for it to start earning arate of return of 5%-6% by 2005/2006 (from about 2.5% expected by theend of 2004). These involve a stable tariff of about 7 cents/kwh and acontinuing Government subsidy for users below 450 VA (to whom poweris sold below production costs). For PLN to achieve an appreciably higherrate of return, the tariff must be increased substantially. As will be discussedin the following sections, this will not be easy to achieve.
Recent improvements in PLN’s finances, particularly in its capital structure,are due to several one-time actions, such as converting about $3 billion ininterest it owed to the Government into equity, converting about $500million in unpaid principals into a new 20-year loan, and a major revaluationof its fixed assets—which added $11 billion book-value to its equity.Further, the Government paid it a “targeted subsidy,” totaling about $1billion, from 1999-2002. These actions sharply improved PLN’s debt-to-equity and debt-service-coverage ratios.
However, the improved capital structure would only allow PLN to borrowmore, and the fundamentals on the real revenue and expenditure remainunchanged. PLN will not be able to generate enough finances to contributesignificantly to capital investments for some years to come. For example,by the end of 2002, operating losses were about US$800 million, and netlosses before taxes were US$660 million. While operating expendituresincluded substantial amounts for depreciation due to the revaluation of itsfixed assets, there were also gains from foreign exchange transactions anda one-time windfall due to IPP renegotiations.
Prospects for Tariff Increase - Prospects for a substantial tariff increaseare minimal. Immediately after the crisis and the devaluation of the rupiah,the average tariff was about 2.5 cents/kwh. But, due to 10 consecutivequarterly increases, it is now 7 cents and it is unlikely the rate will rise nextyear (due to elections). Even after the election, it would be difficult to hikethe average tariff much more. The Law provides that the tariff in“competition” areas is to be set by “fair competition,”79 and in the non-competitive areas to be set by the central or provincial governments. Inpractice, this will be accomplished by putting a levy on the transmissionand distribution tariff in the competitive areas, to subsidize the developmentcosts of transmission and distribution in the non-competitive areas. Thisimplies a major cross subsidy in the tariff structure. Further, the tariffstructure is distorted in another way, in that the small consumers paysignificantly lower tariffs than the average rate (consumers below the 450VA band in residential areas pay about 3.5 cents, but those above 3.3 KVAband pay about 11 cents). It would be difficult to justify increasing thelower band tariff above 3.5 cents in a country where over 50% of thepopulation of 220 million live on less than US$2 a day. At the same time,to increase the tariff for the higher band users (mainly industries), wouldpush them to self-generation schemes and also may affect theircompetitiveness.
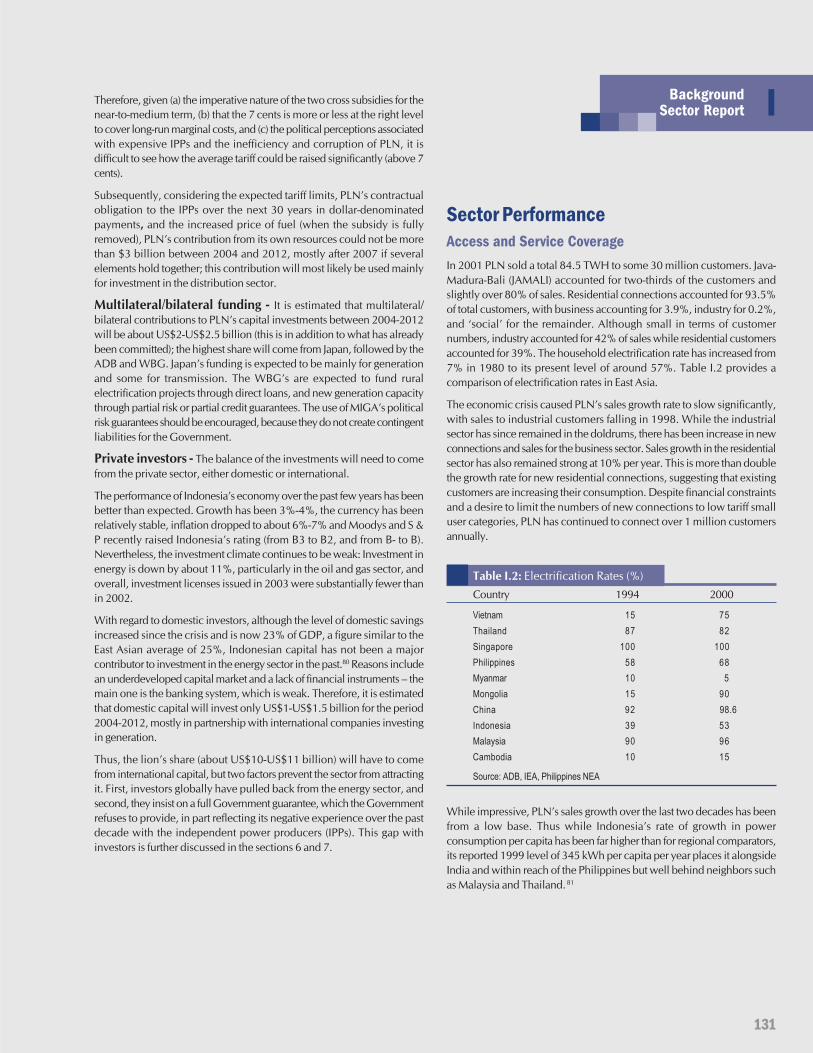
131
IBackgroundSector Report
Therefore, given (a) the imperative nature of the two cross subsidies for thenear-to-medium term, (b) that the 7 cents is more or less at the right levelto cover long-run marginal costs, and (c) the political perceptions associatedwith expensive IPPs and the inefficiency and corruption of PLN, it isdifficult to see how the average tariff could be raised significantly (above 7cents).
Subsequently, considering the expected tariff limits, PLN’s contractualobligation to the IPPs over the next 30 years in dollar-denominatedpayments, and the increased price of fuel (when the subsidy is fullyremoved), PLN’s contribution from its own resources could not be morethan $3 billion between 2004 and 2012, mostly after 2007 if severalelements hold together; this contribution will most likely be used mainlyfor investment in the distribution sector.
Multilateral/bilateral funding - It is estimated that multilateral/bilateral contributions to PLN’s capital investments between 2004-2012will be about US$2-US$2.5 billion (this is in addition to what has alreadybeen committed); the highest share will come from Japan, followed by theADB and WBG. Japan’s funding is expected to be mainly for generationand some for transmission. The WBG’s are expected to fund ruralelectrification projects through direct loans, and new generation capacitythrough partial risk or partial credit guarantees. The use of MIGA’s politicalrisk guarantees should be encouraged, because they do not create contingentliabilities for the Government.
Private investors - The balance of the investments will need to comefrom the private sector, either domestic or international.
The performance of Indonesia’s economy over the past few years has beenbetter than expected. Growth has been 3%-4%, the currency has beenrelatively stable, inflation dropped to about 6%-7% and Moodys and S &P recently raised Indonesia’s rating (from B3 to B2, and from B- to B).Nevertheless, the investment climate continues to be weak: Investment inenergy is down by about 11%, particularly in the oil and gas sector, andoverall, investment licenses issued in 2003 were substantially fewer thanin 2002.
With regard to domestic investors, although the level of domestic savingsincreased since the crisis and is now 23% of GDP, a figure similar to theEast Asian average of 25%, Indonesian capital has not been a majorcontributor to investment in the energy sector in the past.80 Reasons includean underdeveloped capital market and a lack of financial instruments – themain one is the banking system, which is weak. Therefore, it is estimatedthat domestic capital will invest only US$1-US$1.5 billion for the period2004-2012, mostly in partnership with international companies investingin generation.
Thus, the lion’s share (about US$10-US$11 billion) will have to comefrom international capital, but two factors prevent the sector from attractingit. First, investors globally have pulled back from the energy sector, andsecond, they insist on a full Government guarantee, which the Governmentrefuses to provide, in part reflecting its negative experience over the pastdecade with the independent power producers (IPPs). This gap withinvestors is further discussed in the sections 6 and 7.
Sector PerformanceAccess and Service CoverageIn 2001 PLN sold a total 84.5 TWH to some 30 million customers. Java-Madura-Bali (JAMALI) accounted for two-thirds of the customers andslightly over 80% of sales. Residential connections accounted for 93.5%of total customers, with business accounting for 3.9%, industry for 0.2%,and ‘social’ for the remainder. Although small in terms of customernumbers, industry accounted for 42% of sales while residential customersaccounted for 39%. The household electrification rate has increased from7% in 1980 to its present level of around 57%. Table I.2 provides acomparison of electrification rates in East Asia.
The economic crisis caused PLN’s sales growth rate to slow significantly,with sales to industrial customers falling in 1998. While the industrialsector has since remained in the doldrums, there has been increase in newconnections and sales for the business sector. Sales growth in the residentialsector has also remained strong at 10% per year. This is more than doublethe growth rate for new residential connections, suggesting that existingcustomers are increasing their consumption. Despite financial constraintsand a desire to limit the numbers of new connections to low tariff smalluser categories, PLN has continued to connect over 1 million customersannually.
Table I.2: Electrification Rates (%)
Country 1994 2000
Vietnam 15 75Thailand 87 82Singapore 100 100Philippines 58 68Myanmar 10 5Mongolia 15 90China 92 98.6Indonesia 39 53Malaysia 90 96Cambodia 10 15
Source: ADB, IEA, Philippines NEA
While impressive, PLN’s sales growth over the last two decades has beenfrom a low base. Thus while Indonesia’s rate of growth in powerconsumption per capita has been far higher than for regional comparators,its reported 1999 level of 345 kWh per capita per year places it alongsideIndia and within reach of the Philippines but well behind neighbors suchas Malaysia and Thailand. 81
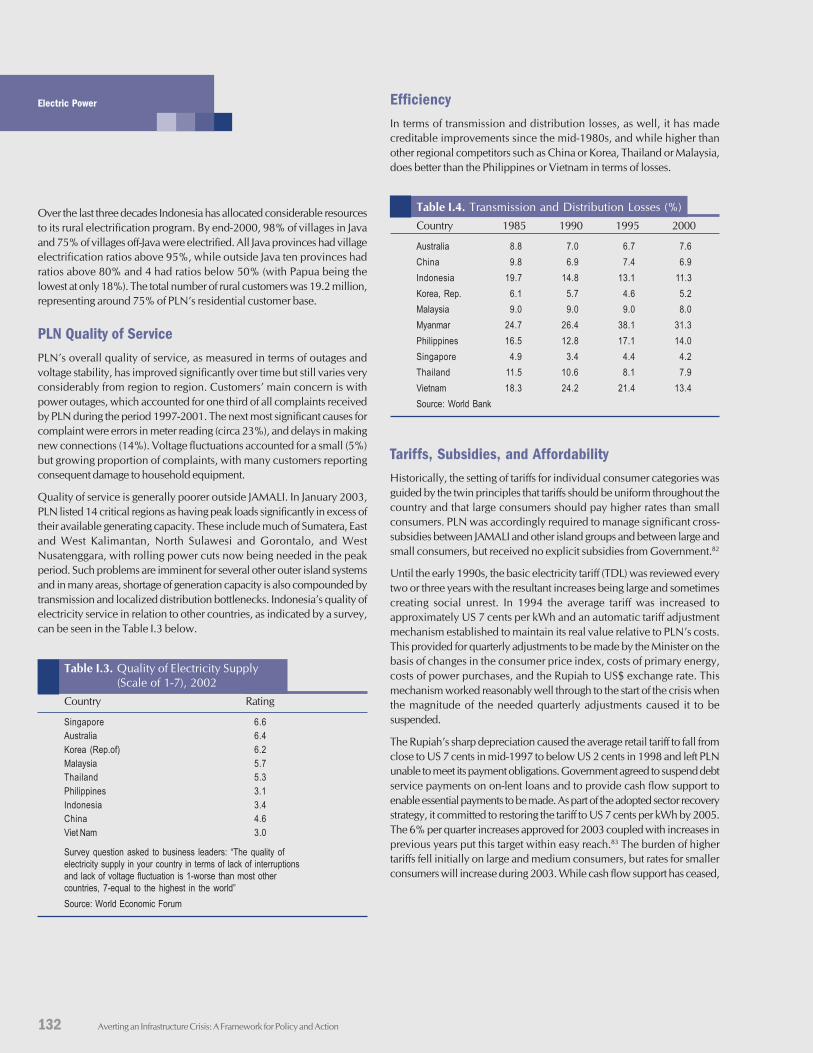
132
Electric Power
Averting an Infrastructure Crisis: A Framework for Policy and Action
Over the last three decades Indonesia has allocated considerable resourcesto its rural electrification program. By end-2000, 98% of villages in Javaand 75% of villages off-Java were electrified. All Java provinces had villageelectrification ratios above 95%, while outside Java ten provinces hadratios above 80% and 4 had ratios below 50% (with Papua being thelowest at only 18%). The total number of rural customers was 19.2 million,representing around 75% of PLN’s residential customer base.
PLN Quality of ServicePLN’s overall quality of service, as measured in terms of outages andvoltage stability, has improved significantly over time but still varies veryconsiderably from region to region. Customers’ main concern is withpower outages, which accounted for one third of all complaints receivedby PLN during the period 1997-2001. The next most significant causes forcomplaint were errors in meter reading (circa 23%), and delays in makingnew connections (14%). Voltage fluctuations accounted for a small (5%)but growing proportion of complaints, with many customers reportingconsequent damage to household equipment.
Quality of service is generally poorer outside JAMALI. In January 2003,PLN listed 14 critical regions as having peak loads significantly in excess oftheir available generating capacity. These include much of Sumatera, Eastand West Kalimantan, North Sulawesi and Gorontalo, and WestNusatenggara, with rolling power cuts now being needed in the peakperiod. Such problems are imminent for several other outer island systemsand in many areas, shortage of generation capacity is also compounded bytransmission and localized distribution bottlenecks. Indonesia’s quality ofelectricity service in relation to other countries, as indicated by a survey,can be seen in the Table I.3 below.
Table I.3. Quality of Electricity Supply(Scale of 1-7), 2002
Country Rating
Singapore 6.6Australia 6.4Korea (Rep.of) 6.2Malaysia 5.7Thailand 5.3Philippines 3.1Indonesia 3.4China 4.6Viet Nam 3.0
Survey question asked to business leaders: “The quality ofelectricity supply in your country in terms of lack of interruptionsand lack of voltage fluctuation is 1-worse than most othercountries, 7-equal to the highest in the world”Source: World Economic Forum
EfficiencyIn terms of transmission and distribution losses, as well, it has madecreditable improvements since the mid-1980s, and while higher thanother regional competitors such as China or Korea, Thailand or Malaysia,does better than the Philippines or Vietnam in terms of losses.
Table I.4. Transmission and Distribution Losses (%)
Country 1985 1990 1995 2000
Australia 8.8 7.0 6.7 7.6China 9.8 6.9 7.4 6.9Indonesia 19.7 14.8 13.1 11.3Korea, Rep. 6.1 5.7 4.6 5.2Malaysia 9.0 9.0 9.0 8.0Myanmar 24.7 26.4 38.1 31.3Philippines 16.5 12.8 17.1 14.0Singapore 4.9 3.4 4.4 4.2Thailand 11.5 10.6 8.1 7.9Vietnam 18.3 24.2 21.4 13.4Source: World Bank
Tariffs, Subsidies, and AffordabilityHistorically, the setting of tariffs for individual consumer categories wasguided by the twin principles that tariffs should be uniform throughout thecountry and that large consumers should pay higher rates than smallconsumers. PLN was accordingly required to manage significant cross-subsidies between JAMALI and other island groups and between large andsmall consumers, but received no explicit subsidies from Government.82
Until the early 1990s, the basic electricity tariff (TDL) was reviewed everytwo or three years with the resultant increases being large and sometimescreating social unrest. In 1994 the average tariff was increased toapproximately US 7 cents per kWh and an automatic tariff adjustmentmechanism established to maintain its real value relative to PLN’s costs.This provided for quarterly adjustments to be made by the Minister on thebasis of changes in the consumer price index, costs of primary energy,costs of power purchases, and the Rupiah to US$ exchange rate. Thismechanism worked reasonably well through to the start of the crisis whenthe magnitude of the needed quarterly adjustments caused it to besuspended.
The Rupiah’s sharp depreciation caused the average retail tariff to fall fromclose to US 7 cents in mid-1997 to below US 2 cents in 1998 and left PLNunable to meet its payment obligations. Government agreed to suspend debtservice payments on on-lent loans and to provide cash flow support toenable essential payments to be made. As part of the adopted sector recoverystrategy, it committed to restoring the tariff to US 7 cents per kWh by 2005.The 6% per quarter increases approved for 2003 coupled with increases inprevious years put this target within easy reach.83 The burden of highertariffs fell initially on large and medium consumers, but rates for smallerconsumers will increase during 2003. While cash flow support has ceased,
133
IBackgroundSector Report
Government is now providing explicit targeted subsidies for very smallconsumers with connections not exceeding 450VA. The amount of thesubsidy is calculated as the difference between the cost of supplying theseconsumers and the revenues received from them.84 Government proposesto reintroduce automatic adjustment once tariffs have reached their‘economic level.’85
At present, Indonesia’s average tariff is relatively blow compared withother countries in the region, but by the end of the year it should bebroadly in line with levels in Malaysia, Thailand and China.
The average tariff disguises considerable variation in the rates for differentconsumer categories. At one end of the range, a small residential consumerwith a 450VA connection and a consumption of 50kWh per month currentlypays around Rp. 16,000 per month or US 3.5 cents per kWh. At the other,a large residential consumer with a connected capacity of 16,500VA andmonthly consumption of 2,000 kWh currently pays the equivalent ofaround US 10.1 cents per kWh.86
Recent information indicates that small customers have tended to increasetheir electricity consumption in the wake of the crisis while at the sametime spending a smaller proportion of their total household expenditureon power. For many prospective electricity consumers, the level of monthlypayments is of lesser concern than the cost of securing a connection,which for a 450 VA connection could be more than the cost of a full year’selectricity usage.
Main Sector IssuesThe ultimate soundness of a power sector is measured by its ability to supplyelectricity to all customers reliably and efficiently. In the case of Indonesia,the sector also needs to expand power rapidly to the remaining 40% of thepopulation without it. This is imperative, for the obvious reasons that thecost of frequent or long-lasting interruptions to supply is huge, the system’sinefficiencies take a heavy toll on consumers and/or public resources, andlack of service to nearly half the population carries high economic costs,particularly for the poor, who represent 90 % of the unserved.
Despite the Government’s commendable efforts over the past few yearswhich have resolved some of the key sector issues (a modern electricity lawwas passed, implementing regulations were prepared, tariffs were increasedsubstantially, and contentious issues with the Independent Power Producershave been settled), Indonesia’s power sector at this juncture can still makesignificant strides in all three areas –reliability, efficiency and access.
134
Electric Power
Averting an Infrastructure Crisis: A Framework for Policy and Action
ReliabilityAlthough it is difficult to assess the reliability of Indonesia’s power systemwithout a more accurate definition for “reliability”, it can be said that thereliability at this juncture is borderline. That is, while the economy willnot slow to any great degree or grind to a halt due to power supplyinterruptions, the system would surely benefit from a comfortable, safemargin of reliability. This assessment is based on an evaluation of how thesystem will function as demand increases in relation to maximum availablesystem capacity as well as available and targeted capacity margin.
Indonesia’s sporadic power shortages will persist, particularly in the outerislands – and, during peak period, in distant residential suburbs—butmajor, long duration blackouts are not imminent unless investment haltscompletely over the next three-four years (which is unlikely). However,even sporadic interruptions have substantial accumulated economic costs;and, if the country is to avoid them and, particularly potentially highercosts in future, it must resolve the reliability issue, now.
Three possible areas from which future interruptions could stem are (a)operating and maintenance practices and budgetary problems; (b)organizational and sectoral changes; and (c) inadequate physicalinfrastructure.
With PLN, operating and maintenance practices and related budgetaryissues would be an unlikely source of major interruptions, since its staffhave many years’ experience operating and maintaining the generationplants, transmission system and distribution network, and have done sorelatively competently and effectively. Further, despite PLN’s financialproblems, the core budget for O&M has always been protected, both byPLN and the Government. In fact, PLN managed to continue the electricitysupply even during the difficult period following the 1997 economiccrisis.
Organizational and structural changes to PLN and the sector—except forthe possible impact of the decentralization discussed below—would alsobe unlikely sources; under almost all scenarios, a “PLN” will continue toexist in some form for the next decade or so. Further, the structure thatprobably will be fashioned over the next 8-10 years is that of a quasi“single-buyer model” (SBM), a rough proxy of the current structure.
However, as decentralization evolves, it could cause localized supplyproblems in the context of the new electricity law. Until the new law waspassed, PLN was expected to meet the Government’s electrification targets.With the new law, some responsibility for power supply will pass toprovincial governments, kabupatens, private companies, and evencommunity-based cooperatives, and licenses for “non-competition areas”including off-grid electricity power will be issued by local mayors orgovernors. At present, no clear implementing regulations nor acomprehensive rural energy strategy exist to adopt the changes in areaswhere it is uneconomic for PLN to extend the network. Therefore, this isa potential supply problem. However, it would be limited to specificgeographic areas, and only be of concern until the Government applies amechanism to support decentralized power provision and defines the
sector structure outside the Java-Bali area. In this respect, the Governmentis encouraged to move rapidly on both fronts: issuing the implementingregulations and formally adopting a policy for operations outside the Java–Bali power sector structure.
Thus, the area with the most potential for causing major powerinterruptions is inadequate/insufficient physical infrastructure. Thus, tothe extent that Indonesia will be able to raise the funds to meet existingneeds and growth in demand will determine whether it will experienceblackouts. An additional threat to increasing reliability is the constraint ondelivery of natural gas to the power sector.
An issue related to the adequate level of infrastructure in Indonesia’spower sector is the country’s substantial capacity of CPPs. Whiletheoretically it is possible to supplement the country’s electricity supplysignificantly and do much to relieve the potential power shortages throughusing captive power, a closer look reveals that the CPPs’ structure and theunwillingness of the CPP owners to participate in “electricity business”effectively limit CPPs’ contributions to the country’s grid supply (see BoxI.2).87
Securing the Financing to Meet DemandPLN’s Finances - Although PLN has recently made great strides inimproving its finances, it is still in a precarious financial state and severalelements must hold together for it to start earning a 5-6% rate of return by2005/2006 and to make significant contributions towards investment needsof the sector. As described in section 4, many of the recent improvementsare due to one time actions rather than a change in business fundamentals.PLN must continue with the implementation of its Efficiency Drive Programto improve its finances, and the Government needs to reinstate the automatictariff adjustment formula to prevent the tariff from sliding back again.
Private Investment Gap - The majority of investment financing (aboutUS$10 billion) will have to come from international capital. However,investors globally have pulled back from the energy sector. They insist ona full Government guarantee, which the Government refuses to provide,in part reflecting its negative experience over the past decade with theindependent power producers (IPPs).88 Clearly, these two positions presentobstacles to investment in the sector. For example, there is no indicationthat the private sector is willing to invest in Indonesia in a major waywithout a Government guarantee. Also, it would be difficult for theGovernment to justify a full faith and credit guarantee to the private sectorto supply power to a viable market, given the negative effects of pastguarantees (see box below). To break this impasse, Indonesia must developa new framework for sharing the risks.
Constraints on Natural GasIt is expected that the use of oil in the power sector will gradually declineto about half its current level by 2010 because (a) Indonesia will be a netimporter of oil by 2010 and (b) subsidies of petroleum products will befully phased out (this has and will increase PLN’s fuel costs substantially).As the oil consumption in the power sector declines, coal and natural gasconsumption will rise. Indonesia, which is the third largest exporter ofcoal, will have an ample supply for domestic use, as long as PLN payscompetitive prices to obtain it. Natural gas, on the other hand, poses amore difficult scenario.
135
IBackgroundSector Report
The main issue is the availability of natural gas because althoughthe country has large reserves—50 years proven, based on currentlevels of production—its use in the domestic market has beenconstrained due to several factors: (a) the flawed price structurefor natural gas, (b) the inadequacy of laws governing natural gasproduction until now, and in that context, the role of Pertamina—which was an inefficient monopoly and negatively affected theupstream gas industry until about two years ago when the newlaw was passed, (c) the vertically integrated structure of thedownstream gas industry which worked against greater privatesector participation until recently, and (d) due to all these, theinfrastructure needed to support a fully developed gas marketwas never built.89
EfficiencyThe issue of efficiency is somewhat less complicated thanreliability; ample room exists for PLN and the sector to improveefficiency—as is also the case with other utilities in the region.Broadly, the issue of efficiency involves PLN’s operations and thesector’s structure.
PLN OperationsWhile it is difficult to fully separate whether inefficiencies stemfrom PLN’s practices or Government actions/policies, based onpast reviews by PLN’s consultants, some features can be described.For example, PLN is following best practices with regard to itscollections, asset loading, on-line monitoring, overhead linemaintenance, and employee training. However, several importantareas can be improved, such as its planning, procurement andimplementation for capital investments. According to itsconsultants’ report, of its average investment from 1995-1998(before the crisis) of about US$3.5-US$4 billion a year,opportunities existed to save up to 40% of the total through betterplanning and evaluation, better timing of the use of funds, andavoiding cost over-runs and delays. However, only half of these“lost opportunities” were under PLN ‘s control (the rest werecontrolled by other stakeholders). Nonetheless, PLN’s share ofinefficiencies according to the report amounted to some US$600-US$800 million a year.
In response to the consultants’ report, PLN began an EfficiencyDrive Program about three years ago to review most of itsoperations and take steps to improve efficiency. Unfortunately, itis difficult to measure the extent to which PLN has succeededwith the program, since, after the crisis, capital investments weresubstantially reduced. At the least, however, it would be useful ifPLN could quantify the achievements to date, and offer a timeframefor addressing and resolving the remaining issues.
Box I.2. What About Using Captive Powerto Increase Reliability?
In 1998, the Bank conducted a preliminary survey, using the information fromDGEEU, PLN and BPS regarding captive power. After making some statisticaladjustments, it concluded that the country’s total CP installed capacity was about12400 MW (representing 40% of the country’s total installed capacity at the time),and that the plants generated 39,000 GWh (representing about 35% of the country’selectricity generation). It is estimated that the installed capacity of CPPs in 2003had reached to about 15000 MW, generating about 44000 GWh electricity.With respect to type of plant, diesel-driven CPPs represented about 60% of installedcapacity and 42% of the electricity the plants generate. Steam plants represent22% and 29% respectively, followed by gas turbines (11% and 17%), and hydroplants (6% and 11%). Co-generation plants represent about 25% of the CP installedcapacity. About 35% of CPPs are connected to the PLN grid and 65% are not.Manufacturing uses about 75% of the power the CPPs produce, followed by oiland gas (17%), mining (6%) and commerce (2%). Within manufacturing, thepaper industry uses the highest share—20% of the capacity.By any measure, this amount could theoretically be a major source of electricitysupply. However, a closer look at the CPPs’ structure—regarding the type ofplants (ie., diesel, steam, gas and hydro), the type of fuel used (ie., oil, gas orcoal), and the type of service performed (ie., whether they are the main orsupplemental source or power, or if they are of co-generation type)—presentsmajor technical and business-philosophy issues that severely limit (a) the extentthat CPPs can be expected to supply power to a national grid (ie., CPPs sellingpower to PLN through its grid system, or selling power to a third party, eitherthrough PLN’s system or through an independent transmission line); and (b) thedegree to which the CPP owners wish to be involved in such activities.Until now, the CPPs’ contribution to grid supply been negligible (i.e., less than1% of the total CPP generation). Several factors have contributed to this limitation:First, excess capacity mostly exists in the diesel plants which are mostly smallunits but collectively they represent about 60% of the CPP’s installed capacity.Such excess capacities do not insure that these small plants are appropriatesources for a major grid. In many cases, economies of scale are an issue.Further, the electricity supply needs to be stable with respect to its quality andquantity, and subject to appropriate regulations. While some of these plants mayindeed produce excess power, it may not be available on a regular basis, ormay not be economic.Second, in the Bank’s survey, numerous CPP owners said they were unwillingto supply power to the PLN, mainly because they did not want to lose focus fromtheir primary business; nor did they want to be responsible for what theyconsidered cumbersome procedures for billing and other aspects. Given the“first” and the “second” above, many of the smaller diesel plants can beeliminated as potential suppliers, although—as noted above—they representover 60% of the CPPs’ installed capacity.Third, while it would thus appear that the larger CPPs (steam plants, gas turbines,hydro plants) meet many of the qualifications to sell excess electricity to the grid(i.e., relative size, reliability, cost effectiveness and ability to adhere to regulations),there are again serious limitations. For example, while two large hydro-basedplants produce substantial power, given their high utilization factor, there isvirtually no excess capacity that could produce electricity to sell to a grid. As forplants run by gas turbines, over 50% are in the oil and gas sector, which againhave very little excess capacity. With regard to large steam plants, while theyhave potential for excess capacity, given that they are mostly of cogenerationtype, the production of electricity is a function of the production of heat.Finally, there is an issue with PLN’s willingness to buy power from the CPPs,possibly with the objective of “taking over” some of the CPPs. However, Bank’sanalysis indicates that there is a considerable limitation to the number of theCPPs that can be taken over by PLN.Therefore, the main conclusion that emerges from these statistics is that thequantity of electricity that can be sold by the CPPs to the grid is significantly lessthan would at first appear possible; namely, estimated about 1,000MW supply tothe grid, under optimal condition.
136
Electric Power
Averting an Infrastructure Crisis: A Framework for Policy and Action
Sector StructureMuch has been written about restructuring and reforming the power sectorglobally to enhance efficiency and promote private sector development. In
the region, Indonesia’s power sector has been one of the most analyzed.Based on those analyses, it is clear that reform strategies must be tailored toeach country’s unique conditions. In Indonesia, the task is complex and willrequire substantial time, given the sector’s precarious finances, the newnessof the law and regulations and the problems created by the existing IPPs,which restrict the reforms that can be adopted. Any sector restructuring willhave to be consistent with the recent law and the soon-to-be issued regulations,and take into account the (a) present direction of PLN’s organization; (b)PLN’s finances and the sector’s financial viability; (c) validity of existing IPP’scontracts; and (d) geographical features with respect to Java–Bali and outsidethe area. (see VII.2.b for more detailed discussion).
AccessOverall, the country’s rate of electrification is about 57%, which meanssome 90 million people still do not have access to power. This rate islower than the world average (74%), and even less than that of developingcountries (65%). Per capita annual consumption, of 380 kwh, is amongthe lowest in the region and the share of biomass use in total energy isabout 32%, one of the region’s highest.
Although this low rate of electrification is a major issue and calls for a moreaccelerated plan to expand the residential supply, meeting the demand ofthe remaining unserved population in Indonesia will be difficult—largelydue to the country’s geography and the location of the rural population.
As of September 2003, PLN had 29.6 million residential customers, ofwhich 70% were in Java-Bali. Almost 80% of the electricity sold isconsumed in Java-Bali, with the industrial sector accounting for 42% ofthe total, residential 40%, commercial 13%, and the public sector 5%.
However, about two-thirds of the population without power live in ruralareas, and 65% of these are outside Java-Bali. The cost of connecting thisgroup is, on average, about 33% higher than connecting residents insideJava-Bali. In fact, this estimate is low, since it is based on (a) an average costthat combines rural and urban connections and (b) rural areas that areaccessible and already served by PLN. However, in a country with roughly15,000 islands and a length and width of 5,000 and 1,800 kilometers, thecost of supplying power to outlying rural areas, particularly the remoteislands, is much higher: In Java Bali, power is generated by larger andmore efficient base-load power plants, transmitted through high voltagebackbone transmission grids and distributed through a well-developeddistribution sector—which reduces losses. In the outer islands, however,the grids use lower transmission voltages and are powered from muchsmaller generation plants, which causes higher losses.
In Java Bali, where over 96% of the villages are already electrified,connecting those without power mainly involves “intensification,” whichmeans expanding within the existing supply and distribution network. Asthe result, the pace of electrification is much faster: If PLN (or its successor)continues connections at the present pace, Java-Bali’s electrification ratewill approach 95%-98% in about 13-15 years. However, outside Java-Bali, where only about 70% of villages are electrified, the task will takesignificantly longer. Thus, it is expected the country’s overall electrificationwill not approach 100% any time in the near future.
Box I.3. Indonesia IPP Debacle
During the 1990s, escalating electricity demand and limited public resourcesthroughout East Asia left many countries little choice but to invite foreigninvestment in power plants. While the programs brought positive resultsby reducing (or in some cases eliminating) power shortages, and whileit is difficult to quantify the cost of power shortages had the IPP programsnot been implemented, they also created serious problems that wereexacerbated by the regional crisis. (a) In some countries, costly powershortages were reduced, but in many cases more capacity was addedthan was needed, and some corruptly benefited from lucrative transactions.(b) Governments often protected the IPPs against market risks (andsometimes fuel supply risks) through long-term take-or-pay contracts,thereby creating huge contingent liabilities for the countries, particularlysince the currency risks were often covered by indexing power purchaseprices to hard currencies. (c) While subsidies for capital costs werereduced, the IPPs sometimes increased the State-owned utilities’ supplycosts, often through uncompetitive bidding practices. (d) Although IPPprograms were intended to break up sector monopolies, the terms of theirpower-purchase-agreements (PPAs) often created rigidities that causedthe systems to operate inefficiently and complicated the sector’s furtherliberalization.These issues were particularly pronounced in Indonesia, where 26 primarilyUS$-denominated PPAs were signed between the IPP sponsors andPLN for about US$18 billion, which added roughly 11,000 MW of capacity.Funds for these IPPs were secured from international sources, butpredominantly from unsolicited proposals. Although the Government didnot issue explicit guarantees, “letter of supports” were given to the IPPsthrough which the Ministry of Finance (MOF) or the Ministry of Mines andEnergy (MEMR)required PLN to perform its obligations. As the result ofthe crisis and devaluation of the rupiah, the Government—faced withhuge debt—postponed some IPP projects and directed PLN to reimburseonly part of its obligations to the operating IPPs. Investor response wasmixed, depending on whether each took a short or long-term view of itsinvolvement; in the most extreme cases, the Government was sued andin one, an international arbitration panel ruled in favor of the IPP.The Government has settled or renegotiated all the disputes with theIPPs, excluding the case mentioned above, and has done acommendable job keeping its commitment and protecting the contracts.However, at least two aspects of the agreements have created seriousproblems - (a) They have produced a huge contingent liability for theGovernment and (b) the PPAs have captured, for the next 30 years, asizeable share of the power market under a set tariff and dispatchabilitylevel which heavily affects the future market.
137
IBackgroundSector ReportThe Way Forward
The most pressing issue is for the Government to promulgate theimplementing regulations for the 2002 Electricity Law, since these are key toresolving most pending issues. The draft has been in an advanced stage forover a year. While all eight regulations need to be promulgated in the nearfuture, the most critical are those that establish the regulatory agency (ElectricityMarket Supervisory Agency—EMSA), set tariffs and adopt licensingprocedures. Only after implementation of Law 20/2002 will significantprogress be made towards increasing reliability, efficiency, and access.
Increase ReliabilitySecuring Financing to Meet DemandImprove the tariff structure. With regard to tariffs, the Government isencouraged to (a) issue the necessary regulation for setting the rates; (b)develop and issue an unambiguous and quantifiable definition of“economic value” including a definition of “fair return;” (c) develop anautomatic price adjustment formula and set a firm date for applying it; (d)issue a regulation on the context and application mechanism for the crosssubsidy (levy) between the competitive and non-competitive markets; and(e) better articulate its policy with regard to cross subsidies between thehigh/medium voltage and the low voltage consumers, in terms of a morepermanent mechanism to handle this cross subsidy and/or timeframe tophase it out.
Close the gap with private investors. The first step to address the issue isto obtain a more accurate understanding of the investors’ expectationswith regard to the risks and risk-sharing. The ongoing initiative by the threemultilateral institutions (WBG, ADB and JBIC) and the Government’sagreement to hold stakeholder consultation meetings will offer anappropriate initial forum for the Government to better articulate itsachievements thus far and its commitment to further sector reform. It willalso offer different types of investors the opportunity to express theirexpectations and underlying concerns. Since the meetings will occur inthe presence of the three largest lenders, this will offer an element ofimpartiality that will help all involved to pinpoint the most importantproblems and find ways to resolve them.
For its part, the Government also needs to expedite the promulgation ofthe regulations, create a regulatory agency and provide a clear signal onthe future direction of the sector structure; these actions are prerequisitesto viable and active private sector involvement. By doing so, the Governmentwill substantially reduce the price the investors put on the risk package.
In 2003, the contingent liability of the power sector alone was about US$14 billion; in fact, the figure could be much higher when the entireperformance of the IPPs for the duration of the 30-year contract is takeninto account. As mentioned above, MOF and MEMR issued letters ofsupport to the IPPs that “cause” PLN to perform its obligation under theagreement—through which all capacity payments must be in foreignexchange, and, in most cases, US dollars. While these letters appear tohave created implicit contingent liability (as opposed to explicit), thearbitration court found the lines between implicit and explicit to be blurred,and ruled that the Government was liable under the contract.
The lack of explicit contractual obligations associated with contingent liability(i.e., an event which may or may not happen), makes its treatment ongovernment balance sheets very difficult. As in many countries, Indonesiahas not adopted a clear standard or appropriate methodology on how totreat contingent liabilities in its national accounting system. Ways do exist toaccount for these liabilities in the budget, although describing them is outsidethe scope of this report. Thus, for the purpose of this discussion, Indonesia’spriority should be to minimize future contingent liability by unbundling therisks the Government assumes, and by devising mechanisms by which someof those risks will gradually (upon improvement of the country’s performance)shift to the private sector. Not only would this lower the Government’scontingent liability, but it would also provide a standard through whichincorporating it in the Government’s books can be facilitated.
The crux is unbundling and reallocating some of the risk. To do so, thecountry could follow the approach the Bank has recommended in othercountries. For example, Indonesia could provide guarantees that protect theinvestors’ rights (such as against expropriation) and assure that basic rulesupon which the viability of a project depends will not be arbitrarily changed.In addition, it could guarantee the foreign exchange convertability and transferrisks, although it could charge a fee for this (the fee could gradually increaseas the Government’s credit rating improves). However, market and fuelsupply risks should form an integral part of the project agreement—say,between PLN and the project sponsors—and such an agreement should bedrawn strictly on a commercial basis. Nonetheless, after carefully assessingthe market, the Government could also consider offering added incentivesduring the early years of credit-building, by agreeing to guarantee the amountthat may be awarded to the project sponsors pursuant to arbitration underthe project agreement. This, as with the foreign exchange guarantee, couldbe phased out once the country meets certain credit thresholds. In otherwords, the Government should offer performance guarantees when neededto overcome perceived country risk problems (associated with the projects),but not for risks that are purely commercial.
Removing Constraints on Natural Gas DeliveryIndonesia needs to devise a coherent and market-integrated strategy fordeveloping its gas sector. Such a strategy must address the problems notedin section 6, as well as establish a sustainable structure for delivering gas tothe power sector, given the critical role of this fuel due to its substantialeconomic and environmental benefits in power generation. A key pre-requisite for economic utilization of gas is for the Government to promulgatethe necessary regulations associated with the new oil and gas law, alongwith Pertamina’s changed role and functions. Lacking such regulations,gas development and utilization will be severely hampered, given the sizeof the sector investment requirements and the need for private sectorparticipation.
138
Electric Power
Averting an Infrastructure Crisis: A Framework for Policy and Action
Adopting and implementing a rational gas pricing policy is the most criticalfactor in mobilizing natural gas. Until now, the domestic price of naturalgas in Indonesia has been problematic. The price of some of the energyproducts for which the gas could substitute are too low for gas to becompetitive. At the same time, the price at which natural gas is sold toconsumers is below its economic value (ie., netback value), which meansproducers have little interest in developing this resource.
A rough estimate indicates that the average (economic) cost of supplyingnatural gas in Indonesia ranges from US$1.90-US$2.25 per mmbtu, whileits weighted average wholesale price is about US$2 per mmbtu. Conversely,the economic value of gas on average is estimated at US$3.00-US$3.75per mmbtu. Under such a cost-value price structure, (a) the selling price ofgas to some consumers is lower than its cost of supply while to others itbarely covers the costs, and (b) a substantial amount of economic rent tothe Government (the difference between the cost of supply and the netbackvalue) is unrealized.
Further, despite Indonesia’s relatively large gas resources, it should not beconsidered a “gas surplus” country, particularly given East Asian countries’appetite for LNG. To redress this, the cost of supplying gas, in addition tothe average incremental cost of production and transport, should includean appropriate amount for the depletion premium. When the total cost of
gas supply is compared to the current weighted average wholesale price ofnatural gas and the netback value of gas, major distortions clearly exist.These have slowed the growth of the gas industry and are a disincentive forproducers to supply gas to the domestic market.
At present, PLN pays an average of about US$2.50 per mmbtu for its gassupply, including the cost of pipeline transmission. This is substantiallybelow the economic value of gas in the power sector (i.e.,US$3.00-US$3.75per mmbtu), where natural gas achieves its highest economic value whenused as fuel to generate electricity. Although because of this under-pricingPLN currently benefits, even if PLN were to pay the full economic value ofgas for its supply, the cost to PLN would still be less than that ofinternationally-priced diesel oil which is currently consumed by PLN.Therefore, PLN suffers from the fact that the existing price distortions limitthe amount of gas that is being produced.
This cost (to PLN) is substantial, representing the difference between theprice PLN pays for diesel oil and what it would pay for natural gas, if it wasavailable. Given PLN’s difficult financial condition, the limits on tariffincreases, and the sector’s large investment needs, such saving would gofar to resolving some severe financial problems.
Increase EfficiencyPLN OperationsPLN must update its achievements thus far in implementing the EfficiencyDrive Program, describing its accomplishments up to now and thetimeframe for resolving remaining issues identified by its consultants, in aformat that can be quantified and monitored.
139
IBackgroundSector Report
Sector StructureBroadly, two alternatives can be envisioned for the sector’s structure: Thesingle-buyer model (SBM), or multi-buyer, multi-seller (MBMS) model,with the possibility of an interim wholesale competition (WSC). Anextensive body of information exists on these alternatives, in general, andseveral studies are available specifically on Indonesia. Since PLN consultantshave already analyzed the pros and cons of the two in the Indonesiancontext, this report does not cover the merits of the two. Instead, it describesthe law’s provisions with respect to the two models, the main issues thatneed to be addressed or steps taken to move towards one or the other, andthe time required to move to a functioning MBMS market.
The recent Law is dormant on the issue of SBM. It provides that “within amaximum period of five years, there shall be the region applying competitionlimited to the generation aspects”. But Article 15 states “the designation ofregion applying competition should be conducted gradually under agovernment regulation,” and then lists eight requirements for designatingthe region in which to adopt electricity competition. These requirementsinclude tariffs reaching their economic value, the condition of a systemthat allows the application of competition, competition of primary energysources, preparation of rules required in the application of competition,and the necessary infrastructure.
Analyzing the above requirements, serious obstacles must be overcome ifcompetition of the sort envisioned in the MBMS model is to develop in amajor region—say, in the Java-Bali system. These include;
• Implementing Regulations. The top priority is for the sector toestablish the regulatory agency (EMSA), which can issue the regulationsneeded and build the capacity of the EMSA and its staff. While therecent law provides a broad framework for the sector to operatecompetitively, it leaves important gaps that must be addressed by theregulator. Such gaps include for the EMSA to (1) finalize decisions onlicensing, to create “businesses” involving generation, transmission,distribution, Sales Enterprise, Sales Agents, Market operators and Systemoperators in the “areas subject to competition”; (2) issue licenses tocaptive power owners that want to sell their excess electricity; (3)supervise the electricity sale price for generation, as well as for highand medium voltage customers; (4) determine the electricity price forlow voltage customers, as it does for transmission/distribution gridprices (i.e., wheeling charges), and (5) supervise or establish safeguardsand safety regulations.
The required regulations need to be unambiguous, be flexible enoughto deflect and/or incorporate external market changes and tested underdifferent sensitivities. Since it takes quite a while to incorporateregulations, the effort should begin as soon as possible.
• PLN’s corporate restructuring. The plan should be finalized andthe final draft should be discussed/agreed with the main players.Sensitive issues—such as the number of generation companies, as wellas the extent of separation/integration of functions such as transmission,System and Market operations—need to be clearly defined. Further,PLN’s role outside Java-Bali must be determined.
• Tariffs and primary fuel. Some of these involve (1) more preciselydefining their “economic value” (as stated in the law), (2) applying theautomatic adjustment formula, and (3) determining the mechanism for
applying/implementing subsidies. Liberalizing primary fuel prices,particularly rationalizing the price of natural gas, is closely related.
• The IPPs. If Indonesia’s electricity market is to be genuinely competitive,a plan must be developed to integrate existing IPPs into the market. Asdiscussed earlier, this task is difficult since existing IPPs have long-termcontracts (eg. 30 years) that often include minimum prices and minimumcapacity (to be used) requirements. Under these conditions, options arelimited, since the Government should not force the IPPs to integrate, asthis would negatively affect its credibility. Thus, possibilities includevoluntary renegotiation or buyouts, and parallel IPP trading (in the lattercase, until market prices are more attractive than those stated in the PPAcontracts). Since Indonesia’s supply will be limited at least in the shortand medium term, integration presents less of an issue, and plans can bedesigned that will smoothly integrate the IPPs into the sector (at present,PLN has established an IPP Trade unit at its headquarter).
• Stranded costs. In principle, these are the costs which exceeds themarket price and which cannot be recovered in the sales of the assets.This issue has received considerable attention, particularly in the US,but in Indonesia it is less a problem given the high growth forecast andneed for additional generation capacity. However, some stranded costsare inevitable in any industry when the regulatory environment changes;in such cases, partial or full compensation is normal practice whenmonopolies are thrust into a competitive market. These costs can bepassed along to consumers as a transition charge or competitiontransition charge (CTC), or recovered by a utility through directGovernment funding or deferred taxes. To the extent that the futuremarket value of electricity will exceed the prices stipulated in the existingPPA, the sunk costs are reduced.
Although the issue of stranded cost is prima facie less a problem,nonetheless, it must be carefully analyzed and dealt with. It should benoted that the stranded costs are easier to absorb under the SBMmodel, where costs can be passed on to consumers transparently.
Therefore, on the question of which model is more appropriate for Indonesia,it is difficult to see how the number of requirements stated above for anMBMS model can be met in the immediate future. Further, during the initialyears, extensive and complicated regulations will be needed.
While these obstacles shift the argument and the choice in favor of anSBM, there are several disadvantages to the SBM which must be noted: (a)it does not provide opportunities for competition in transmission anddistribution; (b) most PPA agreements give limited incentives to plantowners to improve efficiency, and the costs of uneconomic plants tend tobe passed on to consumers; and (c) under a SBM, and given the fragility ofPLN’s financial situations, private investments in generation are unlikely tobe forthcoming without explicit or implicit payments guarantees by the
140
Electric Power
Averting an Infrastructure Crisis: A Framework for Policy and Action
Government; and (d) prices under SBM are mostly from the supply side.Still, the model has three key advantages which, given current conditions,provides a practical approach that will more likely promote a competitivemarket: (a) under the SBM, generation plants are procured throughcompetition and generation investment costs (which are significant) canbe reduced substantially; (b) stranded and social costs are less problematicand more transparent, as they are passed on to consumers; and (c) it ismuch simpler to administer.
In selecting an approach to the next phase of the power market structure,considerations must be given to the (a) law, (b) new regulations and theshape/role of the regulatory agency, (c) existence of substantial IPP capacitywith long-term contracts, (d) PLN’s precarious finances (e) tariff limits (f)inevitability of cross–subsidies, (g) urgently needed infrastructure and (h)bottlenecks in existing facilities.
When all these issues are considered, they collectively set a path whichbegins defacto with a quasi-SBM model (due to the needs of existingoperations), and ends with an MBMS market, with an interim option of awholesale competition market.90
A critical issue is the time needed to move from the structure of the existingsector to a fully functioning SBM, through a possible WSC model, andultimately to an MBMS. It should be noted that although a quasi-SBMmodel has already emerged, still regulations must be issued and theregulatory agency must be functioning in order to establish an effectiveSBM—since SBM will have to be regulated with respect to bulk supplytariffs and least-cost solutions for transmission/generation. Once a fullyfunctional SBM is established and operating for several years, the sectorcould experiment with a small-scale MBMS model (say, in Batam), andthen gradually develop a more complex one. In the meantime, PLN willneed to aggressively improve its efficiency, and fully unbundle/corporatizeits functions.
Clearly, a trade-off exists with respect to the timeframe involved to arriveat a MBMS market. If the Government moves too rapidly, it runs the riskof by-passing pivotal issues that must be resolved in order to achieve asmoothly-functioning competitive market. However, the sooner theGovernment has a fully competitive market in place, the sooner it willeliminate the burden of covering the costs for a sector that operates in thered (particularly given the huge investment needs over the next 10-12 yearsand PLN’s precarious finances), bring increased competitive pressure tobear on operators to improve efficiency, and reduce or eliminate it on-going contingent liabilities.
The pace of reform can indeed be accelerated. As stated earlier, the mostcrucial step is establishing the regulatory agency and promulgating therules. Equally important, the southern 500kV transmission line—which isbackbone for transporting power from east to west—must be completed.
While the Government should continue rationalizing tariffs and subsidies,liberalizing primary fuel prices and integrating the IPPs into the market,these measures can be introduced at the same time as it moves towards anMBMS market. Further, while the law provides that “within a minimumperiod of 5 years there shall be a region applying competition limited tothe generation aspects,” the elucidation also provides that if no such regionexists, the EMSA must take the required steps, including preparing marketrules, grid codes, distribution codes and tariff codes. Further, the lawstates that until EMSA is established, the Government must assume thetasks of regulating and supervising the sector, as well as pave the way forcompetition.
Thus, the law provides a tool for the Government to begin implementingactions now, and to establish an MBMS market and competitive conditionsby 2007. Still, it could take much longer, depending on the pace at whichthe Government moves. While all steps towards an MBMS need to bedeliberated, the Government will surely benefit if it keeps the timeframerelatively short, to reap the benefits of increased competition and lessenthe fiscal burden and contingent liabilities, as mentioned earlier.
Increase AccessWhile a detailed discussion of options to accelerate electrification is outsidethis report, it should be noted that expanding power to rural areas outsideJava Bali (and to some within Java-Bali), need and should not rely entirelyon PLN’s grid connections. Instead, a clear power sector structure foroutside Java Bali and regulations for grid and tariff codes, along with therecent decentralization laws, will provide a rich menu of options toaccelerate electrification, including schemes for local participation andvillage/province cooperatives. To assess these options, a rural electrificationstrategy is needed that will establish optimal schemes and targets,particularly for areas that cannot be supplied through grids for many years.Also, it should include options for involving captive power and co-generation plants, along with small producers willing to sell power toPLN through its regional grid, as well as developing renewable energyresources (within the framework of a least-cost rural electrification strategy),particularly mini-hydro and small biomass plants. One should not overlookthe fact that direct competition is eminently feasible and very beneficialbetween small scale, sometimes informal, providers in almost allinfrastructure sectors. The Government should take steps, when needed,to ensure that such competitive pressures are maximized. For example, anappropriate framework should be established to enable self generatingand small electricity producers to distribute electricity directly to the thirdparties, and to sell electricity to PLN or to gain non-discriminatory accessto PLN’s grid to deliver power to other customers, as the producers choose.
To achieve these aims, the Government must (a) decide on the nature ofthe power sector structure outside Java Bali, (b) clarify the regulatoryframework and regulations under which the sector will operate, particularlythe basis for transmission/sub-transmission charges and (c) develop a moredetailed implementation plan for the two existing subsidies (to low-voltageusers and those across regions).
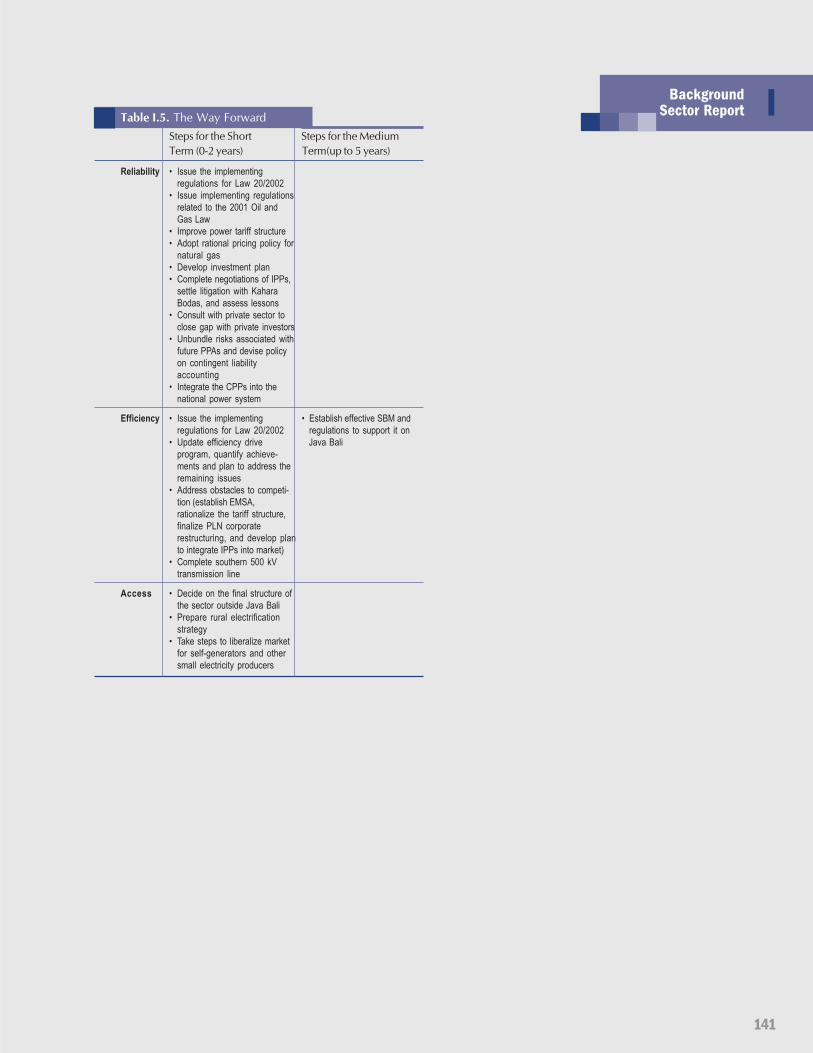
141
IBackgroundSector ReportTable I.5. The Way Forward
Steps for the Short Steps for the MediumTerm (0-2 years) Term(up to 5 years)
Reliability • Issue the implementingregulations for Law 20/2002
• Issue implementing regulationsrelated to the 2001 Oil andGas Law
• Improve power tariff structure• Adopt rational pricing policy for
natural gas• Develop investment plan• Complete negotiations of IPPs,
settle litigation with KaharaBodas, and assess lessons
• Consult with private sector toclose gap with private investors
• Unbundle risks associated withfuture PPAs and devise policyon contingent liabilityaccounting
• Integrate the CPPs into thenational power system
Efficiency • Issue the implementing • Establish effective SBM andregulations for Law 20/2002 regulations to support it on
• Update efficiency drive Java Baliprogram, quantify achieve-ments and plan to address theremaining issues
• Address obstacles to competi-tion (establish EMSA,rationalize the tariff structure,finalize PLN corporaterestructuring, and develop planto integrate IPPs into market)
• Complete southern 500 kVtransmission line
Access • Decide on the final structure ofthe sector outside Java Bali
• Prepare rural electrificationstrategy
• Take steps to liberalize marketfor self-generators and othersmall electricity producers
Averting an Infrastructure Crisis: A Framework for Policy and Action142
demand, costs to the economy are incurred across sectors. To evaluatethese costs the industrial, commercial and residential sectors alreadyconnected to the electricity network will be firstly examined. Then thecosts of not providing electricity to consumers who are not yet connectedto the grid, but nevertheless incur costs for services that could be providedmore efficiently with electricity, will be estimated.
To estimate electricity benefits, both a macroeconomic (top-down)approach and a microeconomic (bottom-up) approach will be employed.A brief review of the methodologies will be presented and available datafrom a previous detailed study of the industrial sector in Indonesia will becontrasted with a number of results from different studies across countries.A range of estimates will be thus calculated to summarize the expectedbenefits of electricity provision in the country.
It should be emphasized that in part II of the following analysis the amountof investments necessary to achieve benefits of avoided electricity outagesis not explicitly addressed. This is because an accurate evaluation of suchinvestments requires detailed least-cost electricity planning
IntroductionElectricity use correlates strongly with economic activity. Benefits fromelectricity use in the various sectors of the economy (industrial, commercial,agricultural) are a result of improved productivity through the use of advancedtechnology and machinery that require electricity. Indeed, higher valueeconomic activities need ample and reliable electricity supply. In the residentialsector, welfare benefits from electricity stem from reduced costs of supplyinglighting, heating and cooling services, time-savings for household chores,and enhanced opportunities for education, communication and leisure timeactivities. In the same manner, the lack of electricity increases unit productioncosts across the economy (thereby negatively affecting overall investmentopportunities) and reduces overall social welfare. This annex will provide arange of estimates for the benefits of electricity use in Indonesia, by investigatingits effect to connected and yet un-connected users.
Electricity demand in Indonesia has been growing at 10-12% in most ofthe past years, and is expected to continue to expand, at average annuallevels of 5-8 % or more. However, if available supplies fail to meet the
T
Annex I.1Cost Benefit Analysis – Electric Power
his annex provides an estimate of the benefits of investing in the electricity sector of Indonesia. Suchbenefits arise mainly in two forms: (i) as avoided costs of electricity interruptions for customers alreadyconnected to the power grid (industrial, commercial, residential), and (ii) as welfare benefits for newcustomers that could — with further system expansion— become connected to the grid and enjoy electricityservices. Aggregate estimates of such benefits are subject to the uncertainties of statistical averaging of abroad range of costs, perceptions of costs, and limited information on customers willingness —and ability—to pay. Nevertheless, conservative estimates —for electricity shortages only— are at a level of about0.15% of GDP, while a figure of 0.8% of GDP is not unreasonable. Moreover, such electricity interruptioncosts are sensitive to system reliability, which in turn is directly related to overall investments in thesector. Should investments in the sector not keep up with the rate of growth of projected electricitydemand, system reliability is bound to deteriorate resulting in considerable costs that will likely impactadversely the country’s investment climate and macroeconomic condition.
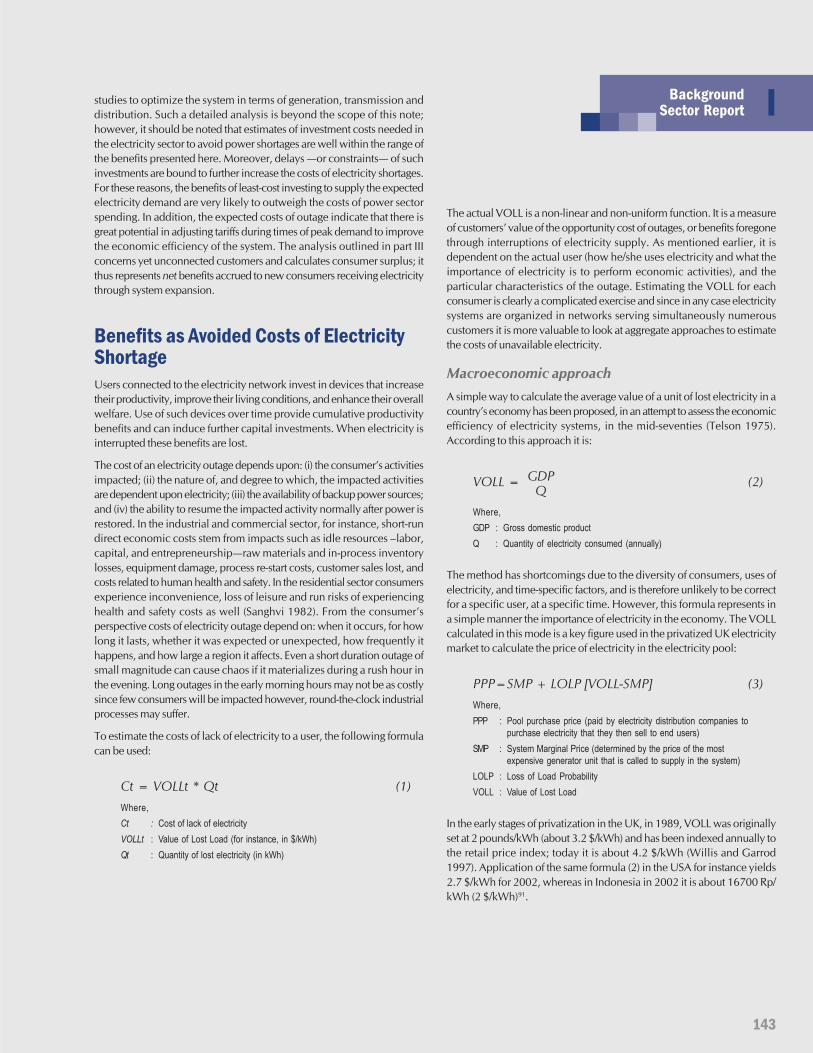
143
IBackgroundSector Report
studies to optimize the system in terms of generation, transmission anddistribution. Such a detailed analysis is beyond the scope of this note;however, it should be noted that estimates of investment costs needed inthe electricity sector to avoid power shortages are well within the range ofthe benefits presented here. Moreover, delays —or constraints— of suchinvestments are bound to further increase the costs of electricity shortages.For these reasons, the benefits of least-cost investing to supply the expectedelectricity demand are very likely to outweigh the costs of power sectorspending. In addition, the expected costs of outage indicate that there isgreat potential in adjusting tariffs during times of peak demand to improvethe economic efficiency of the system. The analysis outlined in part IIIconcerns yet unconnected customers and calculates consumer surplus; itthus represents net benefits accrued to new consumers receiving electricitythrough system expansion.
Benefits as Avoided Costs of ElectricityShortageUsers connected to the electricity network invest in devices that increasetheir productivity, improve their living conditions, and enhance their overallwelfare. Use of such devices over time provide cumulative productivitybenefits and can induce further capital investments. When electricity isinterrupted these benefits are lost.
The cost of an electricity outage depends upon: (i) the consumer’s activitiesimpacted; (ii) the nature of, and degree to which, the impacted activitiesare dependent upon electricity; (iii) the availability of backup power sources;and (iv) the ability to resume the impacted activity normally after power isrestored. In the industrial and commercial sector, for instance, short-rundirect economic costs stem from impacts such as idle resources –labor,capital, and entrepreneurship—raw materials and in-process inventorylosses, equipment damage, process re-start costs, customer sales lost, andcosts related to human health and safety. In the residential sector consumersexperience inconvenience, loss of leisure and run risks of experiencinghealth and safety costs as well (Sanghvi 1982). From the consumer’sperspective costs of electricity outage depend on: when it occurs, for howlong it lasts, whether it was expected or unexpected, how frequently ithappens, and how large a region it affects. Even a short duration outage ofsmall magnitude can cause chaos if it materializes during a rush hour inthe evening. Long outages in the early morning hours may not be as costlysince few consumers will be impacted however, round-the-clock industrialprocesses may suffer.
To estimate the costs of lack of electricity to a user, the following formulacan be used:
Ct = VOLLt * Qt (1)Where,Ct : Cost of lack of electricityVOLLt : Value of Lost Load (for instance, in $/kWh)Qt : Quantity of lost electricity (in kWh)
The actual VOLL is a non-linear and non-uniform function. It is a measureof customers’ value of the opportunity cost of outages, or benefits foregonethrough interruptions of electricity supply. As mentioned earlier, it isdependent on the actual user (how he/she uses electricity and what theimportance of electricity is to perform economic activities), and theparticular characteristics of the outage. Estimating the VOLL for eachconsumer is clearly a complicated exercise and since in any case electricitysystems are organized in networks serving simultaneously numerouscustomers it is more valuable to look at aggregate approaches to estimatethe costs of unavailable electricity.
Macroeconomic approachA simple way to calculate the average value of a unit of lost electricity in acountry’s economy has been proposed, in an attempt to assess the economicefficiency of electricity systems, in the mid-seventies (Telson 1975).According to this approach it is:
VOLL = GDP (2)Q
Where,GDP : Gross domestic productQ : Quantity of electricity consumed (annually)
The method has shortcomings due to the diversity of consumers, uses ofelectricity, and time-specific factors, and is therefore unlikely to be correctfor a specific user, at a specific time. However, this formula represents ina simple manner the importance of electricity in the economy. The VOLLcalculated in this mode is a key figure used in the privatized UK electricitymarket to calculate the price of electricity in the electricity pool:
PPP=SMP + LOLP [VOLL-SMP] (3)Where,PPP : Pool purchase price (paid by electricity distribution companies to
purchase electricity that they then sell to end users)SMP : System Marginal Price (determined by the price of the most
expensive generator unit that is called to supply in the system)LOLP : Loss of Load ProbabilityVOLL : Value of Lost Load
In the early stages of privatization in the UK, in 1989, VOLL was originallyset at 2 pounds/kWh (about 3.2 $/kWh) and has been indexed annually tothe retail price index; today it is about 4.2 $/kWh (Willis and Garrod1997). Application of the same formula (2) in the USA for instance yields2.7 $/kWh for 2002, whereas in Indonesia in 2002 it is about 16700 Rp/kWh (2 $/kWh)91.
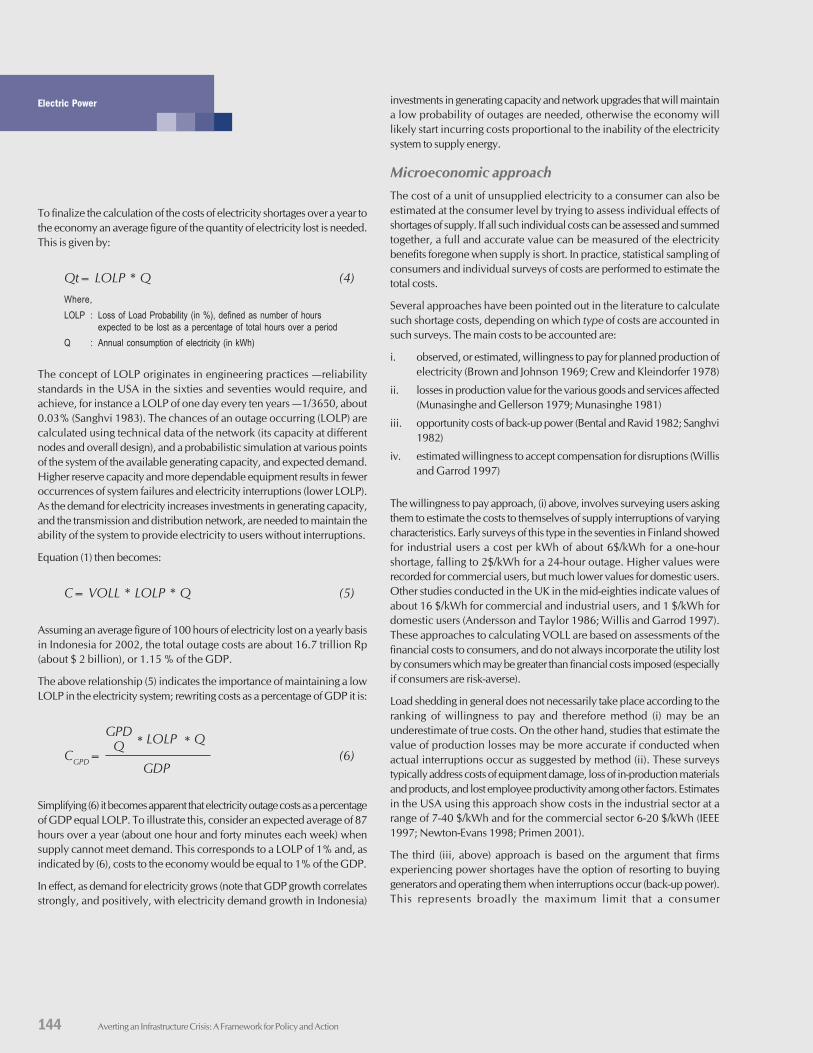
144
Electric Power
Averting an Infrastructure Crisis: A Framework for Policy and Action
To finalize the calculation of the costs of electricity shortages over a year tothe economy an average figure of the quantity of electricity lost is needed.This is given by:
Qt= LOLP * Q (4)Where,LOLP : Loss of Load Probability (in %), defined as number of hours
expected to be lost as a percentage of total hours over a periodQ : Annual consumption of electricity (in kWh)
The concept of LOLP originates in engineering practices —reliabilitystandards in the USA in the sixties and seventies would require, andachieve, for instance a LOLP of one day every ten years —1/3650, about0.03% (Sanghvi 1983). The chances of an outage occurring (LOLP) arecalculated using technical data of the network (its capacity at differentnodes and overall design), and a probabilistic simulation at various pointsof the system of the available generating capacity, and expected demand.Higher reserve capacity and more dependable equipment results in feweroccurrences of system failures and electricity interruptions (lower LOLP).As the demand for electricity increases investments in generating capacity,and the transmission and distribution network, are needed to maintain theability of the system to provide electricity to users without interruptions.
Equation (1) then becomes:
C= VOLL * LOLP * Q (5)
Assuming an average figure of 100 hours of electricity lost on a yearly basisin Indonesia for 2002, the total outage costs are about 16.7 trillion Rp(about $ 2 billion), or 1.15 % of the GDP.
The above relationship (5) indicates the importance of maintaining a lowLOLP in the electricity system; rewriting costs as a percentage of GDP it is:
GPD* LOLP * Q
CGPD=Q
(6)GDP
Simplifying (6) it becomes apparent that electricity outage costs as a percentageof GDP equal LOLP. To illustrate this, consider an expected average of 87hours over a year (about one hour and forty minutes each week) whensupply cannot meet demand. This corresponds to a LOLP of 1% and, asindicated by (6), costs to the economy would be equal to 1% of the GDP.
In effect, as demand for electricity grows (note that GDP growth correlatesstrongly, and positively, with electricity demand growth in Indonesia)
investments in generating capacity and network upgrades that will maintaina low probability of outages are needed, otherwise the economy willlikely start incurring costs proportional to the inability of the electricitysystem to supply energy.
Microeconomic approachThe cost of a unit of unsupplied electricity to a consumer can also beestimated at the consumer level by trying to assess individual effects ofshortages of supply. If all such individual costs can be assessed and summedtogether, a full and accurate value can be measured of the electricitybenefits foregone when supply is short. In practice, statistical sampling ofconsumers and individual surveys of costs are performed to estimate thetotal costs.
Several approaches have been pointed out in the literature to calculatesuch shortage costs, depending on which type of costs are accounted insuch surveys. The main costs to be accounted are:
i. observed, or estimated, willingness to pay for planned production ofelectricity (Brown and Johnson 1969; Crew and Kleindorfer 1978)
ii. losses in production value for the various goods and services affected(Munasinghe and Gellerson 1979; Munasinghe 1981)
iii. opportunity costs of back-up power (Bental and Ravid 1982; Sanghvi1982)
iv. estimated willingness to accept compensation for disruptions (Willisand Garrod 1997)
The willingness to pay approach, (i) above, involves surveying users askingthem to estimate the costs to themselves of supply interruptions of varyingcharacteristics. Early surveys of this type in the seventies in Finland showedfor industrial users a cost per kWh of about 6$/kWh for a one-hourshortage, falling to 2$/kWh for a 24-hour outage. Higher values wererecorded for commercial users, but much lower values for domestic users.Other studies conducted in the UK in the mid-eighties indicate values ofabout 16 $/kWh for commercial and industrial users, and 1 $/kWh fordomestic users (Andersson and Taylor 1986; Willis and Garrod 1997).These approaches to calculating VOLL are based on assessments of thefinancial costs to consumers, and do not always incorporate the utility lostby consumers which may be greater than financial costs imposed (especiallyif consumers are risk-averse).
Load shedding in general does not necessarily take place according to theranking of willingness to pay and therefore method (i) may be anunderestimate of true costs. On the other hand, studies that estimate thevalue of production losses may be more accurate if conducted whenactual interruptions occur as suggested by method (ii). These surveystypically address costs of equipment damage, loss of in-production materialsand products, and lost employee productivity among other factors. Estimatesin the USA using this approach show costs in the industrial sector at arange of 7-40 $/kWh and for the commercial sector 6-20 $/kWh (IEEE1997; Newton-Evans 1998; Primen 2001).
The third (iii, above) approach is based on the argument that firmsexperiencing power shortages have the option of resorting to buyinggenerators and operating them when interruptions occur (back-up power).This represents broadly the maximum limit that a consumer
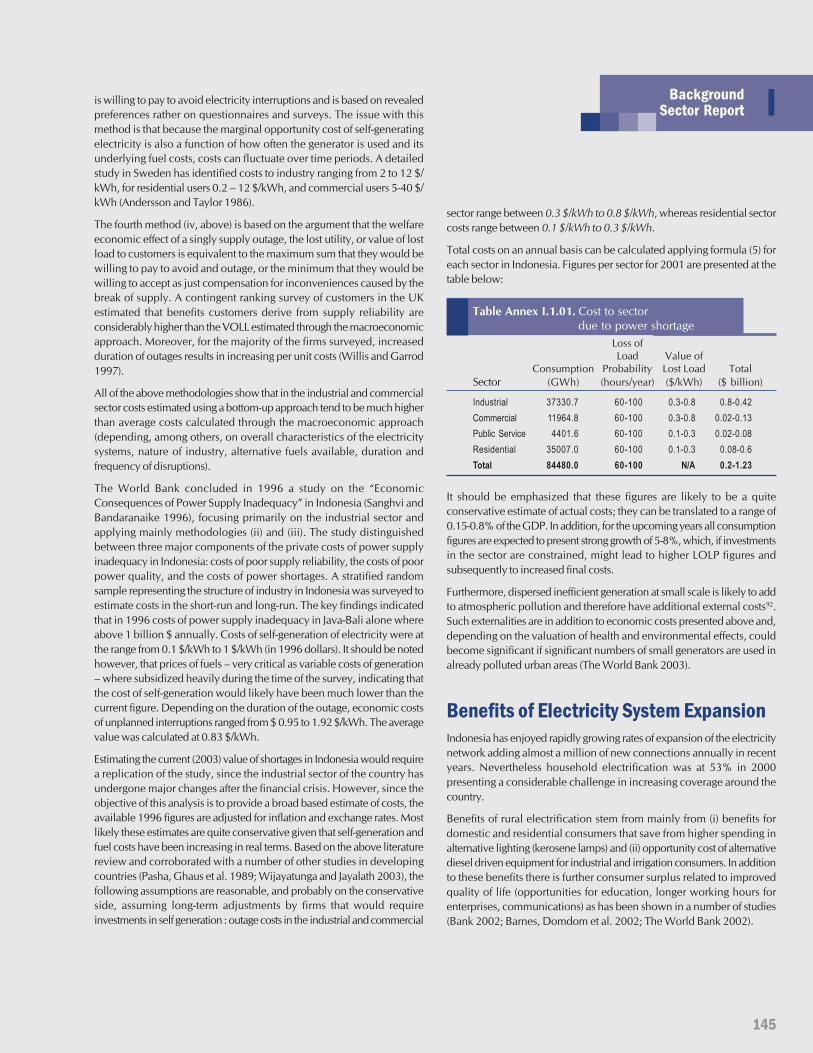
145
IBackgroundSector Report
is willing to pay to avoid electricity interruptions and is based on revealedpreferences rather on questionnaires and surveys. The issue with thismethod is that because the marginal opportunity cost of self-generatingelectricity is also a function of how often the generator is used and itsunderlying fuel costs, costs can fluctuate over time periods. A detailedstudy in Sweden has identified costs to industry ranging from 2 to 12 $/kWh, for residential users 0.2 – 12 $/kWh, and commercial users 5-40 $/kWh (Andersson and Taylor 1986).
The fourth method (iv, above) is based on the argument that the welfareeconomic effect of a singly supply outage, the lost utility, or value of lostload to customers is equivalent to the maximum sum that they would bewilling to pay to avoid and outage, or the minimum that they would bewilling to accept as just compensation for inconveniences caused by thebreak of supply. A contingent ranking survey of customers in the UKestimated that benefits customers derive from supply reliability areconsiderably higher than the VOLL estimated through the macroeconomicapproach. Moreover, for the majority of the firms surveyed, increasedduration of outages results in increasing per unit costs (Willis and Garrod1997).
All of the above methodologies show that in the industrial and commercialsector costs estimated using a bottom-up approach tend to be much higherthan average costs calculated through the macroeconomic approach(depending, among others, on overall characteristics of the electricitysystems, nature of industry, alternative fuels available, duration andfrequency of disruptions).
The World Bank concluded in 1996 a study on the “EconomicConsequences of Power Supply Inadequacy” in Indonesia (Sanghvi andBandaranaike 1996), focusing primarily on the industrial sector andapplying mainly methodologies (ii) and (iii). The study distinguishedbetween three major components of the private costs of power supplyinadequacy in Indonesia: costs of poor supply reliability, the costs of poorpower quality, and the costs of power shortages. A stratified randomsample representing the structure of industry in Indonesia was surveyed toestimate costs in the short-run and long-run. The key findings indicatedthat in 1996 costs of power supply inadequacy in Java-Bali alone whereabove 1 billion $ annually. Costs of self-generation of electricity were atthe range from 0.1 $/kWh to 1 $/kWh (in 1996 dollars). It should be notedhowever, that prices of fuels – very critical as variable costs of generation– where subsidized heavily during the time of the survey, indicating thatthe cost of self-generation would likely have been much lower than thecurrent figure. Depending on the duration of the outage, economic costsof unplanned interruptions ranged from $ 0.95 to 1.92 $/kWh. The averagevalue was calculated at 0.83 $/kWh.
Estimating the current (2003) value of shortages in Indonesia would requirea replication of the study, since the industrial sector of the country hasundergone major changes after the financial crisis. However, since theobjective of this analysis is to provide a broad based estimate of costs, theavailable 1996 figures are adjusted for inflation and exchange rates. Mostlikely these estimates are quite conservative given that self-generation andfuel costs have been increasing in real terms. Based on the above literaturereview and corroborated with a number of other studies in developingcountries (Pasha, Ghaus et al. 1989; Wijayatunga and Jayalath 2003), thefollowing assumptions are reasonable, and probably on the conservativeside, assuming long-term adjustments by firms that would requireinvestments in self generation : outage costs in the industrial and commercial
sector range between 0.3 $/kWh to 0.8 $/kWh, whereas residential sectorcosts range between 0.1 $/kWh to 0.3 $/kWh.
Total costs on an annual basis can be calculated applying formula (5) foreach sector in Indonesia. Figures per sector for 2001 are presented at thetable below:
Table Annex I.1.01. Cost to sectordue to power shortage
Loss ofLoad Value of
Consumption Probability Lost Load TotalSector (GWh) (hours/year) ($/kWh) ($ billion)
Industrial 37330.7 60-100 0.3-0.8 0.8-0.42Commercial 11964.8 60-100 0.3-0.8 0.02-0.13Public Service 4401.6 60-100 0.1-0.3 0.02-0.08Residential 35007.0 60-100 0.1-0.3 0.08-0.6Total 84480.0 60-100 N/A 0.2-1.23
It should be emphasized that these figures are likely to be a quiteconservative estimate of actual costs; they can be translated to a range of0.15-0.8% of the GDP. In addition, for the upcoming years all consumptionfigures are expected to present strong growth of 5-8%, which, if investmentsin the sector are constrained, might lead to higher LOLP figures andsubsequently to increased final costs.
Furthermore, dispersed inefficient generation at small scale is likely to addto atmospheric pollution and therefore have additional external costs92.Such externalities are in addition to economic costs presented above and,depending on the valuation of health and environmental effects, couldbecome significant if significant numbers of small generators are used inalready polluted urban areas (The World Bank 2003).
Benefits of Electricity System ExpansionIndonesia has enjoyed rapidly growing rates of expansion of the electricitynetwork adding almost a million of new connections annually in recentyears. Nevertheless household electrification was at 53% in 2000presenting a considerable challenge in increasing coverage around thecountry.
Benefits of rural electrification stem from mainly from (i) benefits fordomestic and residential consumers that save from higher spending inalternative lighting (kerosene lamps) and (ii) opportunity cost of alternativediesel driven equipment for industrial and irrigation consumers. In additionto these benefits there is further consumer surplus related to improvedquality of life (opportunities for education, longer working hours forenterprises, communications) as has been shown in a number of studies(Bank 2002; Barnes, Domdom et al. 2002; The World Bank 2002).
146
Electric Power
Averting an Infrastructure Crisis: A Framework for Policy and Action
For this section, results of economic benefits assessed during theImplementation Completion Report of a previous Rural Electrificationproject in Indonesia (The World Bank 2000) will be used to provideapproximate figures for the potential economic benefits of furtherinvestments in expanding electricity services. According to the report,average consumption per new customer per year was estimated at 430 -540 kWh/year for residential users and 3800 – 5000 kWh/year for non-residential customers (low figures are for locations outside Java, higherfigures in Java). The EIRR of the project was 26.2% exceeding comfortablythe benchmark rate of 12%. An average consumer surplus of 690 Rp/kWhwas estimated, that could be as high as 1150 Rp/kWh93.
Using the assumptions above, maintaining a rate of one million newconnections annually, and without accounting for the very likely increasesin demand over time for newly connected users, additional benefits at arange of US$ 70-150 million are quite possible for the next decade.
ReferencesAndersson, R. and L. Taylor (1986). “The social cost of unsupplied electricity
: A critical review.” Energy Economics 8(3): 139-146.
Barnes, D. F., A. Domdom, et al. (2002). Rural Electrification andDevelopment in the Philippines: Measuring the Social and EconomicBenefits. Washington, DC, ESMAP / The World Bank.
Bental, B. and S. Ravid (1982). “A simple method for evaluating themarginal cost of unsupplied electricity.” The Bell Journal of Economics13: 249-253.
Brown, G. J. and B. Johnson (1969). “Public Utility Pricing and OutputUnder Risk.” The American Economic Review 59(1): 119-128.
Crew, M. A. and P. R. Kleindorfer (1978). “Reliability and Public UtilityPricing.” The American Economic Review 68(1): 31-40.
IEEE (1997). Recommended Practices for the Design of Reliable Industrialand Commercial Power Systems, Institute of Electrical and ElectronicEngineers.
Munasinghe, M. (1981). “Optimal electricity supply : Reliability, pricingand system planning.” Energy Economics 3(3): 140-152.
Munasinghe, M. and M. Gellerson (1979). “Economic criterion foroptimizing power system reliability levels.” The Bell Journal ofEconomics 10(1): 353-365.
Newton-Evans (1998). Market Trend Digest. Balitmore, Newton-EvansResearch Company.
Pasha, H. A., A. Ghaus, et al. (1989). “The economic cost of poweroutages in the industrial sector of Pakistan.” Energy Economics 11(4):301-318.
Primen (2001). The Cost of Power Disturbances to Industrial and DigitalEconomy Companies. Palo Alto, CA, EPRI (Electric Power ResearchInstitution).
Sanghvi, A. P. (1982). “Economic costs of electricity supply interruptions: US and foreign experience.” Energy Economics 4(3): 180-198.
Sanghvi, A. P. (1983). “Optimal electricity supply reliability using customershortage costs.” Energy Economics 5(2): 129-136.
Sanghvi, A. P. and D. R. Bandaranaike (1996). Indonesia EconomicConsequences of Power Supply Inadequacy. Washington, DC, TheWorld Bank, Industry and Energy Division.
Telson, M. (1975). “The Economics of Alternative Levels of Reliability.”Bell Journal of Economics 6(2): 679-694.
The World Bank (2000). Indonesia - Second Rural Electrification Project:Implementation Completion Report. Washington, DC, The WorldBank, Energy and Mining Sector Unit.
The World Bank (2002). Sri Lanka Renewable Energy Development, ProjectAppraisal Document. Washington, DC, The World Bank, South AsiaEnergy Unit.
The World Bank (2003). Indonesia Environment Monitor 2003. Jakarta,The World Bank.
Wijayatunga, P. D. C. and M. S. Jayalath (2003). “Assessment of economicimpact of electricity supply interruptions in the Sri Lanka industrialsector.” Energy Conversion and Management In Press, Corrected Proof.
Willis, K. G. and G. D. Garrod (1997). “Electricity supply reliability:Estimating the value of lost load.” Energy Policy 25(1): 97-103.


Averting an Infrastructure Crisis: A Framework for Policy and Action148
IITelecommunicationsse
ct
or
149
Indonesia’s telecommunications sector has weathered the economic crisis and the bursting of theglobal telecommunications bubble moderately well. Dramatic growth in the number mobile
subscribers since 1997 has been accompanied by solid increases in numbers of fixed lines in service,public payphones, teleshops (wartels) and internet shops (warnets). Despite reverses, private sectorinterest has also remained strong, as evidenced by the government’s sale in December 2002 of anadditional 41.9% interest in international and mobile operator PT Indosat for around US$627 million.
Throughout the 1990’s the Indonesian telecommunications sectors was dominated by two companies:Telkom which was designated as the “organizing body” for basic domestic (local and long distance)telecommunications, and Indosat which was designated as the “organizing body” for basic internationalservices sector. The onset of the economic crisis underscored the need for liberalization, leading theGovernment to prepare a ‘Sector Blueprint’ outlining its strategy for transition to full competition by2010. The Blueprint provided the framework for a new Telecommunications Law, enacted in 1999,that eliminated the ‘organizing body’ roles previously enjoyed by Telkom and Indosat, and alsoenabled an early termination of exclusivities on basic telephony services. As an intermediate steptowards full competition, the Government opted to transform Telkom and Indosat into competingfull network and service providers and to require them to unwind anti-competitive cross-holdings inmobile operators and other service providers.
Indonesia’s first limited steps on the path to privatization were taken in the early 1990s, with bothSOEs – PT Telkom and PT Indosat – being listed on the New York Stock Exchange by 1995. Bothcompanies have since continued to feature prominently in the Government’s privatization program,with Indosat becoming the first SOE to be transferred to majority private ownership.
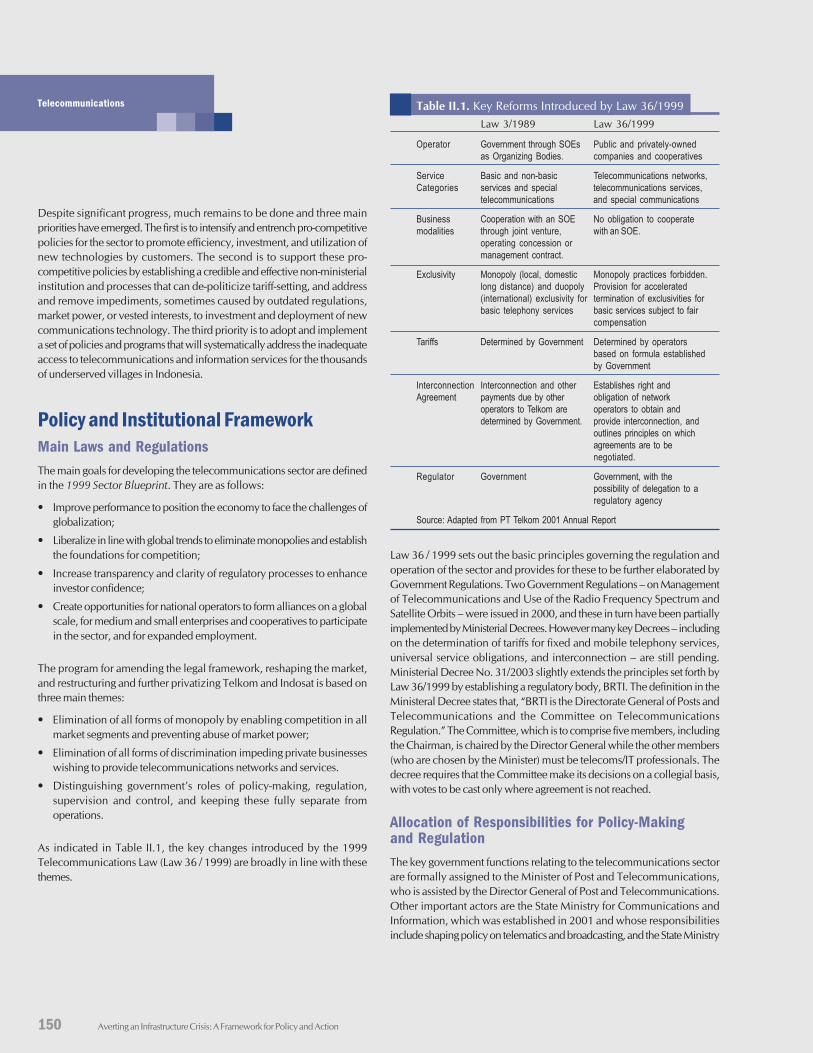
150 Averting an Infrastructure Crisis: A Framework for Policy and Action
Telecommunications
Despite significant progress, much remains to be done and three mainpriorities have emerged. The first is to intensify and entrench pro-competitivepolicies for the sector to promote efficiency, investment, and utilization ofnew technologies by customers. The second is to support these pro-competitive policies by establishing a credible and effective non-ministerialinstitution and processes that can de-politicize tariff-setting, and addressand remove impediments, sometimes caused by outdated regulations,market power, or vested interests, to investment and deployment of newcommunications technology. The third priority is to adopt and implementa set of policies and programs that will systematically address the inadequateaccess to telecommunications and information services for the thousandsof underserved villages in Indonesia.
Policy and Institutional FrameworkMain Laws and RegulationsThe main goals for developing the telecommunications sector are definedin the 1999 Sector Blueprint. They are as follows:
• Improve performance to position the economy to face the challenges ofglobalization;
• Liberalize in line with global trends to eliminate monopolies and establishthe foundations for competition;
• Increase transparency and clarity of regulatory processes to enhanceinvestor confidence;
• Create opportunities for national operators to form alliances on a globalscale, for medium and small enterprises and cooperatives to participatein the sector, and for expanded employment.
The program for amending the legal framework, reshaping the market,and restructuring and further privatizing Telkom and Indosat is based onthree main themes:
• Elimination of all forms of monopoly by enabling competition in allmarket segments and preventing abuse of market power;
• Elimination of all forms of discrimination impeding private businesseswishing to provide telecommunications networks and services.
• Distinguishing government’s roles of policy-making, regulation,supervision and control, and keeping these fully separate fromoperations.
As indicated in Table II.1, the key changes introduced by the 1999Telecommunications Law (Law 36 / 1999) are broadly in line with thesethemes.
Table II.1. Key Reforms Introduced by Law 36/1999Law 3/1989 Law 36/1999
Operator Government through SOEs Public and privately-ownedas Organizing Bodies. companies and cooperatives
Service Basic and non-basic Telecommunications networks,Categories services and special telecommunications services,
telecommunications and special communications
Business Cooperation with an SOE No obligation to cooperatemodalities through joint venture, with an SOE.
operating concession ormanagement contract.
Exclusivity Monopoly (local, domestic Monopoly practices forbidden.long distance) and duopoly Provision for accelerated(international) exclusivity for termination of exclusivities forbasic telephony services basic services subject to fair
compensation
Tariffs Determined by Government Determined by operatorsbased on formula establishedby Government
Interconnection Interconnection and other Establishes right andAgreement payments due by other obligation of network
operators to Telkom are operators to obtain anddetermined by Government. provide interconnection, and
outlines principles on whichagreements are to benegotiated.
Regulator Government Government, with thepossibility of delegation to aregulatory agency
Source: Adapted from PT Telkom 2001 Annual Report
Law 36 / 1999 sets out the basic principles governing the regulation andoperation of the sector and provides for these to be further elaborated byGovernment Regulations. Two Government Regulations – on Managementof Telecommunications and Use of the Radio Frequency Spectrum andSatellite Orbits – were issued in 2000, and these in turn have been partiallyimplemented by Ministerial Decrees. However many key Decrees – includingon the determination of tariffs for fixed and mobile telephony services,universal service obligations, and interconnection – are still pending.Ministerial Decree No. 31/2003 slightly extends the principles set forth byLaw 36/1999 by establishing a regulatory body, BRTI. The definition in theMinisteral Decree states that, “BRTI is the Directorate General of Posts andTelecommunications and the Committee on TelecommunicationsRegulation.” The Committee, which is to comprise five members, includingthe Chairman, is chaired by the Director General while the other members(who are chosen by the Minister) must be telecoms/IT professionals. Thedecree requires that the Committee make its decisions on a collegial basis,with votes to be cast only where agreement is not reached.
Allocation of Responsibilities for Policy-Makingand RegulationThe key government functions relating to the telecommunications sectorare formally assigned to the Minister of Post and Telecommunications,who is assisted by the Director General of Post and Telecommunications.Other important actors are the State Ministry for Communications andInformation, which was established in 2001 and whose responsibilitiesinclude shaping policy on telematics and broadcasting, and the State Ministry
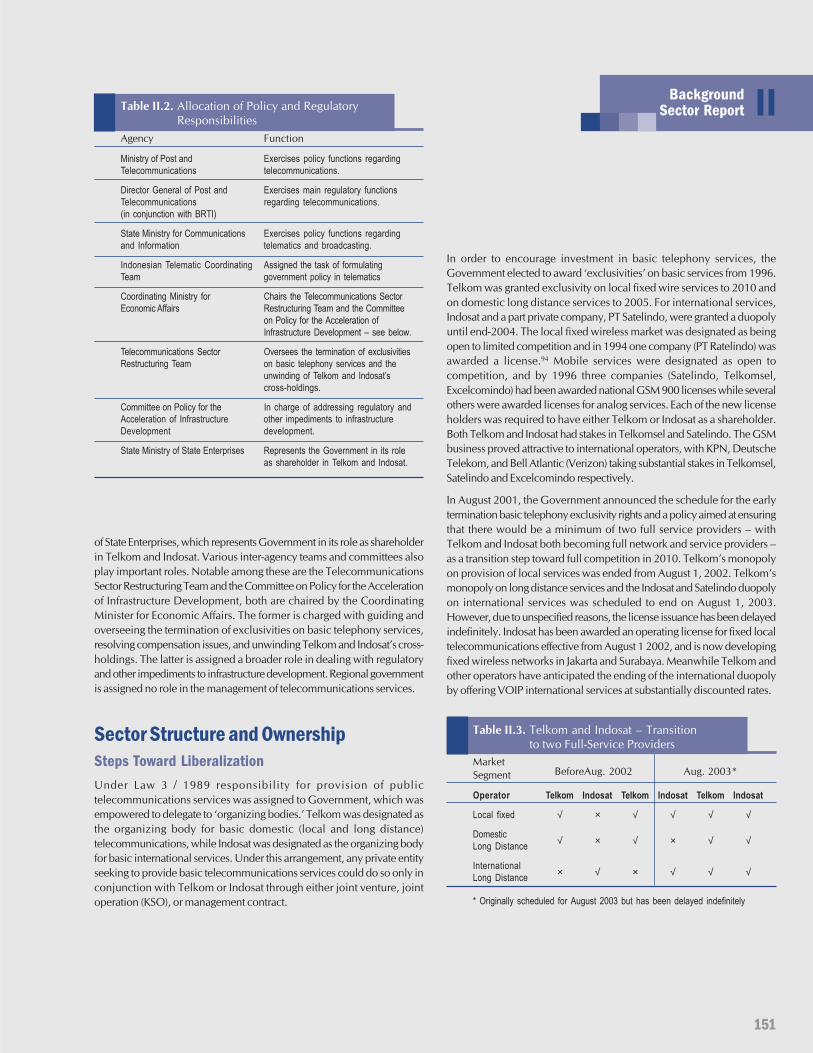
151
IIBackgroundSector Report
of State Enterprises, which represents Government in its role as shareholderin Telkom and Indosat. Various inter-agency teams and committees alsoplay important roles. Notable among these are the TelecommunicationsSector Restructuring Team and the Committee on Policy for the Accelerationof Infrastructure Development, both are chaired by the CoordinatingMinister for Economic Affairs. The former is charged with guiding andoverseeing the termination of exclusivities on basic telephony services,resolving compensation issues, and unwinding Telkom and Indosat’s cross-holdings. The latter is assigned a broader role in dealing with regulatoryand other impediments to infrastructure development. Regional governmentis assigned no role in the management of telecommunications services.
Sector Structure and OwnershipSteps Toward LiberalizationUnder Law 3 / 1989 responsibility for provision of publictelecommunications services was assigned to Government, which wasempowered to delegate to ‘organizing bodies.’ Telkom was designated asthe organizing body for basic domestic (local and long distance)telecommunications, while Indosat was designated as the organizing bodyfor basic international services. Under this arrangement, any private entityseeking to provide basic telecommunications services could do so only inconjunction with Telkom or Indosat through either joint venture, jointoperation (KSO), or management contract.
In order to encourage investment in basic telephony services, theGovernment elected to award ‘exclusivities’ on basic services from 1996.Telkom was granted exclusivity on local fixed wire services to 2010 andon domestic long distance services to 2005. For international services,Indosat and a part private company, PT Satelindo, were granted a duopolyuntil end-2004. The local fixed wireless market was designated as beingopen to limited competition and in 1994 one company (PT Ratelindo) wasawarded a license.94 Mobile services were designated as open tocompetition, and by 1996 three companies (Satelindo, Telkomsel,Excelcomindo) had been awarded national GSM 900 licenses while severalothers were awarded licenses for analog services. Each of the new licenseholders was required to have either Telkom or Indosat as a shareholder.Both Telkom and Indosat had stakes in Telkomsel and Satelindo. The GSMbusiness proved attractive to international operators, with KPN, DeutscheTelekom, and Bell Atlantic (Verizon) taking substantial stakes in Telkomsel,Satelindo and Excelcomindo respectively.
In August 2001, the Government announced the schedule for the earlytermination basic telephony exclusivity rights and a policy aimed at ensuringthat there would be a minimum of two full service providers – withTelkom and Indosat both becoming full network and service providers –as a transition step toward full competition in 2010. Telkom’s monopolyon provision of local services was ended from August 1, 2002. Telkom’smonopoly on long distance services and the Indosat and Satelindo duopolyon international services was scheduled to end on August 1, 2003.However, due to unspecified reasons, the license issuance has been delayedindefinitely. Indosat has been awarded an operating license for fixed localtelecommunications effective from August 1 2002, and is now developingfixed wireless networks in Jakarta and Surabaya. Meanwhile Telkom andother operators have anticipated the ending of the international duopolyby offering VOIP international services at substantially discounted rates.
Table II.3. Telkom and Indosat – Transitionto two Full-Service Providers
MarketSegment BeforeAug. 2002 Aug. 2003*
Operator Telkom Indosat Telkom Indosat Telkom Indosat
Local fixed √ × √ √ √ √
DomesticLong Distance √ × √ × √ √
InternationalLong Distance × √ × √ √ √
* Originally scheduled for August 2003 but has been delayed indefinitely
Table II.2. Allocation of Policy and RegulatoryResponsibilities
Agency Function
Ministry of Post and Exercises policy functions regardingTelecommunications telecommunications.
Director General of Post and Exercises main regulatory functionsTelecommunications regarding telecommunications.(in conjunction with BRTI)
State Ministry for Communications Exercises policy functions regardingand Information telematics and broadcasting.
Indonesian Telematic Coordinating Assigned the task of formulatingTeam government policy in telematics
Coordinating Ministry for Chairs the Telecommunications SectorEconomic Affairs Restructuring Team and the Committee
on Policy for the Acceleration ofInfrastructure Development – see below.
Telecommunications Sector Oversees the termination of exclusivitiesRestructuring Team on basic telephony services and the
unwinding of Telkom and Indosat’scross-holdings.
Committee on Policy for the In charge of addressing regulatory andAcceleration of Infrastructure other impediments to infrastructureDevelopment development.
State Ministry of State Enterprises Represents the Government in its roleas shareholder in Telkom and Indosat.
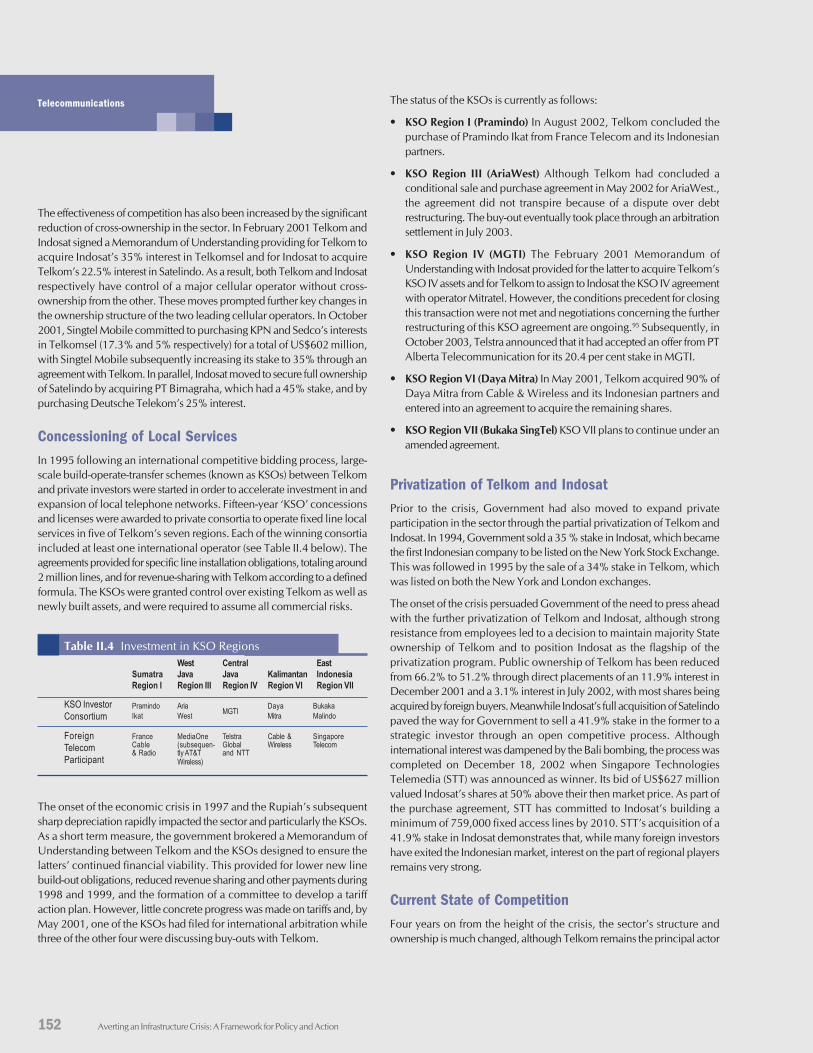
152 Averting an Infrastructure Crisis: A Framework for Policy and Action
Telecommunications
The effectiveness of competition has also been increased by the significantreduction of cross-ownership in the sector. In February 2001 Telkom andIndosat signed a Memorandum of Understanding providing for Telkom toacquire Indosat’s 35% interest in Telkomsel and for Indosat to acquireTelkom’s 22.5% interest in Satelindo. As a result, both Telkom and Indosatrespectively have control of a major cellular operator without cross-ownership from the other. These moves prompted further key changes inthe ownership structure of the two leading cellular operators. In October2001, Singtel Mobile committed to purchasing KPN and Sedco’s interestsin Telkomsel (17.3% and 5% respectively) for a total of US$602 million,with Singtel Mobile subsequently increasing its stake to 35% through anagreement with Telkom. In parallel, Indosat moved to secure full ownershipof Satelindo by acquiring PT Bimagraha, which had a 45% stake, and bypurchasing Deutsche Telekom’s 25% interest.
Concessioning of Local ServicesIn 1995 following an international competitive bidding process, large-scale build-operate-transfer schemes (known as KSOs) between Telkomand private investors were started in order to accelerate investment in andexpansion of local telephone networks. Fifteen-year ‘KSO’ concessionsand licenses were awarded to private consortia to operate fixed line localservices in five of Telkom’s seven regions. Each of the winning consortiaincluded at least one international operator (see Table II.4 below). Theagreements provided for specific line installation obligations, totaling around2 million lines, and for revenue-sharing with Telkom according to a definedformula. The KSOs were granted control over existing Telkom as well asnewly built assets, and were required to assume all commercial risks.
Table II.4 Investment in KSO RegionsWest Central East
Sumatra Java Java Kalimantan IndonesiaRegion I Region III Region IV Region VI Region VII
KSO Investor Pramindo Aria Daya BukakaConsortium Ikat West MGTI Mitra Malindo
Foreign France MediaOne Telstra Cable & SingaporeTelecom Cable (subsequen- Global Wireless Telecom
Participant& Radio tly AT&T and NTT
Wireless)
The onset of the economic crisis in 1997 and the Rupiah’s subsequentsharp depreciation rapidly impacted the sector and particularly the KSOs.As a short term measure, the government brokered a Memorandum ofUnderstanding between Telkom and the KSOs designed to ensure thelatters’ continued financial viability. This provided for lower new linebuild-out obligations, reduced revenue sharing and other payments during1998 and 1999, and the formation of a committee to develop a tariffaction plan. However, little concrete progress was made on tariffs and, byMay 2001, one of the KSOs had filed for international arbitration whilethree of the other four were discussing buy-outs with Telkom.
The status of the KSOs is currently as follows:
• KSO Region I (Pramindo) In August 2002, Telkom concluded thepurchase of Pramindo Ikat from France Telecom and its Indonesianpartners.
• KSO Region III (AriaWest) Although Telkom had concluded aconditional sale and purchase agreement in May 2002 for AriaWest.,the agreement did not transpire because of a dispute over debtrestructuring. The buy-out eventually took place through an arbitrationsettlement in July 2003.
• KSO Region IV (MGTI) The February 2001 Memorandum ofUnderstanding with Indosat provided for the latter to acquire Telkom’sKSO IV assets and for Telkom to assign to Indosat the KSO IV agreementwith operator Mitratel. However, the conditions precedent for closingthis transaction were not met and negotiations concerning the furtherrestructuring of this KSO agreement are ongoing.95 Subsequently, inOctober 2003, Telstra announced that it had accepted an offer from PTAlberta Telecommunication for its 20.4 per cent stake in MGTI.
• KSO Region VI (Daya Mitra) In May 2001, Telkom acquired 90% ofDaya Mitra from Cable & Wireless and its Indonesian partners andentered into an agreement to acquire the remaining shares.
• KSO Region VII (Bukaka SingTel) KSO VII plans to continue under anamended agreement.
Privatization of Telkom and IndosatPrior to the crisis, Government had also moved to expand privateparticipation in the sector through the partial privatization of Telkom andIndosat. In 1994, Government sold a 35 % stake in Indosat, which becamethe first Indonesian company to be listed on the New York Stock Exchange.This was followed in 1995 by the sale of a 34% stake in Telkom, whichwas listed on both the New York and London exchanges.
The onset of the crisis persuaded Government of the need to press aheadwith the further privatization of Telkom and Indosat, although strongresistance from employees led to a decision to maintain majority Stateownership of Telkom and to position Indosat as the flagship of theprivatization program. Public ownership of Telkom has been reducedfrom 66.2% to 51.2% through direct placements of an 11.9% interest inDecember 2001 and a 3.1% interest in July 2002, with most shares beingacquired by foreign buyers. Meanwhile Indosat’s full acquisition of Satelindopaved the way for Government to sell a 41.9% stake in the former to astrategic investor through an open competitive process. Althoughinternational interest was dampened by the Bali bombing, the process wascompleted on December 18, 2002 when Singapore TechnologiesTelemedia (STT) was announced as winner. Its bid of US$627 millionvalued Indosat’s shares at 50% above their then market price. As part ofthe purchase agreement, STT has committed to Indosat’s building aminimum of 759,000 fixed access lines by 2010. STT’s acquisition of a41.9% stake in Indosat demonstrates that, while many foreign investorshave exited the Indonesian market, interest on the part of regional playersremains very strong.
Current State of CompetitionFour years on from the height of the crisis, the sector’s structure andownership is much changed, although Telkom remains the principal actor
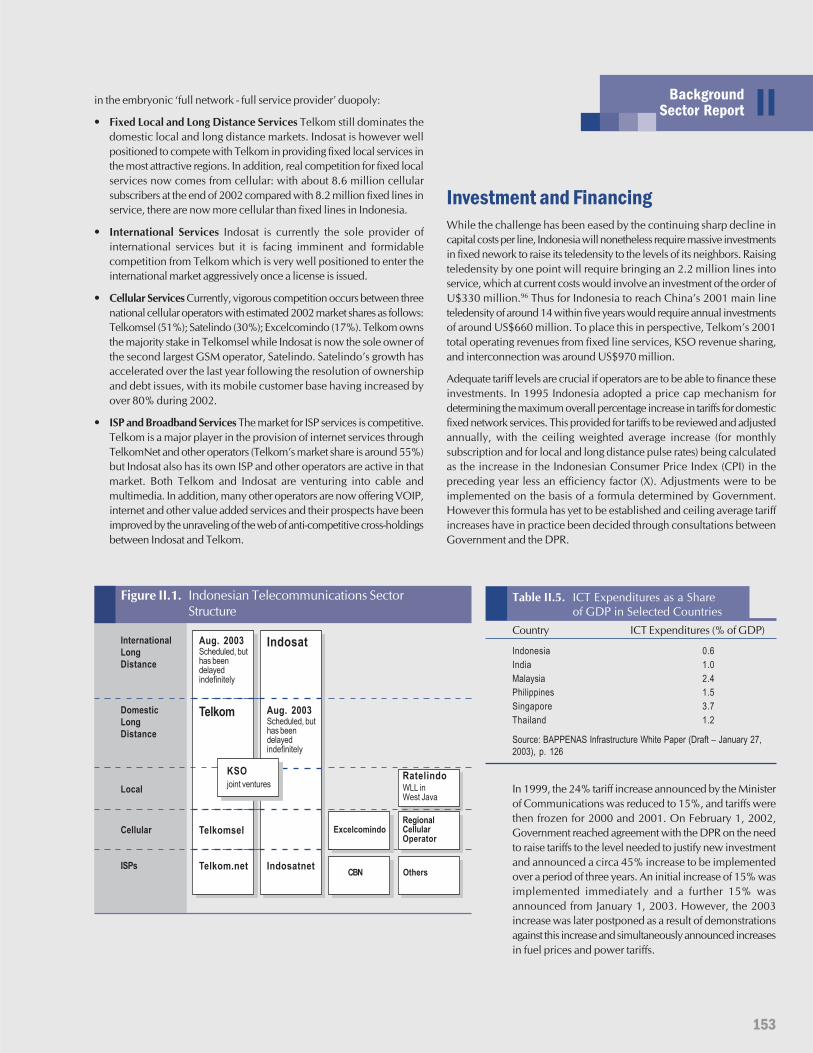
153
IIBackgroundSector Report
in the embryonic ‘full network - full service provider’ duopoly:
• Fixed Local and Long Distance Services Telkom still dominates thedomestic local and long distance markets. Indosat is however wellpositioned to compete with Telkom in providing fixed local services inthe most attractive regions. In addition, real competition for fixed localservices now comes from cellular: with about 8.6 million cellularsubscribers at the end of 2002 compared with 8.2 million fixed lines inservice, there are now more cellular than fixed lines in Indonesia.
• International Services Indosat is currently the sole provider ofinternational services but it is facing imminent and formidablecompetition from Telkom which is very well positioned to enter theinternational market aggressively once a license is issued.
• Cellular Services Currently, vigorous competition occurs between threenational cellular operators with estimated 2002 market shares as follows:Telkomsel (51%); Satelindo (30%); Excelcomindo (17%). Telkom ownsthe majority stake in Telkomsel while Indosat is now the sole owner ofthe second largest GSM operator, Satelindo. Satelindo’s growth hasaccelerated over the last year following the resolution of ownershipand debt issues, with its mobile customer base having increased byover 80% during 2002.
• ISP and Broadband Services The market for ISP services is competitive.Telkom is a major player in the provision of internet services throughTelkomNet and other operators (Telkom’s market share is around 55%)but Indosat also has its own ISP and other operators are active in thatmarket. Both Telkom and Indosat are venturing into cable andmultimedia. In addition, many other operators are now offering VOIP,internet and other value added services and their prospects have beenimproved by the unraveling of the web of anti-competitive cross-holdingsbetween Indosat and Telkom.
Investment and FinancingWhile the challenge has been eased by the continuing sharp decline incapital costs per line, Indonesia will nonetheless require massive investmentsin fixed nework to raise its teledensity to the levels of its neighbors. Raisingteledensity by one point will require bringing an 2.2 million lines intoservice, which at current costs would involve an investment of the order ofU$330 million.96 Thus for Indonesia to reach China’s 2001 main lineteledensity of around 14 within five years would require annual investmentsof around US$660 million. To place this in perspective, Telkom’s 2001total operating revenues from fixed line services, KSO revenue sharing,and interconnection was around US$970 million.
Adequate tariff levels are crucial if operators are to be able to finance theseinvestments. In 1995 Indonesia adopted a price cap mechanism fordetermining the maximum overall percentage increase in tariffs for domesticfixed network services. This provided for tariffs to be reviewed and adjustedannually, with the ceiling weighted average increase (for monthlysubscription and for local and long distance pulse rates) being calculatedas the increase in the Indonesian Consumer Price Index (CPI) in thepreceding year less an efficiency factor (X). Adjustments were to beimplemented on the basis of a formula determined by Government.However this formula has yet to be established and ceiling average tariffincreases have in practice been decided through consultations betweenGovernment and the DPR.
Table II.5. ICT Expenditures as a Shareof GDP in Selected Countries
Country ICT Expenditures (% of GDP)
Indonesia 0.6India 1.0Malaysia 2.4Philippines 1.5Singapore 3.7Thailand 1.2
Source: BAPPENAS Infrastructure White Paper (Draft – January 27,2003), p. 126
In 1999, the 24% tariff increase announced by the Ministerof Communications was reduced to 15%, and tariffs werethen frozen for 2000 and 2001. On February 1, 2002,Government reached agreement with the DPR on the needto raise tariffs to the level needed to justify new investmentand announced a circa 45% increase to be implementedover a period of three years. An initial increase of 15% wasimplemented immediately and a further 15% wasannounced from January 1, 2003. However, the 2003increase was later postponed as a result of demonstrationsagainst this increase and simultaneously announced increasesin fuel prices and power tariffs.
InternationalLongDistance
DomesticLongDistance
Local
Cellular
ISPs
Aug. 2003Scheduled, buthas beendelayedindefinitely
Telkom
Telkomsel
Telkom.net
Indosat
Indosatnet
Aug. 2003Scheduled, buthas beendelayedindefinitely
KSOjoint ventures
Figure II.1. Indonesian Telecommunications SectorStructure
RatelindoWLL inWest Java
Others
RegionalCellularOperator
CBN
Excelcomindo
154 Averting an Infrastructure Crisis: A Framework for Policy and Action
Telecommunications
Following the postponement of the 2003 increase, both Telkom and Indosathave indicated they will be reviewing previously announced plans forexpansion of their fixed line / fixed access networks. This promptedGovernment to announce in February 2003 that it would finance directlythe installation of phone line in 43,000 villages outside Java over a threeyear period.
While telecommunications remains attractive for private investment, raisingfinancing on the scale indicated above for fixed network development willbe challenging. Telkom, which is rated AAA by Indonesia’s rating agencyPefindo, was able to raise Rp. 1 trillion (circa US$ 112 million) in July2002 through the issue of a 5-year bond with a coupon of 17%. However,plans to follow this with the issue of a US$ bond were cancelled. Indosat,with a Pefindo AA+ rating, accessed the market in October 2002 raisingRp. 1 trillion through a 5-year bond with 15% coupon that was substantiallyoversubscribed. In April 2002, Telkomsel demonstrated the greaterattractiveness of the mobile market, with its US$100 million 5-year 9.75%coupon bond issue being increased to US$150 after it was 3.6 timessubscribed.
Sector PerformanceAccess to ServicesOver the decade from 1991 to 2001, the number of main lines in servicein Indonesia has grown from 1.27 million to 7.22 million, an averageannual growth rate of 19% pa, with teledensity increasing from 0.68 linesto 3.25 lines per 100 residents. At the peak, year-on-year growth ratesexceeded 30% pa in 1994 and 1995. However, with the onset of thecrisis, the pace of new investment has slowed with the average increasefrom 1996 to 2001 being 11.5% pa. The number of public telephonesprovided by Telkom has increased rapidly from around 163,000 in 1997to 383,000 by end 2001. In addition, there has also been steady growth innumbers of private teleshops (Wartels).
The teledensities in Telkom’s seven regions in 2001 ranged from 2.11 inDivision VII (Eastern Indonesia) to 10.73 in Division II (Greater Jakarta),with the second highest being Region III (East Java) with a teledensity of3.41. While the teledensity spread between regions is relatively narrow,the spread between urban and rural areas is large. As of December 2001,six large metropolitan cities – Jakarta, Surabaya, Semarang, Bandung,Medan and Denpasar – with a combined population of 17.3 millionaccounted for 48.5% of all fixed lines in service. Denpasar topped thetable with a density of 34.1, followed by Surabaya with 28.1, and Jakartawith 20.6.
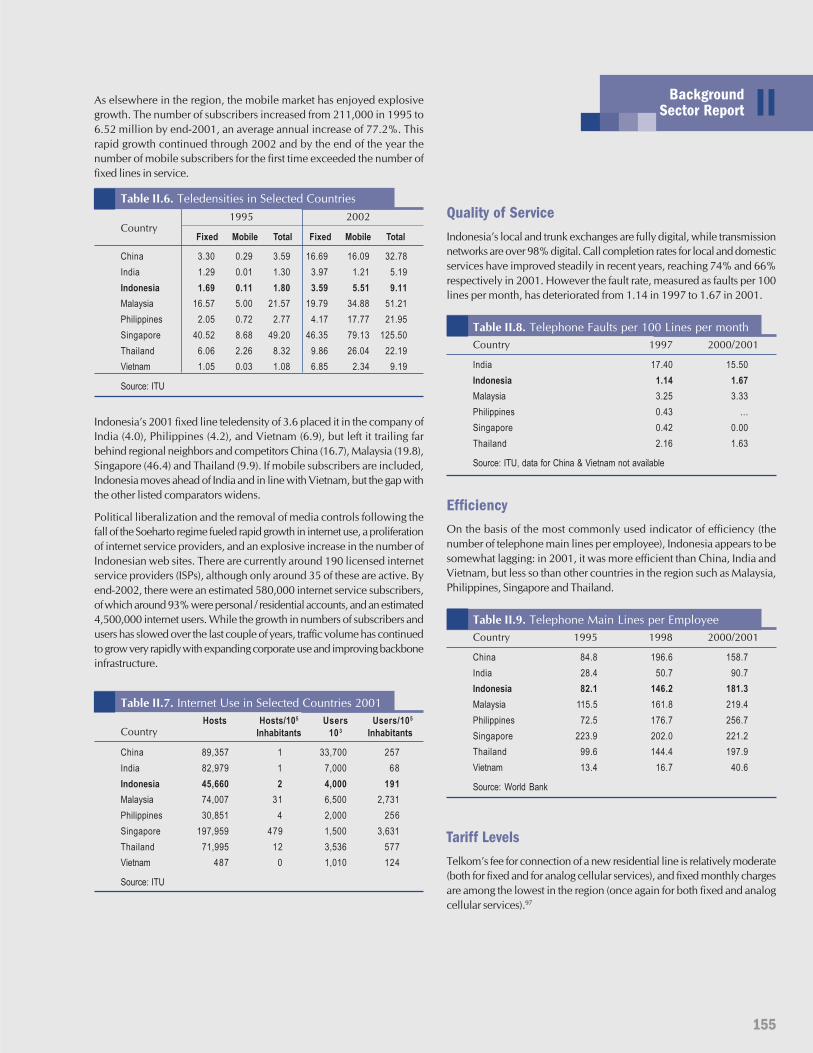
155
IIBackgroundSector Report
As elsewhere in the region, the mobile market has enjoyed explosivegrowth. The number of subscribers increased from 211,000 in 1995 to6.52 million by end-2001, an average annual increase of 77.2%. Thisrapid growth continued through 2002 and by the end of the year thenumber of mobile subscribers for the first time exceeded the number offixed lines in service.
Table II.6. Teledensities in Selected Countries
Country1995 2002
Fixed Mobile Total Fixed Mobile Total
China 3.30 0.29 3.59 16.69 16.09 32.78India 1.29 0.01 1.30 3.97 1.21 5.19Indonesia 1.69 0.11 1.80 3.59 5.51 9.11Malaysia 16.57 5.00 21.57 19.79 34.88 51.21Philippines 2.05 0.72 2.77 4.17 17.77 21.95Singapore 40.52 8.68 49.20 46.35 79.13 125.50Thailand 6.06 2.26 8.32 9.86 26.04 22.19Vietnam 1.05 0.03 1.08 6.85 2.34 9.19
Source: ITU
Indonesia’s 2001 fixed line teledensity of 3.6 placed it in the company ofIndia (4.0), Philippines (4.2), and Vietnam (6.9), but left it trailing farbehind regional neighbors and competitors China (16.7), Malaysia (19.8),Singapore (46.4) and Thailand (9.9). If mobile subscribers are included,Indonesia moves ahead of India and in line with Vietnam, but the gap withthe other listed comparators widens.
Political liberalization and the removal of media controls following thefall of the Soeharto regime fueled rapid growth in internet use, a proliferationof internet service providers, and an explosive increase in the number ofIndonesian web sites. There are currently around 190 licensed internetservice providers (ISPs), although only around 35 of these are active. Byend-2002, there were an estimated 580,000 internet service subscribers,of which around 93% were personal / residential accounts, and an estimated4,500,000 internet users. While the growth in numbers of subscribers andusers has slowed over the last couple of years, traffic volume has continuedto grow very rapidly with expanding corporate use and improving backboneinfrastructure.
Table II.7. Internet Use in Selected Countries 2001
CountryHosts Hosts/105 Users Users/105
Inhabitants 103 Inhabitants
China 89,357 1 33,700 257India 82,979 1 7,000 68Indonesia 45,660 2 4,000 191Malaysia 74,007 31 6,500 2,731Philippines 30,851 4 2,000 256Singapore 197,959 479 1,500 3,631Thailand 71,995 12 3,536 577Vietnam 487 0 1,010 124
Source: ITU
Quality of ServiceIndonesia’s local and trunk exchanges are fully digital, while transmissionnetworks are over 98% digital. Call completion rates for local and domesticservices have improved steadily in recent years, reaching 74% and 66%respectively in 2001. However the fault rate, measured as faults per 100lines per month, has deteriorated from 1.14 in 1997 to 1.67 in 2001.
Table II.8. Telephone Faults per 100 Lines per monthCountry 1997 2000/2001
India 17.40 15.50Indonesia 1.14 1.67Malaysia 3.25 3.33Philippines 0.43 …Singapore 0.42 0.00Thailand 2.16 1.63
Source: ITU, data for China & Vietnam not available
EfficiencyOn the basis of the most commonly used indicator of efficiency (thenumber of telephone main lines per employee), Indonesia appears to besomewhat lagging: in 2001, it was more efficient than China, India andVietnam, but less so than other countries in the region such as Malaysia,Philippines, Singapore and Thailand.
Table II.9. Telephone Main Lines per EmployeeCountry 1995 1998 2000/2001
China 84.8 196.6 158.7India 28.4 50.7 90.7Indonesia 82.1 146.2 181.3Malaysia 115.5 161.8 219.4Philippines 72.5 176.7 256.7Singapore 223.9 202.0 221.2Thailand 99.6 144.4 197.9Vietnam 13.4 16.7 40.6
Source: World Bank
Tariff LevelsTelkom’s fee for connection of a new residential line is relatively moderate(both for fixed and for analog cellular services), and fixed monthly chargesare among the lowest in the region (once again for both fixed and analogcellular services).97
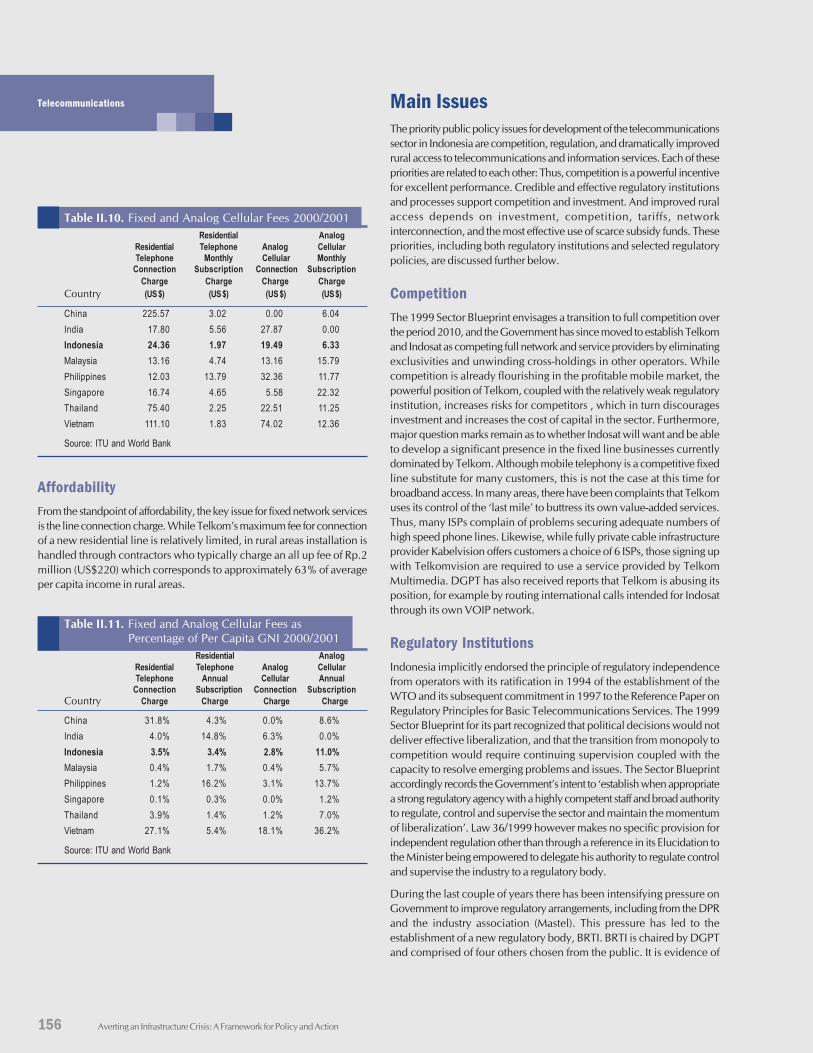
156 Averting an Infrastructure Crisis: A Framework for Policy and Action
Telecommunications
Table II.10. Fixed and Analog Cellular Fees 2000/2001Residential Analog
Residential Telephone Analog CellularTelephone Monthly Cellular Monthly
Connection Subscription Connection SubscriptionCharge Charge Charge Charge
Country (US $) (US $) (US $) (US $)
China 225.57 3.02 0.00 6.04India 17.80 5.56 27.87 0.00Indonesia 24.36 1.97 19.49 6.33Malaysia 13.16 4.74 13.16 15.79Philippines 12.03 13.79 32.36 11.77Singapore 16.74 4.65 5.58 22.32Thailand 75.40 2.25 22.51 11.25Vietnam 111.10 1.83 74.02 12.36
Source: ITU and World Bank
AffordabilityFrom the standpoint of affordability, the key issue for fixed network servicesis the line connection charge. While Telkom’s maximum fee for connectionof a new residential line is relatively limited, in rural areas installation ishandled through contractors who typically charge an all up fee of Rp.2million (US$220) which corresponds to approximately 63% of averageper capita income in rural areas.
Table II.11. Fixed and Analog Cellular Fees asPercentage of Per Capita GNI 2000/2001
Residential AnalogResidential Telephone Analog CellularTelephone Annual Cellular Annual
Connection Subscription Connection SubscriptionCountry Charge Charge Charge Charge
China 31.8% 4.3% 0.0% 8.6%India 4.0% 14.8% 6.3% 0.0%Indonesia 3.5% 3.4% 2.8% 11.0%Malaysia 0.4% 1.7% 0.4% 5.7%Philippines 1.2% 16.2% 3.1% 13.7%Singapore 0.1% 0.3% 0.0% 1.2%Thailand 3.9% 1.4% 1.2% 7.0%Vietnam 27.1% 5.4% 18.1% 36.2%
Source: ITU and World Bank
Main IssuesThe priority public policy issues for development of the telecommunicationssector in Indonesia are competition, regulation, and dramatically improvedrural access to telecommunications and information services. Each of thesepriorities are related to each other: Thus, competition is a powerful incentivefor excellent performance. Credible and effective regulatory institutionsand processes support competition and investment. And improved ruralaccess depends on investment, competition, tariffs, networkinterconnection, and the most effective use of scarce subsidy funds. Thesepriorities, including both regulatory institutions and selected regulatorypolicies, are discussed further below.
CompetitionThe 1999 Sector Blueprint envisages a transition to full competition overthe period 2010, and the Government has since moved to establish Telkomand Indosat as competing full network and service providers by eliminatingexclusivities and unwinding cross-holdings in other operators. Whilecompetition is already flourishing in the profitable mobile market, thepowerful position of Telkom, coupled with the relatively weak regulatoryinstitution, increases risks for competitors , which in turn discouragesinvestment and increases the cost of capital in the sector. Furthermore,major question marks remain as to whether Indosat will want and be ableto develop a significant presence in the fixed line businesses currentlydominated by Telkom. Although mobile telephony is a competitive fixedline substitute for many customers, this is not the case at this time forbroadband access. In many areas, there have been complaints that Telkomuses its control of the ‘last mile’ to buttress its own value-added services.Thus, many ISPs complain of problems securing adequate numbers ofhigh speed phone lines. Likewise, while fully private cable infrastructureprovider Kabelvision offers customers a choice of 6 ISPs, those signing upwith Telkomvision are required to use a service provided by TelkomMultimedia. DGPT has also received reports that Telkom is abusing itsposition, for example by routing international calls intended for Indosatthrough its own VOIP network.
Regulatory InstitutionsIndonesia implicitly endorsed the principle of regulatory independencefrom operators with its ratification in 1994 of the establishment of theWTO and its subsequent commitment in 1997 to the Reference Paper onRegulatory Principles for Basic Telecommunications Services. The 1999Sector Blueprint for its part recognized that political decisions would notdeliver effective liberalization, and that the transition from monopoly tocompetition would require continuing supervision coupled with thecapacity to resolve emerging problems and issues. The Sector Blueprintaccordingly records the Government’s intent to ‘establish when appropriatea strong regulatory agency with a highly competent staff and broad authorityto regulate, control and supervise the sector and maintain the momentumof liberalization’. Law 36/1999 however makes no specific provision forindependent regulation other than through a reference in its Elucidation tothe Minister being empowered to delegate his authority to regulate controland supervise the industry to a regulatory body.
During the last couple of years there has been intensifying pressure onGovernment to improve regulatory arrangements, including from the DPRand the industry association (Mastel). This pressure has led to theestablishment of a new regulatory body, BRTI. BRTI is chaired by DGPTand comprised of four others chosen from the public. It is evidence of

157
IIBackgroundSector Report
steps taken to improve the regulatory environment, but it does not meetthe criteria of a strong, independent regulatory body. Given BRTI’s statusand structure, it represents only a limited step towards an effective crediblenon-ministerial regulatory agency that would compare with internationalbest practice.
TariffsThe current practice of seeking Parliamentary endorsement of proposedtelecom price changes inevitably involves the politicization of pricing.This approach introduces enormous risks for investors and therebydiscourages investment. The government decision in January 2003 topostpone the 15% tariff increase announced only a few days previouslyhas exacerbated concerns about this critical element which affects investmentdecisions.
InterconnectionA transparently managed and non-discriminatory interconnection regimeunder which major providers are obliged to provide cost-reflective ratesand are prohibited from engaging in anti-competitive cross-subsidies is akey prerequisite for effective competition in the sector. Telkom currentlyoccupies an overwhelmingly dominant position in the fixed market andcomplex interconnection issues are arising as Indosat seeks to become acompetitor and Telkom divests its stakes in other operators. The plannedMinisterial decree on Interconnection has not yet been finalized and DGPThas acknowledged that it is poorly equipped to deal with the emergingproblems in this area.
LicensingProcedures for the award of licenses for telecommunications network andservice operators remain ill-defined and non-transparent. During the Suhartoera, licenses were issued to connected parties without competitive tendering.The Government not only missed opportunities to generate significantnon-tax revenues, it also failed to set specific investment and otherperformance obligations for licensees.98 While there has subsequentlybeen much discussion of the need to improve licensing procedures andlicense documents, there has been little concrete progress to date and thehandling of VOIP licensees in 2002 has prompted renewed concernsabout lack of transparency and high-level corruption.99 Particular attentionneeds to be given to managing the use of the radio spectrum. Implementationof improved management and licensing arrangements has the potential tooptimize the economic benefit of this scarce resource while also generatingsubstantial revenues.
AccessThe number of telephone lines per 100 people shows a large variationbetween Jakarta and rural areas of Indonesia where the problem of thousandsof unserved or underserved villages needs to be addressed. As mentioned
158 Averting an Infrastructure Crisis: A Framework for Policy and Action
Telecommunications
above, the Government announced in February 2003 that it would financedirectly the installation of phone line in 43,000 villages outside Java overa three year period. Under such a scenario, there is no guarantee, however,that public resources will be used in the most efficient way. Morefundamentally - although it is presented in part as a move to support themore rapid counting of votes for the 2004 General Election - theGovernment’s decision to invest directly in the sector marks a significantshift in policy and raises important questions about the Government’sfuture role in the sector.
The Way ForwardThe overarching challenge now facing Government is to establish aneffective policy and regulatory environment conducive to the mobilizationof the large scale private investments needed to rapidly increase Indonesia’steledensity, particularly in rural areas, and to improve the quality andcapacity of other telecommunications services. Three main priorities emerge.The first is to intensify and entrench pro-competitive policies for the sectorto promote efficiency, investment, and timely utilization of new technologiesby customers. The second is to support these pro-competitive policies byestablishing a highly credible and effective non-ministerial institution andprocesses that can serve to de-politicize tariff-setting, and address andremove impediments (sometimes caused by outdated regulations, marketpower, or vested interests) to investment and deployment of newcommunications technology. The third priority, for areas that are not well-served by the market, is to adopt and implement a set of policies andprograms that will systematically address the inadequate access totelecommunications services, and more broadly to information services,in thousands of villages in Indonesia. While there is a broad consensuswithin Indonesia on many of these items, actions have been delayed inpart because of reluctance to move regulatory authority out of the sectorministry, and because of anticipated delays in drafting and passing newlegislation. The more detailed Roadmap to address the challenge isdiscussed below.
Promote CompetitionThe development of competition in the ICT sector has provided enormouslypowerful incentives for investments and innovation. In order to maximizethe benefits of competition, a first priority is to ensure that competition inthe sector is not eroded through anti-competitive ownership structures orconduct. Before an independent regulatory body is fully functional (seebelow), there might be merit in requesting the Government’s BusinessCompetition Supervisory Agency (KPPU) to conduct an early review toassess whether the key actors in the sector are abusing their market powerand pursuing anti-competitive behaviors. In addition, the Governmentshould take step to increase competition in basic telephony services.International experience demonstrates that duopoly structures have usuallyfailed to yield substantial competition benefits and new competitors willbe needed to create effective competition in basic telephony services.
Establish an Independent Regulatory BodyThe Government should act quickly to establish an interim independent(non-ministerial) regulatory agency under the umbrella provided by Law36. This could be accomplished by: (a) creating the new agency throughan implementing Government Regulation under Law 36; (b) having theMinister assign his authority for sector regulation, supervision and controlto the new agency through an irrevocable Ministerial Decree; and (c)amending and supplementing as appropriate the two existing GovernmentRegulations issued for Law 36 so as to better define the regulatory powersthat would be delegated and the policies and criteria to govern their use.Such a move would be in line with recent developments in the energysector, where the 2001 Law on Oil and Natural Gas provides for theestablishment of a Downstream Regulatory Agency and the 2002 Law onElectricity provides the establishment of an Electricity Market SupervisoryAgency. The financing for the new Agency should enable it to recruithighly qualified professionals and to engage world class professional advisorsas needed.
Adjust and Rebalance Tariffs for Fixed ServicesThe Government’s decision in January 2003 to postpone the 15% tariffincrease announced only a few days previously has exacerbated operatorconcerns regarding this critical element of sector policy and has causedboth Telkom and Indosat to cut back their plans for fixed access networkexpansion. As a short term measure, the Government needs to commit toa firm plan for completing the implementation of the circa 45% tariffincrease over three years already agreed with the DPR. In addition, MOCneeds to finalize the long delayed decree on tariff setting so as to provideclear guidelines for tariff rebalancing. Finally, once an independentregulatory body is in place, that body should become responsible for priceregulation.
Establish a Credible and Equitable InterconnectionRegimeEnforcement of a credible and equitable network interconnection regimeis critical to facilitate new entry as well as to provide incentives for existingoperators to make investments. Draft Ministerial Decrees are still pendingin this area since the enactment of Law 36/1999 and adoption of soundregulations in this domain is a matter of urgent priority.
Improve Licensing and Radio Spectrum ManagementThe Government should as a matter of urgency initiate a comprehensivereview of its current policies and practices for awarding licenses andmanaging the radio spectrum. The objective should be to ensureeconomically optimal use of scarce resources. Properly implemented,improved policies and practices should also generate substantial non-taxand tax revenues for the State budget. It is recommended that such areview be completed before any new licenses are issued for radio-basedservices.
Promote Extension of Rural TelecommunicationsServicesThe Government’s recent announcement of plans to finance the extensionof fixed access networks to villages in remote areas raises fundamentalquestions about its future role in the sector. While improving rural accessto telecommunications services is a valid objective, it is important that the
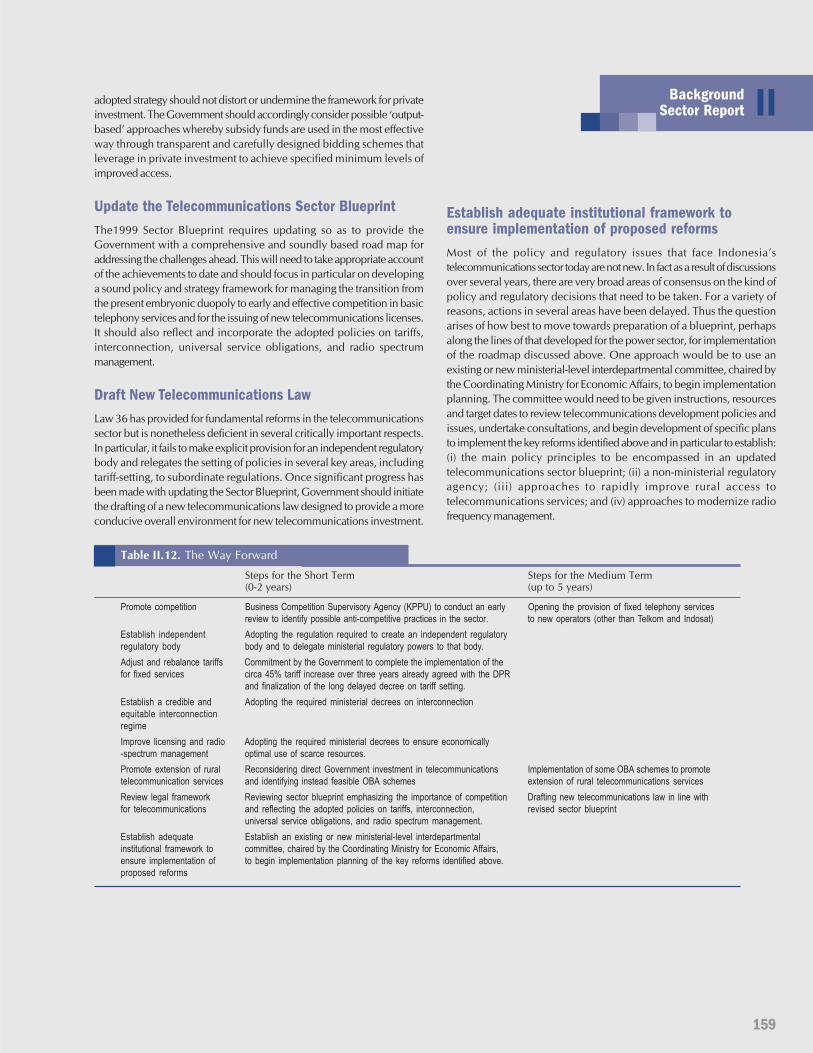
159
IIBackgroundSector Report
adopted strategy should not distort or undermine the framework for privateinvestment. The Government should accordingly consider possible ‘output-based’ approaches whereby subsidy funds are used in the most effectiveway through transparent and carefully designed bidding schemes thatleverage in private investment to achieve specified minimum levels ofimproved access.
Update the Telecommunications Sector BlueprintThe1999 Sector Blueprint requires updating so as to provide theGovernment with a comprehensive and soundly based road map foraddressing the challenges ahead. This will need to take appropriate accountof the achievements to date and should focus in particular on developinga sound policy and strategy framework for managing the transition fromthe present embryonic duopoly to early and effective competition in basictelephony services and for the issuing of new telecommunications licenses.It should also reflect and incorporate the adopted policies on tariffs,interconnection, universal service obligations, and radio spectrummanagement.
Draft New Telecommunications LawLaw 36 has provided for fundamental reforms in the telecommunicationssector but is nonetheless deficient in several critically important respects.In particular, it fails to make explicit provision for an independent regulatorybody and relegates the setting of policies in several key areas, includingtariff-setting, to subordinate regulations. Once significant progress hasbeen made with updating the Sector Blueprint, Government should initiatethe drafting of a new telecommunications law designed to provide a moreconducive overall environment for new telecommunications investment.
Establish adequate institutional framework toensure implementation of proposed reformsMost of the policy and regulatory issues that face Indonesia’stelecommunications sector today are not new. In fact as a result of discussionsover several years, there are very broad areas of consensus on the kind ofpolicy and regulatory decisions that need to be taken. For a variety ofreasons, actions in several areas have been delayed. Thus the questionarises of how best to move towards preparation of a blueprint, perhapsalong the lines of that developed for the power sector, for implementationof the roadmap discussed above. One approach would be to use anexisting or new ministerial-level interdepartmental committee, chaired bythe Coordinating Ministry for Economic Affairs, to begin implementationplanning. The committee would need to be given instructions, resourcesand target dates to review telecommunications development policies andissues, undertake consultations, and begin development of specific plansto implement the key reforms identified above and in particular to establish:(i) the main policy principles to be encompassed in an updatedtelecommunications sector blueprint; (ii) a non-ministerial regulatoryagency; (iii) approaches to rapidly improve rural access totelecommunications services; and (iv) approaches to modernize radiofrequency management.
Table II.12. The Way Forward
Steps for the Short Term Steps for the Medium Term(0-2 years) (up to 5 years)
Promote competition Business Competition Supervisory Agency (KPPU) to conduct an early Opening the provision of fixed telephony servicesreview to identify possible anti-competitive practices in the sector. to new operators (other than Telkom and Indosat)
Establish independent Adopting the regulation required to create an independent regulatoryregulatory body body and to delegate ministerial regulatory powers to that body.Adjust and rebalance tariffs Commitment by the Government to complete the implementation of thefor fixed services circa 45% tariff increase over three years already agreed with the DPR
and finalization of the long delayed decree on tariff setting.Establish a credible and Adopting the required ministerial decrees on interconnectionequitable interconnectionregimeImprove licensing and radio Adopting the required ministerial decrees to ensure economically-spectrum management optimal use of scarce resources.Promote extension of rural Reconsidering direct Government investment in telecommunications Implementation of some OBA schemes to promotetelecommunication services and identifying instead feasible OBA schemes extension of rural telecommunications servicesReview legal framework Reviewing sector blueprint emphasizing the importance of competition Drafting new telecommunications law in line withfor telecommunications and reflecting the adopted policies on tariffs, interconnection, revised sector blueprint
universal service obligations, and radio spectrum management.Establish adequate Establish an existing or new ministerial-level interdepartmentalinstitutional framework to committee, chaired by the Coordinating Ministry for Economic Affairs,ensure implementation of to begin implementation planning of the key reforms identified above.proposed reforms
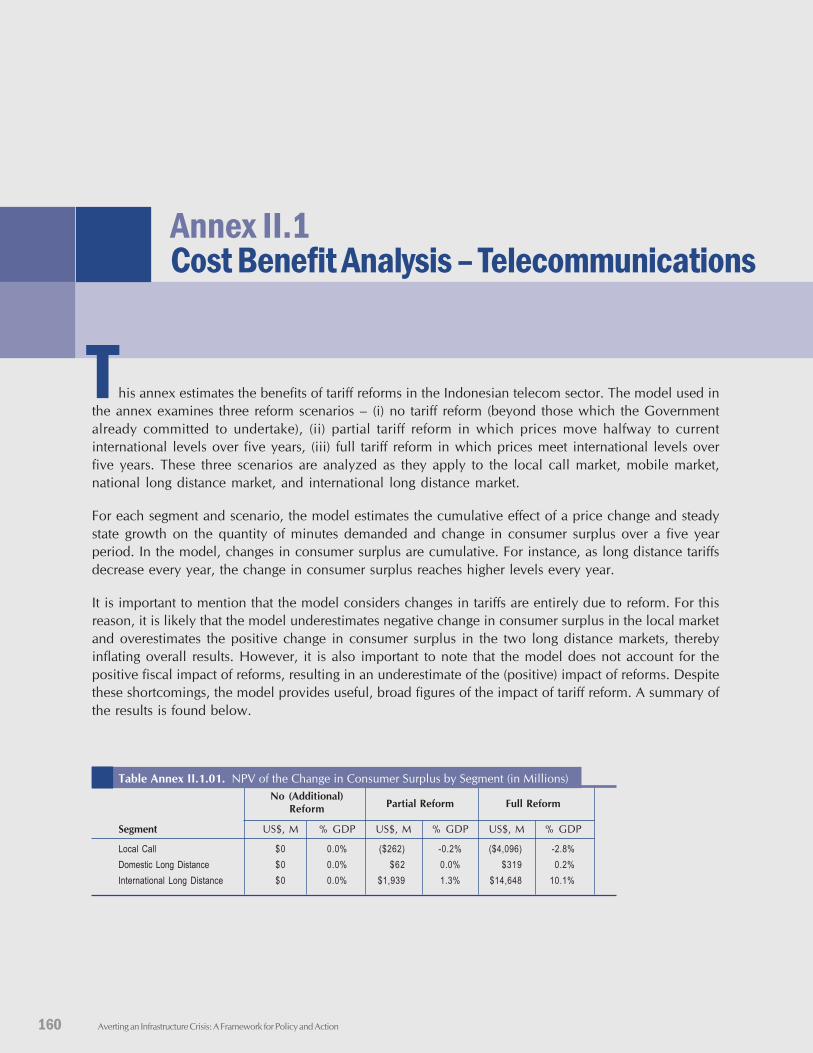
Averting an Infrastructure Crisis: A Framework for Policy and Action160
Annex II.1Cost Benefit Analysis – Telecommunications
his annex estimates the benefits of tariff reforms in the Indonesian telecom sector. The model used inthe annex examines three reform scenarios – (i) no tariff reform (beyond those which the Governmentalready committed to undertake), (ii) partial tariff reform in which prices move halfway to currentinternational levels over five years, (iii) full tariff reform in which prices meet international levels overfive years. These three scenarios are analyzed as they apply to the local call market, mobile market,national long distance market, and international long distance market.
For each segment and scenario, the model estimates the cumulative effect of a price change and steadystate growth on the quantity of minutes demanded and change in consumer surplus over a five yearperiod. In the model, changes in consumer surplus are cumulative. For instance, as long distance tariffsdecrease every year, the change in consumer surplus reaches higher levels every year.
It is important to mention that the model considers changes in tariffs are entirely due to reform. For thisreason, it is likely that the model underestimates negative change in consumer surplus in the local marketand overestimates the positive change in consumer surplus in the two long distance markets, therebyinflating overall results. However, it is also important to note that the model does not account for thepositive fiscal impact of reforms, resulting in an underestimate of the (positive) impact of reforms. Despitethese shortcomings, the model provides useful, broad figures of the impact of tariff reform. A summary ofthe results is found below.
Table Annex II.1.01. NPV of the Change in Consumer Surplus by Segment (in Millions)No (Additional)
Partial Reform Full ReformReform
Segment US$, M % GDP US$, M % GDP US$, M % GDP
Local Call $0 0.0% ($262) -0.2% ($4,096) -2.8%Domestic Long Distance $0 0.0% $62 0.0% $319 0.2%International Long Distance $0 0.0% $1,939 1.3% $14,648 10.1%
T
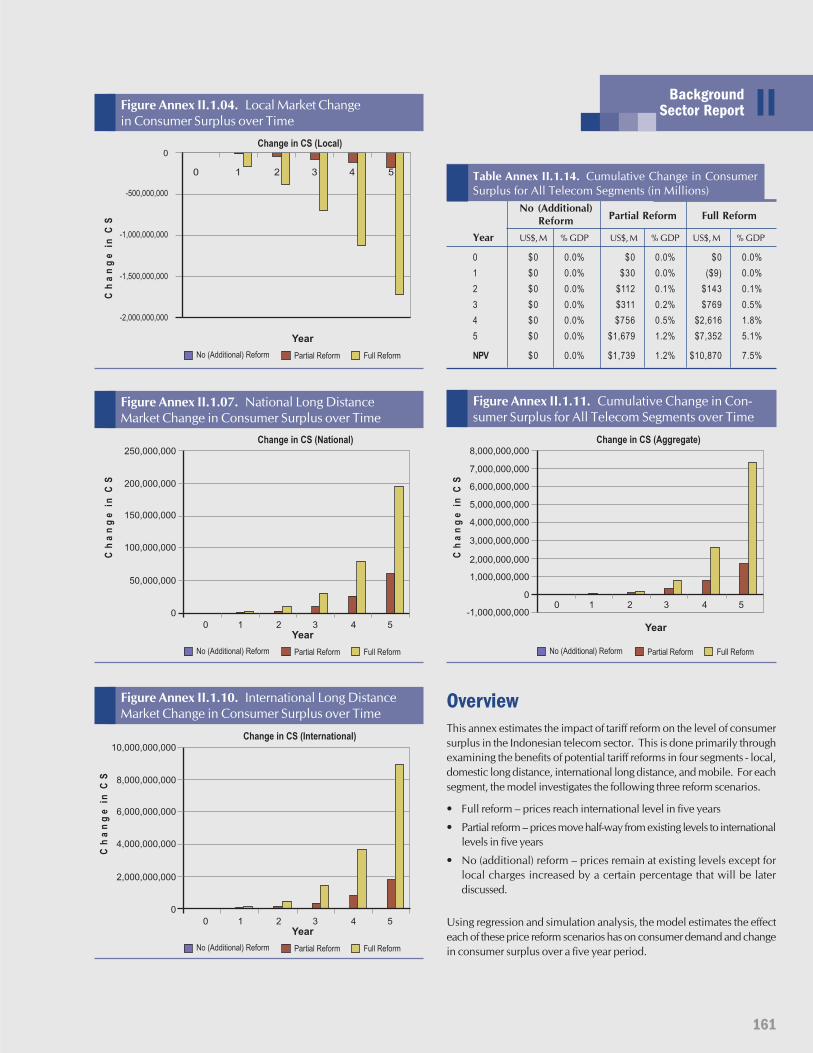
161
IIBackgroundSector Report
Change in CS (National)
Year
Ch
an
ge
inC
S
No (Additional) Reform Partial Reform Full Reform
0
50,000,000
100,000,000
150,000,000
200,000,000
250,000,000
0 1 2 3 4 5
Figure Annex II.1.07. National Long DistanceMarket Change in Consumer Surplus over Time
Change in CS (Local)
-2,000,000,000
-1,500,000,000
-1,000,000,000
-500,000,000
0
0 1 2 3 4 5
Year
Ch
an
ge
inC
S
No (Additional) Reform Partial Reform Full Reform
Figure Annex II.1.04. Local Market Changein Consumer Surplus over Time
Change in CS (International)
Year
Ch
an
ge
inC
S
No (Additional) Reform Partial Reform Full Reform
0
2,000,000,000
4,000,000,000
6,000,000,000
8,000,000,000
10,000,000,000
0 1 2 3 4 5
Figure Annex II.1.10. International Long DistanceMarket Change in Consumer Surplus over Time
Table Annex II.1.14. Cumulative Change in ConsumerSurplus for All Telecom Segments (in Millions)
No (Additional)Partial Reform Full ReformReform
Year US$, M % GDP US$, M % GDP US$, M % GDP
0 $0 0.0% $0 0.0% $0 0.0%1 $0 0.0% $30 0.0% ($9) 0.0%2 $0 0.0% $112 0.1% $143 0.1%3 $0 0.0% $311 0.2% $769 0.5%4 $0 0.0% $756 0.5% $2,616 1.8%5 $0 0.0% $1,679 1.2% $7,352 5.1%
NPV $0 0.0% $1,739 1.2% $10,870 7.5%
OverviewThis annex estimates the impact of tariff reform on the level of consumersurplus in the Indonesian telecom sector. This is done primarily throughexamining the benefits of potential tariff reforms in four segments - local,domestic long distance, international long distance, and mobile. For eachsegment, the model investigates the following three reform scenarios.
• Full reform – prices reach international level in five years
• Partial reform – prices move half-way from existing levels to internationallevels in five years
• No (additional) reform – prices remain at existing levels except forlocal charges increased by a certain percentage that will be laterdiscussed.
Using regression and simulation analysis, the model estimates the effecteach of these price reform scenarios has on consumer demand and changein consumer surplus over a five year period.
Change in CS (Aggregate)
Year
Ch
an
ge
inC
S
No (Additional) Reform Partial Reform Full Reform
0
1,000,000,000
4,000,000,000
5,000,000,000
7,000,000,000
8,000,000,000
0 1 2 3 4 5-1,000,000,000
2,000,000,000
3,000,000,000
6,000,000,000
Figure Annex II.1.11. Cumulative Change in Con-sumer Surplus for All Telecom Segments over Time
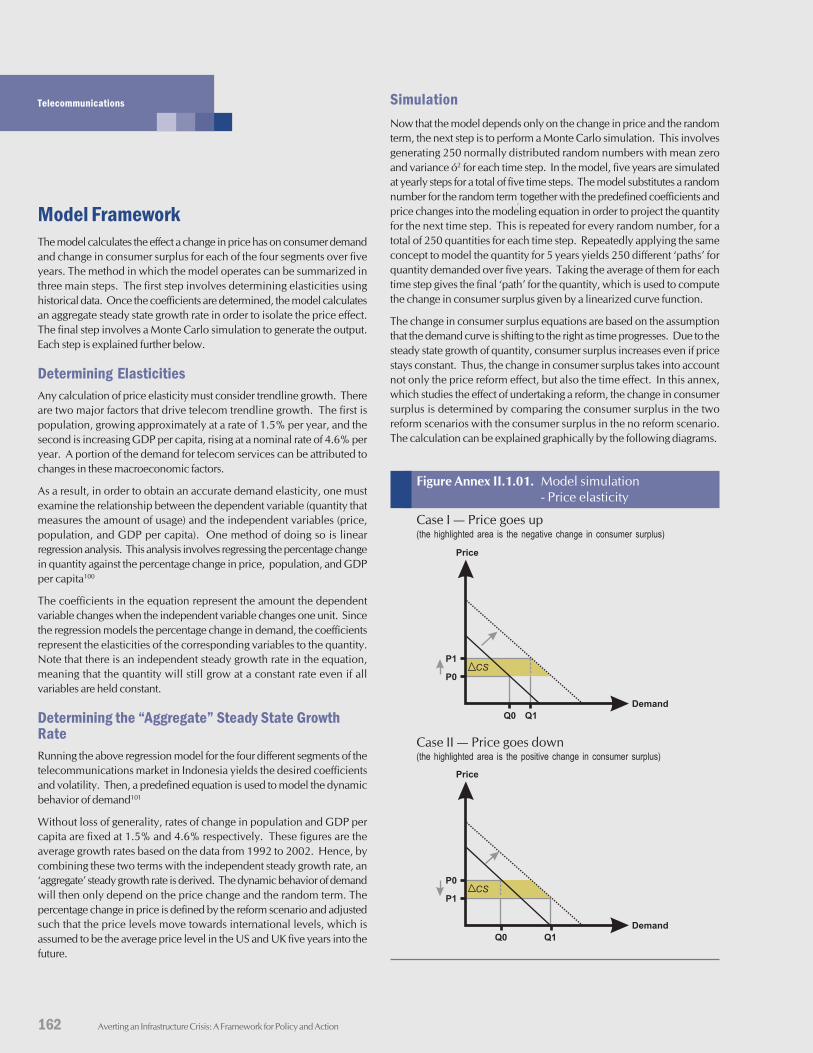
162 Averting an Infrastructure Crisis: A Framework for Policy and Action
Telecommunications
Q0 Q1
P0
P1
Price
Demand
CS
Q1
P1
P0
Price
Demand
CS
Q0
Model FrameworkThe model calculates the effect a change in price has on consumer demandand change in consumer surplus for each of the four segments over fiveyears. The method in which the model operates can be summarized inthree main steps. The first step involves determining elasticities usinghistorical data. Once the coefficients are determined, the model calculatesan aggregate steady state growth rate in order to isolate the price effect.The final step involves a Monte Carlo simulation to generate the output.Each step is explained further below.
Determining ElasticitiesAny calculation of price elasticity must consider trendline growth. Thereare two major factors that drive telecom trendline growth. The first ispopulation, growing approximately at a rate of 1.5% per year, and thesecond is increasing GDP per capita, rising at a nominal rate of 4.6% peryear. A portion of the demand for telecom services can be attributed tochanges in these macroeconomic factors.
As a result, in order to obtain an accurate demand elasticity, one mustexamine the relationship between the dependent variable (quantity thatmeasures the amount of usage) and the independent variables (price,population, and GDP per capita). One method of doing so is linearregression analysis. This analysis involves regressing the percentage changein quantity against the percentage change in price, population, and GDPper capita100
The coefficients in the equation represent the amount the dependentvariable changes when the independent variable changes one unit. Sincethe regression models the percentage change in demand, the coefficientsrepresent the elasticities of the corresponding variables to the quantity.Note that there is an independent steady growth rate in the equation,meaning that the quantity will still grow at a constant rate even if allvariables are held constant.
Determining the “Aggregate” Steady State GrowthRateRunning the above regression model for the four different segments of thetelecommunications market in Indonesia yields the desired coefficientsand volatility. Then, a predefined equation is used to model the dynamicbehavior of demand101
Without loss of generality, rates of change in population and GDP percapita are fixed at 1.5% and 4.6% respectively. These figures are theaverage growth rates based on the data from 1992 to 2002. Hence, bycombining these two terms with the independent steady growth rate, an‘aggregate’ steady growth rate is derived. The dynamic behavior of demandwill then only depend on the price change and the random term. Thepercentage change in price is defined by the reform scenario and adjustedsuch that the price levels move towards international levels, which isassumed to be the average price level in the US and UK five years into thefuture.
SimulationNow that the model depends only on the change in price and the randomterm, the next step is to perform a Monte Carlo simulation. This involvesgenerating 250 normally distributed random numbers with mean zeroand variance ó2 for each time step. In the model, five years are simulatedat yearly steps for a total of five time steps. The model substitutes a randomnumber for the random term, together with the predefined coefficients andprice changes into the modeling equation in order to project the quantityfor the next time step. This is repeated for every random number, for atotal of 250 quantities for each time step. Repeatedly applying the sameconcept to model the quantity for 5 years yields 250 different ‘paths’ forquantity demanded over five years. Taking the average of them for eachtime step gives the final ‘path’ for the quantity, which is used to computethe change in consumer surplus given by a linearized curve function.
The change in consumer surplus equations are based on the assumptionthat the demand curve is shifting to the right as time progresses. Due to thesteady state growth of quantity, consumer surplus increases even if pricestays constant. Thus, the change in consumer surplus takes into accountnot only the price reform effect, but also the time effect. In this annex,which studies the effect of undertaking a reform, the change in consumersurplus is determined by comparing the consumer surplus in the tworeform scenarios with the consumer surplus in the no reform scenario.The calculation can be explained graphically by the following diagrams.
Figure Annex II.1.01. Model simulation- Price elasticity
Case I — Price goes up(the highlighted area is the negative change in consumer surplus)
Case II — Price goes down(the highlighted area is the positive change in consumer surplus)
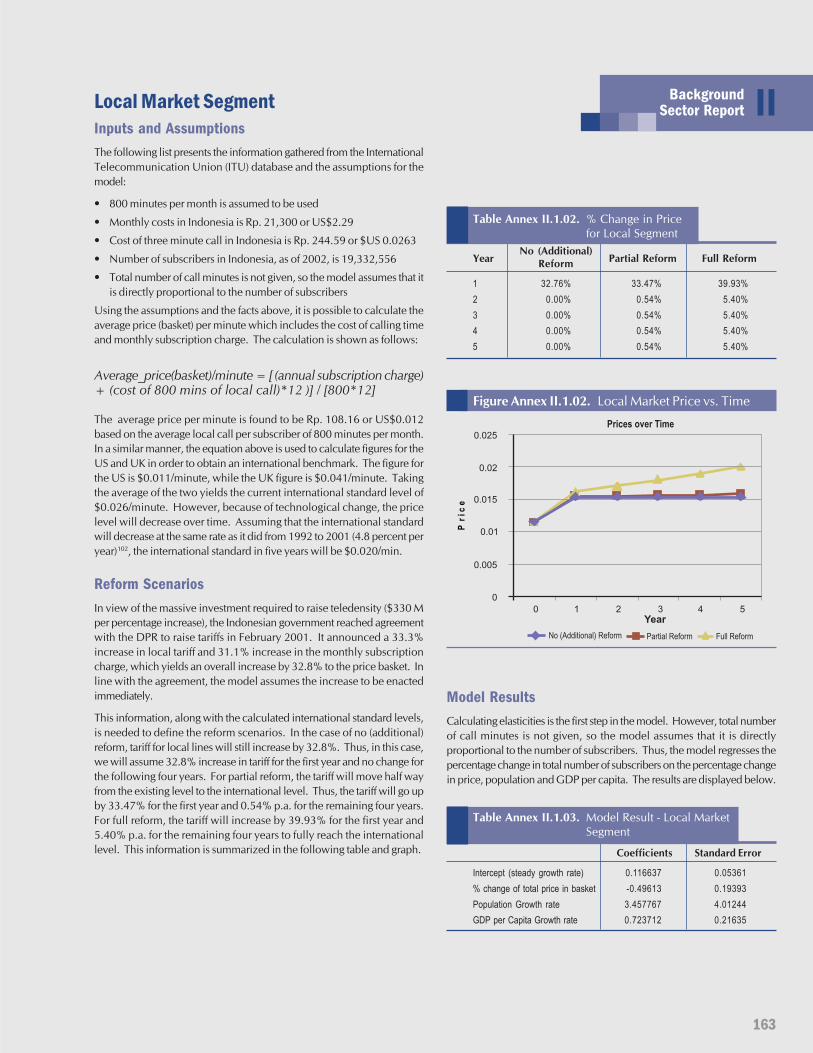
163
IIBackgroundSector ReportLocal Market Segment
Inputs and AssumptionsThe following list presents the information gathered from the InternationalTelecommunication Union (ITU) database and the assumptions for themodel:
• 800 minutes per month is assumed to be used
• Monthly costs in Indonesia is Rp. 21,300 or US$2.29
• Cost of three minute call in Indonesia is Rp. 244.59 or $US 0.0263
• Number of subscribers in Indonesia, as of 2002, is 19,332,556
• Total number of call minutes is not given, so the model assumes that itis directly proportional to the number of subscribers
Using the assumptions and the facts above, it is possible to calculate theaverage price (basket) per minute which includes the cost of calling timeand monthly subscription charge. The calculation is shown as follows:
Average_price(basket)/minute = [ (annual subscription charge)+ (cost of 800 mins of local call)*12 )] / [800*12]
The average price per minute is found to be Rp. 108.16 or US$0.012based on the average local call per subscriber of 800 minutes per month.In a similar manner, the equation above is used to calculate figures for theUS and UK in order to obtain an international benchmark. The figure forthe US is $0.011/minute, while the UK figure is $0.041/minute. Takingthe average of the two yields the current international standard level of$0.026/minute. However, because of technological change, the pricelevel will decrease over time. Assuming that the international standardwill decrease at the same rate as it did from 1992 to 2001 (4.8 percent peryear)102, the international standard in five years will be $0.020/min.
Reform ScenariosIn view of the massive investment required to raise teledensity ($330 Mper percentage increase), the Indonesian government reached agreementwith the DPR to raise tariffs in February 2001. It announced a 33.3%increase in local tariff and 31.1% increase in the monthly subscriptioncharge, which yields an overall increase by 32.8% to the price basket. Inline with the agreement, the model assumes the increase to be enactedimmediately.
This information, along with the calculated international standard levels,is needed to define the reform scenarios. In the case of no (additional)reform, tariff for local lines will still increase by 32.8%. Thus, in this case,we will assume 32.8% increase in tariff for the first year and no change forthe following four years. For partial reform, the tariff will move half wayfrom the existing level to the international level. Thus, the tariff will go upby 33.47% for the first year and 0.54% p.a. for the remaining four years.For full reform, the tariff will increase by 39.93% for the first year and5.40% p.a. for the remaining four years to fully reach the internationallevel. This information is summarized in the following table and graph.
Table Annex II.1.02. % Change in Pricefor Local Segment
YearNo (Additional)
Partial Reform Full ReformReform
1 32.76% 33.47% 39.93%2 0.00% 0.54% 5.40%3 0.00% 0.54% 5.40%4 0.00% 0.54% 5.40%5 0.00% 0.54% 5.40%
Prices over Time
Year
No (Additional) Reform Partial Reform Full Reform
0
0.005
0.01
0.015
0.02
0.025
0 1 2 3 4 5
Pr
ice
Figure Annex II.1.02. Local Market Price vs. Time
Model ResultsCalculating elasticities is the first step in the model. However, total numberof call minutes is not given, so the model assumes that it is directlyproportional to the number of subscribers. Thus, the model regresses thepercentage change in total number of subscribers on the percentage changein price, population and GDP per capita. The results are displayed below.
Table Annex II.1.03. Model Result - Local MarketSegment
Coefficients Standard Error
Intercept (steady growth rate) 0.116637 0.05361% change of total price in basket -0.49613 0.19393Population Growth rate 3.457767 4.01244GDP per Capita Growth rate 0.723712 0.21635
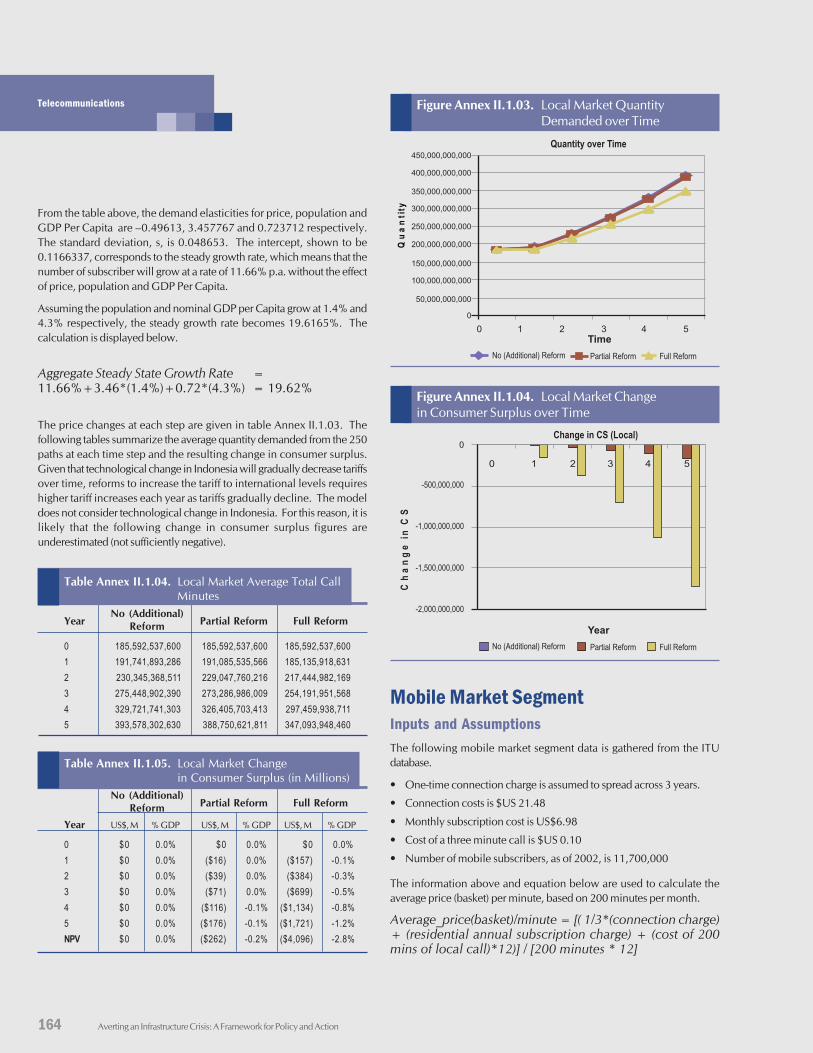
164 Averting an Infrastructure Crisis: A Framework for Policy and Action
Telecommunications
Quantity over Time
Time
No (Additional) Reform Partial Reform Full Reform
0 1 2 3 4 5
Qu
an
tity
50,000,000,000
0
100,000,000,000
150,000,000,000
200,000,000,000
250,000,000,000
300,000,000,000
350,000,000,000
400,000,000,000
450,000,000,000
From the table above, the demand elasticities for price, population andGDP Per Capita are –0.49613, 3.457767 and 0.723712 respectively.The standard deviation, s, is 0.048653. The intercept, shown to be0.1166337, corresponds to the steady growth rate, which means that thenumber of subscriber will grow at a rate of 11.66% p.a. without the effectof price, population and GDP Per Capita.
Assuming the population and nominal GDP per Capita grow at 1.4% and4.3% respectively, the steady growth rate becomes 19.6165%. Thecalculation is displayed below.
Aggregate Steady State Growth Rate =11.66%+3.46*(1.4%)+0.72*(4.3%) = 19.62%
The price changes at each step are given in table Annex II.1.03. Thefollowing tables summarize the average quantity demanded from the 250paths at each time step and the resulting change in consumer surplus.Given that technological change in Indonesia will gradually decrease tariffsover time, reforms to increase the tariff to international levels requireshigher tariff increases each year as tariffs gradually decline. The modeldoes not consider technological change in Indonesia. For this reason, it islikely that the following change in consumer surplus figures areunderestimated (not sufficiently negative).
Table Annex II.1.04. Local Market Average Total CallMinutes
YearNo (Additional)
Partial Reform Full ReformReform
0 185,592,537,600 185,592,537,600 185,592,537,6001 191,741,893,286 191,085,535,566 185,135,918,6312 230,345,368,511 229,047,760,216 217,444,982,1693 275,448,902,390 273,286,986,009 254,191,951,5684 329,721,741,303 326,405,703,413 297,459,938,7115 393,578,302,630 388,750,621,811 347,093,948,460
Table Annex II.1.05. Local Market Changein Consumer Surplus (in Millions)
No (Additional)Partial Reform Full ReformReform
Year US$, M % GDP US$, M % GDP US$, M % GDP
0 $0 0.0% $0 0.0% $0 0.0%1 $0 0.0% ($16) 0.0% ($157) -0.1%2 $0 0.0% ($39) 0.0% ($384) -0.3%3 $0 0.0% ($71) 0.0% ($699) -0.5%4 $0 0.0% ($116) -0.1% ($1,134) -0.8%5 $0 0.0% ($176) -0.1% ($1,721) -1.2%NPV $0 0.0% ($262) -0.2% ($4,096) -2.8%
Mobile Market SegmentInputs and AssumptionsThe following mobile market segment data is gathered from the ITUdatabase.
• One-time connection charge is assumed to spread across 3 years.
• Connection costs is $US 21.48
• Monthly subscription cost is US$6.98
• Cost of a three minute call is $US 0.10
• Number of mobile subscribers, as of 2002, is 11,700,000
The information above and equation below are used to calculate theaverage price (basket) per minute, based on 200 minutes per month.
Average_price(basket)/minute = [( 1/3*(connection charge)+ (residential annual subscription charge) + (cost of 200mins of local call)*12)] / [200 minutes * 12]
Change in CS (Local)
-2,000,000,000
-1,500,000,000
-1,000,000,000
-500,000,000
0
0 1 2 3 4 5
Year
Ch
an
ge
inC
S
No (Additional) Reform Partial Reform Full Reform
Figure Annex II.1.04. Local Market Changein Consumer Surplus over Time
Figure Annex II.1.03. Local Market QuantityDemanded over Time
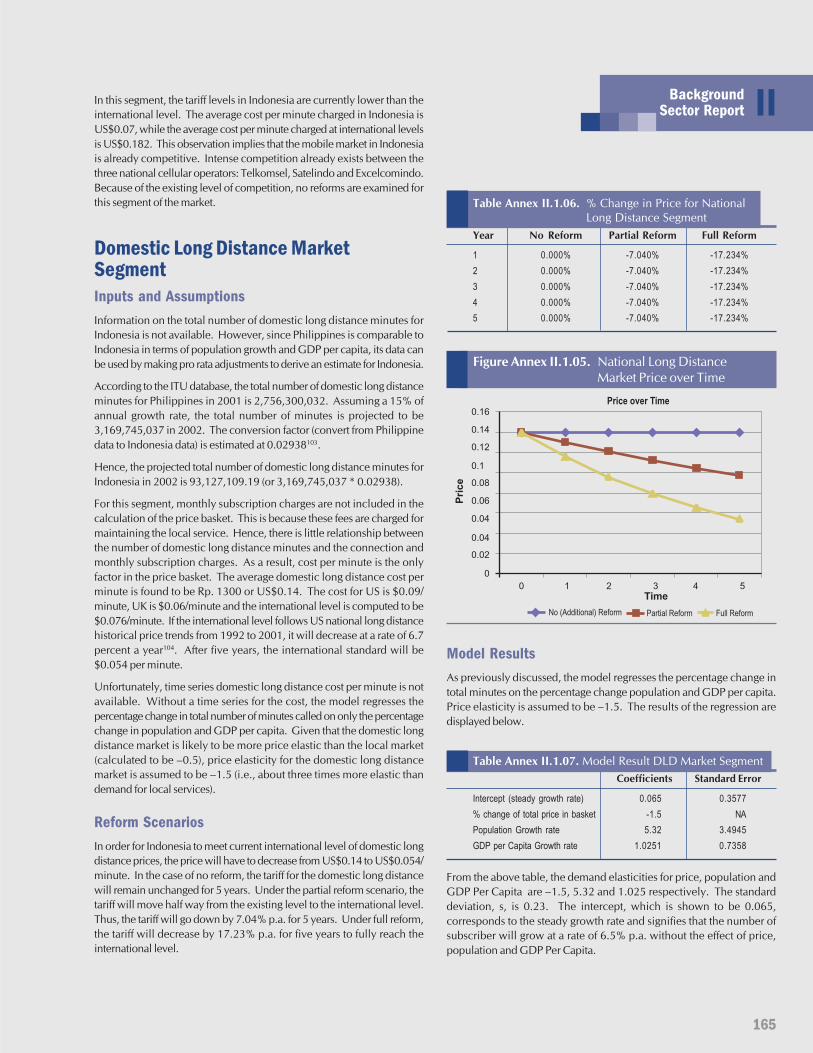
165
IIBackgroundSector Report
In this segment, the tariff levels in Indonesia are currently lower than theinternational level. The average cost per minute charged in Indonesia isUS$0.07, while the average cost per minute charged at international levelsis US$0.182. This observation implies that the mobile market in Indonesiais already competitive. Intense competition already exists between thethree national cellular operators: Telkomsel, Satelindo and Excelcomindo.Because of the existing level of competition, no reforms are examined forthis segment of the market.
Domestic Long Distance MarketSegmentInputs and AssumptionsInformation on the total number of domestic long distance minutes forIndonesia is not available. However, since Philippines is comparable toIndonesia in terms of population growth and GDP per capita, its data canbe used by making pro rata adjustments to derive an estimate for Indonesia.
According to the ITU database, the total number of domestic long distanceminutes for Philippines in 2001 is 2,756,300,032. Assuming a 15% ofannual growth rate, the total number of minutes is projected to be3,169,745,037 in 2002. The conversion factor (convert from Philippinedata to Indonesia data) is estimated at 0.02938103.
Hence, the projected total number of domestic long distance minutes forIndonesia in 2002 is 93,127,109.19 (or 3,169,745,037 * 0.02938).
For this segment, monthly subscription charges are not included in thecalculation of the price basket. This is because these fees are charged formaintaining the local service. Hence, there is little relationship betweenthe number of domestic long distance minutes and the connection andmonthly subscription charges. As a result, cost per minute is the onlyfactor in the price basket. The average domestic long distance cost perminute is found to be Rp. 1300 or US$0.14. The cost for US is $0.09/minute, UK is $0.06/minute and the international level is computed to be$0.076/minute. If the international level follows US national long distancehistorical price trends from 1992 to 2001, it will decrease at a rate of 6.7percent a year104. After five years, the international standard will be$0.054 per minute.
Unfortunately, time series domestic long distance cost per minute is notavailable. Without a time series for the cost, the model regresses thepercentage change in total number of minutes called on only the percentagechange in population and GDP per capita. Given that the domestic longdistance market is likely to be more price elastic than the local market(calculated to be –0.5), price elasticity for the domestic long distancemarket is assumed to be –1.5 (i.e., about three times more elastic thandemand for local services).
Reform ScenariosIn order for Indonesia to meet current international level of domestic longdistance prices, the price will have to decrease from US$0.14 to US$0.054/minute. In the case of no reform, the tariff for the domestic long distancewill remain unchanged for 5 years. Under the partial reform scenario, thetariff will move half way from the existing level to the international level.Thus, the tariff will go down by 7.04% p.a. for 5 years. Under full reform,the tariff will decrease by 17.23% p.a. for five years to fully reach theinternational level.
Table Annex II.1.06. % Change in Price for NationalLong Distance Segment
Year No Reform Partial Reform Full Reform
1 0.000% -7.040% -17.234%2 0.000% -7.040% -17.234%3 0.000% -7.040% -17.234%4 0.000% -7.040% -17.234%5 0.000% -7.040% -17.234%
Price over Time
Time
No (Additional) Reform Partial Reform Full Reform
0 1 2 3 4 5
0
0.02
0.04
0.04
0.06
0.08
0.1
0.12
0.14
0.16
Pri
ce
Figure Annex II.1.05. National Long DistanceMarket Price over Time
Model ResultsAs previously discussed, the model regresses the percentage change intotal minutes on the percentage change population and GDP per capita.Price elasticity is assumed to be –1.5. The results of the regression aredisplayed below.
Table Annex II.1.07. Model Result DLD Market SegmentCoefficients Standard Error
Intercept (steady growth rate) 0.065 0.3577% change of total price in basket -1.5 NAPopulation Growth rate 5.32 3.4945GDP per Capita Growth rate 1.0251 0.7358
From the above table, the demand elasticities for price, population andGDP Per Capita are –1.5, 5.32 and 1.025 respectively. The standarddeviation, s, is 0.23. The intercept, which is shown to be 0.065,corresponds to the steady growth rate and signifies that the number ofsubscriber will grow at a rate of 6.5% p.a. without the effect of price,population and GDP Per Capita.
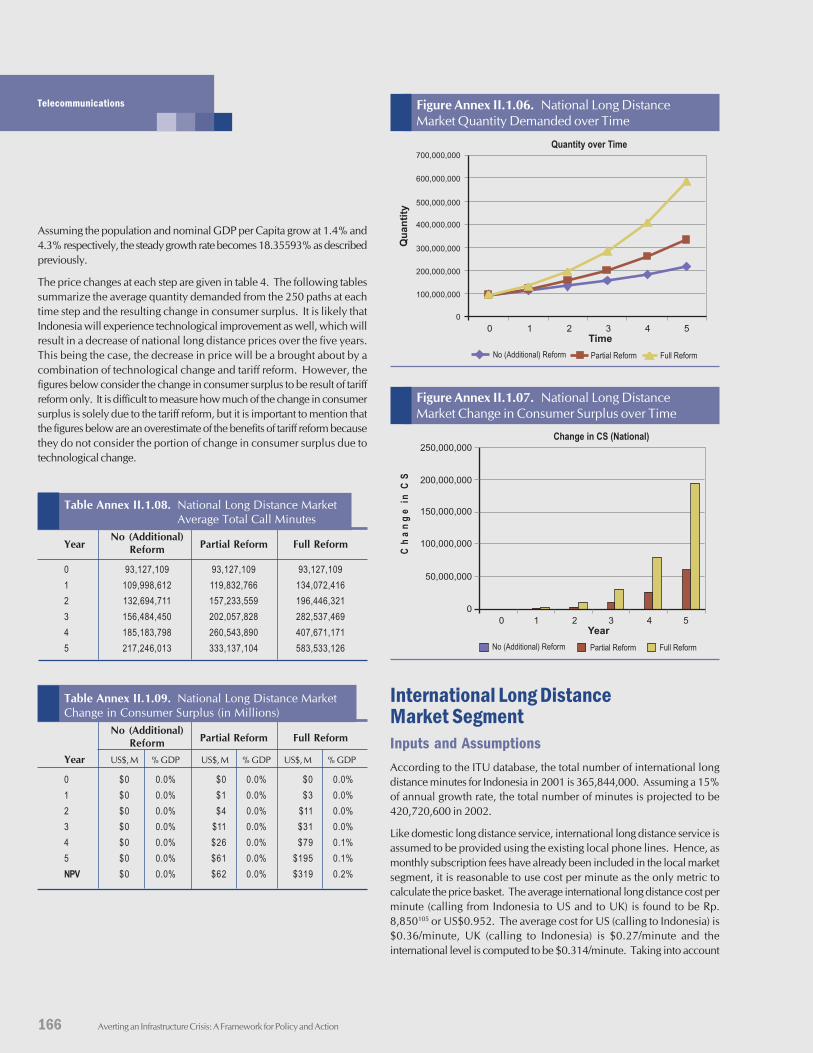
166 Averting an Infrastructure Crisis: A Framework for Policy and Action
Telecommunications
Assuming the population and nominal GDP per Capita grow at 1.4% and4.3% respectively, the steady growth rate becomes 18.35593% as describedpreviously.
The price changes at each step are given in table 4. The following tablessummarize the average quantity demanded from the 250 paths at eachtime step and the resulting change in consumer surplus. It is likely thatIndonesia will experience technological improvement as well, which willresult in a decrease of national long distance prices over the five years.This being the case, the decrease in price will be a brought about by acombination of technological change and tariff reform. However, thefigures below consider the change in consumer surplus to be result of tariffreform only. It is difficult to measure how much of the change in consumersurplus is solely due to the tariff reform, but it is important to mention thatthe figures below are an overestimate of the benefits of tariff reform becausethey do not consider the portion of change in consumer surplus due totechnological change.
Table Annex II.1.08. National Long Distance MarketAverage Total Call Minutes
YearNo (Additional)
Partial Reform Full ReformReform
0 93,127,109 93,127,109 93,127,1091 109,998,612 119,832,766 134,072,4162 132,694,711 157,233,559 196,446,3213 156,484,450 202,057,828 282,537,4694 185,183,798 260,543,890 407,671,1715 217,246,013 333,137,104 583,533,126
Table Annex II.1.09. National Long Distance MarketChange in Consumer Surplus (in Millions)
No (Additional)Partial Reform Full ReformReform
Year US$, M % GDP US$, M % GDP US$, M % GDP
0 $0 0.0% $0 0.0% $0 0.0%1 $0 0.0% $1 0.0% $3 0.0%2 $0 0.0% $4 0.0% $11 0.0%3 $0 0.0% $11 0.0% $31 0.0%4 $0 0.0% $26 0.0% $79 0.1%5 $0 0.0% $61 0.0% $195 0.1%NPV $0 0.0% $62 0.0% $319 0.2%
International Long DistanceMarket SegmentInputs and AssumptionsAccording to the ITU database, the total number of international longdistance minutes for Indonesia in 2001 is 365,844,000. Assuming a 15%of annual growth rate, the total number of minutes is projected to be420,720,600 in 2002.
Like domestic long distance service, international long distance service isassumed to be provided using the existing local phone lines. Hence, asmonthly subscription fees have already been included in the local marketsegment, it is reasonable to use cost per minute as the only metric tocalculate the price basket. The average international long distance cost perminute (calling from Indonesia to US and to UK) is found to be Rp.8,850105 or US$0.952. The average cost for US (calling to Indonesia) is$0.36/minute, UK (calling to Indonesia) is $0.27/minute and theinternational level is computed to be $0.314/minute. Taking into account
Quantity over Time
Time
No (Additional) Reform Partial Reform Full Reform
0 1 2 3 4 5
0
100,000,000
Qu
an
tity
200,000,000
300,000,000
400,000,000
500,000,000
600,000,000
700,000,000
Figure Annex II.1.06. National Long DistanceMarket Quantity Demanded over Time
Change in CS (National)
Year
Ch
an
ge
inC
S
No (Additional) Reform Partial Reform Full Reform
0
50,000,000
100,000,000
150,000,000
200,000,000
250,000,000
0 1 2 3 4 5
Figure Annex II.1.07. National Long DistanceMarket Change in Consumer Surplus over Time
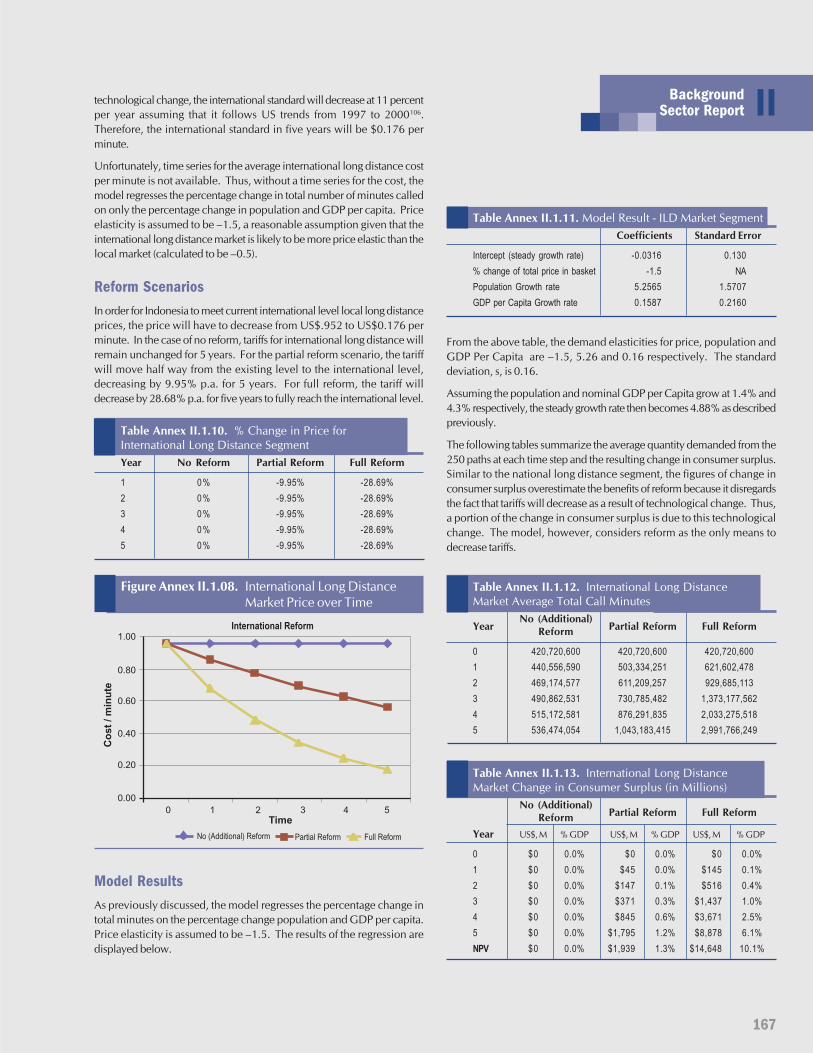
167
IIBackgroundSector Report
technological change, the international standard will decrease at 11 percentper year assuming that it follows US trends from 1997 to 2000106.Therefore, the international standard in five years will be $0.176 perminute.
Unfortunately, time series for the average international long distance costper minute is not available. Thus, without a time series for the cost, themodel regresses the percentage change in total number of minutes calledon only the percentage change in population and GDP per capita. Priceelasticity is assumed to be –1.5, a reasonable assumption given that theinternational long distance market is likely to be more price elastic than thelocal market (calculated to be –0.5).
Reform ScenariosIn order for Indonesia to meet current international level local long distanceprices, the price will have to decrease from US$.952 to US$0.176 perminute. In the case of no reform, tariffs for international long distance willremain unchanged for 5 years. For the partial reform scenario, the tariffwill move half way from the existing level to the international level,decreasing by 9.95% p.a. for 5 years. For full reform, the tariff willdecrease by 28.68% p.a. for five years to fully reach the international level.
Table Annex II.1.10. % Change in Price forInternational Long Distance SegmentYear No Reform Partial Reform Full Reform
1 0% -9.95% -28.69%2 0% -9.95% -28.69%3 0% -9.95% -28.69%4 0% -9.95% -28.69%5 0% -9.95% -28.69%
Table Annex II.1.11. Model Result - ILD Market SegmentCoefficients Standard Error
Intercept (steady growth rate) -0.0316 0.130% change of total price in basket -1.5 NAPopulation Growth rate 5.2565 1.5707GDP per Capita Growth rate 0.1587 0.2160
From the above table, the demand elasticities for price, population andGDP Per Capita are –1.5, 5.26 and 0.16 respectively. The standarddeviation, s, is 0.16.
Assuming the population and nominal GDP per Capita grow at 1.4% and4.3% respectively, the steady growth rate then becomes 4.88% as describedpreviously.
The following tables summarize the average quantity demanded from the250 paths at each time step and the resulting change in consumer surplus.Similar to the national long distance segment, the figures of change inconsumer surplus overestimate the benefits of reform because it disregardsthe fact that tariffs will decrease as a result of technological change. Thus,a portion of the change in consumer surplus is due to this technologicalchange. The model, however, considers reform as the only means todecrease tariffs.
Table Annex II.1.12. International Long DistanceMarket Average Total Call Minutes
YearNo (Additional)
Partial Reform Full ReformReform
0 420,720,600 420,720,600 420,720,6001 440,556,590 503,334,251 621,602,4782 469,174,577 611,209,257 929,685,1133 490,862,531 730,785,482 1,373,177,5624 515,172,581 876,291,835 2,033,275,5185 536,474,054 1,043,183,415 2,991,766,249
Table Annex II.1.13. International Long DistanceMarket Change in Consumer Surplus (in Millions)
No (Additional)Partial Reform Full ReformReform
Year US$, M % GDP US$, M % GDP US$, M % GDP
0 $0 0.0% $0 0.0% $0 0.0%1 $0 0.0% $45 0.0% $145 0.1%2 $0 0.0% $147 0.1% $516 0.4%3 $0 0.0% $371 0.3% $1,437 1.0%4 $0 0.0% $845 0.6% $3,671 2.5%5 $0 0.0% $1,795 1.2% $8,878 6.1%NPV $0 0.0% $1,939 1.3% $14,648 10.1%
International Reform
Time
No (Additional) Reform Partial Reform Full Reform
0 1 2 3 4 5
0.00
0.20
Co
st
/m
inu
te
0.40
0.60
0.80
1.00
Figure Annex II.1.08. International Long DistanceMarket Price over Time
Model ResultsAs previously discussed, the model regresses the percentage change intotal minutes on the percentage change population and GDP per capita.Price elasticity is assumed to be –1.5. The results of the regression aredisplayed below.
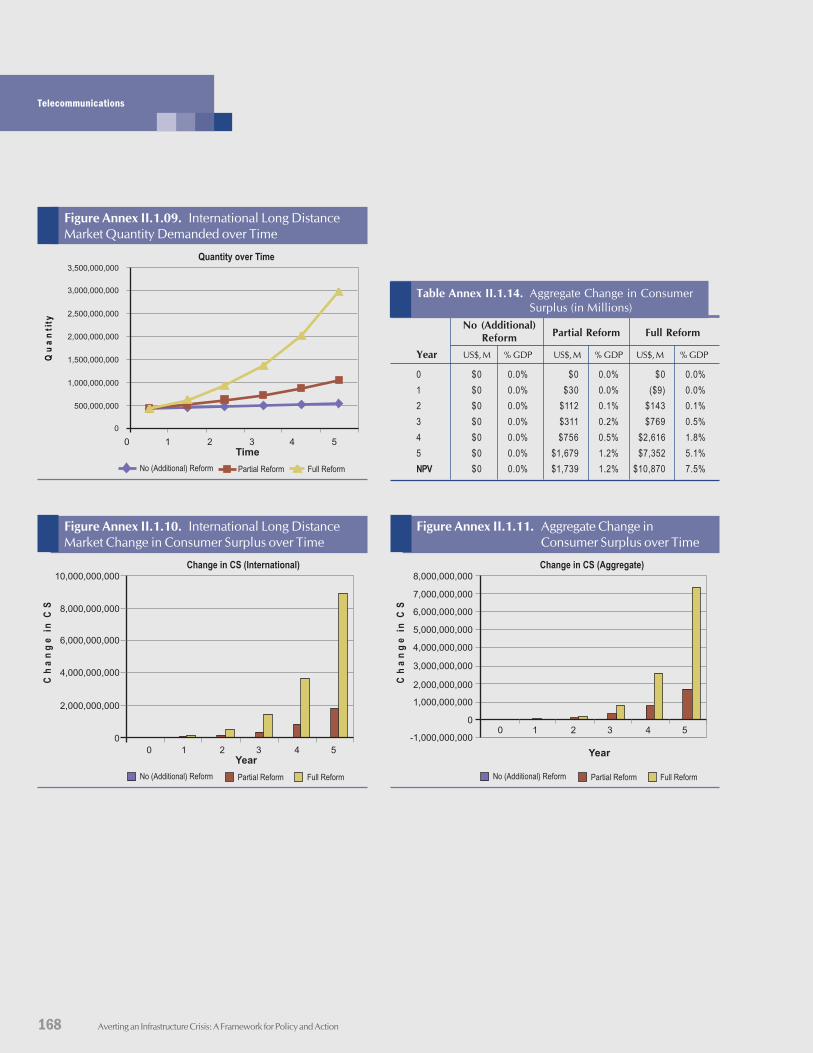
168 Averting an Infrastructure Crisis: A Framework for Policy and Action
Telecommunications
Table Annex II.1.14. Aggregate Change in ConsumerSurplus (in Millions)
No (Additional)Partial Reform Full ReformReform
Year US$, M % GDP US$, M % GDP US$, M % GDP
0 $0 0.0% $0 0.0% $0 0.0%1 $0 0.0% $30 0.0% ($9) 0.0%2 $0 0.0% $112 0.1% $143 0.1%3 $0 0.0% $311 0.2% $769 0.5%4 $0 0.0% $756 0.5% $2,616 1.8%5 $0 0.0% $1,679 1.2% $7,352 5.1%NPV $0 0.0% $1,739 1.2% $10,870 7.5%
Change in CS (International)
Year
Ch
an
ge
inC
S
No (Additional) Reform Partial Reform Full Reform
0
2,000,000,000
4,000,000,000
6,000,000,000
8,000,000,000
10,000,000,000
0 1 2 3 4 5
Figure Annex II.1.10. International Long DistanceMarket Change in Consumer Surplus over Time
Change in CS (Aggregate)
Year
Ch
an
ge
inC
S
No (Additional) Reform Partial Reform Full Reform
0
1,000,000,000
4,000,000,000
5,000,000,000
7,000,000,000
8,000,000,000
0 1 2 3 4 5-1,000,000,000
2,000,000,000
3,000,000,000
6,000,000,000
Figure Annex II.1.11. Aggregate Change inConsumer Surplus over Time
Quantity over Time
Time
No (Additional) Reform Partial Reform Full Reform
0 1 2 3 4 5
Qu
an
tity
500,000,000
0
1,000,000,000
1,500,000,000
2,000,000,000
2,500,000,000
3,000,000,000
3,500,000,000
Figure Annex II.1.09. International Long DistanceMarket Quantity Demanded over Time

Averting an Infrastructure Crisis: A Framework for Policy and Action170
IIIRoad and Road Transportse
ct
or
171
R oads and road transport affect the daily lives of most Indonesians. The sector accounts for byfar the major share of domestic intra-island freight and inter-urban passenger movements and
plays a crucial role in linking communities and markets throughout the country. Its efficient functioningis vital for maintaining and enhancing international competitiveness as well as for improving theavailability and reducing the prices of goods and services within the economy. For many remote andisolated areas, availability of basic road transport services is a prerequisite for reducing poverty andproviding access to health and education services, information and markets.
Successive national plans have recognized the sector’s importance, as reflected in the large share ofdevelopment spending provided for upgrading, expanding and extending the public road networkover the last two decades. Government’s concern to see these funds used well is confirmed by substantialinvestments to develop and apply improved planning and programming tools and to build institutionalcapacities at the central and regional levels. While the achievements—in terms of improving overallnetwork condition—have been impressive, many issues still remain.
Substantially higher expenditures on road preservation and capacity expansion works would be justifiedby resultant user savings in fuel and maintenance costs. Well justified investments to expand thecapacity of heavily congested links in the Java arterial network have had to be deferred because oftight budget constraints during the economic crisis, while planned private investments in new tollroads have been halted. Additionally, the condition of the kabupaten road network has deterioratedsignificantly. Inadequate routine maintenance is resulting in accelerated deterioration of road conditionsacross regions and networks. The net result is greatly increased road provision and user costs.
Moreover, there remains considerable scope for further increasing efficiency in infrastructure provisionby securing an adequate and predictable level of funding for road works, allocating that funding inan optimal manner, and ensuring that funded road works are effectively and efficiently implemented.It is clear that a combination of under-funding, sub-optimal allocation of available funds, and poorquality of construction contributed to the current condition of the road network.
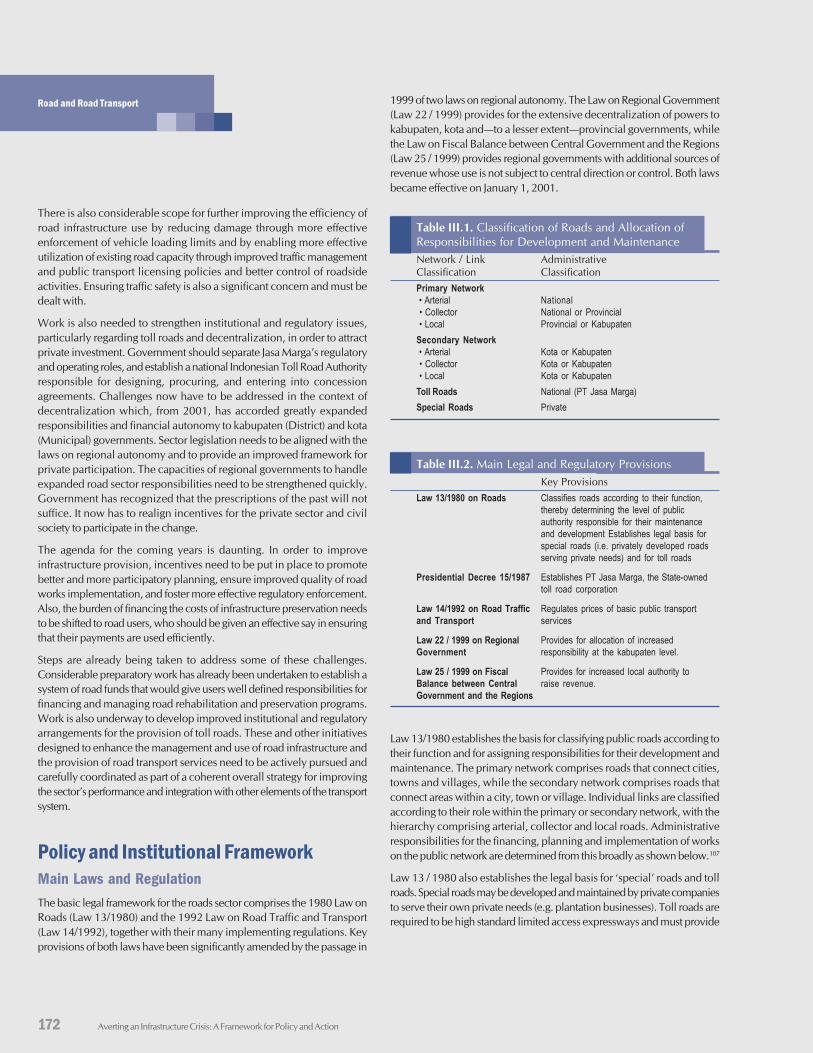
172 Averting an Infrastructure Crisis: A Framework for Policy and Action
Road and Road Transport
There is also considerable scope for further improving the efficiency ofroad infrastructure use by reducing damage through more effectiveenforcement of vehicle loading limits and by enabling more effectiveutilization of existing road capacity through improved traffic managementand public transport licensing policies and better control of roadsideactivities. Ensuring traffic safety is also a significant concern and must bedealt with.
Work is also needed to strengthen institutional and regulatory issues,particularly regarding toll roads and decentralization, in order to attractprivate investment. Government should separate Jasa Marga’s regulatoryand operating roles, and establish a national Indonesian Toll Road Authorityresponsible for designing, procuring, and entering into concessionagreements. Challenges now have to be addressed in the context ofdecentralization which, from 2001, has accorded greatly expandedresponsibilities and financial autonomy to kabupaten (District) and kota(Municipal) governments. Sector legislation needs to be aligned with thelaws on regional autonomy and to provide an improved framework forprivate participation. The capacities of regional governments to handleexpanded road sector responsibilities need to be strengthened quickly.Government has recognized that the prescriptions of the past will notsuffice. It now has to realign incentives for the private sector and civilsociety to participate in the change.
The agenda for the coming years is daunting. In order to improveinfrastructure provision, incentives need to be put in place to promotebetter and more participatory planning, ensure improved quality of roadworks implementation, and foster more effective regulatory enforcement.Also, the burden of financing the costs of infrastructure preservation needsto be shifted to road users, who should be given an effective say in ensuringthat their payments are used efficiently.
Steps are already being taken to address some of these challenges.Considerable preparatory work has already been undertaken to establish asystem of road funds that would give users well defined responsibilities forfinancing and managing road rehabilitation and preservation programs.Work is also underway to develop improved institutional and regulatoryarrangements for the provision of toll roads. These and other initiativesdesigned to enhance the management and use of road infrastructure andthe provision of road transport services need to be actively pursued andcarefully coordinated as part of a coherent overall strategy for improvingthe sector’s performance and integration with other elements of the transportsystem.
Policy and Institutional FrameworkMain Laws and RegulationThe basic legal framework for the roads sector comprises the 1980 Law onRoads (Law 13/1980) and the 1992 Law on Road Traffic and Transport(Law 14/1992), together with their many implementing regulations. Keyprovisions of both laws have been significantly amended by the passage in
1999 of two laws on regional autonomy. The Law on Regional Government(Law 22 / 1999) provides for the extensive decentralization of powers tokabupaten, kota and—to a lesser extent—provincial governments, whilethe Law on Fiscal Balance between Central Government and the Regions(Law 25 / 1999) provides regional governments with additional sources ofrevenue whose use is not subject to central direction or control. Both lawsbecame effective on January 1, 2001.
Table III.1. Classification of Roads and Allocation ofResponsibilities for Development and MaintenanceNetwork / Link AdministrativeClassification ClassificationPrimary Network • Arterial National • Collector National or Provincial • Local Provincial or KabupatenSecondary Network • Arterial Kota or Kabupaten • Collector Kota or Kabupaten • Local Kota or KabupatenToll Roads National (PT Jasa Marga)Special Roads Private
Table III.2. Main Legal and Regulatory ProvisionsKey Provisions
Law 13/1980 on Roads Classifies roads according to their function,thereby determining the level of publicauthority responsible for their maintenanceand development Establishes legal basis forspecial roads (i.e. privately developed roadsserving private needs) and for toll roads
Presidential Decree 15/1987 Establishes PT Jasa Marga, the State-ownedtoll road corporation
Law 14/1992 on Road Traffic Regulates prices of basic public transportand Transport services
Law 22 / 1999 on Regional Provides for allocation of increasedGovernment responsibility at the kabupaten level.
Law 25 / 1999 on Fiscal Provides for increased local authority toBalance between Central raise revenue.Government and the Regions
Law 13/1980 establishes the basis for classifying public roads according totheir function and for assigning responsibilities for their development andmaintenance. The primary network comprises roads that connect cities,towns and villages, while the secondary network comprises roads thatconnect areas within a city, town or village. Individual links are classifiedaccording to their role within the primary or secondary network, with thehierarchy comprising arterial, collector and local roads. Administrativeresponsibilities for the financing, planning and implementation of workson the public network are determined from this broadly as shown below.107
Law 13 / 1980 also establishes the legal basis for ‘special’ roads and tollroads. Special roads may be developed and maintained by private companiesto serve their own private needs (e.g. plantation businesses). Toll roads arerequired to be high standard limited access expressways and must provide
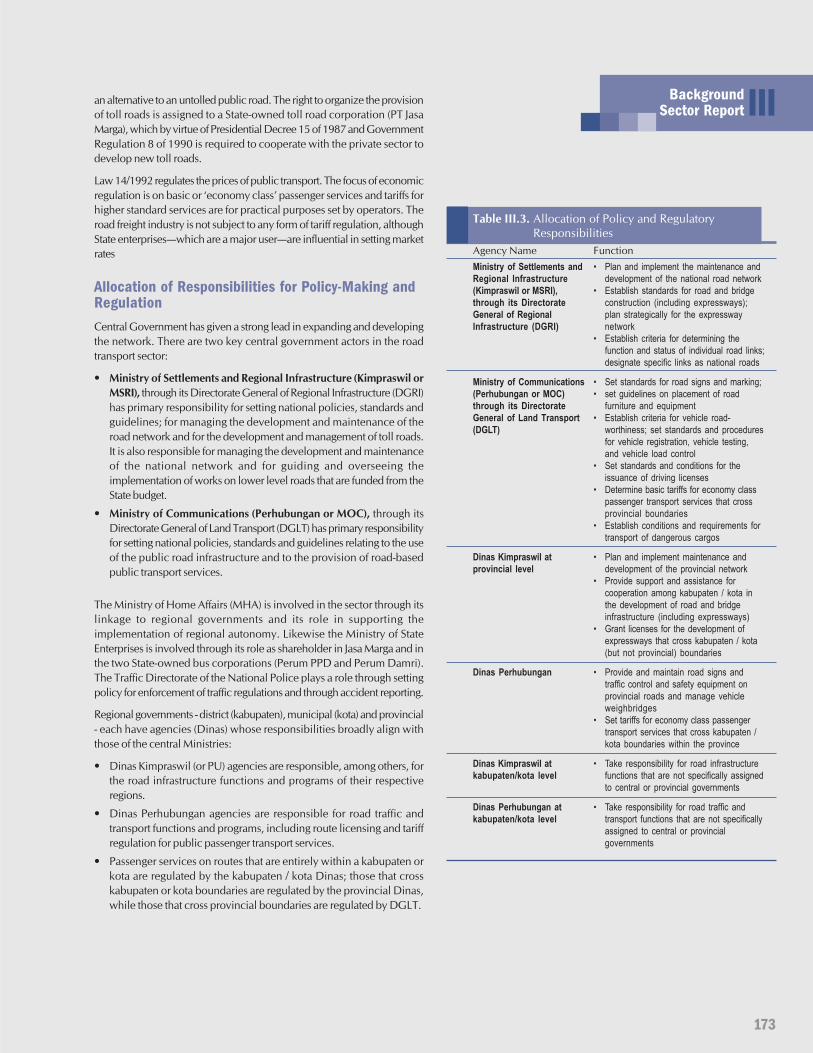
173
BackgroundSector Report IIIan alternative to an untolled public road. The right to organize the provision
of toll roads is assigned to a State-owned toll road corporation (PT JasaMarga), which by virtue of Presidential Decree 15 of 1987 and GovernmentRegulation 8 of 1990 is required to cooperate with the private sector todevelop new toll roads.
Law 14/1992 regulates the prices of public transport. The focus of economicregulation is on basic or ‘economy class’ passenger services and tariffs forhigher standard services are for practical purposes set by operators. Theroad freight industry is not subject to any form of tariff regulation, althoughState enterprises—which are a major user—are influential in setting marketrates
Allocation of Responsibilities for Policy-Making andRegulationCentral Government has given a strong lead in expanding and developingthe network. There are two key central government actors in the roadtransport sector:
• Ministry of Settlements and Regional Infrastructure (Kimpraswil orMSRI), through its Directorate General of Regional Infrastructure (DGRI)has primary responsibility for setting national policies, standards andguidelines; for managing the development and maintenance of theroad network and for the development and management of toll roads.It is also responsible for managing the development and maintenanceof the national network and for guiding and overseeing theimplementation of works on lower level roads that are funded from theState budget.
• Ministry of Communications (Perhubungan or MOC), through itsDirectorate General of Land Transport (DGLT) has primary responsibilityfor setting national policies, standards and guidelines relating to the useof the public road infrastructure and to the provision of road-basedpublic transport services.
The Ministry of Home Affairs (MHA) is involved in the sector through itslinkage to regional governments and its role in supporting theimplementation of regional autonomy. Likewise the Ministry of StateEnterprises is involved through its role as shareholder in Jasa Marga and inthe two State-owned bus corporations (Perum PPD and Perum Damri).The Traffic Directorate of the National Police plays a role through settingpolicy for enforcement of traffic regulations and through accident reporting.
Regional governments - district (kabupaten), municipal (kota) and provincial- each have agencies (Dinas) whose responsibilities broadly align withthose of the central Ministries:
• Dinas Kimpraswil (or PU) agencies are responsible, among others, forthe road infrastructure functions and programs of their respectiveregions.
• Dinas Perhubungan agencies are responsible for road traffic andtransport functions and programs, including route licensing and tariffregulation for public passenger transport services.
• Passenger services on routes that are entirely within a kabupaten orkota are regulated by the kabupaten / kota Dinas; those that crosskabupaten or kota boundaries are regulated by the provincial Dinas,while those that cross provincial boundaries are regulated by DGLT.
Table III.3. Allocation of Policy and RegulatoryResponsibilities
Agency Name FunctionMinistry of Settlements and • Plan and implement the maintenance andRegional Infrastructure development of the national road network(Kimpraswil or MSRI), • Establish standards for road and bridgethrough its Directorate construction (including expressways);General of Regional plan strategically for the expresswayInfrastructure (DGRI) network
• Establish criteria for determining thefunction and status of individual road links;designate specific links as national roads
Ministry of Communications • Set standards for road signs and marking;(Perhubungan or MOC) • set guidelines on placement of roadthrough its Directorate furniture and equipmentGeneral of Land Transport • Establish criteria for vehicle road-(DGLT) worthiness; set standards and procedures
for vehicle registration, vehicle testing,and vehicle load control
• Set standards and conditions for theissuance of driving licenses
• Determine basic tariffs for economy classpassenger transport services that crossprovincial boundaries
• Establish conditions and requirements fortransport of dangerous cargos
Dinas Kimpraswil at • Plan and implement maintenance andprovincial level development of the provincial network
• Provide support and assistance forcooperation among kabupaten / kota inthe development of road and bridgeinfrastructure (including expressways)
• Grant licenses for the development ofexpressways that cross kabupaten / kota(but not provincial) boundaries
Dinas Perhubungan • Provide and maintain road signs andtraffic control and safety equipment onprovincial roads and manage vehicleweighbridges
• Set tariffs for economy class passengertransport services that cross kabupaten /kota boundaries within the province
Dinas Kimpraswil at • Take responsibility for road infrastructurekabupaten/kota level functions that are not specifically assigned
to central or provincial governments
Dinas Perhubungan at • Take responsibility for road traffic andkabupaten/kota level transport functions that are not specifically
assigned to central or provincialgovernments
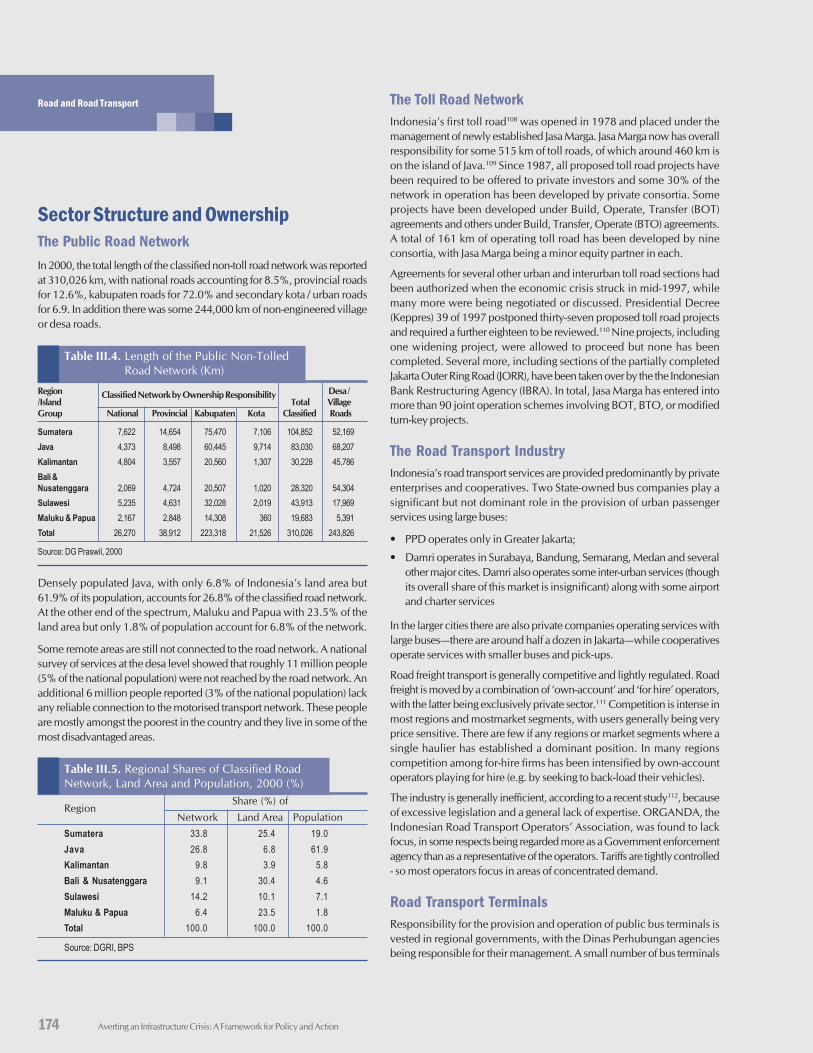
174 Averting an Infrastructure Crisis: A Framework for Policy and Action
Road and Road Transport
Sector Structure and OwnershipThe Public Road NetworkIn 2000, the total length of the classified non-toll road network was reportedat 310,026 km, with national roads accounting for 8.5%, provincial roadsfor 12.6%, kabupaten roads for 72.0% and secondary kota / urban roadsfor 6.9. In addition there was some 244,000 km of non-engineered villageor desa roads.
Table III.4. Length of the Public Non-TolledRoad Network (Km)
Region Classified Network by Ownership Responsibility Desa //Island Total VillageGroup National Provincial Kabupaten Kota Classified Roads
Sumatera 7,622 14,654 75,470 7,106 104,852 52,169Java 4,373 8,498 60,445 9,714 83,030 68,207Kalimantan 4,804 3,557 20,560 1,307 30,228 45,786Bali &Nusatenggara 2,069 4,724 20,507 1,020 28,320 54,304Sulawesi 5,235 4,631 32,028 2,019 43,913 17,969Maluku & Papua 2,167 2,848 14,308 360 19,683 5,391Total 26,270 38,912 223,318 21,526 310,026 243,826
Source: DG Praswil, 2000
Densely populated Java, with only 6.8% of Indonesia’s land area but61.9% of its population, accounts for 26.8% of the classified road network.At the other end of the spectrum, Maluku and Papua with 23.5% of theland area but only 1.8% of population account for 6.8% of the network.
Some remote areas are still not connected to the road network. A nationalsurvey of services at the desa level showed that roughly 11 million people(5% of the national population) were not reached by the road network. Anadditional 6 million people reported (3% of the national population) lackany reliable connection to the motorised transport network. These peopleare mostly amongst the poorest in the country and they live in some of themost disadvantaged areas.
Table III.5. Regional Shares of Classified RoadNetwork, Land Area and Population, 2000 (%)
RegionShare (%) of
Network Land Area PopulationSumatera 33.8 25.4 19.0Java 26.8 6.8 61.9Kalimantan 9.8 3.9 5.8Bali & Nusatenggara 9.1 30.4 4.6Sulawesi 14.2 10.1 7.1Maluku & Papua 6.4 23.5 1.8Total 100.0 100.0 100.0
Source: DGRI, BPS
The Toll Road NetworkIndonesia’s first toll road108 was opened in 1978 and placed under themanagement of newly established Jasa Marga. Jasa Marga now has overallresponsibility for some 515 km of toll roads, of which around 460 km ison the island of Java.109 Since 1987, all proposed toll road projects havebeen required to be offered to private investors and some 30% of thenetwork in operation has been developed by private consortia. Someprojects have been developed under Build, Operate, Transfer (BOT)agreements and others under Build, Transfer, Operate (BTO) agreements.A total of 161 km of operating toll road has been developed by nineconsortia, with Jasa Marga being a minor equity partner in each.
Agreements for several other urban and interurban toll road sections hadbeen authorized when the economic crisis struck in mid-1997, whilemany more were being negotiated or discussed. Presidential Decree(Keppres) 39 of 1997 postponed thirty-seven proposed toll road projectsand required a further eighteen to be reviewed.110 Nine projects, includingone widening project, were allowed to proceed but none has beencompleted. Several more, including sections of the partially completedJakarta Outer Ring Road (JORR), have been taken over by the the IndonesianBank Restructuring Agency (IBRA). In total, Jasa Marga has entered intomore than 90 joint operation schemes involving BOT, BTO, or modifiedturn-key projects.
The Road Transport IndustryIndonesia’s road transport services are provided predominantly by privateenterprises and cooperatives. Two State-owned bus companies play asignificant but not dominant role in the provision of urban passengerservices using large buses:
• PPD operates only in Greater Jakarta;
• Damri operates in Surabaya, Bandung, Semarang, Medan and severalother major cites. Damri also operates some inter-urban services (thoughits overall share of this market is insignificant) along with some airportand charter services
In the larger cities there are also private companies operating services withlarge buses—there are around half a dozen in Jakarta—while cooperativesoperate services with smaller buses and pick-ups.
Road freight transport is generally competitive and lightly regulated. Roadfreight is moved by a combination of ‘own-account’ and ‘for hire’ operators,with the latter being exclusively private sector.111 Competition is intense inmost regions and mostmarket segments, with users generally being veryprice sensitive. There are few if any regions or market segments where asingle haulier has established a dominant position. In many regionscompetition among for-hire firms has been intensified by own-accountoperators playing for hire (e.g. by seeking to back-load their vehicles).
The industry is generally inefficient, according to a recent study112, becauseof excessive legislation and a general lack of expertise. ORGANDA, theIndonesian Road Transport Operators’ Association, was found to lackfocus, in some respects being regarded more as a Government enforcementagency than as a representative of the operators. Tariffs are tightly controlled- so most operators focus in areas of concentrated demand.
Road Transport TerminalsResponsibility for the provision and operation of public bus terminals isvested in regional governments, with the Dinas Perhubungan agenciesbeing responsible for their management. A small number of bus terminals
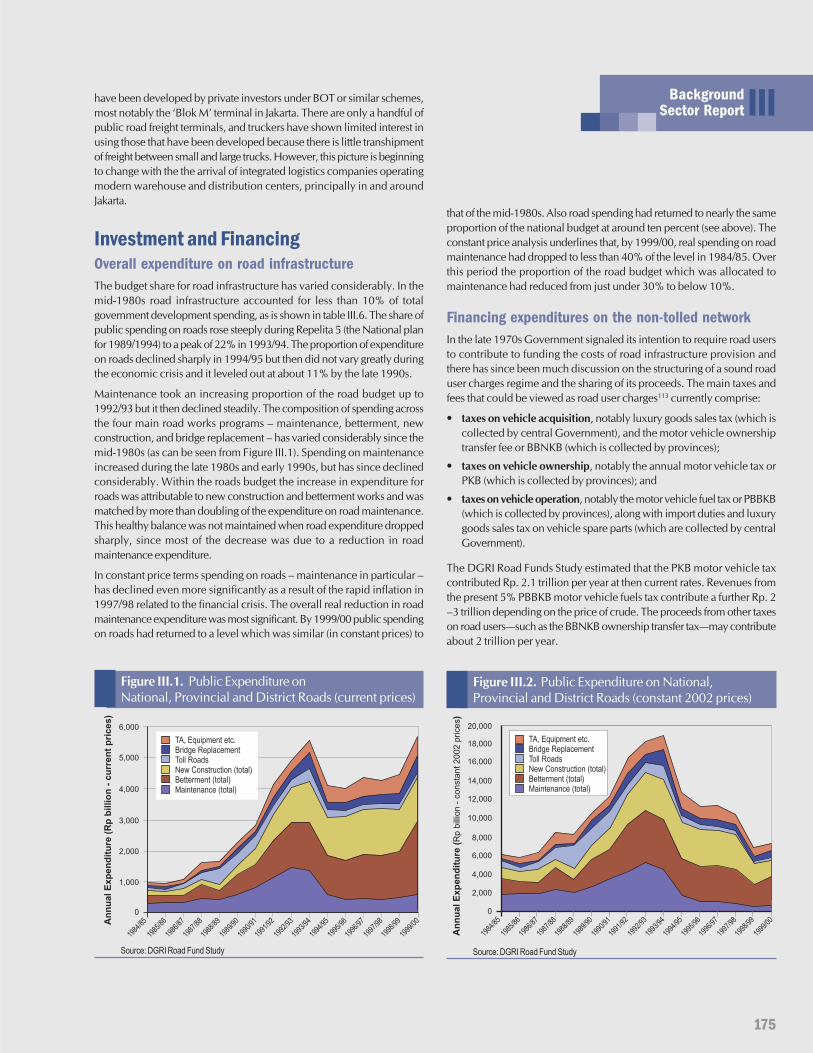
175
BackgroundSector Report III
1,000
0
2,000
3,000
4,000
5,000
6,000
TA, Equipment etc.Bridge ReplacementToll RoadsNew Construction (total)Betterment (total)Maintenance (total)
1984
/85
1985
/86
1986
/87
1987
/88
1988
/89
1989
/90
1990
/91
1991
/92
1992
/93
1993
/94
1994
/95
1995
/96
1996
/97
1997
/98
1998
/99
1999
/00An
nu
al
Ex
pe
nd
itu
re(R
pb
illi
on
-c
urr
en
tp
ric
es
)
Figure III.1. Public Expenditure onNational, Provincial and District Roads (current prices)
Source: DGRI Road Fund Study
4,000
0
8,000
10,000
14,000
16,000
20,000
TA, Equipment etc.Bridge ReplacementToll RoadsNew Construction (total)Betterment (total)Maintenance (total)
1984
/85
1985
/86
1986
/87
1987
/88
1988
/89
1989
/90
1990
/91
1991
/92
1992
/93
1993
/94
1994
/95
1995
/96
1996
/97
1997
/98
1998
/99
1999
/00
An
nu
al
Ex
pe
nd
itu
re(
)R
pbill
ion
-consta
nt2002
prices
2,000
6,000
12,000
18,000
Figure III.2. Public Expenditure on National,Provincial and District Roads (constant 2002 prices)
Source: DGRI Road Fund Study
have been developed by private investors under BOT or similar schemes,most notably the ‘Blok M’ terminal in Jakarta. There are only a handful ofpublic road freight terminals, and truckers have shown limited interest inusing those that have been developed because there is little transhipmentof freight between small and large trucks. However, this picture is beginningto change with the the arrival of integrated logistics companies operatingmodern warehouse and distribution centers, principally in and aroundJakarta.
Investment and FinancingOverall expenditure on road infrastructureThe budget share for road infrastructure has varied considerably. In themid-1980s road infrastructure accounted for less than 10% of totalgovernment development spending, as is shown in table III.6. The share ofpublic spending on roads rose steeply during Repelita 5 (the National planfor 1989/1994) to a peak of 22% in 1993/94. The proportion of expenditureon roads declined sharply in 1994/95 but then did not vary greatly duringthe economic crisis and it leveled out at about 11% by the late 1990s.
Maintenance took an increasing proportion of the road budget up to1992/93 but it then declined steadily. The composition of spending acrossthe four main road works programs – maintenance, betterment, newconstruction, and bridge replacement – has varied considerably since themid-1980s (as can be seen from Figure III.1). Spending on maintenanceincreased during the late 1980s and early 1990s, but has since declinedconsiderably. Within the roads budget the increase in expenditure forroads was attributable to new construction and betterment works and wasmatched by more than doubling of the expenditure on road maintenance.This healthy balance was not maintained when road expenditure droppedsharply, since most of the decrease was due to a reduction in roadmaintenance expenditure.
In constant price terms spending on roads – maintenance in particular –has declined even more significantly as a result of the rapid inflation in1997/98 related to the financial crisis. The overall real reduction in roadmaintenance expenditure was most significant. By 1999/00 public spendingon roads had returned to a level which was similar (in constant prices) to
that of the mid-1980s. Also road spending had returned to nearly the sameproportion of the national budget at around ten percent (see above). Theconstant price analysis underlines that, by 1999/00, real spending on roadmaintenance had dropped to less than 40% of the level in 1984/85. Overthis period the proportion of the road budget which was allocated tomaintenance had reduced from just under 30% to below 10%.
Financing expenditures on the non-tolled networkIn the late 1970s Government signaled its intention to require road usersto contribute to funding the costs of road infrastructure provision andthere has since been much discussion on the structuring of a sound roaduser charges regime and the sharing of its proceeds. The main taxes andfees that could be viewed as road user charges113 currently comprise:
• taxes on vehicle acquisition, notably luxury goods sales tax (which iscollected by central Government), and the motor vehicle ownershiptransfer fee or BBNKB (which is collected by provinces);
• taxes on vehicle ownership, notably the annual motor vehicle tax orPKB (which is collected by provinces); and
• taxes on vehicle operation, notably the motor vehicle fuel tax or PBBKB(which is collected by provinces), along with import duties and luxurygoods sales tax on vehicle spare parts (which are collected by centralGovernment).
The DGRI Road Funds Study estimated that the PKB motor vehicle taxcontributed Rp. 2.1 trillion per year at then current rates. Revenues fromthe present 5% PBBKB motor vehicle fuels tax contribute a further Rp. 2–3 trillion depending on the price of crude. The proceeds from other taxeson road users—such as the BBNKB ownership transfer tax—may contributeabout 2 trillion per year.
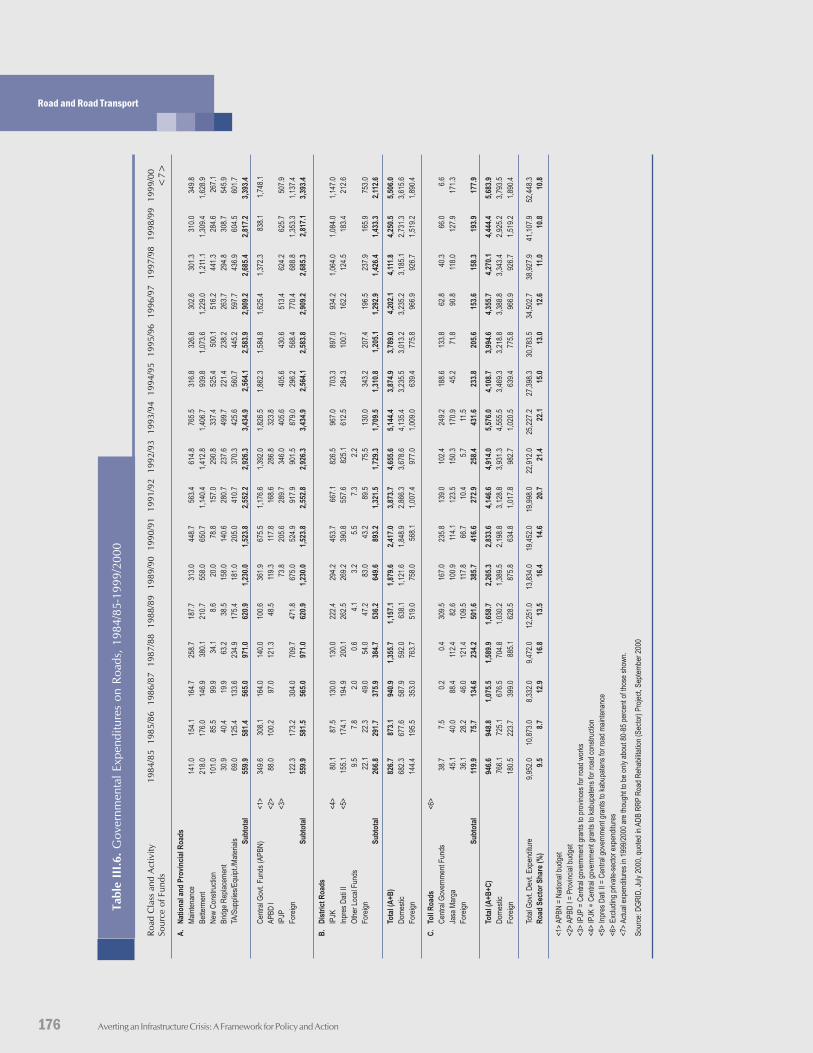
176 Averting an Infrastructure Crisis: A Framework for Policy and Action
Road and Road Transport
Ro
ad
Cla
ssan
dA
cti
vit
y1
98
4/8
51
98
5/8
61
98
6/8
71
98
7/8
81
98
8/8
91
98
9/9
01
99
0/9
11
99
1/9
21
99
2/9
31
99
3/9
41
99
4/9
51
99
5/9
61
99
6/9
71
99
7/9
81
99
8/9
91
99
9/0
0So
urc
eo
fFu
nd
s<
7>
A.
Nat
ion
alan
dP
rovi
nci
alR
oad
s
Mai
nten
ance
141.
015
4.1
164.
725
8.7
187.
731
3.0
448.
756
3.4
614.
876
5.5
316.
832
6.8
302.
630
1.3
310.
034
9.8
Bet
term
ent
218.
017
6.0
146.
938
0.1
210.
755
8.0
650.
71,
140.
41,
412.
81,
406.
793
9.8
1,07
3.6
1,22
9.0
1,21
1.1
1,30
9.4
1,62
8.9
New
Con
stru
ctio
n10
1.0
85.5
99.9
34.1
8.6
20.0
78.8
157.
029
0.8
337.
452
5.4
500.
151
6.2
441.
328
4.6
267.
1
Brid
geR
epla
cem
ent
30.9
40.4
19.9
63.2
38.5
158.
014
0.6
280.
723
7.6
499.
722
1.4
238.
226
3.7
294.
830
8.7
545.
9
TA/S
uppl
ies/
Equ
ipt./
Mat
eria
ls69
.012
5.4
133.
623
4.9
175.
418
1.0
205.
041
0.7
370.
342
5.6
560.
744
5.2
597.
743
6.9
604.
560
1.7
Su
bto
tal
559.
958
1.4
565.
097
1.0
620.
91,
230.
01,
523.
82,
552.
22,
926.
33,
434.
92,
564.
12,
583.
92,
909.
22,
685.
42,
817.
23,
393.
4
Cen
tral
Gov
t.F
unds
(AP
BN
)<1
>34
9.6
308.
116
4.0
140.
010
0.6
361.
967
5.5
1,17
6.6
1,39
2.0
1,82
6.5
1,86
2.3
1,58
4.8
1,62
5.4
1,37
2.3
838.
11,
748.
1
AP
BD
I<2
>88
.010
0.2
97.0
121.
348
.511
9.3
117.
816
8.6
286.
832
3.8
IPJP
<3>
73.8
205.
628
9.7
346.
040
5.6
405.
643
0.6
513.
462
4.2
625.
750
7.9
For
eign
122.
317
3.2
304.
070
9.7
471.
867
5.0
524.
991
7.9
901.
587
9.0
296.
256
8.4
770.
468
8.8
1,35
3.3
1,13
7.4
Su
bto
tal
559.
958
1.5
565.
097
1.0
620.
91,
230.
01,
523.
82,
552.
82,
926.
33,
434.
92,
564.
12,
583.
82,
909.
22,
685.
32,
817.
13,
393.
4
B.
Dis
tric
tR
oad
s
IPJK
<4>
80.1
87.5
130.
013
0.0
222.
429
4.2
453.
766
7.1
826.
596
7.0
703.
389
7.0
934.
21,
064.
01,
084.
01,
147.
0
Inpr
esD
atiI
I<5
>15
5.1
174.
119
4.9
200.
126
2.5
269.
239
0.8
557.
682
5.1
612.
526
4.3
100.
716
2.2
124.
518
3.4
212.
6
Oth
erLo
calF
unds
9.5
7.8
2.0
0.6
4.1
3.2
5.5
7.3
2.2
For
eign
22.1
22.3
49.0
54.0
47.2
83.0
43.2
89.5
75.5
130.
034
3.2
207.
419
6.5
237.
916
5.9
753.
0
Su
bto
tal
266.
829
1.7
375.
938
4.7
536.
264
9.6
893.
21,
321.
51,
729.
31,
709.
51,
310.
81,
205.
11,
292.
91,
426.
41,
433.
32,
112.
6
Tota
l(A
+B)
826.
787
3.1
940.
91,
355.
71,
157.
11,
879.
62,
417.
03,
873.
74,
655.
65,
144.
43,
874.
93,
789.
04,
202.
14,
111.
84,
250.
55,
506.
0
Dom
estic
682.
367
7.6
587.
959
2.0
638.
11,
121.
61,
848.
92,
866.
33,
678.
64,
135.
43,
235.
53,
013.
23,
235.
23,
185.
12,
731.
33,
615.
6
For
eign
144.
419
5.5
353.
076
3.7
519.
075
8.0
568.
11,
007.
497
7.0
1,00
9.0
639.
477
5.8
966.
992
6.7
1,51
9.2
1,89
0.4
C.
Toll
Ro
ads
<6>
Cen
tral
Gov
ernm
entF
unds
38.7
7.5
0.2
0.4
309.
516
7.0
235.
813
9.0
102.
424
9.2
188.
613
3.8
62.8
40.3
66.0
6.6
Jasa
Mar
ga45
.140
.088
.411
2.4
82.6
100.
911
4.1
123.
515
0.3
170.
945
.271
.890
.811
8.0
127.
917
1.3
For
eign
36.1
28.2
46.0
121.
410
9.5
117.
866
.710
.45.
711
.5
Su
bto
tal
119.
975
.713
4.6
234.
250
1.6
385.
741
6.6
272.
925
8.4
431.
623
3.8
205.
615
3.6
158.
319
3.9
177.
9
Tota
l(A
+B+C
)94
6.6
948.
81,
075.
51,
589.
91,
658.
72,
265.
32,
833.
64,
146.
64,
914.
05,
576.
04,
108.
73,
994.
64,
355.
74,
270.
14,
444.
45,
683.
9
Dom
estic
766.
172
5.1
676.
570
4.8
1,03
0.2
1,38
9.5
2,19
8.8
3,12
8.8
3,93
1.3
4,55
5.5
3,46
9.3
3,21
8.8
3,38
8.8
3,34
3.4
2,92
5.2
3,79
3.5
For
eign
180.
522
3.7
399.
088
5.1
628.
587
5.8
634.
81,
017.
898
2.7
1,02
0.5
639.
477
5.8
966.
992
6.7
1,51
9.2
1,89
0.4
Tota
lGov
t.D
evt.
Exp
endi
ture
9,95
2.0
10,8
73.0
8,33
2.0
9,47
2.0
12,2
51.0
13,8
34.0
19,4
52.0
19,9
98.0
22,9
12.0
25,2
27.2
27,3
98.3
30,7
83.5
34,5
02.7
38,9
27.9
41,1
07.9
52,4
48.3
Ro
adS
ecto
rS
har
e(%
)9.
58.
712
.916
.813
.516
.414
.620
.721
.422
.115
.013
.012
.611
.010
.810
.8
<1>
AP
BN
=N
atio
nalb
udge
t
<2>
AP
BD
I=P
rovi
ncia
lbud
get
<3>
IPJP
=C
entr
algo
vern
men
tgra
nts
topr
ovin
ces
for
road
wor
ks
<4>
IPJK
=C
entr
algo
vern
men
tgra
nts
toka
bupa
tens
for
road
cons
truc
tion
<5>
Inpr
esD
atiI
I=C
entr
algo
vern
men
tgra
nts
toka
bupa
tens
for
road
mai
nten
ance
<6>
Exc
ludi
ngpr
ivat
e-se
ctor
expe
nditu
res
<7>
Act
uale
xpen
ditu
res
in19
99/2
000
are
thou
ghtt
obe
only
abou
t80-
85pe
rcen
toft
hose
show
n.
Sou
rce:
DG
RID
,Jul
y20
00,q
uote
din
AD
BR
RP
Roa
dR
ehab
ilita
tion
(Sec
tor)
Pro
ject
,Sep
tem
ber
2000
Tabl
e II
I.6. G
over
nmen
tal
Expe
nditu
res
on R
oads
, 19
84/8
5-19
99/2
000
177
BackgroundSector Report IIIRevenues from the PKB, BBNKB and PBBKB are collected by the provinces
and shared with their constituent kabupaten and kota in accordance withminima specified in Law 34 of 2000.114 Together these taxes account for amajor part of the ‘own source’ revenues of regional governments, althoughthe proportion varies considerably from region to region. The proceedsare treated as general tax revenues and are not ‘earmarked’ for financingthe road programs.
While total receipts from these sources are significant, they have beenmore than offset by the subsidies road users have enjoyed as a result of lowadministered prices for petroleum fuels, and particularly automotive dieseloil (ADO). Government announced its intent to raise fuel prices tointernational levels as far back as 1993, and in 1997 was close to eliminatingthe subsidy when the Rupiah’s sharp depreciation and the coincidentsharp rise in crude oil prices caused the amount of subsidy to blow out.115
A significant proportion of the subsidies has gone to road users and inparticular to operators of diesel-engine vehicles. Prices have since beenincreased progressively and the subsidy on both gasoline and ADO wasscheduled to be eliminated from January 1 2003. A surge in crude pricescoupled with adverse public reaction to simultaneous increases in powerand telephone tariffs caused the Government to defer this important stepbut it is expected to be implemented once crude oil prices have stabilizedat or below the levels that prevailed prior to the build up to the Iraq war.
Prior to decentralization, expenditures on the national and provincialroad programs were funded almost entirely from the State budget throughspecial purpose (Inpres) road grants for provincial roads, with a large andincreasing proportion of the total being sourced from foreign loans. Thepicture was broadly similar for kabupaten roads, with most works being
financed from the State budget through special purpose road constructionand maintenance grants and allocations from foreign loans.
The picture has changed significantly as a result of decentralization, withprovinces and in particular kabupatens and kotas now enjoying greatlyincreased revenues from the General Allocation Fund (DAU) and royaltieson natural resources. Special purpose Inpres grants have ceased, but centralgovernment continues to channel foreign loans to provinces, kabupatensand kotas for road works and does not require repayment under existingloans.116 From 2003, central government will also provide funding fromthe State Budget through the Special Fund Allocation mechanism (DanaAlokasi Khusus or DAK) for works on rural roads.117 Overall a significantlygreater proportion of road works expenditures is now being financed bythe respective ‘owner’ governments using revenues sources over whichthey have full control.
Financing expenditures on toll roadsGovernment initiated the toll road program in the late 1970s when itrecognized the need for users to participate in financing the constructionof high standard limited access expressways. During the mid-1980s it
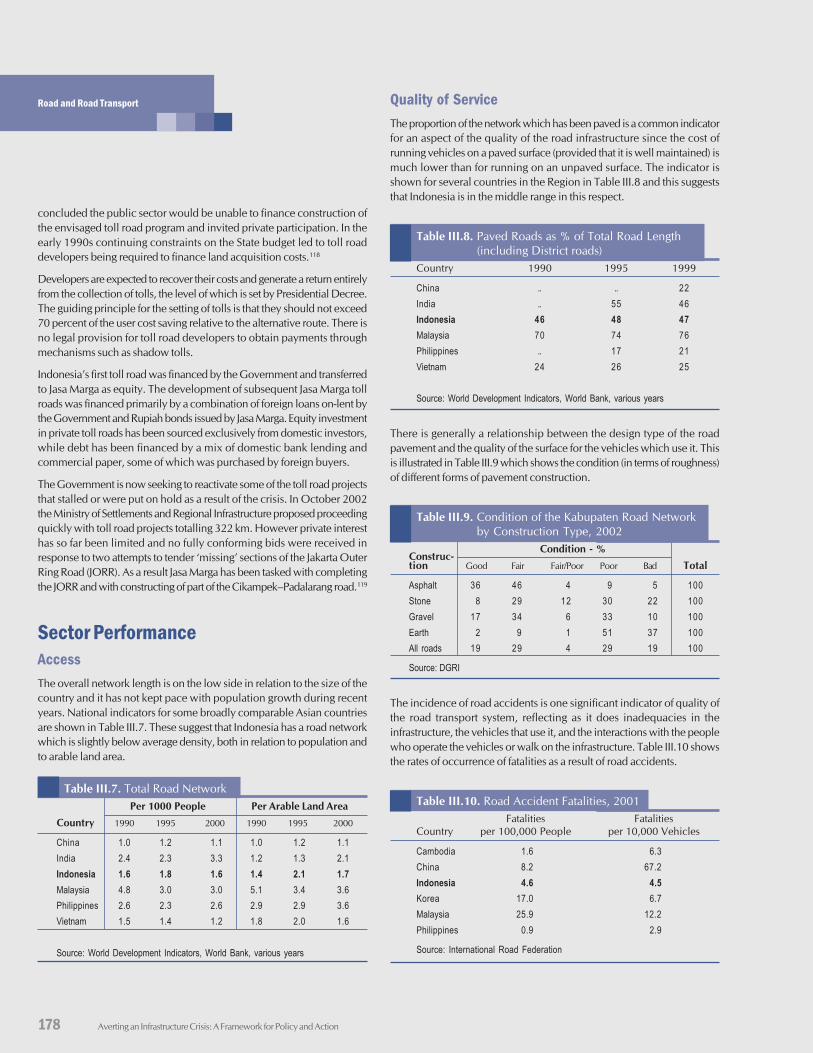
178 Averting an Infrastructure Crisis: A Framework for Policy and Action
Road and Road Transport
concluded the public sector would be unable to finance construction ofthe envisaged toll road program and invited private participation. In theearly 1990s continuing constraints on the State budget led to toll roaddevelopers being required to finance land acquisition costs.118
Developers are expected to recover their costs and generate a return entirelyfrom the collection of tolls, the level of which is set by Presidential Decree.The guiding principle for the setting of tolls is that they should not exceed70 percent of the user cost saving relative to the alternative route. There isno legal provision for toll road developers to obtain payments throughmechanisms such as shadow tolls.
Indonesia’s first toll road was financed by the Government and transferredto Jasa Marga as equity. The development of subsequent Jasa Marga tollroads was financed primarily by a combination of foreign loans on-lent bythe Government and Rupiah bonds issued by Jasa Marga. Equity investmentin private toll roads has been sourced exclusively from domestic investors,while debt has been financed by a mix of domestic bank lending andcommercial paper, some of which was purchased by foreign buyers.
The Government is now seeking to reactivate some of the toll road projectsthat stalled or were put on hold as a result of the crisis. In October 2002the Ministry of Settlements and Regional Infrastructure proposed proceedingquickly with toll road projects totalling 322 km. However private interesthas so far been limited and no fully conforming bids were received inresponse to two attempts to tender ‘missing’ sections of the Jakarta OuterRing Road (JORR). As a result Jasa Marga has been tasked with completingthe JORR and with constructing of part of the Cikampek–Padalarang road.119
Sector PerformanceAccessThe overall network length is on the low side in relation to the size of thecountry and it has not kept pace with population growth during recentyears. National indicators for some broadly comparable Asian countriesare shown in Table III.7. These suggest that Indonesia has a road networkwhich is slightly below average density, both in relation to population andto arable land area.
Table III.7. Total Road NetworkPer 1000 People Per Arable Land Area
Country 1990 1995 2000 1990 1995 2000
China 1.0 1.2 1.1 1.0 1.2 1.1India 2.4 2.3 3.3 1.2 1.3 2.1Indonesia 1.6 1.8 1.6 1.4 2.1 1.7Malaysia 4.8 3.0 3.0 5.1 3.4 3.6Philippines 2.6 2.3 2.6 2.9 2.9 3.6Vietnam 1.5 1.4 1.2 1.8 2.0 1.6
Source: World Development Indicators, World Bank, various years
Quality of ServiceThe proportion of the network which has been paved is a common indicatorfor an aspect of the quality of the road infrastructure since the cost ofrunning vehicles on a paved surface (provided that it is well maintained) ismuch lower than for running on an unpaved surface. The indicator isshown for several countries in the Region in Table III.8 and this suggeststhat Indonesia is in the middle range in this respect.
Table III.8. Paved Roads as % of Total Road Length(including District roads)
Country 1990 1995 1999
China .. .. 22India .. 55 46Indonesia 46 48 47Malaysia 70 74 76Philippines .. 17 21Vietnam 24 26 25
Source: World Development Indicators, World Bank, various years
There is generally a relationship between the design type of the roadpavement and the quality of the surface for the vehicles which use it. Thisis illustrated in Table III.9 which shows the condition (in terms of roughness)of different forms of pavement construction.
Table III.9. Condition of the Kabupaten Road Networkby Construction Type, 2002
Construc-Condition - %
tion Good Fair Fair/Poor Poor Bad Total
Asphalt 36 46 4 9 5 100Stone 8 29 12 30 22 100Gravel 17 34 6 33 10 100Earth 2 9 1 51 37 100All roads 19 29 4 29 19 100
Source: DGRI
The incidence of road accidents is one significant indicator of quality ofthe road transport system, reflecting as it does inadequacies in theinfrastructure, the vehicles that use it, and the interactions with the peoplewho operate the vehicles or walk on the infrastructure. Table III.10 showsthe rates of occurrence of fatalities as a result of road accidents.
Table III.10. Road Accident Fatalities, 2001Fatalities Fatalities
Country per 100,000 People per 10,000 Vehicles
Cambodia 1.6 6.3China 8.2 67.2Indonesia 4.6 4.5Korea 17.0 6.7Malaysia 25.9 12.2Philippines 0.9 2.9
Source: International Road Federation
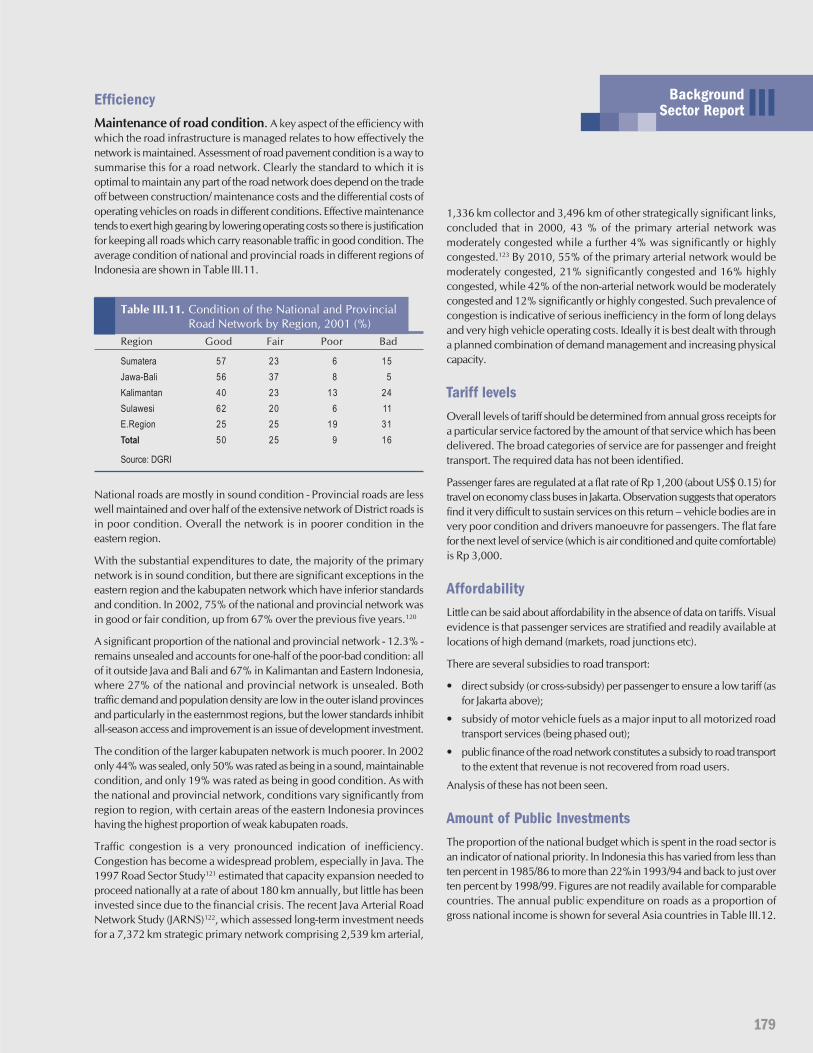
179
BackgroundSector Report IIIEfficiency
Maintenance of road condition. A key aspect of the efficiency withwhich the road infrastructure is managed relates to how effectively thenetwork is maintained. Assessment of road pavement condition is a way tosummarise this for a road network. Clearly the standard to which it isoptimal to maintain any part of the road network does depend on the tradeoff between construction/ maintenance costs and the differential costs ofoperating vehicles on roads in different conditions. Effective maintenancetends to exert high gearing by lowering operating costs so there is justificationfor keeping all roads which carry reasonable traffic in good condition. Theaverage condition of national and provincial roads in different regions ofIndonesia are shown in Table III.11.
Table III.11. Condition of the National and ProvincialRoad Network by Region, 2001 (%)
Region Good Fair Poor Bad
Sumatera 57 23 6 15Jawa-Bali 56 37 8 5Kalimantan 40 23 13 24Sulawesi 62 20 6 11E.Region 25 25 19 31Total 50 25 9 16
Source: DGRI
National roads are mostly in sound condition - Provincial roads are lesswell maintained and over half of the extensive network of District roads isin poor condition. Overall the network is in poorer condition in theeastern region.
With the substantial expenditures to date, the majority of the primarynetwork is in sound condition, but there are significant exceptions in theeastern region and the kabupaten network which have inferior standardsand condition. In 2002, 75% of the national and provincial network wasin good or fair condition, up from 67% over the previous five years.120
A significant proportion of the national and provincial network - 12.3% -remains unsealed and accounts for one-half of the poor-bad condition: allof it outside Java and Bali and 67% in Kalimantan and Eastern Indonesia,where 27% of the national and provincial network is unsealed. Bothtraffic demand and population density are low in the outer island provincesand particularly in the easternmost regions, but the lower standards inhibitall-season access and improvement is an issue of development investment.
The condition of the larger kabupaten network is much poorer. In 2002only 44% was sealed, only 50% was rated as being in a sound, maintainablecondition, and only 19% was rated as being in good condition. As withthe national and provincial network, conditions vary significantly fromregion to region, with certain areas of the eastern Indonesia provinceshaving the highest proportion of weak kabupaten roads.
Traffic congestion is a very pronounced indication of inefficiency.Congestion has become a widespread problem, especially in Java. The1997 Road Sector Study121 estimated that capacity expansion needed toproceed nationally at a rate of about 180 km annually, but little has beeninvested since due to the financial crisis. The recent Java Arterial RoadNetwork Study (JARNS)122, which assessed long-term investment needsfor a 7,372 km strategic primary network comprising 2,539 km arterial,
1,336 km collector and 3,496 km of other strategically significant links,concluded that in 2000, 43 % of the primary arterial network wasmoderately congested while a further 4% was significantly or highlycongested.123 By 2010, 55% of the primary arterial network would bemoderately congested, 21% significantly congested and 16% highlycongested, while 42% of the non-arterial network would be moderatelycongested and 12% significantly or highly congested. Such prevalence ofcongestion is indicative of serious inefficiency in the form of long delaysand very high vehicle operating costs. Ideally it is best dealt with througha planned combination of demand management and increasing physicalcapacity.
Tariff levelsOverall levels of tariff should be determined from annual gross receipts fora particular service factored by the amount of that service which has beendelivered. The broad categories of service are for passenger and freighttransport. The required data has not been identified.
Passenger fares are regulated at a flat rate of Rp 1,200 (about US$ 0.15) fortravel on economy class buses in Jakarta. Observation suggests that operatorsfind it very difficult to sustain services on this return – vehicle bodies are invery poor condition and drivers manoeuvre for passengers. The flat farefor the next level of service (which is air conditioned and quite comfortable)is Rp 3,000.
AffordabilityLittle can be said about affordability in the absence of data on tariffs. Visualevidence is that passenger services are stratified and readily available atlocations of high demand (markets, road junctions etc).
There are several subsidies to road transport:
• direct subsidy (or cross-subsidy) per passenger to ensure a low tariff (asfor Jakarta above);
• subsidy of motor vehicle fuels as a major input to all motorized roadtransport services (being phased out);
• public finance of the road network constitutes a subsidy to road transportto the extent that revenue is not recovered from road users.
Analysis of these has not been seen.
Amount of Public InvestmentsThe proportion of the national budget which is spent in the road sector isan indicator of national priority. In Indonesia this has varied from less thanten percent in 1985/86 to more than 22%in 1993/94 and back to just overten percent by 1998/99. Figures are not readily available for comparablecountries. The annual public expenditure on roads as a proportion ofgross national income is shown for several Asia countries in Table III.12.
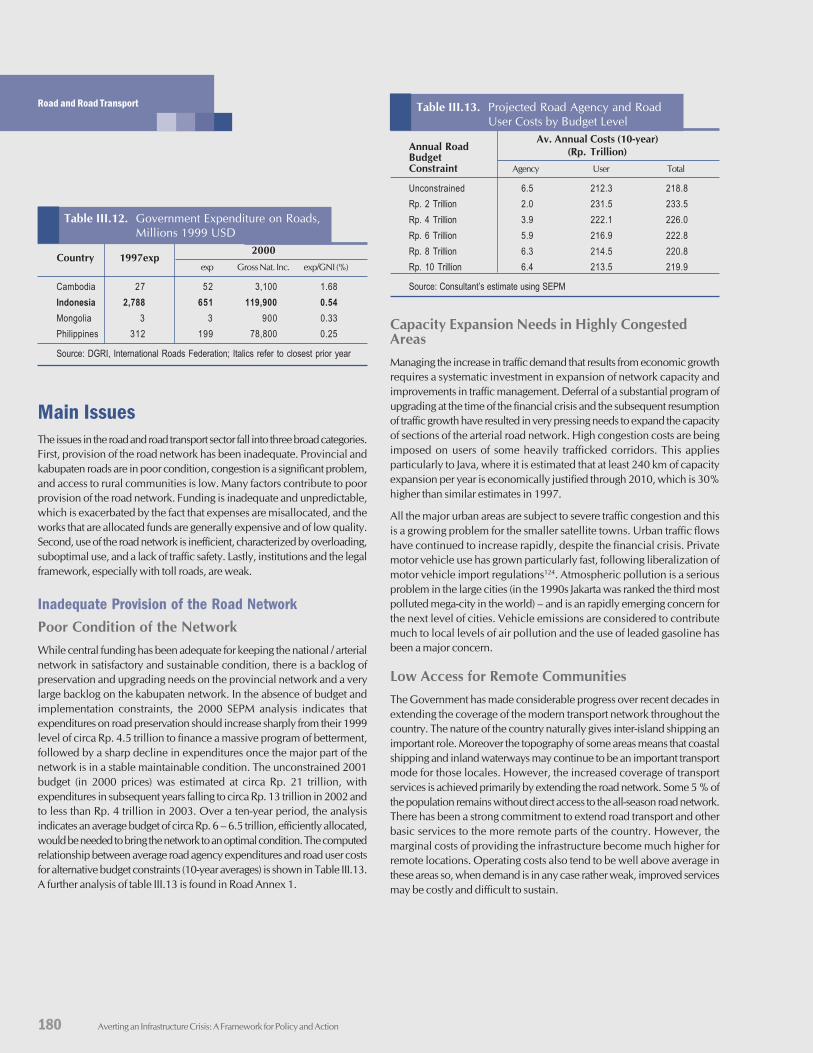
180 Averting an Infrastructure Crisis: A Framework for Policy and Action
Road and Road Transport
Table III.12. Government Expenditure on Roads,Millions 1999 USD
Country 1997exp2000
exp Gross Nat. Inc. exp/GNI (%)
Cambodia 27 52 3,100 1.68Indonesia 2,788 651 119,900 0.54Mongolia 3 3 900 0.33Philippines 312 199 78,800 0.25
Source: DGRI, International Roads Federation; Italics refer to closest prior year
Main IssuesThe issues in the road and road transport sector fall into three broad categories.First, provision of the road network has been inadequate. Provincial andkabupaten roads are in poor condition, congestion is a significant problem,and access to rural communities is low. Many factors contribute to poorprovision of the road network. Funding is inadequate and unpredictable,which is exacerbated by the fact that expenses are misallocated, and theworks that are allocated funds are generally expensive and of low quality.Second, use of the road network is inefficient, characterized by overloading,suboptimal use, and a lack of traffic safety. Lastly, institutions and the legalframework, especially with toll roads, are weak.
Inadequate Provision of the Road NetworkPoor Condition of the NetworkWhile central funding has been adequate for keeping the national / arterialnetwork in satisfactory and sustainable condition, there is a backlog ofpreservation and upgrading needs on the provincial network and a verylarge backlog on the kabupaten network. In the absence of budget andimplementation constraints, the 2000 SEPM analysis indicates thatexpenditures on road preservation should increase sharply from their 1999level of circa Rp. 4.5 trillion to finance a massive program of betterment,followed by a sharp decline in expenditures once the major part of thenetwork is in a stable maintainable condition. The unconstrained 2001budget (in 2000 prices) was estimated at circa Rp. 21 trillion, withexpenditures in subsequent years falling to circa Rp. 13 trillion in 2002 andto less than Rp. 4 trillion in 2003. Over a ten-year period, the analysisindicates an average budget of circa Rp. 6 – 6.5 trillion, efficiently allocated,would be needed to bring the network to an optimal condition. The computedrelationship between average road agency expenditures and road user costsfor alternative budget constraints (10-year averages) is shown in Table III.13.A further analysis of table III.13 is found in Road Annex 1.
Table III.13. Projected Road Agency and RoadUser Costs by Budget Level
Annual RoadAv. Annual Costs (10-year)
Budget (Rp. Trillion)Constraint Agency User Total
Unconstrained 6.5 212.3 218.8Rp. 2 Trillion 2.0 231.5 233.5Rp. 4 Trillion 3.9 222.1 226.0Rp. 6 Trillion 5.9 216.9 222.8Rp. 8 Trillion 6.3 214.5 220.8Rp. 10 Trillion 6.4 213.5 219.9
Source: Consultant’s estimate using SEPM
Capacity Expansion Needs in Highly CongestedAreasManaging the increase in traffic demand that results from economic growthrequires a systematic investment in expansion of network capacity andimprovements in traffic management. Deferral of a substantial program ofupgrading at the time of the financial crisis and the subsequent resumptionof traffic growth have resulted in very pressing needs to expand the capacityof sections of the arterial road network. High congestion costs are beingimposed on users of some heavily trafficked corridors. This appliesparticularly to Java, where it is estimated that at least 240 km of capacityexpansion per year is economically justified through 2010, which is 30%higher than similar estimates in 1997.
All the major urban areas are subject to severe traffic congestion and thisis a growing problem for the smaller satellite towns. Urban traffic flowshave continued to increase rapidly, despite the financial crisis. Privatemotor vehicle use has grown particularly fast, following liberalization ofmotor vehicle import regulations124. Atmospheric pollution is a seriousproblem in the large cities (in the 1990s Jakarta was ranked the third mostpolluted mega-city in the world) – and is an rapidly emerging concern forthe next level of cities. Vehicle emissions are considered to contributemuch to local levels of air pollution and the use of leaded gasoline hasbeen a major concern.
Low Access for Remote CommunitiesThe Government has made considerable progress over recent decades inextending the coverage of the modern transport network throughout thecountry. The nature of the country naturally gives inter-island shipping animportant role. Moreover the topography of some areas means that coastalshipping and inland waterways may continue to be an important transportmode for those locales. However, the increased coverage of transportservices is achieved primarily by extending the road network. Some 5 % ofthe population remains without direct access to the all-season road network.There has been a strong commitment to extend road transport and otherbasic services to the more remote parts of the country. However, themarginal costs of providing the infrastructure become much higher forremote locations. Operating costs also tend to be well above average inthese areas so, when demand is in any case rather weak, improved servicesmay be costly and difficult to sustain.
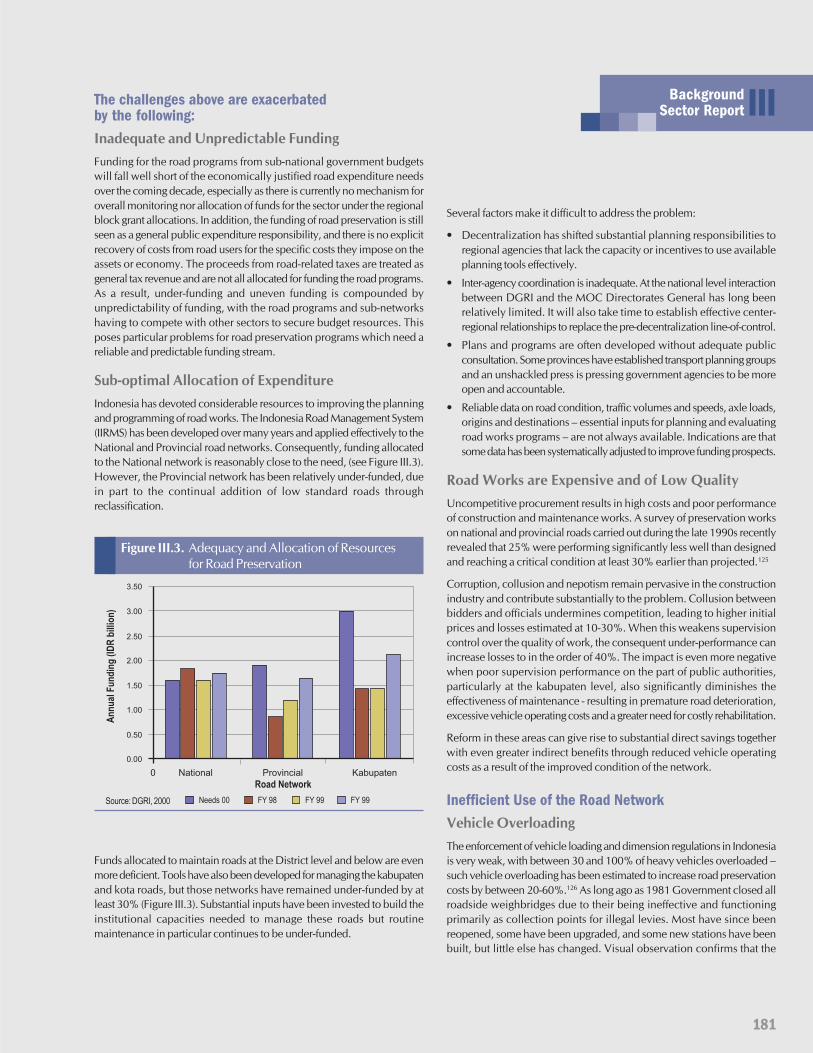
181
BackgroundSector Report III
An
nu
alF
un
din
g(I
DR
bill
ion
)
Needs 00
0 National
0.50
0.00
1.00
1.50
2.00
2.50
3.00
3.50
Provincial Kabupaten
FY 98 FY 99 FY 99
Road Network
Figure III.3. Adequacy and Allocation of Resourcesfor Road Preservation
Source: DGRI, 2000
The challenges above are exacerbatedby the following:Inadequate and Unpredictable FundingFunding for the road programs from sub-national government budgetswill fall well short of the economically justified road expenditure needsover the coming decade, especially as there is currently no mechanism foroverall monitoring nor allocation of funds for the sector under the regionalblock grant allocations. In addition, the funding of road preservation is stillseen as a general public expenditure responsibility, and there is no explicitrecovery of costs from road users for the specific costs they impose on theassets or economy. The proceeds from road-related taxes are treated asgeneral tax revenue and are not all allocated for funding the road programs.As a result, under-funding and uneven funding is compounded byunpredictability of funding, with the road programs and sub-networkshaving to compete with other sectors to secure budget resources. Thisposes particular problems for road preservation programs which need areliable and predictable funding stream.
Sub-optimal Allocation of ExpenditureIndonesia has devoted considerable resources to improving the planningand programming of road works. The Indonesia Road Management System(IIRMS) has been developed over many years and applied effectively to theNational and Provincial road networks. Consequently, funding allocatedto the National network is reasonably close to the need, (see Figure III.3).However, the Provincial network has been relatively under-funded, duein part to the continual addition of low standard roads throughreclassification.
Several factors make it difficult to address the problem:
• Decentralization has shifted substantial planning responsibilities toregional agencies that lack the capacity or incentives to use availableplanning tools effectively.
• Inter-agency coordination is inadequate. At the national level interactionbetween DGRI and the MOC Directorates General has long beenrelatively limited. It will also take time to establish effective center-regional relationships to replace the pre-decentralization line-of-control.
• Plans and programs are often developed without adequate publicconsultation. Some provinces have established transport planning groupsand an unshackled press is pressing government agencies to be moreopen and accountable.
• Reliable data on road condition, traffic volumes and speeds, axle loads,origins and destinations – essential inputs for planning and evaluatingroad works programs – are not always available. Indications are thatsome data has been systematically adjusted to improve funding prospects.
Road Works are Expensive and of Low QualityUncompetitive procurement results in high costs and poor performanceof construction and maintenance works. A survey of preservation workson national and provincial roads carried out during the late 1990s recentlyrevealed that 25% were performing significantly less well than designedand reaching a critical condition at least 30% earlier than projected.125
Corruption, collusion and nepotism remain pervasive in the constructionindustry and contribute substantially to the problem. Collusion betweenbidders and officials undermines competition, leading to higher initialprices and losses estimated at 10-30%. When this weakens supervisioncontrol over the quality of work, the consequent under-performance canincrease losses to in the order of 40%. The impact is even more negativewhen poor supervision performance on the part of public authorities,particularly at the kabupaten level, also significantly diminishes theeffectiveness of maintenance - resulting in premature road deterioration,excessive vehicle operating costs and a greater need for costly rehabilitation.
Reform in these areas can give rise to substantial direct savings togetherwith even greater indirect benefits through reduced vehicle operatingcosts as a result of the improved condition of the network.
Inefficient Use of the Road NetworkVehicle OverloadingThe enforcement of vehicle loading and dimension regulations in Indonesiais very weak, with between 30 and 100% of heavy vehicles overloaded –such vehicle overloading has been estimated to increase road preservationcosts by between 20-60%.126 As long ago as 1981 Government closed allroadside weighbridges due to their being ineffective and functioningprimarily as collection points for illegal levies. Most have since beenreopened, some have been upgraded, and some new stations have beenbuilt, but little else has changed. Visual observation confirms that the
Funds allocated to maintain roads at the District level and below are evenmore deficient. Tools have also been developed for managing the kabupatenand kota roads, but those networks have remained under-funded by atleast 30% (Figure III.3). Substantial inputs have been invested to build theinstitutional capacities needed to manage these roads but routinemaintenance in particular continues to be under-funded.
182 Averting an Infrastructure Crisis: A Framework for Policy and Action
Road and Road Transport
problem remains very serious and is possibly worsening. In Sumateratrucks transport logs that overhang far beyond the permitted the limit. InJava ‘hungry boards’ are used to enable trucks to carry excessive volumesof sand and aggregates. Similarly in Jakarta, ready-mix concrete trucks arefitted with drums that are much larger than the volume stated on thevehicle documents. Many overloaded trucks enjoy military or policeprotection and indeed many are operated by military or police cooperatives.
Sub-optimal Utilization of Existing Road NetworkCapacityWith budget constraints limiting the scope for road capacity expansioninvestments, it will be essential in the medium term to maximize utilizationof existing capacity. At present, serious congestion, which greatly increasesroad user costs, is commonly caused by poor traffic engineering and trafficmanagement, especially at intersections, by roadside activities such asmarkets that impede traffic flow, by slow-moving vehicles that areoverloaded, under-powered or unsafe, and by poor driver behavior. Insome areas, problems are compounded by poor public transport routelicensing practices that allow the operation of excessive numbers of smallpick-ups and that require these to pass through badly located and managedterminals for the primary purpose of revenue generation.
Some basic traffic management measures such as traffic lights and ‘oneway’ streets are applied in most urban areas. To date there have beenrather limited attempts to introduce more sophisticated traffic managementmeasures such as segregated traffic, ‘tidal flow’ lanes and variable geometryat roundabouts. The very substantial needs for improved regulation andmanagement of urban transport as well as for capital investment must beassessed in the complex context of urban management and planning.
Poor Road Traffic SafetyRoad traffic accidents cause around 25 deaths per day in Indonesia andgive rise to substantial material costs. Road accidents impose an estimatedcost of 1.5% of GDP. The number of reported fatalities has declined inrecent years, falling from circa 11,800 in 1998 to 8,762 in 2002. Thenumber of fatalities per 100,000 population is relatively low at 4.6, butthe number per 10,000 registered vehicles is relatively high at 4.5. Poorpublic and driver education coupled with lax driver testing procedures fordrivers of public transport and heavy goods vehicles, are important factors.They are compounded by weak enforcement of safety-related trafficregulations, ineffectual inspection of motor vehicle condition, which iscurrently required only for commercial vehicles, and poor road andintersection geometry and signing. In some instances, notably driver andvehicle testing, corruption is recognized to be a significant underlyingfactor.
Information on the causes and consequences of traffic accidents is poor, inpart because it has taken more than a decade to secure inter-agency agreementon the adoption of an improved traffic accident reporting and data processingsystem whose implementation is only now commencing on a pilot basis.
Official statistics are believed to understate actual number of fatalities, inpart because deaths occurring more than 24 hours after an accident areoften not included.
Inadequate Institutional and Regulatory Frameworkfor Toll RoadsPrivate interest in developing toll roads has not recovered from the significantsetbacks brought about by the financial and economic crisis in 1997. As aresult of the crisis, GOI eventually canceled 37 projects and subjected 18to further review. In October 2002, MSRI proposed reactivating stalledprojects and proceeding quickly with toll road projects totaling 322 km,but there has been limited private interest. Clearly, many years after thecrisis, there is still no sign of renewed private interest in the toll roads.
The limited interest now being shown in the toll road sector by seriousprivate investors is attributable to several factors aside from the overallinvestment climate. Prominent among them are:
• Concerns regarding the concessions award process and the multipleroles assigned to Jasa Marga, which acts as a toll road developer, anagent of development required by the Government to construct roadsthat are not commercially viable, and as a counter-party for concessionagreements with private developers or as a joint venture partner forsuch developers;
• Absence of an agreed automatic tariff adjustment mechanism to reflectchanges in costs not controllable by developers;
• Difficultly of acquiring land in a timely manner, as there is no enforceablelegal framework to expropriate land for public purposes;
• Requiring developers to be responsible for the costs of land acquisitionin the absence of functioning eminent domain powers;
• Unclear allocation of government responsibility, particularly on tariffpolicy and regulation;
• Slow progress in the resolution of existing concessions; and
• Absence of a well designed and updated toll road master-plan onwhich to prepare meaningful feasibility studies.
The Way ForwardGovernment has recognized and has been seeking to tackle the coreproblems impeding the efficient functioning of the road sector for morethan two decades. While some initiatives have borne fruit, the overall paceof progress has been disappointingly slow. The resultant costs—for thebudget and for road users—amount to several trillions of Rupiah per year.These are real costs that impact the performance of the economy andimpede efforts to alleviate poverty. A fundamental rethinking on the wayin which the sector is managed and regulated is clearly needed.
Improve Road Network ProvisionExpand and Extend NetworkManaging the increase in traffic demand that results from economic growthrequires a systematic investment in expansion of network capacity andimprovements in traffic and demand management. Programs of priorityinvestment on the core sections of the network should be identified,particularly those that may be suitable for private investment.
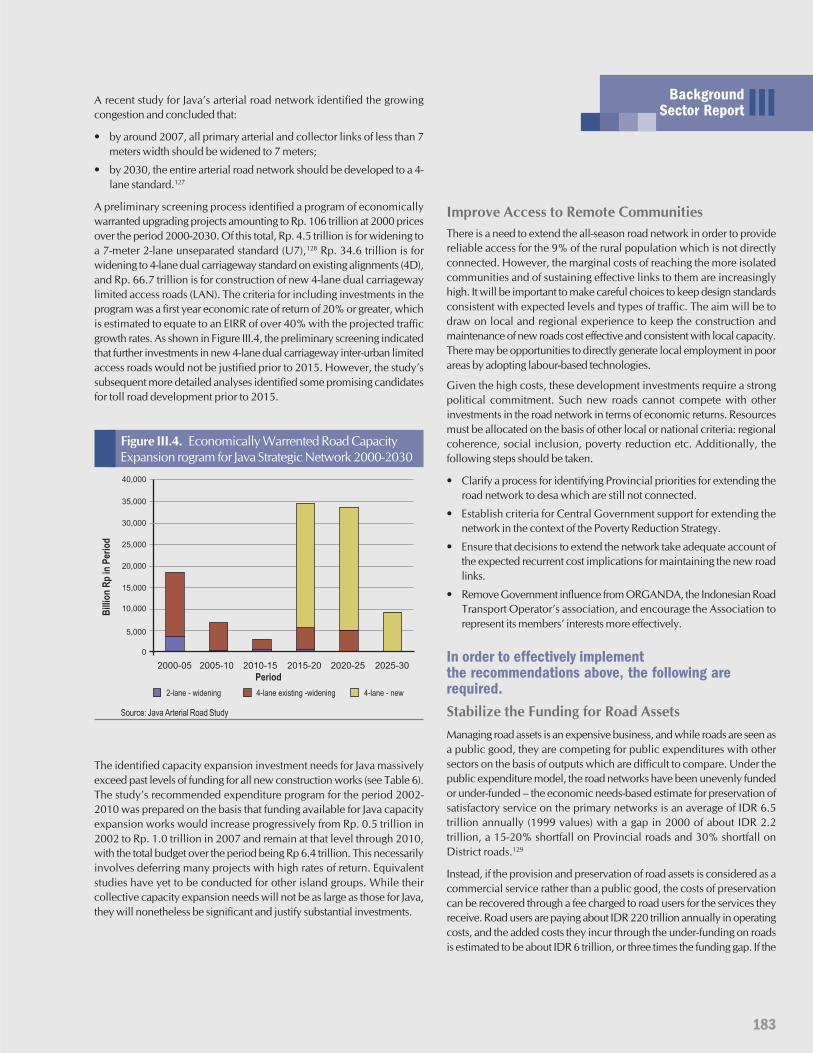
183
BackgroundSector Report III
Bill
ion
Rp
inP
erio
d
2-lane - widening
2000-05
5,000
0
10,000
15,000
20,000
25,000
30,000
40,000
4-lane existing -widening 4-lane - new
Period2005-10 2010-15 2015-20 2020-25 2025-30
35,000
Figure III.4. Economically Warrented Road CapacityExpansion rogram for Java Strategic Network 2000-2030
Source: Java Arterial Road Study
A recent study for Java’s arterial road network identified the growingcongestion and concluded that:
• by around 2007, all primary arterial and collector links of less than 7meters width should be widened to 7 meters;
• by 2030, the entire arterial road network should be developed to a 4-lane standard.127
A preliminary screening process identified a program of economicallywarranted upgrading projects amounting to Rp. 106 trillion at 2000 pricesover the period 2000-2030. Of this total, Rp. 4.5 trillion is for widening toa 7-meter 2-lane unseparated standard (U7),128 Rp. 34.6 trillion is forwidening to 4-lane dual carriageway standard on existing alignments (4D),and Rp. 66.7 trillion is for construction of new 4-lane dual carriagewaylimited access roads (LAN). The criteria for including investments in theprogram was a first year economic rate of return of 20% or greater, whichis estimated to equate to an EIRR of over 40% with the projected trafficgrowth rates. As shown in Figure III.4, the preliminary screening indicatedthat further investments in new 4-lane dual carriageway inter-urban limitedaccess roads would not be justified prior to 2015. However, the study’ssubsequent more detailed analyses identified some promising candidatesfor toll road development prior to 2015.
The identified capacity expansion investment needs for Java massivelyexceed past levels of funding for all new construction works (see Table 6).The study’s recommended expenditure program for the period 2002-2010 was prepared on the basis that funding available for Java capacityexpansion works would increase progressively from Rp. 0.5 trillion in2002 to Rp. 1.0 trillion in 2007 and remain at that level through 2010,with the total budget over the period being Rp 6.4 trillion. This necessarilyinvolves deferring many projects with high rates of return. Equivalentstudies have yet to be conducted for other island groups. While theircollective capacity expansion needs will not be as large as those for Java,they will nonetheless be significant and justify substantial investments.
Improve Access to Remote CommunitiesThere is a need to extend the all-season road network in order to providereliable access for the 9% of the rural population which is not directlyconnected. However, the marginal costs of reaching the more isolatedcommunities and of sustaining effective links to them are increasinglyhigh. It will be important to make careful choices to keep design standardsconsistent with expected levels and types of traffic. The aim will be todraw on local and regional experience to keep the construction andmaintenance of new roads cost effective and consistent with local capacity.There may be opportunities to directly generate local employment in poorareas by adopting labour-based technologies.
Given the high costs, these development investments require a strongpolitical commitment. Such new roads cannot compete with otherinvestments in the road network in terms of economic returns. Resourcesmust be allocated on the basis of other local or national criteria: regionalcoherence, social inclusion, poverty reduction etc. Additionally, thefollowing steps should be taken.
• Clarify a process for identifying Provincial priorities for extending theroad network to desa which are still not connected.
• Establish criteria for Central Government support for extending thenetwork in the context of the Poverty Reduction Strategy.
• Ensure that decisions to extend the network take adequate account ofthe expected recurrent cost implications for maintaining the new roadlinks.
• Remove Government influence from ORGANDA, the Indonesian RoadTransport Operator’s association, and encourage the Association torepresent its members’ interests more effectively.
In order to effectively implementthe recommendations above, the following arerequired.Stabilize the Funding for Road AssetsManaging road assets is an expensive business, and while roads are seen asa public good, they are competing for public expenditures with othersectors on the basis of outputs which are difficult to compare. Under thepublic expenditure model, the road networks have been unevenly fundedor under-funded – the economic needs-based estimate for preservation ofsatisfactory service on the primary networks is an average of IDR 6.5trillion annually (1999 values) with a gap in 2000 of about IDR 2.2trillion, a 15-20% shortfall on Provincial roads and 30% shortfall onDistrict roads.129
Instead, if the provision and preservation of road assets is considered as acommercial service rather than a public good, the costs of preservationcan be recovered through a fee charged to road users for the services theyreceive. Road users are paying about IDR 220 trillion annually in operatingcosts, and the added costs they incur through the under-funding on roadsis estimated to be about IDR 6 trillion, or three times the funding gap. If the
184 Averting an Infrastructure Crisis: A Framework for Policy and Action
Road and Road Transport
financing of road preservation was put on a fee-for-service basis, users maypay an additional IDR 2.2 trillion but they would have net savings ofdouble that amount.
Under a commercial service model, the full economic costs of roadpreservation would be recovered from users and invested in the roadassets, in a similar way to the operation of utilities such as telephones orelectric power. Adoption of this cost recovery model could place themanagement of road assets on a fully sustainable basis which does notimpose on general public expenditures, because the revenue would keeppace with the expenditure needs, provided that the funds were investedback in the assets efficiently. In essence the funds would pass through fromroad user revenues to the budget for road expenditures – and eventually,with the appropriate controls, could be managed off-budget.
Off-budget road funds financed by predictable revenue streams from usercharges have proven effective in many countries, particularly where theyare part of a broader strategy for managing roads on a business-like fee-for-service basis. Road fund revenues should be sourced from specific roaduser charges, not from general tax revenue, and its claim to these revenuesshould be established in law. The level of revenues should be sufficient tofinance the works and services needed to improve and maintain the network
to a satisfactory standard, while the structure of user charges should provideincentives for economically sound vehicle purchase and operating decisions.Road preservation works would thus be funded entirely off-budget byusers and without financing from foreign loans.
When the subsidy on gasoline and ADO is eliminated, road users will startto make a substantial contribution towards the costs of road preservation(rehabilitation, routine and periodic maintenance and limited betterment).Revenues from the PKB motor vehicle tax, the PBBKB motor vehicle fuelstax, and other taxes on road users would be broadly in line with thedesirable level of preservation expenditures.130
The present structure of the existing road user charges is far from that ideal,however. The PKB was conceived as a wealth tax and, although its potentialrole as a road user charge was recognized in the early 1990s, the maindeterminant of the PKB rate is vehicle book value (with a cap of 5%). Ratesaccordingly decline with vehicle age, with the rate for an old truck capableof causing considerable road damage being very low. This structure is alsoundesirable inasmuch as it encourages retention of vehicles beyond theireconomic working lives. BBNKB is payable on each ownership transfer,with the amount payable being a percentage of book value. It is probablybest viewed as a general tax.131 The PBBKB is critically important as a roadusage related charge, as the amount a user pays depends on the size of thevehicle and the distance it travels. However, it is an ad valorem tax and therevenue per liter accordingly fluctuates with the price of fuel.
The sources of revenues for the road fund system should therefore be theannual motor vehicle tax (PKB) and the motor vehicle fuel tax (PBBKB).Both will require some restructuring for this purpose. For the PKB, therates for commercial vehicles should be reflect their road damaging
185
BackgroundSector Report IIIpotential (gross vehicle weight and axle configuration) and should not
decline with vehicle age as is the case at present. There could be a case forsplitting the PKB into two components, a wealth tax and road damagecharge, with only the latter being designated as a road user charge. ThePBBKB, which is currently an ad valorem tax, should be replaced by a levyor levies expressed as a fixed Rupiah amount per liter, with the amountbeing subject to periodic review and adjustment. These changes will requireamendments to the provisions of Law 18/1997 that relate to the structureof the PKB and PBBKB. The Road Funds study estimated that the levywould need to be set initially at around Rp 140 per liter for gasoline anddiesel on the basis of an annual road preservation funding requirement ofRp. 6.5 trillion and a contribution of circa Rp. 2.1 trillion from the PKB.
It will also be necessary to amend the provisions of Law 34/2000 thatrelate to the collection and sharing of these taxes. In particular, it will benecessary to provide for the proceeds of the PKB to be channeled to theprovincial road funds and for part of the proceeds from the PBBKB levy tobe allocated to the national road fund. Alternatively, there could be a casefor establishing a new national motor vehicle fuel levy whose proceedswould accrue entirely to the national road fund. There will also be a needfor changes to the 1980 Law on Roads in order to provide the legal basisfor, or otherwise to accommodate, the establishment of national andprovincial road funds and related institutional changes.
MSRI has indicated its strong support for the road fund concept andproposes amending the Law on Roads to provide a suitable enablingframework. ‘Socialization’ has already commenced in several provinces,and there are plans to commence preparation of a pilot scheme shortly.But there is still a long way to go. In particular, there is opposition in somequarters to the principle of the PKB and PBBKB being treated as road usercharges and allocated to finance a system of road funds. Moreover regionsthat have high revenues from PKB and PBBKB are likely to be averse to anypooling.
The next steps will therefore need to involve further development of theconcept, preparation of a comprehensive and detailed implementationplan, coupled with intensive efforts to build understanding of the benefits.The DGRI Road Funds study identified and evaluated alternative modelsfor a system of road funds in Indonesia, with the most promising optioninvolving a combination of national and provincial road funds. Provincialroad funds in each province would fund the rehabilitation and maintenanceof national roads, acting as deconcentrated agents of central government,and of provincial roads. Within this framework, the primary function ofthe national road fund would be to adjust the balance between the revenuesand expenditure needs of individual provincial funds. While the MSRIwill need to keep playing a key role in further defining the road fundconcept, it is not well positioned, as a sector technical ministry, to identify,guide and coordinate all of the many actions required. There would seemto be a strong case for assigning this role to Government’s minister-levelKKPPI committee, with its road sector sub-committee committee acting asthe focal point in close consultation with other stakeholders.
Improve the Allocation of Road ExpendituresResponsibility for road maintenance should, as mentioned above, beallocated to a combination of national and provincial road funds. Theprovincial funds should provide transfers to participating kabupatenadministrations to finance rehabilitation and maintenance of their networks,subject to them adopting and applying sound road management practices.
Establishing a sound governance framework for the road funds is critical inorder to improve the allocation of expenditures for maintenance work.
The task of managing funds for road preservation should be handled byboards with legally defined powers and obligations that operates at arm’slength from government. The majority of board members should representstakeholders other than government (e.g. industrial, agricultural andcommercial associations, aspects of civil society, passenger and freighttransport organizations; and key government departments), and decision-making should be insulated from political interference. Having road usersmore directly involved in the funding and management of the road systemcreates a sense of ownership and a concern for value for money that inturn pressures road agencies to become more efficient, accountable andtransparent. The Provincial Roads Boards should be responsible for thestrategic oversight of all the roads in the Province (National, Provincialand kabupaten) down to, but not including, the desa level, while theNational Roads Board should maintain an oversight for national policyissues and will provide for coordination between the Provincial RoadsBoards.
The road agencies should use the IIRMS planning and managementprocedures to assess needs and determine priorities for allocation of funds.They should have updated maintenance programs, which take into accountprevailing constraints of finance and capacity. Design, civil works, andworks supervision should be tendered by the road agencies, as should alsothe collection of data (road condition, traffic, vehicle loading). Agenciesshould be required to report to the Boards on the management of thenetwork and arrange for independent auditing.
As far as network expansion is concerned, a soundly prioritized pipelineof economically justified projects needs to be prepared based on an agreedstrategic network development plan. The JARNS study has provided anevaluation of priorities for Java but the approaches and procedures developednow need to be institutionalized, with the data bases being maintainedand refined and coverage being extended to other regions.
For this purpose DGRI should establish a permanent strategic road networkplanning unit whose duties should include:
• maintaining and further developing the network / link planning andevaluation systems developed under JARNS and extending theirapplication to relatively heavily trafficked regions outside Java;
• developing and maintaining a primary arterial road network plan,including a plan for toll road network development, so as to providethe basis for the programming and budgeting of capacity expansionworks and for assessing the viability of investments in toll roads;
• carrying out detailed technical, economic and financial feasibility studiesof specific capacity expansion and major network extension proposals,including for limited access expressways proposed for development astoll roads.
Ensure that Road Works Yield Better Valuefor MoneyOnce road funds are in place, the function of funds management needs tobe clearly distinguished from that of works and services implementation.
186 Averting an Infrastructure Crisis: A Framework for Policy and Action
Road and Road Transport
The road funds should act as a purchaser of works and services and shouldpromote the effective competition needed to push down prices and improvequality of works and services. Reporting arrangements must provide theinformation needed for independent assessments of performance, andindependent technical and financial audits should become mandatory.
In addition, actions and incentives to improve the efficiency of works andservices should be encouraged and put in place. A more balanced share ofrisk between contractor and client, or transfer of risk to the contractor,would reduce the indirect costs being incurred through inadequate quality.Further consideration needs to be given to the implementation of output-based contracting (in which payments are made only when the workpasses technical audit and extended warranty periods may be included).The possibility of introducing multi-year performance-specified contracting(in which a contractor fully maintains a road or sub-network over severalyears to specified performance standards) is also worth a trial. MSRI and anumber of provinces have shown strong interest in proceeding with pilotschemes but these have not yet progressed due to problems in securingagreement to making multi-year budget commitments. The success of suchapproaches depends on internal discipline and project management bythe contractor, and rigorous and impartial evaluation and monitoring bythe client of the contractor’s achievements, exerting control through thepayment schedule. For the initial trials, a good governance environmentshould be selected and, for the performance-specified contracts, a mediumperiod of 3 to 5 years will allow opportunity for review and refinement ofthe approach before broader dissemination.
Increase Efficiency of Road Network UseAddress the Issue of Vehicle OverloadingReduction of vehicle overloading remains a top priority, and a pilot projectinvolving several roadside weighbridges now being developed by MOCmerits careful monitoring. The project will upgrade the weighbridges,including by the addition of secure in-ground weigh-in-motion equipmentthat will enable reliable monitoring of axle loads. Weighbridge operationwill be contracted out, and an incentive structure will be established withthe WIM system providing the basis on which to measure performance.Government’s efforts must be actively supported by a freight transportindustry that wishes to eliminate the damaging practice of over loadingamongst its members, so awareness must be raised concerning the massivecosts which are inflicted by overloaded vehicles in terms of excessive roaddamage.
Improve Road Infrastructure UseIn a decentralized environment under which central government’s powersare quite limited, increased attention will need to be given to buildingawareness of the public and private costs of inefficient use of the roadnetwork, to working with progressive regional governments to pilotimprovements, and to publicizing successes so as to encourage their wideradoption.
Continued efforts should be made to improve traffic management andpublic transport licensing and to reduce roadside friction caused by marketsand other commercial activities. These will reduce congestion at low cost,but will require effective consultation with stakeholders. Publicizing a fewsuccess stories would put pressure on other governments to follow suit.For new roads such as urban bypasses, restrictions should be placed onfrontage development so as to enable them to serve their intended function.
Improve Road SafetyThe Government embarked on a comprehensive program to address roadsafety problems in 1980. The more important achievements includeenforcing use of helmets by motor cyclists, implementing sound remedialworks at major accident black spots, and eliminating the movement of ISOcontainers on rigid trucks. However, overall progress in most areas hasbeen very limited and the successes few.
In the near term, the most cost effective initiatives for traffic safetyimprovement will likely continue to be remedial measures at accidentblack-spots. The recently adopted accident reporting (3L) system needs tobe implemented rapidly so as to improve information on the location,causes and consequences of accidents. Attention should also be given toimproving road safety education, including through finalizing andpublishing the draft highway code developed by MOC in the mid-1990s.
Improving driver testing, vehicle inspection, and traffic regulationenforcement remain important priorities, but the pressures for this willneed to come increasingly from the public rather than from centralGovernment. Operators who appreciate the commercial benefits (as wellas the social) of employing good practice to ensure safe and cost effectivetransport will have a strong incentive to support education and enforcementactivities which are designed to encourage all operators to adopt safepractice. Central Government can potentially play an important role inbenchmarking the performance of the regions, although this will requirecareful planning and preparation and sound data. Consideration shouldagain be given to the possibility of establishing a national road safetycouncil so as to help promote public awareness and coordinate the activitiesof the many agencies and boards with traffic safety-related responsibilities.
Strengthen Institutional and Legal FrameworkStrengthening the Institutional and RegulatoryFramework for Toll RoadsIt is vital to strengthen the institutional and regulatory environment inorder to revitalize private participation. GOI has recognized the need toamend the framework for toll roads and proposals for an improved structureare now being developed. The overarching goal is to attract substantialprivate investment on reasonable terms and with an appropriate sharing ofrisks in a manner that contributes to the achievement of overall sector andregional development goals. Efforts for reform should be focused on thefollowing specific measures:
• Enable Jasa Marga to operate as a commercially viable company byseparating its regulatory and operating roles;
• Establish a national Indonesian Toll Road Authority, empowered toproduce, procure and enter into concession agreements with thirdparties with the full backing of government;
• Enable the automatic adjustment of toll rates based on an appropriatelystructured formula;
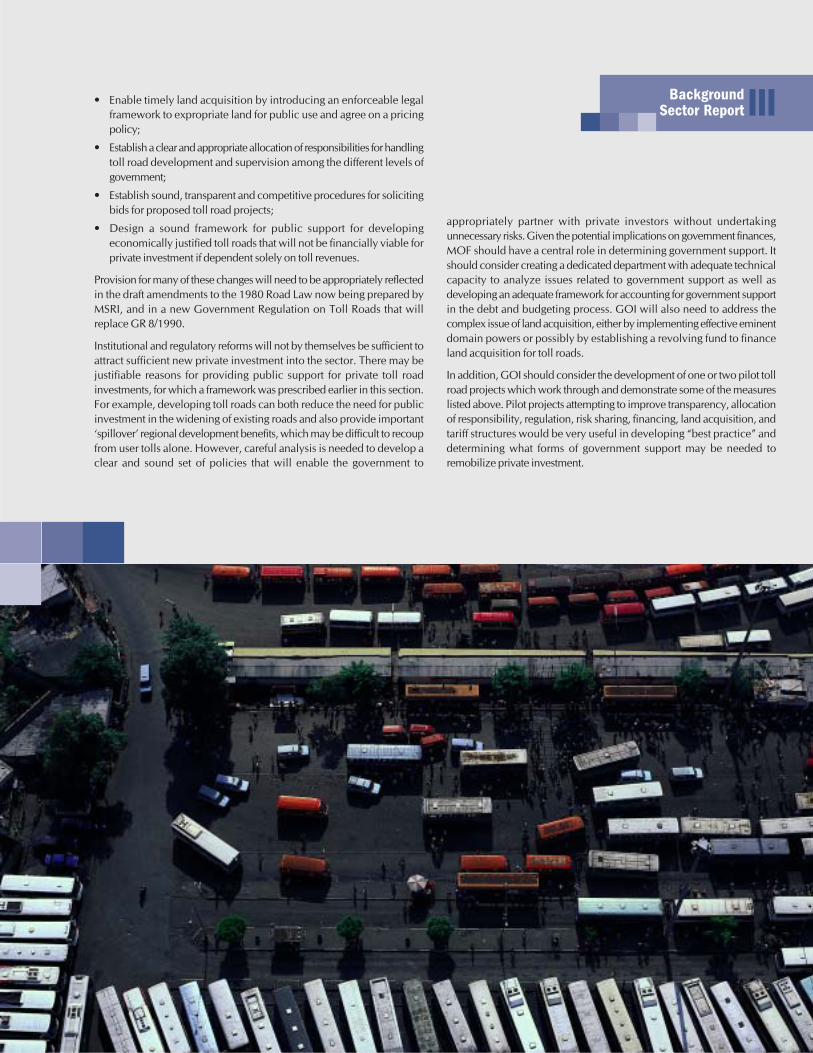
187
BackgroundSector Report III• Enable timely land acquisition by introducing an enforceable legal
framework to expropriate land for public use and agree on a pricingpolicy;
• Establish a clear and appropriate allocation of responsibilities for handlingtoll road development and supervision among the different levels ofgovernment;
• Establish sound, transparent and competitive procedures for solicitingbids for proposed toll road projects;
• Design a sound framework for public support for developingeconomically justified toll roads that will not be financially viable forprivate investment if dependent solely on toll revenues.
Provision for many of these changes will need to be appropriately reflectedin the draft amendments to the 1980 Road Law now being prepared byMSRI, and in a new Government Regulation on Toll Roads that willreplace GR 8/1990.
Institutional and regulatory reforms will not by themselves be sufficient toattract sufficient new private investment into the sector. There may bejustifiable reasons for providing public support for private toll roadinvestments, for which a framework was prescribed earlier in this section.For example, developing toll roads can both reduce the need for publicinvestment in the widening of existing roads and also provide important‘spillover’ regional development benefits, which may be difficult to recoupfrom user tolls alone. However, careful analysis is needed to develop aclear and sound set of policies that will enable the government to
appropriately partner with private investors without undertakingunnecessary risks. Given the potential implications on government finances,MOF should have a central role in determining government support. Itshould consider creating a dedicated department with adequate technicalcapacity to analyze issues related to government support as well asdeveloping an adequate framework for accounting for government supportin the debt and budgeting process. GOI will also need to address thecomplex issue of land acquisition, either by implementing effective eminentdomain powers or possibly by establishing a revolving fund to financeland acquisition for toll roads.
In addition, GOI should consider the development of one or two pilot tollroad projects which work through and demonstrate some of the measureslisted above. Pilot projects attempting to improve transparency, allocationof responsibility, regulation, risk sharing, financing, land acquisition, andtariff structures would be very useful in developing “best practice” anddetermining what forms of government support may be needed toremobilize private investment.
188 Averting an Infrastructure Crisis: A Framework for Policy and Action
Road and Road Transport
Table III.14. The Way Forward
Issue Steps for the Short Term (0-2 years) Steps for the Medium Term (up to 5 years)
Expansion and extension • Adopt and initiate preparation of a program of priority • Increase road development budget allocation from IDR 0.5 trof the road network feasible road capacity expansion and construction projects to IDR 1.0 tr by 2007 and sustain that through 2010.
for Java. • Implement capacity expansion and construction program.• Study and forecast capacity needs for other regions and • Audit (technically and financially) expansion program.
networks• Determine and plan financing for medium-term program
within national development budget, and foreign finance
Increase access to remote areas • Clarify process for identifying provincial priorities forextending road network
• Establish criteria for central government support forextending road network
Stable sustainable financing • Establishment of a fuel levy (amend Law 18/1997) • Progressive increase of fuel levy to about IDR 140 / L.for road asset preservation • Dedication of fuel levy and road licence fee to road • Allocation of fuel levy to a national road fund.
expenditures and separation from wealth tax element • Pilot allocation of vehicle registration tax (PKB) to a provincial(amend Law 34/2000) fund in a pilot Province.
• Legislation enabling establishment of national and provincial • Establishment and operation of national road fund androad funds (amend 1980 Law on Roads) board.
• Socialization of RUC concept nationally and provincially, • Establishment, operation and assessment of pilot provincialand selection of pilot Province. road fund and boards.
• Detailed design of pilot road fund and oversightarrangements.
Improve allocation • Improve use of IIRMS programming tool at national and • Base allocation of road program budgets on results ofof road expenditures provincial level planning and programming tools
• Establish a permanent strategic road network planning unit. • If allocations at sub-national levels have become more• Develop operational toolkit on planning and programming efficient, accelerate reduction of backlog on Provincial and
methods, for pilot road fund board District roads• Conduct training on road programming tools with provincial • Review experience with sub-national block grants and pilot
and local government road officials road fund, recommend sub-national road managementmodel and adopt it.
Improve value-for-money • Intensify training in project and contract management, and • Expand use of computerized tools to improve efficiency andof road works focus accountability on project manager. link promotion to performance for project managers.
• Conduct independent technical audits on contracts, act on • Include performance history in contractors’ pre-qualificationfindings and publish results evaluation, and introduce computerized prequalification
• Increase transparency and efficiency in procurement, procedureexpanding use of ICT to publish projects, bid results, awards • Publish statistics on average costs of works against targetand performance trends and compare with external benchmark values.
• Require and enforce quality management plans from • Implement program of area-based and performancecontractors under the Quality Assurance system -specified multi-year contracts.
• Initiate pilot trials of multi-year performance-specifiedcontracts.
Adopting the Necessary Legal and InstitutionalReformsThe passage of the laws on regional autonomy makes it necessary toamend or replace Law 13/1980 on Roads and Law 14/192 on Road Trafficand Transport to reflect the greatly altered allocation of responsibilitiesbetween the different levels of government. Both laws also need to beamended to provide a more conducive framework for private participation.For the Road Law particular attention needs to be given to establishing animproved framework for the development and operation of toll roads, andto creating the legal basis for the introduction of road funds.
MSRI is already far advanced with the drafting of an amendment to theRoad Law while MOC has already embarked on the drafting of a newRoad Traffic and Transport Law. Before this is finalized and submitted tothe DPR it is recommended that a roads and road traffic and transportsector blueprint be prepared. This would provide a comprehensive roadmap for the sector’s development over the medium term and should showhow the proposed legal changes would fit with and support proposedpolicy and institutional reforms. The KKPPI Roads Steering Committeeshould take the lead in coordinating the preparation of this blueprint andin ensuring that the proposed legal changes are in line with this.
Over the last two decades corporatization of state enterprises, privateparticipation in infrastructure provision, and decentralization havedramatically changed the landscape of the transport sector, and hence therole and tasks of central government. While there have been consequentchanges in the structure and staffing of some ministries, including forexample the transformation of the Ministry of Public Works into theMinistry of Settlements and Regional Infrastructure, others including MOChave changed relatively little so far.
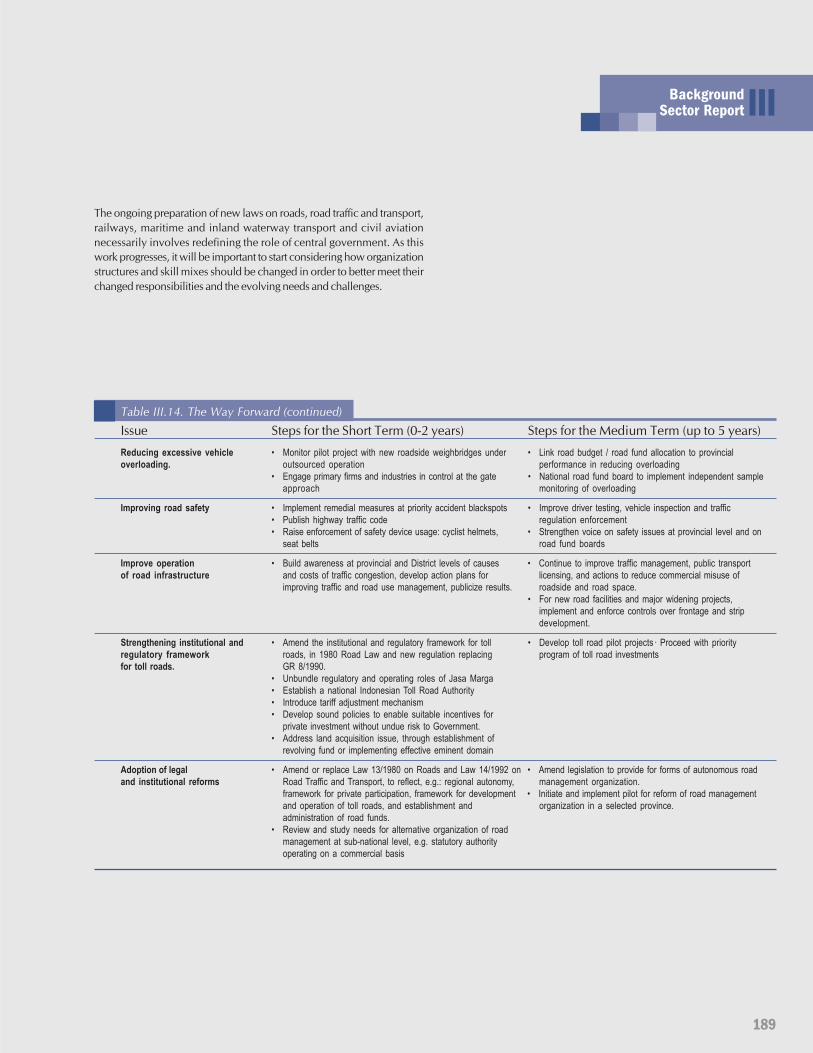
189
BackgroundSector Report III
Table III.14. The Way Forward (continued)
Issue Steps for the Short Term (0-2 years) Steps for the Medium Term (up to 5 years)
Reducing excessive vehicle • Monitor pilot project with new roadside weighbridges under • Link road budget / road fund allocation to provincialoverloading. outsourced operation performance in reducing overloading
• Engage primary firms and industries in control at the gate • National road fund board to implement independent sampleapproach monitoring of overloading
Improving road safety • Implement remedial measures at priority accident blackspots • Improve driver testing, vehicle inspection and traffic• Publish highway traffic code regulation enforcement• Raise enforcement of safety device usage: cyclist helmets, • Strengthen voice on safety issues at provincial level and on
seat belts road fund boards
Improve operation • Build awareness at provincial and District levels of causes • Continue to improve traffic management, public transportof road infrastructure and costs of traffic congestion, develop action plans for licensing, and actions to reduce commercial misuse of
improving traffic and road use management, publicize results. roadside and road space.• For new road facilities and major widening projects,
implement and enforce controls over frontage and stripdevelopment.
Strengthening institutional and • Amend the institutional and regulatory framework for toll • Develop toll road pilot projects· Proceed with priorityregulatory framework roads, in 1980 Road Law and new regulation replacing program of toll road investmentsfor toll roads. GR 8/1990.
• Unbundle regulatory and operating roles of Jasa Marga• Establish a national Indonesian Toll Road Authority• Introduce tariff adjustment mechanism• Develop sound policies to enable suitable incentives for
private investment without undue risk to Government.• Address land acquisition issue, through establishment of
revolving fund or implementing effective eminent domain
Adoption of legal • Amend or replace Law 13/1980 on Roads and Law 14/1992 on • Amend legislation to provide for forms of autonomous roadand institutional reforms Road Traffic and Transport, to reflect, e.g.: regional autonomy, management organization.
framework for private participation, framework for development • Initiate and implement pilot for reform of road managementand operation of toll roads, and establishment and organization in a selected province.administration of road funds.
• Review and study needs for alternative organization of roadmanagement at sub-national level, e.g. statutory authorityoperating on a commercial basis
The ongoing preparation of new laws on roads, road traffic and transport,railways, maritime and inland waterway transport and civil aviationnecessarily involves redefining the role of central government. As thiswork progresses, it will be important to start considering how organizationstructures and skill mixes should be changed in order to better meet theirchanged responsibilities and the evolving needs and challenges.
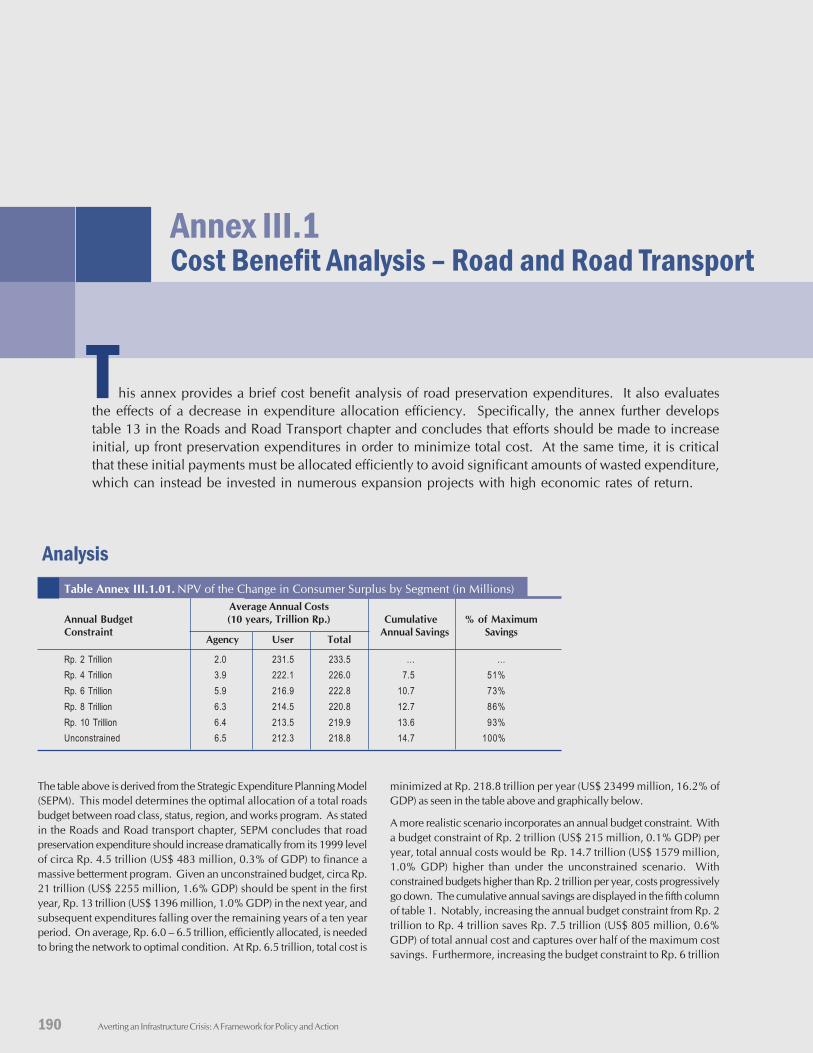
Averting an Infrastructure Crisis: A Framework for Policy and Action190
Annex III.1Cost Benefit Analysis – Road and Road Transport
his annex provides a brief cost benefit analysis of road preservation expenditures. It also evaluatesthe effects of a decrease in expenditure allocation efficiency. Specifically, the annex further developstable 13 in the Roads and Road Transport chapter and concludes that efforts should be made to increaseinitial, up front preservation expenditures in order to minimize total cost. At the same time, it is criticalthat these initial payments must be allocated efficiently to avoid significant amounts of wasted expenditure,which can instead be invested in numerous expansion projects with high economic rates of return.
T
Analysis
The table above is derived from the Strategic Expenditure Planning Model(SEPM). This model determines the optimal allocation of a total roadsbudget between road class, status, region, and works program. As statedin the Roads and Road transport chapter, SEPM concludes that roadpreservation expenditure should increase dramatically from its 1999 levelof circa Rp. 4.5 trillion (US$ 483 million, 0.3% of GDP) to finance amassive betterment program. Given an unconstrained budget, circa Rp.21 trillion (US$ 2255 million, 1.6% GDP) should be spent in the firstyear, Rp. 13 trillion (US$ 1396 million, 1.0% GDP) in the next year, andsubsequent expenditures falling over the remaining years of a ten yearperiod. On average, Rp. 6.0 – 6.5 trillion, efficiently allocated, is neededto bring the network to optimal condition. At Rp. 6.5 trillion, total cost is
Table Annex III.1.01. NPV of the Change in Consumer Surplus by Segment (in Millions)Average Annual Costs
Annual Budget (10 years, Trillion Rp.) Cumulative % of MaximumConstraint
Agency User TotalAnnual Savings Savings
Rp. 2 Trillion 2.0 231.5 233.5 … …Rp. 4 Trillion 3.9 222.1 226.0 7.5 51%Rp. 6 Trillion 5.9 216.9 222.8 10.7 73%Rp. 8 Trillion 6.3 214.5 220.8 12.7 86%Rp. 10 Trillion 6.4 213.5 219.9 13.6 93%Unconstrained 6.5 212.3 218.8 14.7 100%
minimized at Rp. 218.8 trillion per year (US$ 23499 million, 16.2% ofGDP) as seen in the table above and graphically below.
A more realistic scenario incorporates an annual budget constraint. Witha budget constraint of Rp. 2 trillion (US$ 215 million, 0.1% GDP) peryear, total annual costs would be Rp. 14.7 trillion (US$ 1579 million,1.0% GDP) higher than under the unconstrained scenario. Withconstrained budgets higher than Rp. 2 trillion per year, costs progressivelygo down. The cumulative annual savings are displayed in the fifth columnof table 1. Notably, increasing the annual budget constraint from Rp. 2trillion to Rp. 4 trillion saves Rp. 7.5 trillion (US$ 805 million, 0.6%GDP) of total annual cost and captures over half of the maximum costsavings. Furthermore, increasing the budget constraint to Rp. 6 trillion
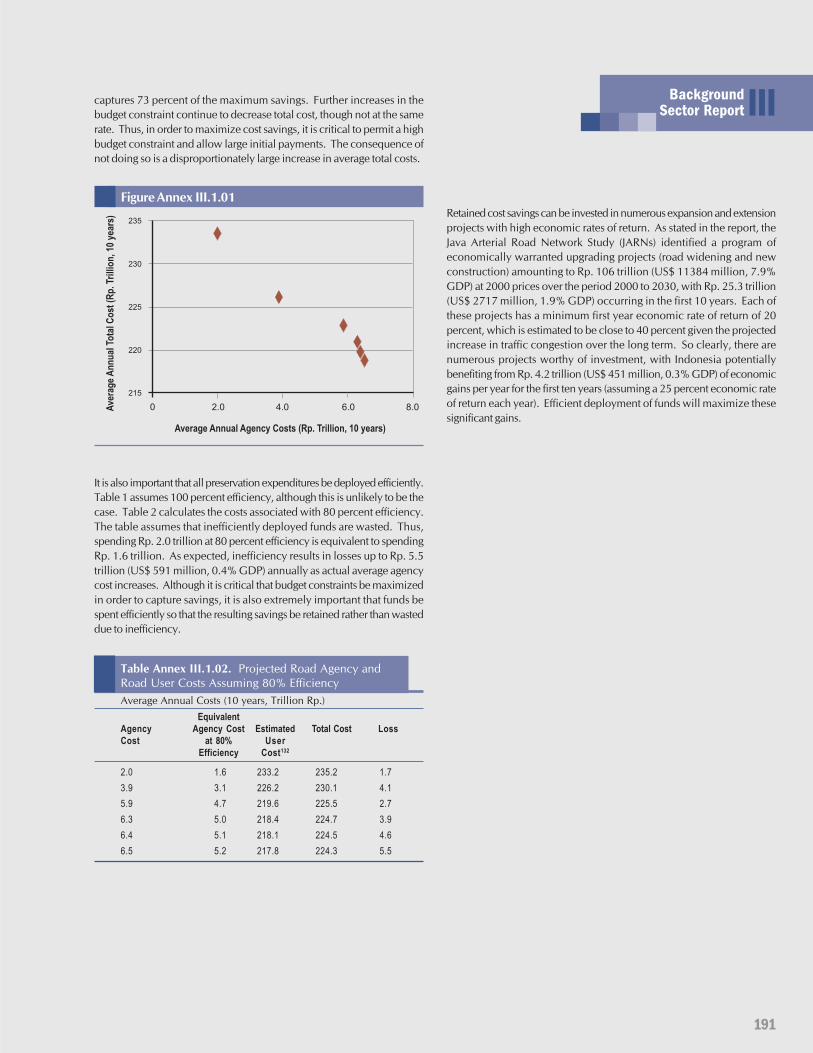
191
BackgroundSector Report III
Ave
rag
eA
nn
ual
Tota
l Co
st(R
p. T
rilli
on
, 10
year
s)
0
215
220
225
230
235
2.0
Average Annual Agency Costs (Rp. Trillion, 10 years)
4.0 6.0 8.0
captures 73 percent of the maximum savings. Further increases in thebudget constraint continue to decrease total cost, though not at the samerate. Thus, in order to maximize cost savings, it is critical to permit a highbudget constraint and allow large initial payments. The consequence ofnot doing so is a disproportionately large increase in average total costs.
Figure Annex III.1.01
It is also important that all preservation expenditures be deployed efficiently.Table 1 assumes 100 percent efficiency, although this is unlikely to be thecase. Table 2 calculates the costs associated with 80 percent efficiency.The table assumes that inefficiently deployed funds are wasted. Thus,spending Rp. 2.0 trillion at 80 percent efficiency is equivalent to spendingRp. 1.6 trillion. As expected, inefficiency results in losses up to Rp. 5.5trillion (US$ 591 million, 0.4% GDP) annually as actual average agencycost increases. Although it is critical that budget constraints be maximizedin order to capture savings, it is also extremely important that funds bespent efficiently so that the resulting savings be retained rather than wasteddue to inefficiency.
Table Annex III.1.02. Projected Road Agency andRoad User Costs Assuming 80% EfficiencyAverage Annual Costs (10 years, Trillion Rp.)
EquivalentAgency Agency Cost Estimated Total Cost LossCost at 80% User
Efficiency Cost132
2.0 1.6 233.2 235.2 1.73.9 3.1 226.2 230.1 4.15.9 4.7 219.6 225.5 2.76.3 5.0 218.4 224.7 3.96.4 5.1 218.1 224.5 4.66.5 5.2 217.8 224.3 5.5
Retained cost savings can be invested in numerous expansion and extensionprojects with high economic rates of return. As stated in the report, theJava Arterial Road Network Study (JARNs) identified a program ofeconomically warranted upgrading projects (road widening and newconstruction) amounting to Rp. 106 trillion (US$ 11384 million, 7.9%GDP) at 2000 prices over the period 2000 to 2030, with Rp. 25.3 trillion(US$ 2717 million, 1.9% GDP) occurring in the first 10 years. Each ofthese projects has a minimum first year economic rate of return of 20percent, which is estimated to be close to 40 percent given the projectedincrease in traffic congestion over the long term. So clearly, there arenumerous projects worthy of investment, with Indonesia potentiallybenefiting from Rp. 4.2 trillion (US$ 451 million, 0.3% GDP) of economicgains per year for the first ten years (assuming a 25 percent economic rateof return each year). Efficient deployment of funds will maximize thesesignificant gains.
Averting an Infrastructure Crisis: A Framework for Policy and Action192
IVse
ct
or
Water Supply and Sanitation
193
IVBackgroundSector Report
The water and sanitation sectors are in a state of crisis, undeniably amongst the weakest sectors inIndonesia. The inadequacy of service delivery in the sector in recent years has had significant
impacts on human development outcomes. The most compelling indicator of the problems in thesector is the high incidence of typhoid, invariably amongst the poorer sections of society. No othercountry in the region with a GNI per capita of US$710 (2002) finds itself in this situation.
Urban activity is at the heart of economic growth in Indonesia and water and sanitation services areparticularly critical to the development of productive cities throughout the country. Over the lastdecade, the urbanization process has become a key determinant of the future structure of water andsanitation policy and investment. Although the current urban population is estimated at 40% of thetotal, at the current rate of growth133 it is expected to reach about 60% by 2025, and the delivery ofsafe and adequate water and sanitation services to this growing population, many of whom are poor,will need to be prioritized by government.
While the picture of water and sanitation is disturbing, there has been significant progress in generatingawareness and capacity for water and sanitation policy-making over recent years and the potential ofchange lies in the hands of all stakeholders. The new opportunities created by the implementation ofthe 2001 decentralization agenda, mean that the water and sanitation sector is at a turning point.
194 Averting an Infrastructure Crisis: A Framework for Policy and Action
Water Supply and Sanitation
Water SupplyApproximately 85 million people live in the service areas of water utilities(PDAMs), of which only about 35% are served through 5.25 millionconnections. This makes up approximately 17% of the total population.Almost 5 years after the economic crisis, there is evidence that publicly-funded water supply systems have deteriorated and service quality hasfallen. New investments have been postponed and the lack of adequatemaintenance is causing systems throughout the country to fall into disrepair.Some 221 PDAMs (out of 307) hold more than 400 outstanding loanswith MOF, with about 63% of these in arrears or in default. MOF hasaccrued $500 million in debt as a result.134 Tariffs are well below costrecovery levels ($0.08 per cubic meter) and the sector is estimated to bemaking losses of about Rp. 100 billion per year excluding depreciationand rural investment. Unaccounted for water is over 40% across thesector.
In the absence of effective delivery by government agencies, two significantareas of activity have developed and are key to a practical understanding ofhow people get water services in Indonesia today. The first of these is selfprovisioning – be it by communities in a collective delivery system, or byindividuals developing access to water services at the household level. Thesecond area of activity occurs in the informal sector through alternativeprovision. Small-scale private water providers interface with both PDAMsand self-suppliers by distributing PDAM water (illegally) and by providingtechnical support to households and communities to access waterthemselves. Together these are the more common forms of supply, reachingas much as 50% in smaller cities. In rural areas, utility provision is as lowas 11% while community and self-provision total around 88%. This impliesthat over 100 million rural people are providing water for themselves.
In this context, the main objective in the water sector is to increase accessand sustainability of service delivery. In order to do so, a number ofconcerns need to be addressed. First, PDAMs are hindered by financial,political, and institutional blockages and it is necessary to establish howexisting PDAMs will be transformed into efficient and viable utilities. It isalso vital that coverage is extended to meet significant, growing urbandemand, and there is a key question as to how formal utilities can bedeveloped to meet these requirements. Second, it is necessary to developbetter understanding of the role played by small-scale private waterproviders, and to establish mechanisms that optimize the contributionthey can make. Third, it is now necessary to bring about theinstitutionalization and replication of community-managed models and tosolve some of the legislative and policy blockages hindering theirsustainability; and in view of significant levels of household provision, it isnecessary to work out how to address the serious risks associated withwater quality and sustainability even in the short term. Lastly, the lack of anenabling framework for this multi-provider market means that action needsto be taken to optimize the opportunities that are there, to regulate providers,and ensure that delivery is pro-poor.
SanitationThe lack of institutions and investment in the sanitation sector create asituation that is one of the greatest challenges for service delivery in thecountry. There is virtually no formal institutional structure for sanitation inIndonesia: there is no ministry at the national level responsible for sanitationpolicy or designated to lead a national sanitation campaign; and localgovernments requires greater clarity of their roles.
Levels of investment in sanitation have been negligible for some time.Indonesia has one of the lowest rates of urban sewerage coverage in Asia.Less than 10 cities have some form of network sewerage and these reach asfew as 1.3% of the urban population. Cost recovery of sanitation isconsequently an undeveloped matter.
Due to the lack of any formal (public or private) networks and infrastructure,households and small-scale operators provide the majority of services,including installation and removal. Currently 73% of urban householdsare estimated to have on-site sanitation, mostly in the form of septic tanks,many of which are not functioning effectively. However, self-provisioningby households has not been accompanied by complementary ‘public good’investments in drainage, septage collection and disposal and the lack ofadequate, functioning public facilities, or even oversight and regulation bylocal government, means that proper disposal is rare. Most sewerage findsits way into open access resources such as rivers or canals. Widespreadcontamination of surface and ground waters across the country has resultedin repeated local epidemics and a high incidence of fecal-borne disease aswell as severe environmental impacts. Economic losses attributed toinadequate sanitation services are estimated at US$6.8 billion per year and2.4% of 2001 GDP, roughly equivalent to US$12 per household permonth.135 Urgent action is required to avoid the continued impact onhealth, environmental and economic impacts for decades to come.
The key issues facing the sanitation sector are threefold. First, a lack ofpolitical will and commitment in government at all levels to improvedsanitation contributes to the lack of access and worsening environmentalpollution characterizing the sanitation sector. Second, the lack of a policyframework and institutional responsibility for policy and implementationis central to the sanitation crisis. There is an urgent need for a formal urbansanitation policy that identifies and sets priorities, sets out the legal andregulatory framework, and defines a strategy that links the household,community, and city-wide issues into a comprehensive framework. Lastly,it is necessary to consider the constraints and opportunities for financingthe sanitation sector effectively and thereby address the severe deficiencyof infrastructure and facilities in cities. The lack of government activitymust be addressed together with the blockages and problems associatedwith the services provided by small-scale private enterprise, communitiesand by households themselves.
The Way ForwardThe strategic framework for action suggests that the focus of efforts in thewater sector over the next five years should be to address the specific issuesof each form of provision, while also providing an overall enablingframework to revitalize the sector. This enabling framework shouldformulate a comprehensive policy and legislative framework, reviseallocation of responsibilities, and move towards predictable, cost recoverytariffs. With regards to the forms of provision, a program should be launchedto establish efficient and viable utilities (critically important to meet growing
195
IVBackgroundSector Report
urban demand), to capitalize on the role of alternative providers, toencourage community-managed provision, and address the sustainabilityand quality of household self-provision.
The sanitation sector presents such an extensive and untackled problem togovernment in Indonesia that there is not always consensus as to whatshould be done. The solutions to the sanitation crisis will inevitably involveall forms of provision, and will also need to place government, independentproviders, communities, and householders in a regulated multi-providerframework. Incentives for performance and for investment need to beimplemented along with sanctions that hold local government accountablethrough existing legislation. Urgent efforts are needed to develop a nation-wide sanitation campaign and prescribe a new active role for localgovernment in sanitation service delivery. With this in hand, it is necessaryto look at the mechanisms to: inject finance, improve regulation of on-sitesanitation especially in urban areas, enhance community sanitation initiativesand capitalize on, and regulate, activities by private small-scale providers.
One of the fundamental problems of describing these sectors in Indonesiais the inconsistency of the data available through a vast range of reportsand assessments. Although specific initiatives have started filling data gapsin specific areas, there is an urgent need to compile a comprehensive set ofdata and to keep it relevant and updated. This is vital to inform thedevelopment of policy and legislation that is relevant to market forces anduser demands. The data provided in this document is estimated and isoften qualified to present the actual situation on the ground.
World Bank AssistanceSince 1975, the World Bank has supported up to US$ 2.45 billion in loansfor 24 urban development and water supply projects. They have introducedpiped water services to many medium and small size towns, and financedexpansion of water networks in major cities.
Since 1991, the World Bank financed water and sanitation investmentshave formed part of the Integrated Urban Infrastructure DevelopmentProject (IUIDP) approach. Whilst these projects have contributed towardsgreater local government participation in the management of urbandevelopment and its infrastructure, there has been a lack of focus on otherimportant sector issues, such as operational efficiency and financial viabilityof PDAMs, institutional reform and capacity building.
Starting with the Water Supply and Sanitation for Low-income Communitiesproject (WSSLIC 1), in 1994, community-based approaches establishedservice delivery decisions based on consumer demand – indicated bycommunity willingness to contribute a fixed portion of construction costs,and responsibility for operations and maintenance costs. Consulting poorcommunities, offering them the freedom to choose service types and levelsand transferring funds to them for managing construction were featuresintroduced in infrastructure development projects such as VIP and KDP inthe mid-1990s. Technical assistance to help communities make moreinformed choices from among alternatives were further added in VIP andWSSLIC 2.
To respond to institutional issues, after 1999 a number of new sectorinitiatives were introduced. The Water Sector Adjustment Loan (WATSAL)was launched to provide budgetary assistance to the GoI to improve thenational policy, legal, institutional and decision-support framework forwater resources development and management. With the assistance of theWorld Bank and ASEM Trust Fund, the Financial Recovery Action Plan(FRAP) was developed in 17 PDAMs under a PDAM Rescue Program overthe period 2000-2002. PPIAF has also supported the development of a
Benchmarking System implemented by PERPAMSI, the ProfessionalAssociation of Indonesia Water Utilities, to gauge the performance ofPDAMs.
Consistent with the recent Country Assistance Strategy for Indonesia, whichprioritized good corporate governance and efficiency in water supply andimproved access to basic water and sanitation services, especially to thepoor, for the next four years (2004-2007), the World Bank will continueits dialogue with the GoI on water and sanitation sector reform, and willsupport new lending and non-lending operations.
One of the first sector operations will be the Urban Water and SanitationImprovement and Expansion Project, which aims to improve water andsanitation services by strengthening local water utilities to becomeoperationally-efficient and financially-sustainable. This loan will also besupported by the World Bank Institute/PERPAMSI twinning program aimedat strengthening communication and information services of PERPAMSIand PDAMs, promoting PDAM benchmarking and performancemonitoring/improvement, and upgrading the PERPAMSI Education andTraining Foundation.
PART A: WATER SUPPLYPolicy and Institutional Framework(Water)Legislative and Regulatory FrameworkIn April 1999, the Government of Indonesia formulated the Letter ofSector Policy and Policy Reform Matrix, which formed the basis of theIndonesian Water Sector Adjustment Loan (WATSAL) from the WorldBank. This was intended to start a process of major institutional reform,including policy, legal, organizational and financing aspects.
The comprehensive policy framework currently before parliament locatespolicies for water supply and sanitation under the umbrella of waterresources. The WASPOLA working group, comprised of members fromBAPPENAS, KIMPRASWIL and others136 has agreed a national policydocument to govern community-provision and is in the preliminary stagesof producing a framework for utility-provision. In this policy frameworkthere is an emphasis on water as an economic and public good. Despitethese planning efforts, the realization of sector reform is urgent. For anysubstantive improvements to be made in the sector it is necessary to finalizethe policy framework, to better understand and enforce the roles andresponsibilities of key agencies and to address the limitations of thelegislative and regulatory framework.
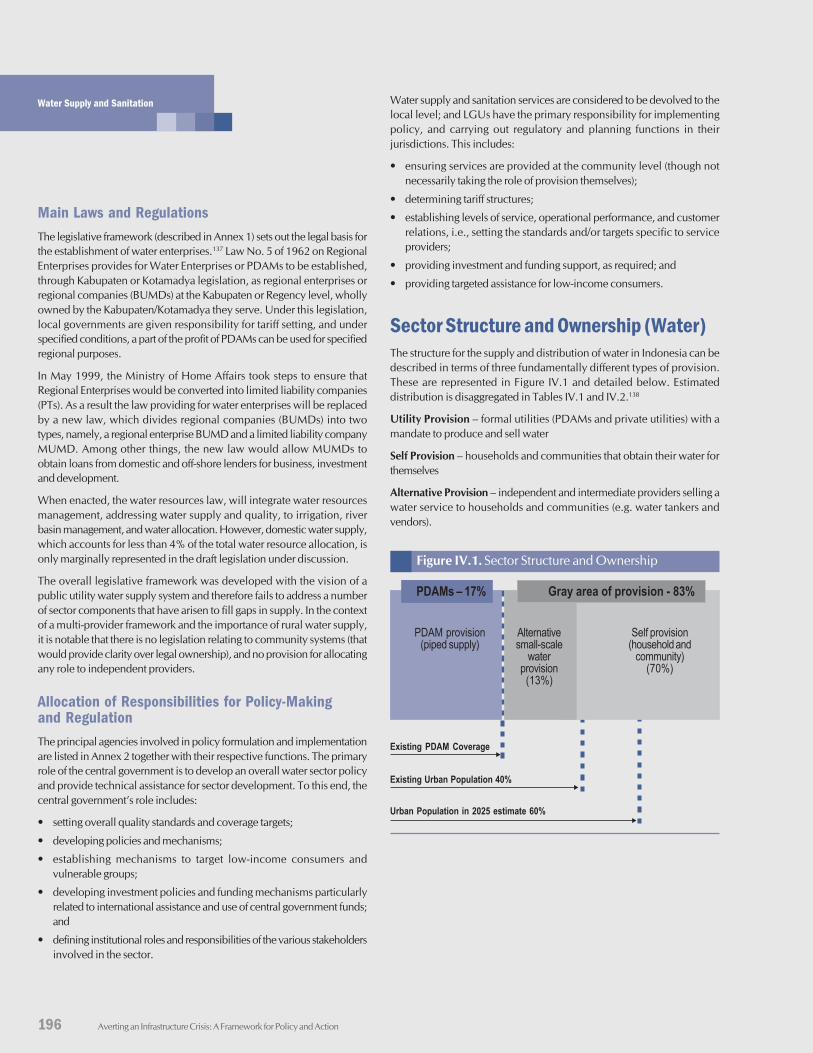
196 Averting an Infrastructure Crisis: A Framework for Policy and Action
Water Supply and Sanitation
Main Laws and RegulationsThe legislative framework (described in Annex 1) sets out the legal basis forthe establishment of water enterprises.137 Law No. 5 of 1962 on RegionalEnterprises provides for Water Enterprises or PDAMs to be established,through Kabupaten or Kotamadya legislation, as regional enterprises orregional companies (BUMDs) at the Kabupaten or Regency level, whollyowned by the Kabupaten/Kotamadya they serve. Under this legislation,local governments are given responsibility for tariff setting, and underspecified conditions, a part of the profit of PDAMs can be used for specifiedregional purposes.
In May 1999, the Ministry of Home Affairs took steps to ensure thatRegional Enterprises would be converted into limited liability companies(PTs). As a result the law providing for water enterprises will be replacedby a new law, which divides regional companies (BUMDs) into twotypes, namely, a regional enterprise BUMD and a limited liability companyMUMD. Among other things, the new law would allow MUMDs toobtain loans from domestic and off-shore lenders for business, investmentand development.
When enacted, the water resources law, will integrate water resourcesmanagement, addressing water supply and quality, to irrigation, riverbasin management, and water allocation. However, domestic water supply,which accounts for less than 4% of the total water resource allocation, isonly marginally represented in the draft legislation under discussion.
The overall legislative framework was developed with the vision of apublic utility water supply system and therefore fails to address a numberof sector components that have arisen to fill gaps in supply. In the contextof a multi-provider framework and the importance of rural water supply,it is notable that there is no legislation relating to community systems (thatwould provide clarity over legal ownership), and no provision for allocatingany role to independent providers.
Allocation of Responsibilities for Policy-Makingand RegulationThe principal agencies involved in policy formulation and implementationare listed in Annex 2 together with their respective functions. The primaryrole of the central government is to develop an overall water sector policyand provide technical assistance for sector development. To this end, thecentral government’s role includes:
• setting overall quality standards and coverage targets;
• developing policies and mechanisms;
• establishing mechanisms to target low-income consumers andvulnerable groups;
• developing investment policies and funding mechanisms particularlyrelated to international assistance and use of central government funds;and
• defining institutional roles and responsibilities of the various stakeholdersinvolved in the sector.
Water supply and sanitation services are considered to be devolved to thelocal level; and LGUs have the primary responsibility for implementingpolicy, and carrying out regulatory and planning functions in theirjurisdictions. This includes:
• ensuring services are provided at the community level (though notnecessarily taking the role of provision themselves);
• determining tariff structures;
• establishing levels of service, operational performance, and customerrelations, i.e., setting the standards and/or targets specific to serviceproviders;
• providing investment and funding support, as required; and
• providing targeted assistance for low-income consumers.
Sector Structure and Ownership (Water)The structure for the supply and distribution of water in Indonesia can bedescribed in terms of three fundamentally different types of provision.These are represented in Figure IV.1 and detailed below. Estimateddistribution is disaggregated in Tables IV.1 and IV.2.138
Utility Provision – formal utilities (PDAMs and private utilities) with amandate to produce and sell water
Self Provision – households and communities that obtain their water forthemselves
Alternative Provision – independent and intermediate providers selling awater service to households and communities (e.g. water tankers andvendors).
Figure IV.1. Sector Structure and Ownership
PDAM provision(piped supply)
Self provision(household and
community)(70%)
Alternativesmall-scale
waterprovision
(13%)
Gray area of provision - 83%PDAMs – 17%
Existing PDAM Coverage
Existing Urban Population 40%
Urban Population in 2025 estimate 60%
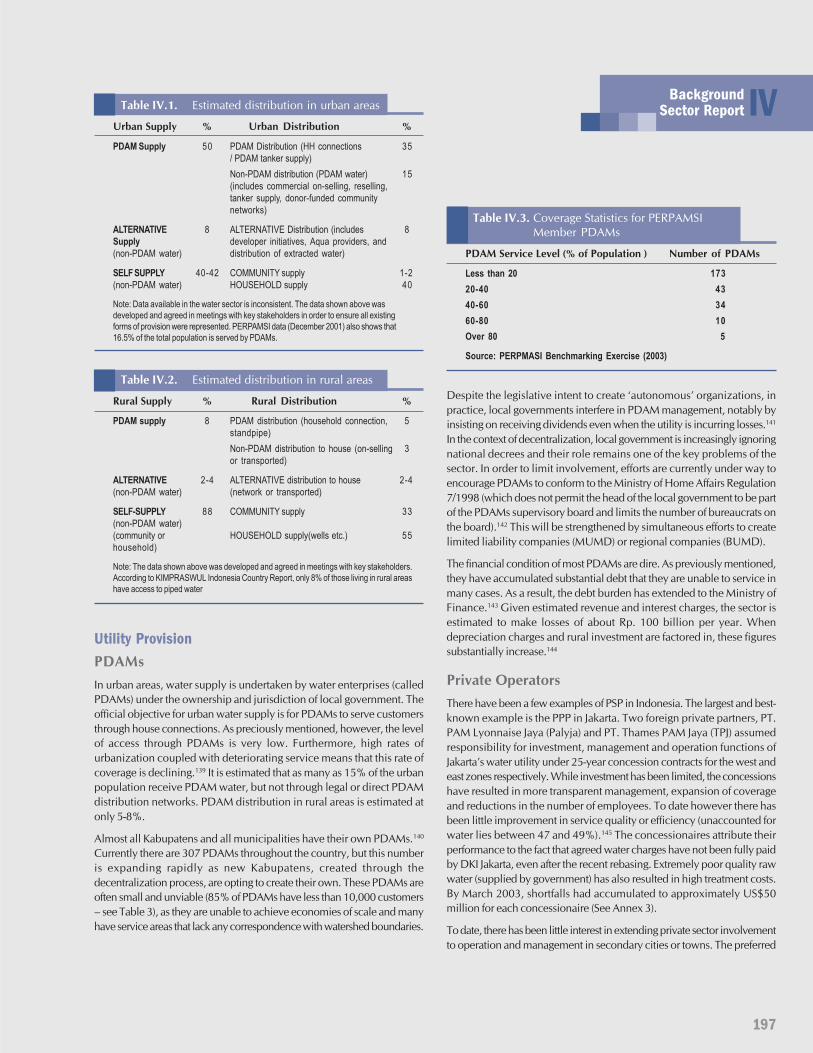
197
IVBackgroundSector ReportTable IV.1. Estimated distribution in urban areas
Urban Supply % Urban Distribution %
PDAM Supply 50 PDAM Distribution (HH connections 35/ PDAM tanker supply)Non-PDAM distribution (PDAM water) 15(includes commercial on-selling, reselling,tanker supply, donor-funded communitynetworks)
ALTERNATIVE 8 ALTERNATIVE Distribution (includes 8Supply developer initiatives, Aqua providers, and(non-PDAM water) distribution of extracted water)
SELF SUPPLY 40-42 COMMUNITY supply 1-2(non-PDAM water) HOUSEHOLD supply 40
Note: Data available in the water sector is inconsistent. The data shown above wasdeveloped and agreed in meetings with key stakeholders in order to ensure all existingforms of provision were represented. PERPAMSI data (December 2001) also shows that16.5% of the total population is served by PDAMs.
Table IV.2. Estimated distribution in rural areas
Rural Supply % Rural Distribution %
PDAM supply 8 PDAM distribution (household connection, 5standpipe)Non-PDAM distribution to house (on-selling 3or transported)
ALTERNATIVE 2-4 ALTERNATIVE distribution to house 2-4(non-PDAM water) (network or transported)
SELF-SUPPLY 88 COMMUNITY supply 33(non-PDAM water)(community or HOUSEHOLD supply(wells etc.) 55household)
Note: The data shown above was developed and agreed in meetings with key stakeholders.According to KIMPRASWUL Indonesia Country Report, only 8% of those living in rural areashave access to piped water
Utility ProvisionPDAMsIn urban areas, water supply is undertaken by water enterprises (calledPDAMs) under the ownership and jurisdiction of local government. Theofficial objective for urban water supply is for PDAMs to serve customersthrough house connections. As preciously mentioned, however, the levelof access through PDAMs is very low. Furthermore, high rates ofurbanization coupled with deteriorating service means that this rate ofcoverage is declining.139 It is estimated that as many as 15% of the urbanpopulation receive PDAM water, but not through legal or direct PDAMdistribution networks. PDAM distribution in rural areas is estimated atonly 5-8%.
Almost all Kabupatens and all municipalities have their own PDAMs.140
Currently there are 307 PDAMs throughout the country, but this numberis expanding rapidly as new Kabupatens, created through thedecentralization process, are opting to create their own. These PDAMs areoften small and unviable (85% of PDAMs have less than 10,000 customers– see Table 3), as they are unable to achieve economies of scale and manyhave service areas that lack any correspondence with watershed boundaries.
Table IV.3. Coverage Statistics for PERPAMSIMember PDAMs
PDAM Service Level (% of Population ) Number of PDAMs
Less than 20 17320-40 4340-60 3460-80 10Over 80 5
Source: PERPMASI Benchmarking Exercise (2003)
Despite the legislative intent to create ‘autonomous’ organizations, inpractice, local governments interfere in PDAM management, notably byinsisting on receiving dividends even when the utility is incurring losses.141
In the context of decentralization, local government is increasingly ignoringnational decrees and their role remains one of the key problems of thesector. In order to limit involvement, efforts are currently under way toencourage PDAMs to conform to the Ministry of Home Affairs Regulation7/1998 (which does not permit the head of the local government to be partof the PDAMs supervisory board and limits the number of bureaucrats onthe board).142 This will be strengthened by simultaneous efforts to createlimited liability companies (MUMD) or regional companies (BUMD).
The financial condition of most PDAMs are dire. As previously mentioned,they have accumulated substantial debt that they are unable to service inmany cases. As a result, the debt burden has extended to the Ministry ofFinance.143 Given estimated revenue and interest charges, the sector isestimated to make losses of about Rp. 100 billion per year. Whendepreciation charges and rural investment are factored in, these figuressubstantially increase.144
Private OperatorsThere have been a few examples of PSP in Indonesia. The largest and best-known example is the PPP in Jakarta. Two foreign private partners, PT.PAM Lyonnaise Jaya (Palyja) and PT. Thames PAM Jaya (TPJ) assumedresponsibility for investment, management and operation functions ofJakarta’s water utility under 25-year concession contracts for the west andeast zones respectively. While investment has been limited, the concessionshave resulted in more transparent management, expansion of coverageand reductions in the number of employees. To date however there hasbeen little improvement in service quality or efficiency (unaccounted forwater lies between 47 and 49%).145 The concessionaires attribute theirperformance to the fact that agreed water charges have not been fully paidby DKI Jakarta, even after the recent rebasing. Extremely poor quality rawwater (supplied by government) has also resulted in high treatment costs.By March 2003, shortfalls had accumulated to approximately US$50million for each concessionaire (See Annex 3).
To date, there has been little interest in extending private sector involvementto operation and management in secondary cities or towns. The preferred
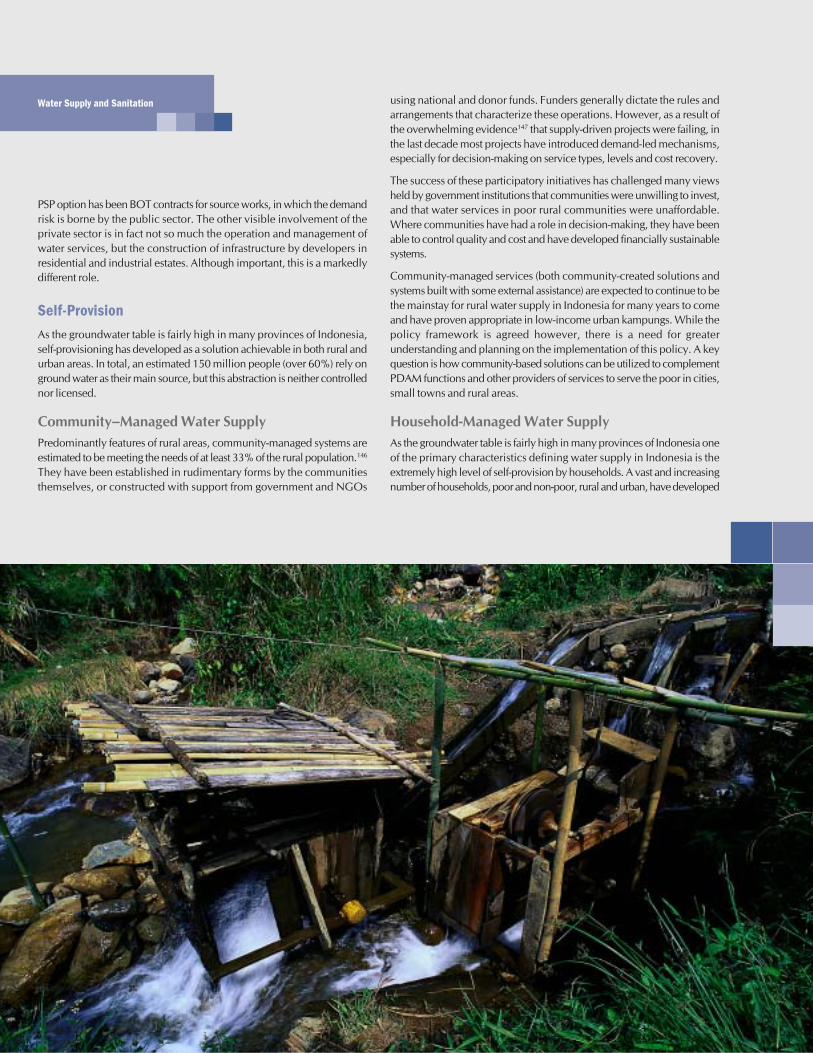
198 Averting an Infrastructure Crisis: A Framework for Policy and Action
Water Supply and Sanitation
PSP option has been BOT contracts for source works, in which the demandrisk is borne by the public sector. The other visible involvement of theprivate sector is in fact not so much the operation and management ofwater services, but the construction of infrastructure by developers inresidential and industrial estates. Although important, this is a markedlydifferent role.
Self-ProvisionAs the groundwater table is fairly high in many provinces of Indonesia,self-provisioning has developed as a solution achievable in both rural andurban areas. In total, an estimated 150 million people (over 60%) rely onground water as their main source, but this abstraction is neither controllednor licensed.
Community–Managed Water SupplyPredominantly features of rural areas, community-managed systems areestimated to be meeting the needs of at least 33% of the rural population.146
They have been established in rudimentary forms by the communitiesthemselves, or constructed with support from government and NGOs
using national and donor funds. Funders generally dictate the rules andarrangements that characterize these operations. However, as a result ofthe overwhelming evidence147 that supply-driven projects were failing, inthe last decade most projects have introduced demand-led mechanisms,especially for decision-making on service types, levels and cost recovery.
The success of these participatory initiatives has challenged many viewsheld by government institutions that communities were unwilling to invest,and that water services in poor rural communities were unaffordable.Where communities have had a role in decision-making, they have beenable to control quality and cost and have developed financially sustainablesystems.
Community-managed services (both community-created solutions andsystems built with some external assistance) are expected to continue to bethe mainstay for rural water supply in Indonesia for many years to comeand have proven appropriate in low-income urban kampungs. While thepolicy framework is agreed however, there is a need for greaterunderstanding and planning on the implementation of this policy. A keyquestion is how community-based solutions can be utilized to complementPDAM functions and other providers of services to serve the poor in cities,small towns and rural areas.
Household-Managed Water SupplyAs the groundwater table is fairly high in many provinces of Indonesia oneof the primary characteristics defining water supply in Indonesia is theextremely high level of self-provision by households. A vast and increasingnumber of households, poor and non-poor, rural and urban, have developed
199
IVBackgroundSector Report
their own water source.148 The quality of water as well as the sustainabilityof this supply mechanism is questionable. Closely associated with householdself-provisioning is the emerging group of small enterprises paid to extract,store and purify water at the household level (described below).
The impacts of household-provision on the structure of the water sectorare far reaching for policy, regulation and enforcement. Whereas collectiveforms of self-provision, such as the community-managed systems describedabove, can be regulated, the sheer numbers of household systems presenta regulatory challenge. Two key issues need to be addressed in regulatoryframeworks to address self-provisioned water supply: the impact on thewater table and the regulation of the quality of water consumed afterextraction and storage. Notwithstanding the important role of householdself-provisioning in filling gaps in formal institutional supply over pastdecades, the sheer magnitude of the self-provisioning market has significantconsequences for PDAMs creating a viable customer base as householdshave, for decades, relied on alternatives to piped water.
Alternative ProvisionFor those households without access to utility supply or the opportunitiesfor self-provision, the remaining alternative is to rely on the market ofalternative providers. The ‘informal’ water sector includes a multitude ofunregulated, competitive service providers reliant on the water businessfor their livelihoods. With an estimated 50 per cent of consumers in urbanareas and 88 per cent in rural areas not receiving direct or indirect servicesfrom PDAMs, the role of these informal providers is likely to be important– they either provide a direct water supply service or they assist communitiesand households to become self-providers. It is important to differentiatethe water providers from the supporting enterprises in order to understandtheir function and the role of government in supporting their activities.
Independent or intermediate water distributorsThe small-scale private water providers (SSPWPs) may be small or mediumscale entrepreneurs that have made water distribution their main source ofincome and, although their business is generally not legal, many haveinvested small amounts of their own capital. The role of SSPWPs vary butinclude operators that distribute PDAM water at neighborhood, lane andhousehold levels. Typically, they will be transporting or reselling water, asthere is little evidence of private networks. Each of these modes of deliverydifferentiates their role and performance and this results in different behavior(business-like, competitive, exploitative etc). The majority of these SSPWPsare informal, some are exploitative, while others provide a useful servicewithout formal recognition but often with the tacit agreement of the PDAMor PDAM staff.
Many households, especially the poor, are actually served through a systemof reselling (sometimes called on-selling) by small-scale providers distributingPDAM water. In April 1990149 government announced that all householdswith a metered connection would be permitted to sell water to theirneighbors and to vendors. Despite this, in practice this activity is stillstrongly discouraged. Data on the impacts of this reform are old andfurther analysis is needed to provide better understanding for appropriatepolicy development.
Global research is constantly providing more sophisticated sectoralknowledge about SSPWPs. Notable in the context of Indonesia is theabsence of a number of alternative forms of water delivery. Unlike manyother countries, utilities have not facilitated arrangements with alternativeproviders that allow the distribution of PDAM water (from regulated
supply points) by non-PDAM water sellers. Second, there is only a limitedmarket of alternative providers developing their own source and providingnon-PDAM water.150 The lack of activity along these supply chains hassignificant policy implications.
Private enterprises supporting self provisionA second category of SSPWPs provides support to households andcommunities to access their own water. The emergence of the pattern ofhousehold self-provisioning is entirely dependent on this group of suppliersof the technologies, materials and equipment and the workforce to constructhousehold level facilities. The drilling of wells, installation of pumps andoverhead tanks is a substantial activity that employs thousands of workers.
Investment and Financing (Water)Although there has been a stabilization of the economy, the financial crisisof 1997 left a mark on the water sector. The sharp and sudden devaluationof the Indonesian Rupiah from 2,317 to $US 1 at pre-crisis to 16,950 inJune 1998 resulted in massive deterioration in investment and financinglevels and many infrastructure projects were no longer affordable. PDAMsmostly became bankrupt as their cost/revenue balance, already faltering,was affected by the escalation in FX components of investment as well asthe costs of imported inputs and electricity.
According to the Indonesia Country Report prepared for Kyoto in 2003151,it would require a total investment of Rp. 66.43 trillion (US$ 7.5 billion)or Rp.5.1 trillion (US $573 million) annually to reach the MDG targets.Typical annual government spending for all public infrastructure (includingroads, bridges, irrigation, water, housing, etc.) is about Rp.11 trillionannually. The shortfall in current and future public expenditure meansthat it is necessary, not only to stimulate greater commitment of government(and donors) to the sector, but also to mobilize the private sector,communities and households to improve access to safe water supply andsanitation.
Public Investment and FinancingFor the last decade or so, investment in the water sector has been madethrough public financing. Before the IUIDP program all financing wasgrant-based, but more recently have taken the form of loans from centralgovernment, made through subsidiary loan agreements (SLAs) with thePDAMs/Local Governments funded by donors or domestic borrowingthrough regional development accounts (RDAs). The Ministry of Finance,through the Directorate General of Financial Institutions (DGFI), retainedthe contingent liabilities, and as a result the arrangement did not provideany incentive for PDAMs to amortize the loans, or hold local governmentor other central agencies accountable. At the same time it is argued thatsome PDAMs and Local Governments were not consulted in the process,or were advised of their liabilities after the event. In addition to the impactof this financing mechanism, a number of other factors have contributed
200 Averting an Infrastructure Crisis: A Framework for Policy and Action
Water Supply and Sanitation
to the weak financial position of PDAMs: (i) the arbitrary acts of localgovernment, especially in relation to the payment of dividends; (ii) the lackof viability of some PDAMs due to their size; (iii) the lack of concern fordemand-led planning and investment, consumer affordability or willingnessto pay; and (iv) the reluctance of many local governments to set tariffs atcost recovery levels.
In 2002, fixed assets totaled Rp7.5 trillion while loans outstanding wereestimated at Rp.3.2 trillion. Most of the loans to PDAMs have been extendedat subsidized interest rates (between 9% and 11.5%) at maturities of 20years with 5 years grace on principal repayment and it has been impossiblefor the Ministry to cover foreign exchange exposure during the steepdevaluations in 1998. As such, losses from the lending program to thePDAMs are substantially higher than those purely reported by the PDAMson their own accounts. As meniotned previously, PDAMs today have anumber of outstanding loans, many of them in arrears, which straddleMOF with a substantial amount of debt.152 It is estimated that the sector ismaking losses of about Rp. 100 billion per year. When depreciation chargesand rural investment are factored in, these figures increase substantially.153
The financial recovery action plan (FRAP) (detailed in Annex 4) sets out thesteps that are envisaged to restore financial conditions to a more manageablelevel, to overcome the added effects of the economic crisis and create thepotential for a viable functioning institutional provision in the future. Theprogram is also intended to develop the financial capacity of PDAMs toundertake new investments. The actions envisaged require stakeholdercommitment to reform and need to be negotiated by all interested partiesto ensure a sustainable financial solution.
The policy framework proposed envisages that PDAMs would utilize: (a)their own resources, generated out of cashflow arising from efficientoperations; and complemented by; (b) equity contributions from localgovernment; (c) domestic commercial loans; and (d) grants and loans fromcentral government. Proposed policy to convert PDAMs into limited liabilityor regional companies would enable them to obtain loans from domesticand off-shore sources. The key corporate restructuring and trainingrequirements are described in Annex 5. However, it should be noted thatdebt restructuring is not confined to the WSS sector, the debt overhang inthe sector is closely linked to public finance management and institutionalreform, particularly the allocation of roles to central and local governmentin debt restructuring.
Private InvestmentTo date, formal private financing for water has not been forthcoming. Inthe Jakarta concessions, Palyja has invested $132 million, and TPJ $85million respectively in the past five years. This is equivalent to an averageof about $40 million a year in a metropolis of over 10 million people,which is not significant enough to generate major efficiency gains. (Furtherinformation on the concessions in Jakarta is provided in Annex 3). Elsewhereinvestment has been relatively insignificant.
In the water sector, information on the scale of small-scale providerinvestment however is very limited. Their informal status makes access to
institutional finance very difficult but they do invest in the equipment theyneed to provide their service. Better understanding of how much andunder what circumstances is essential in developing an enabling frameworkthat enhances incentives for entrepreneurs and users.
In the past ten years, the World Bank-funded WSSLIC projects havedemonstrated the viability of community financing in conjunction withoperation and management roles. In WSSLIC I, communities paid 20% ofconstruction costs. Poor rural communities actually contributed morethan 200 percent of expected projections, despite the fact that they hadhad little choice in project inputs and key decisions. The KDPimplementation experiences in different parts of Indonesia have shownthat communities contribute as much as is necessary to bridge gaps betweenproject grants and the costs of their preferred service.
Household investment is significant. Given that around 50 per cent of thetotal population is obtaining water for themselves at the household level,it would be reasonable to assume that investments run into hundreds ofmillions of dollars every year. The sheer quantity of investment required inthe next decade to improve service delivery suggests that, for the foreseeablefuture, households will continue to shoulder a major part of the investmentfor water supply.
Sector Performance (Water)AccessOfficial SUSENAS data categorizes access to drinking water according toownership – whether private or public and whether ownership is individualor shared. For Indonesia as a whole (rural and urban) the data indicatesthat of those that have access to drinking water supply at household level,52% have individual privately-owned sources (e.g. pump, well etc.), 25%have a jointly-owned source (e.g. communal taps) and that nearly 15%rely on public (communal) utilities. (e.g. PDAMs).
In 2000, WHO figures154 suggest that 78% of the population of Indonesiaas a whole had access to what was termed an improved155 water source.However, in rural areas, where access was estimated at 69%, surveysshow that households have ‘access’ to communal facilities if such facilitiesexist in the community – not that they obtained improved water. Thelimitations of this data are revealed through participatory evaluations156
that showed great variations in actual proportions of village populationsthat gained access to improved water supply in practice.157 In urban areas,access to improved water was estimated to be 90%. Yet data fromPERPAMSI (shown in Table 3), indicate that only five PDAMs in thecountry are achieving over 80% coverage, and further examination (seetables 1 and 2) shows that a proportion of this water is distributed by on-selling, or by household reselling.158
Irrespective of the quality and lack of consensus on data, the fundamentalissue is that access is dependent on the contribution of self and alternativeforms of provision. Furthermore the use of the improved water supplyindicators at the national level does not provide adequate information onthe level of consumption by the poorest households. The bench markingstudy provides a draft analysis of East Jakarta in 2002 and shows that low-income connections are providing an average of 100 liters per capita perday or 11 liters per connection per day159; middle-income households areutilizing 150 liters per capita per day and high-income households anaverage of 250 liters per capita per day.
201
IVBackgroundSector Report
QualityAfter more than five years since the economic crisis, there is evidence thatwater supply infrastructure has deteriorated and service quality has fallen.In relation to utility water, there is evidence that PDAMs have postponedmaintenance in an effort to reduce costs, and few PDAMs use the requiredchemical dosages for water treatment. The incidence of water-borne diseaseshas increased as a result.160 Inefficiencies in management and operationshave severely impaired the opportunity of improving services to existingand new customers and the quality of water is a serious issue in many ofthe large cities such as Jakarta, Surabaya and Bandung.
In self-provisioning by households and communities, water quality, quantityand reliability of service has tended to vary with the type of water supplytechnology used. While the more convenient piped systems are reportedlysatisfactory, dug wells, hand pumps and rainwater harvesting systemspresent concerns over water quality as they are often affected by lack ofacceptable standards of water storage. Quantity and reliability presentsless of a problem in most areas where water is plentiful. The quality ofservice provided by alternative providers is also variable. The utilization ofPDAM water by most SSPWPs means that water quality will be similar orwill have deteriorated in the transportation and storage process. Furtherinformation is needed to improve understanding of this is relation todifferent types of providers functioning in different locations.
EfficiencyOnly the efficiency of the services delivered by PDAMs can be measuredin both operational and financial terms. Overall, the figures for both non-revenue water (NRW) and unaccounted for water (UFW) are very high,suggesting that PDAMs are not optimizing the use of their existing assets.PDAMs are often too small to take advantage of economies of scale andthey tend to have low managerial and technical capacity.161 As withcoverage there are wide variations in the efficiency of different PDAMs butoverall, inefficiencies constrain service quality to existing users, and anyscope for expanding and improving services to existing and new customers.The poor are disproportionately disadvantaged by this failure and Indonesiahas fallen well behind in achieving its MDG targets for the sector. Insummary:
Unaccounted for water (UFW): BAPPENAS data suggest that forIndonesia as a whole UFW is about 40%.162 For Jakarta, the figure is 53%,which, although very high, is comparable to other Asian cities.
Non-revenue Water (NRW): Based on a sample of 68 PDAMs,PERPAMSI has estimated that average NRW is 44%, with a standarddeviation of 17%, again suggesting a wide variation in operationalperformance. Problems are not limited to physical assets, a great deal ofleakage and informal payment occurs in the large market of unrecognizedon-selling and a lack of control over non-connection water supply.
Staffing Ratios: A case study of 16 PDAMs across Indonesia163 indicatesthat kabupaten PDAMs usually have staffing ratios of 11 staff per 1000connections whereas kotamadyas PDAMs, in more densely populatedservice areas, have ratios of around 7 per 1000 connections. Staff ratios forthe major cities of Jakarta and Medan, not included in the above study, are5.9 per 1000 and 4.9 per 1000 connections respectively.164
Cash / Operating Expenses: A vast majority of PDAMs are not in aposition to recover operating expenses from the cashflow, or repay loanssigned through SLAs. Available figures for accounts receivable show Jakartaat 1.0 month, Medan at 0.1 month and Bandung at 1.0 month.165
Debt service Ratio: In the benchmarking study of PDAMs, debt-serviceratio exceeded 1 for only 8 of the 28 PDAMs in the sample.
TariffsPDAM tariffs are well below cost recovery levels – they are regulated bylocal governments seeking to address social and political considerations,often in conflict with technical and financial requirements. Reports fromPERPAMSI indicate that most PDAMs have negative profitability and nearlyhalf charge tariffs below the cost of operations and maintenance. Overall,average tariffs are Rp. 980 or US$0.08 per cubic meter sold166 and theaverage monthly bill per connection was Rp.26,150 or $2.20. PDAMtariff structures are usually based on the rising block tariff systems in whichhigh consumption customers cross-subsidize low consumption, normallypoorer, customers. With increasing costs of production the tendency hasbeen to overprice the big consumers and under-price the small. As aconsequence, and in an environment where self-provision is a norm, thishas promoted a situation in which many high consumptions customersopt out of the system and construct their own boreholes. Also, the lowtariffs to low level consumers dictated by public policy have exacerbatedfinancial problems and are thereby contributing to the limited coverage ofPDAMs (with particular consequences for poor households).
In community-managed systems, water tariffs are virtually non-existent forpoint sources (dugwells, handpumps, rainwater harvesters). For pipedsystems there is usually a tariff fixed by the community or by projectfunctionaries. Water tariffs for community-managed systems are typicallyvery low, and only sufficient to cover daily operating expenses. Funds formaintenance and repairs are typically collected on a case-by-case basis asneeds arise, making it difficult to meet any contingency expenditure. Theseare rarely based on proper cost estimates, and may be unpaid or collected.Conflicts often arise on the issues of community cost-sharing for repair andmaintenance for both point sources and piped distribution systems, sinceprojects have often neglected to facilitate formal agreements aboutownership and O&M responsibilities that all users consider fair. Howeverevaluations of community-managed systems also identified cases wherecommunities were not only sustaining their services fully, but had financedexpansions and replacements of the system, and built up financial reservesthat were used for micro-credit activities.167
Pricing by alternative providers varies substantially, from the competitiveto the exploitative, (although the incidence of exploitation is unknown).The group that provides support to the self-provisioning of households hasgenerally been viewed as performing a vital economic function atcompetitive prices, while the group that sells water from kiosks, conveyswater to homes in push carts or through plastic hoses have been viewed ina more negative light because of the price differentials compared with theutility charges. While there is some evidence that mafia-like organizationscontrol pricing of resold water and hijackers control water points in someareas, there are also studies that show that pricing of water piped throughhoses for instance, can be quite competitive and that price differentialsreflect incremental costs of conveying the water to homes. For example,
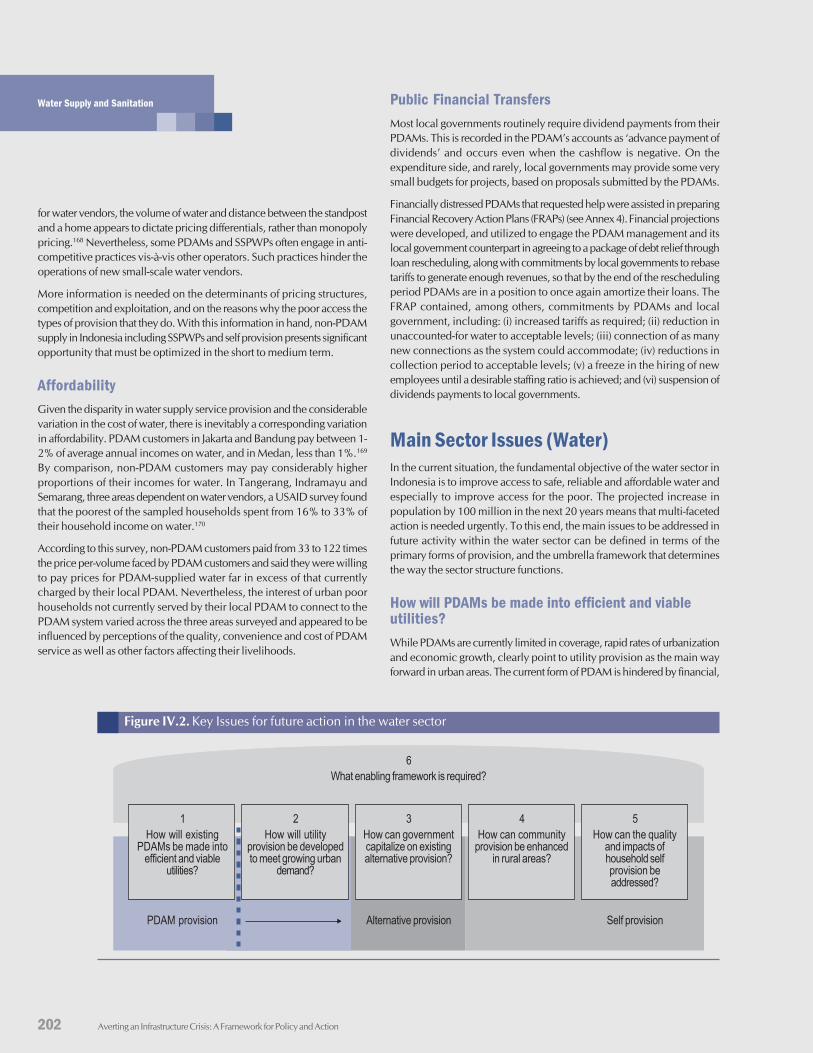
202 Averting an Infrastructure Crisis: A Framework for Policy and Action
Water Supply and Sanitation
for water vendors, the volume of water and distance between the standpostand a home appears to dictate pricing differentials, rather than monopolypricing.168 Nevertheless, some PDAMs and SSPWPs often engage in anti-competitive practices vis-ŕ-vis other operators. Such practices hinder theoperations of new small-scale water vendors.
More information is needed on the determinants of pricing structures,competition and exploitation, and on the reasons why the poor access thetypes of provision that they do. With this information in hand, non-PDAMsupply in Indonesia including SSPWPs and self provision presents significantopportunity that must be optimized in the short to medium term.
AffordabilityGiven the disparity in water supply service provision and the considerablevariation in the cost of water, there is inevitably a corresponding variationin affordability. PDAM customers in Jakarta and Bandung pay between 1-2% of average annual incomes on water, and in Medan, less than 1%.169
By comparison, non-PDAM customers may pay considerably higherproportions of their incomes for water. In Tangerang, Indramayu andSemarang, three areas dependent on water vendors, a USAID survey foundthat the poorest of the sampled households spent from 16% to 33% oftheir household income on water.170
According to this survey, non-PDAM customers paid from 33 to 122 timesthe price per-volume faced by PDAM customers and said they were willingto pay prices for PDAM-supplied water far in excess of that currentlycharged by their local PDAM. Nevertheless, the interest of urban poorhouseholds not currently served by their local PDAM to connect to thePDAM system varied across the three areas surveyed and appeared to beinfluenced by perceptions of the quality, convenience and cost of PDAMservice as well as other factors affecting their livelihoods.
Public Financial TransfersMost local governments routinely require dividend payments from theirPDAMs. This is recorded in the PDAM’s accounts as ‘advance payment ofdividends’ and occurs even when the cashflow is negative. On theexpenditure side, and rarely, local governments may provide some verysmall budgets for projects, based on proposals submitted by the PDAMs.
Financially distressed PDAMs that requested help were assisted in preparingFinancial Recovery Action Plans (FRAPs) (see Annex 4). Financial projectionswere developed, and utilized to engage the PDAM management and itslocal government counterpart in agreeing to a package of debt relief throughloan rescheduling, along with commitments by local governments to rebasetariffs to generate enough revenues, so that by the end of the reschedulingperiod PDAMs are in a position to once again amortize their loans. TheFRAP contained, among others, commitments by PDAMs and localgovernment, including: (i) increased tariffs as required; (ii) reduction inunaccounted-for water to acceptable levels; (iii) connection of as manynew connections as the system could accommodate; (iv) reductions incollection period to acceptable levels; (v) a freeze in the hiring of newemployees until a desirable staffing ratio is achieved; and (vi) suspension ofdividends payments to local governments.
Main Sector Issues (Water)In the current situation, the fundamental objective of the water sector inIndonesia is to improve access to safe, reliable and affordable water andespecially to improve access for the poor. The projected increase inpopulation by 100 million in the next 20 years means that multi-facetedaction is needed urgently. To this end, the main issues to be addressed infuture activity within the water sector can be defined in terms of theprimary forms of provision, and the umbrella framework that determinesthe way the sector structure functions.
How will PDAMs be made into efficient and viableutilities?While PDAMs are currently limited in coverage, rapid rates of urbanizationand economic growth, clearly point to utility provision as the main wayforward in urban areas. The current form of PDAM is hindered by financial,
6What enabling framework is required?
Figure IV.2. Key Issues for future action in the water sector
1How will existing
PDAMs be made intoefficient and viable
utilities?
2How will utility
provision be developedto meet growing urban
demand?
3How can governmentcapitalize on existingalternative provision?
4How can community
provision be enhancedin rural areas?
5How can the quality
and impacts ofhousehold selfprovision beaddressed?
PDAM provision Alternative provision Self provision
203
IVBackgroundSector Report
political and institutional blockages. PDAMs have inherited or accumulatedheavy debts and continue to be loss-making. Even with higher tariffs andmore efficient operations, many PDAMs would still remain in a financiallyunviable situation, many are too small. The institutional relationship betweenPDAMs and local government hinders improved utility performance.Currently, PDAMs are owned by and subject to interference from localgovernment and their ability to work as autonomous corporate entities iscompromised. PDAMs and established water vendors often engage inanti-competitive practices. Furthermore, public authorities lack capacityand have not created enabling environments to promote effective servicedelivery or to encourage effectively PDAM delivery incentives and privatesector investment, there is a perception of risk of working in the currentconditions. Sector governance is not conducive to effective provision ofservices by public and/or private sector and there is a lack of political willfor change at the local government level. While the PDAM reform envisaged(which includes the formation of other institutional models) is still to berolled out, the inefficiency and financial viability of PDAMs are key issuesto be constantly emphasized in the short to medium term and requiresunderstanding that financial viability is also dependent on demand forpiped services.
How will utility provision be extended to meet growingurban demand?Notwithstanding the urgent need for PDAM reform, it is also necessary forgovernment to invest in and develop water sector assets. Investment inlarge cities is urgently needed. This lack of investment occurs at all levels ofinfrastructure: tertiary (household and street infrastructure), secondary(mains and pumping) and primary (bulk supply, pumping, treatment andprimary mains). There are currently no strategies and action plans describinghow coverage will be extended and how existing infrastructure will beimproved to match the 4.4% projected growth rate. Greater understandingis also needed of the factors that affected the efficiencies of past investments.The utilities that emerge from the reform process, whether public orprivate, will need to be backed with significant investment to meet thegrowing needs of the urban population.
How can government capitalize on existingalternative provision?Alternative forms of provision by informal and small-scale operators arean untapped market whose role can be enhanced in improving access,especially for the poor, in the short and medium term. Existing urban dataclearly indicates that non-PDAM actors have stepped in to fill the gap indistribution, and their contribution needs to be formalized and regulated.While a large number of independent and intermediate providers are ableto assist in the expansion of current levels of access, they currently provideservices illegally. The lack of any effort to date to include independentproviders in the overall delivery system – through, for instance, bulk salearrangements – is a missed opportunity. The lack of recognition of theirrole means there is a lack of regulation of existing practices. As a result,quality is variable and some price structures and local markets are distortedand exploitative, with disproportionate impact on the poor.
How can community provision be enhancedin rural areas?In rural areas, community-based management systems now provide anestablished model and are likely to constitute a main way forward in themedium to long term. While a policy framework for this is agreed at the
national level, serious problems in relation to financing and localgovernment commitment stand in the way of effective implementationand replication. Community-based options are not legally recognized andthe approach not institutionalized, despite their success in a number ofdistricts. Long-term management solutions for these systems are still to betested. Voluntary management is rarely a viable long-term solution and, inIndonesia, these systems will need to undergo a transition to more formalforms of management (community-appointed managers or local privateoperators). Future expansion and higher levels of service are emerging asimportant issues for the future as the composition and wealth ofcommunities change.
How can the quality and impacts of householdself-provision be addressed?The high levels of household self-provision in both rural and urbanIndonesia are a unique characteristic of the Indonesian water sector.Whereas in rural areas household provisioning remains viable, in urbanareas, household provision has grown to the extent that sustainability is orwill soon be at question. and this form of self-supply has implications forthe viability of PDAMs when demand for networked services is kept low.Impacts on ground water are not adequately monitored and the lack ofregulation (and opportunities for enforcement) over extraction presentsignificant risk in relation to quality (especially given the prevalence of on-site sanitation).
What enabling framework is required?The inconsistency and usability of existing data on all providers, theirperformance, actual costs and investment, is a key issue in the sector.Adequate and updated data is required to provide a sound basis for planningan enabling framework (and then monitoring) sector performance.
The lack of an effective enabling framework means that it is not possible atthis stage to capitalize on the potential of all forms of provision, to regulatedelivery or to ensure that delivery is pro-poor. The legislative and regulatoryframework is weak and without appropriate regulation (and enforcement)over pricing, quality and performance standards.
There is also no provision or incentive for local government to establisheffective pricing regimes or deal with issues of efficiency or sustainability.Water tariffs are well below cost recovery levels or are unpredictable andunstable. Very low tariff levels exacerbate the financial position of thesector and the ability of all providers to expand and improve services ishindered. Very high levels of unaccounted for water and non-revenuewater need to be addressed and other sustainability issues such as highground water abstraction considered as a part of a long term strategy.Financing mechanisms create a lack of accountability by local governmentfor proper and sustainable investment, operations and maintenance. TheSAP funding mechanism is yet to be replaced. There are also a number ofpolicy gaps and institutional blockages, and the allocation of responsibilitiesfails to provide incentives for service delivery agencies – public or private.Policy in relation to alternative forms of provision is non-existent despite
204 Averting an Infrastructure Crisis: A Framework for Policy and Action
Water Supply and Sanitation
the high dependence on non-PDAM supply. Apart from the specific policiesrelating to community provision developed under the WASPOLA project,there is currently no overall framework that protects the interests of thepoor, and this has led to a lack of direction and mandate for servicedelivery institutions.
PART B: SANITATIONPolicy and Institutional Framework (Sani-tation)Main Laws and RegulationsThe legislative framework for sanitation aims to define the areas of authorityfor municipalities and regencies (see Annex 1). Urban wastewater servicesare not specifically mentioned in the Autonomy Law but it is generallyunderstood that they lie within the purview of local governments. Theprovisions for the health aspects of urban sanitation are covered by theHealth Law No.23 of 1992 and are developed through a regulatoryframework prescribing the requirements of water quality.171 A draftregulation on environmental health and safety has been prepared inaccordance with the Autonomy Law and includes further provisions onwater quality and on the discharge of wastewater. The primary act from anenvironmental viewpoint is Law No. 23 of 1997, Regarding EnvironmentalManagement which increases the legislative power of government,recognizes the right of individuals to a clean and healthy environment andputs the onus on business and industry to provide accurate information onenvironmental management within their area of responsibility.
As it currently stands, however, the legislative framework for sanitation isweak and lacks the provisions necessary to respond to existing and futureopportunities for improving service delivery. In particular, it lacks anyprovisions necessary for effective governance over those enterprises,community organizations and households that are, in practice, the primaryproviders of sanitation services in Indonesia today.
Allocation of Responsibilities for Policy makingand RegulationIt is the central government’s role to determine policy, and it does so byestablishing norms, standards, criteria, procedures, and guidelines foreach sector. Although a formal urban sanitation policy does not exist inIndonesia, there is a de facto framework that includes matters of jurisdictionand delegation as well as the delineation of roles and activities of allstakeholders.
Legislative functions including the formulation of policies and the enactmentof laws, regulations, and decrees that are necessary for the sustainabledelivery of urban sanitation services are exercised both by the centralgovernment and by the local governments. Regulatory functions to pursuethe policy goals of urban sanitation (including tariffs, quality and coverage)are performed at the national level, although such responsibilities aredispersed among several ministries:
MOHA, the Ministry of Home Affairs, is responsible for regional companies;KIMPRASWIL, the Directorate General of Ministry of Settlements andRegional Development is responsible for urban sanitation projects fundedby the central government; BAPPENAS, the National Development PlanningBoard, is responsible for urban sanitation planning; including coordinationand monitoring functions at national level; MOH, the Ministry of Health,is responsible for monitoring and ensuring adequate environmental healthstandards, including the health aspects of sanitation; MOF, the Ministry ofFinance, is responsible for the allocation of finances to central and localgovernment agencies for developmental infrastructure projects and forregulating off-shore financing; and MOE, the Ministry of Environment, isresponsible for formulating and enforcing the legislative framework onenvironmental management.
In conjunction with the relevant central government agencies, localgovernment (either district/regency or municipality) is responsible forenforcing laws and regulations on regional autonomy, fiscal balance, waterquality and the management of PDAMs(in the context of decentralizationimportant issues arise about their role and lack of capacity). Under theautonomy law, the responsibility for sanitation service provision restswith local governments requiring them to ensure that such services areprovided within their respective jurisdictions, but does not imply thattechnical departments in local government should themselves undertakethe actual operation and delivery of these services or that they currentlyhave the capacity to do so.
Sector Structure and Ownership(Sanitation)Sanitation service is mainly provided by three groups: by utilities, by selfprovisioning by users, and by alternative service providers. Whereas in thewater sector, some 15-20% of services are provided by formal institutions(PDAMs, PPPs, LG), in sanitation, the public sector has played an evensmaller role. GOI policy treats basic sanitation172 as primarily a privateresponsibility. Households and developers have been expected to invest inon-site sanitation improvements to conform to public health regulations,although these are poorly enforced. The conveyance of this waste awayfrom the living environment for treatment and disposal is considered to bea public responsibility, but investment in sewerage and sewage treatmentfacilities has been negligible. The construction of septic tanks is normallycarried out by private enterprises, as is the desludging of tanks and removalof septage.
Most of those without access to some sanitation services are poor. Accordingto overall SUSENAS data, 13% of sewage goes into rivers and lakes, and6% in to rice fields etc.
Utility ProvisionLocal GovernmentThe sanitation sector does not have the equivalent of PDAMs or any otherwell-developed public sector delivery system. In nearly all cities, the
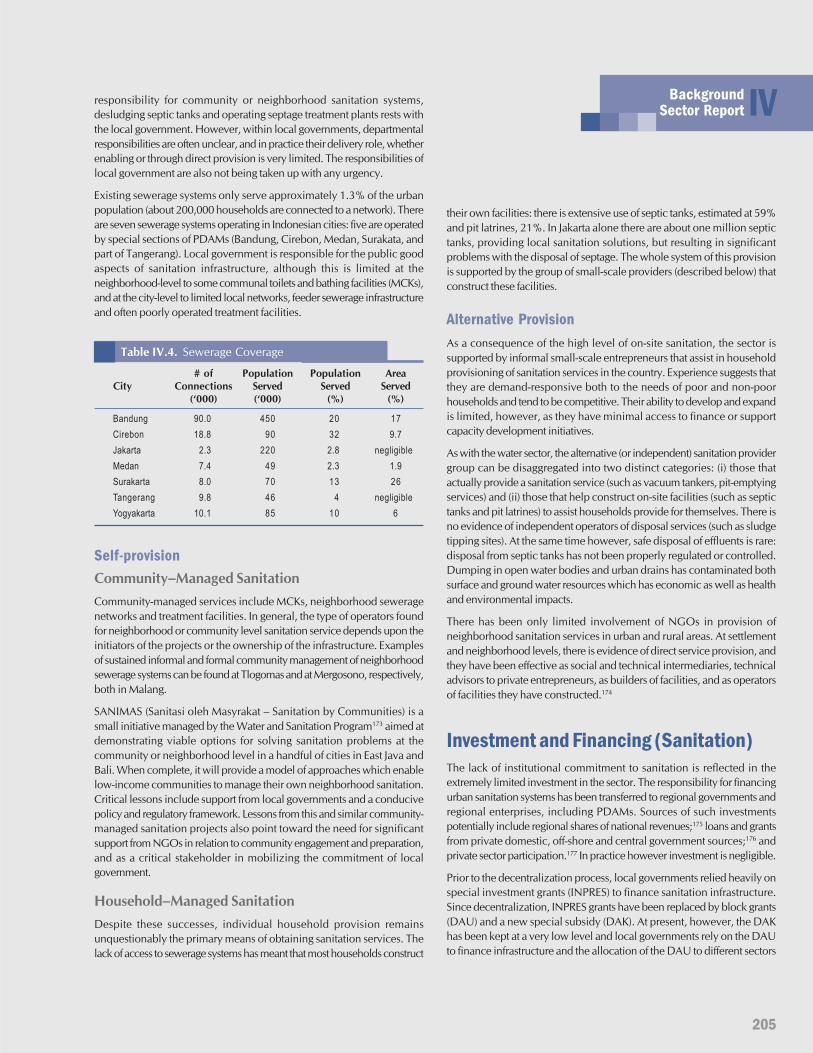
205
IVBackgroundSector Report
responsibility for community or neighborhood sanitation systems,desludging septic tanks and operating septage treatment plants rests withthe local government. However, within local governments, departmentalresponsibilities are often unclear, and in practice their delivery role, whetherenabling or through direct provision is very limited. The responsibilities oflocal government are also not being taken up with any urgency.
Existing sewerage systems only serve approximately 1.3% of the urbanpopulation (about 200,000 households are connected to a network). Thereare seven sewerage systems operating in Indonesian cities: five are operatedby special sections of PDAMs (Bandung, Cirebon, Medan, Surakata, andpart of Tangerang). Local government is responsible for the public goodaspects of sanitation infrastructure, although this is limited at theneighborhood-level to some communal toilets and bathing facilities (MCKs),and at the city-level to limited local networks, feeder sewerage infrastructureand often poorly operated treatment facilities.
Table IV.4. Sewerage Coverage
# of Population Population AreaCity Connections Served Served Served
(‘000) (‘000) (%) (%)
Bandung 90.0 450 20 17Cirebon 18.8 90 32 9.7Jakarta 2.3 220 2.8 negligibleMedan 7.4 49 2.3 1.9Surakarta 8.0 70 13 26Tangerang 9.8 46 4 negligibleYogyakarta 10.1 85 10 6
Self-provisionCommunity–Managed SanitationCommunity-managed services include MCKs, neighborhood seweragenetworks and treatment facilities. In general, the type of operators foundfor neighborhood or community level sanitation service depends upon theinitiators of the projects or the ownership of the infrastructure. Examplesof sustained informal and formal community management of neighborhoodsewerage systems can be found at Tlogomas and at Mergosono, respectively,both in Malang.
SANIMAS (Sanitasi oleh Masyrakat – Sanitation by Communities) is asmall initiative managed by the Water and Sanitation Program173 aimed atdemonstrating viable options for solving sanitation problems at thecommunity or neighborhood level in a handful of cities in East Java andBali. When complete, it will provide a model of approaches which enablelow-income communities to manage their own neighborhood sanitation.Critical lessons include support from local governments and a conducivepolicy and regulatory framework. Lessons from this and similar community-managed sanitation projects also point toward the need for significantsupport from NGOs in relation to community engagement and preparation,and as a critical stakeholder in mobilizing the commitment of localgovernment.
Household–Managed SanitationDespite these successes, individual household provision remainsunquestionably the primary means of obtaining sanitation services. Thelack of access to sewerage systems has meant that most households construct
their own facilities: there is extensive use of septic tanks, estimated at 59%and pit latrines, 21%. In Jakarta alone there are about one million septictanks, providing local sanitation solutions, but resulting in significantproblems with the disposal of septage. The whole system of this provisionis supported by the group of small-scale providers (described below) thatconstruct these facilities.
Alternative ProvisionAs a consequence of the high level of on-site sanitation, the sector issupported by informal small-scale entrepreneurs that assist in householdprovisioning of sanitation services in the country. Experience suggests thatthey are demand-responsive both to the needs of poor and non-poorhouseholds and tend to be competitive. Their ability to develop and expandis limited, however, as they have minimal access to finance or supportcapacity development initiatives.
As with the water sector, the alternative (or independent) sanitation providergroup can be disaggregated into two distinct categories: (i) those thatactually provide a sanitation service (such as vacuum tankers, pit-emptyingservices) and (ii) those that help construct on-site facilities (such as septictanks and pit latrines) to assist households provide for themselves. There isno evidence of independent operators of disposal services (such as sludgetipping sites). At the same time however, safe disposal of effluents is rare:disposal from septic tanks has not been properly regulated or controlled.Dumping in open water bodies and urban drains has contaminated bothsurface and ground water resources which has economic as well as healthand environmental impacts.
There has been only limited involvement of NGOs in provision ofneighborhood sanitation services in urban and rural areas. At settlementand neighborhood levels, there is evidence of direct service provision, andthey have been effective as social and technical intermediaries, technicaladvisors to private entrepreneurs, as builders of facilities, and as operatorsof facilities they have constructed.174
Investment and Financing (Sanitation)The lack of institutional commitment to sanitation is reflected in theextremely limited investment in the sector. The responsibility for financingurban sanitation systems has been transferred to regional governments andregional enterprises, including PDAMs. Sources of such investmentspotentially include regional shares of national revenues;175 loans and grantsfrom private domestic, off-shore and central government sources;176 andprivate sector participation.177 In practice however investment is negligible.
Prior to the decentralization process, local governments relied heavily onspecial investment grants (INPRES) to finance sanitation infrastructure.Since decentralization, INPRES grants have been replaced by block grants(DAU) and a new special subsidy (DAK). At present, however, the DAKhas been kept at a very low level and local governments rely on the DAUto finance infrastructure and the allocation of the DAU to different sectors
206 Averting an Infrastructure Crisis: A Framework for Policy and Action
Water Supply and Sanitation
is left to the discretion of the local governments, which prefer allocatingthese resources to investments that have the greatest political visibility. Thegreatest casualty in this process is sanitation that brings little politicalkudos. Despite their statutory obligation, most local governments regardsanitation as the business of NGOs, the private sector or the nationalgovernment. In one local government, only about 6% of the DAU wasallocated to human settlements, and of this 80% was allocated to watersupply, 15% to housing, and only 5% to sanitation. Evidence also suggestthat local governments commonly allocate some budget, however small,for sanitation activities, but often do not know how best to spend it. Ofseveral cities in East Java and Bali included in the SANIMAS project describedabove, local governments had budgets for sanitation that were underused.Given the option to facilitate community-level sanitation development,most of the cities were eager to contribute these budgets for meaningfulinvestments into the sector.
For large scale improvements, the potential financing arrangements includethe Subsidiary Loan Agreement, designed for on-lending multilateral loansfor local infrastructure projects. The subsidiary loan agreement entails atwo-stage loan process with agreements between the GoI and aninternational lender followed by a second agreement between thegovernment and the local government that serves as the final borrower.Domestic private sources to local governments are another untapped source
of finance. Finally, the DAK Mechanism is a special new mechanismthrough which grant funds can be provided for projects with high socialexternalities such as urban sanitation. Although currently kept at a lowlevel, the DAK could become an important source of grant funding forurban sanitation provided there are clear rules for allocation, and thattransparency and administrative simplicity can be ensured.
Alternative providers mainly rely on their own equity and very expensiveshort-term loans from informal creditors to finance their investments.
The primary source of investment however is individual households andcommunities, although accurate data indicating its magnitude is lacking.In the city of Jakarta alone, ‘self-provisioned’ investments in septic tanks byhouseholds are estimated to be around $150 million. The multiplier effectsthat are generated among tukangs who construct the septic tanks, andother service providers who collect and empty the wastes, can be significant.
Access to ServiceAccess to sanitation is significantly lower than water and presents a differentpolicy challenge. Whereas there is some recognition of the main issues ofthe water sector, the need for reform in relation to the sanitation sector islargely unrecognized, only tentatively accepted or perhaps too large tocontemplate.
Indonesia has the lowest percentage of urban households with adequatesanitation in Asia.178 Of the urban population, SUSENAS data indicate that68% have access to private basic sanitation. Service coverage at theneighborhood, community and citywide levels is very low. There hasbeen no significant investment in city-wide sanitation infrastructure duringthe last 20 years.
207
IVBackgroundSector Report
Approximately 73% of the existing access is through on-site sanitation.While this is a reflection of government policy, which assigns responsibilityfor sanitation to households, the disposal of waste is largely unregulated,and therefore, proper disposal of human waste is rare.179 The lack of alllevels of sanitation service results in severe health and environmentalconsequences and economic losses of an estimated 2.4% GDP equivalentto US$6.8 billion per year in 2001.180
According to the Joint Monitoring Program on access to water supply andsanitation, 76% of the urban population in Indonesia has access to basicsanitation. Based on SUSENAS data, of the urban population that hasaccess to basic sanitation at household level, 68% has access to privatebasic sanitation; 14% use shared facilities, 8% use public facilities; and10% use other non-specified facilities.
Rural sanitation coverage at household level was estimated in 1997 to beabout 44% percent.181 Of these, 45% use private facilities, 11% use sharedfacilities; another 11% use public facilities and 33% use unspecifiedfacilities. Participatory evaluations have shown that these coverage statisticsmay be masking the fact that the poor are not gaining access to improvedsanitation.182,183 In rural areas, pit latrines are the most populartechnological choice (37%) followed by use of rivers and lakes (23%),septic tanks (18%), beaches and open spaces (7%), ponds and rice fields(7%), and other sources (8%). With increasing urbanization and greateruse of piped water in urban areas, pollution levels have been increasingboth in watercourses and in wastewater, especially in the larger cities.184
Services prevent pollution through either the control of effluent dischargesinto public water bodies or through the use of public infrastructure in theform of a sewer network and appropriate treatment facilities for municipalwaste.
The lack of sanitation services is further reflected in the delivery of ‘software’sanitation services such as hygiene promotion, especially for the poor.This reliance on household level responsibility and on-site sanitation impliesthat the government has not facilitated efforts to stimulate household demandand use proper methods of sanitation. By extension there has been littlecoordination with awareness building efforts on the importance ofsanitation, few social marketing initiatives associated with improvedsanitation facilities, or efforts to stimulate demand for sanitation services.
Quality of ServiceIn the context of widespread household provision, quality of service islargely dependent on the proper functioning of on-site sanitation systems.While the extent of failure is difficult to quantify, it is known that theperformance of septic tanks presents a significant problem in urban areas.With virtually no regulation or enforcement of performance standards,most septic tanks are not appropriately designed and not adequatelymaintained.185 As a consequence, semi-treated wastewater is simplydischarged into open drains and water bodies and contributes significantlyto the increasing pollution of the urban environment. The problem isundoubtedly exacerbated further by the effects of urban stormwater, whichcauses major flushes of highly polluting material from the urban drainsinto rivers.
Septage collection and disposal is also not controlled. The city of Jakartahas only one septage treatment plant located at one end of the sprawlingcity. Consequently, unregulated and poorly supervised septage haulagecontractors from the other end of the city often simply dump waste intonearby streams and public drains under the cover of darkness. Poor designand poor performance of sludge treatment plants have affected properoperation and maintenance in some cases; in others, public pressure has
led to the abandonment septage plants without alternatives to replacethem. This has contributed significantly to urban pollution. It has beenestimated that 70-75% of organic pollutant load in Indonesia’s waterbodies comes from household waste, while the remaining 25-30 % comesfrom industries. The worst affected region appears to be West Java, followedby Central Java and Jakarta.
In community level systems in rural and low-income urban areas, a lack ofmaintenance has also been a major cause of poor performance of sanitationsystems. In some cases, inadequate supervision, coupled with a lack of(contractor and operator) accountability to communities, has resulted inpoor construction. This, in turn, has increased the cost of community-based operation and maintenance.
In rural areas, satisfaction with household sanitation facilities is closelylinked to the type of water supply facility available. Satisfaction withhousehold latrines is markedly higher in communities with piped watersupply (which can be connected to homes), than in villages with pointsources (where water for flushing has to be carried home). This has haddirect effects on use and sustainability of household latrines in rural areas.
EfficiencyMost of the performance parameters are inapplicable to the sanitationsector at its present stage of development. However, with regard to technicalperformance, in the few sewerage systems, efficiency of removal ofpollutants (measured in terms of reductions in BOD or Biochemical OxygenDemand) range from 75% to 95%.
TariffsFew households pay tariffs for sewerage, and those that exist have not beenbased on cost recovery principles, but have taken the form of a modestsurcharge over the cost of water. For instance, the surcharge rate is 15% inCirebon and 30% in Bandung, those cities with the greatest coverage. Inthe cases of Jakarta and Medan, the tariff is not related to water consumptionbut is based on floor area, building type and use. The lack of cost recoveryof sewerage services accounts at least in part for the lower levels of coverage.
For Community Sanitation Centers, a user charge is levied for each use ofthe facility. Where NGOs are the providers, the levy has often beendetermined in consultation with the users.
Given the predominance of household provision, it is the cost ofconstructing and maintaining on-site sanitation and intermittent servicingthat constitutes the service cost. This is significant and likely to far exceeda cost-recovery tariff for potential sewerage service (if that infrastructurewere costed and available).
AffordabilityIn urban areas, as sewerage tariffs are not universally charged or are in theform of a relatively small charge in relation to income, access is by far thekey issue, not affordability. However, as noted above, households are
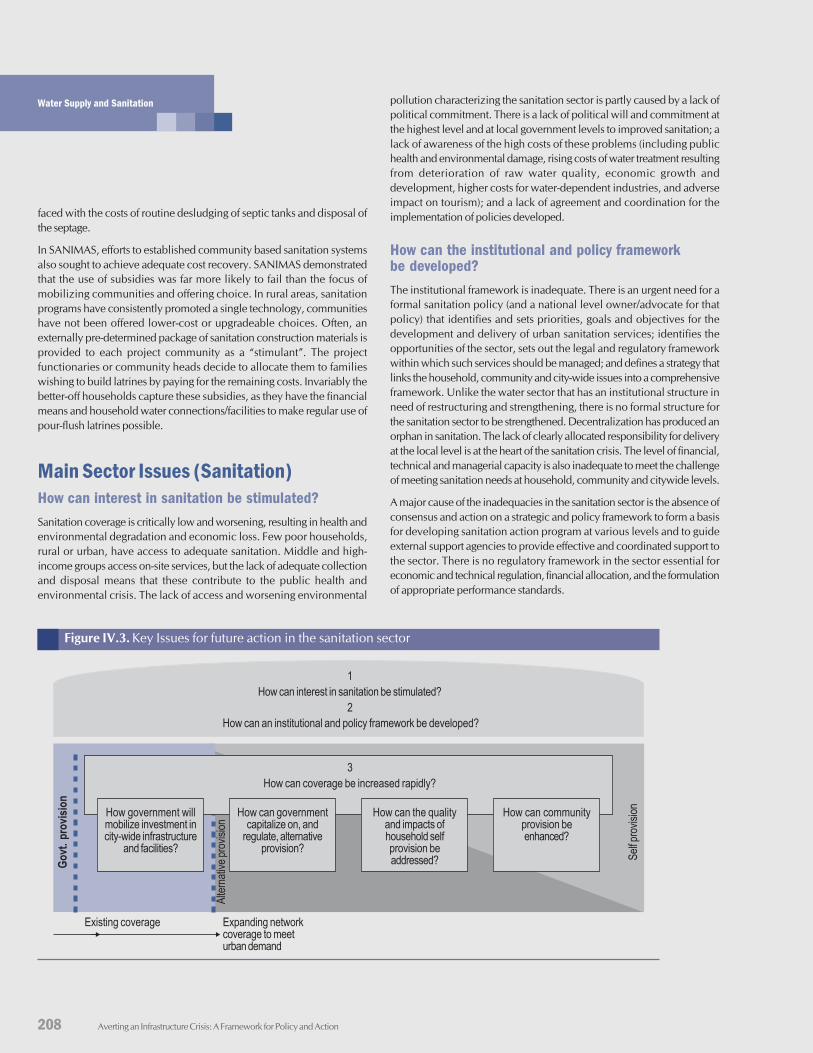
208 Averting an Infrastructure Crisis: A Framework for Policy and Action
Water Supply and Sanitation
faced with the costs of routine desludging of septic tanks and disposal ofthe septage.
In SANIMAS, efforts to established community based sanitation systemsalso sought to achieve adequate cost recovery. SANIMAS demonstratedthat the use of subsidies was far more likely to fail than the focus ofmobilizing communities and offering choice. In rural areas, sanitationprograms have consistently promoted a single technology, communitieshave not been offered lower-cost or upgradeable choices. Often, anexternally pre-determined package of sanitation construction materials isprovided to each project community as a “stimulant”. The projectfunctionaries or community heads decide to allocate them to familieswishing to build latrines by paying for the remaining costs. Invariably thebetter-off households capture these subsidies, as they have the financialmeans and household water connections/facilities to make regular use ofpour-flush latrines possible.
Main Sector Issues (Sanitation)How can interest in sanitation be stimulated?Sanitation coverage is critically low and worsening, resulting in health andenvironmental degradation and economic loss. Few poor households,rural or urban, have access to adequate sanitation. Middle and high-income groups access on-site services, but the lack of adequate collectionand disposal means that these contribute to the public health andenvironmental crisis. The lack of access and worsening environmental
pollution characterizing the sanitation sector is partly caused by a lack ofpolitical commitment. There is a lack of political will and commitment atthe highest level and at local government levels to improved sanitation; alack of awareness of the high costs of these problems (including publichealth and environmental damage, rising costs of water treatment resultingfrom deterioration of raw water quality, economic growth anddevelopment, higher costs for water-dependent industries, and adverseimpact on tourism); and a lack of agreement and coordination for theimplementation of policies developed.
How can the institutional and policy frameworkbe developed?The institutional framework is inadequate. There is an urgent need for aformal sanitation policy (and a national level owner/advocate for thatpolicy) that identifies and sets priorities, goals and objectives for thedevelopment and delivery of urban sanitation services; identifies theopportunities of the sector, sets out the legal and regulatory frameworkwithin which such services should be managed; and defines a strategy thatlinks the household, community and city-wide issues into a comprehensiveframework. Unlike the water sector that has an institutional structure inneed of restructuring and strengthening, there is no formal structure forthe sanitation sector to be strengthened. Decentralization has produced anorphan in sanitation. The lack of clearly allocated responsibility for deliveryat the local level is at the heart of the sanitation crisis. The level of financial,technical and managerial capacity is also inadequate to meet the challengeof meeting sanitation needs at household, community and citywide levels.
A major cause of the inadequacies in the sanitation sector is the absence ofconsensus and action on a strategic and policy framework to form a basisfor developing sanitation action program at various levels and to guideexternal support agencies to provide effective and coordinated support tothe sector. There is no regulatory framework in the sector essential foreconomic and technical regulation, financial allocation, and the formulationof appropriate performance standards.
1How can interest in sanitation be stimulated?
2 How can an institutional and policy framework be developed?
Existing coverage Expanding networkcoverage to meeturban demand
3How can coverage be increased rapidly?
How government willmobilize investment incity-wide infrastructure
and facilities?
How can governmentcapitalize on, and
regulate, alternativeprovision?
How can the qualityand impacts ofhousehold selfprovision beaddressed?
How can communityprovision beenhanced?
Govt
. pro
visio
n
Alter
nativ
e pro
vision
Self p
rovis
ionFigure IV.3. Key Issues for future action in the sanitation sector
209
IVBackgroundSector Report
How can coverage be rapidly increased?Current levels of investment are inadequate. Financing is a problem notonly for new and rehabilitation works, but also for operation andmaintenance. This is caused by inadequate cost recovery mechanisms andlack of a proper institutional structure for the sector. The problemsassociated with financing of new investments and solutions are the sameas those associated with the water supply sector. Absence of appropriateincentives is a major factor that prevents local governments from borrowingor committing funds to the sanitation sector at all levels within theirjurisdiction.
To increase coverage rapidly and affordably, the solutions to the sanitationcrisis will inevitably involve all forms of provision, and will need to placegovernment, independent providers, communities and householders in amulti-provider framework. Consequently, it is necessary to understand:
• How government will mobilize investment in city-wide infrastructureand facilities?
• How government can capitalize on, and regulate, alternative provision?
• How the quality and impacts of household self provision can beaddressed?
• How community provision can be enhanced?
The Way Forward ( Water and Sanitation)In nearly all contexts, water and sanitation in Indonesia have functioned astwo separate sectors. In terms of institutional, financial and technicalaspects of delivery there is little similarity or convergence, and little reflectionof a holistic system of water supply and wastewater disposal. This cannotbe over-emphasized. The unbundling of sectors that are inextricably linkedmay be useful at this stage, however for detailed analysis and for tacklingthe idiosyncrasies of reform and sector development, the way forward isto create greater integration and understanding of the dual nature of thewater and sanitation sector. The lack of connection in the eyes ofpolicymakers is a critical gap to be addressed in the development of capacityin the future.
Water SupplyThe financial health of the water sector has now been taken up as a priorityitem of Government. The Coordination Ministry for Economic Affairs hasbeen mandated to look into the burden of debt plaguing the sector and toestablish an agenda for comprehensive policy reform and a Committeeestablished to accelerate infrastructure development is considering debtrestructuring guidelines.186 The above actions make it possible to undertakea national roll-out of the Financial Rescue Program since it providesadditional incentives to PDAMs and local governments to come to thetable and agree on more substantial performance action items.
These government actions need to be extended by strategic planning in thesector that reflects the importance of alternative supply mechanisms andprovides the necessary institutional supporting arrangements. With theaim of addressing the potential health, environmental and economic impactsof the sector, a strategic framework would identify key initiatives in relationto the necessary expansion of water supply and sewerage services, addressself provision, facilitate alternative approaches to delivery and underpinthese in the regulatory, legislative and institutional framework.
Key actions for government fall into five key areas:Develop an enabling framework to revitalize thewater sectorAlthough efforts are underway to improve the policy environment forwater services, it is necessary to ensure the reform package is comprehensiveand results in an enabling framework to revitalize the water sector. Itshould address policy-making, regulation, and institutions, and should befollowed with an action plan for implementation and the resources tomake it happen.
• Formulate a comprehensive policy and legislative framework withstrategies and action plans for implementation.
The policy framework should explicitly target the poor, eliminatebarriers to entry for non-PDAM providers, encourage furtherdevelopment of community-managed systems, and address issues ofprice and performance standards. Specific interventions and targetingmechanisms are required both in rural and urban areas to mitigateproblems faced by the poor and improve their access to water andsanitation services.
Elements of the necessary legal framework exist, but require revision toreflect the opportunities of decentralization and private sectorparticipation and to remove impediments to implementation.187 Alegislative and regulatory framework for the sector will require theownership and agreement of all parties at central and local governmentlevels and consistent local government regulations are an essentialaspect of the overall framework. In the short to medium term, given theshortfall in PDAM distribution, there is a need to recognize existingopportunities and create new opportunities for all providers(independent, community, household) within the scope of a predefinedregulatory environment. Appropriate performance standards regulatingquality and operations will need to be established,188 which enable theadoption of technologies that end-users can afford. At the same time,appropriate arrangements for enforcement, including appropriatesanctions and rewards, need to be put in place.
It is vital to strengthen sector data at an early stage. Current informationis neither accurate nor consistent, and the sector lacks rigorousmonitoring and evaluation. Once relevant data is updated, it is vitalthat it be kept updated on a bi-annual basis. Benchmarking arrangementson all aspects of performance, including the impact on the poor, andthe publication of this data would provide incentives to improveperformance.
• Revise the allocation of responsibilities
In view of the changes associated with decentralization, it is necessaryto clarify roles, responsibilities and relationships for the various functionsthat need to be performed in the sector, including policy making,financing, service provision and regulation. In addition, the allocationof risks has to be reviewed so that they can be assigned to those parties
210 Averting an Infrastructure Crisis: A Framework for Policy and Action
Water Supply and Sanitation
best able to bear and to manage them. Some of the key functions include
• GOI’s policy-making role in the water and sanitation sector shouldbe emphasized and focused on adopting measures, not only torevitalize PDAMs to plan for future expansion of their coverage, butalso to encourage efficient service provision by other existingproviders (such as community organizations, alternative providersand the large-scale private sector), and to facilitate innovation in thesector in relation to delivery to the poor.
• MOF needs to continue to bear foreign exchange risks, whiledeveloping mechanisms for encouraging domestic investment andan accurate approach to pricing loans and covering foreign currencyrisks. A common guarantee framework needs to be established atthe national level for sub-sovereign guarantees that could be extendedby local governments to certain projects.
• KIMPRASWIL, as the sector ministry, has the important roles ofbenchmarking sector performance trends, providing technicalassistance to PDAMs on a demand basis, and overseeing GOI-funded targeted programs.
• Local government needs to assume regulatory and planningresponsibilities.
• Move towards cost-recovery and a predictable tariff regime
Efforts should focus on developing and implementing policy that ensureswater and sanitation services become self-financing. A process ofongoing restructuring of the tariff regime is critical to achievingsustainability, generating a reliable cash flow to cover operating expenses,paying debt obligations, funding new investments to increase servicecoverage, and improving reliability. It is also necessary to ensure thattariff structures do not create barriers or marginalize and discriminateagainst poor consumers. Price also needs to be correlated withappropriate performance standards.
The strategy would also need to ensure that pricing becomes predictableand stable. This will require local government commitment to areformed regulatory framework. In order to promote the adoption ofsustainable, cost-covering prices, a national body could be set up withthe task of advising local governments on price setting issues (requiringthat these opinions be published might give them more weight). Localgovernments could also be given the option to delegate to that bodytheir price setting responsibilities.
Launch a program to establish efficient and viablewater utilities• Establish commitment to reforms in Local Governments
Commitment to reform is not a given but can be developed throughsupportive technical assistance to reform-minded local governments.Building capacity and awareness amongst implementing agencies andleaders is a vital ingredient of change that can be strengthened by providingpolitical incentives to formulate (and enforce) local regulations.
• Carry out a widespread program of PDAM reform
Within the context of broader sectoral reform, a well-managed programfor restructuring inefficient and financially burdened PDAMs wouldhave a significant impact on the sector and its ability to expand coverageand serve poor communities. The PDAM rescue program takes eachcase on a demand basis and, in exchange for debt restructuring, developsfinancial recovery plans with agreed actions to be taken by PDAMmanagement and local governments. The rollout of this program wouldinclude significant monitoring to ensure the financial revitalizationcourse is maintained. Support will be required to assist local governmentto identify the most appropriate management and organizationalsolution(s) and to implement a plan of action. A number of options tocreate efficient functional PDAMs are under discussion and are suggestedbelow. Before any other steps can be taken, however, the first of these,debt restructuring and rescheduling is urgently required. The financialring fencing of sectoral activities is a key milestone in the push to createefficient organizations and sectoral governance.
Pilot activities have provided a number of lessons on how a broaderPDAM reform program will work. These include the need to involvelocal government and establish strong political will for change amongstkey stakeholders, that changes in management alone will not solve thePDAM problems; to consider ways of recapitalizing on assets, chargingcost-recovery tariffs and ensuring autonomy; to manage debtrescheduling; to take account of different conditions and specific ratherthan general solutions; and to ensure monitoring of financial recoveryplans and the capacity to undertake the required follow-up.
Through a process of corporatization, improved management andpartnerships with all stakeholders, the current PDAM should aim tobecome a functional utility able to draw in the resources of allstakeholders and maximize on the potential roles of other existing andnew stakeholders – household, community or small-scale providers.The first step is a new level of viability enabled by debt restructuring,and also accountability developed through restructured organizationsunder new management rules and a revised regulatory regime, providingdemand-led services. A key part of this process is creating citizen demandfor improved services through increased community awareness andthe adequate price structure of piped water versus other sources ofwater.
Through the reform of PDAMs greater transparency and accountabilityshould be achieved. It would be useful to also prepare general guidelinesat the national level (and ensure enforcement at the local level) toeliminate: (i) anti-competitive agreements between PDAMs andestablished water vendors; (ii) anti-competitive practices by PDAMsthat exploit their exclusivity rights in the franchised area. It is necessaryto promote broader partnerships that enhance transparency of PDAMactivities and in particular strengthen the capacity of public sectoragencies to work with private developers as well as communities andsmall-scale providers. Creating more dialogue and awareness ofconsumer roles in enhancing and monitoring performance is a key stepin improving accountability.
Debt Restructuring: It is necessary to develop guidelines for debtrestructuring and re-scheduling. The restructuring process will requiredecisive support to PDAMs from MOF and local governments throughequity contributions and rescheduling of existing debt.
211
IVBackgroundSector Report
Corporatization: Creating autonomous limited companies, protectedfrom local government interference is a key starting point of reform.Converting PDAMs into corporate entities with an independent Boardof Directors would enable these utilities to adopt standard operationalbusiness practices, be independently audited and be exempted fromunduly restrictive civil service rules. Assistance would establish specificguidelines for the corporatization process where utilities are viableentities and this is an appropriate solution.
Mergers: A majority of PDAMs are currently not viable operations. Asthe advantages of economies of scale become more apparent, it isanticipated that more local governments will merge, following the leadof reform-minded PDAMs.189 Incentives should be provided to localgovernments to accelerate such reforms. An additional advantage ofcreating larger, more autonomous PDAMs is to eventually facilitatetheir access to the commercial banking and capital markets.
Private Sector Participation: Corporatization and economies of scaleare likely to both precede and generate private sector interest. Ultimately,the level and form of private participation, be it in relation to investmentor delegated management, depends upon the objectives being pursued.In the Indonesian context, redefining the financing framework, reformingregulatory arrangements, and converting the local governments to sub-national guarantors, are key steps in this process.
Rethinking monopoly status: Rethinking exclusivity and fostering a moreopen market ultimately results in better utility coverage and improvedoutcomes. Alternative providers are distributing PDAM water withoutregulation or control and exacerbate rent-seeking behavior. Best practiceelsewhere has shown unequivocally that, given the right incentives,utilities can work effectively in transparent partnerships with local small-scale providers and communities. The unbundling of production anddistribution functions should be accompanied by regularization ofreselling (watchful of disincentives), enabling greater control over quality,less NRW and can provide greater protection to the poor.
Eliminate barriers to entry: It is therefore necessary to eliminate barriersto entry into the market for water vending and small-scale waterincluding: (i) anti-competitive agreements between PDAMs and certainwater vendors aimed at preventing other water vendors from enteringthe market; (ii) exclusive rights granted to PDAMs to serve certainareas, which make small-scale supply and vending illegal and discourageentry; (iii) anti-competitive practices by PDAMs vis-ŕ-vis small-scalesuppliers of piped water.
Expand network coverage to meet growing urbandemandsIn view of the 4.4% urban growth and the critical role of cities in economicgrowth, it is necessary to work with reform-minded PDAMs and /or localgovernment to improve and extend network coverage and meet growingdemand. For selected PDAMs and LGs, a strategic framework and actionplanning process should be undertaken to instigate investment programsin urban areas. Significant investment is required to increase bulk supply,treatment and distribution of water. Before any new investments areconsidered it is first necessary to develop a clearer understanding of theefficiency and effectiveness of current investments, to address any blockagesidentified, and to ensure that a monitoring and evaluation regime (includingefficiency and targeting) forms a critical part of the reform and investmentprocess.
National government will need to develop a new financing frameworktogether with a plan for its operationalization. KMK35, which regulatesmulti-lateral and bi-lateral funding to PDAMs needs to be operationalizedto encourage reform-minded PDAMs and to endorse the actions of thoselocal governments that have corporatized the PDAM function (as well asoutput-based aid schemes targeted at the poor). A key component of thisexpansion is the inclusion of poor households and communities inunderserved areas (to an agreed target by 2015), if necessary through thedesign of appropriate low-cost interventions.
Capitalize on the potential of the alternative waterprovider marketGiven the limited coverage of PDAM provision at present, it is vital thatthe alternative sector of intermediate and independent operators and serviceproviders is drawn in, and not excluded. More information is needed tounderstand how it works, what services are provided, whom it supplies,the levels of investment, mechanisms for pricing and market entry, and theblockages to this form of provision.
As a part of broader strategic planning process it is vital to consider thepotential mechanisms for encouraging effective contribution of SSPWPs inthe sector. The enabling framework described above would includeprovision for the encouragement of small-scale private initiative and removeany legal blockages constraining small and medium-scale providers fromimproving the scope and quality of their inputs in the sector. While theframework should control exploitative behavior, anti-competitiveassociations with PDAMs and other dubious practices, care must be takento ensure the regulatory regime does not create disincentives for investment.In addition, the local private sector operators would benefit from capacitybuilding initiatives to support and extend their businesses (e.g. technicaland financial management support) and from development of mechanismsfor SSPWPs to interface effectively with utilities190 and enforcementagencies. Consideration should be given at the local level as to whether thepromotion of small-scale private sector involvement should be targeted atexpanding existing businesses or expanding the market with new businesses,or both. Efforts supporting self-regulation in the form of providerassociations may be workable in some circumstances.
Establish a strategy and action plan to encouragecommunity–managed provisionInformed choice is the basis for demand-responsive approaches andcommunity decision-making and management of water supply systems isat the forefront of the strategy of improving rural access. The involvementof communities (and especially women) is a key factor in securing ownershipand sustainability, and corollaries include stakeholder endorsement ofcost recovery, enforcing accountability of all service providers, and betteroperation and maintenance. A number of government actions wouldremove constraints to, and promote further action by, communities. Inparticular it is necessary to:
212 Averting an Infrastructure Crisis: A Framework for Policy and Action
Water Supply and Sanitation
• Operationalize the community-managed services policy framework.Implement action plan in agreed areas and monitor progress and arisingblockages. The policy framework developed through WASPOLA (to bepromulgated through a ministerial decree) requires financial supportand dissemination. It is vital that efforts are taken to build on the WSLICcommunity model to facilitate the scaling up of community-managementin rural areas not served by formal utility arrangements.
• Develop a financing strategy for community level activity. Large-scaleinvestment is then needed in coordination with other large-scale donorsto increase the poor’s access to services in rural areas. Guidelines andtesting of approaches in relation to cost recovery should be a key aspectof the financial strategy adopted.
• Support implementation at the local level through capacity building.Blockages to the operationalization of policy in local government needto be addressed through building capacity and developing incentivemechanisms. It is not only necessary to generate better understandingof the benefits of the approach but also to clear the way for establishingclarity of ownership of community schemes and enabling communitycontracting processes to be implemented. Currently, presidential decreesexist to allow these practices but they are either considered unclear, orare ignored or evaded at the local government level.
Establish a strategy and action plan for regulatinghousehold self–provisionThe level and location of household provisioning needs oversight tominimize the potential impact on the environment and to ensure thatwater quality standards are maintained. In particular it is necessary to:
• Develop a regime for regulating household provision and ensureenforcement. This would include efforts to understand local impactsand the restrictions needed to protect ground water resources. It is alsonecessary to ensure technical standards for construction and to considerhow and where enforcement can best be achieved.
• Facilitate changeover to network service as adequacy improves. In themedium term, and especially in large urban areas, it is necessary todevelop a strategy enabling a transition to the network system as thesedevelop. This is necessary both to promote efficient utility provisionthrough the development of networks with economies of scale and toplace restrictions on unregulated ground water extraction.
SanitationUrgent action is also recommended for developing a national sanitationpolicy. Although the way forward is the subject of some debate, the mainconstraints revolve around a lack of political will, a lack of policy, and alack of institutional responsibility at both national and local levels. In theimmediate future, action needs to be taken to recognize, regulate andenhance the activities of those actors that have stepped in to fill the gaps inservice provision, but a more comprehensive approach is essential for thelonger term and would include the following steps recommended forgovernment.
Develop a nation-wide campaign to focus attentionon the impacts of inadequate sanitation• Develop a strategy for securing political will for sanitation
An advocacy campaign is required to secure awareness and commitmentto sanitation at the highest political level at central, regional and localgovernment levels in the country.
• Develop a nation-wide capacity and awareness building strategy
Advocacy work amongst politicians should be accompanied by abroader awareness-raising campaign targeted at civil society, especiallyamongst school children and women, that identifies and generateslocal interest in the household and community benefits of improvedsanitation. Political will can only arise from more aware citizensdemanding change and a more receptive political climate.
• Develop a National Sanitation Policy and Strategy
To provide the basis for the development of a legal and regulatoryframework for investment in sanitation, a national sanitation policy isvital. It should outline rights, responsibilities of households, localgovernment and national government, create incentives, proposefinancing options as well as mechanisms to ensure demandresponsiveness, and provide for the involvement of the private sector.In addition, it should address the issues brought about bydecentralization and the implications for bundling and unbundlingsanitation in urban areas particularly.
Develop a relevant institutional and policy frame-work• Identify departmental responsibility for, and initiate, sanitation
policymaking
At the national level, government should urgently identify departmentalresponsibility for sanitation policy development and clarifyresponsibility at local level. It will then be possible to:
• develop a national policy framework that recognizes the need for amulti-provider solution, as well as define appropriate standards;
• develop an enabling framework to operationalize the policy agenda;
• allocate central funds to address the inadequacy of sanitationinfrastructure;
• develop sustainable public and private sector (and user) financinginstruments;
• assist local governments develop strategies and action plans forimplementation, and support these with technical assistance andguidelines to assist them to prepare strategic sanitation plans (whichthey need for qualifying for DAK incentive mechanisms);
• support a process of capacity building for sanitation service deliveryto undertake priority interventions to pave the way for sustainableinvestments and expansion of service in the sanitation sector;
• create incentives and sanctions to ensure local governments improvesanitation services.
At the local level, government should:
• stimulate demand for improving the local environment and healththrough better sanitation.
• develop and roll-out a multi-provider strategy for community,household and small scale provider activity;
213
IVBackgroundSector Report
• develop a local regulatory framework to operationalize policyagenda, strengthen compliance in relation to sanitation, and addresscost recovery.
• generate political will and develop capacity for implementing thenew policy agenda and build awareness of the policy frameworkamongst the stakeholders responsible for implementation.
• ensure that the sanitation agenda is emphasized until coverage targetsare reached.
Prescribe a pro-active financing and strategicplanning role for government in sanitation servicedelivery• Underpin financing of the sanitation sector
Fundamental to any reform of the sanitation sector is a financing strategywhich addresses the chronic under-investment of the past. Newinstitutions, no matter how effective, will be unable to address thepublic good aspect of sanitation, without adequate finance. Althoughmuch of the problem of sanitation can be traced back to the lack ofdemand and lack of institutional clarity, the fundamental absence offunding to the sector is both a cause and effect. Incentive-basedmanagement for effective cost recovery approaches will be crucial toeffective use of funding.
It will be necessary to establish sector-specific central funds to financelocal governments plans, (structured through incentives for innovativesolutions in sanitation investment), and to introduce a demandresponsiveness in the distribution of targeted resources. Providing localgovernments sufficient support to realize their investments is critical toestablishing a pattern of change and success in the sector. Meetingincreased demand for sanitation with improved supply is a criticalaspect of stimulating the sector. The investment strategy should improveaccess to treatment and disposal facilities that are appropriate underlocal conditions . There is a need for the government to takeresponsibility for facilitating disposal and secondary services needed tosupplement on-site sanitation.
• Formulate a strategy to regulate on-site sanitation
In order to understand the existing dimensions of sanitation servicedelivery, there is a need for a review of the status and conditions at thecommunity and household levels. A thorough mapping and impactanalysis would help strengthen the efforts needed to support existingdelivery processes at the local level. With stronger political will andstrengthened capacity, it is necessary for local governments to developand implement a regulatory regime for household sanitation, withspecific time bound targets. This should include technical standards forconstruction of on-site sanitation and disposal. In large cities, aforeseeable goal will be to shift from on-site sanitation to networksewerage, and it will be vital to put in place a strategy for such atransition, once institutions are reformed and investment is facilitated.
• Formulate a strategy to enhance, scale-up and replicate communityinitiatives
Community involvement is essential to stimulate demand, identifypriority investments and mobilize the resources needed to constructsanitation infrastructure at the household level. Better understandingand specific action is needed to enhance the role played by community-managed sanitation systems in rural and low-income urban areas. Stepswould include the development of a strategy towards scaling-upcommunity sanitation models to link into city-wide institutions andinfrastructure, and working in conjunction with identified governmentand local communities to pilot, monitor and evaluate the scaling upprocess and then launch a nation-wide replication campaign.
• Capitalize on, and regulate activities by private small-scale providersand householders
Small-scale private providers currently play a critical role in supportingexisting provision and will continue to do so in the foreseeable future.It is necessary to better understand the various services they provide, towhat extent, where and how they perform them (where they dumpwaste, what the standard is etc.) and to then respond to this at the locallevel to enhance their performance and contribution to the sector.
In order to draw small-scale independent providers into a functioningand structured sector, it will be necessary to:
• identify optimal relationships between SSIPs and local government,and review relationships with households,
• address factors constraining investment such as insecurity of tenure,
• develop a strategy for the short and medium term (in the absence ofinfrastructure and facilities) to enhance SSPWP service and to provideincentives and demand-led support packages to improve service toconsumers and facilitate disposal caused by widespreadcontamination of indiscriminate dumping;
• develop an approach to regulation, through licensing and localregulations appropriate to the context (recognizing the disincentivessuch formalization may create).
The suggested program for Government action is given below. Thematrix covers steps to be taken in the immediate term (0-2 years) andmedium term (up to 5 years) and these actions are separated into waterand sanitation sectors.
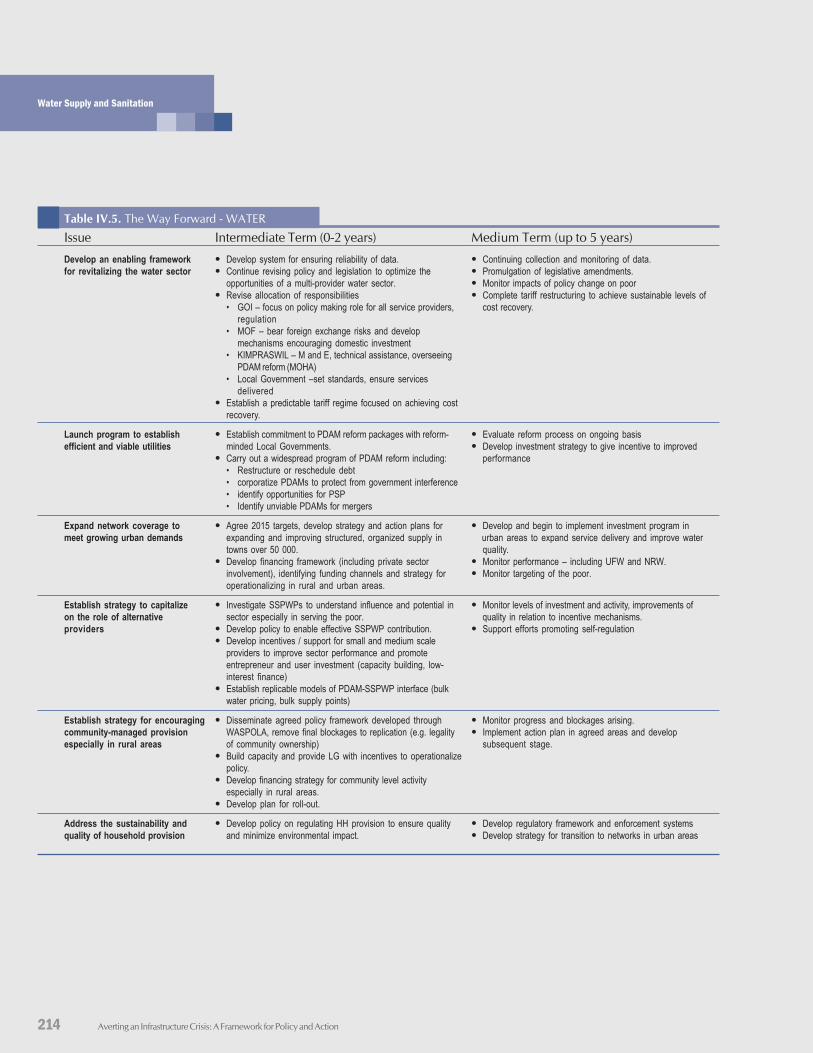
214 Averting an Infrastructure Crisis: A Framework for Policy and Action
Water Supply and Sanitation
Table IV.5. The Way Forward - WATER
Issue Intermediate Term (0-2 years) Medium Term (up to 5 years)
Develop an enabling framework • Develop system for ensuring reliability of data. • Continuing collection and monitoring of data.for revitalizing the water sector • Continue revising policy and legislation to optimize the • Promulgation of legislative amendments.
opportunities of a multi-provider water sector. • Monitor impacts of policy change on poor• Revise allocation of responsibilities • Complete tariff restructuring to achieve sustainable levels of
• GOI – focus on policy making role for all service providers, cost recovery.regulation
• MOF – bear foreign exchange risks and developmechanisms encouraging domestic investment
• KIMPRASWIL – M and E, technical assistance, overseeingPDAM reform (MOHA)
• Local Government –set standards, ensure servicesdelivered
• Establish a predictable tariff regime focused on achieving costrecovery.
Launch program to establish • Establish commitment to PDAM reform packages with reform- • Evaluate reform process on ongoing basisefficient and viable utilities minded Local Governments. • Develop investment strategy to give incentive to improved
• Carry out a widespread program of PDAM reform including: performance• Restructure or reschedule debt• corporatize PDAMs to protect from government interference• identify opportunities for PSP• Identify unviable PDAMs for mergers
Expand network coverage to • Agree 2015 targets, develop strategy and action plans for • Develop and begin to implement investment program inmeet growing urban demands expanding and improving structured, organized supply in urban areas to expand service delivery and improve water
towns over 50 000. quality.• Develop financing framework (including private sector • Monitor performance – including UFW and NRW.
involvement), identifying funding channels and strategy for • Monitor targeting of the poor.operationalizing in rural and urban areas.
Establish strategy to capitalize • Investigate SSPWPs to understand influence and potential in • Monitor levels of investment and activity, improvements ofon the role of alternative sector especially in serving the poor. quality in relation to incentive mechanisms.providers • Develop policy to enable effective SSPWP contribution. • Support efforts promoting self-regulation
• Develop incentives / support for small and medium scaleproviders to improve sector performance and promoteentrepreneur and user investment (capacity building, low-interest finance)
• Establish replicable models of PDAM-SSPWP interface (bulkwater pricing, bulk supply points)
Establish strategy for encouraging • Disseminate agreed policy framework developed through • Monitor progress and blockages arising.community-managed provision WASPOLA, remove final blockages to replication (e.g. legality • Implement action plan in agreed areas and developespecially in rural areas of community ownership) subsequent stage.
• Build capacity and provide LG with incentives to operationalizepolicy.
• Develop financing strategy for community level activityespecially in rural areas.
• Develop plan for roll-out.
Address the sustainability and • Develop policy on regulating HH provision to ensure quality • Develop regulatory framework and enforcement systemsquality of household provision and minimize environmental impact. • Develop strategy for transition to networks in urban areas
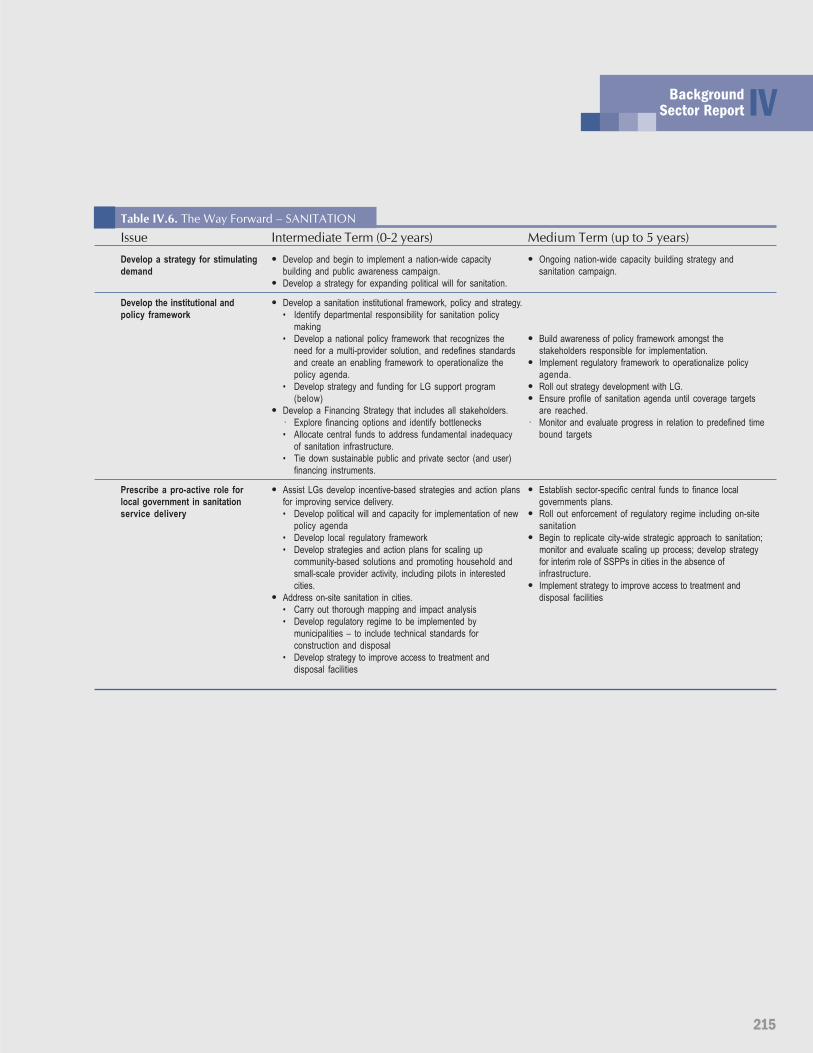
215
IVBackgroundSector Report
Table IV.6. The Way Forward – SANITATION
Issue Intermediate Term (0-2 years) Medium Term (up to 5 years)
Develop a strategy for stimulating • Develop and begin to implement a nation-wide capacity • Ongoing nation-wide capacity building strategy anddemand building and public awareness campaign. sanitation campaign.
• Develop a strategy for expanding political will for sanitation.
Develop the institutional and • Develop a sanitation institutional framework, policy and strategy.policy framework • Identify departmental responsibility for sanitation policy
making• Develop a national policy framework that recognizes the • Build awareness of policy framework amongst the
need for a multi-provider solution, and redefines standards stakeholders responsible for implementation.and create an enabling framework to operationalize the • Implement regulatory framework to operationalize policypolicy agenda. agenda.
• Develop strategy and funding for LG support program • Roll out strategy development with LG.(below) • Ensure profile of sanitation agenda until coverage targets
• Develop a Financing Strategy that includes all stakeholders. are reached.· Explore financing options and identify bottlenecks · Monitor and evaluate progress in relation to predefined time• Allocate central funds to address fundamental inadequacy bound targets
of sanitation infrastructure.• Tie down sustainable public and private sector (and user)
financing instruments.
Prescribe a pro-active role for • Assist LGs develop incentive-based strategies and action plans • Establish sector-specific central funds to finance locallocal government in sanitation for improving service delivery. governments plans.service delivery • Develop political will and capacity for implementation of new • Roll out enforcement of regulatory regime including on-site
policy agenda sanitation• Develop local regulatory framework • Begin to replicate city-wide strategic approach to sanitation;• Develop strategies and action plans for scaling up monitor and evaluate scaling up process; develop strategy
community-based solutions and promoting household and for interim role of SSPPs in cities in the absence ofsmall-scale provider activity, including pilots in interested infrastructure.cities. • Implement strategy to improve access to treatment and
• Address on-site sanitation in cities. disposal facilities• Carry out thorough mapping and impact analysis• Develop regulatory regime to be implemented by
municipalities – to include technical standards forconstruction and disposal
• Develop strategy to improve access to treatment anddisposal facilities
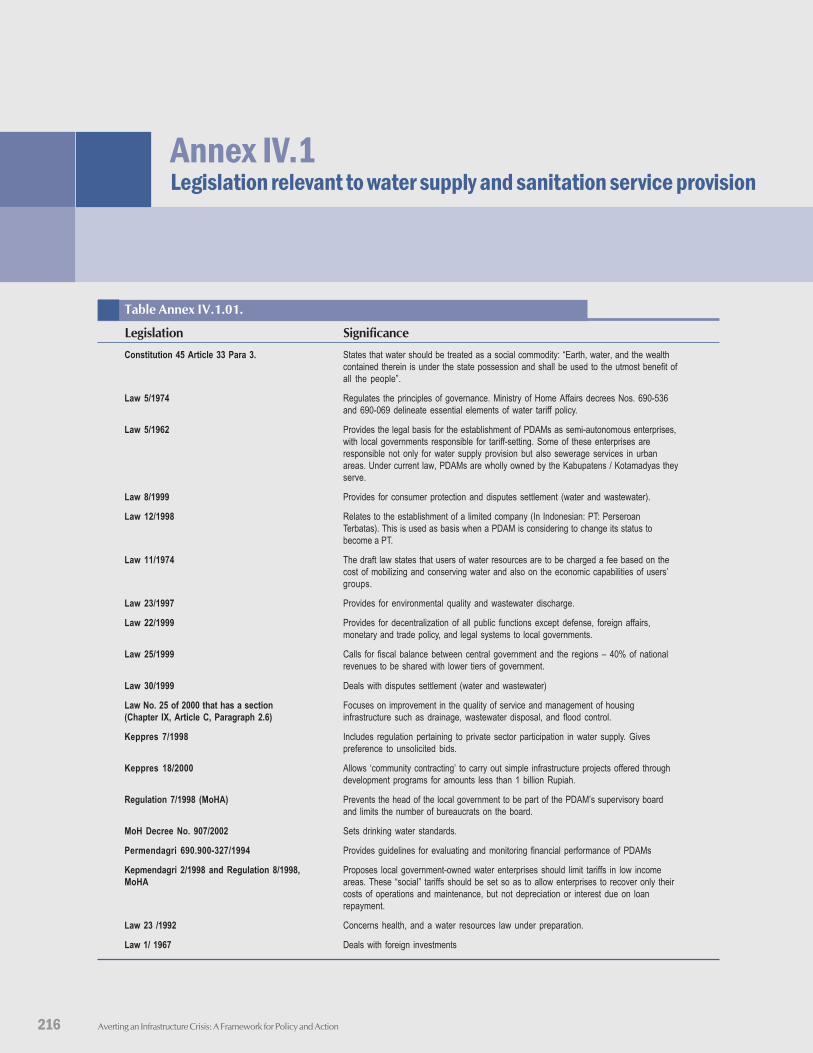
Averting an Infrastructure Crisis: A Framework for Policy and Action216
Annex IV.1Legislation relevant to water supply and sanitation service provision
Table Annex IV.1.01.
Legislation SignificanceConstitution 45 Article 33 Para 3. States that water should be treated as a social commodity: “Earth, water, and the wealth
contained therein is under the state possession and shall be used to the utmost benefit ofall the people”.
Law 5/1974 Regulates the principles of governance. Ministry of Home Affairs decrees Nos. 690-536and 690-069 delineate essential elements of water tariff policy.
Law 5/1962 Provides the legal basis for the establishment of PDAMs as semi-autonomous enterprises,with local governments responsible for tariff-setting. Some of these enterprises areresponsible not only for water supply provision but also sewerage services in urbanareas. Under current law, PDAMs are wholly owned by the Kabupatens / Kotamadyas theyserve.
Law 8/1999 Provides for consumer protection and disputes settlement (water and wastewater).
Law 12/1998 Relates to the establishment of a limited company (In Indonesian: PT: PerseroanTerbatas). This is used as basis when a PDAM is considering to change its status tobecome a PT.
Law 11/1974 The draft law states that users of water resources are to be charged a fee based on thecost of mobilizing and conserving water and also on the economic capabilities of users’groups.
Law 23/1997 Provides for environmental quality and wastewater discharge.
Law 22/1999 Provides for decentralization of all public functions except defense, foreign affairs,monetary and trade policy, and legal systems to local governments.
Law 25/1999 Calls for fiscal balance between central government and the regions – 40% of nationalrevenues to be shared with lower tiers of government.
Law 30/1999 Deals with disputes settlement (water and wastewater)
Law No. 25 of 2000 that has a section Focuses on improvement in the quality of service and management of housing(Chapter IX, Article C, Paragraph 2.6) infrastructure such as drainage, wastewater disposal, and flood control.
Keppres 7/1998 Includes regulation pertaining to private sector participation in water supply. Givespreference to unsolicited bids.
Keppres 18/2000 Allows ‘community contracting’ to carry out simple infrastructure projects offered throughdevelopment programs for amounts less than 1 billion Rupiah.
Regulation 7/1998 (MoHA) Prevents the head of the local government to be part of the PDAM’s supervisory boardand limits the number of bureaucrats on the board.
MoH Decree No. 907/2002 Sets drinking water standards.
Permendagri 690.900-327/1994 Provides guidelines for evaluating and monitoring financial performance of PDAMs
Kepmendagri 2/1998 and Regulation 8/1998, Proposes local government-owned water enterprises should limit tariffs in low incomeMoHA areas. These “social” tariffs should be set so as to allow enterprises to recover only their
costs of operations and maintenance, but not depreciation or interest due on loanrepayment.
Law 23 /1992 Concerns health, and a water resources law under preparation.
Law 1/ 1967 Deals with foreign investments
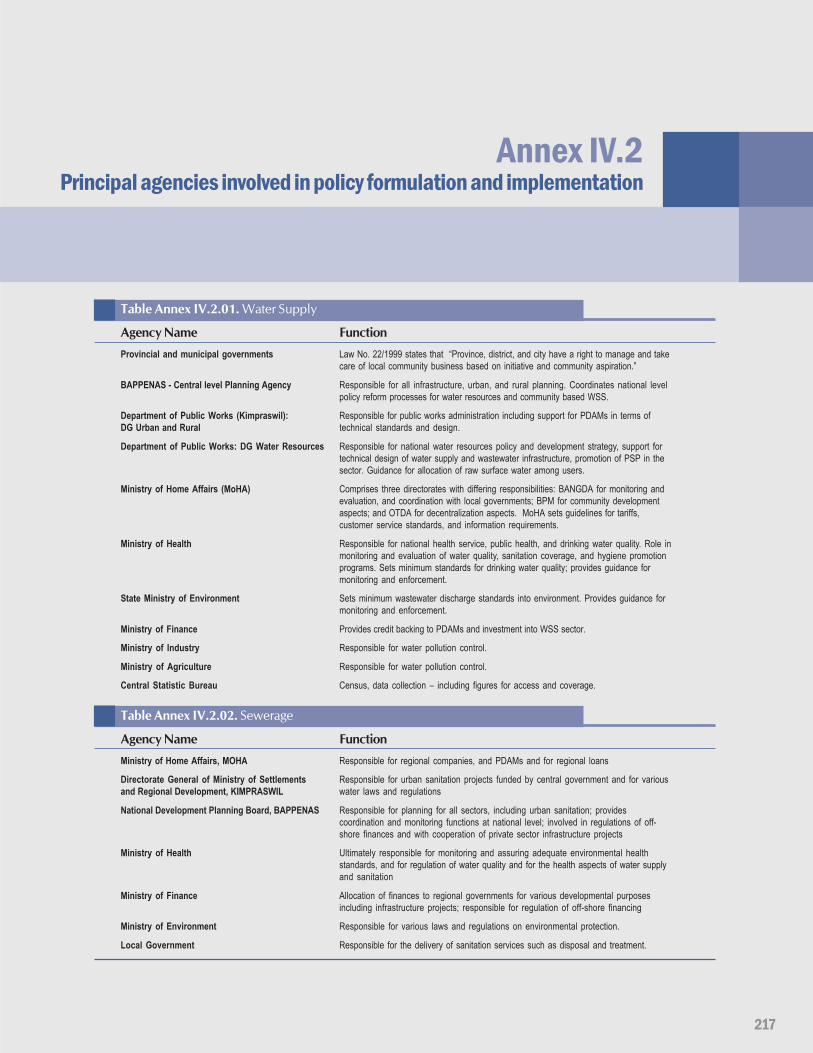
217
Annex IV.2Principal agencies involved in policy formulation and implementation
Table Annex IV.2.01. Water Supply
Agency Name FunctionProvincial and municipal governments Law No. 22/1999 states that “Province, district, and city have a right to manage and take
care of local community business based on initiative and community aspiration.”
BAPPENAS - Central level Planning Agency Responsible for all infrastructure, urban, and rural planning. Coordinates national levelpolicy reform processes for water resources and community based WSS.
Department of Public Works (Kimpraswil): Responsible for public works administration including support for PDAMs in terms ofDG Urban and Rural technical standards and design.
Department of Public Works: DG Water Resources Responsible for national water resources policy and development strategy, support fortechnical design of water supply and wastewater infrastructure, promotion of PSP in thesector. Guidance for allocation of raw surface water among users.
Ministry of Home Affairs (MoHA) Comprises three directorates with differing responsibilities: BANGDA for monitoring andevaluation, and coordination with local governments; BPM for community developmentaspects; and OTDA for decentralization aspects. MoHA sets guidelines for tariffs,customer service standards, and information requirements.
Ministry of Health Responsible for national health service, public health, and drinking water quality. Role inmonitoring and evaluation of water quality, sanitation coverage, and hygiene promotionprograms. Sets minimum standards for drinking water quality; provides guidance formonitoring and enforcement.
State Ministry of Environment Sets minimum wastewater discharge standards into environment. Provides guidance formonitoring and enforcement.
Ministry of Finance Provides credit backing to PDAMs and investment into WSS sector.
Ministry of Industry Responsible for water pollution control.
Ministry of Agriculture Responsible for water pollution control.
Central Statistic Bureau Census, data collection – including figures for access and coverage.
Table Annex IV.2.02. Sewerage
Agency Name FunctionMinistry of Home Affairs, MOHA Responsible for regional companies, and PDAMs and for regional loans
Directorate General of Ministry of Settlements Responsible for urban sanitation projects funded by central government and for variousand Regional Development, KIMPRASWIL water laws and regulations
National Development Planning Board, BAPPENAS Responsible for planning for all sectors, including urban sanitation; providescoordination and monitoring functions at national level; involved in regulations of off-shore finances and with cooperation of private sector infrastructure projects
Ministry of Health Ultimately responsible for monitoring and assuring adequate environmental healthstandards, and for regulation of water quality and for the health aspects of water supplyand sanitation
Ministry of Finance Allocation of finances to regional governments for various developmental purposesincluding infrastructure projects; responsible for regulation of off-shore financing
Ministry of Environment Responsible for various laws and regulations on environmental protection.
Local Government Responsible for the delivery of sanitation services such as disposal and treatment.
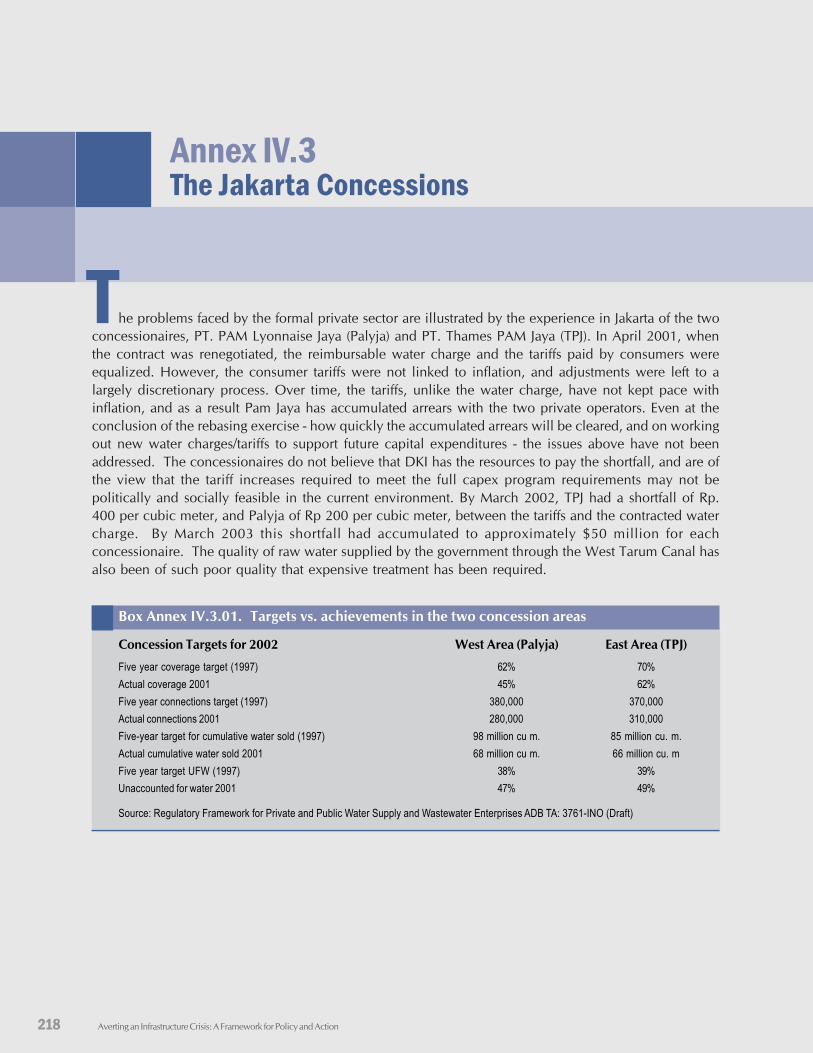
Averting an Infrastructure Crisis: A Framework for Policy and Action218
he problems faced by the formal private sector are illustrated by the experience in Jakarta of the twoconcessionaires, PT. PAM Lyonnaise Jaya (Palyja) and PT. Thames PAM Jaya (TPJ). In April 2001, whenthe contract was renegotiated, the reimbursable water charge and the tariffs paid by consumers wereequalized. However, the consumer tariffs were not linked to inflation, and adjustments were left to alargely discretionary process. Over time, the tariffs, unlike the water charge, have not kept pace withinflation, and as a result Pam Jaya has accumulated arrears with the two private operators. Even at theconclusion of the rebasing exercise - how quickly the accumulated arrears will be cleared, and on workingout new water charges/tariffs to support future capital expenditures - the issues above have not beenaddressed. The concessionaires do not believe that DKI has the resources to pay the shortfall, and are ofthe view that the tariff increases required to meet the full capex program requirements may not bepolitically and socially feasible in the current environment. By March 2002, TPJ had a shortfall of Rp.400 per cubic meter, and Palyja of Rp 200 per cubic meter, between the tariffs and the contracted watercharge. By March 2003 this shortfall had accumulated to approximately $50 million for eachconcessionaire. The quality of raw water supplied by the government through the West Tarum Canal hasalso been of such poor quality that expensive treatment has been required.
Box Annex IV.3.01. Targets vs. achievements in the two concession areas
Concession Targets for 2002 West Area (Palyja) East Area (TPJ)
Five year coverage target (1997) 62% 70%Actual coverage 2001 45% 62%Five year connections target (1997) 380,000 370,000Actual connections 2001 280,000 310,000Five-year target for cumulative water sold (1997) 98 million cu m. 85 million cu. m.Actual cumulative water sold 2001 68 million cu m. 66 million cu. mFive year target UFW (1997) 38% 39%Unaccounted for water 2001 47% 49%
Source: Regulatory Framework for Private and Public Water Supply and Wastewater Enterprises ADB TA: 3761-INO (Draft)
Annex IV.3The Jakarta Concessions
T
219
Annex IV.4Financial Recovery Action Plan (FRAP)
Features of the FRAPThe financial recovery action plan (FRAP) is prepared by a water utility(PDAM) which has a desire to improve its performance to enable it toimprove and expand its services to consumers. It consists of an analysis ofthe existing problems of the PDAM, whether they are technical, financial,commercial or managerial. These problems are analyzed by the PDAM asto their causes so that appropriate actions can be implemented. Therequired actions are contained in the FRAP details, and supported byfinancial projections to show the results of these combined actions on thePDAM operations. The FRAP may just be management, commercial and/or technical improvements requiring only minor investments. It may alsoinvolve major investments, depending on the technical problem that needsto be addressed. If the PDAM has delinquent loans with the Ministry ofFinance, a proposed loan rescheduling scheme is included.
The FRAP is developed by the PDAM, and is then discussed and agreedwith its Mayor/Bupati and DPRD. The FRAP becomes a commitmentbetween these three parties to implement the FRAP on the part of thePDAM, and to see to it that it is implemented, on the part of the Mayor/Bupati and DPRD. The PDAM’s accountability is thereby improved, asthe latter’s regulatory and oversight responsibility is strengthened. ThePDAM Rescue Program also showed that just by streamlining operationsand with some boost from loan rescheduling with MOF, a PDAM can bebrought back to operate profitably.
The FRAP has been piloted in 17 PDAMs under the PDAM Rescue Programduring 2000-2002. It was funded by a grant from the ASEM Trust Fund tofinance technical assistance to PDAMs willing to be reformed. Duringthat time, PDAMs were almost on the verge of bankruptcy as the financialcrisis that hit Indonesia starting from the middle of 1997 exacerbated weakmanagement, poor financial discipline, and deteriorating network systems.Inflation reached 78% at the end of 1998, and the rupiah was devaluedfrom a pre-crisis level Rp 2000 to a US dollar to as high as Rp15000 at onepoint. They could not borrow to properly maintain their network systemmuch more expand it, because they could not promptly repay theiroutstanding obligations.
The Program was intended to help PDAMs survive the crisis, not only inthe short-run, but also in a more sustainable manner that will enable themto be self-sufficient in the long run. The Program was expected to beachieved by improving the operational and financial efficiency of thePDAM consistent with the overall direction of water sector reform. Sincethere was no financial assistance involved, additional cash had either (1) tobe earned by the PDAM out of improved management and tariff increases;(2) to be provided by its local government in the form of additional equity,
(3) to be obtained by the deferment of loan repayment as part of loanrescheduling; or (4) a combination of all of these.
Parties to the FRAPThe FRAP is a commitment from these parties:
1. The PDAM who commits to:
• Raise tariff to required levels;
• Add new connections, depending on available capacity;
• Shorten collection period to improve its cash position;
• Reduce unaccounted-for water and turn these into revenues;
• Improve staffing ratio by suspending hiring of new employees andnot filling up vacated positions;
• Reschedule delinquent loan accounts based on its financial capabilityafter considering the positive effects from the above; and
• Implement the required investment based on agreed program whichare intended to deal with the technical problems existing in thePDAM.
2. The PEMDA and DPRD who independently commit to:
• Suspend the collection of dividends from the PDAM until therequired service coverage has been attained by the PDAM;
• Support the implementation of the required increases tariff;
• Allow the PDAM to reschedule its delinquent loans; and
• Monitor the PDAM performance based on FRAP and take action, ifrequired.
3. The MOF who commits to:
• Reschedule the PDAM’s delinquent loan accounts based on thePDAM’s financial capability after considering the results of theFRAP actions before loan rescheduling.
220 Averting an Infrastructure Crisis: A Framework for Policy and Action
Water Supply and Sanitation
FRAP Targets and Desired ResultsIn the FRAP, targets are made for reduction of unaccounted-for water,additional connections that can be generated, shorter collection period,lower staffing ratio, tariff increases, and debt service that is affordable inrelation to the rescheduling of delinquent loans. It also includes theinvestments that need to be made to improve the system, and the PDAM’sequity in the project.
Based on these targets, the expected results are increased population served,sufficient water supply where once there may have been a shortage, a netprofit after tax, an operating ratio of at most 70% that affords the PDAM toearn a decent profit, a debt service coverage ratio higher than 1.3 times toensure repayment of debts as they fall due, and average tariff that enablesthe PDAM to fully recover its O&M costs and depreciation.
221
Annex IV.5Corporatization of PDAMs
S uccessful water utilities worldwide share the common characteristics. Accepting these principlesand creating the conditions for making them work, may lead to the development of an efficient watersector that can provide adequate services at a reasonable cost:
· Autonomy in all aspects of management and operation of systems by the enterprise, includingplanning, financing, and implementing investments;
· A clearly defined regulatory framework by government that holds water companies to high standardsof efficiency, but allows professional management that is insulated from undue political interference;
· Financial self-sufficiency gained through the collection of tariffs that are sufficient to meet all financialneeds (operational, maintenance, investment, and debt service);
· Transparent, targeted and efficient governmental subsidies to support the poorest segments of thepopulation that are not able to pay the water and sanitation fees;
· A strong sense of public service and consumer orientation;
· Access to a convenient source of credit for financing investments; and
· Reliance on a strong, competitive private sector from which to obtain quality support services.
Following the above mentioned principles the Government of Indonesia (GOI) initiated the majordecentralization and corporatization steps. In May 1999, the Ministry of Home Affairs issued a circularto all local governments and PDAMs to convert Regional Enterprises into limited liability companies(PTs). As a result the law providing for water enterprises will be replaced by a new law, which dividesregional companies (BUMDs) into two types, namely, a regional enterprise BUMD and a limited liabilitycompany MUMD.
Proposed PDAM Reform StrategyThe profile that emerges from the Indonesian water sector comprises anumber of different agencies and ministries, often with overlapping orunclear lines of authority. Each ministry has independently progressedinto sectoral implementation tasks, thus impeding the efficient developmentof multisector planning, programming and budgeting initiatives. The resulthas been a piecemeal response to sectoral needs that has tended to focuson the installation of large-scale physical infrastructure facilities. Becausemany of these facilities were not operationally integrated into a program ofasset maintenance and improvement at the planning and implementationstage, operating and maintenance requirements have traditionally assumeda low priority in the national budgeting process.
Today, many of the infrastructure systems, have regressed into a state ofsystemic degradation, exhibiting the accumulated effect of decades ofinadequate maintenance. Nevertheless, over the last three decades, theGOI has made substantial investments in water infrastructure. However,the focus of this investment policy has been on the quantity of investments.Improving the quality of investments is also vital.
Further, while the PDAMs are the public utilities and should be perceivedas commercially oriented undertakings, it should be recognized that untilrecently they have always operated at a loss, never generating sufficientfunds to meet day-to-day expenses nor to cover their working capitalneeds, or the contributions required to finance new works; the PDAMs
222 Averting an Infrastructure Crisis: A Framework for Policy and Action
Water Supply and Sanitation
became accustomed to operating as a highly subsidized institutions, andtheir management philosophy has been deeply ingrained along these lines.This, coupled with the sectoral fragmentation at the national level and lowoperating efficiencies at the sectoral level, have all played a part in reducingthe impact of the earlier investments and point to the need for a majorreform initiative. Creating the institutional and organizational conditionsthat oblige the water utilities to be more efficient and more responsive tothe needs of users is clearly the major challenge of the sector.
This challenge will be addressed through a five-point intervention program:(i) creating a macro environment conducive to change; (ii) establishingcorporatization partnerships; (iii) creating an appropriate institutionalframework; (iv) establishing the internal capacity to manage reform; and(v) corporatizing PDAMs.
Creating a Macro Environment Conducive to Reform.It is envisaged that the GOI will have a continuing but changed role in thePDAMs - from that of a direct financier to that of a regulator. In thisconnection, it is important that a policy and regulatory framework beestablished at the national level that coordinates cross-sectoral interactions,including private involvement in the provision of infrastructure, safeguardsthe interests of the low income groups, and improves environmentalsafeguards.
Establishing Corporatization Partnerships.Twinning arrangements with modern water utilities and related trainingwill provide the framework for the commercial operation of PDAMs.Specific programs will be designed to assist PDAMs in this process and theimplementation of further steps including preparation of the consumereducation program, the introduction of new technology into PDAMs, andthe implementation of an Institutional Restructuring Plan aimed atreorganizing and strengthening the management systems, especiallyaccounting, billing and collection, financial management, informationmanagement, and operations management. Similarly, both formal andinformal on-the-job training to all staff will be provided;
Creating the Appropriate Institutional Framework.As the first step in the reform process, the participating PDAMs should beestablished as a legal entity subject to company law, including formalseparation of ownership and management responsibilities through a boardof directors. Each PDAM should have its charter, board of directors(including professional managers and user representatives), its owncontracting and salary regime.
Corporatizing the PDAMs.Responsibility for the corporatization of the PDAM will rest with itsmanagement with the support of the Corporatization Partner which willprepare an overall corporate restructuring plan. The plan will includeexplicit performance objectives and well-defined budgets. As an importanttool in this process, a management information system linked with bothoperational budget planning and strategic planning will be installed andwill include, inter alia, a general ledger module with provision fordepartmental accounting; an automated, fixed-asset module to provide allpertinent information on depreciation and an easily retrievable means ofhandling revaluations; a general accounts receivable module for fullyautomating the billing and collection process; a payroll module forprocessing salaries and wages with provision for receiving data fromtimekeeping and job cost-modules; and a cost accounting module toseparately account for wages, materials, etc. in the central and districtworkshops, as well as in the treatment facilities and major pumping stations.
The corporate restructuring plan will place special emphasis on improvingthe maintenance capability of PDAMs . The existing entities currentlyoperate a passive leakage control policy, in that leaks are repaired onlywhen they are visible above the ground. This was appropriate in view ofthe shortage of materials for repairs and the high losses caused by burstmains and customer plumbing systems. However, as the system is renewedand pressures increase, the incidence of pipe failure will likely increase,thus escalating the need for efficient and responsive operational control.Training will undoubtedly need to take place and be sustained to ensurethe quality of the repairs made. It is important, therefore, that a leakageinspection repair team be set up and properly equipped to travel the routesof trunk mains so that leaks may be promptly repaired. This effort will betargeted at those trunk and transmission mains which are shown bymeasurement to have high losses.
At present, public perception of the service provided by PDAMs is negative.The future success of PDAMs is largely contingent on successfully solicitingconsumer cooperation. To ensure proper implementation of this part ofthe restructuring plan, it will be necessary for each PDAM to recruit apublic information officer with a small department to develop and delivera proactive public relations strategy aimed at reversing the image of theagency and explaining its current and future plans and the important roleit plays in respect to the quality of life in the city.
The present personnel function deals principally with personnel recordsand recruitment. Little or no emphasis has been placed on staff demands,personal development, industrial relations and structured training programs.In fact, over the past several years staff training initiatives have experienceda steady decline. To ensure the success of this part of the restructuringplan, therefore, it will be necessary for the PDAMs to recruit the qualifiedhuman resource and training coordinators to rationalize personnel servicesand develop and deliver training programs aimed at both operational andadministrative personnel. Moreover, there will be a need to consolidatehuman resource functions within the new corporate structure along withthe training function.
223
Annex IV.6Cost Benefit Analysis – Water Supply
his annex estimates the benefits of tariff and efficiency reforms in Indonesian PDAMs. The modelused in the annex examines three scenarios: (i) status quo, (ii) partial reform, which involves a 50% tariffincrease, and (iii) full reform, which involves increases in tariffs by 50%, efficiency by 20%, and billcollection rates by 20%. In conjunction with the three scenarios, the model investigates two hypothesesregarding the number of direct PDAM end-users: (i) maintaining current service levels and (ii) expandingthe number of direct connections by reinvesting additional revenue from tariff increases in networkexpansion.
For each outcome, the model generates an estimate of profit from continuing operations and change inconsumer surplus for direct PDAM end users over five years. In the model, the change in consumersurplus is cumulative (i.e. it is computed by comparing consumer surplus during any given year withconsumer surplus prior to the reforms). The model assumes that additional profits are reinvested toexpand the network. As new connections bring additional profit, and as new users benefit from thesenew connections, the change in consumer surplus reaches higher levels every year. Furthermore, themodel determines the required increases in tariffs needed to cover cost under each reform scenario. Theresults show significant potential gains, which increase as the number of direct end users and implementedreforms increase. A summary of the results is found in the tables below.
The following analysis ignores some significant elements and requires numerous assumptions. First, theannex mainly deals with existing and new PDAM direct end users, disregarding the those not served byPDAMs and the sanitation sector . Second, it also does not take into account the differences in waterquality or service as an individual moves from self provisioning to PDAM direct connection or vice versa.Lastly, the model relies on country wide aggregation of PDAMs and averages, which may limit thesignificance of the results. There is significant variation in PDAM performance and the situation willtherefore vary from municipality to municipality. However, the figures used in the analysis are bestestimates of "representative" figures. Despite these shortcomings, the analysis provides a useful, roughestimate of potential benefits of reform in PDAM water supply management.
T
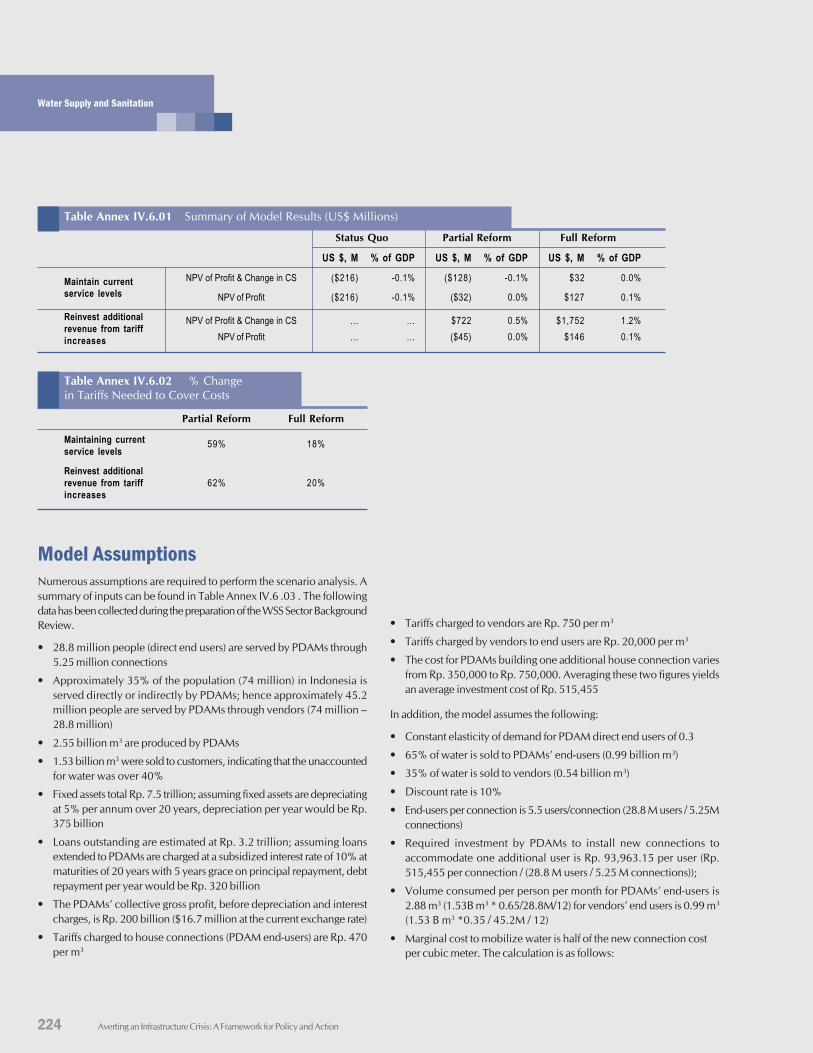
224 Averting an Infrastructure Crisis: A Framework for Policy and Action
Water Supply and Sanitation
Table Annex IV.6.01 Summary of Model Results (US$ Millions)
Status Quo Partial Reform Full Reform
US $, M % of GDP US $, M % of GDP US $, M % of GDP
Maintain current NPV of Profit & Change in CS ($216) -0.1% ($128) -0.1% $32 0.0%service levels NPV of Profit ($216) -0.1% ($32) 0.0% $127 0.1%
Reinvest additional NPV of Profit & Change in CS … … $722 0.5% $1,752 1.2%revenue from tariffincreases NPV of Profit … … ($45) 0.0% $146 0.1%
• Tariffs charged to vendors are Rp. 750 per m3
• Tariffs charged by vendors to end users are Rp. 20,000 per m3
• The cost for PDAMs building one additional house connection variesfrom Rp. 350,000 to Rp. 750,000. Averaging these two figures yieldsan average investment cost of Rp. 515,455
In addition, the model assumes the following:
• Constant elasticity of demand for PDAM direct end users of 0.3
• 65% of water is sold to PDAMs’ end-users (0.99 billion m3)
• 35% of water is sold to vendors (0.54 billion m3)
• Discount rate is 10%
• End-users per connection is 5.5 users/connection (28.8 M users / 5.25Mconnections)
• Required investment by PDAMs to install new connections toaccommodate one additional user is Rp. 93,963.15 per user (Rp.515,455 per connection / (28.8 M users / 5.25 M connections));
• Volume consumed per person per month for PDAMs’ end-users is2.88 m3 (1.53B m3 * 0.65/28.8M/12) for vendors’ end users is 0.99 m3
(1.53 B m3 *0.35 / 45.2M / 12)
• Marginal cost to mobilize water is half of the new connection costper cubic meter. The calculation is as follows:
Table Annex IV.6.02 % Changein Tariffs Needed to Cover Costs
Partial Reform Full Reform
Maintaining currentservice levels
59% 18%
Reinvest additionalrevenue from tariff 62% 20%increases
Model AssumptionsNumerous assumptions are required to perform the scenario analysis. Asummary of inputs can be found in Table Annex IV.6 .03 . The followingdata has been collected during the preparation of the WSS Sector BackgroundReview.
• 28.8 million people (direct end users) are served by PDAMs through5.25 million connections
• Approximately 35% of the population (74 million) in Indonesia isserved directly or indirectly by PDAMs; hence approximately 45.2million people are served by PDAMs through vendors (74 million –28.8 million)
• 2.55 billion m3 are produced by PDAMs
• 1.53 billion m3 were sold to customers, indicating that the unaccountedfor water was over 40%
• Fixed assets total Rp. 7.5 trillion; assuming fixed assets are depreciatingat 5% per annum over 20 years, depreciation per year would be Rp.375 billion
• Loans outstanding are estimated at Rp. 3.2 trillion; assuming loansextended to PDAMs are charged at a subsidized interest rate of 10% atmaturities of 20 years with 5 years grace on principal repayment, debtrepayment per year would be Rp. 320 billion
• The PDAMs’ collective gross profit, before depreciation and interestcharges, is Rp. 200 billion ($16.7 million at the current exchange rate)
• Tariffs charged to house connections (PDAM end-users) are Rp. 470per m3
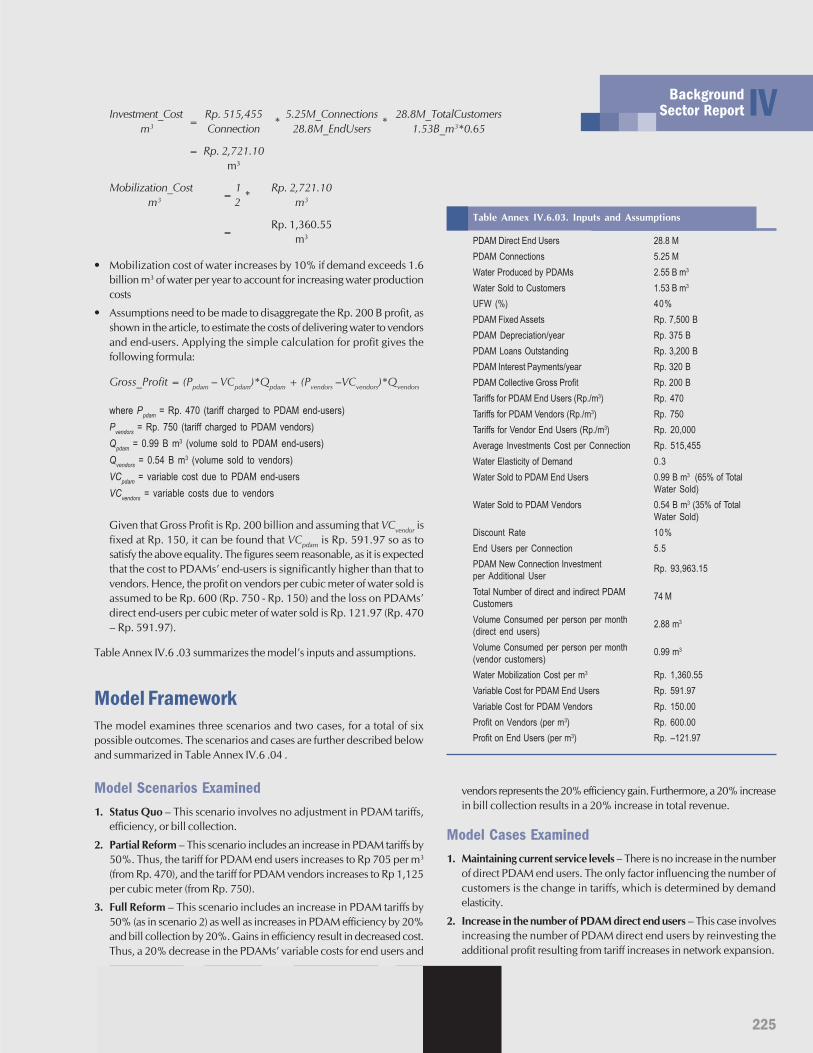
225
IVBackgroundSector ReportInvestment_Cost
=Rp. 515,455
*5.25M_Connections
*28.8M_TotalCustomers
m3 Connection 28.8M_EndUsers 1.53B_m3*0.65
= Rp. 2,721.10m3
Mobilization_Cost=
1 *
Rp. 2,721.10m3 2 m3
=Rp. 1,360.55
m3
vendors represents the 20% efficiency gain. Furthermore, a 20% increasein bill collection results in a 20% increase in total revenue.
Model Cases Examined1. Maintaining current service levels – There is no increase in the number
of direct PDAM end users. The only factor influencing the number ofcustomers is the change in tariffs, which is determined by demandelasticity.
2. Increase in the number of PDAM direct end users – This case involvesincreasing the number of PDAM direct end users by reinvesting theadditional profit resulting from tariff increases in network expansion.
• Mobilization cost of water increases by 10% if demand exceeds 1.6billion m3 of water per year to account for increasing water productioncosts
• Assumptions need to be made to disaggregate the Rp. 200 B profit, asshown in the article, to estimate the costs of delivering water to vendorsand end-users. Applying the simple calculation for profit gives thefollowing formula:
Gross_Profit = (Ppdam – VCpdam)*Qpdam + (Pvendors –VCvendors)*Qvendors
where Ppdam = Rp. 470 (tariff charged to PDAM end-users)Pvendors = Rp. 750 (tariff charged to PDAM vendors)Qpdam = 0.99 B m3 (volume sold to PDAM end-users)Qvendors = 0.54 B m3 (volume sold to vendors)VCpdam = variable cost due to PDAM end-usersVCvendors = variable costs due to vendors
Given that Gross Profit is Rp. 200 billion and assuming that VCvendor isfixed at Rp. 150, it can be found that VCpdam is Rp. 591.97 so as tosatisfy the above equality. The figures seem reasonable, as it is expectedthat the cost to PDAMs’ end-users is significantly higher than that tovendors. Hence, the profit on vendors per cubic meter of water sold isassumed to be Rp. 600 (Rp. 750 - Rp. 150) and the loss on PDAMs’direct end-users per cubic meter of water sold is Rp. 121.97 (Rp. 470– Rp. 591.97).
Table Annex IV.6 .03 summarizes the model’s inputs and assumptions.
Model FrameworkThe model examines three scenarios and two cases, for a total of sixpossible outcomes. The scenarios and cases are further described belowand summarized in Table Annex IV.6 .04 .
Model Scenarios Examined1. Status Quo – This scenario involves no adjustment in PDAM tariffs,
efficiency, or bill collection.
2. Partial Reform – This scenario includes an increase in PDAM tariffs by50%. Thus, the tariff for PDAM end users increases to Rp 705 per m3
(from Rp. 470), and the tariff for PDAM vendors increases to Rp 1,125per cubic meter (from Rp. 750).
3. Full Reform – This scenario includes an increase in PDAM tariffs by50% (as in scenario 2) as well as increases in PDAM efficiency by 20%and bill collection by 20%. Gains in efficiency result in decreased cost.Thus, a 20% decrease in the PDAMs’ variable costs for end users and
Table Annex IV.6.03. Inputs and Assumptions
PDAM Direct End Users 28.8 MPDAM Connections 5.25 MWater Produced by PDAMs 2.55 B m3
Water Sold to Customers 1.53 B m3
UFW (%) 40%PDAM Fixed Assets Rp. 7,500 BPDAM Depreciation/year Rp. 375 BPDAM Loans Outstanding Rp. 3,200 BPDAM Interest Payments/year Rp. 320 BPDAM Collective Gross Profit Rp. 200 BTariffs for PDAM End Users (Rp./m3) Rp. 470Tariffs for PDAM Vendors (Rp./m3) Rp. 750Tariffs for Vendor End Users (Rp./m3) Rp. 20,000Average Investments Cost per Connection Rp. 515,455Water Elasticity of Demand 0.3Water Sold to PDAM End Users 0.99 B m3 (65% of Total
Water Sold)Water Sold to PDAM Vendors 0.54 B m3 (35% of Total
Water Sold)Discount Rate 10%End Users per Connection 5.5PDAM New Connection Investmentper Additional User
Rp. 93,963.15
Total Number of direct and indirect PDAMCustomers
74 M
Volume Consumed per person per month(direct end users)
2.88 m3
Volume Consumed per person per month(vendor customers)
0.99 m3
Water Mobilization Cost per m3 Rp. 1,360.55Variable Cost for PDAM End Users Rp. 591.97Variable Cost for PDAM Vendors Rp. 150.00Profit on Vendors (per m3) Rp. 600.00Profit on End Users (per m3) Rp. –121.97
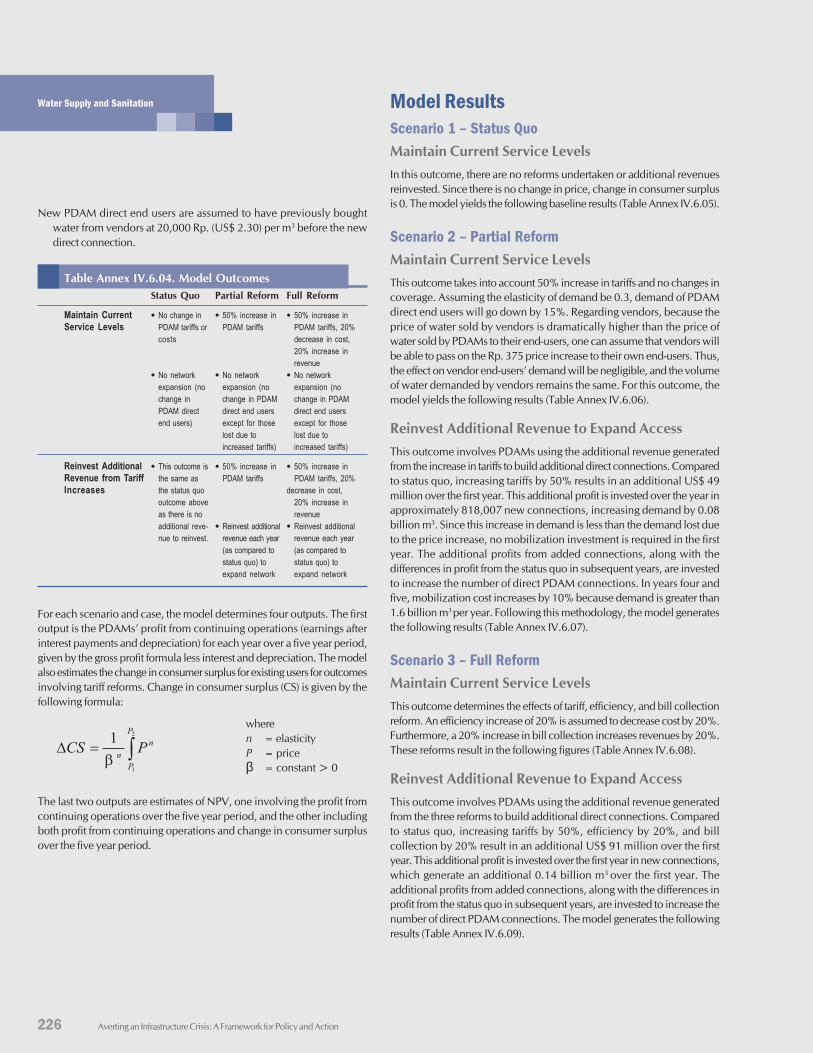
226 Averting an Infrastructure Crisis: A Framework for Policy and Action
Water Supply and Sanitation
New PDAM direct end users are assumed to have previously boughtwater from vendors at 20,000 Rp. (US$ 2.30) per m3 before the newdirect connection.
Table Annex IV.6.04. Model OutcomesStatus Quo Partial Reform Full Reform
Maintain Current • No change in • 50% increase in • 50% increase inService Levels PDAM tariffs or PDAM tariffs PDAM tariffs, 20%
costs decrease in cost,20% increase inrevenue
• No network • No network • No networkexpansion (no expansion (no expansion (nochange in change in PDAM change in PDAMPDAM direct direct end users direct end usersend users) except for those except for those
lost due to lost due toincreased tariffs) increased tariffs)
Reinvest Additional • This outcome is • 50% increase in • 50% increase inRevenue from Tariff the same as PDAM tariffs PDAM tariffs, 20%Increases the status quo decrease in cost,
outcome above 20% increase inas there is no revenueadditional reve- • Reinvest additional • Reinvest additionalnue to reinvest. revenue each year revenue each year
(as compared to (as compared tostatus quo) to status quo) toexpand network expand network
For each scenario and case, the model determines four outputs. The firstoutput is the PDAMs’ profit from continuing operations (earnings afterinterest payments and depreciation) for each year over a five year period,given by the gross profit formula less interest and depreciation. The modelalso estimates the change in consumer surplus for existing users for outcomesinvolving tariff reforms. Change in consumer surplus (CS) is given by thefollowing formula:
wheren = elasticityP = priceβ = constant > 0
The last two outputs are estimates of NPV, one involving the profit fromcontinuing operations over the five year period, and the other includingboth profit from continuing operations and change in consumer surplusover the five year period.
Model ResultsScenario 1 – Status QuoMaintain Current Service LevelsIn this outcome, there are no reforms undertaken or additional revenuesreinvested. Since there is no change in price, change in consumer surplusis 0. The model yields the following baseline results (Table Annex IV.6.05).
Scenario 2 – Partial ReformMaintain Current Service LevelsThis outcome takes into account 50% increase in tariffs and no changes incoverage. Assuming the elasticity of demand be 0.3, demand of PDAMdirect end users will go down by 15%. Regarding vendors, because theprice of water sold by vendors is dramatically higher than the price ofwater sold by PDAMs to their end-users, one can assume that vendors willbe able to pass on the Rp. 375 price increase to their own end-users. Thus,the effect on vendor end-users’ demand will be negligible, and the volumeof water demanded by vendors remains the same. For this outcome, themodel yields the following results (Table Annex IV.6.06).
Reinvest Additional Revenue to Expand AccessThis outcome involves PDAMs using the additional revenue generatedfrom the increase in tariffs to build additional direct connections. Comparedto status quo, increasing tariffs by 50% results in an additional US$ 49million over the first year. This additional profit is invested over the year inapproximately 818,007 new connections, increasing demand by 0.08billion m3. Since this increase in demand is less than the demand lost dueto the price increase, no mobilization investment is required in the firstyear. The additional profits from added connections, along with thedifferences in profit from the status quo in subsequent years, are investedto increase the number of direct PDAM connections. In years four andfive, mobilization cost increases by 10% because demand is greater than1.6 billion m3 per year. Following this methodology, the model generatesthe following results (Table Annex IV.6.07).
Scenario 3 – Full ReformMaintain Current Service LevelsThis outcome determines the effects of tariff, efficiency, and bill collectionreform. An efficiency increase of 20% is assumed to decrease cost by 20%.Furthermore, a 20% increase in bill collection increases revenues by 20%.These reforms result in the following figures (Table Annex IV.6.08).
Reinvest Additional Revenue to Expand AccessThis outcome involves PDAMs using the additional revenue generatedfrom the three reforms to build additional direct connections. Comparedto status quo, increasing tariffs by 50%, efficiency by 20%, and billcollection by 20% result in an additional US$ 91 million over the firstyear. This additional profit is invested over the first year in new connections,which generate an additional 0.14 billion m3 over the first year. Theadditional profits from added connections, along with the differences inprofit from the status quo in subsequent years, are invested to increase thenumber of direct PDAM connections. The model generates the followingresults (Table Annex IV.6.09).
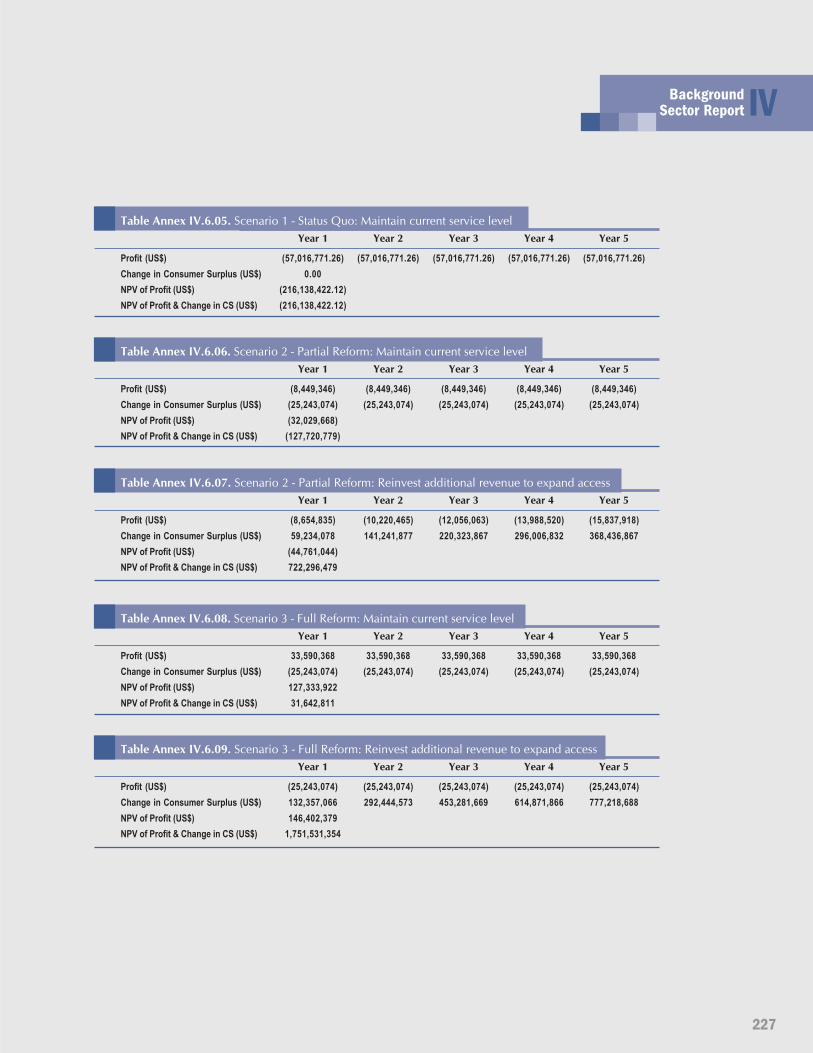
227
IVBackgroundSector Report
Table Annex IV.6.05. Scenario 1 - Status Quo: Maintain current service levelYear 1 Year 2 Year 3 Year 4 Year 5
Profit (US$) (57,016,771.26) (57,016,771.26) (57,016,771.26) (57,016,771.26) (57,016,771.26)Change in Consumer Surplus (US$) 0.00NPV of Profit (US$) (216,138,422.12)NPV of Profit & Change in CS (US$) (216,138,422.12)
Table Annex IV.6.06. Scenario 2 - Partial Reform: Maintain current service levelYear 1 Year 2 Year 3 Year 4 Year 5
Profit (US$) (8,449,346) (8,449,346) (8,449,346) (8,449,346) (8,449,346)Change in Consumer Surplus (US$) (25,243,074) (25,243,074) (25,243,074) (25,243,074) (25,243,074)NPV of Profit (US$) (32,029,668)NPV of Profit & Change in CS (US$) (127,720,779)
Table Annex IV.6.07. Scenario 2 - Partial Reform: Reinvest additional revenue to expand accessYear 1 Year 2 Year 3 Year 4 Year 5
Profit (US$) (8,654,835) (10,220,465) (12,056,063) (13,988,520) (15,837,918)Change in Consumer Surplus (US$) 59,234,078 141,241,877 220,323,867 296,006,832 368,436,867NPV of Profit (US$) (44,761,044)NPV of Profit & Change in CS (US$) 722,296,479
Table Annex IV.6.08. Scenario 3 - Full Reform: Maintain current service levelYear 1 Year 2 Year 3 Year 4 Year 5
Profit (US$) 33,590,368 33,590,368 33,590,368 33,590,368 33,590,368Change in Consumer Surplus (US$) (25,243,074) (25,243,074) (25,243,074) (25,243,074) (25,243,074)NPV of Profit (US$) 127,333,922NPV of Profit & Change in CS (US$) 31,642,811
Table Annex IV.6.09. Scenario 3 - Full Reform: Reinvest additional revenue to expand accessYear 1 Year 2 Year 3 Year 4 Year 5
Profit (US$) (25,243,074) (25,243,074) (25,243,074) (25,243,074) (25,243,074)Change in Consumer Surplus (US$) 132,357,066 292,444,573 453,281,669 614,871,866 777,218,688NPV of Profit (US$) 146,402,379NPV of Profit & Change in CS (US$) 1,751,531,354
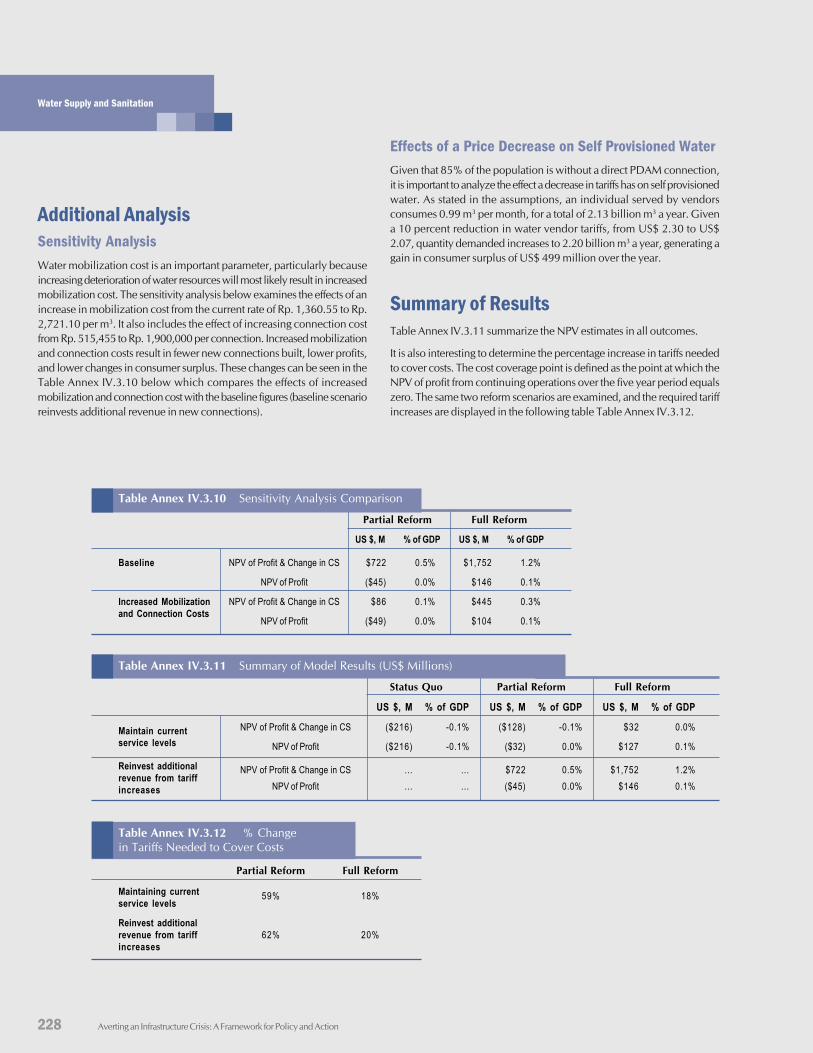
228 Averting an Infrastructure Crisis: A Framework for Policy and Action
Water Supply and Sanitation
Additional AnalysisSensitivity AnalysisWater mobilization cost is an important parameter, particularly becauseincreasing deterioration of water resources will most likely result in increasedmobilization cost. The sensitivity analysis below examines the effects of anincrease in mobilization cost from the current rate of Rp. 1,360.55 to Rp.2,721.10 per m3. It also includes the effect of increasing connection costfrom Rp. 515,455 to Rp. 1,900,000 per connection. Increased mobilizationand connection costs result in fewer new connections built, lower profits,and lower changes in consumer surplus. These changes can be seen in theTable Annex IV.3.10 below which compares the effects of increasedmobilization and connection cost with the baseline figures (baseline scenarioreinvests additional revenue in new connections).
Effects of a Price Decrease on Self Provisioned WaterGiven that 85% of the population is without a direct PDAM connection,it is important to analyze the effect a decrease in tariffs has on self provisionedwater. As stated in the assumptions, an individual served by vendorsconsumes 0.99 m3 per month, for a total of 2.13 billion m3 a year. Givena 10 percent reduction in water vendor tariffs, from US$ 2.30 to US$2.07, quantity demanded increases to 2.20 billion m3 a year, generating again in consumer surplus of US$ 499 million over the year.
Summary of ResultsTable Annex IV.3.11 summarize the NPV estimates in all outcomes.
It is also interesting to determine the percentage increase in tariffs neededto cover costs. The cost coverage point is defined as the point at which theNPV of profit from continuing operations over the five year period equalszero. The same two reform scenarios are examined, and the required tariffincreases are displayed in the following table Table Annex IV.3.12.
Table Annex IV.3.10 Sensitivity Analysis Comparison
Partial Reform Full Reform
US $, M % of GDP US $, M % of GDP
Baseline NPV of Profit & Change in CS $722 0.5% $1,752 1.2%
NPV of Profit ($45) 0.0% $146 0.1%
Increased Mobilization NPV of Profit & Change in CS $86 0.1% $445 0.3%and Connection Costs
NPV of Profit ($49) 0.0% $104 0.1%
Table Annex IV.3.11 Summary of Model Results (US$ Millions)
Status Quo Partial Reform Full Reform
US $, M % of GDP US $, M % of GDP US $, M % of GDP
Maintain current NPV of Profit & Change in CS ($216) -0.1% ($128) -0.1% $32 0.0%service levels NPV of Profit ($216) -0.1% ($32) 0.0% $127 0.1%
Reinvest additional NPV of Profit & Change in CS … … $722 0.5% $1,752 1.2%revenue from tariffincreases NPV of Profit … … ($45) 0.0% $146 0.1%
Table Annex IV.3.12 % Changein Tariffs Needed to Cover Costs
Partial Reform Full Reform
Maintaining currentservice levels
59% 18%
Reinvest additionalrevenue from tariff 62% 20%increases

229
List of Abbreviations
AAAA Analytical and Advisory Activities
AIM Association of Indonesian Municipalities
APEKSI Association of Indonesian Municipalities
BBAKN Board for the Analysis of National Finances
BANGDA Directorate-General for Local Development
BAPEDAL Local Environmental Protection Agency
BAPPEDA Local Development Planning Agency
BAPPENAS National Development Planning Agency
BEN National Land Administration Agency
BKM Community Development Committees
BKN National Civil Service Agency
BKP4N National Board for Policy and Supervision of Housingand Settlements Development
BKTRN National Spatial Coordination Board
BOO Build Operate Own
BOT Build Operate Transfer
BPPN Indonesia Bank Restructuring Agency
BPS Central Bureau of Statistics
BTN National Savings Bank
BUMD Public enterprise owned by an autonomous regionalgovernment
BUMN State owned enterprises
CCBHD Project Community-Based Housing Development
Project
CBH Community-Based Housing
CBO Community-Based Organization
CBUIM Capacity Building for Urban InfrastructureManagement
CoBILD Project Community-Based Initiatives for Housing andLocal Development
DDAK Special Local Government Grant
DAU Consolidated Block Grant
DGURD Directorate General of Urban and Rural Development
Dinas Perumahan Housing section of a local government
DPOD Regional Autonomy Advisory Council
DPR Parliament
DPRD Local Council
E - F - G - HEKUIN Coordinating Minister for Economy, Industry
and Finance
FRAP Financial Recovery Action Plan
GDP Gross Domestic Product
GOI Government of Indonesia
Gotong Royong Mutual help
GRDP Gross Regional Domestic Product
I - JIBRA Indonesia Bank Restructuring Agency
IUIDP Integrated Urban Infrastructure DevelopmentProgram
JABOTABEK Jakarta-Bogor-Tangerang-Bekasi-Region
JABODETABEK Jakarta-Bogor-Depok-Tangerang-Bekasi-Region
230 Averting an Infrastructure Crisis: A Framework for Policy and Action
KKabupaten District Government
Kanwil Deconcentrated Regional Office
KASIBA Ready-to-build area
Kelurahan Administrative Sub-district (lower level governmentadministrative unit in a Kota)
Kimpraswil Ministry for Settlements and Regional Infrastructure
KIP Kampung Improvement Program
Kota City District
Krismon Monetary crisis (used to indicate the 1997/98 crisis)
KPR Kredit Pemilikan Rumah/Home Ownership Loan
LLAP Land Administration Project
LIDAP Local Institutional Development Action Program
LISIBA Stand-alone ready to build environment
LO Land Office
M - N - OMDF Municipal Development Fund
MSIP Multi-Sectoral Investment Program
MSRI Ministry of Settlements and Regional Infrastructure
NGO Non-Government Organization
O&M Operation and Maintenance
OTDA Directorate General for Local Autonomy
P - QPAD Local Own Revenues
PBB Property Tax (Pajak Bumi dan Bangunan)
PDAM Local Water Supply Enterprise
PDK Local Solid Waste Management Enterprise
PDPP Basic Urban Development Program
PERDA Regional Regulation
PERPAMSI National Association of Water Supply Enterprises
Perum Perumnas National Urban Housing Development Corporation
PIPP Urban Services Investment Program
PJM Medium-Term Investment Program
PLN State-Owned Electricity Company
PP Government Regulation
PPP Public-Private Partnership
PROPEDA Regional Development Plan
PROPENAS National Development Plan
PSPI Pusat Studi Properti Indonesia
PUMDA Directorate-General for Local Governance
PUOD Directorate-General for Governance and RegionalAutonomy
RRakorbang Local development coordination meeting
RDA Regional Development Account
RIAP Revenue Improvement Action Program
ROW Right of Way
RS Low-cost housing units
RSS Very low-cost housing units
SSASKENAS National Labor Force Surveys
SK Surat Keputusan (Decree)
SLA Subsidiary Loan Agreement
SMERU Social Monitoring and Early Response Unit
SPAPB Grants from central to local governments
SUSENAS National Household Expenditure Survey
T - U - V - W - X - Y - ZTELKOM State-owned telecommunication company
TKPP Coordination Team for Urban Development
UDF Urban Development Fund
UNCHS United Nations Center of Human Settlements
UNDP United Nations Development Program
UPP Urban Poverty Project
URDI Urban and Regional Development Institute
USDRP Urban Sector Development and Reform Project
WSS Water and Sanitation Sector
List of Abbreviations
231
End Notes
Chapter 1 - Achievements,Challenges, and Opportunities1. By way of examples, some provinces are seeking to impose a revenue
tax on operators of mobile telephone services.
Chapter 2 - Improving PublicManagement of Infrastructure2. The Perjan is the most weakly corporatized of Indonesia’s three
forms of State-owned enterprise, and was used for enterprises whosemission was deemed to be primarily social (e.g. hospitals). Perjanslegally formed part of the related department and their principaltargets were set in production rather than financial terms. The twomain forms of State enterprise today are the Perum and the Persero.A Perum is required to cover its costs but not to earn a profit. Itscapital is not divided into shares and it cannot be privatized. APersero is required to be profit-seeking and is founded on the samelegal code as fully private limited liability shareholder companies,with Government being permitted to sell part or all of its shares.
3. Law 22 of 1999 on Regional Governance and Law 25 of 1999 onFiscal Balance between Central and Regional Governments.
4. The main exceptions are the non-toll road network, railwayinfrastructure (but not services), and very small ports and airports.
5. Most State-owned transport operators, including Garuda, Merpati(airlines) and Pelni (shipping), are also Perseros. There are fewPerums, with PPD and Damri (bus services) being the mainexceptions.
6. The websites of these Persero companies provide a reasonable goodproxy indicator of their relative managerial performance.
7. Telkom and Indosat are listed on the New York Stock Exchange andobliged to meet its more exacting requirements.
8. The railway sector presents a special challenge because the SOEoperates railway services and, on behalf of Government, maintainsand operates the state-owned infrastructure. When Perumka wastransformed into PT KA, a decision was taken to place the shareholderfunction with MOC and not with MOSE. This policy has now beenreversed, but the delayed move perhaps partly explains the slowerprogress on PT KA’s corporate restructuring.
9. Indonesia Integrated Road Management System (IIRMS) for thenational and provincial networks, the Ministerial Instruction 77(SK77) procedures for kabupaten roads, the Urban RoadManagement System (URMS), and the Bridge Management System(BMS).
10. See ‘Decentralizing Indonesia’ (World Bank, June 2003, report26191-IND) for a comprehensive initial assessment of the impactsof decentralization.
11. These include the intergovernmental fiscal equalization system, thestate administrative system, State economic institutions, humanresource development and empowerment, utilization of naturalresources and strategic advanced technology, conservation, andnational standardization.
12. In practice, the increased financial autonomy accorded to kabupatensand kotas should reduce
13. These powers are handled by agencies( Dinas) whose responsibilitiesbroadly align with those of the Ministry of Settlements and RegionalInfrastructure (Kimpraswil or MSRI) and the Ministry ofCommunications (Perhubungan or MOC). Dinas Kimpraswil (orPU) agencies are responsible, among others, for the roadinfrastructure functions and programs of their respective regions.Dinas Perhubungan agencies are responsible for road traffic andtransport functions and programs, including route licensing andtariff regulation for public passenger transport services.
14. The 2002 Electricity Law stipulates that a bupati/walikota in a non-competition region may issue business and operating licenses for
232 Averting an Infrastructure Crisis: A Framework for Policy and Action
enterprises whose activities are located entirely within the kabupaten/kotaand not connected to the national grid. Likewise a governor mayissue licenses for enterprises whose activities span kabupaten orkota boundaries but are located entirely with a province and notconnected to the national grid. Authority to issue licenses forenterprises whose activities span provincial boundaries and/or areconnected to the national grid continues to reside with the sectorMinister.
15. In two years, more than 100 new local governments have beencreated, raising the total to over 400. While their average sizes arenot small by international standards, many new local governmentscurrently lack the capacities and resources to deliver servicessatisfactorily.
16. The authority of regions to impose taxes and levies is defined byLaw 18 of 1997 as amended by Law 34 of 2000.
17. Regional budget (APBD) receipts per capita for rich regions are ofthe order of fifty times those for the poorest regions.
18. The DAK program comprises two components, namely DAK DRand DAK non-DR. The DAK DR is a special reforestation programand all references in this chapter are to the DAK non-DR. TotalDAK non-DR funding in 2003 is around Rp.2.3 trillion (or around2% of the funding being channeled to regions through revenuesharing and the DAU).
19. Law 18 includes provisions that would restrict some desirablechanges in the fees and taxes paid by road users. In particular, itcaps the amount of motor vehicle tax (PKB) at 5% of book value (atruck’s road damaging potential does not diminish with age whereasas its book value does) and defines the motor vehicle fuel tax to bean ad valorem tax (an adjustable Rupiah levy per liter would bepreferable).
20. Reflecting its changed role post-decentralization, its name waschanged from Ministry of Energy and Mining to Ministry of Energyand Natural Resources.
21. At present responsibilities for energy policy formulation in Indonesiaare dispersed among a number of agencies. In principle, overallpolicy is determined by a Minister-level National EnergyCoordinating Board (Bakoren), with inputs being provided by unitsof MEMR and by other agencies such as BPPT and BATAN.However, Bakoren is no longer a functioning forum and therewould be merit in consolidating policy analysis expertise into fewerunits. The Center for Energy Information was initially conceived asan embryonic policy analysis unit and has indeed performed such arole.
22. Including, for example, Telkom and Indosat, Garuda, Pelni, PTKA,the four Pelindos and the two Angkasa Puras.
23. The present BRTI would appear to leave DGPT’s powers essentiallyintact.
24. The scope of the Department’s activities have changed significantlyinasmuch as responsibility for posts and telecommunications was
transferred to a new Ministry of Posts Telecommunications andTourism in the early 1980s and then restored in the late 1980s.
25. GOI’s Economic Policy Package issued in September 2003 providesfor drafts of new laws for these sectors to be prepared during 2004.
Chapter 3 - Restoring PrivateParticipation26. Sarinah functions more as a building management company, and
earns much of its revenues from letting space to fast-food chains andrestaurants and other vendors.
27. The lack of consensus is well captured by an article dated September17 2003 in the Jakarta Post. Entitled ‘Laksamana lambasts ludicrouslawmakers’, the article goes on to note ‘State Minister for StateEnterprises Laksamana Sukardi erupted in anger on Tuesday duringa hearing with House of Representatives legislators, blaming themas the main culprits behind the government’s failure to meet theprivatization target and schedule. “How can we work if you (thelegislators) keep on wasting our time by asking insignificant questions,and ... quarreling with each other. With all due respect, I don’t seeany point to this hearing,” said Laksamana.’
28. There were originally five such ‘KSO’ agreements but three havebeen bought out by Telkom subsequent to the onset of the economiccrisis.
29. There are many variants of the BOT model, with Indonesia havingfavored the BOO (Build Own Operate) scheme for many of its IPPprojects.
30. Government provides compensation to PLN to cover the differencebetween the efficient costs of supplying power to small customers(<450VA for up to 60kWh per month) and the revenues receivedfrom these customers at the Government mandated tariffs. Thisshould be seen as a subsidy to targeted end-users and not to PLN.The budgeted cost of this compensation for 2003 is around Rp.4.5trillion.
31. Telkom is competing ahead of schedule by offering a high qualityand easy to use VOIP service.
32. Williamson, Oliver. 1976. “Franchise Bidding for NaturalMonopoly—in General and with Respect to CATV,” Bell Journal ofEconomics, 7 (Spring): 73-104
33. Yardstick regulation has been extensively employed in the UK,including for setting rates for water, sewerage and power distributioncompanies, and is also now being used in Latin America andelsewhere.
34. See Judith Rees. “Regulation and Private Participation in the Waterand Sanitation Sector” and authors
35. Telkomsel has slightly over 50% of the market, Indosat/Satelindoaround one third, while Excelcomindo has most of the remainder.
36. Government envisages transitioning to full competition through aduopoly stage under which Telkom and Indosat-Satelindo wouldcompete head-to-head as full service providers. As part of the firstphase it is planned that Indosat-Satelindo would develop fixed accessnetworks in Jakarta and Surabaya
37. Despite reducing capital costs, further progress on tariff rebalancingwill be needed to create incentives for expanded investment in fixedaccess local services, especially in rural areas.
End Notes
233
38. It should be noted that the PDAMs account for only around 16% ofthe total water supply market. Efforts also need to be made tomaintain and foster competition among informal service providers,including those who supply water to homes by pushcart or hose,and those who remove septage.
39. Reference to Acil Tasman Final Report and PPIAF.
40. One notable example is UK’s British Gas, which repeatedly resistedefforts to introduce effective competition in gas supply. Ultimatelythe Monopolies and Mergers Commission (MMC) in 1993 imposeda restructuring which separated the company’s gas supply andtransportation arms and laid the foundations for a truly competitivegas market in the UK.
41. Blueprint for the Development of the National Electricity Industry,2003-2020, Ministry of Energy and Mineral Resources, April 2003.
42. In the interim, it is proposed that the small Batam grid serve as thelaboratory for implementing competition.
43. Reference Hunt and Shuttleworth book on Competition in ElectricitySupply
44. Insert reference to Tim Irwin / Phil Gray paper.
45. section draws on Penelope J. Brook and Suzanne M. Smith,Contracting for Public Services: Output-based Aid and itsApplications, The World Bank and International FinanceCorporation.
46. Expected costs should be assessed based on the probability of paymentbeing realized to assess cost of guarantee and potential future burdenof budget.
Chapter 4 - Getting a Gripon Corruption47. Developed with Gallup International’s ‘Voice of the People’ Survey.
48. For a comprehensive overview of corruption in Indonesia and astrategy for tackling it, see ‘Combating Corruption in Indonesia’,World Bank, October 2003. Much of the material in this chapter isdrawn from this document.
49. According to a study financed by the ADB, basic salaries ofgovernment Project Managers are mostly below Rp 1,400,000(US$165) per month while tender committee members generallyearn less than Rp 980,000 per month. Salaries of similar positionsin the private sector are more than four times higher.
50. A colluding favored contractor could skew its unit rates so as tocome in with a low initial bid in the knowledge that additionalearthworks under a pre-arranged contract amendment would makethe contract very profitable. A variant of this practice, used whenbudgets cannot be increased, involves subsequent amendment ofthe contract, following a design review, to narrow its scope so as tofavor the more profitable components.
51. See ‘Combating Corruption in Indonesia’. Op Cit.
52. The PPA for Tanjung Jati A was signed but the project was put onhold by Keppres 39/1997. The project was subsequently ‘closedout’ during the renegotiation.
53. While PLN uses financial models to evaluate IPP tariff proposals,there will always be differences of opinion regarding appropriatevalues for key inputs such as achievable capital costs, financingcharges, and returns on equity capital.
54. As indicated previously, high prices do not automatically imply thatdeals were secured corruptly. On the other hand, the low pricesthat can be achieved through intense competition allow little roomfor significant corruption. It should be noted in this context thatPLN has recently been a pioneer in using life cycle costing in itsprocurements, including notably for a recent major power plantprocurement where account was taken of financing costs and fuelefficiency as well as capital costs.
55. Few of these had been the subject of sound feasibility studies andmany had very questionable prospects for being commercially viableeven under very optimistic assumptions.
56. Country Department III, East Asia Pacific Region, World Bank.Report No. 15394-IND, June 1997.
57. Op Cit
Chapter 5 - Mobilizing Finance forInfrastructure Development58. See Klein and Roger (1994) Back to the Future: The Potential In
Infrastructure Privatization
59. For eg: the ongoing and widely publicized difficulties of lenders toAsia Pulp & Paper – creates significant doubts in the minds ofinternational lenders whether their rights can be adequatelyprotected in Indonesia.
60. There is significant liquidity in the Indonesia banking system atpresent. However, much of this is because of short-term depositswhich are a poor funding source for long-term investments.
61. The Asian Development Bank estimates that TASPEN was in a cash-flow deficit (excess of payouts over contributions) of Rp. 13.5 trillionin 2000 while ASABRI was in a cash flow deficit of Rp. 30 billionin the same year. These deficits are funded out of the Government’sgeneral budgetary resources and are expected to grow dramaticallyover the coming years, thereby becoming a part of the fiscal problemfor the government as opposed to being a part of the solution..
Background Sector Report I –Electric Power62. Blueprint for the Development of the National Electricity Industry
2003-2020. Ministry of Energy and Mineral Resources. April 21,2003.
63. Private participation in the power sector should also comply withcross-sectoral policies on private participation in infrastructure provisioncontained in Keppres 7/1998 (now being revised) and policies onforeign investment contained in Government Regulation 20/1994
End Notes
234 Averting an Infrastructure Crisis: A Framework for Policy and Action
64. The law provides for a power system manager to be responsible forplant dispatch and for controlling and coordinating betweengeneration, transmission and distribution, and for a power marketmanager to be responsible for the matching power demands withbids to supply.
65. The national power grid has been defined by Minister of Energy andMineral Resources Decree 55K/30/MEM/2003. It is anticipatedthat this decree will later be reissued as a Presidential Decree.
66. The Elucidation to the Law states that these levies are to be collectedin regions that apply competition and are not to burden consumersconnected at low voltage.
67. One further contract, for Tanjung Jati C, was signed in December1997 when PLN was already in serious financial distress. This waslinked to Tanjung Jati B and was terminated as part of the lattersrestructuring. ESCs are three-way contracts for geothermal powerplants between Pertamina (as steam owner), PLN (as buyer) and anIPP developer. While there were a few proposed privatetransmission projects, no agreements had been concluded by thetime the crisis struck.
68. One geothermal project developer was able to secure a Governmentguarantee for PLN’s payment obligations.
69. Some of the affected projects were subsequently cleared to proceedby Keppres 47/1997, but this decree was revoked a couple ofmonths later by Keppres 5/1998.
70. The other plants on which agreement has already been reached areSibolga, Amurang, Palembang Timur, Asahan, Sibayak and Cibuni.Construction on these has either not started or was halted at anearly stage.
71. Karaha Bodas. An international arbitration panel found in favor ofthe developer and awarded a settlement of $261 million that wassubsequently overruled by the Jakarta District Court. An out ofcourt solution is now being sought by Government.
72. See the report on World Bank-PLN Joint Seminar on Captive Powerin Indonesia-July 1999.
73. A significant part of Pertamina’s output is produced by contractorsunder Technical Assistance Agreements.
74. PLN recently announced plans to source some fuel through overseastrading entities.
75. Although a reliable supply for the entire country is the ultimateobjective, the Java-Bali power system, which represents over 75 %of the country’s power market, is the immediate goal: The impact offrequent and prolonged blackouts in Java-Bali on industry, commerceand tourism would be substantial. The effect of blackouts outsideJava-Bali is significantly less, although this is not to say that outsideJava-Bali should be ignored.
76. The period 2002-2006 was considered critical with respect topotential power shortage, because by beginning 2007, Tanjun JatiB plant, with a capacity of 1,320 MW, would come on stream, thus
adding substantially to the installed capacity and help in mitigatingthe risk of power shortage.
77. While traditional indicators of the level of generation reserves (i.e.,generation reserves margin, which is the difference between installedcapacity and peak load, divided by peak load) in case of Indonesiaseems to be ample –thus implying that there is excess of generationcapacity — in reality the maximum available capacity is substantiallyless (even if no units were on forced outage, on maintenance, orexperiencing some temporary derating of the capacity). This isbecause of the constraints resulting from (i) derated capacity (4%-5% per year) , (ii) long term outage capacity (350 MW), and (iii)constrained capacities (1500 MW). To present a more realisticpicture of the level of generation reserves which can actually bedispatched, an “available capacity margin” was arrived at by allowingfor these constraints, and then compared with required “targetcapacity margin.” Security of the system was measured to meet thelevel of installed capacity needed to satisfy both the target capacitymargin and the essential spinning reserve (615 MW) requirements.
78. Several sources have estimated the total investment to be as high as$28 billion. IEA estimates that based on 5%-5.5% average growthbetween 2003-2030, the sector’s investment needs for generationonly for 2003-2010 is US$15 billion, for 2010-2020 is US$25billion, and the total for 2003-2030 is US$77 billion.
79. The Law also provides for tariff to be set at “economic value” beforeelectricity competition is introduced, and the elucidation definesthe economic value as that which recovers costs and ensures “fairreturn”. But there is no definition on what constitutes fair return.
80. This differed from the situation in Malaysia, which weathered thecrisis more easily because most of its IPPs were domestically funded.
81. These figures exclude use of power from captive generation.Indonesia has an unusually high proportion of captive generationcapacity and allowing for this would likely improve Indonesia’srelative position. Note also that PLN’s power sales per capita hadincreased to around 400 kWh per year by 2002.
82. Government provided no operating subsidies but did finance asignificant proportion of PLN’s investment programs, including inparticular for rural electrification, through equity injections.
83. PLN’s average revenue for the last quarter of 2002 was Rp. 480 orapproximately US 5.3 cents per kWh. Implementation of the agreedquarterly increases for 2003 should raise this to around Rp. 615 orapproximately US 6.8 cents per kWh (at Rp. 9,000 to the US$) byyear-end.
84. Minister of Finance Decree 431/KMK/.06/2002
85. This is defined in Law 20/2002 as a level that covers costs plus a fairreturn.
86. The retail tariff comprises capacity and usage charges, with the unitrates for both varying with customer category, connection capacity,and usage level.
87. It is estimated that the most CPP-generated electricity that PLNcould replace through its grid supply would be about 10,000 GWh(out of 37,000 GWh), if all the CPPs had access to PLN’s grid andif the tariff charged would be based on supply costs.
88. See also Indonesia’s IPP Rationalization Program: A proposedApproach-June 2001
89. See Indonesia Oil and Gas Sector Study –Report 20512-June 2000
End Notes
235
90. Under a Wholesale competition market, the developers assume theinvestment risks. The stranded costs associated with the wholesalemodel (WSC) are much lower than for MBMS, since no retailcontracts are needed. Although disadvantages arise with wholesalecompetition (for example, consumers may not get full benefit fromelectricity competition), the model is an important first step todeveloping a fully competitive retail market.
Background Sector Annex I.1:Cost Benefit Analysis – Electric Power91. Figures for GDP and total electricity consumption for 2002 are
based on the Country Analysis Briefs of the Energy InformationAdministration of the Department of Energy, available at: http://www.eia.doe.gov/emeu/cabs/
92. Unit costs of electricity production by small individual generatorsare higher than the Long Run Marginal Cost (LRMC) of the systembecause , among other reasons, of the lack of economies of scale. Inaddition smaller generators consume more fuel per unit producedadding further inefficiency in the system.
93. The consumer surplus estimate on the above report is based on alinear consumer demand function for electricity, and could thereforebe overestimated. Further analysis on the costs and benefits of ruralelectrification needs to be undertaken to assess the economics ofrural electrification in Indonesia adequately.
Background Sector Report II –Telecommunications94. The processes by which licenses were awarded to Satelindo and
Ratelindo in 1994 were opaque, with the domestic privateshareholders being politically well-connected.
95. Indosat’s planned acquisition of KSO IV was designed in part togive it a fixed line subscriber base from which to start competingwith Telkom on local services. However, the transaction was stronglyresisted by Telkom employees.
96. This assumes a capital cost per line of circa US$150 and a populationof 220 million. Telkom’s reported capital cost per line in 2001 wassignificantly higher at around US$530 but it now projects the costper line for fixed access radio to be around $150. By way ofcomparison, Telkom’s cost per line was around US$3000 in thelate 1980s.
97. Figures for 2003 have slightly increased: the connection fee for anew residential line is Rp. 295,000 (circa US$33) while the monthlycharge is around Rp. 34,000 (circa $3.80).
98. The one notable exception was the selection the five KSOs, whichwas handled openly and competitively.
99. Initially some 12 companies were granted VOIP licenses butGovernment subsequently elected to allow only five players. Threelicenses were issued to the major operators (Telkom, Indosat andSatelindo) and two were awarded to new start-up companies thathad not previously been in this business.
Background Sector Annex II.1:Cost Benefit Analysis – Telecommunications100. It can be displayed in the following equation:
whereQt = total number of minutes call in year tPt = price measured as a segment “price basket”Lt = population in year tGDPt = GDP per Capita in year tut = noise term which is normally distributed with mean
zero and variance ??
∆ = operator that represents the difference between a variablein time t+1 and that in time t.
101. The following equation is used to model the dynamic behavior ofdemand, Qt:
where
Given that Qt+1 = Qt +
tQ∆
, the model projects Qt for t > 0from the initial quantity Q0, which is known from historical data.
102. Based on the ITU Database
103. While most of the recent time series on the total number of domesticlong distance minutes are missing, time series for both Philippinesand Indonesia are available from 1990 to 1994 inclusively. Thedata reveals that despite a smaller population in Philippines, thetotal number of domestic long distance minutes in the Philippines ishigher than that of Indonesia, and the ratio (Philippines minutes toIndonesia minutes) is increasing over time. A linear regression inwhich the ratio of Philippines minutes to Indonesian minutes isregressed on time produces the following linear equation: y =3.202x - 1.1857, where x denotes the number of years from 1990and y represents the ratio of minutes. Using the regression equation,the ratio in 2002 is computed to be 34.0363 (or 3.202*11-1.1857),and the resulting conversion factor (Indonesia to Philippines) is0.02938 (or 1 / 34.0363).
104. FCC Press Release July 15, 2003 hraunfoss.fcc.gov/edocs_public/attachmatch/DOC-236539A1.pdf
105. The tariff rates are found in the Indosat website. It is shown that thecalling costs from Indonesia to US and to UK are Rp. 8,300 and Rp.9,400 per minute respectively, resulting in an average cost of Rp.8,850.
106. FCC Presentation October 2001, www.fcc.gov/ib/files/11_27_01/consumer_education_website.pdf
End Notes
236 Averting an Infrastructure Crisis: A Framework for Policy and Action
Background Sector Report III –Road and Road Transport107. This is a simplified representation of complex mapping rules. It
should be noted that central Government ‘deconcentrates’ certainresponsibilities (e.g. implementation of betterment and maintenanceworks on national roads) to provincial agencies, and that kabupatenand kota governments may request provincial governments toperform certain of their functions on their behalf.
108. The Jakarta-Cibinong section of the Jagorawi toll road, which linksJakarta to Bogor and Ciawi.
109. There are two toll roads outside Java, namely in North Sumatera(34.4 km near Medan) and in South Sulawesi (20.3 km nearMakassar).
110. Keppres 39/1997, issued in September 1999, affected publicly andprivately financed infrastructure, energy and petrochemical projects.The toll road sector was most affected in terms of numbers ofprojects put on hold while the power sector was most affected interms of value of projects. The Decree was revoked in February2002 by Keppres 15/2002.
111. Vehicles owned by for-hire and own-account operators can bedistinguished by the background color of their number plates. For-hire vehicles (trucks, buses, taxis, etc.) have yellow backgroundswhile own-account vehicles have black backgrounds.
112. Road Transport Industry Development Component; MottMacDonald Ltd. March, 2002
113. VAT (PPN) is a general tax and accordingly is not considered to bea road user charge.
114. At least 30% of the net proceeds from PKB and BBNKB and 70%of the net proceeds from the PBBKB is required to be transferred byprovinces to their constituent kabupaten and kota.
115. The total cost of subsidies enjoyed by the households, industry,power and transport sectors for all fuel types (gasoline, ADO,kerosene, industrial diesel, and fuel oil) from the State budget wasRp. 53.8 trillion in 2000, Rp. 68.4 trillion in 2001 and Rp. 30.4trillion in 2002. In 2000, subsidies accounted for around 40% oftotal State budget expenditures, with fuel accounting for 85% of thetotal subsidy payments.
116. Minister of Finance Decree 35 of 2003 establishes new interimprocedures and criteria to govern the on-lending and on-granting offoreign loans. Preliminary indications are that works on non-tolledroads would be treated as non-cost recovery projects and accordinglybe eligible for on-granting rather than on-lending.
117. The scope of the DAK has been expanded from 2003 to includeitems other than reforestation. Rural roads receive a total budgetRp. 0.842 trillion which is allocated among provinces andkabupatens.
118. This runs contrary to provisions of Government Regulation 8 of1990 on Toll Roads that stipulate Government shall be responsiblefor the costs of land acquisition
119. This is the missing link in the toll road connection between Jakartaand Bandung. Jasa Marga is developing only the comparatively lowcost end-sections.
120. The condition assessment is made using International RoughnessIndex (IRI) and Surface Distress Index (SDI) of the road pavement asfollows: Good = IRI<=4 and SDI<50; Fair = 4<IRI<=8 andSDI<100; Poor = 8<IRI<=12 and SDI<250; Bad = IRI>12or SDI>250. It does not account for traffic capacity.
121. Country Department III, East Asia Pacific Region, World Bank.Report No. 15394-IND, June 1997.
122. Carl Bro International a/s in association with MVA Asia Ltd., NDLEA Consultants, PT Amythas, PT Dressa Cipta Rekayasa, PT JasaCitra Manunggal, and PT Multi Phi Beta. October 2001.
123. Based on volume:capacity ratios as follows: Moderate = 0.3-0.6;Significant = 0.6–0.85; High = >0.85.
124. Cities in Transition: Urban Sector Review in an Era ofDecentralisation in Indonesia. World Bank. June, 2003.
125. Second Highway Sector Investment Project, ImplementationCompletion Report. World Bank, December 2002.
126. Country Department III, East Asia Pacific Region, World Bank.Report No. 15394-IND, June 1997.
127. The study determined that the economically optimal path forproviding additional corridor capacity was through incrementalwidening up to a maximum 4-lane dual carriageway road, beyondwhich construction a new road on a new alignment would bejustified.
128. Widening to U7 standard will also have been included under thelimited betterment program identified by the Road Fund Study andshould not be double-counted. Since the SEPM runs conducted forthe Road Fund Study did not provide for expansion to LAN standard,user costs will include a substantial congestion component in theouter years.
129. These analyses were undertaken as part of the DGRI Road Fundsstudy (PT Hasfarm Dian Konsultan, March 2001. The SEPM enablesthe impact of alternative, optimally allocated, budget levels for roadworks to be assessed in terms of their impact on road user costs. Itconsiders national, provincial , kabupaten and kota roads, but notbridges.
130. It should be noted that road transport usually gives rise to significantexternal costs in the form of polluting emissions, road crashes,construction intrusion etc
131. The BBNKB tends to discourage reporting of ownership transfers.Road user charges studies conducted by MOC have proposed it bediscontinued, with the loss of revenue being offset by increases inPKB rates.
Background Sector Annex III.1:Cost Benefit Analysis – Road and RoadTransport132. Estimated User Cost is based on the polynomial regression equation:
Estimated User Cost = 0.178*(Agency Cost)2 – 5.4765*(Agency Cost) + 241.51 (R2=0.98)
End Notes
237
Background Sector Report IV –Water and Sanitation133. During the 1990s, while average annual population growth was
about 1.7%, urban population grew at a rate of 4.4%.
134. BAPPENAS, 2003, Infrastructure White Paper (draft of January 7,2003), p.135
135. ADB, 1998, quoted in Wright, A, 2003, Draft Report IndonesiaUrban Sanitation Policy Framework p1, adjusted for 2001.
136. Including DEPKES and MOHA
137. Establishment of Water Enterprises – Perusahaan daerah air minum(PDAMs).
138. Note that this data does not include the population that does nothave access to safe water at all.
139. Assuming coverage at 6 persons per connection and an urbanpopulation of 90 million - roughly 40% of the total population ofIndonesia. Data obtained from PERPAMSI raw data reports –December 2001. This coverage is comparable with the Philippinesand lower than Thailand.
140. BAPPENAS, Op. Cit. p134.
141. Ibid. p 135.
142. Elvas, L. and A. Baietti, 2001, Delivery of Water Supply Services inthe Context of Decentralization and Regional Autonomy, at Annex1, pp. 2-3.
143. BAPPENAS Op. Cit. p135.
144. Elvas and Baietti, Op. Cit. p2.
145. ADB 2001, Regulatory Framework for Private and Public WaterSupply and Wastewater Enterprises, TA: 3761-INO (UnpublishedDraft)
146. SUSENAS, 2000.
147. Evaluations conducted by the Water and Sanitation Program – EastAsia and the Pacific. See WSP-EAP, 1998, Study of Community-based Approaches in UNICEF’s WES Program in Indonesia; WSP-EAP, 1999 Evaluation of the Community-Managed Activitiescomponent of AusAID-supported NTB – ESWS Project. ; WSP-EAP, 2001, Achieving Sustained Sanitation for the Poor: Lessonsfrom Participatory Policy Assessments in Cambodia, Indonesia,Vietnam, Do Project Rules Promote Sustainability and Equity? Anassessment in 40 communities served by 5 past projects in Indonesia,in Mukherjee, N. and van Wijk, C. (eds.) Sustainability Planningand Monitoring; WSP-EAP, 2002. Flores Revisited. Evaluation ofRWSS project interventions funded by AusAID (FLOWS), WorldBank (WSSLIC) and NGOs (CARE, Dian Desa, Delsos, Tana Noa)in Flores, NTT. Draft report dated December 2002.
148. It is not uncommon to find that affluent households have investedsignificantly in wells, pumps and storage tanks. Many householdsuse several sources of water even when connected to the publicdistribution system. In lower income areas, people tend to limitpiped water consumption for drinking and cooking purposes, andstill rely on wells and surface water for bathing and laundry. In thewealthiest urban areas, households tend to use water from theirdeep wells for most purposes, with the exception of drinking wherethe norm is still bottled water.
149. PAM JAYA Director General Announcement 030/INSTR/PAM/IV/1990
150. This has generally been restricted to businesses selling (aqua) drinkingwater.
151. Ministry of Settlements and Regional Infrastructure, 2003, WaterResources Management: Towards Enhancement of Effective WaterGovernance: Country Report. World Water Council, prepared for3rd World Water Forum in Kyoto March, 2003.
152. See BAPPENAS Op. Cit p135.
153. Assuming 10% interest rates on the Rp. 3 trillion of outstandingloan (i.e. Rp. 300 billion per year and revenue of Rp. 200 billion)
154. WHO, 2000
155. This may include one or more of the following: standpost/pipe,borehole, protected spring or well, collected rain water.Improvement does not ensure that water is safe.
156. WSP-EAP, 1999 op cit.
157. In a random sample conducted 24-37 % households gained accessto an improved water supply in South Sulawesi, while only 4-9 %of village households gained access to improved water in West Javaand a significant range (14-100%) was found in West Nusa Tenggara.Ibid.
158. Location is also a key determinant of access to PDAM water, asrevealed in the massive imbalance in rural and urban water accessin table 2. It is difficult for small consumers, often the poor, to ‘optin’ to the system because PDAMs do not generate enough revenueto expand services beyond the core service areas.
159. With 9 people drawing on one water connection.
160. Anecdotal evidence suggests that many PDAMs do not use chemicals,although they appear on the accounts.
161. Elvas and Baietti, Op. cit. p2
162. BAPPENAS Op. cit. p134
163. 1997-2001 Data obtained from the PDAM Rescue Program
164. These are in the low to mid range compared with other Asian citiesof similar size. ADB, 1997, Second Water Utilities Data Book.
165. A benchmarking exercise conducted for 28 PDAMs showed theoperating cost recovery percentage exceeded 100% for 25 PDAMs.However, these were among the better performing PDAMs. ADB,1997, ibid.
166. As a point of reference, the average tariff for the water supply utilityin Phnom Penh was $.29/m3 and the average monthly bill was$11.06. ADB, ibid, 1997.
167. WSP-EAP, Op Cit. 1998; 1999; 2002.
168. Shugart, C. 1991, An Exploratory Study of the Water Standpipe-Vendor System in Jakarta, Harvard Institute for InternationalDevelopment
169. These data are consistent with those for other Asian cities providedin ADB regional surveys. ADB, Second Water Utilities Data Book,1997.
End Notes

238 Averting an Infrastructure Crisis: A Framework for Policy and Action
170. For those with income below Rp200,000 per month. USAID survey,ADB, 1997, ibid.
171. Regulation No. 416/MENKES/PER/IX/1990 for the Ministry of HealthRegulation on Water Quality.
172. Basic sanitation includes toilets and septic tanks, on-site collectionof excreta and wastewater.
173. Sub-project of WASPOLA with grant funding from AusAID
174. An example of the NGO role as operators can be found in Tengarangand Surabaya where they have been involved in the construction ofsome 30 community sanitation centers.
175. Distributed in accordance with rules governed by the Law on FiscalBalance between Central and Regional governments Law No. 25/1999
176. Governed by Law No. 25/1999, government Regulation on RegionalLoans (No. 107/2000), by Ministerial Decree No. 347a/KMK.017/2000; and
177. Presidential Decree on Cooperation with the Private Sector (No. 7/1998).
178. Sukarma, R. and R. Pollard., 2001, Indonesia: Overview of Sanitationand Sewerage Experience and Policy Options, Urban DevelopmentSector Unit.
179. ibid. p59
180. ADB, 1998, TA No. 2805-INO, Strengthening of Urban WasteManagement Policies and Strategies, October 1998.
181. SUSENAS, Op. Cit. 1997
182. WSP-EAP, 2001, “ Is it selling toilets? No, a lifestyle” WSP Fieldnote.
183. Gross, B., 2003, Do project rules promote sustainability and equity?WSP-IRC
184. SUSENAS, Op. Cit. 1997
185. Moreover in densely populated urban areas this would not even bepractical.
186. The intention is to submit the guidelines and a six point action planto revitalize the sector to the National Parliament for approval andimplementation.
187. A start has been made under the WASPOLA initiative but this workneeds to be accelerated, especially in relation to utility and informalservice provision.
188. Drinking water quality standards have recently been revised by theGOI for all public utilities
189. Voluntary mergers between PDAMs have taken place, for instance,with Medan and Semarang.
190. In order to create a unified system of delivery, local government andPDAMs need to consider their relationship with these independentproviders. Do they want SSPWPs to go on siphoning water illegally,or do they want to establish up-front bulk sales of water by providingpurpose made standposts (hydrants) allowing control over waterquality and procurement of water at cost recovery levels?
End Notes

239
Bibliography
Anjali, Kumar et. al. 1997. “ Mobilizing Domestic Capital Markets forInfrastructure Financing.” World Bank Discussion Paper No. 377.
Amis, Philip and Sashi Kumar. 2000. “Urban Economic Growth,Infrastructure, and Poverty in India: Lessons from Visakhapatnam.”Environment & Urbanization. Vol. 12, no. 1, pp. 185-196.
Brenneman, Adam. 2002. “Infrastructure and Poverty Linkages: A LiteratureReview.” World Bank.
Bappenas. 2003. Infrastruktur Indonesia: Sebelum, Selama, dan PascaKrisis. Bappenas: Jakarta, Indonesia.
Bappenas, BPS – Statistics Indonesia, and UNDP. 2001. Indonesia HumanDevelopment Report 2001: Towards a New Consensus, Democracyand Human Development in Indonesia. Bappenas, BPS – StatisticsIndonesia, and UNDP: Jakarta, Indonesia.
Clarke, George and Scott Wallsen. 2002 “Universal(ly Bad) Service:Providing Infrastructure Services to Rural and Poor UrbanConsumers.” Development Research Group. The World Bank:Washington, DC.
Canning, David, and Esra Bennathan. 2000. “The Social Rate of Return onInfrastructure Investments.” Policy Research Working Paper 2390.The World Bank: Washington, DC.
Coordinating Ministry for Economic Affairs. 2003. Rural Infrastructure forDevelopment: Linking Rural Infrastructure Development with PovertyAlleviation and Employment Creation. Secretariat, Coordination Teamon Rural Infrastructure Development: Jakarta, Indonesia.
Department for International Development. 2002. Draft- MakingConnections: Infrastructure for Poverty Reduction.
Dollar, David, and Aart Kraay. 2001. “Growth is Good for the Poor.”Policy Research Working Paper 2587. The World Bank: Washington,DC.
Dubash, Navroz. 2002. Power and Politics: Equity and Environment inElectricity Reform. World Resources Institute: Washington, DC.
Dwiyanto, Agus. 2003. Reformasi Tata Pemerintahan Dan OtonomiDaerah. Universitas Gadjah Mada: Yogyakarta, Indonesia.
Eastwood, Robert, and Michael Limpton. 2000. “Pro-poor Growth andPro-growth Poverty Reduction: Meaning, Evidence, and PolicyImplications.” Asian Development Review, vol 18, no. 2, pp 22-58.
Elvas, Leila, and Aldo Baietti. 2001. Delivery of Water Supply Services inthe Context of Decentralization and regional Autonomy. World Bank:Jakarta, Indonesia.
Fan, Shenggen, Linxiu Zhang, and Xiaobo Zhang. 2002. “Growth,Inequality, and Poverty in Rural China.” Research Report 125.International Food Policy Research Institute: Washington, DC.
Fan, Shenggen, Peter Hazell, and Sukhadeo Thorat. 1999. “LinkagesBetween Government Spending, Growth, and Poverty in RuralIndonesia.” Research Report 110. International Food Policy ResearchInstitute: Washington, DC.
Harris, Clive, John Hodges, Michael Schur, and Padmesh Shukla. 2003.“Infrastructure Projects.” The World Bank Group Private Sector andInfrastructure Network. Note 252.
KKPPI. 2003. Pre-CGI Meeting: Infrastructure Session Proceedings. KomiteKebijakan Percepatan Pembangunan Infrastruktur: Jakarta, Indonesia.
Klausen, Anne-Lise. 2003. “Big Ticket Corruption in InfrastructureDevelopment.” World Bank: Jakarta, Indonesia.
Ministry of Energy and Mineral Resources. 2003. Blueprint for theDevelopment of the National Electricity Industry 2003-2020.Indonesia.
Ministry of Settlements and Regional Infrastructure, Directorate Generalof Water Resources, Republic of Indonesia. 2003. Water ResourceManagement: Towards Enhancement of Effective Water Governance,Country report. World Water Council.
Mukherjee, Nilanjana and Ratna Josodipoero. 2001. “Is it selling toilets?NO, a lifestyle.” WSP-EAP, The World Bank.

240 Averting an Infrastructure Crisis: A Framework for Policy and Action
Sawada, Yasuyuki, and Naoko Shinkai. 2002. Do Infrastructure InvestmentsHelp Reduce Poverty? Evaluation of an Irrigation Project in Sri Lanka.University of Tokyo.: Tokyo, Japan.
Sukarma, Risyana and Richard Pollard. 2001. “Indonesia: Overview ofSanitation and Sewerage Experience and Policy Options.” UrbanDevelopment Sector, World Bank: Jakarta, Indonesia.
Williamson, Oliver. 1976. “Franchise Bidding for natural Monopoly – inGeneral and With Respect to CATV.” Bell Journal of Economics 7(Spring):73-104.
World Bank. 1995. Bureaucrats in Business: the Economics and Politics ofGovernment Ownership. New York: Oxford University Press.
World Bank. 2003. Cities in Transition: Urban Sector Review in an Era ofDecentralization in Indonesia. World Bank: Washington, DC.
World Bank, East Asia Poverty Reduction and Economic ManagementUnit. 2003. Combating Corruption in Indonesia: EnhancingAccountability for Development. World Bank: Jakarta, Indonesia.
World Bank, East Asia Poverty Reduction and Economic ManagementUnit. 2003. Decentralizing Indonesia: A Regional Public ExpenditureReview Overview Report. World Bank: Jakarta, Indonesia.
World Bank. 2000. Indonesia: Accelerating Recovery in Uncertain Times.World Bank: Jakarta, Indonesia.
World Bank. 2003. Indonesia: Beyond Macro-Economic Stability. WorldBank Brief for the Consultative Group on Indonesia: Jakarta, Indonesia.
World Bank. 1998. Indonesia in Crisis: A Macroeconomic Update. WorldBank: Washington, DC.
World Bank. 2003. Indonesia: Maintaining Stability, Deepening Reforms.World Bank Brief for the Consultative Group on Indonesia: Jakarta,Indonesia.
World Bank. 2002. Second Highway Investment Project, ImplementationCompletion Report. World Bank: Jakarta, Indonesia.
World Bank. 2003. World Development Indicators 2003. Word Bank:Washington, DC.
World Bank. 1994. World Development Report 1994: Infrastructure forDevelopment. New York: Oxford University Press.
World Bank. 1999. Vietnam: Country Framework Report on PrivateParticipation in Infrastructure. World Bank: Washington, DC.
World Bank, East Asia Poverty Reduction and Economic ManagementUnit. 2003. Philippines Improving Government Performance:Discipline, Efficiency and Equity in Managing Public Resources.World Bank: Philippines Country Office.
World Bank, Public Private Infrastructure Advisory Facility (PPIAF). 2003.“Private Solutions for Infrastructure in Mexico: Country FrameworkReport for Private Participation in Infrastructure.” World Bank:Washington, DC.
Wright, Albert. 2003. Draft: Indonesia Urban Sanitation Policy Framework.World Bank: Jakarta, Indonesia.
van de Walle, Dominique, and Dorothyjean Cratty. 2002. “ImpactEvaluation of a Rural Road Rehabilitation Project.” World Bank:Washington, DC.
van de Walle, Dominique. 2001. “Are Returns to Investment Lower forthe Poor? Human and Physical Capital Interactions in RuralVietnam.” World Bank: Washington, DC.
van de Walle, Dominique. 1996. “Infrastructure and Poverty in Viet Nam.”The Living Standards Measurement Study. World Bank: Washington,DC.
Bibliography