Embed Size (px)
Citation preview
Public experiences of and attitudes towards rail travel
1. Introduction 1.1 This article summarises people's experiences of and attitudes towards rail
travel. It is based on a module of questions included in the Office for National Statistics' Omnibus Survey in February 2006 (Box 1). The questions were commissioned and designed by the Department for Transport.
1.2 The article covers both short distance rail trips (journeys of 50 miles or less) and
long distance trips (journeys of more than 50 miles). For both short and long distance rail journeys the article examines:
• the frequency and purpose of rail journeys; • how rail users and non-users rate rail services; • whether recent experiences of rail travel have met expectations; • the features of rail travel that users most value; • reasons why people do not use rail services more often and the
improvements people believe would encourage use. 1.3 The figures in this article relate to Great Britain unless otherwise stated. Where
sample sizes are sufficient differences by factors such as sex, age, income and socio-economic status have been examined. The report only focuses on statistically significant differences (significant at the 5% level). More detailed tables are available in Annex A - Tables A.1 to A.7.
1.4 Findings from the National Travel Survey (Box 2) are also presented where
appropriate. 1.5 The results presented here are part of a wider programme of research into
passenger attitudes to rail travel. The main source of data on rail passenger satisfaction is the National Passenger Survey, which is run by Passenger Focus.1 The Department for Transport also recently completed a survey of rail use across GB, the National Rail Travel Survey, and this will include information on who uses the railways, where, when and for what purposes. Initial results will be published at the end of 2006. However, unlike the ONS Omnibus Survey module, these sources do not cover the views of both users and non-users of the railways.
Box 1 ONS Omnibus Survey - design details The ONS Omnibus Survey is a random probability survey of adults aged 16 and over living in private households in England, Wales and Scotland. The February 2006 Omnibus Survey interviewed 1,254 adults face-to-face in their own homes. The response rate was 67%. The questions asked can be found at Annex B. Box 2 National Travel Survey The National Travel Survey is a household survey designed to provide a databank of personal travel information for Great Britain. It is a continuous survey that began in July 1988, following ad hoc surveys since the mid-1960s. The survey is designed to pick up long-term trends in travel behaviour. It is not suitable for monitoring short-term trends. Further details are available at: http://www.dft.gov.uk/transtat/personaltravel
1 Results from the NPS are published twice a year. These are available at: www.passengerfocus.org.uk.
1
This report was prepared by Tracey Budd (Statistics Travel). Key Findings • A half (49%) of adults had travelled by rail in the year preceding the survey. 18%
had made both short and long distance journeys; 22% had only made short distance journeys; 7% only longer distance rail journeys.
• Only 9% of adults were frequent rail travellers making short distance rail journeys
at least once a week. Overall ratings • Overall, respondents were positive about rail services. 63% of respondents rated
short distance services as good; 17% as poor. For long distance services the respective figures were 62% and 14%.
• Users of services were generally more positive than non-users. 70% of users
rated short distance services as good; 56% of non users. For long distance services the respective figures were 68% and 56%.
Aspects of service • The particular aspects of short distance services that received the highest ratings
were: number of destinations (71% of respondents rated this aspect as 'good'); information about train times (67%); frequency of trains (62%); politeness and helpfulness of staff (61%) and reliability/punctuality of services (57%).
• The aspects of the services least likely to be rated as good were in relation to
fares and personal safety. This held for both users and non-users, but the evidence suggests these features in themselves are not barriers to rail use.
• Around a half of non-users considered safety from crime and threats on board
trains (48%) and at stations (52%) to be poor. However, only 2% of non/infrequent users mentioned personal safety concerns as a main reason for not using short distance train services or doing so infrequently.
• 34% of those who had not used short distance rail services said the availability of
information about fares was poor and 62% considered the cost of fares to be poor.
• A fifth (21%) of non/infrequent users mentioned the high cost of train fares or
relative cheapness of car travel as a reason for not using short distance train services or doing so infrequently, however only 7% said this was the main reason.
Expectations and improvements • A fifth (20%) of short distance rail users felt their recent experiences of the
service were better than expected and 72% felt that their expectations were met.
2
• 35% of users felt that short distance rail had improved over the past 2 years, while only 15% felt they had deteriorated. 28% felt that rail services would improve over the next 2 years, 14% felt they would deteriorate.
• On long distance services, 33% said their recent experiences were better than
expected, only 7% felt they were worse than expected. 44% of long distance rail users said they felt that services had improved over the past 2 years, only 13% felt they had got worse.
Encouraging rail use • The main reason people do not use trains for short distance journeys or only do
so infrequently is the perceived convenience of travelling by car instead (ease or speed or journey). 46% of non users and 37% of infrequent users mentioned this as the main reason they did not travel by train. The next most common reason was stations not being close to origin/destination, which was mentioned by 17% of both users and infrequent users.
• The most common factor that was mentioned as likely to increase use of short
distance train services by non/infrequent users was a reduction in the cost of fares (mentioned by 33%). Other changes were better location of stations (26%) and improved frequency/reliability/speed of services (24%).
• 66% of infrequent users and 52% of non users said they would increase their use
of short distance rail services should their desired changes be made, though it should be noted that expressed willingness to use services may not necessarily translate into behavioural change and some of the desired changes (e.g., location of stations) would be difficult to implement in practice.
• Similarly, for long distance services the main reasons for not using train services
for long distance journeys made was the ease/speed of making the journey by car or plane instead and the high cost of rail fares relative to the cost of alternative modes.
• The most commonly mentioned change, by far, that would encourage more use
of long distance rail services was cheaper rail fares (mentioned by 54%).
3
2. Patterns of rail travel 2.1 Rail travel is relatively rare compared with other modes of travel. The National
Travel Survey (NTS) found that the average GB resident made 988 trips in total in 2004, but only 14 of these trips were by surface rail. Males on average made more rail trips (16) than females (12). Rail travel comprised 15% of all public transport trips made.
2.2 The NTS also shows that most rail trips that are made are short distance.
Almost nine in ten (86%) rail trips were under 50 miles in length. A quarter (25%) were under 10 miles and a further 40% between 10 and 25 miles.
2.3 The Omnibus Survey asked respondents how far they lived from the nearest
railway station, whether or not they had travelled by train at all in the last 12 months, how frequently they had made short distance rail trips and to what extent they used trains for long distance trips.
2.4 Almost a quarter (27%) of adults interviewed in the February Omnibus Survey
said they lived within a 13 minute walk of their nearest railway station, a further 22% lived within a 14 to 26 minute walk.
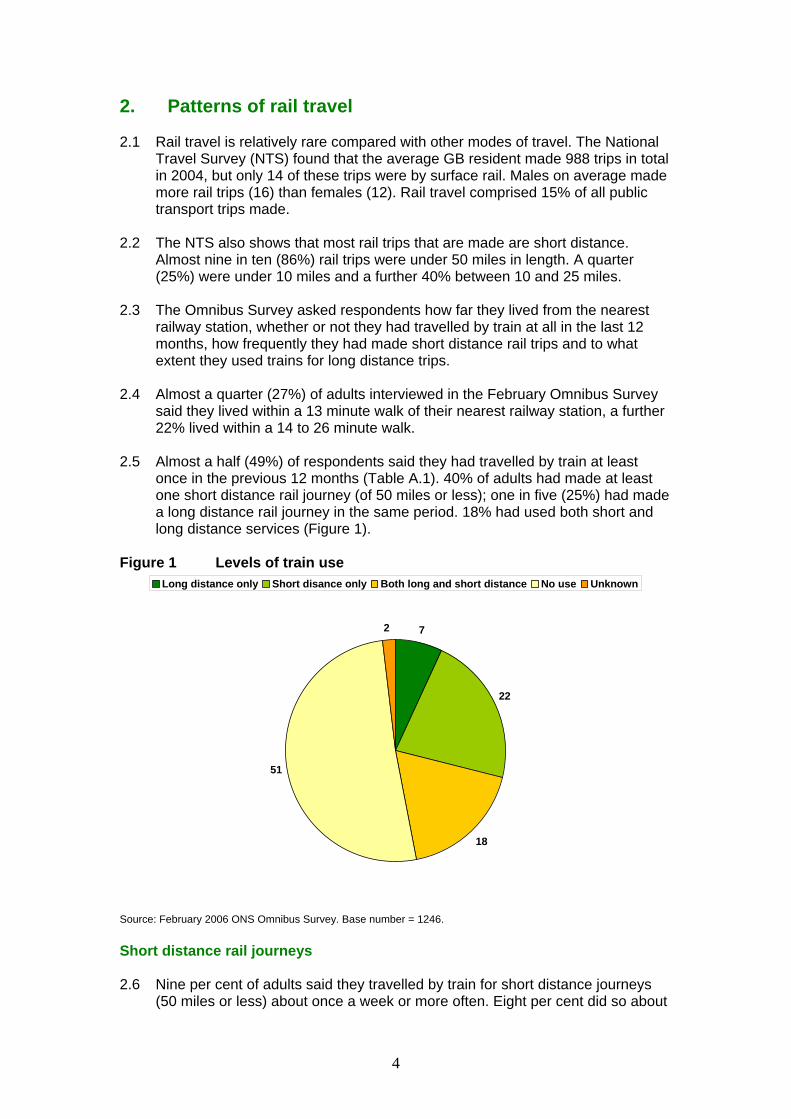
2.5 Almost a half (49%) of respondents said they had travelled by train at least
once in the previous 12 months (Table A.1). 40% of adults had made at least one short distance rail journey (of 50 miles or less); one in five (25%) had made a long distance rail journey in the same period. 18% had used both short and long distance services (Figure 1).
Figure 1 Levels of train use
7
22
18
51
2
Long distance only Short disance only Both long and short distance No use Unknown
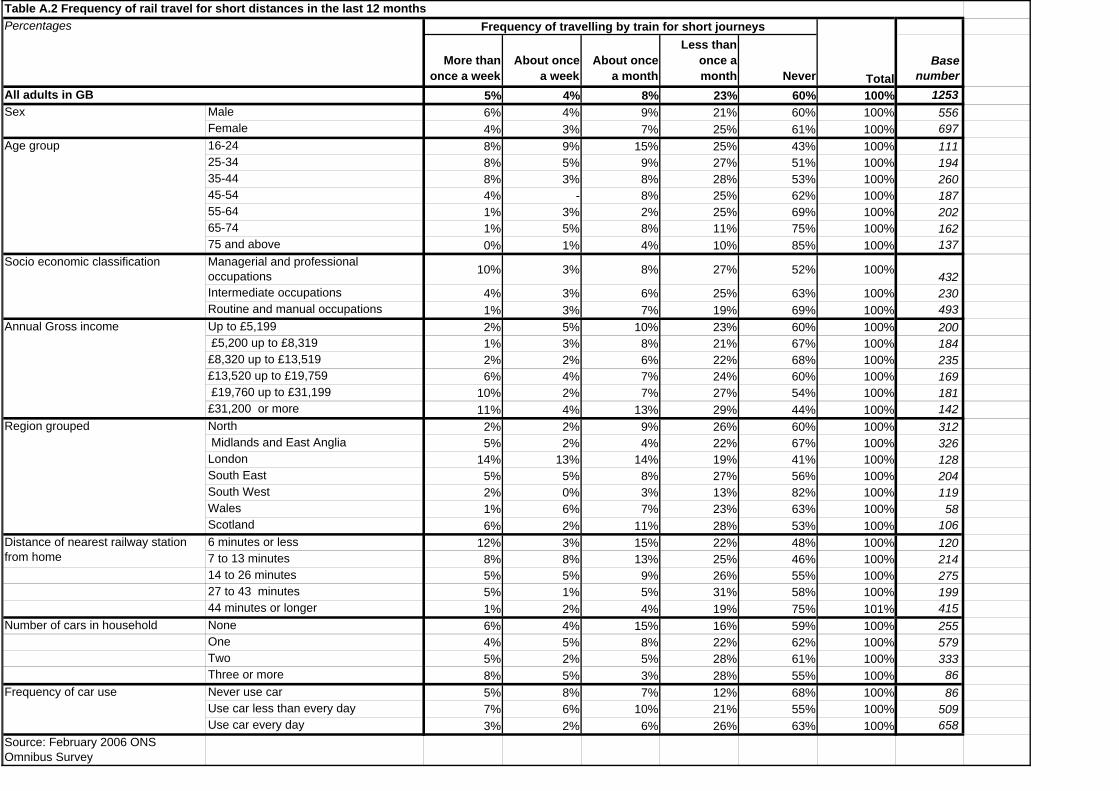
Source: February 2006 ONS Omnibus Survey. Base number = 1246. Short distance rail journeys 2.6 Nine per cent of adults said they travelled by train for short distance journeys
(50 miles or less) about once a week or more often. Eight per cent did so about
4
once a month, while 23% did so less than once a month (but more than once a year).
2.7 Young people aged from 16 to 24, were most likely to frequently make short
distance rail journeys, as were those in professional and managerial occupations and in the high income groups. There was no clear relationship between level of car ownership and frequency of train use (Table A.2).
2.8 Respondents living in London were more likely to frequently travel by train for
short distance journeys than those living elsewhere. Similarly, those who lived closer to a station (within a 13 minute walk) were more likely to frequently travel by train than those who lived further away (Table A.2).
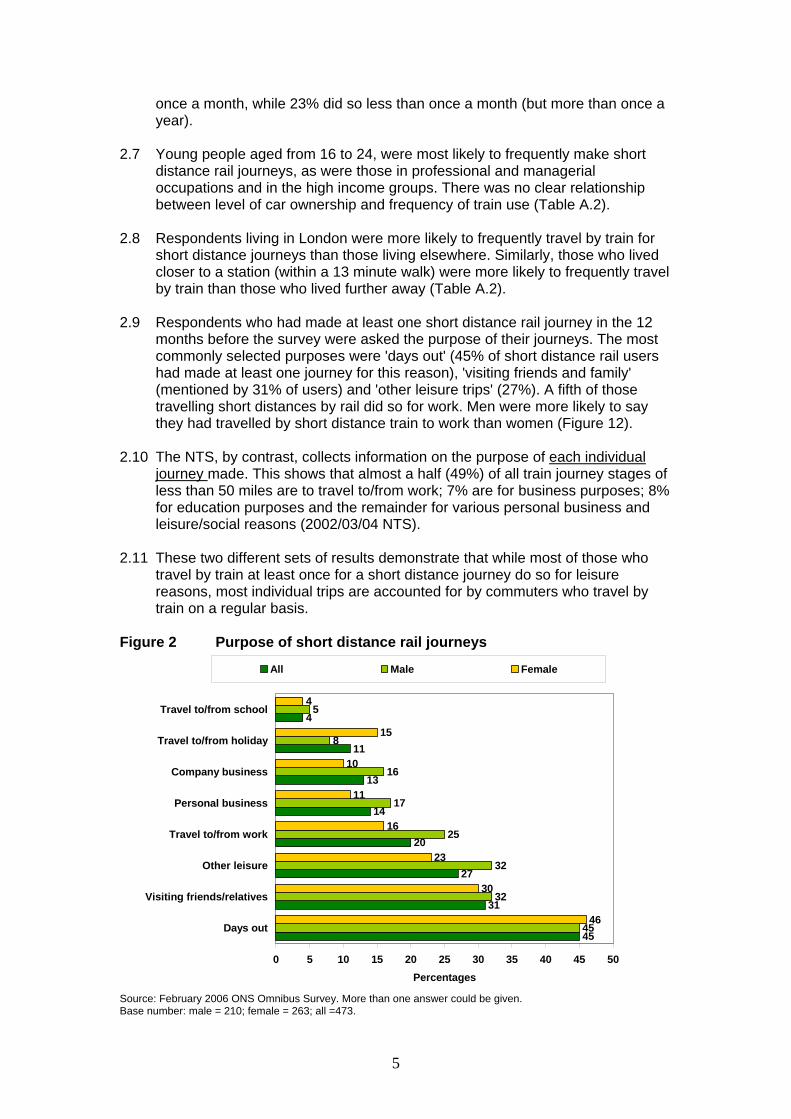
2.9 Respondents who had made at least one short distance rail journey in the 12
months before the survey were asked the purpose of their journeys. The most commonly selected purposes were 'days out' (45% of short distance rail users had made at least one journey for this reason), 'visiting friends and family' (mentioned by 31% of users) and 'other leisure trips' (27%). A fifth of those travelling short distances by rail did so for work. Men were more likely to say they had travelled by short distance train to work than women (Figure 12).
2.10 The NTS, by contrast, collects information on the purpose of each individual
journey made. This shows that almost a half (49%) of all train journey stages of less than 50 miles are to travel to/from work; 7% are for business purposes; 8% for education purposes and the remainder for various personal business and leisure/social reasons (2002/03/04 NTS).
2.11 These two different sets of results demonstrate that while most of those who
travel by train at least once for a short distance journey do so for leisure reasons, most individual trips are accounted for by commuters who travel by train on a regular basis.
Figure 2 Purpose of short distance rail journeys
45
11
4
45
32
32
25
17
16
8
5
46
30
23
16
11
10
15
4
31
27
13
14
20
0 5 10 15 20 25 30 35 40 45 50
Days out
Visiting friends/relatives
Other leisure
Travel to/from work
Personal business
Company business
Travel to/from holiday
Travel to/from school
Percentages
All Male Female
Source: February 2006 ONS Omnibus Survey. More than one answer could be given. Base number: male = 210; female = 263; all =473.
5
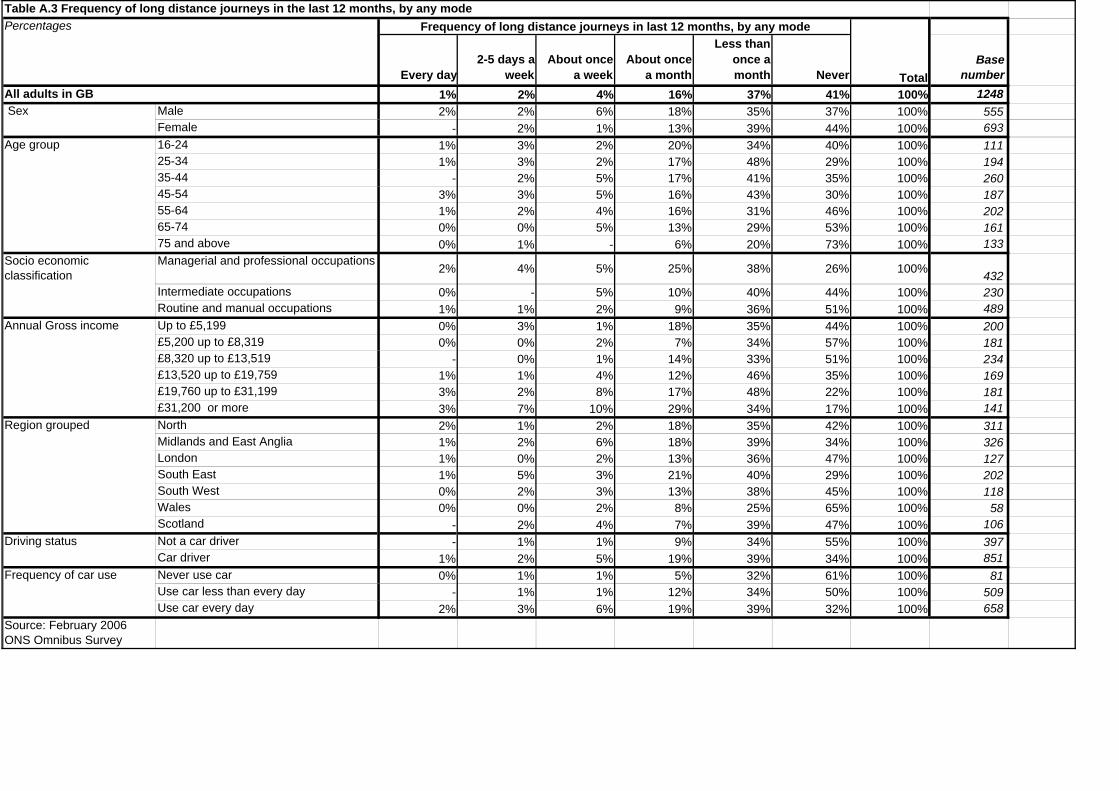
Long distance journeys 2.12 Long distance travel by rail is relatively rare. Four in ten (41%) adults did not
make any long distance journeys by any mode in the 12 months before interview, and a further 37% did so less than once a month. A fifth (22%) of adults made regular long distance journeys. (Table A.3).
2.13 Among those who had made long distance journeys, 57% said they did not
make any of these journeys by rail. A quarter (25%) said they made less than half of all of their long distance journeys by rail, 4% made about half of such journeys by rail and 13% made more than a half of such journeys by rail.
2.14 Overall, 25% of all respondents had made at least one long distance rail
journey in the last 12 months. Younger people were more likely to travel by long distance train than older people (34% of 16 to 34 year-olds had made a long distance train journey in the last year; 27% of 35 to 54 year-olds and 16% of those aged 55 and older). Those in managerial and professional occupations (37%) and in the highest income group (51%) were also particularly likely to use long distance trains (Table A.4).
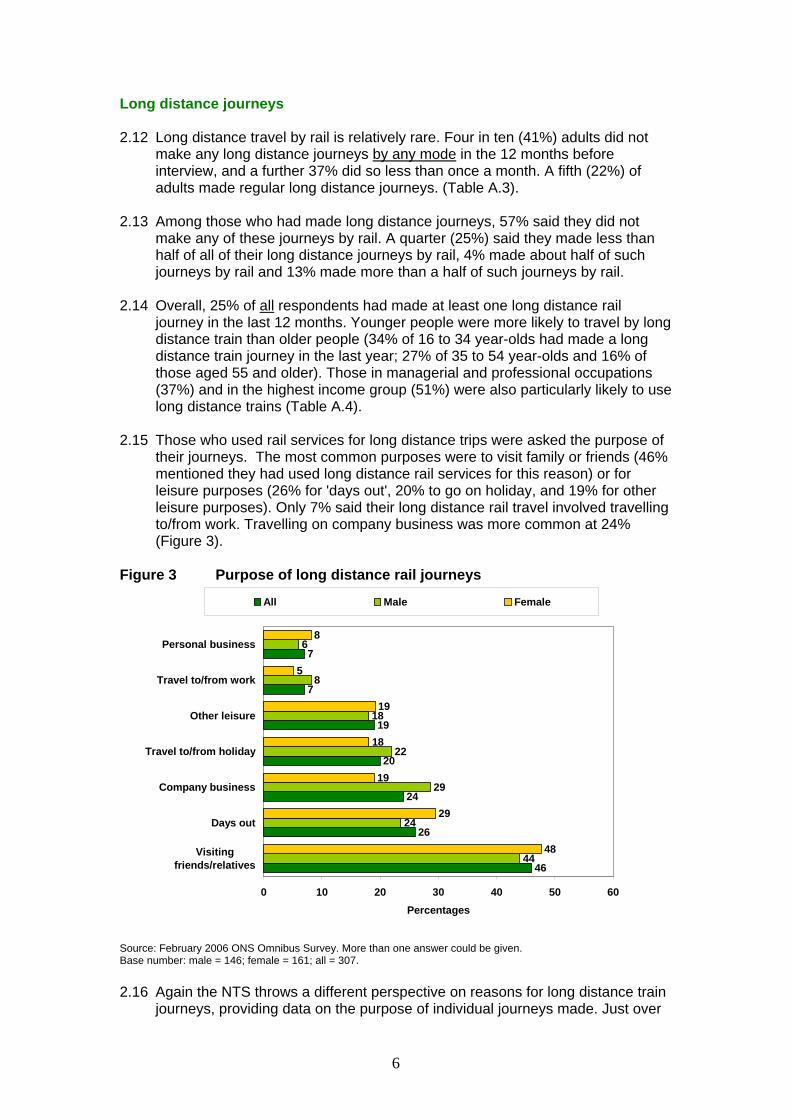
2.15 Those who used rail services for long distance trips were asked the purpose of
their journeys. The most common purposes were to visit family or friends (46% mentioned they had used long distance rail services for this reason) or for leisure purposes (26% for 'days out', 20% to go on holiday, and 19% for other leisure purposes). Only 7% said their long distance rail travel involved travelling to/from work. Travelling on company business was more common at 24% (Figure 3).
Figure 3 Purpose of long distance rail journeys
46
7
44
24
29
22
18
8
6
48
29
19
18
19
5
8
26
24
7
19
20
0 10 20 30 40 50 60
Visitingfriends/relatives
Days out
Company business
Travel to/from holiday
Other leisure
Travel to/from work
Personal business
Percentages
All Male Female
Source: February 2006 ONS Omnibus Survey. More than one answer could be given. Base number: male = 146; female = 161; all = 307. 2.16 Again the NTS throws a different perspective on reasons for long distance train
journeys, providing data on the purpose of individual journeys made. Just over
6
a half (53%) of train stages of 50 miles or more were for personal business/leisure/social reasons, 24% were commuting journeys and 21% for business purposes.
3. Ratings of short distance rail journeys
3.1 All respondents were asked to rate how good short distance rail services were
overall and against a series of different factors. Those who had not used services, were asked to give their impression based on what they knew or had heard.
Overall rating of short distance rail journeys 3.2 Overall, 10% of respondents rated the quality of train services for short journeys
as 'very good' and a further 40% rated services as 'fairly good'. 14% of respondents considered services to be 'very' or 'fairly' poor and 16% felt that services were 'neither good nor poor'. Just over a fifth (21%) of respondents said they did not know.
3.3 A far higher proportion of respondents who had not used short distance trains
said they were unable to rate services (34% said don't know), compared with those who had used services (1% said don't know).
3.4 Among respondents who were able to give an opinion (i.e. excluding those who
said don't know), 13% rated services as 'very good'; 50% as 'fairly good'; 12% as 'fairly poor'; 5% as 'very poor' and 20% as 'neither good nor poor'.
3.5 70% of those who had used short distance rail services in the last year rated
services as 'very' or 'fairly' good; 12% as 'very' or 'fairly' poor. Among non-users who expressed an opinion, 56% rated services as good; 22% as poor.
3.6 Figure 4 shows the overall ratings by frequency of use (excluding those
respondents who said don't know). Ratings were similar among users regardless of frequency of use (no significant differences).
7
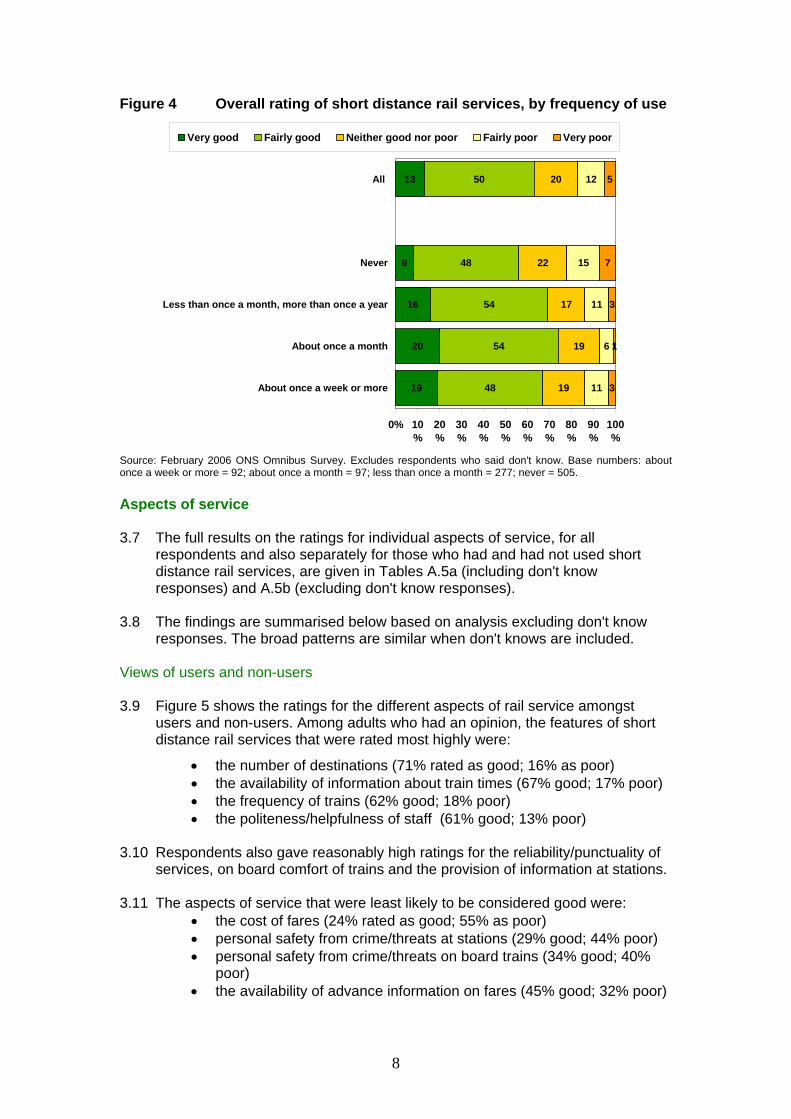
Figure 4 Overall rating of short distance rail services, by frequency of use
19
20
16
8
13
48
54
54
48
50
19
19
17
22
20
11
6
11
15
12
3
1
3
7
5
0% 10%
20%
30%
40%
50%
60%
70%
80%
90%
100%
About once a week or more
About once a month
Less than once a month, more than once a year
Never
All
Very good Fairly good Neither good nor poor Fairly poor Very poor
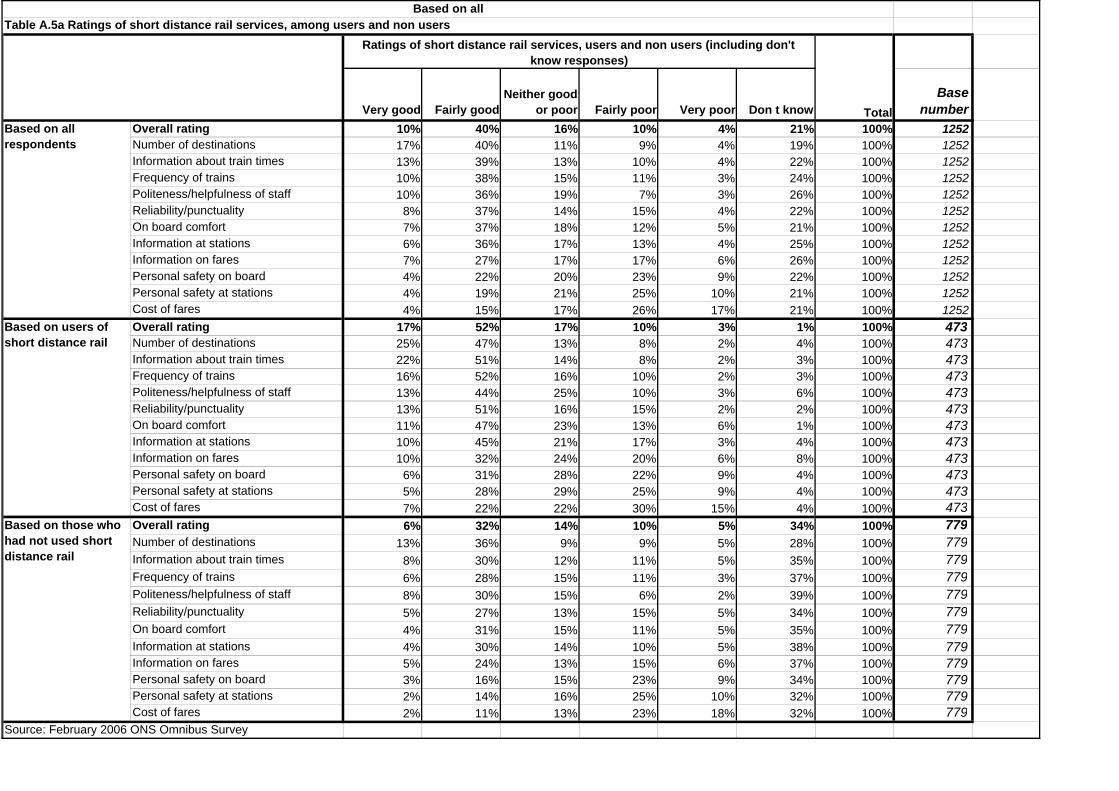
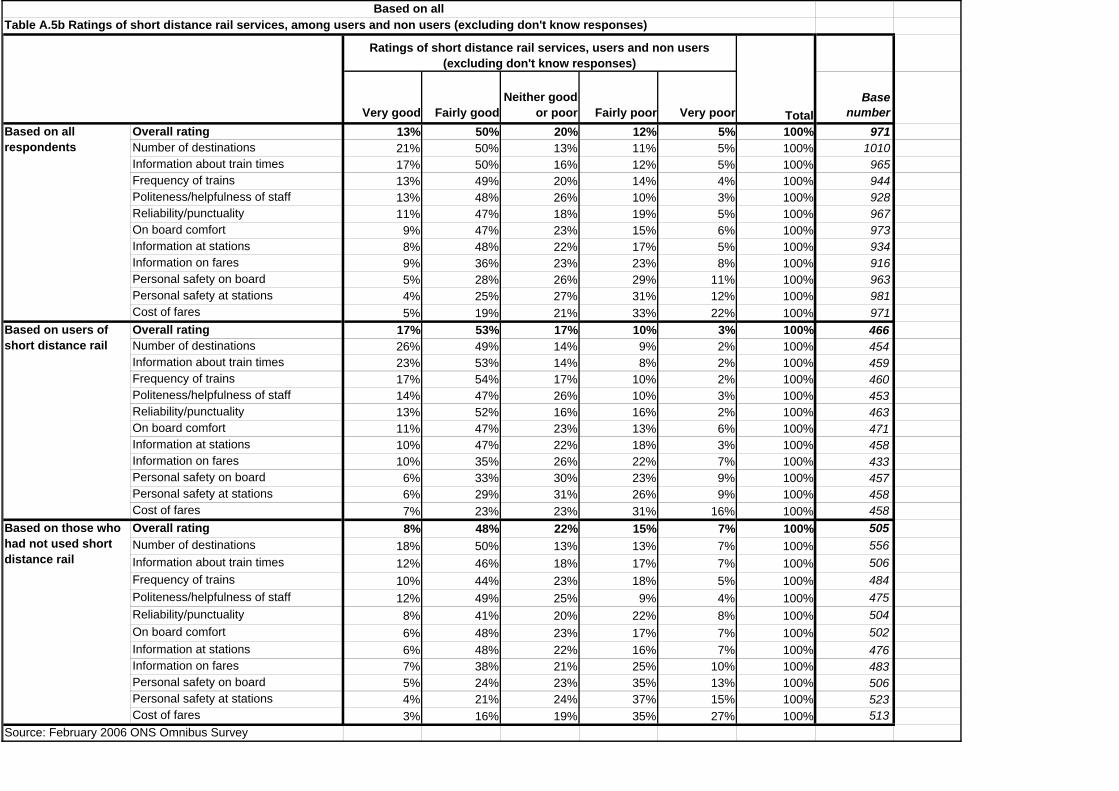
Source: February 2006 ONS Omnibus Survey. Excludes respondents who said don't know. Base numbers: about once a week or more = 92; about once a month = 97; less than once a month = 277; never = 505. Aspects of service 3.7 The full results on the ratings for individual aspects of service, for all
respondents and also separately for those who had and had not used short distance rail services, are given in Tables A.5a (including don't know responses) and A.5b (excluding don't know responses).
3.8 The findings are summarised below based on analysis excluding don't know
responses. The broad patterns are similar when don't knows are included. Views of users and non-users 3.9 Figure 5 shows the ratings for the different aspects of rail service amongst
users and non-users. Among adults who had an opinion, the features of short distance rail services that were rated most highly were:
• the number of destinations (71% rated as good; 16% as poor) • the availability of information about train times (67% good; 17% poor) • the frequency of trains (62% good; 18% poor) • the politeness/helpfulness of staff (61% good; 13% poor)
3.10 Respondents also gave reasonably high ratings for the reliability/punctuality of services, on board comfort of trains and the provision of information at stations.
3.11 The aspects of service that were least likely to be considered good were:
• the cost of fares (24% rated as good; 55% as poor) • personal safety from crime/threats at stations (29% good; 44% poor) • personal safety from crime/threats on board trains (34% good; 40%
poor) • the availability of advance information on fares (45% good; 32% poor)
8
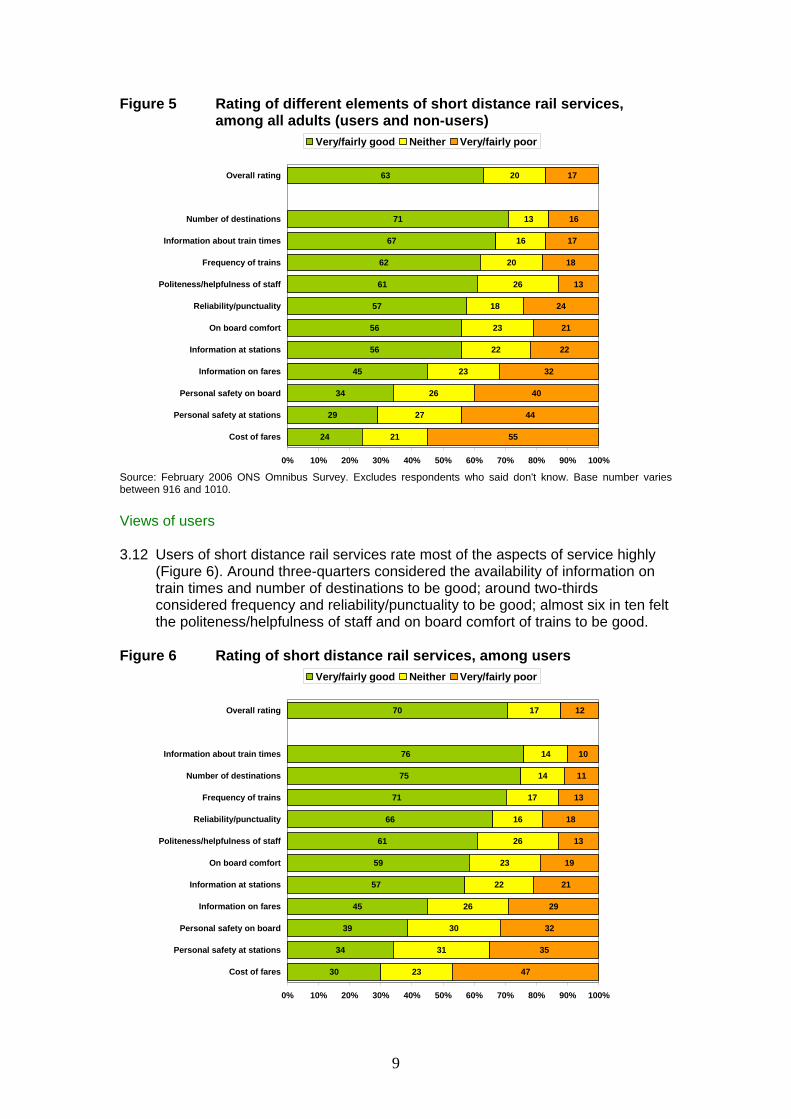
Figure 5 Rating of different elements of short distance rail services, among all adults (users and non-users)
24
57
61
62
67
71
63
21
27
26
23
22
23
18
26
20
16
13
20
55
44
40
32
22
21
24
13
18
17
16
17
45
56
56
34
29
0% 10% 20% 30% 40% 50% 60% 70% 80% 90% 100%
Cost of fares
Personal safety at stations
Personal safety on board
Information on fares
Information at stations
On board comfort
Reliability/punctuality
Politeness/helpfulness of staff
Frequency of trains
Information about train times
Number of destinations
Overall rating
Very/fairly good Neither Very/fairly poor
Source: February 2006 ONS Omnibus Survey. Excludes respondents who said don't know. Base number varies between 916 and 1010. Views of users 3.12 Users of short distance rail services rate most of the aspects of service highly
(Figure 6). Around three-quarters considered the availability of information on train times and number of destinations to be good; around two-thirds considered frequency and reliability/punctuality to be good; almost six in ten felt the politeness/helpfulness of staff and on board comfort of trains to be good.
Figure 6 Rating of short distance rail services, among users
30
61
66
71
75
76
70
23
31
30
26
22
23
26
16
17
14
14
17
47
35
32
29
21
19
13
18
13
11
10
12
45
57
59
39
34
0% 10% 20% 30% 40% 50% 60% 70% 80% 90% 100%
Cost of fares
Personal safety at stations
Personal safety on board
Information on fares
Information at stations
On board comfort
Politeness/helpfulness of staff
Reliability/punctuality
Frequency of trains
Number of destinations
Information about train times
Overall rating
Very/fairly good Neither Very/fairly poor
9
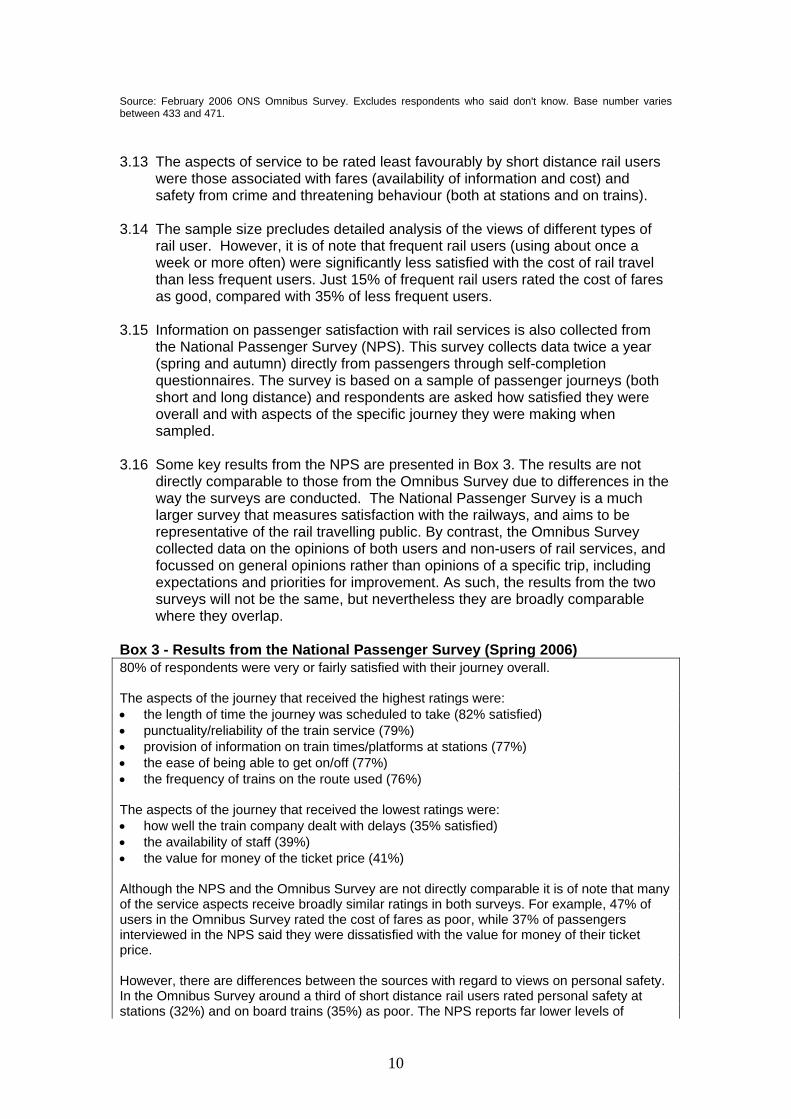
Source: February 2006 ONS Omnibus Survey. Excludes respondents who said don't know. Base number varies between 433 and 471. 3.13 The aspects of service to be rated least favourably by short distance rail users
were those associated with fares (availability of information and cost) and safety from crime and threatening behaviour (both at stations and on trains).
3.14 The sample size precludes detailed analysis of the views of different types of
rail user. However, it is of note that frequent rail users (using about once a week or more often) were significantly less satisfied with the cost of rail travel than less frequent users. Just 15% of frequent rail users rated the cost of fares as good, compared with 35% of less frequent users.
3.15 Information on passenger satisfaction with rail services is also collected from
the National Passenger Survey (NPS). This survey collects data twice a year (spring and autumn) directly from passengers through self-completion questionnaires. The survey is based on a sample of passenger journeys (both short and long distance) and respondents are asked how satisfied they were overall and with aspects of the specific journey they were making when sampled.
3.16 Some key results from the NPS are presented in Box 3. The results are not
directly comparable to those from the Omnibus Survey due to differences in the way the surveys are conducted. The National Passenger Survey is a much larger survey that measures satisfaction with the railways, and aims to be representative of the rail travelling public. By contrast, the Omnibus Survey collected data on the opinions of both users and non-users of rail services, and focussed on general opinions rather than opinions of a specific trip, including expectations and priorities for improvement. As such, the results from the two surveys will not be the same, but nevertheless they are broadly comparable where they overlap.
Box 3 - Results from the National Passenger Survey (Spring 2006) 80% of respondents were very or fairly satisfied with their journey overall. The aspects of the journey that received the highest ratings were: • the length of time the journey was scheduled to take (82% satisfied) • punctuality/reliability of the train service (79%) • provision of information on train times/platforms at stations (77%) • the ease of being able to get on/off (77%) • the frequency of trains on the route used (76%) The aspects of the journey that received the lowest ratings were: • how well the train company dealt with delays (35% satisfied) • the availability of staff (39%) • the value for money of the ticket price (41%) Although the NPS and the Omnibus Survey are not directly comparable it is of note that many of the service aspects receive broadly similar ratings in both surveys. For example, 47% of users in the Omnibus Survey rated the cost of fares as poor, while 37% of passengers interviewed in the NPS said they were dissatisfied with the value for money of their ticket price. However, there are differences between the sources with regard to views on personal safety. In the Omnibus Survey around a third of short distance rail users rated personal safety at stations (32%) and on board trains (35%) as poor. The NPS reports far lower levels of
10
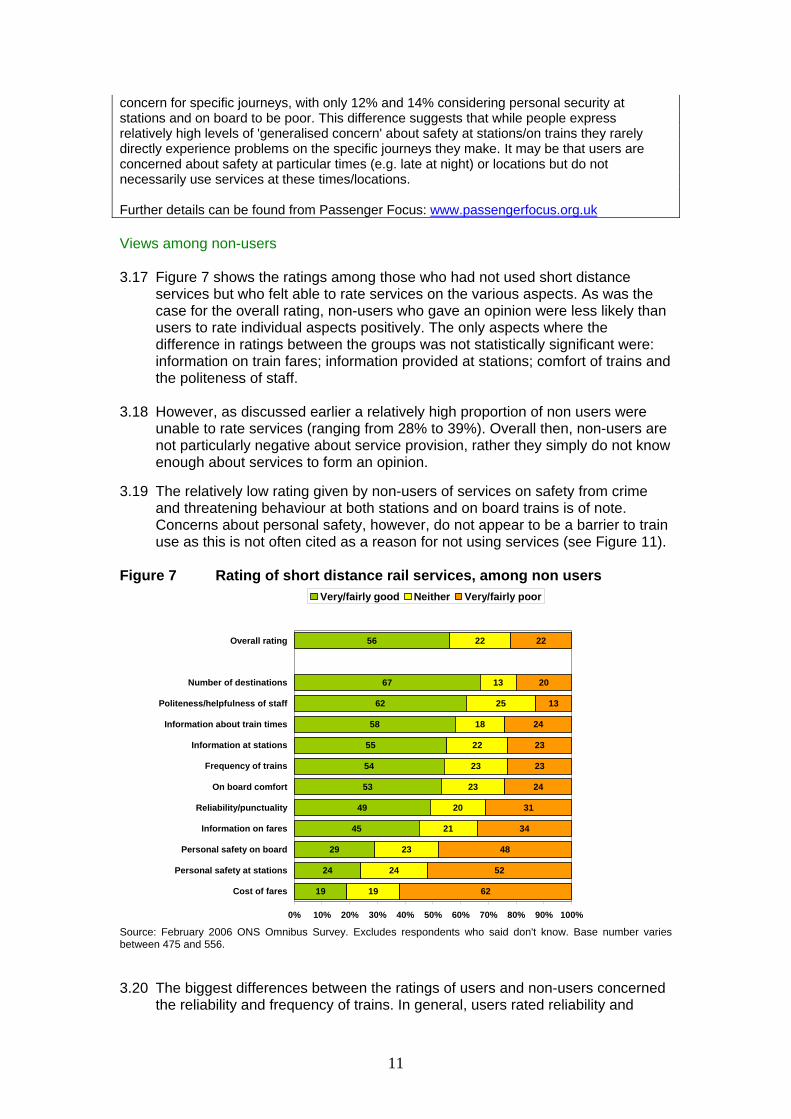
concern for specific journeys, with only 12% and 14% considering personal security at stations and on board to be poor. This difference suggests that while people express relatively high levels of 'generalised concern' about safety at stations/on trains they rarely directly experience problems on the specific journeys they make. It may be that users are concerned about safety at particular times (e.g. late at night) or locations but do not necessarily use services at these times/locations. Further details can be found from Passenger Focus: www.passengerfocus.org.uk Views among non-users 3.17 Figure 7 shows the ratings among those who had not used short distance
services but who felt able to rate services on the various aspects. As was the case for the overall rating, non-users who gave an opinion were less likely than users to rate individual aspects positively. The only aspects where the difference in ratings between the groups was not statistically significant were: information on train fares; information provided at stations; comfort of trains and the politeness of staff.
3.18 However, as discussed earlier a relatively high proportion of non users were
unable to rate services (ranging from 28% to 39%). Overall then, non-users are not particularly negative about service provision, rather they simply do not know enough about services to form an opinion.
3.19 The relatively low rating given by non-users of services on safety from crime
and threatening behaviour at both stations and on board trains is of note. Concerns about personal safety, however, do not appear to be a barrier to train use as this is not often cited as a reason for not using services (see Figure 11).
Figure 7 Rating of short distance rail services, among non users
19
54
55
58
62
67
56
19
24
23
21
20
23
23
22
18
25
13
22
62
52
48
34
31
24
23
23
24
13
20
22
45
49
53
29
24
0% 10% 20% 30% 40% 50% 60% 70% 80% 90% 100%
Cost of fares
Personal safety at stations
Personal safety on board
Information on fares
Reliability/punctuality
On board comfort
Frequency of trains
Information at stations
Information about train times
Politeness/helpfulness of staff
Number of destinations
Overall rating
Very/fairly good Neither Very/fairly poor
Source: February 2006 ONS Omnibus Survey. Excludes respondents who said don't know. Base number varies between 475 and 556. 3.20 The biggest differences between the ratings of users and non-users concerned
the reliability and frequency of trains. In general, users rated reliability and
11
frequency relatively highly compared other aspects of service, while among non-users these aspects of service were rated less well.
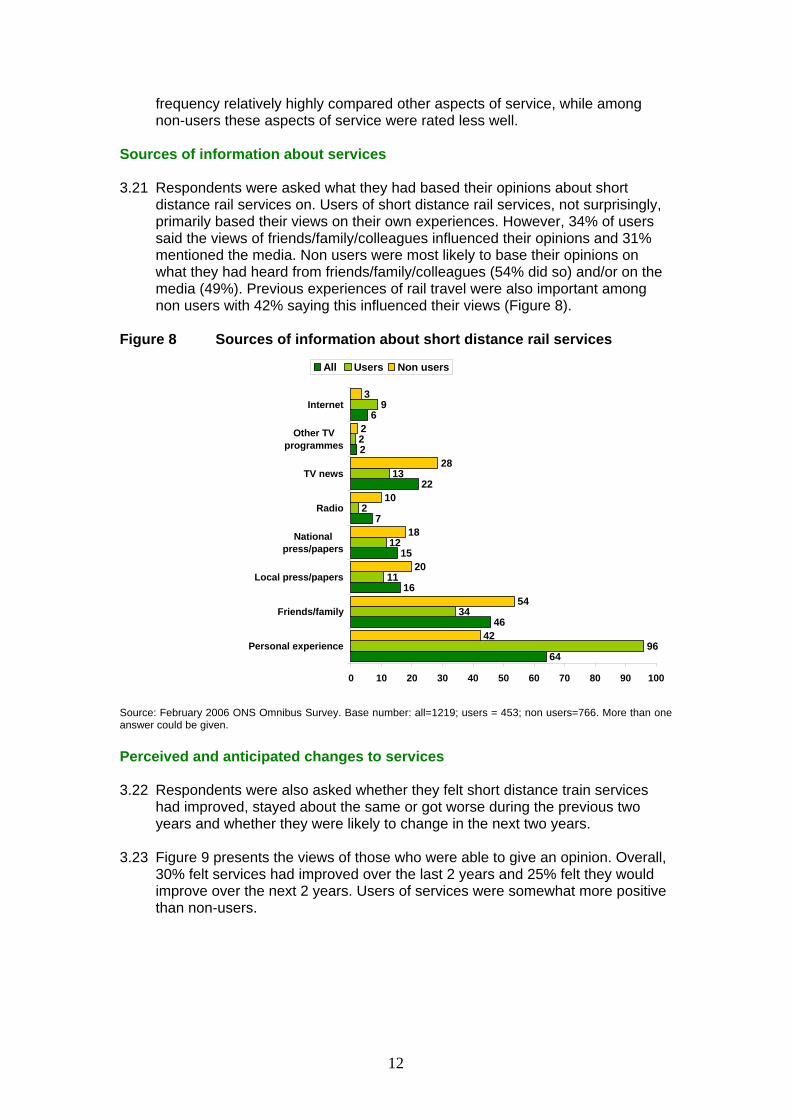
Sources of information about services 3.21 Respondents were asked what they had based their opinions about short
distance rail services on. Users of short distance rail services, not surprisingly, primarily based their views on their own experiences. However, 34% of users said the views of friends/family/colleagues influenced their opinions and 31% mentioned the media. Non users were most likely to base their opinions on what they had heard from friends/family/colleagues (54% did so) and/or on the media (49%). Previous experiences of rail travel were also important among non users with 42% saying this influenced their views (Figure 8).
Figure 8 Sources of information about short distance rail services
64
46
16
15
7
22
2
6
96
34
11
12
2
13
2
9
42
54
20
18
10
28
2
3
0 10 20 30 40 50 60 70 80 90 100
Personal experience
Friends/family
Local press/papers
Nationalpress/papers
Radio
TV news
Other TVprogrammes
Internet
All Users Non users
Source: February 2006 ONS Omnibus Survey. Base number: all=1219; users = 453; non users=766. More than one answer could be given. Perceived and anticipated changes to services 3.22 Respondents were also asked whether they felt short distance train services
had improved, stayed about the same or got worse during the previous two years and whether they were likely to change in the next two years.
3.23 Figure 9 presents the views of those who were able to give an opinion. Overall,
30% felt services had improved over the last 2 years and 25% felt they would improve over the next 2 years. Users of services were somewhat more positive than non-users.
12
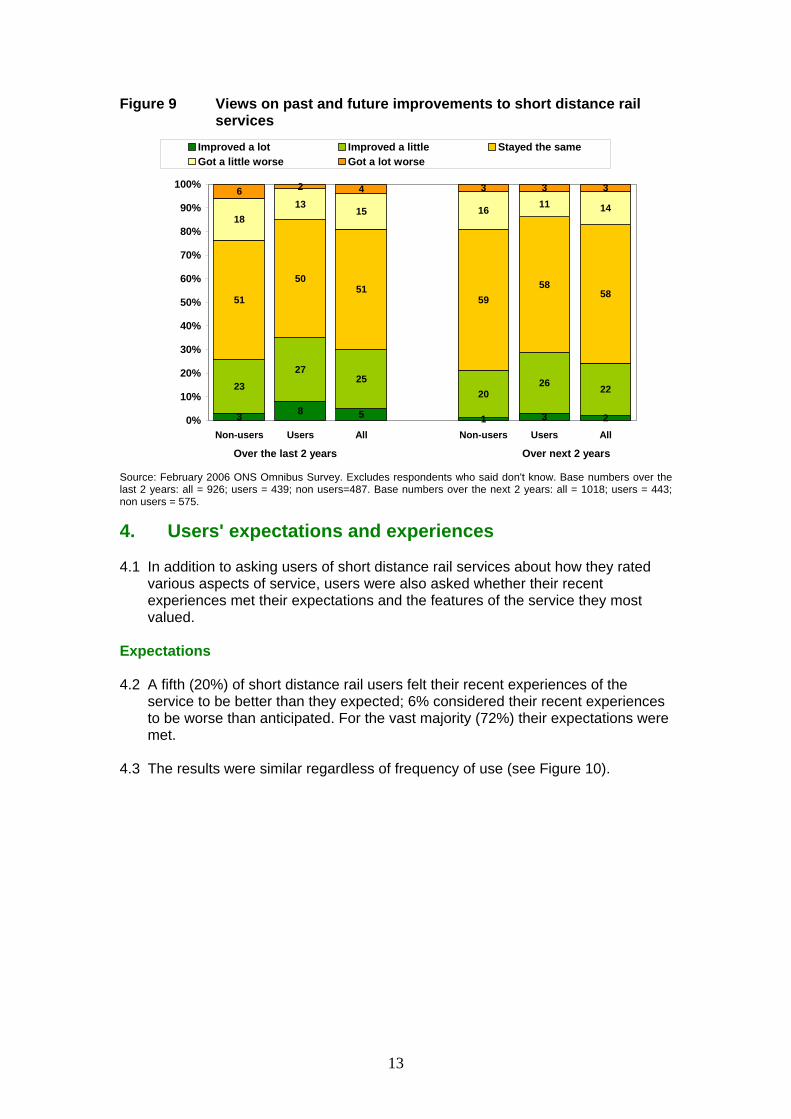
Figure 9 Views on past and future improvements to short distance rail services
3 8 5 1 3 2
2327
2520
26 22
51
5051
5958
58
1813
15 16 11 146 2 4 3 3 3
0%
10%
20%
30%
40%
50%
60%
70%
80%
90%
100%
Non-users Users All Non-users Users All
Improved a lot Improved a little Stayed the sameGot a little worse Got a lot worse
Over the last 2 years Over next 2 years
Source: February 2006 ONS Omnibus Survey. Excludes respondents who said don't know. Base numbers over the last 2 years: all = 926; users = 439; non users=487. Base numbers over the next 2 years: all = 1018; users = 443; non users = 575.
4. Users' expectations and experiences 4.1 In addition to asking users of short distance rail services about how they rated
various aspects of service, users were also asked whether their recent experiences met their expectations and the features of the service they most valued.
Expectations 4.2 A fifth (20%) of short distance rail users felt their recent experiences of the
service to be better than they expected; 6% considered their recent experiences to be worse than anticipated. For the vast majority (72%) their expectations were met.
4.3 The results were similar regardless of frequency of use (see Figure 10).
13
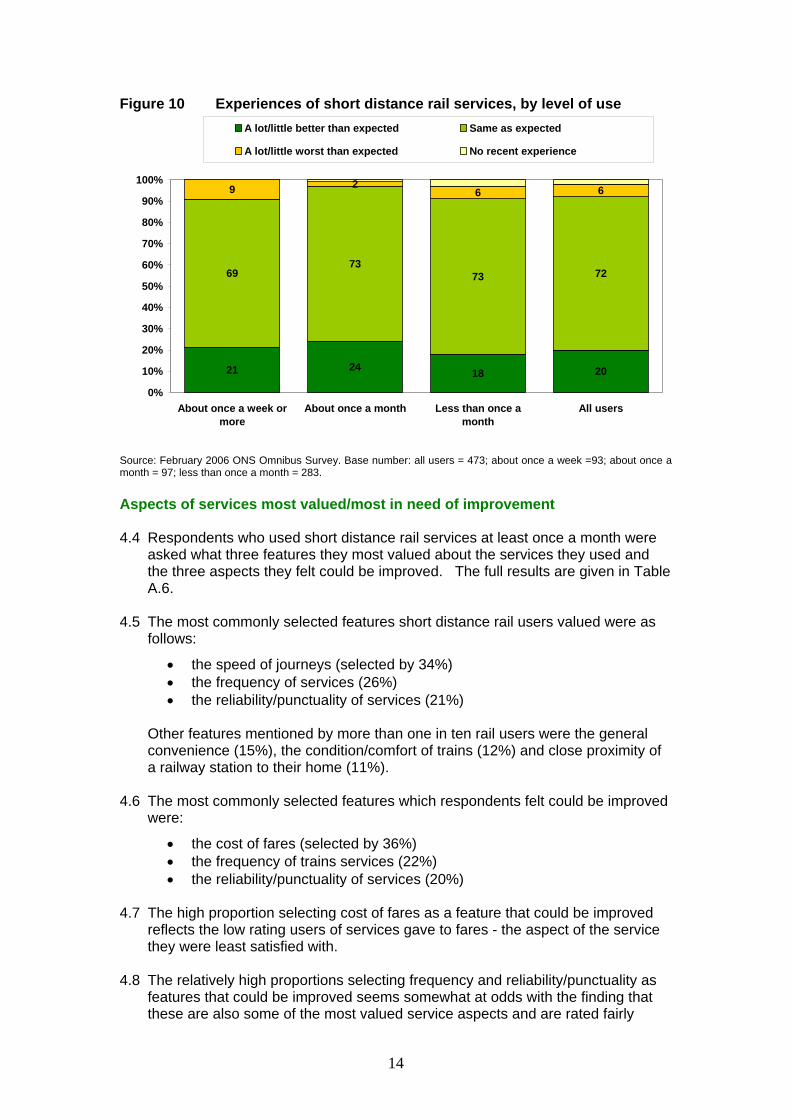
Figure 10 Experiences of short distance rail services, by level of use
21
6973
73 72
9 26 6
201824
0%
10%
20%
30%
40%
50%
60%
70%
80%
90%
100%
About once a week ormore
About once a month Less than once amonth
All users
A lot/little better than expected Same as expected
A lot/little worst than expected No recent experience
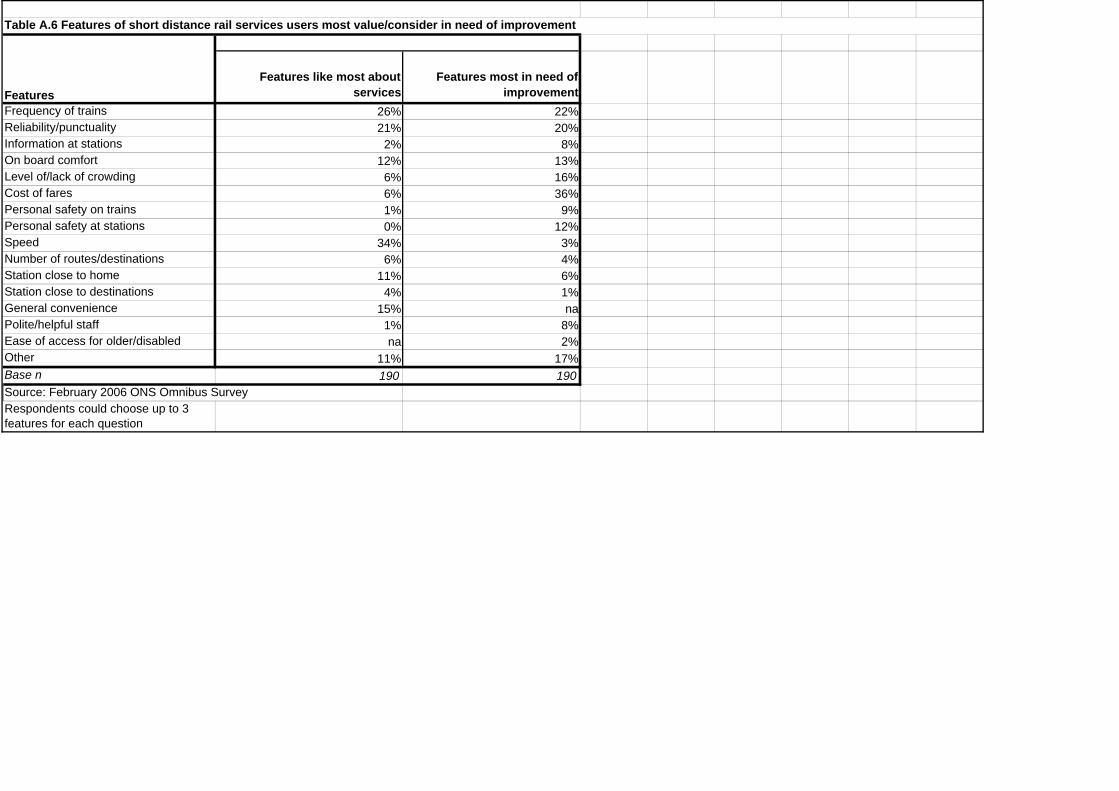
Source: February 2006 ONS Omnibus Survey. Base number: all users = 473; about once a week =93; about once a month = 97; less than once a month = 283. Aspects of services most valued/most in need of improvement 4.4 Respondents who used short distance rail services at least once a month were
asked what three features they most valued about the services they used and the three aspects they felt could be improved. The full results are given in Table A.6.
4.5 The most commonly selected features short distance rail users valued were as
follows:
• the speed of journeys (selected by 34%) • the frequency of services (26%) • the reliability/punctuality of services (21%)
Other features mentioned by more than one in ten rail users were the general convenience (15%), the condition/comfort of trains (12%) and close proximity of a railway station to their home (11%).
4.6 The most commonly selected features which respondents felt could be improved
were:
• the cost of fares (selected by 36%) • the frequency of trains services (22%) • the reliability/punctuality of services (20%)
4.7 The high proportion selecting cost of fares as a feature that could be improved
reflects the low rating users of services gave to fares - the aspect of the service they were least satisfied with.
4.8 The relatively high proportions selecting frequency and reliability/punctuality as
features that could be improved seems somewhat at odds with the finding that these are also some of the most valued service aspects and are rated fairly
14
highly (around seven in ten saying they believe these aspects of service to be very/fairly good). This suggests that these are service features which are very important to users and which they would like to see improved further.
4.9 Other features mentioned by more than one in ten rail users were less crowded
trains (16%), improved condition/comfort of trains (13%) and better personal safety at railway stations (12%). The relatively low proportions selecting personal safety at railways stations/on trains suggest that despite this being an area of concern not many people believe much more could be done to improve security.
4.10 Almost a fifth (17%) of users said there was nothing that could be improved. 5. Potential to increase use of short distance rail services Reasons for not using short distance rail services 5.1 Respondents who had not used short distance rail services at all in the last 12
months or had only done so less than monthly were asked why they did not use rail services (more often). They were asked for all reasons and then for the main reason.
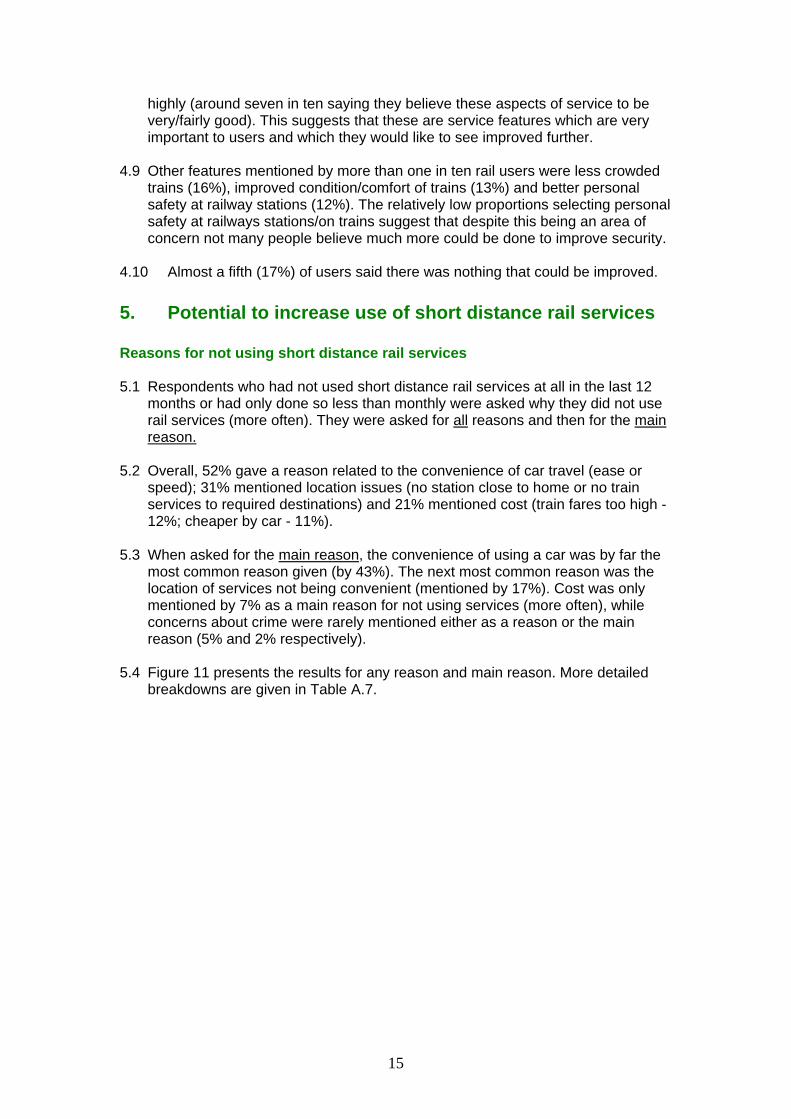
5.2 Overall, 52% gave a reason related to the convenience of car travel (ease or
speed); 31% mentioned location issues (no station close to home or no train services to required destinations) and 21% mentioned cost (train fares too high - 12%; cheaper by car - 11%).
5.3 When asked for the main reason, the convenience of using a car was by far the
most common reason given (by 43%). The next most common reason was the location of services not being convenient (mentioned by 17%). Cost was only mentioned by 7% as a main reason for not using services (more often), while concerns about crime were rarely mentioned either as a reason or the main reason (5% and 2% respectively).
5.4 Figure 11 presents the results for any reason and main reason. More detailed
breakdowns are given in Table A.7.
15
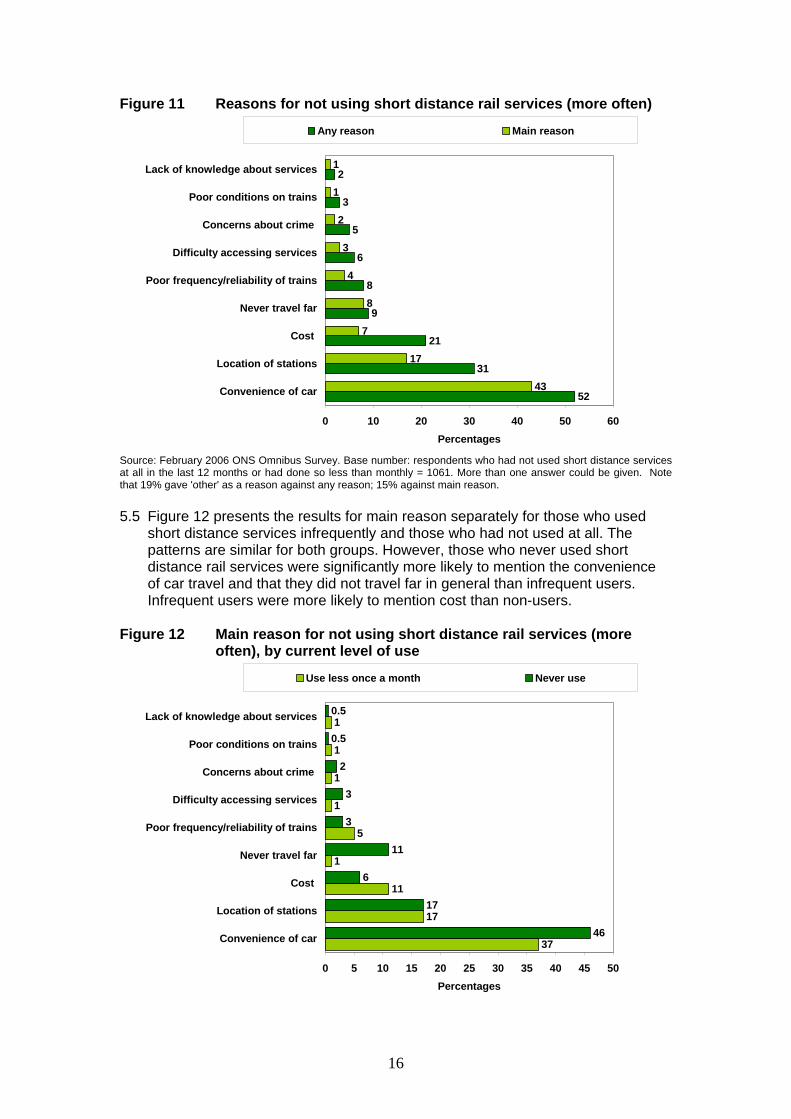
Figure 11 Reasons for not using short distance rail services (more often)
52
5
3
2
43
17
7
8
4
3
2
1
1
31
21
6
8
9
0 10 20 30 40 50 60
Convenience of car
Location of stations
Cost
Never travel far
Poor frequency/reliability of trains
Difficulty accessing services
Concerns about crime
Poor conditions on trains
Lack of knowledge about services
Percentages
Any reason Main reason
Source: February 2006 ONS Omnibus Survey. Base number: respondents who had not used short distance services at all in the last 12 months or had done so less than monthly = 1061. More than one answer could be given. Note that 19% gave 'other' as a reason against any reason; 15% against main reason. 5.5 Figure 12 presents the results for main reason separately for those who used
short distance services infrequently and those who had not used at all. The patterns are similar for both groups. However, those who never used short distance rail services were significantly more likely to mention the convenience of car travel and that they did not travel far in general than infrequent users. Infrequent users were more likely to mention cost than non-users.
Figure 12 Main reason for not using short distance rail services (more often), by current level of use
37
17
11
1
5
1
1
1
1
46
17
6
11
3
3
2
0.5
0.5
0 5 10 15 20 25 30 35 40 45 50
Convenience of car
Location of stations
Cost
Never travel far
Poor frequency/reliability of trains
Difficulty accessing services
Concerns about crime
Poor conditions on trains
Lack of knowledge about services
Percentages
Use less once a month Never use
16
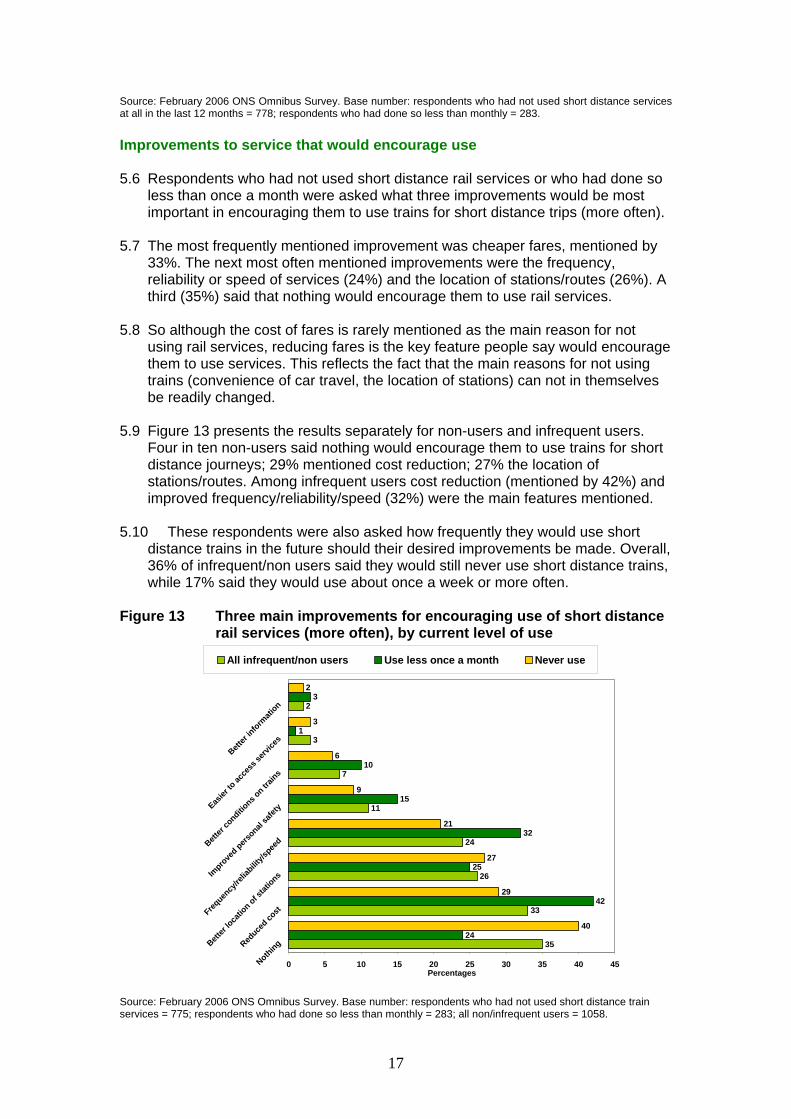
Source: February 2006 ONS Omnibus Survey. Base number: respondents who had not used short distance services at all in the last 12 months = 778; respondents who had done so less than monthly = 283. Improvements to service that would encourage use 5.6 Respondents who had not used short distance rail services or who had done so
less than once a month were asked what three improvements would be most important in encouraging them to use trains for short distance trips (more often).
5.7 The most frequently mentioned improvement was cheaper fares, mentioned by
33%. The next most often mentioned improvements were the frequency, reliability or speed of services (24%) and the location of stations/routes (26%). A third (35%) said that nothing would encourage them to use rail services.
5.8 So although the cost of fares is rarely mentioned as the main reason for not
using rail services, reducing fares is the key feature people say would encourage them to use services. This reflects the fact that the main reasons for not using trains (convenience of car travel, the location of stations) can not in themselves be readily changed.
5.9 Figure 13 presents the results separately for non-users and infrequent users.
Four in ten non-users said nothing would encourage them to use trains for short distance journeys; 29% mentioned cost reduction; 27% the location of stations/routes. Among infrequent users cost reduction (mentioned by 42%) and improved frequency/reliability/speed (32%) were the main features mentioned.
5.10 These respondents were also asked how frequently they would use short
distance trains in the future should their desired improvements be made. Overall, 36% of infrequent/non users said they would still never use short distance trains, while 17% said they would use about once a week or more often.
Figure 13 Three main improvements for encouraging use of short distance rail services (more often), by current level of use
35
33
26
24
11
7
3
2
24
42
25
32
15
10
1
3
40
29
27
21
9
6
3
2
0 5 10 15 20 25 30 35 40 45NothingReduce
d cost
Better
locatio
n of stat
ions
Frequen
cy/re
liabilit
y/spee
d
Impro
ved pers
onal sa
fety
Better
conditio
ns on tr
ains
Easier
to ac
cess
servi
ces
Better
informati
on
Percentages
All infrequent/non users Use less once a month Never use
Source: February 2006 ONS Omnibus Survey. Base number: respondents who had not used short distance train services = 775; respondents who had done so less than monthly = 283; all non/infrequent users = 1058.
17
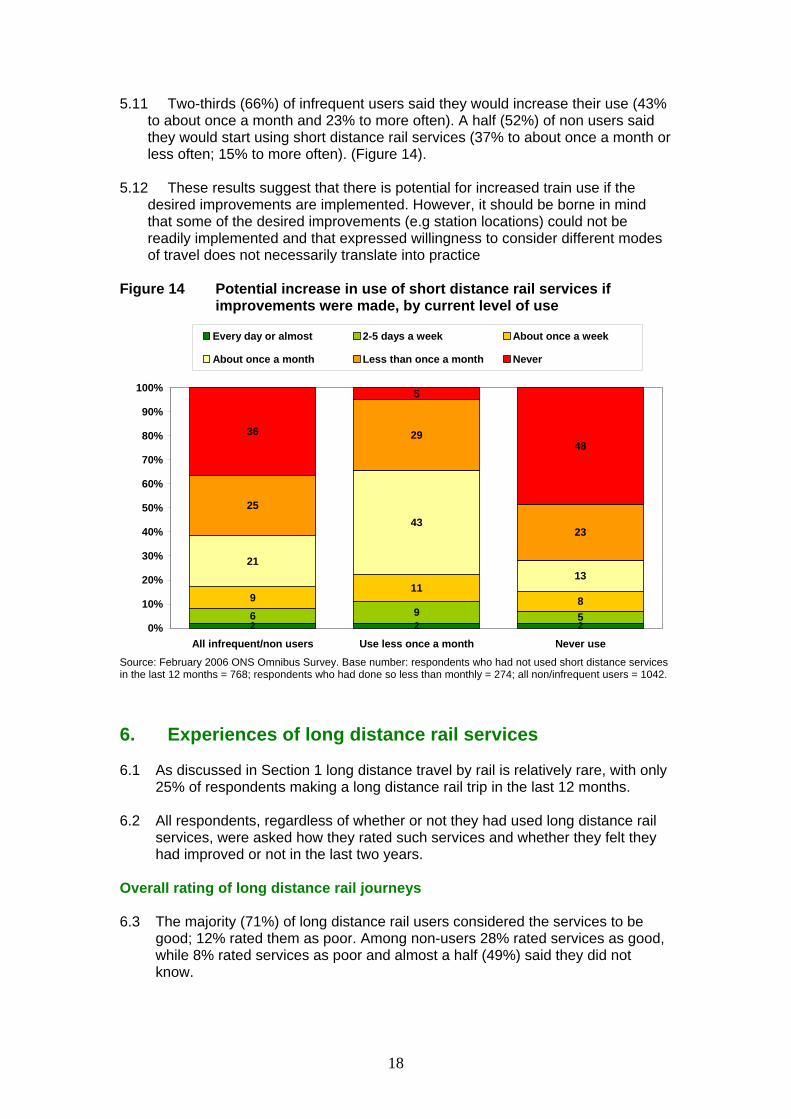
5.11 Two-thirds (66%) of infrequent users said they would increase their use (43% to about once a month and 23% to more often). A half (52%) of non users said they would start using short distance rail services (37% to about once a month or less often; 15% to more often). (Figure 14).
5.12 These results suggest that there is potential for increased train use if the
desired improvements are implemented. However, it should be borne in mind that some of the desired improvements (e.g station locations) could not be readily implemented and that expressed willingness to consider different modes of travel does not necessarily translate into practice
Figure 14 Potential increase in use of short distance rail services if improvements were made, by current level of use
26 9 5
911
8
21
43
13
25
29
23
36
5
48
220%
10%
20%
30%
40%
50%
60%
70%
80%
90%
100%
All infrequent/non users Use less once a month Never use
Every day or almost 2-5 days a week About once a week
About once a month Less than once a month Never
Source: February 2006 ONS Omnibus Survey. Base number: respondents who had not used short distance services in the last 12 months = 768; respondents who had done so less than monthly = 274; all non/infrequent users = 1042.
6. Experiences of long distance rail services 6.1 As discussed in Section 1 long distance travel by rail is relatively rare, with only
25% of respondents making a long distance rail trip in the last 12 months. 6.2 All respondents, regardless of whether or not they had used long distance rail
services, were asked how they rated such services and whether they felt they had improved or not in the last two years.
Overall rating of long distance rail journeys 6.3 The majority (71%) of long distance rail users considered the services to be
good; 12% rated them as poor. Among non-users 28% rated services as good, while 8% rated services as poor and almost a half (49%) said they did not know.
18
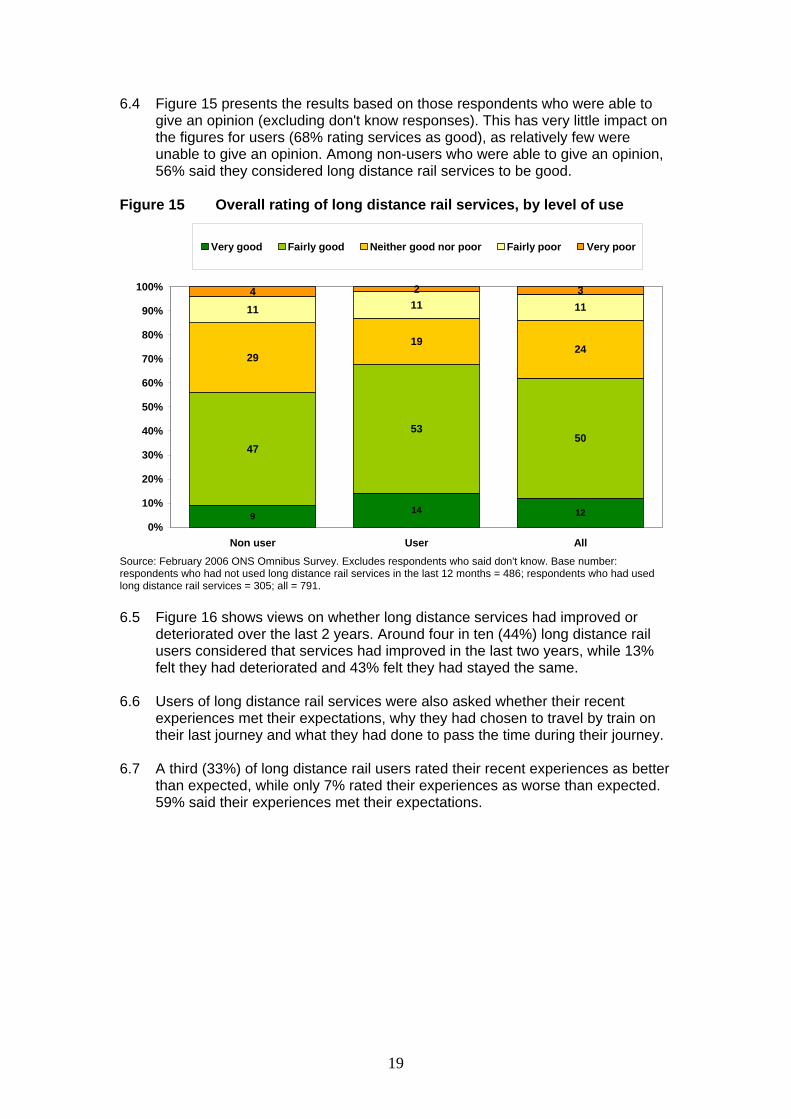
6.4 Figure 15 presents the results based on those respondents who were able to give an opinion (excluding don't know responses). This has very little impact on the figures for users (68% rating services as good), as relatively few were unable to give an opinion. Among non-users who were able to give an opinion, 56% said they considered long distance rail services to be good.
Figure 15 Overall rating of long distance rail services, by level of use
9
47
5350
2919
24
11 11 112
1214
34
0%
10%
20%
30%
40%
50%
60%
70%
80%
90%
100%
Non user User All
Very good Fairly good Neither good nor poor Fairly poor Very poor
Source: February 2006 ONS Omnibus Survey. Excludes respondents who said don't know. Base number: respondents who had not used long distance rail services in the last 12 months = 486; respondents who had used long distance rail services = 305; all = 791. 6.5 Figure 16 shows views on whether long distance services had improved or
deteriorated over the last 2 years. Around four in ten (44%) long distance rail users considered that services had improved in the last two years, while 13% felt they had deteriorated and 43% felt they had stayed the same.
6.6 Users of long distance rail services were also asked whether their recent
experiences met their expectations, why they had chosen to travel by train on their last journey and what they had done to pass the time during their journey.
6.7 A third (33%) of long distance rail users rated their recent experiences as better
than expected, while only 7% rated their experiences as worse than expected. 59% said their experiences met their expectations.
19
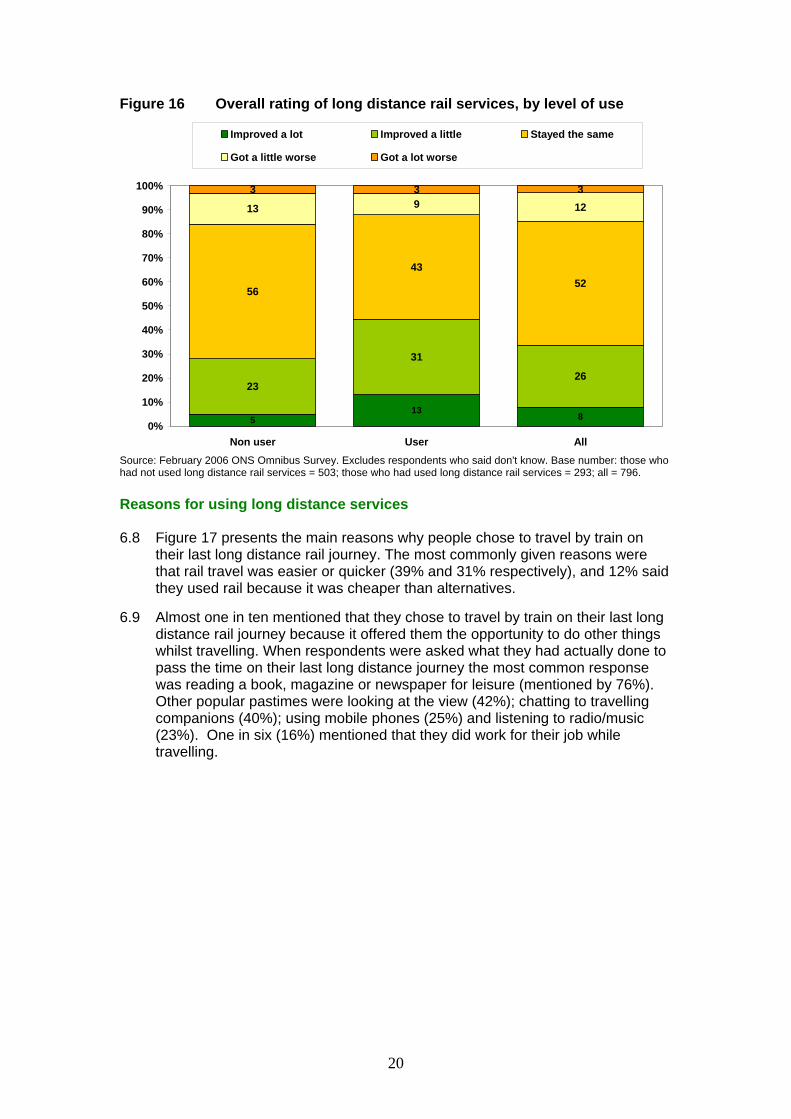
Figure 16 Overall rating of long distance rail services, by level of use
5
23
31
26
56
4352
13 9 123
813
33
0%
10%
20%
30%
40%
50%
60%
70%
80%
90%
100%
Non user User All
Improved a lot Improved a little Stayed the same
Got a little worse Got a lot worse
Source: February 2006 ONS Omnibus Survey. Excludes respondents who said don't know. Base number: those who had not used long distance rail services = 503; those who had used long distance rail services = 293; all = 796. Reasons for using long distance services 6.8 Figure 17 presents the main reasons why people chose to travel by train on
their last long distance rail journey. The most commonly given reasons were that rail travel was easier or quicker (39% and 31% respectively), and 12% said they used rail because it was cheaper than alternatives.
6.9 Almost one in ten mentioned that they chose to travel by train on their last long
distance rail journey because it offered them the opportunity to do other things whilst travelling. When respondents were asked what they had actually done to pass the time on their last long distance journey the most common response was reading a book, magazine or newspaper for leisure (mentioned by 76%). Other popular pastimes were looking at the view (42%); chatting to travelling companions (40%); using mobile phones (25%) and listening to radio/music (23%). One in six (16%) mentioned that they did work for their job while travelling.
20
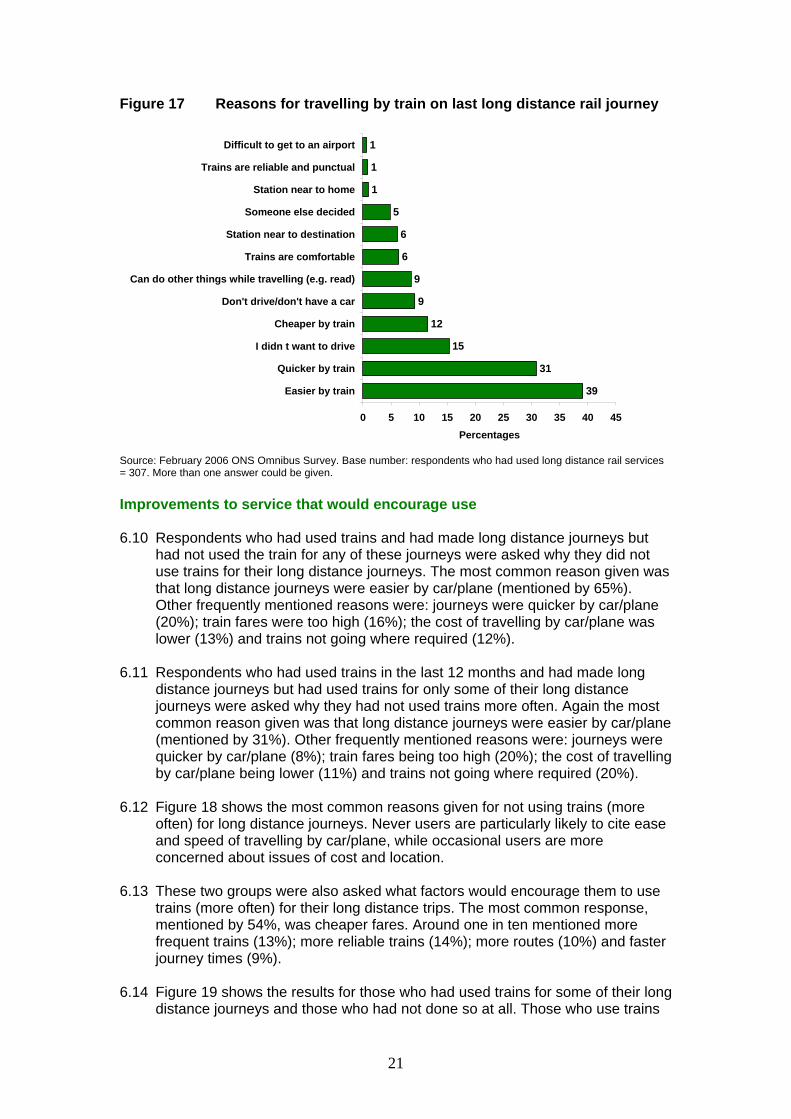
Figure 17 Reasons for travelling by train on last long distance rail journey
39
31
15
12
9
9
6
6
5
1
1
1
0 5 10 15 20 25 30 35 40 45
Easier by train
Quicker by train
I didn t want to drive
Cheaper by train
Don't drive/don't have a car
Can do other things while travelling (e.g. read)
Trains are comfortable
Station near to destination
Someone else decided
Station near to home
Trains are reliable and punctual
Difficult to get to an airport
Percentages
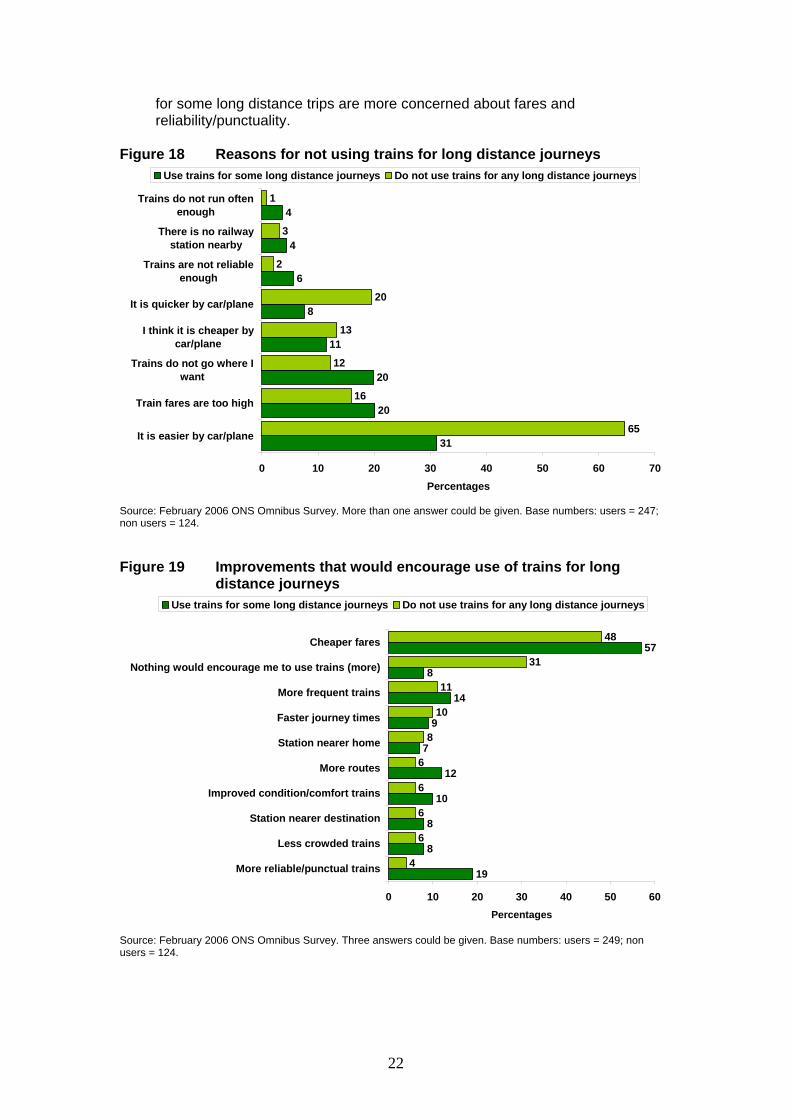
Source: February 2006 ONS Omnibus Survey. Base number: respondents who had used long distance rail services = 307. More than one answer could be given. Improvements to service that would encourage use 6.10 Respondents who had used trains and had made long distance journeys but
had not used the train for any of these journeys were asked why they did not use trains for their long distance journeys. The most common reason given was that long distance journeys were easier by car/plane (mentioned by 65%). Other frequently mentioned reasons were: journeys were quicker by car/plane (20%); train fares were too high (16%); the cost of travelling by car/plane was lower (13%) and trains not going where required (12%).
6.11 Respondents who had used trains in the last 12 months and had made long
distance journeys but had used trains for only some of their long distance journeys were asked why they had not used trains more often. Again the most common reason given was that long distance journeys were easier by car/plane (mentioned by 31%). Other frequently mentioned reasons were: journeys were quicker by car/plane (8%); train fares being too high (20%); the cost of travelling by car/plane being lower (11%) and trains not going where required (20%).
6.12 Figure 18 shows the most common reasons given for not using trains (more
often) for long distance journeys. Never users are particularly likely to cite ease and speed of travelling by car/plane, while occasional users are more concerned about issues of cost and location.
6.13 These two groups were also asked what factors would encourage them to use
trains (more often) for their long distance trips. The most common response, mentioned by 54%, was cheaper fares. Around one in ten mentioned more frequent trains (13%); more reliable trains (14%); more routes (10%) and faster journey times (9%).
6.14 Figure 19 shows the results for those who had used trains for some of their long
distance journeys and those who had not done so at all. Those who use trains
21
for some long distance trips are more concerned about fares and reliability/punctuality.
Figure 18 Reasons for not using trains for long distance journeys
31
20
20
11
8
6
4
4
65
16
12
13
20
2
3
1
0 10 20 30 40 50 60 7
It is easier by car/plane
Train fares are too high
Trains do not go where Iwant
I think it is cheaper bycar/plane
It is quicker by car/plane
Trains are not reliableenough
There is no railwaystation nearby
Trains do not run oftenenough
Percentages0
Use trains for some long distance journeys Do not use trains for any long distance journeys
Source: February 2006 ONS Omnibus Survey. More than one answer could be given. Base numbers: users = 247; non users = 124. Figure 19 Improvements that would encourage use of trains for long distance journeys
19
8
8
10
12
7
9
14
8
57
4
6
6
6
6
8
10
11
31
48
0 10 20 30 40 50 60
More reliable/punctual trains
Less crowded trains
Station nearer destination
Improved condition/comfort trains
More routes
Station nearer home
Faster journey times
More frequent trains
Nothing would encourage me to use trains (more)
Cheaper fares
Percentages
Use trains for some long distance journeys Do not use trains for any long distance journeys
Source: February 2006 ONS Omnibus Survey. Three answers could be given. Base numbers: users = 249; non users = 124.
22
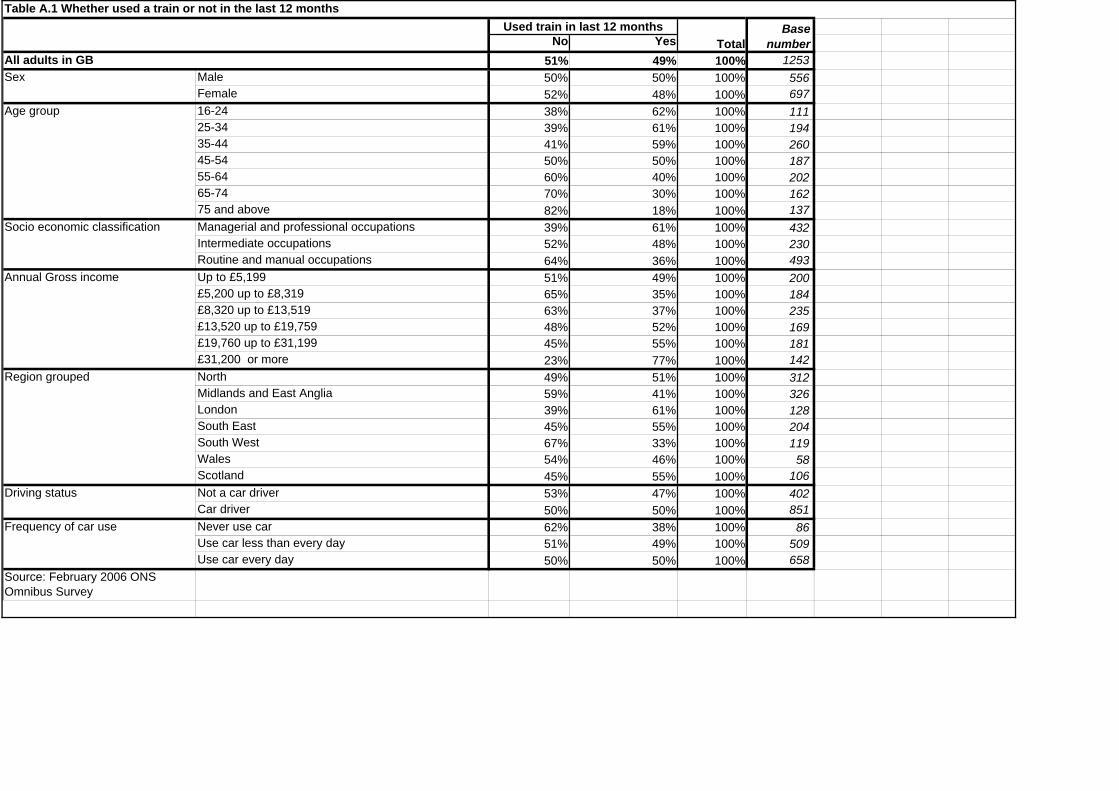
Table A.1 Whether used a train or not in the last 12 months
Used train in last 12 months
TotalBase
numberNo YesAll adults in GB 51% 49% 100% 1253Sex Male 50% 50% 100% 556
Female 52% 48% 100% 697Age group 16-24 38% 62% 100% 111
25-34 39% 61% 100% 19435-44 41% 59% 100% 26045-54 50% 50% 100% 18755-64 60% 40% 100% 20265-74 70% 30% 100% 16275 and above 82% 18% 100% 137
Socio economic classification Managerial and professional occupations 39% 61% 100% 432Intermediate occupations 52% 48% 100% 230Routine and manual occupations 64% 36% 100% 493
Annual Gross income Up to £5,199 51% 49% 100% 200£5,200 up to £8,319 65% 35% 100% 184£8,320 up to £13,519 63% 37% 100% 235£13,520 up to £19,759 48% 52% 100% 169£19,760 up to £31,199 45% 55% 100% 181£31,200 or more 23% 77% 100% 142
Region grouped North 49% 51% 100% 312Midlands and East Anglia 59% 41% 100% 326London 39% 61% 100% 128South East 45% 55% 100% 204South West 67% 33% 100% 119Wales 54% 46% 100% 58Scotland 45% 55% 100% 106
Driving status Not a car driver 53% 47% 100% 402Car driver 50% 50% 100% 851
Frequency of car use Never use car 62% 38% 100% 86Use car less than every day 51% 49% 100% 509Use car every day 50% 50% 100% 658
Source: February 2006 ONS Omnibus Survey
More than once a week
About once a week
About once a month
Less than once a month Never
Base number
5% 4% 8% 23% 60% 100% 1253Male 6% 4% 9% 21% 60% 100% 556Female 4% 3% 7% 25% 61% 100% 69716-24 8% 9% 15% 25% 43% 100% 11125-34 8% 5% 9% 27% 51% 100% 19435-44 8% 3% 8% 28% 53% 100% 26045-54 4% - 8% 25% 62% 100% 18755-64 1% 3% 2% 25% 69% 100% 20265-74 1% 5% 8% 11% 75% 100% 16275 and above 0% 1% 4% 10% 85% 100% 137Managerial and professional occupations 10% 3% 8% 27% 52% 100% 432Intermediate occupations 4% 3% 6% 25% 63% 100% 230Routine and manual occupations 1% 3% 7% 19% 69% 100% 493Up to £5,199 2% 5% 10% 23% 60% 100% 200 £5,200 up to £8,319 1% 3% 8% 21% 67% 100% 184£8,320 up to £13,519 2% 2% 6% 22% 68% 100% 235£13,520 up to £19,759 6% 4% 7% 24% 60% 100% 169 £19,760 up to £31,199 10% 2% 7% 27% 54% 100% 181£31,200 or more 11% 4% 13% 29% 44% 100% 142North 2% 2% 9% 26% 60% 100% 312 Midlands and East Anglia 5% 2% 4% 22% 67% 100% 326London 14% 13% 14% 19% 41% 100% 128South East 5% 5% 8% 27% 56% 100% 204South West 2% 0% 3% 13% 82% 100% 119Wales 1% 6% 7% 23% 63% 100% 58Scotland 6% 2% 11% 28% 53% 100% 1066 minutes or less 12% 3% 15% 22% 48% 100% 1207 to 13 minutes 8% 8% 13% 25% 46% 100% 21414 to 26 minutes 5% 5% 9% 26% 55% 100% 27527 to 43 minutes 5% 1% 5% 31% 58% 100% 19944 minutes or longer 1% 2% 4% 19% 75% 101% 415
Number of cars in household None 6% 4% 15% 16% 59% 100% 255One 4% 5% 8% 22% 62% 100% 579Two 5% 2% 5% 28% 61% 100% 333Three or more 8% 5% 3% 28% 55% 100% 86Never use car 5% 8% 7% 12% 68% 100% 86Use car less than every day 7% 6% 10% 21% 55% 100% 509Use car every day 3% 2% 6% 26% 63% 100% 658
Source: February 2006 ONS Omnibus Survey
All adults in GB
PercentagesTable A.2 Frequency of rail travel for short distances in the last 12 months
Distance of nearest railway station from home
Frequency of car use
Region grouped
Frequency of travelling by train for short journeys
Total
Annual Gross income
Socio economic classification
Age group
Sex
Every day2-5 days a
weekAbout once
a weekAbout once
a month
Less than once a month Never
Base number
1% 2% 4% 16% 37% 41% 100% 1248Male 2% 2% 6% 18% 35% 37% 100% 555Female - 2% 1% 13% 39% 44% 100% 69316-24 1% 3% 2% 20% 34% 40% 100% 11125-34 1% 3% 2% 17% 48% 29% 100% 19435-44 - 2% 5% 17% 41% 35% 100% 26045-54 3% 3% 5% 16% 43% 30% 100% 18755-64 1% 2% 4% 16% 31% 46% 100% 20265-74 0% 0% 5% 13% 29% 53% 100% 16175 and above 0% 1% - 6% 20% 73% 100% 133Managerial and professional occupations
2% 4% 5% 25% 38% 26% 100% 432Intermediate occupations 0% - 5% 10% 40% 44% 100% 230Routine and manual occupations 1% 1% 2% 9% 36% 51% 100% 489Up to £5,199 0% 3% 1% 18% 35% 44% 100% 200£5,200 up to £8,319 0% 0% 2% 7% 34% 57% 100% 181£8,320 up to £13,519 - 0% 1% 14% 33% 51% 100% 234£13,520 up to £19,759 1% 1% 4% 12% 46% 35% 100% 169£19,760 up to £31,199 3% 2% 8% 17% 48% 22% 100% 181£31,200 or more 3% 7% 10% 29% 34% 17% 100% 141North 2% 1% 2% 18% 35% 42% 100% 311Midlands and East Anglia 1% 2% 6% 18% 39% 34% 100% 326London 1% 0% 2% 13% 36% 47% 100% 127South East 1% 5% 3% 21% 40% 29% 100% 202South West 0% 2% 3% 13% 38% 45% 100% 118Wales 0% 0% 2% 8% 25% 65% 100% 58Scotland - 2% 4% 7% 39% 47% 100% 106Not a car driver - 1% 1% 9% 34% 55% 100% 397Car driver 1% 2% 5% 19% 39% 34% 100% 851Never use car 0% 1% 1% 5% 32% 61% 100% 81Use car less than every day - 1% 1% 12% 34% 50% 100% 509Use car every day 2% 3% 6% 19% 39% 32% 100% 658
Source: February 2006 ONS Omnibus Survey
Age group
Sex
Table A.3 Frequency of long distance journeys in the last 12 months, by any modePercentages
Frequency of car use
Driving status
Region grouped
Annual Gross income
Socio economic classification
TotalAll adults in GB
Frequency of long distance journeys in last 12 months, by any mode
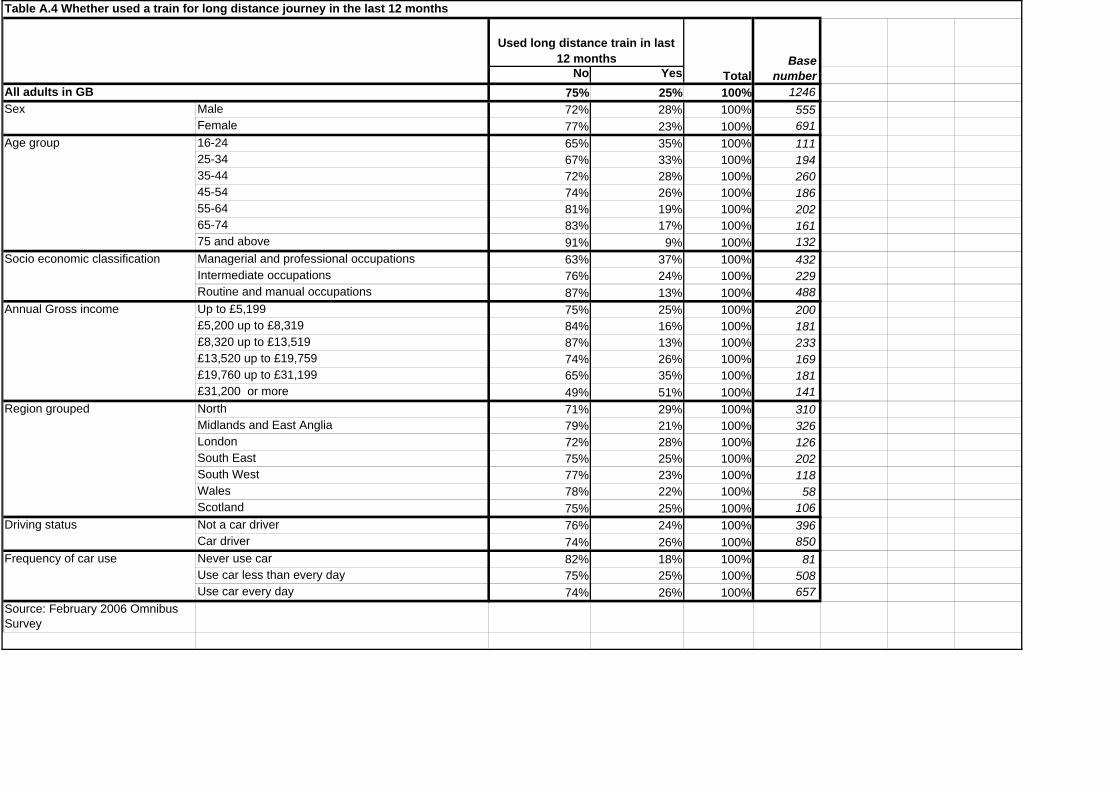
Table A.4 Whether used a train for long distance journey in the last 12 months
Used long distance train in last 12 months
TotalBase
numberNo YesAll adults in GB 75% 25% 100% 1246Sex Male 72% 28% 100% 555
Female 77% 23% 100% 691Age group 16-24 65% 35% 100% 111
25-34 67% 33% 100% 19435-44 72% 28% 100% 26045-54 74% 26% 100% 18655-64 81% 19% 100% 20265-74 83% 17% 100% 16175 and above 91% 9% 100% 132
Socio economic classification Managerial and professional occupations 63% 37% 100% 432Intermediate occupations 76% 24% 100% 229Routine and manual occupations 87% 13% 100% 488
Annual Gross income Up to £5,199 75% 25% 100% 200£5,200 up to £8,319 84% 16% 100% 181£8,320 up to £13,519 87% 13% 100% 233£13,520 up to £19,759 74% 26% 100% 169£19,760 up to £31,199 65% 35% 100% 181£31,200 or more 49% 51% 100% 141
Region grouped North 71% 29% 100% 310Midlands and East Anglia 79% 21% 100% 326London 72% 28% 100% 126South East 75% 25% 100% 202South West 77% 23% 100% 118Wales 78% 22% 100% 58Scotland 75% 25% 100% 106
Driving status Not a car driver 76% 24% 100% 396Car driver 74% 26% 100% 850
Frequency of car use Never use car 82% 18% 100% 81Use car less than every day 75% 25% 100% 508Use car every day 74% 26% 100% 657
Source: February 2006 Omnibus Survey
Very good Fairly goodNeither good
or poor Fairly poor Very poor Don t knowBase
numberOverall rating 10% 40% 16% 10% 4% 21% 100% 1252Number of destinations 17% 40% 11% 9% 4% 19% 100% 1252Information about train times 13% 39% 13% 10% 4% 22% 100% 1252Frequency of trains 10% 38% 15% 11% 3% 24% 100% 1252Politeness/helpfulness of staff 10% 36% 19% 7% 3% 26% 100% 1252Reliability/punctuality 8% 37% 14% 15% 4% 22% 100% 1252On board comfort 7% 37% 18% 12% 5% 21% 100% 1252Information at stations 6% 36% 17% 13% 4% 25% 100% 1252Information on fares 7% 27% 17% 17% 6% 26% 100% 1252Personal safety on board 4% 22% 20% 23% 9% 22% 100% 1252Personal safety at stations 4% 19% 21% 25% 10% 21% 100% 1252Cost of fares 4% 15% 17% 26% 17% 21% 100% 1252Overall rating 17% 52% 17% 10% 3% 1% 100% 473Number of destinations 25% 47% 13% 8% 2% 4% 100% 473Information about train times 22% 51% 14% 8% 2% 3% 100% 473Frequency of trains 16% 52% 16% 10% 2% 3% 100% 473Politeness/helpfulness of staff 13% 44% 25% 10% 3% 6% 100% 473Reliability/punctuality 13% 51% 16% 15% 2% 2% 100% 473On board comfort 11% 47% 23% 13% 6% 1% 100% 473Information at stations 10% 45% 21% 17% 3% 4% 100% 473Information on fares 10% 32% 24% 20% 6% 8% 100% 473Personal safety on board 6% 31% 28% 22% 9% 4% 100% 473Personal safety at stations 5% 28% 29% 25% 9% 4% 100% 473Cost of fares 7% 22% 22% 30% 15% 4% 100% 473Overall rating 6% 32% 14% 10% 5% 34% 100% 779Number of destinations 13% 36% 9% 9% 5% 28% 100% 779Information about train times 8% 30% 12% 11% 5% 35% 100% 779Frequency of trains 6% 28% 15% 11% 3% 37% 100% 779Politeness/helpfulness of staff 8% 30% 15% 6% 2% 39% 100% 779Reliability/punctuality 5% 27% 13% 15% 5% 34% 100% 779On board comfort 4% 31% 15% 11% 5% 35% 100% 779Information at stations 4% 30% 14% 10% 5% 38% 100% 779Information on fares 5% 24% 13% 15% 6% 37% 100% 779Personal safety on board 3% 16% 15% 23% 9% 34% 100% 779Personal safety at stations 2% 14% 16% 25% 10% 32% 100% 779Cost of fares 2% 11% 13% 23% 18% 32% 100% 779
Based on allTable A.5a Ratings of short distance rail services, among users and non users
Ratings of short distance rail services, users and non users (including don't know responses)
Total
Source: February 2006 ONS Omnibus Survey
Based on those who had not used short distance rail
Based on users of short distance rail
Based on all respondents
Very good Fairly goodNeither good
or poor Fairly poor Very poorBase
numberOverall rating 13% 50% 20% 12% 5% 100% 971Number of destinations 21% 50% 13% 11% 5% 100% 1010Information about train times 17% 50% 16% 12% 5% 100% 965Frequency of trains 13% 49% 20% 14% 4% 100% 944Politeness/helpfulness of staff 13% 48% 26% 10% 3% 100% 928Reliability/punctuality 11% 47% 18% 19% 5% 100% 967On board comfort 9% 47% 23% 15% 6% 100% 973Information at stations 8% 48% 22% 17% 5% 100% 934Information on fares 9% 36% 23% 23% 8% 100% 916Personal safety on board 5% 28% 26% 29% 11% 100% 963Personal safety at stations 4% 25% 27% 31% 12% 100% 981Cost of fares 5% 19% 21% 33% 22% 100% 971Overall rating 17% 53% 17% 10% 3% 100% 466Number of destinations 26% 49% 14% 9% 2% 100% 454Information about train times 23% 53% 14% 8% 2% 100% 459Frequency of trains 17% 54% 17% 10% 2% 100% 460Politeness/helpfulness of staff 14% 47% 26% 10% 3% 100% 453Reliability/punctuality 13% 52% 16% 16% 2% 100% 463On board comfort 11% 47% 23% 13% 6% 100% 471Information at stations 10% 47% 22% 18% 3% 100% 458Information on fares 10% 35% 26% 22% 7% 100% 433Personal safety on board 6% 33% 30% 23% 9% 100% 457Personal safety at stations 6% 29% 31% 26% 9% 100% 458Cost of fares 7% 23% 23% 31% 16% 100% 458Overall rating 8% 48% 22% 15% 7% 100% 505Number of destinations 18% 50% 13% 13% 7% 100% 556Information about train times 12% 46% 18% 17% 7% 100% 506Frequency of trains 10% 44% 23% 18% 5% 100% 484Politeness/helpfulness of staff 12% 49% 25% 9% 4% 100% 475Reliability/punctuality 8% 41% 20% 22% 8% 100% 504On board comfort 6% 48% 23% 17% 7% 100% 502Information at stations 6% 48% 22% 16% 7% 100% 476Information on fares 7% 38% 21% 25% 10% 100% 483Personal safety on board 5% 24% 23% 35% 13% 100% 506Personal safety at stations 4% 21% 24% 37% 15% 100% 523Cost of fares 3% 16% 19% 35% 27% 100% 513
Source: February 2006 ONS Omnibus Survey
Based on those who had not used short distance rail
Based on users of short distance rail
Based on all respondents
Based on allTable A.5b Ratings of short distance rail services, among users and non users (excluding don't know responses)
Ratings of short distance rail services, users and non users (excluding don't know responses)
Total
Features like most about services
Features most in need of improvement
Frequency of trains 26% 22%Reliability/punctuality 21% 20%Information at stations 2% 8%On board comfort 12% 13%Level of/lack of crowding 6% 16%Cost of fares 6% 36%Personal safety on trains 1% 9%Personal safety at stations 0% 12%Speed 34% 3%Number of routes/destinations 6% 4%Station close to home 11% 6%Station close to destinations 4% 1%General convenience 15% naPolite/helpful staff 1% 8%Ease of access for older/disabled na 2%Other 11% 17%Base n 190 190
Respondents could choose up to 3 features for each question
Source: February 2006 ONS Omnibus Survey
Features
Table A.6 Features of short distance rail services users most value/consider in need of improvement
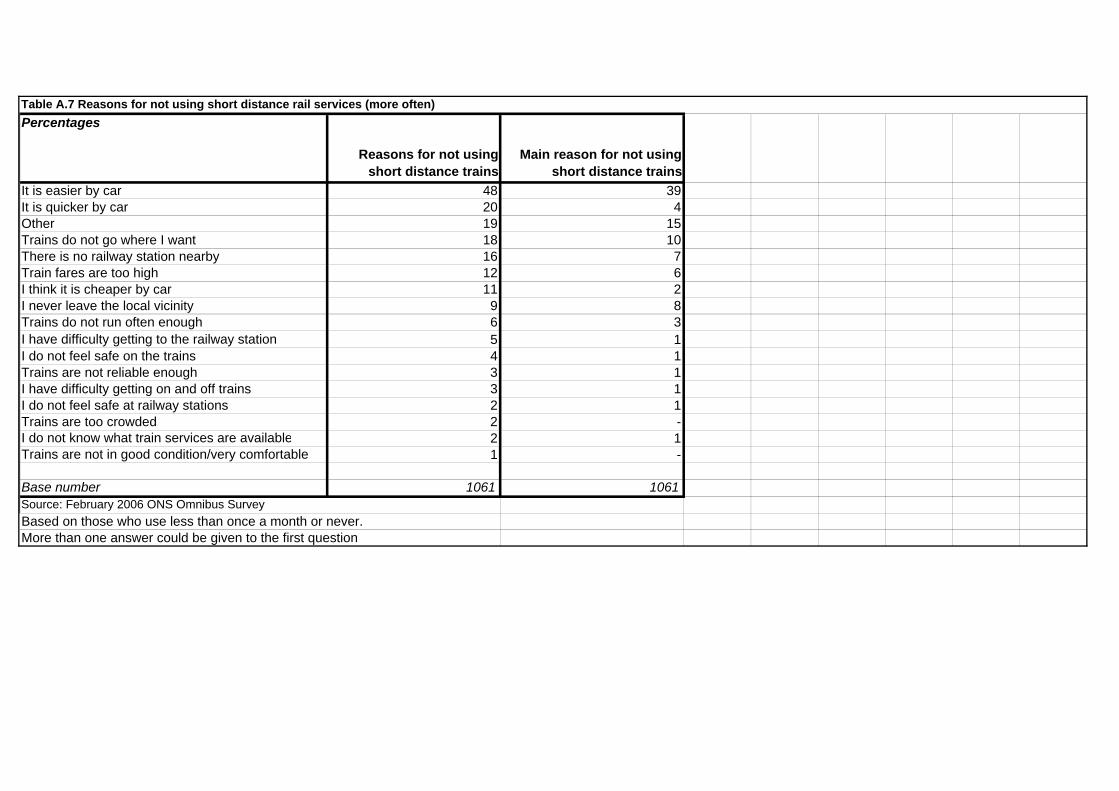
Table A.7 Reasons for not using short distance rail services (more often)Percentages
Reasons for not using short distance trains
Main reason for not using short distance trains
It is easier by car 48 39It is quicker by car 20 4Other 19 15Trains do not go where I want 18 10There is no railway station nearby 16 7Train fares are too high 12 6I think it is cheaper by car 11 2I never leave the local vicinity 9 8Trains do not run often enough 6 3I have difficulty getting to the railway station 5 1I do not feel safe on the trains 4 1Trains are not reliable enough 3 1I have difficulty getting on and off trains 3 1I do not feel safe at railway stations 2 1Trains are too crowded 2 -I do not know what train services are available 2 1Trains are not in good condition/very comfortable 1 -
Base number 1061 1061Source: February 2006 ONS Omnibus SurveyBased on those who use less than once a month or never.More than one answer could be given to the first question
Block: MODDOC.QInter.MAK
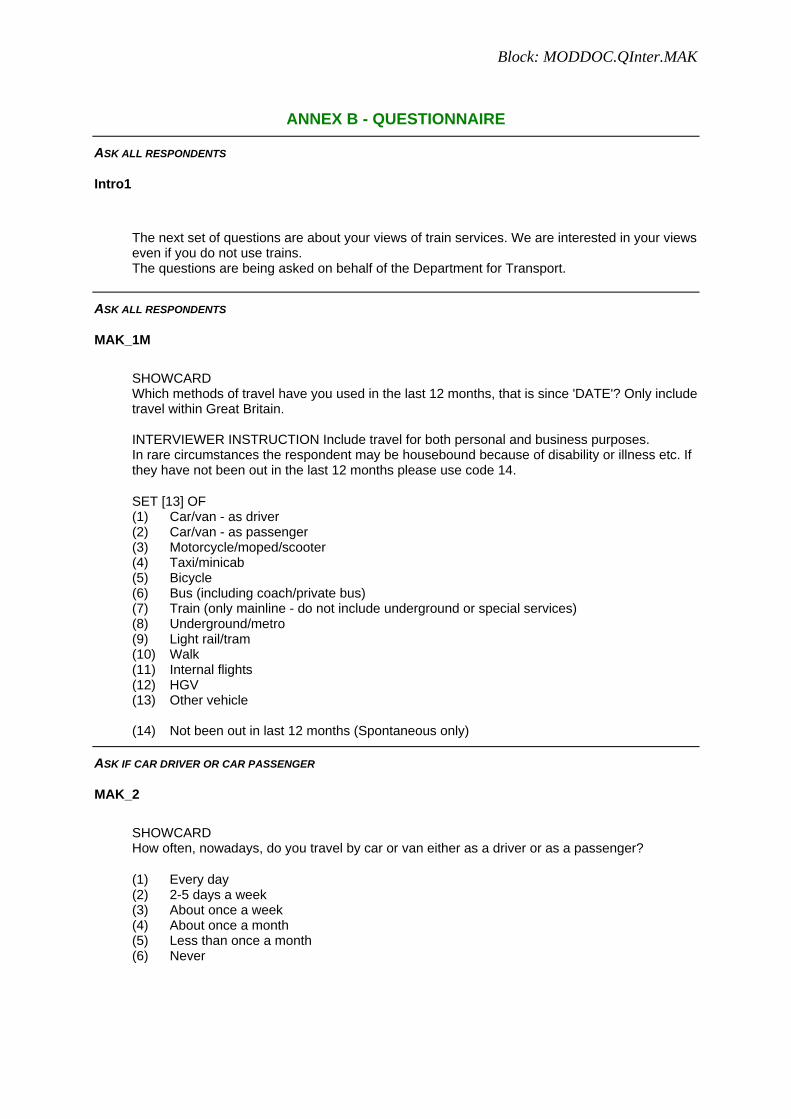
ANNEX B - QUESTIONNAIRE
ASK ALL RESPONDENTS
Intro1
The next set of questions are about your views of train services. We are interested in your views even if you do not use trains. The questions are being asked on behalf of the Department for Transport.
ASK ALL RESPONDENTS
MAK_1M
SHOWCARD Which methods of travel have you used in the last 12 months, that is since 'DATE'? Only include travel within Great Britain. INTERVIEWER INSTRUCTION Include travel for both personal and business purposes. In rare circumstances the respondent may be housebound because of disability or illness etc. If they have not been out in the last 12 months please use code 14.
SET [13] OF (1) Car/van - as driver (2) Car/van - as passenger (3) Motorcycle/moped/scooter (4) Taxi/minicab (5) Bicycle (6) Bus (including coach/private bus) (7) Train (only mainline - do not include underground or special services) (8) Underground/metro (9) Light rail/tram (10) Walk (11) Internal flights (12) HGV (13) Other vehicle (14) Not been out in last 12 months (Spontaneous only)
ASK IF CAR DRIVER OR CAR PASSENGER
MAK_2
SHOWCARD How often, nowadays, do you travel by car or van either as a driver or as a passenger?
(1) Every day (2) 2-5 days a week (3) About once a week (4) About once a month (5) Less than once a month (6) Never
Block: MODDOC.QInter.MAK
ASK ALL RESPONDENTS
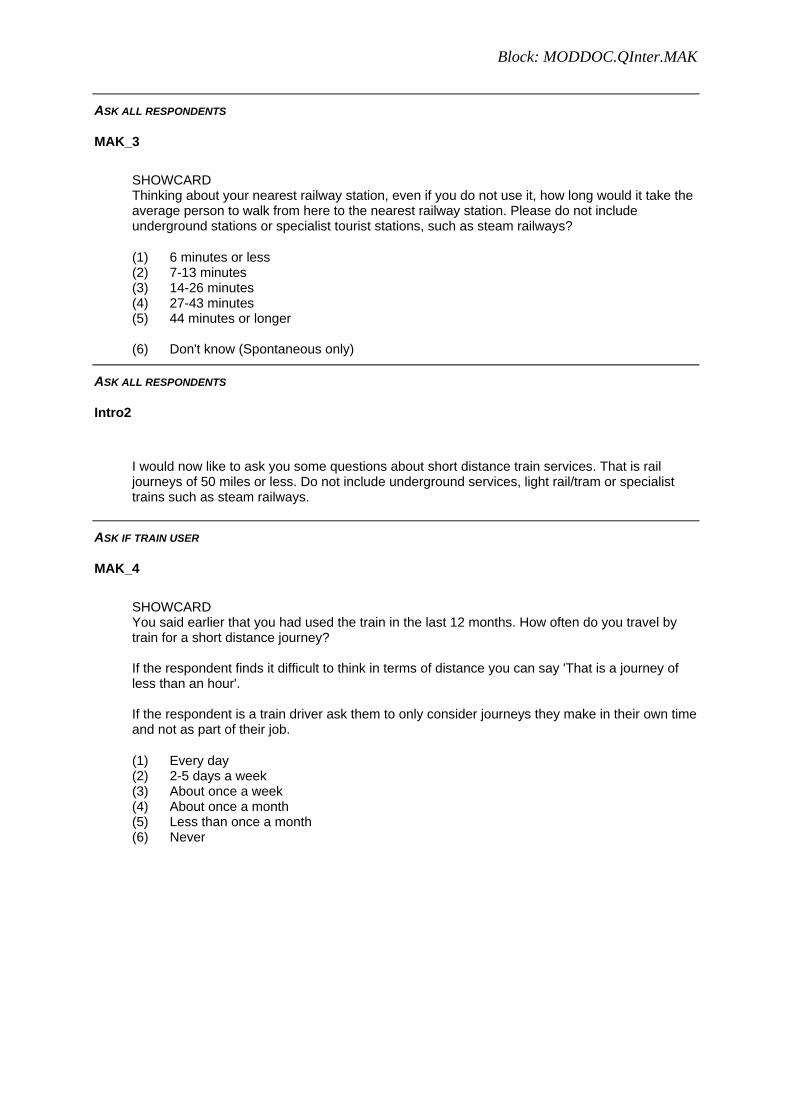
MAK_3
SHOWCARD Thinking about your nearest railway station, even if you do not use it, how long would it take the average person to walk from here to the nearest railway station. Please do not include underground stations or specialist tourist stations, such as steam railways?
(1) 6 minutes or less (2) 7-13 minutes (3) 14-26 minutes (4) 27-43 minutes (5) 44 minutes or longer (6) Don't know (Spontaneous only)
ASK ALL RESPONDENTS
Intro2
I would now like to ask you some questions about short distance train services. That is rail journeys of 50 miles or less. Do not include underground services, light rail/tram or specialist trains such as steam railways.
ASK IF TRAIN USER
MAK_4
SHOWCARD You said earlier that you had used the train in the last 12 months. How often do you travel by train for a short distance journey? If the respondent finds it difficult to think in terms of distance you can say 'That is a journey of less than an hour'. If the respondent is a train driver ask them to only consider journeys they make in their own time and not as part of their job.
(1) Every day (2) 2-5 days a week (3) About once a week (4) About once a month (5) Less than once a month (6) Never
Block: MODDOC.QInter.MAK
ASK IF USED SHORT DISTANCE TRAIN SERVICES IN LAST YEAR
MAK_5M
SHOWCARD What types of journey have you made of 50 miles or less by train in the last 12 months?
SET [9] OF (1) Travelling to/from work (2) Travel to/from school (include accompanying children) (3) Travel on company business(or on own if self-employed) (4) Visiting friends/relatives (5) Travel on personal business (e.g. to dentist) (6) Travel to/from holiday (7) Days out (e.g. visits) (8) Other leisure trips (9) Other (Please specify)
ASK IF USED SHORT DISTANCE TRAIN SERVICES IN THE LAST YEAR
Intro3a
I would now like to ask you about your views of short distance train services journeys.
ASK IF HAS NOT USED SHORT DISTANCE TRAIN SERVICES IN THE LAST YEAR
Intro3b
First, I would like to ask you about your views of short distance train services. Even if you have not used a short distance train service recently please give me your impression from what you know or have heard.
ASK ALL RESPONDENTS
MAK_6
*Overall, how would you currently rate the quality of train services for short journeys?
(1) Very good (2) Fairly good (3) Neither good or poor (4) Fairly poor (5) Very poor (6) Don't know (Spontaneous only)
Block: MODDOC.QInter.MAK
ASK ALWAYS:
MAK_7
SHOWCARD *Overall, do you think short distance train services have improved, stayed about the same, or got worse over the last two years?
(1) Improved a lot (2) Improved a little (3) Stayed the same (4) Got a little worse (5) Got a lot worse (6) Don't know/No opinion(Spontaneous only)
Block: MODDOC.QInter.MAK
ASK ALL RESPONDENTS
Intro4
I'm going to read out some factors related to short distance train journeys. Please rate the following based on your own experience or on what you have heard or read.
ASK ALWAYS:
MAK_8 to MAK_18
SHOWCARD *How would you rate….
….the availability of information about train timetables before starting your journey?
….the availability of information about train fares before the start of your journey?
….the frequency of trains?
….the reliability and punctuality of trains?
….the number of places you can get to by train?
….the cost of train fares?
….the information provided at railway stations?
….the on-board comfort of trains?
….the levels of personal safety from crime or threatening behaviour at railway stations?
….the levels of personal safety from crime or threatening behaviour when travelling on trains?
….the politeness/helpfulness of the train staff?
(1) Very good (2) Fairly good (3) Neither good nor poor (4) Fairly poor (5) Very poor (6) Don't know (Spontaneous only)
Block: MODDOC.QInter.MAK
ASK ALL RESPONDENTS
MAK_19M
SHOWCARD Looking at this card what would you say your opinions are mainly based on. You can choose up to three main sources? Code three only.
SET [3] OF (1) Personal experience of service (2) What you have heard from friends/family/colleagues (3) What you have read in local press/newspapers (4) What you have read in national press/newspapers (5) What you have heard on radio (6) What you have seen on TV news (7) What you have seen on other programmes (8) Internet (9) Other information
ASK IF USED SHORT DISTANCE TRAINS IN THE LAST YEAR
MAK_20
Would you say your recent experiences of short distance train services have been better than you expected, worse than you expected or about the same as you expected?
(1) A lot better than expected (2) A little better than expected (3) Same as expected (4) A little worse than expected (5) A lot worse than expected (6) No recent experience(Spontaneous only) (7) Don't know (Spontaneous only)
Block: MODDOC.QInter.MAK
ASK IF USED SHORT DISTANCE TRAIN SERVICES LESS THAN ONCE A MONTH OR NOT AT ALL IN LAST YEAR
MAK_21M
Why don't you use the short distance train services(more often)? You can give more than one answer?
SET [17] OF (1) Trains don't run often enough (2) It's easier by car (3) It's quicker by car (4) Train fares are too high (5) I think it is cheaper by car (6) I don't know what train services are available (7) Trains aren't reliable enough (8) I have difficulty getting on and off trains (9) I have difficulty getting to the railway station (10) I don't feel safe on the trains (11) I don't feel safe at railway stations (12) Trains are not in good condition/very comfortable (13) Trains are too crowded (14) Trains don't go where I want (15) There is no railway station nearby (16) I never leave the local vicinity (17) Other(Please specify)
ASK IF USED SHORT DISTANCE TRAIN SERVICES LESS THAN ONCE A MONTH OR NOT AT ALL IN LAST YEAR
MAK_22
And what is the main reason you don't use short distance trains(more often)? Code one only.
(1) Trains don't run often enough (2) It's easier by car (3) It's quicker by car (4) Train fares are too high (5) I think it is cheaper by car (6) I don't know what train services are available (7) Trains aren't reliable enough (8) I have difficulty getting on and off trains (9) I have difficulty getting to the railway station (10) I don't feel safe on the trains (11) I don't feel safe at railway stations (12) Trains are not in good condition/very comfortable (13) Trains are too crowded (14) Trains don't go where I want (15) There is no railway station nearby (16) I never leave the local vicinity (17) Other(Please specify)
Block: MODDOC.QInter.MAK
ASK IF USED SHORT DISTANCE TRAIN SERVICES LESS THAN ONCE A MONTH OR NOT AT ALL IN LAST YEAR
MAK_23M
What three improvements would be most important in encouraging you to use trains for short distance trips (more often)?
SET [3] OF (1) More frequent trains (2) More reliable and punctual trains (3) Better information about rail services (4) Improved condition/comfort of trains (5) Less crowded trains (6) Cheaper fares (7) Better personal safety on trains (8) Better safety at railway stations (9) Faster journey times (10) More routes (11) Railway station nearer to home (12) Railway station nearer to destination (13) Friendlier/more helpful staff (14) Easier for older/disabled people to get on and off (15) Other(Please specify) (16) Nothing would encourage me to use trains (more often)
ASK IF USED SHORT DISTANCE TRAIN SERVICES LESS THAN ONCE A MONTH OR NOT AT ALL IN LAST YEAR
MAK_24
If such improvements were made, how often do you think you would use a train for a short distance?
(1) Every day (2) 2-5 days a week (3) About once a week (4) About once a month (5) Less than once a month (6) Never
Block: MODDOC.QInter.MAK
ASK IF USE SHORT DISTANCE TRAIN SERVICES AT LEAST ONCE A MONTH IN LAST YEAR
MAK_25M
What, if anything, do you like most about the short distance train services that you use? Code up to three.
SET [3] OF (1) Trains are frequent (2) Trains are reliable and punctual (3) Good information provided at railway stations (4) Trains are in good condition/comfortable (5) Trains are not crowded (6) They provide value for money (7) I feel safe on the trains (8) I feel safe at the railway stations (9) Fastest way to make journey (10) Number of routes (11) Railway station is near to home (12) Railway station nearer to my destination (13) General convenience (14) Staff are polite and helpful (15) Other(Please specify) (16) Nothing
ASK IF USE SHORT DISTANCE TRAIN SERVICES AT LEAST ONCE A MONTH IN LAST YEAR
MAK_26M
How could the short train distance train services you use be improved. Please give up to three answers? Code up to three.
SET [3] OF (1) More frequent trains (2) More reliable and punctual trains (3) Better information provided at railway stations (4) Improved condition/comfort of the trains (5) Less crowded trains (6) Cheaper fares (7) Better personal safety on trains (8) Better personal safety at railway stations (9) Faster journey times (10) More routes (11) Railway station nearer to home (12) Railway station nearer to destination (13) Politer/more helpful staff (14) Make it easier for older/disabled people to get on and off (15) Other - please specify (16) Nothing
Block: MODDOC.QInter.MAK
ASK ALL RESPONDENTS
MAK_27
Over the next two years, do you think short distance train services will improve, stay about the same, or get worse?
(1) Improve a lot (2) Improve a little (3) Stay the same (4) a little worse (5) Get a lot worse (6) Don't know/No opinion(Spontaneous only)
ASK ALL RESPONDENTS
Intro5
I would now like to ask a few questions about train services for long distance journeys. That is, journeys of more than 50 miles. Even if you have not used a long distance train service recently please give me your impressions from what you know or have heard.
ASK ALL RESPONDENTS APART FROM THE HOUSEBOUND
MAK_28
SHOWCARD In the last 12 months how often have you made long distance journeys of any type, not just by train? INTERVIEWER INSTRUCTION If the respondent finds it difficult to think in terms of distance you can say 'That is a journey that takes an hour or more' If the respondent is a train driver ask them to only consider journeys they make in their own time and not as part of their job
(1) Every day (2) 2-5 days a week (3) About once a week (4) About once a month (5) Less than once a month (6) Never
ASK IF TRAVELLED BY TRAIN IN THE LAST YEAR AND MADE LONG DISTANCE JOURNEYS IN THE LAST YEAR
MAK_29
What proportion of your long distance journeys do you make by train?
(1) All (2) More than half (3) About a half (4) Less than a half (5) None (6) Don't know'(Spontaneous only)
Block: MODDOC.QInter.MAK
ASK IF MADE AT LEAST SOME LONG DISTANCE JOURNEYS BY TRAIN
MAK_30M
What types of long distance journey have you made by train in the last 12 months?
SET [9] OF (1) Travelling to/from work (2) Travel to/from school (include accompanying children) (3) Travel on company business(or on own if self-employed) (4) Visiting friends/relatives (5) Travel on personal business (e.g. to dentist) (6) Travel to/from holiday (7) Days out (e.g. visits) (8) Other leisure trips (9) Other (Please specify)
ASK ALL RESPONDENTS
MAK_31
Overall, how would you rate the quality of long distance train services?
(1) Very good (2) Fairly good (3) Neither good nor poor (4) Fairly poor (5) Very poor (6) Don't know (Spontaneous only)
ASK ALL RESPONDENTS
MAK_32
Overall, do you think long distance train services have improved, stayed about the same, or got worse over the last two years?
(1) Improved a lot (2) Improved a little (3) Stayed the same (4) Got a little worse (5) Got a lot worse (6) Don't know/No opinion(Spontaneous only)
Block: MODDOC.QInter.MAK
ASK IF MADE AT LEAST SOME LONG DISTANCE JOURNEYS BY TRAIN
MAK_33
Would you say your recent experiences of long distance train services have been better than you expected, worse that you expected or about the same as you expected?
(1) A lot better than expected (2) A little better than expected (3) Same as expected (4) A little worse than expected (5) A lot worse than expected (6) Don't know(Spontaneous only)
ASK IF MADE AT LEAST SOME LONG DISTANCE JOURNEYS BY TRAIN
MAK_34M
Thinking about the last time you used long distance rail service. Why did you choose the train for this journey rather than any other means of transport?
SET [14] OF (1) It was quicker by train (2) It was easier by train (3) It was cheaper by train (4) Trains are reliable and punctual (5) Trains are safe (6) Trains are comfortable (7) You can do other things while travelling (e.g. read, work) (8) Railway station near to home (9) Railway station near to destination (10) I would have difficulty getting to an airport (11) I don't drive/don't have a car (12) I didn't want to drive (13) I don't like flying/travelling by coach (14) I didn't have a choice - someone else decided (15) Other(Please specify)
Block: MODDOC.QInter.MAK
ASK IF MADE AT LEAST SOME LONG DISTANCE JOURNEYS BY TRAIN
MAK_35M
SHOWCARD And the last time you used a long distance rail service what did you do to pass the time while on the train. You can choose more than one answer.
SET [14] OF (1) Read a book/magazine/newspaper for leisure (2) Listened to radio/music (3) Watched a film/video (4) Played games(electronic or otherwise) (5) Work for my job (6) Studying (7) Looked at the view (8) Chatted to friends/family with whom I was travelling (9) Talked to other passengers (10) Slept/snoozes (11) Text messages/phone calls - personal (12) Text messages/phone calls - work related (13) Entertained children (14) Logged onto the Internet (15) Other (Please specify)
ASK IF DID NOT MAKE ALL LONG DISTANCE JOURNEYS BY TRAIN
MAK_36M
Why don't you use the train (for more of) your long distance journeys?
SET [16] OF (1) Trains don't run often enough (2) It's easier by car/plane (3) It's quicker by car/plane (4) Train fares are too high (5) I think it is cheaper by car/plane (6) I don't know what train services are available (7) Trains aren't reliable enough (8) I have difficulty getting on and off trains (9) I have difficulty getting to the railway station (10) I don't feel safe on trains (11) I don't feel safe at railway stations (12) Trains are not in good condition/very comfortable (13) Trains are too crowded (14) Trains don't go where I want (15) There is no railway station nearby (16) Other
Block: MODDOC.QInter.MAK
ASK IF DID NOT MAKE ALL LONG DISTANCE JOURNEYS BY TRAIN
MAK_37
And what is the main reason why you don't use trains for your long distance journeys more often (more often)? Code one only.
(1) Trains don't run often enough (2) It's easier by car/plane (3) It's quicker by car/plane (4) Train fares are too high (5) I think it is cheaper by car/plane (6) I don't know what train services are available (7) Trains aren't reliable enough (8) I have difficulty getting on and off trains (9) I have difficulty getting to the railway station (10) I don't feel safe on trains (11) I don't feel safe at railway stations (12) Trains are not in good condition/very comfortable (13) Trains are too crowded (14) Trains don't go where I want (15) There is no railway station nearby (16) Other
ASK IF DID NOT MAKE ALL LONG DISTANCE JOURNEYS BY TRAIN
MAK_38M
What three improvements would be most important in encouraging you to use the trains for long distance trips (more often)?
SET [3] OF (1) More frequent trains (2) More reliable and punctual trains (3) Better information provided at railway stations (4) Improved condition/comfort of the trains (5) Less crowded trains (6) Cheaper fares (7) Better personal safety on trains (8) Better safety at railway stations (9) Faster journey times (10) More routes (11) Railway station nearer to home (12) Railway station nearer to destination (13) Politer/More helpful staff (14) Easier for older/disabled people to get on and off (15) Other - please specify (16) No single improvement could be made to encourage me to use the trains (more often) (17) Nothing would encourage me to use trains (more often)

Block: MODDOC.QInter.MAK
ASK IF DID NOT MAKE ALL LONG DISTANCE JOURNEYS BY TRAIN
MAK_39
SHOWCARD If such improvements were made how often do you think you would use a train for long distance journeys?
(1) Every day (2) 2-5 days a week (3) About once a week (4) About once a month (5) Less than once a month (6) Never