Embed Size (px)
Citation preview

2015
PUBLIC FINANCE REVIEW
Republic of Serbia
2015
Report No.96451-YF


Republic of Serbia Public Finance Review
Toward a Sustainable and Efficient Fiscal Policy
July 24, 2015Document of the World Bank
Report No.96451-YF
Macroeconomics & Fiscal Management


CURRENCY EQUIVALENTS
Exchange Rate Effective June 27, 2015
Currency Unit: RSDRSD 107.59=US$ 1
Fiscal YearJanuary 1 – December 31
Abbreviations and Acronyms
ALMPs Active Labor Market Policies
AOFI Export Credit and Insurance Agency
BEEPs Business Environment and Enterprise Surveys
CA Child Allowances
CAD Current Account Deficit
CAP Common Agricultural Policy
CSL Civil Servants Law
CSWs Centers for Social Work
DILS Delivery of Improved Local Services
DZ Dom Zdravlja
EBRD European Bank for Reconstruction and Development
EC European Commission
ECA Europe and Central Asia
ECD Early Childhood Development
EU European Union
FDI Foreign Direct Investment
FSA Financial Social Assistance
FREN Foundation for the Advancement of Economics
GIZ German Agency for International Cooperation
HBS Household Budget Survey
HIF Health Insurance Fund
IBRD International Bank for Reconstruction and
Development
HTA Health Technology Assessments
ICT Information and Communications Technology
IMF International Monetary Fund
IPARD Instrument for Pre-Accession Assistance in Rural
Development
JSCs Joint Stock Companies
LLCs Limited Liability Companies
LTO Large Taxpayer Office
MoF Ministry of Finance
MLESP Ministry of Labor, Employment and Social Policy
NARD National Agency for Regional Development
NCDs Noncommunicable Diseases
OECD Organization for Economic Co-operation and
Development
PEs Public Enterprises
SIEPA Serbian Investment and Exports Promotion Agency
SILC Survey on Income and Living Conditions
SMEs Small and Medium Enterprises
SOEs State-Owned Enterprises
STS Serbian Taxpayer Survey
TIMSS Trends in International Mathematics and Science
Study
UNESCO United Nations Educational, Scientific and Cultural
Organization
UNICEF United Nations Children's Fund
USAID U.S. Agency for International Development

Regional Vice President: Country Director:Senior Director:Director:Practice Manager:Task Team Leaders:
Laura TuckEllen GoldsteinMarcelo GiugaleSatu KähkönenIvailo IzvorskiAbebe Adugna and Lazar Šestović

TABLE OF CONTENTS
Executive Summary ......................................................................................................................................................................... I
I. Introduction and Country Context ................................................................................................................................ 1
Chapter 1. ...................................................................................................................................................................................................... 3The Need for Fiscal Consolidation ........................................................................................................................................... 3
A. Country Context ............................................................................................................................................................................... 3B. Fiscal Sustainability under Alternative Scenarios ........................................................................................................ 7C. How the Report is Organized ..................................................................................................................................................10
II. Opportunities and Options for Fiscal Consolidation .....................................................................................11
Chapter 2 ....................................................................................................................................................................................................13Revenue and Tax Administration ............................................................................................................................................13
A. Revenue Performance .................................................................................................................................................................13B. Current Weaknesses in Tax Administration ...................................................................................................................14C. Tax Administration as a Business Constraint ...............................................................................................................17D. Tax Strategies to Combat Serbia’s Shadow Economy ............................................................................................19E. Conclusions and Recommendations.................................................................................................................................. 20
Chapter 3. ................................................................................................................................................................................................... 23Wage Bill and Staffing in Public Administration ....................................................................................................... 23
A. Introduction .................................................................................................................................................................................... 23B. The Need for Wage Reform and Right-sizing ............................................................................................................... 23C. Lack of Control and Oversight ............................................................................................................................................... 27D. Government Reforms Underway ......................................................................................................................................... 28E. Conclusions and Recommendations .................................................................................................................................. 30
Chapter 4 ................................................................................................................................................................................................... 31Pension Reform: Medium to Longer Term Issues ....................................................................................................... 31
A. Current State of the Pension System ................................................................................................................................ 31B. Design of the Pension System before the 2014 Changes ..................................................................................... 33C. Reforms Enacted in 2014 and Their Impact ................................................................................................................. 37D. Issues Going Forward................................................................................................................................................................. 38E. Conclusions and Recommendations .................................................................................................................................. 42
Chapter 5. ................................................................................................................................................................................................... 43Subsidies and State Support to the Economy .............................................................................................................. 43
A. State Support to SOEs ............................................................................................................................................................... 44B. State Support to Agriculture ................................................................................................................................................. 48C. State Support to the Private Sector ................................................................................................................................... 53D. Conclusions and Recommendations ................................................................................................................................. 54
III. Opportunities for Improving the Efficiency and Equity of Public Spending in Social Sectors ......................................................................................................................... 55
Chapter 6 ................................................................................................................................................................................................... 57Education ................................................................................................................................................................................................ 57
A. Quality of and Access to Education in Serbia .............................................................................................................. 57B. Financing Education: Where Does the Money Go? ................................................................................................... 60C. Opportunities for Enhancing Efficiency .......................................................................................................................... 62D. Conclusions and Recommendations ................................................................................................................................. 67
Chapter 7 ................................................................................................................................................................................................... 69Health ........................................................................................................................................................................................................ 69
A. Overview ............................................................................................................................................................................................ 69B. Health Outcomes .......................................................................................................................................................................... 69

C. Coverage and Quality of Health Services ....................................................................................................................... 70D. Health Financing and Expenditure: Trends and Composition ............................................................................ 72E. Efficiency of Public Health Spending ................................................................................................................................ 77F. Financial Protection .................................................................................................................................................................... 80G. Conclusions and Recommendations ................................................................................................................................. 82
Chapter 8. ................................................................................................................................................................................................... 83Social Assistance ............................................................................................................................................................................... 83
A. Social Protection in Serbia ...................................................................................................................................................... 83B. How Effective are Social Assistance Programs ............................................................................................................ 88C. Performance of Categorical (Non-Targeted) Benefits ........................................................................................... 90D. Performance of Poverty-Targeted Programs ................................................................................................................92E. Conclusions and Recommendations ...................................................................................................................................93
IV. Distributional Impact of Fiscal Consolidation in Serbia............................................................................. 95
Chapter 9. ................................................................................................................................................................................................... 97Distributional Impact of Fiscal Consolidation Measures ................................................................................... 97
A. Serbia’s Poverty and Labor Market Profile in Brief .................................................................................................. 97B. Public Sector Wage Bill Reforms .......................................................................................................................................... 98C. Pension Reforms ............................................................................................................................................................................ 99D. Reduced State Support to Public Enterprises .............................................................................................................101E. Electricity Tariff Adjustment ................................................................................................................................................102
References .............................................................................................................................................................................................105
Annex 1: Strategies to Combat the Shadow Economy: Examples from around the World.....................107
Annex 2: Public and Private Sector Salaries by Occupation .....................................................................................119
TABLES
Table 1: Summary of Policy Recommendations ............................................................................................................ XTable 2: Estimated Fiscal Impact of Additional Identified Reforms Relative to Baseline .............. XIIITable 1.1: General Government Expenditure by Function, Pre- and Post-crisis .............................................. 6Table 1.2: General Government Fiscal Operations ........................................................................................................... 8Table 1.3: General Government Fiscal Operations, January-June 2014 and 2015 ........................................ 9Table 2.1: Serbia Tax Revenues 2008–14 ...........................................................................................................................14Table 2.2: VAT Audit Performance, 2011–13 ....................................................................................................................15Table 2.3: Planned vs Ordered Audits ....................................................................................................................................15Table 2.4: Tax Arrears, 2012–14 ................................................................................................................................................16Table 2.5: Tax Evasion by Mode and Questioning Technique (pooled sample) ...........................................18Table 2.6: Cash payments Made and Received, by Firm Size ...................................................................................18Table 2.7: Factors that Complicate Paying Taxes, by Firm Size .............................................................................18Table 3.1: The Importance of the Wage Bill as a Source of Fiscal Consolidation Savings ..................... 25Table 3.2: Categories of Public Employment, 2013....................................................................................................... 26Table 5.1: General Government Support to Economy, 2014 .................................................................................... 43Table 5.2: The Nonfinancial SOE Sector, 2013 unless Otherwise Indicated ................................................... 44Table 5.3: Public Spending for the Agri-Food Sector in Rural Areas ................................................................... 48Table 5.4: Budget Support for Crops, Fuel, and Insurance by Region, 2013 ................................................... 50Table B5.3.1: How EU Agricultural Support will be Used................................................................................................... 52Table 6.1: Gross Enrollment Rates, Serbia and Comparator Countries .............................................................. 60Table 6.2: Public Expenditures on Education in the Republic of Serbia, 2010–12 .......................................61Table 6.3: Primary and Secondary Student-Teacher Ratios by Region, Serbia, 2009–12 ..................... 64Table 7.1: HIF Revenue and Expenditures, 2008–14 ..................................................................................................74Table 7.2: Spending on the top 5 Patented Hospital Drugs, 2013 ....................................................................... 80Table 8.1: FSA Spending and Beneficiaries, 2005–13 ................................................................................................. 87Table 9.1: At-risk-of-poverty Rate by Age and Labor Market Status .................................................................. 98Table 9.2: Labor Force Statistics by Income Group, aged 18–65 .......................................................................... 98Table 9.3: Old Age Pension Beneficiaries by Type and Pension Level, 2013 ................................................... 99

Table 9.4: Worker Characteristics and Wages, SOEs and the Private Sector ..............................................102Table 9.5: Electricity and Energy Budget Shares by Quintile and Heating Group, 2013 ......................102Table A1.1. Sectors where Tax Evasion is Prominent.....................................................................................................110Table A1.2: Denmark: Mapping of Compliance in Business Segments ..............................................................110
FIGURES
Figure 1.1: General Government Fiscal Operations, 2009–14 ..................................................................................... 4Figure 1.2: Public Debt, 2009–14 ................................................................................................................................................. 4Figure 1.3: Decomposition of Change in Average Revenues from 2006–2008 to 2012–2014 ................ 5Figure 1.4: Decomposition of Change in Expenditures from 2006–2008 to 2012–2014 ........................... 5Figure 1.5: General Government Expenditure by Function, 2014 ............................................................................. 6Figure 1.6: General Government Debt-to-GDP Ratio, Alternative Scenarios ...................................................... 7Figure 1.7: Additional Fiscal Reforms Can Yield a More Sustained Reduction in the Debt Ratio ........... 8Figure 1.8: The Debt Path is Particularly Sensitive to Growth or Exchange Rate Weakness ..................... 8Figure 2.1: Serbia Tax-to-GDP Ratio, 2009–14 ...................................................................................................................13Figure 2.2: Average Cost, Tax Administration per Employee .....................................................................................16Figure 2.3: Taxpayers per Tax Administration ....................................................................................................................17Figure 2.4: Serbia: Top Ten Constraints for Businesses ................................................................................................17Figure 2.5: How Firms Perceive Tax Administration .........................................................................................................18Figure 3.1: The Public Wage Bill, Regional Comparison, 2013 ................................................................................. 24Figure 3.2: Public Wage Bill Spending in Serbia ............................................................................................................... 24Figure 3.3: Average Wage, Public and Private, 2002–14 .............................................................................................. 24Figure 3.4: Serbia: Primary Education Employees vs. Pupils ..................................................................................... 26Figure 3.5: Pay Subsystems in the new Wage Law .......................................................................................................... 29Figure 3.6: What is Needed to Estimate the Fiscal Impact of new Wage Law ............................................... 29Figure 4.1: Pension Benefits in Serbia are Among the Highest in Europe Relative to GDP Per Capita .......................................................................................... 32Figure 4.2: Old-age Pensioners below Retirement Age ................................................................................................. 33Figure 4.3: Newly Retired Old-Age Pensioners below Retirement Age, 2013 ................................................... 33Figure 4.4: Pension Beneficiaries by Type, 2013 ............................................................................................................... 33Figure 4.5: Average Projected Old-Age Benefits Relative to the Current Average Wage, 2013–73 ............................................................................................................. 35Figure 4.6: Pension Spending, 2013–73 ................................................................................................................................ 36Figure 4.7: Pension Fund Balance, 2013–73 ....................................................................................................................... 36Figure 4.8: Reduction in Benefits per Year of Early Retirement ............................................................................... 36Figure 4.9: Impact of 2014 Reforms on Pension Spending ........................................................................................ 38Figure 4.10: Benefit Impact of Delinking General Point Value from Post-retirement Indexation .................................................................................................................................. 39Figure 4.11: Pension Spending Impact of Delinking ......................................................................................................... 40Figure 4.12: Percentage of Elderly Collecting Public Pensions Today and Estimated Percentage Eligible for Benefits in 2050 .............................................................................. 40Figure 5.1: State Support to the Economy, 2000–14 ..................................................................................................... 43Figure 5.2: Composition of State Support to the Economy, 2000–14 ................................................................. 43Figure 5.3: Guaranteed Debt, 2007–14 ................................................................................................................................ 46Figure 5.4: Debt service for Guaranteed Debt (Interest and Principal) Real Prices .................................... 46Figure 5.5: Budget Support to Agriculture by Type of Program ............................................................................. 49Figure 5.6: Number of Active Farmers, 2006–13 ........................................................................................................... 50Figure 5.7: Milk Subsidies and Dairy Production, 2004–13 ....................................................................................... 50Figure 6.1: PISA Performance and Public Spending on Education ........................................................................ 58Figure 6.2: Reading Gap, Serbia and Comparator Countries (PISA 2009) ........................................................ 59Figure 6.3: Early Childhood Education in Serbia, 2014 ................................................................................................. 60Figure 6.4: Public Spending on Education .............................................................................................................................61Figure 6.5: Students, Classes, and Teachers. Primary and Secondary Education, 2000–13 ................... 62Figure 6.6: Full-Time and Part-Time Teachers. Primary and Secondary, 2008–12 ....................................... 62Figure 6.7: Primary and Secondary Student-Teacher Ratios, Serbia and the OECD, 2000–12 .............. 63Figure 6.8: Teacher Characteristics by Urban-Rural Location and Quintile ...................................................... 64Figure 6.9: Population of Serbia by Age Group, 1990–2050 .................................................................................... 65Figure 6.10: Number of Primary and Secondary Schools, 2000–13 ........................................................................ 65Figure 6.11: Per Capita Financing of Education in ECA Countries ........................................................................... 67

Figure 7.1: Serbian Population Trends, 1990–2013 ....................................................................................................... 70Figure 7.2: Disease Burdens, Serbia, 1990–2010 Disability-Adjusted Life Years .......................................... 70Figure 7.3: Child Immunization and Antenatal Care by Welfare Quintile ........................................................ 70Figure 7.4: Nutrition Outcomes ................................................................................................................................................. 71Figure 7.5: Outpatient Contacts per Capita per Year .................................................................................................... 71Figure 7.6: Age-standardized Prevalence of Chronic Conditions, Serbia and Comparators ................... 71Figure 7.7: Preventive Examinations ..................................................................................................................................... 71Figure 7.8: Preventive Screening Rates .................................................................................................................................. 72Figure 7.9: Total Public and Private Health Spending, 1995–2012, Serbia and Comparators ............... 72Figure 7.10: Total Public and Private Health Spending, 2005–13, Serbia and Comparators .................... 72Figure 7.11: Private Out-of-pocket Health Payments, 1995–2012 .......................................................................... 73Figure 7.12: Public Health Spending, 1995–2012 ............................................................................................................. 73Figure 7.13: Insurance Pool Composition .................................................................................................................................74Figure 7.14: Insurance Revenue Composition .......................................................................................................................74Figure 7.15: Capital Outlays ............................................................................................................................................................ 75Figure 7.16: Salaries ........................................................................................................................................................................... 75Figure 7.17: Spending on Hospitals ........................................................................................................................................... 75Figure 7.18: Spending on Hospitals ............................................................................................................................................76Figure 7.19: Spending on Curative Services ...........................................................................................................................76Figure 7.20: Spending on Prevention .........................................................................................................................................76Figure 7.21: Pharmaceutical Spending ..................................................................................................................................... 77Figure 7.22: Pharmaceutical Spending ..................................................................................................................................... 77Figure 7.23: Healthy Life Expectancy and Public Health Spending ......................................................................... 77Figure 7.24: Bed Density, 2005–11 ............................................................................................................................................ 78Figure 7.25: Hospital Admissions, 2005–11 ........................................................................................................................... 78Figure 7.26: Average Acute Care Length of Stay, 2005–11 .......................................................................................... 78Figure 7.27: Bed Occupancy Rate for Acute Care, 2005–11 ......................................................................................... 79Figure 7.28: Unmet Health Need for Financial Reasons ................................................................................................ 81Figure 7.29: Relative Increase in Poverty Due to Out-of-Pocket Payments ......................................................... 81Figure 7.30: Catastrophic Payments, 2003–10 ................................................................................................................... 81Figure 7.31: Catastrophic Payments by Quintile, 2008–10 ......................................................................................... 81Figure 8.1: Total Social Protection Spending in Serbia, 2005–13 .......................................................................... 83Figure 8.2: Social Protection Spending ................................................................................................................................. 84Figure 8.3: Social Assistance Spending , 2013 (war benefit simulated) .............................................................. 86Figure 8.4: Serbia’s Social Assistance Spending in Serbia, by Program ............................................................. 86Figure 8.5: Means-tested and Non-means-tested Social Assistance, 2006–13 ............................................ 87Figure 8.6: SA Coverage by Country, Poorest and Richest Quintiles .................................................................... 89Figure 8.7: Distribution of Benefits, Poorest and Richest Quintile ........................................................................ 89Figure 8.8: Generosity of Benefits, Poorest and Richest Quintiles ........................................................................ 89Figure 8.9: Program Coverage and Coverage Distribution by Quintile ............................................................... 90Figure 8.10: Benefits by Program and Quintile ................................................................................................................... 91Figure 8.11: Cost-benefit Ratio of Social Assistance ....................................................................................................... 91Figure 8.12: Coverage by Program and Quintile .................................................................................................................92Figure 9.1: Average Old-age Pensions by Benefit Level and Gender ................................................................. 100Figure 9.2: Average Old-age Pensions by Age and Gender .................................................................................... 100Figure A1.1: Sectors Prominent in Shadow Economies Internationally ..............................................................111Figure A1.2: Shadow Economy by Sector...............................................................................................................................111Figure A1.3: Rollout of the Chinese “Golden Tax System” ............................................................................................115
BOX
Box 1.1: A Snapshot of Serbia’s Pre-and Post-crisis Fiscal Performance .......................................................... 5Box 3.1: Need for Better Personnel Data ........................................................................................................................ 28Box 5.1: Legal Framework Governing the SOEs ........................................................................................................... 45Box 5.2: The Main Budget Support Programs for Agriculture ............................................................................ 48Box 5.3: IPARD 2014–2020 ..................................................................................................................................................... 52Box 6.1: School Network and Per Capita Financing in Moldova ....................................................................... 66Box 8.1: Serbia’s Social Assistance Programs .............................................................................................................. 85Box 8.2: Main FSA Provisions Introduced by the New Law on Social Welfare ........................................... 88

ACKNOWLEDGEMENTS
This report was prepared by a World Bank team led by Abebe Adugna, lead economist, and Lazar Šestović, senior country economist. The chapters were written by the following: Lazar Šestović, Ashley Taylor, and Abebe Adugna (introduction and country context); Rajul Awasthi and Oleksii Balabushko (tax administration); Zachary Mills and Srdjan Svirčev (wage bill and public administration); Duško Vasiljević, Bojan Shimbov, and Bekzod Shamsiev (subsidies and state support to the economy); Anita Schwarz (pensions); Katia Marina Herrera Sosa and Igor Kheyfets with support from Nina Arnhold (education); Patrick Hoang-Vu Eozenou and Timothy Johnston, with support from Biljana Kozlovic (health); Aylin Isik-Dikmelik and Frieda Vandeninden, with support from Marijana Jašarević (social assistance); and Ashley Taylor (distributional impact of fiscal consolidation).
The World Bank team is deeply grateful to the Serbian Government for its close collaboration during preparation of the report. In particular, thanks are due to senior officials in the Ministries of Finance, Public Administration, Education, Health, and Labor and Social Policy, and the Office of State Aid.
Special thanks also go to Ivailo Izvorski, Practice Manager, and Satu Kahkonen, Global Practice Director, who provided continuous support, guidance, and technical advice. Aristomene Varoudakis (Advisor, DECOS), Pavle Petrović (President, Serbia Fiscal Council), Plamen Kaloyanchev (Serbia Desk Economist at the European Commission) served as peer reviewers, and the team is grateful for their rich comments and feedback, along with those received from the IMF country team.
Finally, the team wishes to thank Ellen Goldstein, Country Director for Southeast Europe, and Tony Verheijen, Country Manager for Serbia, for their valuable advice and guidance; Hermina Vuković - Tasić for her support to the team during country visits; and Mismake Galatis and Zakia Nekaien-Nowrouz for support in formatting and document processing.


I
EXECUTIVE SUMMARY
1. Since the global economic and financial crisis of 2008, Serbia has struggled with a weak economy and a deteriorating fiscal position. Until 2008, fiscal deficits were moderate and public debt declined significantly. Since the start of the global economic and financial crisis in 2008, however, Serbia has struggled with the interlinked problems of minimal growth and unfavorable fiscal dynamics. As economic activity has stagnated, revenues have fallen and expenditures, particularly mandatory spending on pensions and wages, have remained high. At the same time, structural fiscal issues, such as continued state support to state-owned enterprises (SOEs) and tax administration inefficiencies, have been a drag on growth. As a result of these pressures, general government fiscal deficits averaged 5.6 percent of GDP a year between 2009 and 2014. Reflecting the high fiscal deficits and poor economic growth, Serbia’s public debt has more than doubled, from 34 percent of GDP in 2008 to 71 percent at yearend-2014.
2. Unchecked, Serbia’s growing public debt is unsustainable. If the fiscal challenges are not addressed and the noninterest fiscal deficit is not reduced—in other words, if from 2015 onward the primary deficit is unchanged at 2.4 percent of GDP—by 2020 public debt will reach 100 percent of GDP. Growing public debt not only absorbs signifi cant resources, it also poses high rollover risk. Fiscal and debt vulnerabilities make it critical that the government pursue fiscal consolidation to achieve debt sustainability and assure medium-term macroeconomic stability.
3. In an effort to overcome its fiscal challenges, the government has since November 2014 put in place and made progress on an ambitious fiscal consolidation and structural reform program to halt the rise in public debt and send it downward by 2017. The program is supported by a 3-year Precautionary Stand-by Arrangement, approved by the IMF Board on February 23, 2015. Over the medium term, the consolidation program should reduce public spending from 46.8 percent of GDP in 2014 to 40.7 percent by 2017, mostly by cutting recurrent spending in particular on public sector wages and pensions costs and reducing fiscal support to public enterprises (restructuring large public enterprises).
4. In the short to medium term, the priority for Serbia is to pursue the fiscal consolidation program with vigor, seeking where possible additional fiscal measures, for example, in tax administration, the wage bill and public administration, and subsidies. Even as it consolidates its fiscal position, however, Serbia will need to significantly improve the quality of its human capital and skills to become more competitive in the region, attract foreign direct
investment, and continue toward income convergence with Western Europe. While many factors determine the quality of human capital, the level and efficiency of current public spending on edu cation, training and skills development is critical. In light of the 2015–17 fiscal consolidation program already in place, Serbia’s principal avenue to enhancing investments in human capital in the short to medium term would be through efficiency gains.
5. The objective of this report is therefore twofold: (i) propose policy options and recommendations (beyond those built into the current program) that would help solidify the ongoing fiscal consolidation program and help achieve public debt sustainability over the medium term; and (ii) given near-term fiscal constraints, identify oppo-rtunities for enhancing the efficiency, quality, and equity of current public spending on health, education, and social protection over the medium term.
6. At more than a third of its GDP in 2014, Serbia’s tax revenue is already high, and given recent increases in tax rates, the scope for further tax rate increases to support fiscal consolidation will be limited. Among recent tax policy changes were the 2012 increases in the VAT rate from 18 to 20 percent for the general rate and from 8 to 10 percent for basic goods and communal services; and a rise in the corporate income tax rate from 10 to 15 percent. However, with tax-to-GDP at about 34 percent in 2013–14, the revenue impact of these policy changes has been modest, in part because of economic conditions but also due to inefficient and ineffective tax administration, including high compliance costs and poor management of tax arrears. While improvements in tax administration will be neither rapid nor likely to generate considerably more revenue, especially in the short term, improving how the country collects its revenues could over the medium term reduce the tax compliance cost, improve the business climate, and facilitate economic growth and revenue collection.
7. In Serbia tax administration imposes a high cost of compliance which adversely impacts the investment climate, contributes to a high level of informality, and disproportionately impacts smaller businesses. Tax administration currently makes it harder to operate a business. For example, Serbia ranks low in Doing Business on paying taxes: the number of payments (67) and the time to comply (279 hours) are far worse than the averages for Europe and Central Asia (ECA) and the OECD countries. The clarity of taxpayer obligations is often compromised by the amount of discretion tax authorities have, along with such other problems as the absence of
EXECUTIVE SUMMARY

II
EXECUTIVE SUMMARY
formal interpretations of tax-related legislation and the diversity of opinions between tax offices. Small businesses are particularly affected by the high costs of compliance. For example, 2013 BEEPS data indicate that small and medium firms are far more negatively impacted by both tax administration and tax rates than large firms, so that incentives for SMEs remain informal.
8. The tax authorities use risk management systems only to a limited extent. Although a compliance risk management methodology is in place, it has not often been applied. While there are plans to segment taxpayers by size and risks, many activities rely on factors other than risk. For example, audit plans emphasize medium and large taxpayers, but 72 percent of audits in 2013 were of micro and small companies. Frequent ad hoc decisions interfere with planned audit activities and prevent a focus on tax collection efforts. While the number of audits is growing, both hit rates and yields are declining.
9. Tax arrears continue to be large and remain problematic. The authority to write off uncollectible debt is weak, resulting in large tax arrears for which there are no prospects of recovery. Arrears include amounts that are past the statutory collections period and for corporations that have been liquidated or are bankrupt or are to be privatized, from which the tax authorities are not allowed to pursue recovery by law. A 2012 tax amnesty attempted to resolve the large backlog of arrears, but data from January 1, 2015, already suggest that arrears are increasing, having reached RSD 711 billion, two-thirds of which are classified as having no prospect of recovery (with the remainder accounting for RSD 236 billion or 6 percent of GDP). Expectations of future tax amnesties may also be undermining efforts both to collect arrears and to enforce current tax obligations.
10. Serbia underinvests in tax administration. It spends less per employee than EU countries, including Romania and Hungary. While some of the differences may be due to lower pay reflecting on labor market conditions, a considerable portion relate to underinvestment in analytical capacity, technology, and other essential tools of modern tax administration. For example, there is a clear need for more auditors and a more forceful large taxpayer office rather than the existing network of tax inspectors throughout the country.
11. Finally, given the relatively large informal economy (estimated at 30 percent of GDP) and widespread underreporting of sales turnover and cash
transactions, Serbia needs tax strategies to combat the shadow economy. International experience shows that, to be successful, efforts directed at the informal economy should include measures both to prevent tax evasion more effectively (compliance, audit); and to curb cash transactions and incentivize cashless transactions (banking, use of third-party information, exchange of information between financial intelligence units and tax authorities). To yield meaningful results, such efforts need to be sustained over many years, but if sustained, benefits in terms of additional revenues (estimated at a quarter of a percentage point of GDP) are not negligible. 12. Steps can be taken to improve Serbia’s tax administration, make it more progrowth, and create opportunities for higher revenue collection over the medium term. Table 1 contains a full set of recommendations, but among key steps are: • Lower compliance costs by improving taxpayer
services and reducing uncertainty in the interpretation of tax statutes. • Reorganizeandrestructurethetaxadministrationto
engage the right staff skills mix. • Refocus audits on large taxpayers and reduce the
number of audits that do not produce results. • Improvethemanagementoftaxarrearsthroughboth
stronger collection efforts and clarifying authority to write off uncollectible debt. • Re-evaluate the tax administration IT strategy and
update the IT system.• Combat the informal economy by improving
both taxpayer services and enforcement against tax evasion, and by providing incentives and infrastructure for cashless transactions.
The Wage Bill and Public Administration
13. Serbia’s general government wage bill has grown significantly over the past decade, imposing a high burden on the budget. The wage bill accounted for 10.1 percent of GDP in 2013, significantly above the regional average of 8.4 percent. Not only are reported average wages higher in the public than in the private sector but the differential seems to have widened. A comparison based on a recent Labor Force Survey found evidence of public sector wage premiums, particularly for lower-skill jobs, even after the recent 10 percent across-the-board wage cuts (see Annex 2). The lack of a centralized establishment and pay control system contributes to the high public wage bill, along with significant areas of overstaffing. In November 2014 the government made cuts in both wages and employment. These short-term measures, while welcome, do not fully address the serious structural issues of wages and staffing in the public sector.

III
14. Significant pockets of overstaffing exist in the public sector, with potential inefficiencies in a large number of agencies. For example, although there are fewer students in recent years, there are more teachers (see the discussion of education sector issues below). The health sector nonmedical cadre is overstaffed and the remedial measures introduced have so far had little impact. There is also evidence of overstaffing in the police and security forces, though data access restrictions make this hard to estimate accurately. Finally, many public agencies and public enterprises are budget-dependent but not subject to public sector salary rules or establishment controls, so there is a need to link their freedom to set wages and staff numbers with a corresponding level of accountability.
15. Lack of a centralized establishment and pay control system has contributed to the high public sector wage bill. Structural weaknesses in wage control systems have resulted in more than 2,200 job titles, 71 elements of remuneration, 5 different base salaries, 900 different job coefficients, 19 laws, and a plethora of by-laws that regulate salaries in 11,000 budget institutions. Although the 2005 Law on Pay for Civil Servants and Employees instituted a centralized single pay regime for all civil service employees, it applies only to about 5 percent of total public employment. Other sectors and agencies are regulated through separate legislation. Institutions and organizations use different coefficients and base salaries for similar positions, and allowances and benefits proliferate without centralized oversight, making it virtually impossible to compare the remuneration of similar public jobs.
16. While Serbia has in principle a welldeveloped system for controlling staffing levels at the central level, in practice there has not been sufficient oversight and control. Every central government budget organization, at the time of its creation, is required to have an act of systematization setting out the number of positions permitted. However, the budgeting process does not require a limit on the number of staff within each Government body, leaving each ministry free to instruct the payroll department to add staff, whether or not the position is included in the personnel plan. Public agencies and public enterprises also have by law considerable autonomy in hiring and setting pay, which is not balanced by accountability for performance. Regulatory fragmentation has thus contributed to the growth of the wage bill.
17. The government has initiated public wage system reform but significant design and implementation challenges remain. The pay reform aims to consolidate all 16 different base salaries into a single base salary for the entire public sector; create six subsystems; introduce more
EXECUTIVE SUMMARY
centralized controls; standardize indexation adjustments through the single base pay; and reduce and consolidate the number of allowances and benefits at 10–12. This reform is scheduled to start with adoption of a new Law on Salaries in Public Administration in 2015. While the law is intended to remove many of the pay inequities and bring greater transparency to the public pay structure, some elements of the reform are not yet defined, such as the new structure of job classification and the basis for pay increments in the new wage law (though there is a proposal to make pay increments performance-based).
18. Efforts are also underway to rightsize the public administration, but they are at an early stage. Ambitious targets have been set for the right-sizing program, such as reduction of the public sector workforce (excluding state-owned enterprises) by 75,000 over the next three years and, as of June 2015, to have a 6.5 percent reduction in the number of employees from the end-2013 level. All budget entities have been asked to develop a plan for cutting the number of employees. The second phase of the reforms will focus on restructuring and right-sizing of the public sector based on a comprehensive functional review of the central administration, the Ministry of Finance and possibly the ministries of education, health, labor, and agriculture. Functional reviews are expected to identify targeted savings to be incorporated into the 2016 and 2017 budgets while minimizing disruptions to service delivery.
19. Important steps for limiting the growth of the wage bill, supporting fiscal consolidation, and making public administration more effective are the following: • Continue with recent measures, such as the hiring
freeze and attrition, to limit staffing growth in public administration. • Definecurrentlyundefinedelementsofthenewpay
structure, such as the extent to which allowances will be consolidated; the new job structure and classification; the basis for pay increases; and whether employees who are above the new pay coefficient will take a pay reduction or will be grandfathered into the new system. • Put inplacea centralizedestablishmentandpayroll
control system. • Consider reducing staff in health, police, and (to a
lesser extent) education and integrate right-sizing within regular budget processes. • Undertakeacomprehensivefunctionalreviewofpublic
administration to simplify administrative procedures and eliminate duplicate tasks and functions.

IV
EXECUTIVE SUMMARY
Public Pensions
20. Serbia is currently the fourth highest spender on pensions as a share of GDP in Europe, behind Ukraine, France, and Italy. In 2012–14 general government pension spending reached 13 percent of GDP, up 2 percentage points relative to the 2006–08 average. Spending is driven by a generous benefit structure relative to current wages, and by a high share of young retirees.
21. To curb the spending, the government undertook three pension system reforms in 2014. First, amendments to the pension law in July 2014, which became effective in January 2015, raised the retirement age for women to 65, equalizing it with that of men (with a gradual transition between 2015 and 2032); introduced actuarial reductions of 0.34 percent of the benefit per month of early retirement for both men and women; and tightened extended service requirements. Second, the Pension and Disability Insurance Law was amended again in December 2014 to preclude any increases in pensions before the system reaches a pension expenditure level of 11 percent of GDP. Third, the Law of Temporary Reduction of Pension Payments, effective in November 2014, temporarily reduced pension benefits above RSD 25,000 per month by 22 percent and above RSD 40,000 by a further 3 percent. While the pension reduction was billed as a 10 percent reduction in benefits, the reduction in spending is approximately 5.8 percent of pension expenditures (cuts were levied only on the portion of benefits above the average pension). The 2014 reforms are estimated to have a reasonable impact on the short-run finances of the pension system, yielding savings of 0.63 percentage points of GDP in 2015. The 2014 reforms have thus addressed much of the short-term reform agenda in the pension system to the extent politically possible; the near-term focus should now be on sustained implementation of those reforms.
22. Over the medium to long run, four related pension issues need to be addressed: 1. It is critical that the government engages in a discussion
of minimum pension needs and a prolonged information campaign to educate the public that Serbia can no longer afford an average pension benefit that is 70 percent of average wage.
2. With the indexation of the value of the general point to inflation, as currently legislated, which equalizes pensions for different cohorts of workers, pension benefits are set to drop to 47 percent of average wage in 2025. The government would be wise to delink the general point indexation from indexation of pensions post-retirement and gradually move indexation of the general point to growth in average wages, while retaining indexation of pensions post-retirement to inflation so that the pension system does not implode.
3. With the rise in the number of people who became of working age after 1990 who may not have ever participated in the formal labor market, Serbia will probably start to see an increase in the number of elderly who are ineligible for any type of pension by 2025 or 2030. Serbia will need to consider options for alleviating poverty among them, for example: provide a flat universal pension to all above a certain age; provide a targeted noncontributory benefit to the elderly poor; or unify provisions for old-age poverty with the social assistance system.
4. Finally, the government may want to consider options for restructuring the farmers pension system, for example, whether to set up separate systems, integrate all farmers into the national pension system, or integrate only those willing and able to pay, recognizing that some will remain outside the formal labor system.
23. Key steps toward a medium to longterm pension reform strategy are to:• Discussminimumpensionerneedsandhowtoprovide
at least survival level benefits for the elderly who have no income. • Move away from equalizing pensions for different
cohorts of workers and toward linking contributions to benefits, not just within cohorts, but across cohorts as well, if possible. • Introducesomeprovisionforthosewhoarenotpartof
the formal labor market. • Consider options to restructure the farmers’ pension
system.
Subsidies and State Support to the Economy
24. State support to the economy stood at 5.2 percent of Serbia’s GDP in 2014, about twice government spending on public investments and close to government spending on public health. State support includes direct subsidies, soft loans, and activated guarantees, which went up from 0 percent of GDP in 2008 to almost 1 percent in 2014. Beyond these, the government is often called upon to cover unpaid social contributions, utilities bills, and taxes on behalf of state-owned enterprises (SOEs), although information on the amounts spent is not available and hence not included in the analysis.
25. Subsidies to SOEs, agriculture, and the private sector in Serbia are inefficient. Subsidies to SOEs do not encourage efficiency in recipients and generate significant direct and indirect pressure on the state budget. In recent years, the state has issued guarantees to support the liquidity of some SOEs in dire financial conditions, significantly adding to Serbia’s public debt. State support to public enterprises is often fragmented, and lacking in transparency about

V
EXECUTIVE SUMMARY
how it is allocated. Similarly, the current system of state support to agriculture, based mainly on area and animal payments, should be rethought: it is not the most appropriate way to make Serbian farms more productive and competitive during the process of EU accession. State support to private investment and export promotion is also fragmented, nontransparent, and lacking mechanisms for evaluation.
26. Many stateowned and public enterprises in Serbia are lossmaking and financially nonviable without state support. The combined losses of SOEs exceeded 1 billion euros in 2013, the latest year for which final accounts are available. Direct budget subsidies—principally to SOEs and agriculture—averaged 3.5 percent of GDP over the last three years. The biggest SOE recipients of direct budget subsidies are Railways of Serbia, Roads of Serbia, and JP Resavica, a coal mining company; together they accounted for about 0.7 percent of GDP annually. Until 2012 companies in the Privatization Agency (PA) portfolio received sizable direct budget support (0.3 percent of GDP annually) but this has since been significantly reduced and is expected to fall further as privatization is completed. While direct subsidies have been slightly reduced over the last two years, other forms of support to SOEs (guarantees and soft loans) have gone up significantly.
27. In recent years, guarantees have been issued to support the liquidity of SOEs, in effect replacing direct budget subsidies. Most of the recent increases in guaranteed debt went to Srbijagas for liquidity support as the company continues to be in financial difficulties due to low collection rates, high operating costs, and an unfavorable pricing policy. Other contributors to the rising stock of debt guarantees have been Roads of Serbia, Serbia Railways, and EPS, but these have mostly been guarantees for investment projects. In the last couple of years, guarantees have also been issued to several commercial SOEs, most notably Zelezara Smederevo and Galenika, in effect subsidizing commercial companies.
28. The growing stock of debt guarantees has pushed up amortization of debt service on called guarantees—particularly for Srbijagas, Roads of Serbia, and Serbia Railways. Amortization of called guarantees is likely to stay elevated for the next few years because financial and operational restructuring of these SOEs is bound to take time. However, if the government manages to restructure some of those enterprises benefitting most from guarantees, and require from those enterprises to service at least some, if not all the debt, the additional savings could be between 0.3 and 0.4 percent of GDP annually (between 2016 and 2017). The corporate restructuring plan for Srbijagas adopted in December 2014 includes unbundling the distribution section, divestment of noncore assets, and resolving the companies that have accumulated the most
arrears to Srbijagas. A separate financial restructuring plan is expected that will be based on improved collection and increased transit and network fees. On EPS, the government has committed to comprehensive reform, including streamlining of the organizational structure and management, staff right-sizing, and financial restructuring anchored in improved collections, increased efficiency, cost savings, and tariff increases.
29. In 2014 agriculture subsidies amounted to about 1 percent of GDP and covered a wide variety of programs: general services and support, output payments, rural development support, market support, input subsidies, and area and animal payments. The significant variation in types and levels of support has created disincentives for long-term planning and investment in farms and agro-processing. Until 2011, most direct payments to producers consisted of input subsidies for diesel fuel and fertilizer, with the balance provided as price subsidies for cereals and oilseeds. Today, area and animal payments account for 60 percent of all direct payments, input subsidies for 20 percent, and producer subsidies for 15 percent. The milk subsidy program is the most inefficient, and if phased out could bring savings of almost 0.1 percent of GDP per year. In addition, capping of subsidies to prevent very large farms from benefiting from subsidies could bring savings on a similar scale.
30. Serbia has in recent years subsidized strategic investors and supported export and investment promotion programs and development agencies. State subsidies to strategic investors were mainly to Fiat and Air Serbia; direct subsidies to the two averaged 0.25 percent of GDP annually for 2013–15. While it is too early to assess the full impact of these investments, Fiat has become by far Serbia’s largest exporter, and Air Serbia has completely revamped its fleet, expanded its network, and in 2014, for the first time in many years, recorded a net profit. However, the current system of state support for investment and export promotion is weak, fragmented, nontransparent, and difficult to evaluate. There is a need to consolidate and reform the agencies, with a focus on increasing their transparency and efficiency and to align them to EU state aid policies.
31. Much can be done to reduce state support to SOEs and enhance the efficiency and effectiveness of subsidies to agriculture and the private sector (see Table 1 for a full set of recommendations): • Support to SOEs: Accelerate resolution of the PA
portfolio; and restructure public utilities to improve their financial performance and reduce direct and indirect budget subsidies.• Agriculture subsidies: Rebalance sector support
toward rural development and measures that support competitiveness and away from direct budget

VI
EXECUTIVE SUMMARY
support; gradually redesign and eventually reduce the milk subsidy and reallocate it to rural development; encourage enlargement of farms by allowing farmers to access budget support for both owned and leased land; and cap subsidies to limit support for very large farms. • Private sector support: Reform the state
development and export promotion agencies, introduce robust monitoring and evaluation (M&E) systems, ensure transparency, and ensure links with broader economic strategy.
Opportunities for Improving the Efficiency and Equity of Public Spending in Social Sectors
Education
32. While access to primary and secondary education is high in Serbia, the coverage of preschool education is low by international standards. Coverage of early childhood development (ECD) reaches only 52 percent of boys and 49 percent of girls – very low in comparison to the EU 2020 ECD enrollment target of 95 percent. Access for Roma children is particularly low at 5 percent for boys and 7 percent for girls. Low ECD enrollments are problematic because ECD programs impart generic skills and the ability to “learn how to learn”; it is difficult and costly to catch up if individuals have a disadvantageous start. There are geographical disparities in access to ECD programs because preschool education is primarily funded through municipal budgets, whose resources differ widely.
33. Serbia’s public spending on education is comparable to the OECD average but higher than the average for countries of similar size from the ECA region. The government spends 5.2 percent of GDP (or EUR 1.5 billion) on education annually which is about 1 percent of GDP higher than the level for ECA countries of similar size. The central government finances all levels of education, but most central government spending, about 42 percent, goes to primary education, with about 25 percent going to tertiary and about 22 percent to secondary. As in other countries, more than 70 percent of recurrent central government spending on education goes to salaries. Serbia has 155,000 employees in its education sector, accounting for 28.6 percent of total general government employment. Going forward savings could be realized if Serbia moves its spending on education towards that of peer countries.
34. However, despite the significant public spending, the quality of education in Serbia is low. The latest PISA results (OECD 2013) show that Serbia students lag behind the OECD average by about 1 year of schooling in
mathematics. The country also has a much larger share of students that perform below the basic proficiency level. Learning strategies, individual factors, and school resources help explain Serbia’s lower outcomes than comparator countries.
35. Despite a declining student population and fewer classes, the total number of primary and secondary teachers has gone up over the last two decades. In 2012, there were 21 percent fewer students in primary schools and 13 percent fewer in secondary schools than in 2000. Meanwhile, the total number of primary teachers went up by 18 percent and secondary teachers by 25 percent. Although the number of full-time teachers has declined slightly since 2010, the number of part-time teachers has been growing, reaching 40 percent of the total teacher workforce by 2012, up from 27 percent in 2008. Controlling for the rising share of part-time teachers, the number of full-time equivalent primary teachers was still 4.2 percent higher in 2012 than in 2000, with an increase of 19 percent for secondary teachers.
36. Schools have yet to adapt to the declining student population. By 2030, compared to 2013 Serbia’s population is expected to shrink by 11 percent—800,000 people. As the school-age population continues to decrease, so the demand for education services. However, the school network, designed to meet past demographic needs, has yet to adjust fully to the changing demographics. The number of primary schools has gradually begun decreasing to reflect the decline in student population. In 2010 Parliament issued a bylaw requiring municipal councils to prepare a “plan for the number and territorial distribution of primary schools” within their jurisdictions. While initial work has begun within individual municipalities, there is room for more rationalization of the school network, both primary and secondary. More schools need to be consolidated, particularly in urban areas.
37. Schools in Serbia have become increasingly inefficient and unequal in their relative spending. The traditional education funding mechanism, based on inputs rather than the number of students, offers few incentives to improve efficiency. In contrast, per capita financing, a hallmark of countries with high-performing education systems and widely used in ECA, provides a way to improve transparency and equity in resource allocation because it can effectively target poor and disadvantaged groups by adding weights for student characteristics to the funding formula. There is an urgent need to reduce the spending imbalances among schools by introducing per capita financing in Serbia, building on the previous (unsuccessful) effort in this area. The effectiveness of resource allocation could be made more transparent and significantly enhanced by moving from input-based to per capita financing, an area on which Serbia has already started work.

VII
38. These are among steps that can be taken to improve spending efficiency and learning outcomes in education (see Table 1 for a full set of recommendations): •Increase access to ECD, particularly for Roma children,
using existing facilities and redeploying teachers to the extent feasible, and as the fiscal space opens, scaling up investments in ECD programs. •Consolidate the school network and reduce excess
teachers in primary and secondary education. •Reduce the unequal spending of schools by replacing
input-based budgeting with more equal per student financing; and fully develop and pilot the funding formula. •Regularlymeasurelearningoutcomesattheschoollevel
and link schools input with learning scores to better inform policy decision-making.
Health
39. Serbia performs relatively well on health outcomes compared to countries at similar income levels. Life expectancy at birth, at 75 years in 2013, remains good; it has improved by four years since the mid-1990s because of progress in treating cardiovascular diseases, neonatal disorders, and neoplasms. Infant mortality rates are lower than the regional average and are converging toward EU levels. Coverage of maternal and child health services is good overall, although with gaps for the poor and the Roma.
40. As the population of Serbia has aged, the burden of noncommunicable diseases has grown. Since 1990, the Serbian population has decreased by an average of about -0.2 percent annually. The percentage of the population aged 65 and above has gone up from 10 to 14 percent in 2012, and is projected to reach 25 percent by 2050. Due to its aging population, the disease burden in Serbia is now weighted toward noncommunicable diseases (NCDs) and external causes, such as injuries. The share of NCDs in total disability adjusted life years went up from 81 percent in 1990 to 86 percent in 2010; the top three causes of premature death in 2010 were heart disease, stroke, and cancer.
41. Use of hospital care went up between 2006 and 2013. In a recent survey, 7.8 percent of respondents aged 15 or more (compared to 6.5 percent in 2006) said they had been treated in a hospital in the 12 months preceding the survey. This increase cannot be explained only by the aging of the population but rather also by other factors, including unnecessary hospitals admissions, shortcomings in primary care, excessive use of acute care beds for long-term care, and inadequate use of day surgeries. Waitlists for elective procedures are frequent and significantly longer than in OECD countries; they contribute to the high prevalence of bribery, particularly in the hospital sector.
42. Total public and private health spending is high and has gone up faster than the regional average in the past decade. In 2013, total health expenditure represented about 10.6 percent of GDP compared to 8.6 percent for EU countries and 7.1 percent for Western Balkan countries. Total public health spending increased from 5.2 percent of GDP in 2000 to 6.4 percent in 2013, higher than the average for upper middle-income countries (3.9 percent) and slightly higher than the EU average (6.3 percent). Over half the public health budget was directed to hospitals in 2013 with a quarter spent on pharmaceuticals. Despite high public spending, private out-of-pocket payments for health (OOP) have also gone up markedly, from 2 percent of GDP in 2002 to 4 percent in 2013.
43. Notwithstanding some progress in recent years, inefficiencies persist in public spending for hospital care, primary care, and pharmaceutical and medical devices, and the share of nonmedical hospital staff is particularly high. Hospital bed capacity and admission rates are relatively high, and there is scope to improve the efficiency of acute inpatient care, since both hospital spending and average length of stay are higher than the regional and EU averages. With regard to primary care, despite relatively high spending on prevention services, there are gaps in coverage of key preventive and primary health care services, and outpatient contact rates are relatively high. This again suggests significant scope for efficiency improvement, which could be stimulated by introduction of provider payment reforms that link allocated budgets to outputs and quality of care. The vast majority of transfers to primary care centers are based on line-item budgets, which provide little flexibility or incentive for managers to rationalize staffing, provide better service, or improve quality. Continued centralized procurement of hospital drugs, price negotiation for off–patent drugs, and improved drug price benchmarking could also help achieve savings beyond those already realized in recent years. As mentioned, roughly one quarter of public health care expenditures in 2013 was on pharmaceuticals versus an EU average 12.3 percent. Reducing this ratio by one third, to 18 percent would yield potential savings of up to 0.4 percent of GDP, based on 2013 spending levels. Finally, while coverage of medical staff is within regional norms, the share of nonmedical staff (25 to 30 percent) is twice as high as in OECD countries and preliminary estimates suggest that if Serbia were to reduce non-medical staff to levels comparable with OECD averages savings could be up to 0.2 percent of GDP.
44. Among steps that can be taken to improve spending efficiency and the quality of health care are to (see Table 1 for a full set of recommendations): •Reduce excess noncontractual and nonmedical staff,
and urgently address payment arrears and financing imbalances for hospitals.
EXECUTIVE SUMMARY

VIII
•Continue to implement reforms to save onpharmaceutical and medical devices, and monitor prescription and dispensing practices. •Reformproviderpaymentsforprimarycareandhospitals,
complemented by broader public administration reforms to improve quality and accountability for service provision. •Reinforce the quality and coverage of primary and
preventive care, as by strengthening screening and treatment for chronic diseases and promoting healthy behaviors.
Social Assistance
45. Serbia operates many social assistance (SA) programs with multiple social objectives. These include poverty reduction; population growth (pronatality), and assistance to such vulnerable groups as veterans and the disabled. Serbia has only one explicit anti-poverty program, the means-tested financial social assistance program (FSA), previously called the Material Support for Low-Income Households (MOP) program. The other means-tested program is the pro-natalist child allowance program. Other categorical and not explicitly means-tested programs are the caregiver’s allowance (noncontributory disability benefit); wage compensation during maternity leave (noncontributory); parental allowance (birth grant); benefit for foster care; school fee waiver for vulnerable children; and a plethora of benefits for war veterans and families of fallen soldiers.
46. At about 2 percent of GDP spending on social assistance is on a par with other ECA countries but lower than the EU average (4.3 percent). In Serbia 60 percent of SA spending goes to family and child allowance programs; and only 30 percent goes to poverty reduction programs. The largest SA program is for wage compensation during maternity leave, spending on which rose to about 0.66 percent of GDP in 2013. Due to the link with employment, the program does not cover unemployed mothers or those who are not in the formal labor market. After the New Social Welfare Law was passed in 2011, spending on the last resort SA program, financial SA (FSA), went up to 0.34 percent of GDP but is still below the regional average of 0.5 percent. The two means-tested programs—FSA and the child allowance—together account for just 30 percent of total spending and 0.68 percent of GDP.
47. SA has little impact on poverty due to the prevalence of small but expensive categorical programs resulting in low coverage and targeting accuracy. Simulations indicate that without any SA programs the poverty rate would be only 1.9 percentage point higher than it actually is. This is not surprising as some programs,
including the largest one (in terms of spending) do not focus on the poor (with low coverage and regressive distribution of benefits) but rather focus on other objectives, such as population growth or provision of benefit to war veterans. Simulations indicate that a shift of some of the resources from categorical programs to the well targeted FSA can reduce the overall at risk poverty rate by as much as 8 percentage points
48. Despite relatively generous benefits, the poverty impact of the categorical programs is negligible. Parental allowance is the largest in terms of coverage but reaches only about 4 percent of the population; wage compensation reaches only 2 percent and the parental allowance programs only 0.5 percent. The child allowance is the largest program in terms of coverage, reaching almost 11 percent of the population and 25 percent of the bottom quintile with coverage rates decreasing as quintiles get wealthier. However, less than half of the transfers, 46 percent, accrue to the poorest quintile, and despite minimal generosity, its poverty impact is not insignificant due to its large coverage. Without the program poverty would be expected to increase by 0.8 percentage point.
49. FSA is a well targeted and costeffective program, with 74 percent of all benefits reaching the poorest quintile, but its coverage is still low despite recent attempts to expand it. Only 11 percent of the poorest quintile receive FSA1. The low FSA coverage may be due to non-take-up issues or the additional conditions of a means/asset test in addition to the income test. In fact, the eligibility threshold is far below the income of the bottom decile, which helps in targeting but also limits coverage. The cost-benefit ratio—the reduction in the poverty gap for each RSD spent on the program—is 0.85 for FSA, the highest for any Serbian SA programs. This is a direct consequence of high targeting precision of the FSA compared to other benefits.
50. However, the FSA design has implicit work disincentives. As in many other ECA countries, FSA is designed so that each additional dinar a beneficiary earns is a dinar lost in benefits, because the benefit is calculated as the difference between a certain income threshold and the net income of beneficiary families. Below the threshold there is therefore no financial incentive for a family to earn more income because it will be automatically deducted from the benefit they receive—in effect, a 100 percent marginal effective tax rate. In addition, workers at the Centers for Social Work (CSW) have discretion in assessing income that can deter current benefit recipients from exiting the system. While improvements to SA design are necessary, they may not be sufficient to provide incentives for work unless other barriers are addressed, such as lack of skills,
EXECUTIVE SUMMARY

IX
unavailability of support services, and the high taxes on low-paid labor: at 36.7 percent the tax wedge on labor at lower wage levels in Serbia is one of the highest anywhere, mainly due to the minimum social security contributions that employees and employers must pay.
51. Effective steps to improve SA efficiency and equity and prioritize the poor would be to: •Scale back thewage compensation programand use
the freed-up resources to expand FSA, the most effec-tive SA program in Serbia. •Means-test thebirthgrant to reinforce the safetynet
and use the resulting savings (0.1 percent of GDP) to expand either the FSA, child allowances, or child care coverage.•Redesign the FSA to introduce in-work benefits and
remove disincentives for work. •ComplementtheredesignofFSAwithmoredetermined
enforcement of the activation of FSA beneficiaries, link-ing them with adequate and accessible employment support programs, and ensure better coordination between the National Employment Service and CSWs.
(See Table 1 for a full set of recommendations.)
Distributional Impact of Fiscal Consolidation Measures
52. The distributional implications of the government’s core fiscal consolidation measures need to be looked at both from a welfare perspective and to assess the political sustainability of reforms. The distributional impact of reforms on public sector wages and right-sizing, pensions, state support to SOEs, and electricity prices depends on the initial poverty and vulnerability profile of households, the design and incidence of the reforms, and the mitigating or compensatory measures that are put in place. Certain facts from Serbia’s poverty and labor market profile are particularly important: (1) Relatively low risk of poverty for retired individuals (13.0 percent based on the 2014 SILC) compared to the national average (25.6 percent). (2) Public sector workers are on average better-paid than private sector workers, with public sector employment more prevalent among top income deciles. (3) Electricity is a primary energy source for households and an important component of household budgets, especially for the single elderly.
53. Because reforms leading to fewer job and higher electricity prices are particularly likely to have negative welfare implications, and with the fiscal envelope reduced, how mitigation or compensation
measures are designed and targeted matters considerably. The negative impact on poverty of freezes and cuts in public sector wages may be limited by the fact that public sector employees in general tend to be relatively well paid and far above the poverty line and by the exclusion of lower salaries from the cuts. Similarly, the impact of cuts in nominal pensions is eased because they are progressive, although freezing of pension indexation will have an impact across the board, particularly for households that rely on one pension as a source of income. Public sector right-sizing and layoffs due to SOE restructuring are likely to hit households harder, particularly where workers are lower-skilled. Mitigation measures include severance payments and support in finding new employment, but whether those laid off can find new employment will depend on their education, skills, age, and location. Qualitative analysis has found that households have limited strategies for coping with reduced pensions, electricity tariff increases, or job losses. Given the broad-ranging reforms underway, detailed analysis and monitoring of the distributional implications of the ongoing fiscal consolidation program will be important.
54. Welltargeted support will be crucial given the declining overall fiscal envelope; to the extent possible, it should be channeled through current programs to limit fragmentation and improve effectiveness. The reform priorities proposed for social protection—better targeting of SA to the poor, freeing up resources for more effective programs, and redesigning programs to remove disincentives for work—are especially important when considering how best to limit possible adverse effects of the government’s near-term core fiscal consolidation measures. Other reforms areas outlined in this report may also have serious distributional implications in the medium term that also merit further investigation to inform their design—particularly how to implement measures to address longer-term pension challenges and deliver health and educational services more effectively.
Summary of Policy Recommendations
The recommendations of this report cover measures with both shortterm and medium to longterm horizons for adoption and implementation, depending on their prioritization and technical and political feasibility. Table 1 summarize the recommendations across the different policy areas covered in this report, split by time frame.
1 Due to significant differences between the list of programs in the HBS and the Survey on Income and Living Conditions - SILC (and changes in the poverty measure-ment methodology) it is not feasible to do a comparison of FSA’s coverage over time.
EXECUTIVE SUMMARY

X
Table 1: Summary of Policy Recommendations
Policy Recommendations
Policy Area Short-term Medium- to long-term
Tax Administration Lower compliance costs by improving service to tax-
payers and reducing uncertainty in the interpretation of tax statutes.
Manage tax arrears better, through both stronger collection efforts and clarification of the authority to write off uncollectible debt. Limit the use of tax amnesties for dealing with large arrears.
Reevaluate the tax administration IT strategy and update the IT: Assess current IT hardware and soft-ware capabilities, and update as needed.
Reorganize and restructure the tax administration—downsize, restructure, and ensure that staff have the right skills mix.
Undertake a comprehensive reform of the tax admin-istration risk-management system. Focus audits on large taxpayers and reduce the number of audits that do not produce results. Hire more auditors and strengthen the Large Taxpayers Office. Enhance data exchange and analysis capabilities using third-party sources (e.g., banks, property registry, customs, police, etc.) to make risk management more effective.
Combat the informal economy by improving services to reduce barriers to formalization, improve enforcement against tax evasion, and providing incentives to reduce cash transactions.
Wage Bill Continue recent measures, such as the hiring freeze and attrition, to limit staffing growth. While these measures do not address structural weaknesses, they are critical to limiting staffing growth and delivering fiscal savings in the short to medium term.
Complete a comprehensive functional review of the central administration—the Ministry of Finance, and sector ministries, such as education, health, social protection, and agriculture, to simplify administrative procedures, eliminate redundant tasks, and eliminate or restructure departments with duplicate functions, without compromising service delivery standards.
Complete definition of the elements of the new pay structure, such as the extent of consolidation of allowances; new job structure and classifications; the basis for pay increase; whether employees now above their new pay coefficient will have their pay reduced or be grandfathered into the new system. A well-managed and shorter transition to the new system could also help contain costs.
Implement a centralized establishment and payroll control system: To overcome the deficiencies of current self-reported personnel database, the government needs a comprehensive centralized payroll system to provide the fiscal oversight and reporting necessary to monitor employment growth, distribution of staff, and employment costs.
Consider reducing staff in health, police, and (to a lesser extent) education and integrate right-sizing into the regular budget process: i.e., manage establishment control within credible budget ceilings.
Pensions Sustain implementation of 2014 pension reforms which introduced parametric reforms, including rules for early retirement.
Initiate work on a medium - to long-term reform strategy, including: a) a discussion of minimum pensioner needs and how to provide at least survival level benefits for the elderly who have no income; b) Move away from equalizing pensions for different cohorts of workers and towards linking contributions to benefits, not only within a cohort, but across cohorts as well, if possible; c) Introduce provision for those who are not part of the formal labor market, and d) Look at ways to restructure the farmers’ pension system.
EXECUTIVE SUMMARY

XI
Policy Recommendations
Policy Area Short-term Medium- to long-term
SubsidiesReduce state support to SOEs by accelerating resolu-tion of the PA portfolio.
Proceed with reorganizing large public utilities to improve their financial performance and reduce both the level of subsidies and debt service from the budget.
Make agricultural subsidies more efficient and effective: a) Rebalance sector support, with more resources allocated to rural development and less to direct budget support (phase out the milk subsidy); b) Introduce a more targeted and efficient system of area and animal payments, to encourage farm expansion through, and c) Cap subsidies to limit support to very large farms that have less need of budget support.
Make state support to the private sector more effective: Reform the state development and export promotion agencies, introduce robust M&E systems, ensure transparency, and ensure links with broader economic strategy.
Education Reduce the number of teachers in primary and secondary education by applying a strategy to right-size the teaching workforce, and undertake a program of teacher rationalization, by redeploying current teachers.
Increase ECD coverage, particularly for Roma children by using existing facilities and redeploying teachers to the extent feasible, and as fiscal space opens up, scaling up investments in ECD programs to meet targets.
Improve the equity of teacher quality and distribution by reviewing current teacher deployment policies and realigning them to ensure that students in vulnerable and underserved areas have access to high-quality professional teachers.
Reduce spending inequality between schools by replacing input-based budgeting with more equal per-student financing; fully develop and pilot the funding formula; and scale up per-student financing to achieve a transparent, efficient, and equitable system.
Support student learning by regularly measuring learn-ing outcomes at the school level; and linking school inputs (resources) with outputs (learning scores) to better inform policy decision.
Table 1: Summary of Policy Recommendations
EXECUTIVE SUMMARY

XII
Policy Recommendations
Policy Area Short-term Medium- to long-term
Health Reduce excess non-contracted and nonmedical staff, and urgently address hospital payment arrears and financing imbalances. Identify the numbers and costs of noncontracted staff, and identify scope for savings by reducing unnecessary nonmedical staff. A transpar-ent and consultative process will be necessary for this.
Continue to implement reforms to save on pharmaceutical and medical devices, and more actively monitor prescription and dispensing practices. For outpatient prescription drugs, consider reforms to reimbursement policies (e.g., introduce flat dispensing fees or a regressive margin for medicines), and better monitor prescription and dispensing practices to control volumes. For higher-cost patented drugs, adopt innovative negotiation strategies (such as price-volume agreements) to bring down costs.
Implement provider payments reforms for both primary care and hospitals, complemented by broader public administration reforms to improve quality and accountability for service provision. Shift to performance-based financing for primary and hospital care (adjust primary care capitation financing and for hospitals base payments on diagnostic related groups) for hospitals; right-size hospital networks and rationalize service provision based on an updated hospital master plan; and make managers more accountable for health facilities by giving them more autonomy. Implement reforms that will lay the groundwork for addressing the challenges of an aging population: rationalize hospital service networks to convert excess hospital beds to long-term or social care; increase the use of ambulatory care and day surgeries; reinforce adherence to clinical guidelines and protocols; and better monitor the quality of care and health outcomes at all levels of the health system.
Strengthen the quality and coverage of primary and preventive care, including through strengthening screening and treatment of chronic diseases and promoting healthy behaviors, for a healthier population and reduced costs over the long term.
Social AssistanceComplement the redesign of FSA with stronger implementation and enforcement of the activation of FSA beneficiaries, linking them with adequate and accessible employment support programs. Ensure better coordination between the National Employment Service and the CSWs
Consider scaling back the wage compensation program and use the freed-up resources to expand FSA, Serbia’s most effective SA program.
Consider means-testing parental allowances (the birth grant). Redesign the program and channel the resulting savings (0.1 percent of GDP) to expand FSA, child allow-ances, or child care coverage. Another option could be to consolidate the program with child allowances.
Redesign the FSA to address built-in work disincentives. Introduce in-work benefits. While this will not bring any short-term savings (it may at first increase the cost slightly), it would be worthwhile in the medium to long term as it would incentivize work, increase self-reliance, and ultimately encourage full exit from the system.
Table 1: Summary of Policy Recommendations
EXECUTIVE SUMMARY

XIII
55. The recommendations in this report identify additional potential fiscal savings which could support an improved trajectory path for government debttoGDP. The near-term priority for fiscal consolidation is timely implementation of the government’s reform program for 2015 to 2017, as supported by the IMF program. Under this baseline scenario, the World Bank projection is that government debt-to-GDP, after peaking at 79 percent in 2016, will move onto a downward trajectory, declining to 71 percent by 2020. Many of the recommendations in this report, particularly on the public wage bill and
56. The government’s fiscal consolidation program has already realized significant fiscal savings in the first half of 2015. According to the preliminary results for the first six months public revenues were 1.2 percent of annual GDP higher than last year, driven by higher non-tax revenues, while expenditures were 0.6 percent of GDP lower reflecting lower wage bill and pension spending. Consequently, the general government fiscal deficit was only a quarter of the deficit, in nominal terms, seen in the first half of 2014.
57. Going forward, it is crucial to maintain the progress on fiscal adjustment. Without a full and timely implementation of reforms to ensure a sustainable
administration, are focused on delivering this baseline and limiting risks of slippages which could push up the debt profile. Additional savings are also identified, particularly for the period beyond 2017, which can help to sustain the downward trajectory of government debt (Table 2). If realized, these measures could yield potential additional fiscal savings per year of up to 1.1 to 1.6 percent of GDP over 2017-2019. If these savings are used to reduce the deficit then they could support a further improvement in the debt path relative to the baseline, moving debt-to-GDP down to 66 percent by 2020.
Table 2: Estimated Fiscal Impact of Additional Identified Reforms Relative to Baseline (Percent of GDP)
Chapter Reform 2016 2017 2018 2019 2020
Revenue and Tax Administration
1. Improved work of the tax administration to tackle the informal economy
0.25 0.25 0.25 0.25 0.25
Subsidies and State Support to theEconomy
1. Reduced calling of guarantees by commercial SOEs
2. Phasing out milk subsidy and the cap to farm size is introduced, implementation from 2016
-0.35 -0.25 -0.25 -0.25 -0.20
-0.20 -0.20 -0.20 -0.20 -0.20
Education 1. Additional education cost savings over medium to long term
-0.08 -0.17 -0.25 -0.33 -0.42
Health 1. Movement to OECD average staffing norms of non-medical to medical staff
2. Gradual reduction in average share of spending on pharmaceuticals
-0.04 -0.08 -0.12 -0.16 -0.20
-0.09 -0.18 -0.27 -0.36 -0.45
Summary relative to baseline
Additional revenue
Expenditures savings
Total impact on fiscal balance
0.25
-0.76
-1.01
0.25
-0.88
-1.13
0.25
-1.09
-1.34
0.25
-1.30
-1.55
0.25
-1.46
-1.71
Source: World Bank calculations.Note: Improved tax administration assumed to increase revenue to GDP by 0.25 percentage points of GDP per annum from 2016; Reduction in the calling of guar-antees by commercial SOEs assumed to reduce amortizations of called guarantees by half relative to baseline from 2016; Phasing out milk subsidy and the cap to farm size assumed to reduce spending by 0.2 percentage points in each year from implementation in 2016; Education savings based on assumption of additional reforms implemented from 2016 to 2021 to reduce gradually annual spending by 0.5 percentage points of GDP by the end of this period, i.e. to halve the 1 percent-age point gap in public education spending between Serbia and the average of regional peers in Central And Eastern Europe; Serbia’s share of non-medical staff of 25-30 percent is twice as high as in OECD countries and moving to OECD average staffing norms could yield annual savings of up to 0.2 percentage points of GDP per year with gradual implementation assumed over 2016 to 2020; potential savings on pharmaceuticals are assumed from a movement over 2016-2021 to a target of 18 percent of total health spending on pharmaceuticals from the 2013 level of 25 percent, as applied to a constant public health spending to GDP (with additional analysis needed to incorporate costs of new therapies and improving coverage).
reduction in the fiscal deficit and the public debt thereafter, Serbia risks severe economic and social consequences. The measures outlined in the Government's reform program, as well as the additional savings outlined in this report, would help to put the public debt on a downward trajectory. If this is not achieved then there is a risk of heightened macro-fiscal instability, reducing investment and confidence, and potentially a public debt crisis. In such a negative scenario, measures that would be needed to bring the public finances in order and to restore macroeconomic stability would be even more painful. The likely resulting contraction of the economy would lead to even higher unemployment and to an increase in poverty.
EXECUTIVE SUMMARY

1
I. Introduction and Country Context


3
I. INTRODUCTION AND COUNTRY CONTEXT
CHAPTER 1.THE NEED FOR FISCAL CONSOLIDATION
A. Country Context
1.1. Since the start of its transition in 2001, the Serbian economy has gone through episodes of strong and weak growth and cyclical fiscal dynamics that overlay significant structural fiscal challenges. The early years of transition were marked by post-conflict reconstruction, rapid implementation of structural reforms, and inflows of FDI—all of which led to strong economic growth and a favorable outlook for public finances. Until 2008, fiscal deficits stayed moderate and public debt fell significantly. Since the start of the global economic and financial crisis in 2008, however, Serbia has struggled with the interlinked problems of weak growth and an unfavorable fiscal outlook. As economic activity has stagnated, revenues have fallen and expenditures, particularly on mandatory spending on pensions and wages, are still high. At the same time, structural fiscal issues, for example, continued state support to state-owned enterprises (SOEs) and tax administration inefficiencies, have been dragging down growth. As a result, general government fiscal deficits averaged 5.6 percent of GDP a year between 2009 and 2014, and public debt rose from 34 percent of GDP to 71 percent in 2014; in 2013 and 2014 debt service of about a third of total revenues have become a significant problem for the budget. Increasingly, how Serbia can ensure that its public finances will be sustainable in the medium term has become a critical policy question.
Serbia before the Crisis: 20012008
1.2. In the early phase of transition (20012008) Serbia, like its regional peers, had a very strong growth episode, with the annual growth rate averaging 5.9 percent. The Serbian economy recovered significantly from the shocks that had occurred during the 1990s on the back of the rapid implementation of structural reforms, increased trade integration with Europe and the rest of the world, and post-conflict reconstruction of infrastructure. GDP in 2008 was 49 percent higher in real terms than in 2001. For ECA region as a whole, this period was also characterized by high average levels of growth, at 5.5 percent, and the same drivers that supported Serbia’s growth performance were also seen in other countries of the Western Balkans. By way of comparison, Bosnia & Herzegovina experienced average growth over 2001-2008 of 5.4 percent, Albania 5.7 percent and Kosovo 6.9 percent.
1.3. During this period, Serbia managed to significantly reduce public debt and build a cushion against shocks. A relatively favorable fiscal position, reflected in higher public revenues and low deficits (the average deficit
for 2001–08 was 1.9 percent of GDP) and successful restructuring of old Yugoslav debt, along with strong nominal GDP growth, led to a plunge in public debt from 105 percent of GDP in 2001 to 29 percent in 2008. During this period, Serbia prepaid some of its major creditors, including the IBRD. The government also built up its fiscal buffers: at the onset of the crisis state deposits reached €1.5 billion (4.3 percent of GDP).
1.4. Public finances went through significant reforms. On the revenue side, the tax system was completely reformed early in the 2000s by reducing the number of taxes imposed on businesses and individuals from over 100 to just 6 and introducing the VAT in 2005. The Ministry of Finance (MoF), including the Serbia Tax Administration and Customs, was modernized through the definition of roles and functions typical of these institutions in the EU. The Public Procurement Office was established in 2002, the Treasury in 2003, the State Audit Institution in 2007, and then the Public Debt Administration. On the expenditure side, there were efforts at reform but, given their political sensitivity and the absence of significant fiscal pressures for reform, these were often incomplete or significantly delayed; as a result, public expenditures remained high throughout the period. On average, Serbia’s general government spending was about 45 percent of GDP annually, mainly due to mandatory spending, in particular on pensions and the public wage bill. The government had attempted to introduce pension reforms in 2002 and 2003. Despite some important changes to the core civil service administration, the wage bill went up from 8.0 to 10.5 percent of GDP; civil service changes addressed only a fraction of the wage bill. In addition, subsidies provided to SOEs (3.2 percent of GDP) were high throughout this period as further restructuring of “non-private” enterprises was delayed.
1.5. The boom period, however, generated significant macroeconomic imbalances. As in many other ECA countries, the economic growth in Serbia was driven almost entirely by consumption, which led to significant external imbalances. The current account deficit (CAD) averaged 9.8 percent of GDP, which was financed mainly through new borrowing from abroad and to a lesser extent through FDI. As a result, over 2001–08 total external debt increased by €10 billion.

4
I. INTRODUCTION AND COUNTRY CONTEXT
Serbia after the Crisis: 20092014
1.6. The global financial crisis caused a significant economic slowdown globally, regionally, and in Serbia (Figures 1.1 and 1.2). Almost immediately access to cheap financing ceased, and the unsustainability of the consumption-led growth model was laid bare. The Serbian economy was pushed into recession: the economy contracted by 3.5 percent in 2009. Recession hit again in 2012 with a contraction of 1.5 percent, and once again in 2014, with GDP falling by 1.8 percent, this time mainly because of major floods. Overall, for 2009–14 real GDP growth has been on average negative at –0.2 percent, down 6.1 percentage points from the 2001–08 average. Not surprisingly, the pace of reforms also slowed considerably. The regional trends were again similar, although somewhat less pronounced: average growth in developing ECA after 2008 was just under half its previous level.
Figure 1.1: General Government Fiscal Operations, 2009–14(Percent of GDP)
Figure 1.2: Public Debt, 2009–14(Percent of GDP)
Source: Ministry of Finance, IMF, World Bank. Source: Ministry of Finance.
200930
35
40
45
50
2010 2011 2012 2013 2014
Total expenditures Total revenues
20090
20
40
60
80
2010 2011 2012 2013 2014
1.7. As the economy slowed, Serbia’s general government fiscal balance deteriorated. Revenues fell in 2008–11 and dipping again in 2013, but recovered in 2014, in part due to increases in the VAT rate. Compared with the pre-crisis period of 2006–2008 revenues were down 3.0 percentage points of GDP in 2012–2014, mainly due to declining personal income tax and VAT reflecting weak domestic demand; international trade taxes were also down notably because of the external environment (see Box 1.1). Expenditures, on the other hand, have grown steadily since the crisis, especially pension and interest expenditures, and wages and salaries are unchanged as a share of GDP. The result has been a steadily deteriorating general government fiscal deficit, from about 2.6 percent of GDP in 2008 to the peak of about 7.2 GDP in 2012, although it subsided to 5.6 percent in 2013. The 2013 decline in the deficit was primarily due to cuts in capital spending and subsidies and new rules for indexing salaries and pensions in the public sector, which lowered the spending on wages and pensions. In 2014 the fiscal deficit in 2014 was back up to 6.7 percent of GDP, partly because of amortization of called guarantees. The severe floods that hit Serbia in May 2014 further undermined the fiscal position, contributing an estimated 1 percentage point (pp) of GDP to the fiscal deficit compared to the pre-flood scenario.
200930
35
40
45
50
2010 2011 2012 2013 2014
Total expenditures Total revenues
20090
20
40
60
80
2010 2011 2012 2013 2014

5
I. INTRODUCTION AND COUNTRY CONTEXT
Source: IMF, World Bank staff calculations.
Box 1.1: A Snapshot of Serbia’s Preand Postcrisis Fiscal Performance(Percent of GDP)
Source: IMF, World Bank staff calculations.
Figure 1.3: Decomposition of Change in Average Revenues from 20062008 to 20122014(Percent of GDP)
Figure 1.4: Decomposition of Change in Expenditures from 20062008 to 20122014(Percent of GDP)
38
39
40
41
42
43
44
Av. revenue 2006-2008
Personal in
come ta
x
Corporate inco
me tax
Value-added taxe
s
Excises
Taxes o
n internatio
nal
Non-tax r
evenue
Other revenues
Av. revenue 2012-2014
43
44
45
46
47
48
49
Av. spending 2006-2008
Wages and sa
laries
Goods and se
rvices
Interest
Subsidies
Pensions
Other transfe
rs
Capital exp
enditure
Net lending
Amort. acti
vated guar.
Av. spending 2012-2014
Av. 2006-2008 Av. 2012-2014 ChangeRevenue 42.1 39.1 -3.0Taxes 36.7 34.3 -2.4
Personal income tax 5.2 4.1 -1.1Social security contributions 11.4 10.9 -0.5Corporate income tax 1.2 1.7 0.5Value-added taxes 11.1 10.2 -0.9Excises 4.1 5.3 1.1Taxes on international trade 2.3 0.9 -1.5Other taxes 1.4 1.3 -0.1
Non-tax revenue 5.0 4.6 -0.4Capital revenue 0.3 0.1 -0.3Grants 0.1 0.1 0.1
Expenditure (including amortization of called guarantees) 44.1 45.6 1.5Current expenditure, of which: 39.4 42.1 2.7
Wages and salaries 10.2 10.2 0.0Goods and services 7.8 7.7 -0.1Interest 1.0 2.4 1.5Subsidies 2.7 3.8 1.1Transfers, of which: 17.6 17.9 0.3 Pensions 11.4 13.1 1.7 Other transfers 6.2 4.9 -1.4
Other current expenditures 0.0 0.0 0.0Capital expenditure 4.2 2.7 -1.5Net lending 0.6 0.4 -0.2Amortization of activated guarantees 0.0 0.4 0.4
Primary balance (incl. amort. activated guarantees) -1.0 -4.1 -3.0Fiscal balance (incl. amort. activated guarantees) -2.0 -6.5 -4.5Memo: Fiscal cash balance -2.0 -6.1 -4.1
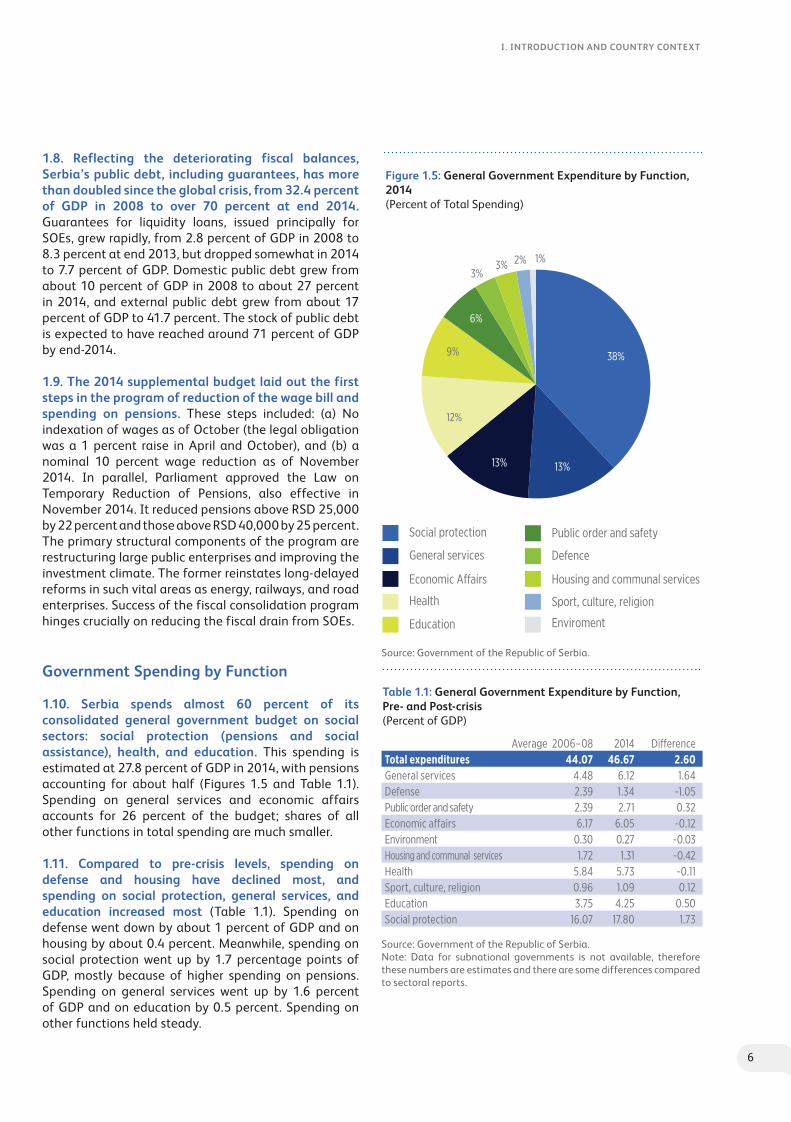
6
I. INTRODUCTION AND COUNTRY CONTEXT
Figure 1.5: General Government Expenditure by Function, 2014(Percent of Total Spending)
Table 1.1: General Government Expenditure by Function, Pre and Postcrisis (Percent of GDP)
1.8. Reflecting the deteriorating fiscal balances, Serbia’s public debt, including guarantees, has more than doubled since the global crisis, from 32.4 percent of GDP in 2008 to over 70 percent at end 2014. Guarantees for liquidity loans, issued principally for SOEs, grew rapidly, from 2.8 percent of GDP in 2008 to 8.3 percent at end 2013, but dropped somewhat in 2014 to 7.7 percent of GDP. Domestic public debt grew from about 10 percent of GDP in 2008 to about 27 percent in 2014, and external public debt grew from about 17 percent of GDP to 41.7 percent. The stock of public debt is expected to have reached around 71 percent of GDP by end-2014.
1.9. The 2014 supplemental budget laid out the first steps in the program of reduction of the wage bill and spending on pensions. These steps included: (a) No indexation of wages as of October (the legal obligation was a 1 percent raise in April and October), and (b) a nominal 10 percent wage reduction as of November 2014. In parallel, Parliament approved the Law on Temporary Reduction of Pensions, also effective in November 2014. It reduced pensions above RSD 25,000 by 22 percent and those above RSD 40,000 by 25 percent. The primary structural components of the program are restructuring large public enterprises and improving the investment climate. The former reinstates long-delayed reforms in such vital areas as energy, railways, and road enterprises. Success of the fiscal consolidation program hinges crucially on reducing the fiscal drain from SOEs.
Government Spending by Function
1.10. Serbia spends almost 60 percent of its consolidated general government budget on social sectors: social protection (pensions and social assistance), health, and education. This spending is estimated at 27.8 percent of GDP in 2014, with pensions accounting for about half (Figures 1.5 and Table 1.1). Spending on general services and economic affairs accounts for 26 percent of the budget; shares of all other functions in total spending are much smaller.
1.11. Compared to precrisis levels, spending on defense and housing have declined most, and spending on social protection, general services, and education increased most (Table 1.1). Spending on defense went down by about 1 percent of GDP and on housing by about 0.4 percent. Meanwhile, spending on social protection went up by 1.7 percentage points of GDP, mostly because of higher spending on pensions. Spending on general services went up by 1.6 percent of GDP and on education by 0.5 percent. Spending on other functions held steady.
Source: Government of the Republic of Serbia.Note: Data for subnational governments is not available, therefore these numbers are estimates and there are some differences compared to sectoral reports.
Source: Government of the Republic of Serbia.
Social protection
General services
Economic A airs
Health
Education
Public order and safety
Defence
Housing and communal services
Sport, culture, religion
Enviroment
38%
13%13%
12%
9%
6%
3%3% 2% 1%
Average 2006–08 2014 DifferenceTotal expenditures 44.07 46.67 2.60General services 4.48 6.12 1.64Defense 2.39 1.34 -1.05Public order and safety 2.39 2.71 0.32Economic affairs 6.17 6.05 -0.12Environment 0.30 0.27 -0.03Housing and communal services 1.72 1.31 -0.42Health 5.84 5.73 -0.11Sport, culture, religion 0.96 1.09 0.12Education 3.75 4.25 0.50Social protection 16.07 17.80 1.73

7
I. INTRODUCTION AND COUNTRY CONTEXT
B. Fiscal Sustainability under Alternative Scenarios
Public Debt Path with No Reform
1.12. Given the weaker growth outlook, Serbia’s growing public debt is unsustainable without fiscal consolidation. If Serbia’s growth were to return to the levels seen prior to the global financial crisis of 2008-2009, then this would support a stabilization of debt reduction within a constant primary surplus. However, with global growth much more subdued, the baseline projection is for Serbia’s growth to average 2.9 percent through 2020—half the pre-crisis level. Given a baseline growth outlook with no reforms, i.e. a situation in which the primary deficit is unchanged from 2015 onwards at 2.4 percent of GDP (versus a baseline assumption of a move to a primary surplus by 2017), public debt would reach 100 percent of GDP by 2020.
1.13. The need to pursue fiscal consolidation within a much weaker growth environment requires that the authorities deliver on challenging spending reductions because the already high revenuestoGDP ratio means that its contribution will be minimal. Fiscal consolidation also requires addressing not only the fiscal deficit but also other government liabilities, particularly from guarantees. A significant part of the increase in public debt between 2008 and 2014 came from guarantees issued on behalf of SOEs, public utilities, and local governments. Growing public debt not only absorbs a significant amount of resources in debt service (35 percent of total revenues) that could be used for productive purposes, it also has a high roll-over risk. The fiscal and debt vulnerabilities make it critical that the government pursue fiscal consolidation to achieve debt sustainability and assure macroeconomic stability over the medium term (see Table 1.2).
20
40
60
80
100
120
2010 2012 2014 2016 2018 2020
71
80
101
Reform Constant primary balance from 2015 but growth of 5.9 percent from 2016
No policy change (constant primary balance from 2015)
Source: World Bank staff estimates.
Figure 1.6: General Government DebttoGDP Ratio, Alternative Scenarios(Percent)
Public Debt with Fiscal Consolidation Program
1.14. To halt the rise in public debt and set it on a downward trajectory by 2017, the government in November 2014 adopted an ambitious program of fiscal consolidation and structural reform. The program is supported by a 3-year Precautionary Stand-by Arrangement approved by the IMF Board in February 2015. Over the medium term, the consolidation program aims to reduce public spending from 46.6 percent in 2014 to 40.7 percent by 2017, mostly by cutting recurrent spending. The fiscal consolidation program will focus on reducing public wage bills and pension costs and reducing fiscal support to public enterprises, mainly by restructuring large public enterprises and improving the investment climate.
1.15. A baseline debt sustainability analysis under the consolidation scenario shows the public debttoGDP ratio reaching 78.9 percent in 2016 before beginning to decline. This scenario assumes that real GDP growth will have picked up to about 2 percent by 2017 and that the fiscal consolidation strategy operates as planned, with the primary deficit declining from 3.7 percent of GDP in 2014 to 0.8 percent by 2016 and thereafter moving into a small primary surplus. Over the near term gross government financing needs will remain significant, reaching 19 percent of GDP by 20172. This is a considerable risk given likely tightening in financing conditions in coming years.
1.16. The projected public debt path, however, is highly sensitive to slippages in the fiscal consolidation plan, unexpectedly poor growth, or a negative real exchange rate shock (see Figures 1.7 and 1.8). For example, if only half the projected fiscal consolidation (in terms of annual reduction in the primary deficit) is achieved, in 2020 the debt-to-GDP ratio would be 75 percent of GDP versus 71 percent in the base case. Low GDP growth that is only half a standard deviation higher than the baseline would push Serbia’s debt ratio to about 84 percent by 2017 (and rising if growth is weakening). Similarly, a one-off real depreciation of 30 percent or a one-off realization of 10 percent of GDP in contingent liabilities would push the public debt ratio up to almost 100 percent of GDP, since about 75 percent of the debt is in foreign currency. Even more moderate real depreciations would thus have sizeable impacts on the ratio, and a combination of smaller slippages across core macro indicators and on fiscal consolidation could mean that the debt ratio would keep rising throughout the projection period. It is also important to note that these sensitivities do not take into account spillovers of, for example, a rising debt burden, or the effects of program slippages on investor confidence and hence interest costs and the currency.
2 See IMF SBA program document.

8
I. INTRODUCTION AND COUNTRY CONTEXT
Source: World Bank staff projections. Source: World Bank staff projections.
Source: Ministry of Finance, IMF.Note: Projections are from IMF 2015, 2014 Article IV consultation and Request for Stand-by Arrangement. The Government’s Fiscal Strategy has slightly different figures for both revenues and expenditures since there was a change in the methodology used for reporting on gross wages and collected social contributions.
20
40
60
80
100
120
2010 2012 2014 2016 2018 2020
71
75
66
101
Baseline
Limited reform implementation(1/2 of adjustment to primary balance)
No policy change (constant primary balance from 2015)
Baseline plus implementation of additional reforms 20
40
60
80
100
120
2010 2012 2014 2016 2018 2020
71
88
100
Reform
Negative growth shock
One time 30 percent real depreciation in 2016
Figure 1.7: Additional Fiscal Reforms Can Yield a More Sustained Reduction in the Debt Ratio(General government debt-to-GDP, percent)
Figure 1.8: The Debt Path is Particularly Sensitive to Growth or Exchange Rate Weakness(General government debt-to-GDP, percent)
Table 1.2: General Government Fiscal Operations(Percent of GDP)
Actual Projected2014 2015 2016 2017
Revenue 40.0 38.7 37.7 36.9Taxes 35.3 34.0 33.2 32.5
Personal income tax 3.8 3.6 3.4 3.4Social security contributions 11.4 10.6 10.2 10.0Corporate income tax 1.9 1.9 1.9 1.9Value-added taxes 10.6 10.1 9.8 9.6Excises 5.5 5.7 5.8 5.6Taxes on international trade 0.8 0.7 0.7 0.7Other taxes 1.5 1.4 1.4 1.4
Non-tax revenue 4.5 4.5 4.3 4.2Capital revenue 0.0 0.0 0.0 0.0Grants 0.2 0.2 0.2 0.2
Expenditure 46.6 44.6 42.4 40.7Current expenditure 42.0 40.6 38.5 37.1
Wages and salaries 10.0 9.1 8.2 7.4Goods and services 8.0 7.6 7.4 7.4Interest 3.0 3.5 3.9 4.0Subsidies 3.0 2.6 2.3 2.4Transfers 18.0 17.8 16.7 16.0Pensions 13.1 12.4 11.8 11.3Other transfers 4.9 5.4 4.8 4.7
Capital expenditure 2.5 3.1 3.1 3.0Net lending 1.4 0.1 0.1 0.1Amortization of activated guarantees 0.8 0.8 0.7 0.5
Primary balance (incl. amortization of called guarantees) -3.7 -2.4 -0.8 0.3Fiscal Balance (including amortization of called guarantees) -6.7 -5.9 -4.7 -3.8

9
I. INTRODUCTION AND COUNTRY CONTEXT
1.17. The risks and consequences of not following through with the implementation of the fiscal consolidation program are significant. Political, governance, and social factors could lead to a slower than needed implementation of reforms covered by this report. If these reforms, in addition to those agreed under the IMF program, are not implemented Serbia risks of facing serious macroeconomic problems, including a deeper contraction of economy, and most likely a public debt crisis. This in turn would lead to even higher unemployment and to an increase in poverty. In such negative scenario, measures that would be needed to bring the public finances in order and to restore the macroeconomic stability would be even more painful.
1.18. Consequently, Serbia’s government cannot be complacent about reforms and should look for all options that could help to achieve both near and longerterm fiscal adjustment as quickly as possible. A recently signed 3 year Stand-By agreement with the IMF provides a strong foundation for fiscal adjustment over the next three years, but reforms recommended in this report could help to bring the debt on a declining
path even quicker. In addition, reforms covered in the rest of this report can help to ensure sustainability of fiscal savings as well as bring efficiency improvements across the public sector. Indeed, as noted in the executive summary, the report identifies a number of reform areas which could yield savings, particularly for the period beyond 2017, which could support a further improvement in the debt path relative to the baseline, moving debt-to-GDP down to 66 percent by 2020 (Figure 1.6).
Early Successes with the Fiscal Adjustment in 2015
1.19. Benefits of the fiscal adjustments were already seen in the first half of 2015, and continued implementation of reform measures will be needed for sustained consolidation progress. Implementation of measures agreed under the IMF program led to a marked reduction of expenditures which, combined with higher revenues, resulted in a general government
Table 1.3: General Government Fiscal Operations, JanuaryJune 2014 and 2015(RSD milion and percent of GDP)
Source: Ministry of Finance, World Bank staff calculations.
Jan-June 2015 Jan-June 2014 Differenceas % of annual
GDPContribution to growth,
percentage points
TOTAL REVENUES 805,199 756,169 49,030 1.2 6.5% Current revenue 802,217 754,084 48,132 1.2 6.4% Tax revenue 693,579 684,373 9,206 0.2 1.2% Personal income tax 68,112 67,320 792 0.0 0.1% Corporate income tax 38,900 45,312 -6,412 -0.2 -0.8% Value added tax 196,296 190,511 5,785 0.1 0.8% Excises 103,507 98,029 5,478 0.1 0.7% Customs 15,802 14,648 1,153 0.0 0.2% Other tax revenues 29,443 25,050 4,393 0.1 0.6% Social contributions 241,520 243,503 -1,983 0.0 -0.3% Non-tax revenues 108,638 69,711 38,926 1.0 5.1%Grants 2,982 2,085 897 0.0 0.1%PUBLIC EXPENDITURES 840,543 864,022 -23,480 -0.6 -2.7%Current expenditures 789,830 809,704 -19,873 -0.5 -2.3%
Wage bill 203,135 228,024 -24,888 -0.6 -2.9% Purchase of goods and services 109,704 109,197 507 0.0 0.1% Interest payment 73,249 64,154 9,094 0.2 1.1% Subsidies 42,530 43,086 -555 0.0 -0.1% Social grants and transfers 340,567 343,066 -2,499 -0.1 -0.3% o/w Pensions 243,771 251,967 -8,196 -0.2 -0.9% o/w Social assistance 72,385 67,354 5,032 0.1 0.6% Other current expenditures 20,645 22,177 -1,532 0.0 -0.2%Capital expenditures 34,324 39,240 -4,917 -0.1 -0.6%Activated guarantees 15,039 12,473 2,566 0.1 0.3%Net lending 1,350 2,606 -1,256 0.0 -0.1%BALANCE -35,344 -107,853 72,510 1.8 n.a.

10
I. INTRODUCTION AND COUNTRY CONTEXT
deficit which, in nominal terms, was only a quarter of the deficit from the same period 2014. Revenues were 6.5 percent higher y/y in the first half 2015 compared to the same period. This was mainly as a result of higher non-tax revenues, reflecting additional taxation of wages in the public sector (classified as non-tax revenues) and one-off measures such as sale of 4G license, transfer of profits from SOEs etc. In addition, VAT (on imports) and excises increased significantly. However, personal and corporate income tax performance was weak. On the expenditure side most of the savings come as a result of the cuts to wages and pensions. This was partially offset by an increase in interest payments (up 14 percent), with the primary balance moving into. In addition, it is important to stress that public investment spending went down significantly (by 12 percent). The increase in the stock of public debt has been stopped as net financing needs were reduced. The full impact of the fiscal adjustment on public debt could have been even higher if there was no a significant strengthening of dollar in early 2015 (one third of Serbia’s public debt is denominated in USD).
C. How the Report is Organized
1.20. The objectives of this public finance review are twofold: (1) Analyze Serbia’s fiscal challenges and propose policy options and recommendations to help solidify the ongoing fiscal consolidation program and achieve public debt sustainability over the medium term; and (2) recognizing that Serbia has little fiscal room to pursue new investments, identify opportunities for enhancing the efficiency, quality, and equity of current public spending on health, education, and social protection over the medium term. The report outlines additional measures that could support fiscal consolidation and identifies options for efficiency gains in public services, particularly health, education and social assistance. Such measures can also help to free up funds as resources are declining to finance temporary spending needs that may arise to limit the social impact of, for example, public sector restructuring and rightsizing.
1.21. The rest of the report is organized as follows: There are three overarching sections. In chapters 2–5 section II explores options and opportunities for fiscal consolidation in the areas of taxes, the wage bill, pensions, and subsidies—areas that could anchor long-term fiscal sustainability. Recognizing that Serbia’s fiscal constraints will not allow for significant new investments in the short term, section III examines, in chapters 6–8, options for increasing the efficiency, quality, and equity of current public spending on education, health, and social assistance (SA)—sectors that account for
about 60 percent of Serbia’s total public expenditure by function. In chapter 9, section IV examines the distributional implications of the fiscal consolidation program and its welfare implications for the less well-off. The report ends with a summary of conclusions and recommendations.

11
II. Opportunities and Options for Fiscal Consolidation


13
II. OPPORTUNITIES AND OPTIONS FOR FISCAL CONSOLIDATION
CHAPTER 2.REVENUE AND TAX ADMINISTRATION
2.1. Scope for fiscal consolidation in Serbia lies primarily on the spending side, although revenue collection remains an important component of fiscal adjustment. Serbia already collects a high share of GDP as taxes, and given recent increases in tax rates, the scope for adjusting tax policy is limited. At the same time, various indicators, such as the Doing Business, Business Environment and Enterprise Performance Surveys (BEEPS), and the Serbia Taxpayers’ Survey3, show that the tax administration currently performs poorly; indeed, it is often cited as a major business climate constraint in Serbia.
2.2. The principal tax administration challenges are these: The high cost of compliance is a burden on taxpayers, particularly small businesses. The clarity of taxpayer obligations is often compromised by the exercise of discretion by the tax authorities. Formal audit plans emphasize audits of medium and large taxpayers, but it is mostly micro and small companies that are audited. More importantly, while the number of audits is growing, both hit rates and yields are declining. Large tax arrears are carried on the books without real prospects of recovery authority to write off uncollectible debt is not clear. Finally, the presence of a relatively large informal economy (an estimated 30 percent of GDP) is a problem: taxpayer services need to be strengthened to provide incentives for formalization; and widespread underreporting of sales turnover and cash transactions suggest that it will be important to improve enforcement against tax evasion. While improvements in tax administration take time and are not likely to generate considerable revenue increases in
the short term, improving the way the country collects its revenues could reduce the cost of tax compliance, improve the business climate, facilitate economic growth and revenue collection and enhance the effectiveness of current tax policies over the medium term.
2.3. This chapter focuses on changes to tax administration that, while keeping revenue collection sustainable, can help reduce the burden on businesses and support economic growth over the medium term. The chapter begins with a brief discussion of the recent revenue performance, followed by an analysis of the efficiency and effectiveness of tax administration today and where improvements are needed. The next section discusses strategies to combat the shadow economy, with insights from countries (see Annex 1). The chapter concludes with options for improving the efficiency and effectiveness of tax administration, reducing the compliance cost, and promoting growth over the medium term. The chapter shares the assessment and most of the recommendations on the tax administration with the recent IMF TA report, which goes into more details on organizational and implementation issues.
A. Revenue Performance
2.4. Serbia’s revenues amount to more than a third of GDP. The tax-to-GDP ratio was 34.2 percent in 2012, 33.4 percent in 2013, and 35.3 percent in 2014 (Figure 2.1). This is fairly high. The average tax-to-GDP ratio for the European Union (EU) was 40 percent in 2014.
3 This survey is carried out on behalf of GIZ Public Finance Management Project in Serbia.4 Khwaja, Munawer, and Indira Iyer. 2013. Revenue Potential, Tax Space, and Tax Gap. World Bank
Figure 2.1: Serbia TaxtoGDP Ratio, 20092014
Source: European Commission Services - 2011; Data: Taxation Trends in the EU (2013) – 2014; Estimates: AMECO database – Autumn 2013 forecast
Serbia2010
Serbia2011
45
40
35
30
25
20
15
10
5
0Serbia2012
Serbia2013
Serbia2014
Latvia2012
Lithuania 2012
Bulgaria2012
Romania2014
Poland2012
Slovenia2012
Hungary2012
Chile2014
Turkey2012
Mexico2012
Korea2012

14
II. OPPORTUNITIES AND OPTIONS FOR FISCAL CONSOLIDATION
Comparison with similar Eastern European countries finds that Serbia’s ratio is higher than those of Latvia, Lithuania, Bulgaria, Romania, Poland, and Slovenia. Only Hungary’s is higher. According to some estimates4, Serbia is punching above its weight in terms of tax effort, i.e., its tax collection effort is high relative to its income level (Table 2.1).
2.5. Unlike in the EU, in Serbia indirect taxes generate the bulk of revenues, and so there could be some scope for increasing the tax take from direct taxes. In the EU, taxes are split evenly, about a third each, between direct taxes, indirect taxes, and social security contributions. In Serbia, the ratio is 15.3 percent for direct taxes, 52.2 percent for indirect taxes, and 32.5 percent for social security contributions. As in many countries in the region, there is clearly a bias in favor of indirect taxes, mainly VAT, and labor taxes, because they are easier to collect. This has interesting implications: (1) There is potential to increase revenue offtake from the corporate income tax (CIT) through rate increases—but only after tax administration is improved. An estimate of CIT productivity puts it at 10 percent; the ECA region average of 16 percent5. An IMF paper6 points out that there are still several tax expenditures on account of CIT, which together added up to revenue foregone of as much as 67.7 percent of total CIT collected in 2011. (2) The high dependence on social security contributions leads to a high tax wedge, which is a disincentive to formal employment7 and thus reinforces informality.
2.6. The revenue impact of recent tax policy changes has been modest due to weak economic conditions and a lessthanoptimal tax administration. Despite tax policy
5 Tax at a Glance, Europe and Central Asia, World Bank, 2013.6 IMF Selected Issues Paper, Article IV Consultation, 2013. 7 The IMF estimates that in 2011, the overall tax wedge in manufacturing, defined as a difference between Total Labor Cost and the net wage, amounted to 41 percent of TLC or 70 percent of the net wage (IMF, 2013 Article IV). 8 Serbia went from 162nd to 165th in Doing Business rankings between 2014 and 2015.
Table 2.1: Serbia Tax Revenues 20082014 (Percent of GDP)
Tax revenues
Of which:
Personal income tax
Social security contributions
Corporate income tax
VAT
Excises
International trade taxes
Other tax revenues
2008
36.4
5.0
11.4
1.4
11.0
4.0
2.4
1.3
2009
34.7
4.6
11.1
1.4
11.0
4.0
2.4
1.3
2010
34.5
4.5
10.6
1.1
10.4
5.0
1.4
1.5
2011
33.2
4.4
10.2
1.1
10.0
5.0
1.1
1.3
2012
34.2
4.6
10.6
1.5
10.3
5.1
1.0
1.2
2013
33.4
4.0
10.8
1.6
9.8
5.3
0.8
1.1
2014
35.3
3.8
11.4
1.9
10.6
5.5
0.8
1.5
Source: Ministry of Finance (MoF) consolidated general government, Bank staff estimates.
measures implemented in recent years—VAT and CIT rates went up in 2012—the fiscal impact of these policy changes has been very modest, in part because of current economic conditions. Increases in VAT rates from 18 to 20 percent for the general rate and from 8 to 10 percent for basic goods and communal services in 2011 did not lead to the expected increase in VAT collections (see Table 1.1). Similarly, the increase in the CIT rate from 10 to 15 percent became effective on January 2013, but in 2013–14 the tax-to-GDP ratio held steady at about 34 percent of GDP. The modest tax revenue performance—coupled with problems of arrears management, and high compliance costs8 —has brought tax policy and tax administration to the fore.
2.7. The increase in tax collections as a share of GDP in 2014 is mainly attributable to intensified enforcement efforts by the tax authorities supported by the tax police. International experience shows that such efforts are unsustainable. A more strategic approach that targets heightening taxpayer compliance can over time deliver a more sustainable increase in tax revenue (see below for a discussion of risk management). Since the tax burden on the economy is already high, reducing the informal economy by encouraging voluntary compliance supported by enforcement would be a major step forward in increasing collection. The challenge is to create a tax regime that will support private investment and growth over the medium term, which in turn would help make the recent tax policy changes more effective.
B. Current Weaknesses in Tax Administration
2.8. How a tax system is administered affects both its yield and its efficiency. A modern tax administration has three major tasks: (i) facilitating compliance; (ii) enforcing compliance and reducing tax evasion, and (iii) improving

15
II. OPPORTUNITIES AND OPTIONS FOR FISCAL CONSOLIDATION
governance by keeping tax officials honest and tax administration equipped with the tools to carry out the first two tasks.
2.9. The clarity of taxpayer obligations is often compromised by too much discretion allowed to tax authorities. The main tax collection agencies are the Serbia Tax Administration (STA), the Social Insurance Funds, the Serbia Customs Administration, and the Tobacco Administration. Recent tax administration reforms have expanded e-filing and integrated collection of social insurance contributions, but formal interpretations are lacking, opinions might differ across tax offices, the binding rulings that are available are not recognized by auditors (adding to taxpayer uncertainty) and individualized service is only intermittently available from tax offices.
2.10. Tax authorities use the risk management system only to a limited extent. The modern approach to risk management is based on taxpayer segmentation to allow for identification of compliance behavior and risks by segment and to mitigate these risks. The responses of the tax administration are then focused on addressing the causes of noncompliant behavior and could take different modes, such as building taxpayer awareness, improving services to taxpayers, audit and enforcement. Compliance plans were drafted for 2011–14 using compliance risk management methodology but were not put into action. While the plans segment taxpayers by size and discuss risks in registration, reporting, filing, and payment, many activities of the tax authorities rely on factors other than risk. There is a disconnect in how audits are planned and carried out that undermines the use of risk criteria. Audit plans emphasize audits of medium and large taxpayers, but in 2013, 58 percent of audits were of micro companies (annual sales of up to RSD 8 million) and 24 percent of small companies (annual sales of RSD 8–100 million), with only 16 percent being audits of medium and large companies; the number of audits in 2013 was almost 26,000 thousand. Audits do not show high yields even for the most focused audits carried by the Large Taxpayer Office (LTO): only 59 percent generated additional revenues. Table 2.2 summarizes the data on VAT audits and audit yields. While the number of audits is growing, both hit rates and yields are declining. Ideally, the trend should be the opposite.
2.11. Institutionally the risk management function needs to be reinforced. While there is both a risk management unit and a Compliance Council, risk management has not been embedded into tax administration practices. The risk management unit is under-resourced. The Compliance Council was disbanded early in 2013, and although it was re-established later that year, it has held few meetings. Frequent ad hoc decisions—as reflected in the wide discrepancy between audits planned and audits ordered by headquarters (Table 2.3)—undermine tax collection
Table 2.2: VAT Audit Performance, 2011–13
Table 2.3: Planned vs Ordered Audits
Value of VAT refund claims(RSD billions )
Number of VAT refundclaims
Number of claims audited
Claims audited percent
Percent of audits thatresult in adjustments
Additional tax from audits(RSD billions)
Comprehensive – sectors
Comprehensive – emerging risks
VAT refund
Other audits (complaints)
Total
Percent of plan completed
2011
95.9
40,121
1,962
4.89
16.8
0.7
2013 2014
2012
114.5
43,500
2,175
5.00
13.4
1.4
2013
132.0
44,958
2,469
5.49
13.7
1.1
3,760
2,027
840
750
7,377
1,093
0
1,146
242
2,481
34
436
0
459
104
999
13
4,032
2,108
840
750
7,730
Source: Serbian Tax Administration.
Source: STA and IMF staff estimations.
Audit Type Planned PlannedOrders Issued
Orders Issued (as of Sept. 5)
2.12. A reevaluation of the efficiency and effectiveness of the current risk model is warranted. There is a need to focus audits on large taxpayers and also to reduce the number that produce no results. Tax administration should continuously monitor both audit hit rates and yields and adjust the risk selection criteria as needed. The way audits are currently conducted does not allow for a tight focus on risky taxpayers. VAT refund audits seem to
efforts. A recent example is the decision to cancel audits in order to focus on inspections of cash registers, the revenue yields of which are likely to be negligible.

16
II. OPPORTUNITIES AND OPTIONS FOR FISCAL CONSOLIDATION
result in negligible additional revenues and a low strike rate, suggest the need to refine the VAT audit selection criteria. An enhancement of data exchange and analysis capabilities with third-party sources (such as banks, property registry, customs, police, etc.) may be necessary to make risk management more effective.
2.13. Many of the improvements needed in the tax administration hinge on availability of a stateoftheart information technology system, for example, making the risk management system more effective and improving both taxpayer services and communications with taxpayers. A re-evaluation of the IT strategy and a thorough re-assessment of the current IT hardware and software capabilities of the tax administration are recommended, as are upgrades as needed to the current IT system and a new IT strategy.
2.14. Tax arrears are an issue despite the recent amnesty initiative. The Serbian authorities attempted to resolve a large backlog of tax arrears by introducing an amnesty in 2012. The amnesty allowed qualified taxpayers to freeze their tax debt as of November 2012 for two years. Provided current liabilities were met during that time, all interests attributed to and included in the debt would be written off, with the remaining principal payable in monthly instalments over two years. Interest and principal were not considered tax arrears unless a taxpayer had failed to comply with the terms. Tax amnesty programs, by providing benefits to delinquent taxpayers often to the disadvantage of those who pay their taxes on time, often create a moral hazard problem rather than addressing the underlying issues of enforcement and arrears management. Serbia is likely proving the point.
2.15. Authority to write off uncollectible tax debt is unclear in Serbia, resulting in large tax arrears being carried on the books without prospects of recovery (Table 2.4). Many are amounts that are past the statutory collections period; others belong to corporate entities that have been liquidated, are bankrupt, or are being privatized (in which case the law does not allow the tax authorities to pursue recovery). While there was a considerable drop in tax arrears between 2012 and 2013, it is mainly attributed to the amnesty and is likely to be reversed: data on arrears as of January 1, 2015 suggests that they are already increasing (now at RSD 711 bn). Expectations of future tax amnesties may also be undermining efforts to both collect arrears and enforce current tax obligations.
2.16. Many of the issues discussed are rooted in inefficient tax administration. To improve tax compliance, Serbia would need a taxpayer-service-oriented administration that encourages compliance and manages risks. For that to happen, tax administration needs to be more efficient.
2.17. Serbia’s tax administration is underresourced. A simple comparison of cost per employee, calculated by dividing the administrative budget by the number of employees, shows that Serbia spends less per employee than EU countries, including Romania and Hungary (Figure 2.2). While some of the difference may be attributed to job market conditions, a considerable portion is likely to be under-investment in analytical capacity, IT, and other essential tools of modern tax administration. The organization structure needs to change: There is a clear need for more auditors and a stronger LTO rather than the current extended network of tax inspectors throughout the country.
Table 2.4: Tax Arrears, 201214
Total gross arrears as of December 31 of the respective fiscal year (in billion RSD)
Total uncollectable arrears as of December 31 of respective fiscal year (in billion RSD)
Arrears as a share in tax collections
2012
1,025
574
79%
2013
626
420
46%
2014
711
475
49%
Source: Serbian Tax Administration.
Source: IOTA.
0
10,000
Serbia
RomaniaIre
land
Hungary
The Netherlands
Sweden
Denmark
20,000
30,000
40,000
50,000
60,000
70,000
2010 2011 2012
Figure 2.2: Average Cost, Tax Administration per Employee(Euros)

17
II. OPPORTUNITIES AND OPTIONS FOR FISCAL CONSOLIDATION
Source: IOTA.
0.0
100.0
Serbia
RomaniaIre
land
Hungary
The Netherlands
Sweden
Denmark
200.0
300.0
400.0
500.0
2010 2011 2012
600.0
700.0
800.0
900.0
1000.0
Figure 2.3: Taxpayers per Tax Administration(Employee)
Source: BEEPS 2013.
Political in
stabilit
y
Tax rates
Corruptio
n
Practices o
f inform
al secto
r
Access
to finance
Inadequately educated labor
Tax admist
ration
Courts
Customs a
nd trade re
gulations
Crime, th
eft and diso
rder0
5
10
15
20
25
30
35
Figure 2.4: Serbia: Top Ten Constraints for Businesses (Percent Cited)
2.18. Under resourcing of the tax administration comes at a price: creating incentives for corruption. Serbia’s tax administration lags behind most of its peers in terms of efficiency. It relies on a large number of staff, who are underpaid. Figure 2.3 shows that the number of taxpayers per tax employee is lower than in all comparator countries. This combined with the low pay and considerable discretion creates opportunities for corruption. Clearly, such a situation negatively impacts the ability of the tax administration to serve taxpayers as well as applying sophisticated risk management.
C. Tax Administration as a Business Constraint
2.19. Serbia’s tax administration has a significant adverse impact on the investment climate and the formal economy. Indicators from Doing Business, Business Enterprise Surveys, and the Serbia Taxpayers’ Survey, show that the tax administration currently makes it hard rather than easy to carry on business. In fact, tax rates and tax administration are seen as among the top obstacles to doing business (Figures 2.4 and 2.5). This can create powerful negative incentives to operate in the formal economy and could be contributing to the high level of informality in Serbia. High compliance burdens are usually associated with a higher incidence of informality (Schneider and Buehn 2009).
2.20. Tax administration is also cited as a serious investment constraint. Serbia ranks very poorly on the World Bank Group’s Doing Business (2015): 165th out of 189 economies. Its scores on the sub-indicator Time to Comply (279 hours), and Number of Payments (67)9 are far worse than the ECA average and significantly poorer than the OECD average. Both indicators are dependent on the quality of tax administration. Improving tax administration should also have a positive impact on Serbia’s Doing Business ranking.
9 From July 2014, almost all tax returns were supposed to have been filed electroni-cally. Depending on the extent of successful compliance with this initiative, this may impact the Payments sub-indicator in the Doing Business rating. According to the Doing Business methodology, if the majority of returns are filed electronically, the number of payments is taken as one (even if they are made several times in a year), in which case the 2016 DB report, which will reflect the 2014 situation, could show an improvement in Serbia’s performance.
2.21. The 2013 BEEPS (Business Environment and Enterprise Surveys) shows there has been some improvement in Serbia since the 2008 survey in terms of perceptions of firms about the tax administration and tax rates. However, on both counts, Serbia is still worse than the ECA average. In particular, on tax rates, as many as 25.5 percent of firms said it is a major constraint to doing business, and in respect of tax administration, 17 percent found it objectionable.

18
II. OPPORTUNITIES AND OPTIONS FOR FISCAL CONSOLIDATION
Source: BEEPS 2013.
0.0 5.0 10.0 15.0 20.0 25.0 30.0
Percent of firmsidentifying tax administrattionas a major constraint
Percent of firmsidentifying tax rates as a major constraint
ECA Serbia
Figure 2.5: How Firms Perceive Tax Administration
2.22. The compliance burden in Serbia is disproportionally heavy for smaller businesses. When disaggregated by firm size, the BEEPS data show that small and medium firms are far more negatively impacted by both tax administration and tax rates than large firms, which gives SMEs incentives to remain informal. The Serbian Taxpayer Survey10 (STS) of May 2014 also points to the fact that micro firms face significantly higher tax compliance costs relative to medium firms: the percentage of staff time spent on tax matters is 10 percentage points higher than in medium firms, and micro firms spend almost 10 times as much in terms of their sales on external tax advisors (whether or not the tax advisors also handle accounting tasks).
2.23. Underreporting of sales turnover and cash transactions fuel the cycle of informality. Tables 2.5 and 2.6, reproduced from the STS, are revealing. A significant proportion of surveyed firms admit to underreporting sales and paying wages in cash. And a large number of transactions seem to be in cash.
10 STS is carried out on behalf of GIZ Public Finance Management Project in Serbia and covers a representative sample of micro firms (1-4 employees), small firms (5-19 employees) and medium firms (20–99 employees) and asks a broad set of questions related to taxation.
Table 2.5: Tax Evasion by Mode and Questioning Technique (pooled sample) (Percent)
Table 2.6: Cash payments Made and Received, by Firm Size(Percent)
Table 2.7: Factors that Complicate Paying Taxes, by Firm Size, (Percent Citing)
Tax evasion: Underreporting of sales
-at least 10% of total sales
Tax evasion: Paying wages in cash
- at least 10% of wages
- at least 30% of wages
Cash payments made for own purchases (% of total payments made)
Cash payments received from customers (% of total payments received)
How STA deals with taxpayers
Time consumed in making multiple payments
Complexity of tax laws
31.7(12.5)
51.1(29.8)
21.7
14.1
25.9
24.0(10.3)
37.6(20.4)
17.8
20.0
22.6
22.5(6.3)
42.0(17.7)
15.5
16.6
26.2
29.0(11.4)
47.2(26.5)
19.4
15.6
24.0
Micro Firms Small Firms Medium Firms All Firms
Micro Firms Small Firms Medium Firms All Firms
Crosswisemodel
28.1
25.8
18.8
Source: STS.
Source: STS.Notes: Averages only for firms reporting positive numbers (i.e., > 0%); figures in parenthesis also include firms that do not use / receive cash in transactions (i.e., 0%-100%).
Source: STS.Notes: Table displays the three most frequently chosen options.
2.24. The findings highlighted in Table 2.7 reveal that tax administration has a significant interest in improving taxpayer services. While the audit and enforcement discussed above constitute a “stick” to prevent evasion, service to taxpayers is a “carrot” to reward compliant taxpayers.
Benchmark
23.1
25.0
4.3

19
II. OPPORTUNITIES AND OPTIONS FOR FISCAL CONSOLIDATION
2.25. The results of the STS, Doing Business, and Enterprise Survey reports all underscore an urgent need for review of tax administration efficiency and effectiveness. Clearly, there are opportunities to improve tax administration, in terms of strengthening audit capacities, streamlining taxpayer services, and inculcating a client orientation in tax officials. A more responsive administration would provide positive incentives to comply with the tax regime and become formal, although that alone may not be enough to tackle the broad issue of the shadow economy and tax noncompliance.
2.26. Specific tax strategies are needed to combat the shadow economy. While positive measures such as improving taxpayer services and facilitating registration, filing, and payment of taxes helps remove barriers to formalization, also needed to deal with this issue are measures related to better enforcement and prevention of tax evasion specifically in the shadow economy, and disincentives for conducting business in cash. Some strategies to address this issue are outlined next.
D. Tax Strategies to Combat Serbia’s Shadow Economy
2.27. Serbia’s shadow economy was estimated at 30 percent of GDP in 2010, according to the U.S. Agency for International Development (USAID) and the Foundation for the Advancement of Economics (FREN). Among fiscal and administrative stimuli11 to the shadow economy are the relatively high fiscal burden on labor; complicated, costly, and opaque tax procedures; a poorly organized, understaffed, and under-equipped tax administration; and high corruption and poor quality of public services.
2.28. The high administrative burden of doing business, when operating formally; the low quality of the regulatory environment; and high corruption all have a bearing on the extent of the shadow economy. For example, on the Paying Taxes indicator in the Doing Business 2015 report—a composite index measuring the time spent to prepare returns and pay taxes; number of tax payments; and tax liabilities as a percent of profits—Serbia ranks at a 165th out of 189 economies. In terms of regulatory quality (cf. the World Governance Indicators), Serbia scored -0.7 in 2013 on a scale of -2.5 (weak) to 2.5 (strong). The decision to operate informally can also be affected by widespread corruption (Serbia ranked 86 in 2011 by Transparency International) and low tax morale.
2.29. To be successful, efforts to minimize the informal economy should use both “carrots” and “sticks” and be sustained for a considerable period. A review of international experience shows that while it is important to have clear “stick” strategies based on greater enforcement, ‘carrots’ to improve incentives to comply are also important. Review of the Serbian experience shows that, beyond compliance enforcement efforts directed at the informal economy, reducing the high burden of tax compliance will be important to the tax reform agenda. To yield meaningful results, these efforts will need to be sustained over many years.
2.30. International experience shows that high expectations of a major revenue impact of reducing the shadow economy have not been realized. Most firms in the shadow economy are small and micro; even when they become formal and begin to comply with tax regulations, revenue gains may not be very large, at least in the short term. As formalized firms grow, however, the amount of revenue they contribute over time can be substantial. Formal firms have more opportunity for growth than informal firms, due to such factors as greater access to formal sources of finance. Nevertheless, Ministry of Finance estimates that additional annual revenues could be around 0.25 percent of GDP.
2.31. A useful way for Serbia to tackle its large informal sector is a twopronged strategy: (a) Measures to more effectively prevent tax evasion, and (b) steps to curb cash transactions and incentivize cashless transactions. Many countries have grappled with how to limit the informal economy and raise more taxes from it. A detailed discussion of strategies and the diversity of country experiences is presented in Annex 1.
Measures to More Effectively Prevent Tax Evasion
2.32. One consequence of having a large shadow economy is the incentive to underreport sales and economic activity. As technology has changed how cash sales are recorded, it has also thoroughly changed the techniques used for sales suppression, also known as skimming. Skimming has always existed in one form or another, among other reasons to evade taxes. Manual skimming options were fairly simple for a business owner: (a) Failing to ring cash sales into the cash register with the business owner keeping the cash, or (b) tampering with the electronic cash register, to, e.g., divert sales to a second cash register that was kept off the books. This is most common in small and medium sized businesses, which usually have fewer internal controls and are often closely-held. There is a high incidence of cash sales in 11 The Shadow Economy in Serbia: New Findings and Recommendations for
Reform, USAID, March 2013

20
II. OPPORTUNITIES AND OPTIONS FOR FISCAL CONSOLIDATION
12 Electronic Sales Suppression; OECD 2013, p.2313 Ibid. p.24
Serbia, providing possibilities for skimming. In some cases, the businesses involved in skimming may keep two sets of books and records, one for the tax authorities and the other for the owner, who may want to show the real sales to a potential buyer.
2.33. As technology has allowed automation of sales records, it has also enabled automated skimming. The first generation suppression technology was Phantom-ware, a hidden pre-installed option embedded within the operating system of a modern electronic cash register (ECR). The second generation is called Zappers, programming options added to ECRs or point of sale (POS) networks. They are carried on memory sticks or removable CDs or can be accessed through an Internet link. Remote skimming of cash transactions is now possible without the knowledge or participation of the cashier who physically rings up the sale. This attribute of Zappers allows skimming fraud to migrate beyond traditional mom-and-pop stores. Zappers allow owners to place employees at the cash register, check their performance, but then remotely skim sales to cheat the tax authorities.
2.34. Tax authorities have a wide range of responses in tackling electronic sales suppression. Those can be categorized as a compliance-oriented approach, an audit approach, and a fiscal till approach. Whatever the dominant line of response chosen, the measures need to be part of a strategic approach that covers: (a) Identification of risks via special audits targeted to specific sectors. Sample audits could help identify which retail and service sectors are most at risk. Many countries focus on restaurants but high risks have also been identified in small supermarket chains, retail pharmacies, hairdressers, and other service providers.12 (b) An understanding of the nature of the POS business market, POS suppliers, both domestic and international, and their relative shares of the market.13(c) Clear and consistent legislation, in line with the strategic intent to combat electronic sales suppression, including legislation criminalizing the supply, possession, or use of electronic sales suppression software.
Steps to Curb Cash Transactions and Incentivize Cashless Transactions
2.35. The use of cash makes it possible to conceal real incomes and makes it almost impossible for tax enforcement and state statistics agencies to trace such transactions. Tracking cash transactions
and stimulating use of cashless operations could reduce the size of the informal economy and push up tax collections. Countries in Europe, America, and Asia gave demonstrated the efficiency of introducing non-cash payments—electronic, banking channels, or card payments—to help combat the shadow economy.
2.36. Three steps can help reduce cash transactions: (a) tax policies and administrative efforts to boost cashless payments, such as building the financial infrastructure and policies to facilitate cashless bank payments; (b) collection and use of third party information for tax purposes; and (c) information exchanges between financial intelligence units and tax authorities regarding cash transactions.
E. Conclusions and Recommendations
2.37. Serbia has few tax policy options. Its tax policy changes in recent years—VAT and CIT rates went up in 2012—had only modest impact on total revenues. While it can in principle further stimulate the formal economy by reducing the high labor tax rates, the revenue impact could be painful and would need to be carefully assessed beforehand by, e.g., investigating the possibility of offsetting the resulting revenue shortfalls from labor taxes by higher rates for less distortive direct taxes. However, the modest revenue gains from recent tax policy changes suggest that the tax regime is complicated by the shadow economy and weaknesses in the tax administration. This can be seen in the negligible yield of recent increases in tax rates, particularly the large increase in the CIT rate from 10 to 15 per cent.
2.38. Improvements in tax administration are essential for sustainable revenue collection and a better investment climate over the medium term. Both the quality of enforcement on the one hand, and taxpayer services on the other need rethinking to change the culture of tax administration to a client-oriented system. There is an on-going effort by the authorities to complete the Tax Administration Transformation Program, 2015-19, which is a structural benchmark under the IMF SBA. The program aims to address most of the areas of concern that the Review raises: (i) strengthen the tax administration’s governance, (ii) streamline organizational structures of headquarters and field offices, including by reallocating employees to facilitate compliance efforts, (iii) phase in a modern compliance risk management approach, (iv) strengthen arrears management, including write off procedures, (v) modernize information technology systems and business processes, and (vii) improve coordination and information exchange with other government agencies.

21
II. OPPORTUNITIES AND OPTIONS FOR FISCAL CONSOLIDATION
2.39. The key recommendations for modernization of tax administration are as follows: •Undertake comprehensive reform of the STA risk-
management system. The efficiency and effectiveness of the current risk model needs to be re-assessed. Not only does the number of audits need to be reduced, but audits that are conducted need to concentrate on high-yield risky cases. Better data exchange and enhancing relationships with banks and other third-party sources may be necessary to make risk management more effective. The tax administration needs to be downsized and restructured and the staff skills mix optimized.
• Bettermanagetaxarrears.Whiletherewasaconsiderabledrop in tax arrears in 2013, this is mainly attributable to the amnesty and is likely to be reversed: the latest data already suggests that arrears are increasing. Expectations of future amnesties may also be undermining efforts to both collect arrears and to enforce current tax obligations.
• UpdateboththeITsystemandtheITstrategy:Manyof the tax administration improvements needed hinge on Serbia having a state-of-the-art IT system. It is recommended that the current system be assessed and upgraded, if needed, to support new approaches to maximizing revenue and minimizing avoidance.
• Lower compliance costs by beingmore responsive totaxpayers and reducing the uncertainty in interpretation of tax statutes and precedents. Responses to taxpayer questions should be consistent, and being helped will improve taxpayer morale.
• Combat the informal economy through reducingbarriers to formalization, improving methods to combat tax evasion, and providing incentives to reduce cash transactions.


23
II. OPPORTUNITIES AND OPTIONS FOR FISCAL CONSOLIDATION
CHAPTER 3.WAGE BILL AND STAFFING IN PUBLIC ADMINISTRATION
A. Introduction
3.1. The unaffordable public wage bill is a pressing problem. The general government wage bill grew significantly in the early 2000s, from 9.1 percent of GDP in 2002 to 10.7 percent in 2008, and there is little oversight or controls on pay or staffing levels. From 2009 to 2014 the wage bill was flat at 10 to 10.5 percent of GDP, but with revenues drying up and other spending rising, it has become an unsustainable fiscal burden. In response to the need for fiscal consolidation, in 2014 the government took extraordinary measures to contain growth of the wage bill through both wage and employment cuts. These near-term measures, however, do not address the serious structural issues in the design and management of the public wage system, such as a highly fragmented regulatory environment governing public sector pay, lack of accountability, and the absence of a centralized payroll database. Addressing these weaknesses will be important not only from the perspective of sustainable control over the fiscal cost of the wage bill but also to improve the efficiency and quality of public service, as discussed, for example, in the chapters on health and education.
3.2. The government has recognized these structural challenges and has a plan to address them that incorporates both wage system reform and rightsizing of the public sector. Public administration reform was a significant part of the Prime Minister’s Inaugural Speech in 2014, the main government agenda.14 It stated as its ultimate goal “replacement of such an inefficient, non-transparent and unfair [public wage] system of numerous coefficients and pay scales by a unique system.” It also committed the government to right-sizing the public sector to make it more efficient. This initiative is being led by the Deputy Prime Minister and the Minister of Public Administration and Local Self-Government with support from the Minister of Finance.
3.3. The following sections analyze the Serbian wage bill from a regional context and discuss the challenges arising from both pay and establishment policies. The chapter then discusses reforms underway both with regard to pay and right-sizing, outlining design elements that are not yet specified. The final section provides a brief conclusion and recommendations for strengthening the ongoing reforms.
B. The Need for Wage Reform and Rightsizing
The Fiscal Burden of Public Sector Wages
3.4. To deliver sustainable fiscal consolidation, it is necessary to restrain mandatory spending, which, for Serbia, centers on pensions, which in 2013 accounted for almost 30 percent of total general government spending, and wages, accounting for 23 percent. The government’s fiscal consolidation program for 2015–17 targeted reductions in mandatory spending on pensions and wages account for about two-thirds of projected savings. Reductions in public sector wages announced in 2014 and a nominal freeze for 2015–17 are projected to save about 1.2 percent of GDP over the three years. Another 1.2 percentage points (pp) of GDP in savings is targeted from right-sizing the public sector to bring the wage bill to just over half of the targeted total savings of 4.7 pp of GDP through 2017.15 The Government’s new wage bill law, which will restructure the public pay system, is expected to be fiscally-neutral in the short-term.
3.5. In comparison to neighboring countries, Serbia’s public wage bill is relatively high. In 2013, its wage bill-to-GDP ratio was 10.1 percent; the regional average was 8.4 percent (see Figure 3.1). International comparisons, however, could have shortcomings, such as differences in how the public wage bill is defined and how different accounting systems classify payments to contract workers under goods and services rather than as spending on wages. Beyond simple ratios, fiscal affordability is a more important yardstick with which to evaluate whether the wage bill is affordable. Figure 3.2 illustrates that in real terms the wage bill grew significantly faster than GDP in the early 2000s. As the fiscal deficit has increased and government debt-to-GDP has risen markedly, fiscal consolidation has become more urgent. As discussed below, there is also a need to address the underlying structural pay and right-sizing issues to ensure that near-term consolidation is sustainable and improve public administration.
14 The Government’s Public Administration Reform (PAR) Strategy was adopted in January 2014. Its objective is to strengthen public administration in accordance with the EU principles of good governance and to improve the quality of services delivered to citizens and businesses. It will focus on decentralization, depolitization, professionalization, rationalization and modernization.
15 Ministry of Finance and IMF staff estimates in Table 6 of IMF (2015), Staff Report for the 2014 Article IV Consultation and Request for Stand-By Arrangement.

24
II. OPPORTUNITIES AND OPTIONS FOR FISCAL CONSOLIDATION
Figure 3.1: The Public Wage Bill, Regional Comparison, 2013(Percent of GDP)
Figure 3.2: Public Wage Bill Spending in Serbia(Real Growth Index, 2001=100)
Figure 3.3: Average Wage, Public and Private, 2002–2014(Serbian Dinars)
Arm
enia
Kaza
khst
an
Geor
gia
Alba
nia
Azer
baija
n
Tajik
ista
n
Slov
ak R
epub
lic
Czec
h Re
publ
ic
FYR
Mac
edon
ia
Rom
ania
Turk
ey
Koso
vo
Latv
ia
Mol
dova
Bulg
aria
Russ
ian
Fede
ratio
n
Hung
ary
Lith
uani
a
Pola
nd
Kyrg
yz R
epub
lic
Bela
rus
Serb
ia
Esto
nia
Ukra
ine
Croa
tia
Bosn
ia &
Her
zego
vina
Mon
tene
gro
Slov
enia
14
12
10
8
6
4
2
0
Source: World Bank, MoF.
Source: World Bank, MoF. Source: Statistical Office.
100
120
140
160
180
200
220
2002
2003
2004
2005
2006
2007
2009
2008
2010
2011
2012
GDP Total Expenditure Wage Expenditure
0
10,000
20,000
30,000
40,000
50,000
60,000
2002
2003
2004
2005
2006
2007
2009
2008
2010
2011
2012
2013
2014
Private sector Public sector

25
II. OPPORTUNITIES AND OPTIONS FOR FISCAL CONSOLIDATION
Table 3.1: The Importance of the Wage Bill as a Source of Fiscal Consolidation Savings(Percent of GDP unless Otherwise Indicated)
Source: IMF, World Bank staff calculations.
Wage Levels
3.6. Average wages are higher in the public than in the private sector and the differential seems to have been widening (Figure 3.3). This may in part reflect the influence and leverage trade unions have in wage negotiations in Serbia; in the past they have been able to negotiate higher wages. However, a comparison of average wages between the private and public sectors should be taken with caution; it does not control for differences in job characteristics, such as education and years of experience. A more appropriate comparison would take the differences into account. However, a recent Labor Force Survey for Serbia, where these differences are accounted for,16 also suggests public sector wage premia in some parts of the public sector, particularly for lower-skill jobs, even after accounting for the recent 10 percent cuts in wages (see Annex 2). The survey shows that the chances that public employees will have a higher (above the median) income are three times greater than that in the private sector.
Staffing Levels
3.7. Only recently was the Government able to determine the true size of the public workforce. In September 2013 as fiscal pressures grew, the MoF required each public entity to submit detailed employee pay characteristics for each individual every month to get public funds released. This allowed the MoF to produce its first comprehensive Register of Public Employees since 2003. It showed that the public sector was about 20 percent larger than estimated (Table 3.2).
16 Comparison of salaries was done at the ISCO (International Standard Classification of Occupations) levels between: employees in registered private sector; employees in public sector (including state and local governments) and public administration (public sector with exclusion of employees in public enterprises)
Av. 2006–2008 Av. 2012–2014 ChangeShare of Total Spending
2012–14, Percent
Revenue 42.1 39.1 -3.0Taxes 36.7 34.3 -2.4Non-tax revenue 5.0 4.6 -0.4
Expenditure (including amortization of activated guarantees) 44.1 45.6 1.5 100Current expenditure, of which: 39.4 42.1 2.7 92
Wages and salaries 10.2 10.2 0.0 22Goods and services 7.8 7.7 -0.1 17Interest 1.0 2.4 1.5 5Subsidies 2.7 3.8 1.1 8Transfers, of which: 17.6 17.9 0.3 39
Pensions 11.4 13.1 1.7 29Other transfers 6.2 4.9 -1.4 11
Other current expenditures 0.0 0.0 0.0 0Capital expenditure 4.2 2.7 -1.5 6Net lending 0.6 0.4 -0.2 1Amortization of activated guarantees 0.0 0.4 0.4 1Fiscal balance (incl. amortization of called guarantees) -2.0 -6.5 -4.5

26
II. OPPORTUNITIES AND OPTIONS FOR FISCAL CONSOLIDATION
Table 3.2: Categories of Public Employment, 2013
Figure 3.4: Serbia: Primary Education Employees vs. Pupils (2008/9=100)
Source: Government Employee Register.
Source: Government Employee Register.
3.8. There is evidence of significant pockets of overstaffing in the public sector. Currently, the public sector comprises a large number of agencies, organizations, and government bodies and in practice a number of bodies in the same policy area have overlapping responsibilities and tasks. As a result, there appear to be significant inefficiencies—and high administrative costs.
3.9. In education, for example, although in recent years there have been fewer pupils, there are now more teachers (Figure 3.4). This finding, coupled with the fact that Serbia has the lowest teacher-to-pupil ration in the
Balkans, indicates overstaffing (see the Education chapter in this report). Similarly, the health sector has an overage of nonmedical staff, and while measures have been initiated to reduce the administrator-to-professional ratio, as yet they have had little impact. There is also evidence of overstaffing among the police and security forces, though data access restrictions make it hard to estimate an accurate number. Finally, many public agencies and public sector enterprises depend on the budget but are not subject to public sector salary rules or establishment control. Their freedom in wage-setting and staffing needs to be accompanied by corresponding accountability.
96
98
100
102
104
106
108
2008/09 2009/10 2010/11 2011/12 2012/13
Employees (Left Axis) Pupils (Right Axis)
86
88
90
92
94
96
98
100
102
Category Permanent staff Term staff Temporary staff TotalCivil servants 29,102 2,861 4,090 36,053Education 117,508 32,164 11,770 161,442Health 124,416 8,675 4,500 137,591Ministry of Interior 46,327 0 687 47,014Ministry of Defense 22,469 9,727 857 33,053Pension Insurance Fund 3,383 295 19 3,697National Employment Service 1,831 211 0 2,042Judiciary 15,109 1,590 2,982 19,681Public agencies 1,754 117 268 2,139Public enterprises 55,553 1,086 4,402 61,041Local government 130,413 11,724 20,823 162,960Other 97,135 4,550 12,602 114,287TOTAL Headcount 645,000 73,000 63,000 781,000

27
II. OPPORTUNITIES AND OPTIONS FOR FISCAL CONSOLIDATION
C. Lack of Control and Oversight
3.10. Serbia lacks control over both pay and establishment policies. Structural weaknesses in wage control systems have resulted in more than 2,200 job titles, 71 different elements of remuneration, 5 different base salaries, 900 different job coefficients, 19 laws, and a plethora of by-laws that regulate salary levels in 11,000 budget institutions. Although the 2005 Law on Pay for Civil Servants and Employees (CSL) instituted a centralized single pay-regime for all civil service employees, in fact it applies only to about 5 percent of total public employment. Pay policies and personnel management for other sectors and agencies were either legislated separately or delegated to public entities and enacted through a series of regulations, such as annual by-laws that set out different base salaries and coefficients for different sectors. For example, education, culture, all insurance funds, and health employees are regulated by the Law on Salaries in State Organs and Public Services and supporting decrees, and there is separate legislation for local governments, judges, public agencies, and public enterprises.
3.11. There is a lack of transparency about the wages of certain government employees. Several institutions, such as the Ministries of Defense and Interior, do not disclose the regulations governing their pay system. Institutions and organizations also use different coefficients and base salaries for similar positions. Allowances and benefits have proliferated without any centralized oversight. For these reasons, it is challenging and time-consuming to compare the remuneration of similar public jobs.
3.12. As noted above, public agencies and public enterprises have considerable autonomy in hiring and setting pay that is not balanced by accountability for performance. The boards of these agencies may make personnel and pay decisions without requiring clearance from the MoF or another central oversight agency. These agencies have taken advantage of their autonomy to create new job titles, bonuses, and allowances as extra compensation for their staff. Anecdotal evidence suggests that this autonomy has been greatly abused through patronage-based hiring of staff and salaries often considerably higher than similar jobs regulated by the CSL.
3.13. This fragmentation has contributed to the growth of the wage bill because groups of public employees are able to lobby for changes to their particular laws and decrees to increase base pay, change coefficients, or receive additional allowances. These piecemeal changes over time have caused a steady expansion of the total wage bill. There are no
statutory requirements for reporting on the number of personnel employed or pay policies by any public entity. While notionally the MoF manages the aggregate wage bill ceiling per entity, this ceiling is not set top-down based on available resources but is regularly adjusted upward in response to employee lobbying.
3.14. These structural weaknesses have obstructed past MoF attempts to reduce the wage bill as different parts of the public sector continued ad hoc hiring and pay increases. They have also resulted in considerable pay inequity: similar public jobs are paid different wages with apparently little justification based on performance or labor market competitiveness.
3.15. In principle, Serbia has a welldeveloped system for controlling central staffing levels, but in practice there has not been sufficient oversight. Every central government budget organization, when it is created, is required to have an act of systematization setting out the number of positions and the title, grade, and responsibilities for each position. Each year, as part of the annual budget process, each central government budget organization fills out a personnel plan that states the number of positions it would like to have funded (existing and new) along with the title, grade, and estimated salary for each. This process generally proceeds from the bottom up. For example, school directors send their proposed staffing plans to the regional office of the Ministry of Education, which passes them on to the Ministry’s central office, which sends them to the MoF. In principle, the MoF evaluates each plan to see if it is justified given budget constraints and government priorities. Before the hiring freeze, this oversight role apparently was not executed. In normal years (when there are no hiring restrictions) reportedly powerful ministries and unions were influential in dictating changes in authorized staffing levels.
3.16. The budgeting process does not set a limit on the number of staff within each government body. Serbia’s budget law requires that a consolidated personnel plan be enacted within 30 days and that its salary estimates correspond to the amount allocated in the budget (Article 156), but does not dictate the number of staff on the government payroll. Individual ministries give the Treasury’s payroll department information on each staff person (name, account number, and amount due, etc.) and the payroll department makes the corresponding transfer from the ministry wage bill account to the individual staff member. Each ministry can instruct the payroll department to add staff to the payroll, whether or not the position is in the personnel plan.

28
II. OPPORTUNITIES AND OPTIONS FOR FISCAL CONSOLIDATION
D. Government Reforms Underway
3.17. Responding to the severe fiscal pressures, the government has taken significant measures to reduce spending on wages in recent years: a hiring freeze was imposed (for each 5 employees who leave, only 1 may be replaced); indexation to inflation was scaled down; a solidarity tax was levied on all public employees earning more than 60,000 dinars; a ceiling on maximum public salaries was legislated; and the number of contract employees a ministry or agency could hire was limited to 10 percent of total staff.17 An additional across-the-board 10 percent pay cut was imposed in November 2014 for all general government employees (thus replacing a solidarity tax), and in December the Budget System Law was modified to suspend indexation of public wages in years when the share of general government salaries (excluding severance) is expected to exceed 7 percent of GDP. These immediate measures, while delivering useful fiscal savings, do not address the structural weaknesses
17 In 2009, the government implemented similar policies: 10 percent cut for wages above 40,000 dinars, 15 percent cut for wages above 100,000 dinars, and a maximum ceiling for public wages (6 times the national average).
noted. The government has therefore embarked on a much more comprehensive reform of public pay structure and staffing policies.
Pay Reforms
3.18. The Serbian authorities have chosen to reform the public pay structure by centralizing several subsystems and introducing more centralized controls. The intent is to achieve a balance between more radical reforms and the current situation of high fragmentation and low accountability. It will also remove many pay inequities to uphold the principle of equal pay for equal work and bring greater transparency to the public pay structure by having one base salary and consolidating allowances into base pay. The Ministry of Public Administration is in charge of this reform, which is scheduled to start with adoption of the New Law on Salaries in Public Administration in the second half of 2015 (the New Wage Law).
The authorities have embarked on significant reforms in the pay structure without a robust centralized public employee pay and employment dataset. Serbia’s current payroll system in Serbia is decentralized and fragmented. Although there are multiple payroll systems, there is no centralized payroll reporting infrastructure which makes it very difficult to estimate the fiscal impact of the reforms without credible headcount and remuneration levels.
To address this, in September 2013 the Ministry of Finance required all public institutions to report on the number, characteristics, and elements of pay for all their employees. While this database, the Public Employee Register, should in principle provide robust data, it has several shortcomings:
• Full compliance has not been achieved despite the threat (so far unrealized) of sanctions. • It contains data entry errors and incorrect figures. • It has a high transaction cost, since the public institutions must fill out all data for every employee.
The authorities are aware of these shortcomings but have as yet put in place no measures to address them. In the short term, it is recommended that the government do so by minimizing the possibilities for errors in data entry, simplifying the interface, and improving storage capacity to minimize the administrative burden.a In the medium term, the government should establish a centralized human resource management information system that can generate accurate payroll data on demand. This lack of data severely constrains the evidence base to design and implement the reforms and it is urgent that for the Government to address this situation.
a Finalization and validation of the Public Employee Register is a structural benchmark under the IMF program with a target date of June 2015.
Box 3.1: Need for Better Personnel Data
3.19. To improve transparency, the authorities have decided to consolidate all 16 different base salaries into a single base salary for the entire public sector (there is resistance, however, from the police and military). This reform reflects good practice and will allow base pay
to be differentiated only by the coefficients for different job titles. It will also allow the authorities to have better controls to monitor wage bill growth, since indexation adjustments will be standardized through the single base pay. The authorities also stated that the number of allowances and benefits would be reduced to no more than 12. Some of the allowances will be eliminated and others consolidated into the base coefficients.

29
II. OPPORTUNITIES AND OPTIONS FOR FISCAL CONSOLIDATION
Figure 3.5: Pay Subsystems in the New Wage Law
Figure 3.6: What is Needed to Estimate the Fiscal Impact of New Wage Law
3.20. There would be six different pay systems under the new law, each with its own pay and grading system (see Figure 3.5). This will add current employees to those governed by the civil service law and create a new pay scheme for public services, among them education, health, social protection, culture, tourism, and sport. Local government, police, and defense, and members of parliament, the judiciary, and state agencies will have their own pay scheme. While public pay systems range from fully centralized (Germany) to fully decentralized (Sweden), most countries fall in the middle and limit the number of pay options for employees. Countries tend to centralize their pay systems to achieve greater fiscal control and improve equity (equal pay for equal work). On this last objective, the government is creating a generic jobs catalogue to ensure that all public employees in generic positions (clerks, drivers, accountants, etc.) receive the same compensation. The new pay structure will be derived from the current comprehensive job evaluation and pay grading exercise, which is supported by the Bank. Through this exercise, a new job catalogue will be developed to standardize and reduce the number of job titles in the public sector.
Civil Service
Public Services*
LocalGovernment
Police
Defence
MPs, Judges,State
Agencies**
* Includes education, health, social protection, culture, tourism, sport.** All elected officials will have a defined coefficient in the new law.
3.21. The authorities have yet to decide the basis for pay increments in the New Wage Law, though they have expressed a preference for increments to be performancebased. This would require significant reforms to strengthen the government’s performance appraisal system, which currently has
low compliance and mostly assigns the highest scores to all employees. Establishing effective performance appraisal systems, however, is a long-term process that requires legislative changes and investments in capacity building, communications, and information systems. Defining measurable and objective means to evaluate performance for public employees has in many countries and sectors proven challenging (Hasnain, Manning, and Pierskalla 2012). Research suggests that performance-related pay has only worked well in the public sector for health, education, and revenue administration and not worked in other cases. Other evidence suggests that performance-related pay is more likely to have impact where planning, policy development, budgeting, monitoring and evaluation, and reporting are anchored to a performance framework—which is not the case in Serbia.
3.22. It will only be possible to estimate the fiscal impact of the new wage law after the new job classifications are defined and allowances and benefits are rationalized (see Figure 3.6). The job evaluation exercise will equalize positions according to responsibilities and competencies, and pay coefficients will only be assigned afterward. The government has indicated that the transition to the new pay structures will be fiscally-neutral in the short-term and that it will likely take several years and be contingent upon fiscal space. It is not clear, however, whether employees who are above their new pay coefficient will take a pay reduction or be grandfathered into the new system.
Single BaseReference Wage
Number of PaySubsystems
Job Classificationto Assign NewPay Grades andRanks
RationalizeElements of Pay
FinancialImplicationsof New WageLaw

30
II. OPPORTUNITIES AND OPTIONS FOR FISCAL CONSOLIDATION
Rightsizing of Public Administration
3.23. The first phase of the rightsizing reform is underway. As part of its fiscal consolidation agenda for 2015–17, as supported by the IMF SBA program, the government has set out a series of fiscal structural reforms, including measures to address the public wage bill. Ambitious targets have been set for the right-sizing program, including a reduction by the public workforce (excluding SOEs) by 75,000 over the next three budget years. Besides continuing to apply the 5:1 attrition rule, the government will implement targeted separations. The first target, set for June 2015, is to have 6.5 percent fewer employees than it had at the end of 2013. All budget entities have been asked to draft a plan for reducing the number of employees.
3.24. The second phase of the reforms will focus on restructuring and rightsizing the public sector. This will begin with a comprehensive functional review of the central administration and the MoF. There will also be functional reviews of specific ministries, such as education, health, social protection, and agriculture. Functional reviews have been used in many countries to identify savings in a more strategic and targeted manner than across-the-board cuts.18 They are intended to simplify administrative procedures, eliminate redundant tasks, and eliminate or restructure departments with duplicate functions without compromising service delivery. They also include changing the organizational structure, job definitions, and staffing levels to ensure that the organizational and functional structure determines public staffing needs. The functional reviews will not necessarily be limited to staff but will also consider other expenditure items and how services are delivered.
3.25. The functional review will be supported by the Bank and is expected to begin in mid2015 and last two years, though most of the analysis will be completed within the first eight months. The analysis is expected to identify savings that will be incorporated into the 2016 and 2017 budgets. The reviews will also attempt to minimize disruptions to service delivery and improve business processes wherever possible.
E. Conclusions and Recommendations
3.26. The government’s reforms to address the public wage bill are a high priority for the required fiscal consolidation and to improve public sector performance, but it will certainly not be easy to achieve them. The comprehensive government reform agenda is challenging but necessary. For the reforms to succeed, the government must retain political support, consistently communicate its intentions, mobilize the needed expertise, employ
change management strategies to overcome resistance, and leverage EU accession to mobilize support for reform. Important steps to limit growth of the wage bill, support fiscal consolidation, and make public administration more effective are the following:
•Define the remaining elements of the new paystructure so that it results in a lower wage bill and fiscal consolidation. The New Wage Law is a welcome reform and should significantly improve the transparency, equity, and manageability of public wages. But its fiscal impact depends on how the new job classification structure is defined and whether the allowances and benefits are rationalized. The government must be vigilant in appropriately classifying jobs and rationalizing allowances so that the new pay structures support fiscal consolidation, transparency and equity. A well-managed and shorter transition period to the new system could help contain costs.•Implement a centralized establishment and payroll
control system: More control of spending on wages, however, will not be possible until payroll data are improved. The self-reported personnel database is not a sustainable solution and is replete with errors. A centralized system is critical to providing the fiscal oversight and reporting necessary to monitor employment growth, distribution of staff, and employment costs.•Continue with recent measures—such as the hiring
freeze and attrition—to limit staffing growth. While these measures do not address the structural weaknesses, they are critical to limit staffing growth and deliver fiscal savings in the short to medium term. •Explore opportunities for reducing staff in health,
police, and (to a lesser extent) education and integrate rightsizing into the normal budget processes. Right-sizing reforms are more sustainable when they are integrated into the budgeting process, when control is managed within credible budget ceilings and staff are aligned to government priorities, performance targets, and population dynamics. It appears that this is not currently the case in Serbia. •Undertake a comprehensive functional review of
the central administration, the MoF, and specific sector ministries to simplify administrative procedures, eliminate redundant tasks, and eliminate or restructure departments that have duplicate functions without compromising service delivery standards. Functional reviews will not necessarily be limited to staffing but will also consider other expenditure items and how services are delivered.
18 Guiding questions for functional reviews include: whether there is a legitimate and necessary role for government in the delivery of this service; whether the service could be delivered in whole or in part to the private or voluntary sector; whether the organizational arrangements for service delivery can be rationalized; whether there are opportunities for cost-recovery, contracting in/out, and/or service network consolidation; and whether the resultant package of programs and activities is affordable within the budget and medium-term expenditure limits.

31
II. OPPORTUNITIES AND OPTIONS FOR FISCAL CONSOLIDATION
19 Fiscal savings from penalties for early retirement are estimated at 0.1 percent of GDP per year by the Ministry of Finance.
CHAPTER 4. PENSION REFORM: MEDIUM TO LONGER TERM ISSUES
4.1. Serbia is currently the fourth highest spender on pension systems as a share of GDP in all of Europe, exceeded only by Ukraine, France, and Italy. The high spending is driven by a generous benefit structure relative to the current average wage when compared to other European countries, and by a high proportion of young retirees. Much of the pressure for both the generous benefits and the early retirement come from societal expectations. Indeed, in 2012–14 general government pension spending reached 13 percent of GDP, up 2.1 percentage points of GDP relative to the average in 2005–07 (accounting for almost the whole 2.5 pp rise in spending, including activation of amortized guarantees). Given this increase, and the fact that pensions account for about one-third of current general government spending, pension restraint is central to the Government’s fiscal consolidation program in 2015–17.
4.2. Pension spending is largely being driven by relatively generous benefits, relative to average wage, and large numbers of early retirees. Pension benefits in Serbia are high relative to GDP per capita and relative to wage when compared to other European countries. The original pension laws also allow multiple pathways to retirement, allowing many people younger than what would be considered normal retirement ages to retire. New pension legislation passed in 2014 is aimed at reducing some of this early retirement. The Organic Budget System Law was also amended in 2014 to eliminate pension increases until pension spending reaches 11percent of GDP.
4.3. However, if the current pension law is implemented as legislated, benefits, relative to the average wage, are expected to drop even within the next 10 years, with surpluses in the pension system beginning as early as 2023. In the medium to long run, the situation is completely reversed from the current generous benefits and high spending. It is unclear, given the social expectations that have led to reversals of previous reforms, whether the pension system as legislated will be maintained. The government would be wise to take palliative measures now rather than risk implosion where the current system has to be replaced by something else in an emergency situation. By keeping pension benefits and retirement ages at levels more typical of other European countries, pensions can be both adequate and more sustainable.
4.4. The following sections first set out the current state of the pension system and its structure before the 2014 reforms. The details of these reforms and their likely impact are then assessed along with an analysis of impending issues before a brief conclusion.
A. Current State of the Pension System
4.5. Pension spending is high in Serbia for two reasons: benefits are relatively generous; and there is a high proportion of young retirees. Many of the reforms adopted in 2014 are meant to at least partially redress this situation. As discussed in detail below, pension benefits are being reduced temporarily for higher-earning pensioners, and penalties are being put in place for early retirement to discourage young people from retiring. However, there is political pressure to reverse some of these reforms. If the government wants to benefit from fiscal savings19 and bring Serbia closer to international and European standards of pension provision, it will be important to maintain these reforms.
4.6. Compared with pension spending in other European countries and relative to its own income levels, Serbian pension spending per beneficiary is unusually high. Figure 4.1 shows pension spending per beneficiary relative to GDP per capita in Serbia and in other European countries. Within Europe, only Cyprus and Montenegro exceed Serbia’s benefits of 66 percent of GDP per capita. It is also notable that Serbia is grouped with six others as high-spending transition countries. Five of the seven- country group originated in the former Yugoslavia, suggesting that its pension systems were already more generous than in the rest of Europe. This is not meant to imply that there are not pensioners in Serbia who are poor or that the pensions in Serbia in Euro terms are equivalent to those in other European countries. But relative to its own GDP per capita, Serbia pays relatively large benefits, and this is a major factor in Serbia’s high pension spending relative to GDP.
4.7. There are also a large number of beneficiaries in Serbia, many of whom are retiring well below the internationally accepted age of 65 and are thus likely to receive benefits for a long time. Typically in the last 15 years of life, work capacity starts to decline. For this reason, governments institute pension programs to provide income for those years when people are assumed to be unable to provide for themselves. Unfortunately, the typical retirement age has been more or less frozen or even declined since pension systems were first instituted while life expectancy has increased. As a result, in many European countries people are living much more than 15 years after retirement and retiring while they are able to work. Lower retirement ages have come to be seen as a bonus for those in physically demanding occupations

32
II. OPPORTUNITIES AND OPTIONS FOR FISCAL CONSOLIDATION
or in occupations that society particularly valued, and society began to expect that after 30, 35, 40, or 45 years of work, people “deserved” a pension. In 2013 (Figure 4.2), over 20 percent of male old-age pensioners in Serbia were below the retirement age of 65 for men and over 10 percent of women were below their retirement age of 60. Fewer farmers retire early than other categories because one of the requirements for retiring before 65 for men and 60 for women in at least 40 years of contributions for men and 35 for women. Most farmers retire with the minimum 15 years of contributions. If the threshold for retirees were raised to 65 for women, as it is in most other European countries, as many as 41 percent of women old-age retirees in Serbia would be considered “young” retirees rather than the current 9 percent.
4.8. Furthermore, the prevalence of young retirement continues today. Of those newly retired with old-age pensions in 2013, roughly half the men were younger than 65 and almost 30 percent of the women were younger than 60 (Figure 4.3). Given the legislative changes that became effective in January 2015 (described below), there was an even greater rush for individuals to retire before the new rules took effect, resulting in even more new young retirees in 2014 who will be paid benefits for a long time.
4.9. Reforms already in place are reducing the number of new disability beneficiaries while increasing the number of oldage beneficiaries. Internationally, about 10 percent of beneficiaries are expected to be disabled, with a large percentage of the rest being old-age pensioners. The percentage of widows and widowers largely depends on women’s labor force participation, which varies substantially from country to country. Serbia’s number of disability pensioners is a bit on the high side at just under 20 percent (Figure 4.4). Up to 2003, disability criteria were much looser they are now, and the number of young disabled has fallen substantially. Legal requirements prevent the pension fund from applying new criteria retroactively, although disability certification can be revoked in cases of fraud. Over time, the distribution of beneficiaries is expected to approach that of other countries. However, the authorities need to be aware that as the 2014 law begins to tighten the conditions for old-age pensions, the disability rates may begin to rise again: there is a possibility of increased fraud as people look for ways to continue to retire early without reduced benefits.
70%
80%
90%
60%
50%
40%
30%
20%
10%
0%
Luxe
mbo
urg
Slov
enia
Fran
ce
Mal
ta
Spai
n
Gree
ce
Italy
Cypr
us
Norw
ay
Irela
nd
Icel
and
Germ
any
Finl
and
Swed
en
Denm
ark
Portu
gal
Aust
ria
Unite
d Ki
ngdo
m
Neth
erla
nds
Geor
gia
Bulg
aria
Alba
nia
Bela
rus
Esto
nia
Latv
ia
Czec
h Re
publ
ic
Lith
uani
a
Russ
ia
Slov
akia
Rom
ania
Croa
tia
Hung
ary
Mol
dova
Pola
nd
Amen
ia
Kaza
khst
an
Mac
edon
ia
Ukra
ine
FBIH
Serb
ia
Repu
blik
a Sr
pska
Mon
tene
gro
Koso
vo
Azer
baija
n
Tajik
istan
Turk
ey
Kyrg
yzst
an
High IncomeGenerous Spender
High IncomeModerate Spender
Lower SpendingTransition Countries
High SpendingTransition Countries
Young Countries
Figure 4.1: Pension Benefits in Serbia are Among the Highest in Europe Relative to GDP Per Capita(Percent)
Source: Inverting Pyramid, World Bank, 2014.

33
II. OPPORTUNITIES AND OPTIONS FOR FISCAL CONSOLIDATION
Figure 4.2: Oldage Pensioners below Retirement Age(Percent)
Figure 4.3: Newly Retired OldAge Pensioners Below Retirement Age, 2013(Percent)
Figure 4.4: Pension Beneficiaries by Type, 2013(Percent)
Source: PIO Fund 2013.
Source: PIO Fund 2013.
Source: PIO Fund 2013.
0%
10%
20%
30%
40%
50%
Employees Military Self-Employed Farmers
Male Female
0%
20%
40%
60%
80%
100%
Employees FarmersSelf-Employed Army
Male Female
120%
Old-age
Disability
Widow
Orphan
59.4%18.9%
18.1%
3.6%
4.10. The Serbian population, like that of all other European countries, is aging; in 2050, 25 percent are expected to be over the age of 65 in 2050, compared with 14 percent today. The old-age dependency rate (the percentage of the population over 65 divided by the working-age population, assumed to be ages 15 to 64), is expected to rise from 21 to 41 percent. This means that with today’s population structure, there are as many as 5 people of working age to support each elderly person while by 2050 there will be as few as 2.5 people of working age per elderly person. But even under today’s more favorable demographic structure, the number of actual contributors to the pension system is only 25 percent higher than the number of beneficiaries. When the working-age population falls, reducing the number of contributors, and elderly requiring benefits rise, the pension system will face even greater difficulties. Serbia is expected to see a decline in the working-age population of 21 percent between 2010 and 2050 while the share of the elderly continues to rise.
B. Design of the Pension System before the 2014 Changes
4.11. To understand how the Serbian pension system found itself in this position, it is important to understand how it was designed and how the design has evolved. The Serbian pension system was designed in 2002-03, but has been amended several times since then,

34
II. OPPORTUNITIES AND OPTIONS FOR FISCAL CONSOLIDATION
and some of the elements of the old Yugoslav system were retained, including the initial level of benefits and the flexible retirement age, which permitted a significant amount of early retirement. As of recently, the Organic Budget Law stipulates that pension spending can be up to 11 percent of GDP.
Level of Benefits
4.12. The Serbian pension system as redesigned in 200203, is based on a point system. Individuals receive one point for each calendar year that they pay contributions on the average wage prevalent in that year. A person who pays contributions on twice the average wage receives 2 points per calendar year and a person who pays contributions on half the average wage receives half a point. Similarly, if a person only pays contributions on a salary equal to the average wage for 6 months in a given calendar year, the person will earn half a point, as specified in Article 63 of the 2003 Pension and Disability Insurance Law.
4.13. Upon retirement, the points a person has accumulated are converted to a dinar amount, using the value of the general point for the conversion. A general point value was defined in the 2003 law based on average pensions received by individuals just retiring in 2002 divided by the personal points they had accumulated. What this meant was that the benefit generosity imbedded in the former pension system was carried into the new pension system. As Figure 4.1 showed, Serbian pension benefits are still generous relative to other countries. According to the law, the value of the general point was to be indexed same way pensions were indexed. The initial law called for pensions to be indexed to 50 percent of nominal wage growth and 50 percent of inflation. In 2005, the law was changed to gradually move to 100 percent inflation indexation by 2009. But before that law was fully implemented, a sizable increase was granted in 2008. In the aftermath of the financial crisis, for 2009 and much of 2010 pensions were frozen. A 2 percent increase was granted in December 2010, followed by an inflation adjustment in April 2011. In both October 2011 and April 2012, increases were based on inflation plus half the growth of real GDP. From October 2012, increases were based on inflation only, with the caveat that should the growth rate of real GDP exceed 4 percent, the difference between the growth and 4 percent would be added to pensions.
4.14. Serbia is now adhering to international best practice in indexing pensions to inflation, as a way to protect pensioners from cost of living increases. Assuming that workers continue to benefit from productivity growth and consequently real wage growth,
in most pension systems individuals will see their pension benefits fall relative to current average wages over the retirement period. Adjusting pension benefit levels to increases in nominal wages has been found to be too expensive, particularly as societies are aging. As a result, public pension systems typically adjust pensions after retirement by inflation, to protect the pensioner’s standard of living, with the view that individuals who want a more generous retirement can provide that themselves with additional saving.
4.15. However, indexing the value of the general point to inflation differs from the way other countries index the general point or revalue past wages. In the past, as in some other European countries like Germany for instance, pensions after retirement were indexed to growth in nominal wages. As a result, if one teacher retired in 1990, another in 2000, and another in 2010, all after 30 years of earning the average wage, in 2015 all three would be receiving the same pension. The notion that people who had worked for the same amount of time in the same job at whatever the prevailing wages were at the time should receive the same pension was, and still is, perceived as fair. While this notion of fairness retains the intracohort fairness, whereby people who paid twice as many contributions within the same cohort will receive twice as high a pension, it introduces an intergenerational inequity, with people who retired from an earlier cohort and thus paid contributions on the basis of lower wages, receiving the same pension as those who retire from a later cohort and who have paid contributions on much higher wages. In most countries, fairness is defined as how linked the pension is to the contributions an individual makes. In this example, the 1990 retiree earned lower wages and paid lower contributions than the next two and in most countries would receive a lower pension. Linking indexation of the general point to the indexation of benefits post-retirement, as is done in Serbia, insures that the three teachers get the same pension. This insures intracohort equity, but not intercohort equity.
4.16. If the pension law continues to be implemented as legislated, and the value of the general point continues to be indexed to inflation, a consequence of linking indexation of the general point to indexation of pensions postretirement will lead to a steep fall in the expected benefit relative to the average wage—and a subsequent decline in expected pension spending relative to GDP.20 Internationally, countries which use the point system typically index the value of the general point to nominal wage growth while continuing to index retirement benefits to inflation. Countries that use a defined benefit formula typically also revalue the earnings on which the benefits are based by nominal wage growth. And countries that use notional accounts

35
II. OPPORTUNITIES AND OPTIONS FOR FISCAL CONSOLIDATION
often use a notional interest rate equal to average wage growth, which performs a similar function. In that way, they avoid the steep drops expected in Serbian benefits in the future and maintain a close link between contributions paid and benefits received. These are some options that Serbia can consider incorporating in future changes of the legislation governing the pension insurance.
4.17. Indeed, should the law continue to be implemented as legislated, this link is projected to lead to benefits dropping from roughly 80 percent of the net average wage in 2013 to 50 percent by 2025 and to continue falling sharply thereafter (Figure 4.5). In 2013 old-age benefits from the Employee Pension Fund stood at almost 80 percent of the net average wage; in other European countries, benefits are roughly 50 percent of average wage. Serbian old-age benefits are expected to drop to just 47 percent of the net average wage in 2025, making pensioners much worse off than workers in 2025. Benefits will continue to drop, reaching as low as 7 percent of the net average wage by 2075. Why would employers and employees want to contribute 24 percent of their wage for 40–45 years to get only 7 percent back in benefits for 15–20 years? The reduction relative to the net average wage occurs entirely because real benefit levels are kept constant while real wages continue to grow. The issues are similar for all of Serbia’s pension systems because the benefit formulas have been unified for farmers, the self-
20 Since the Organic Budget System Law stipulates that pension spending can be up to 11 percent of GDP, nothing in the Budget Law explicitly prevents it from falling below that level.
2013
2015
2017
2019
2021
2023
2025
2027
2029
2031
2033
2035
2037
2039
2041
2043
2045
2047
2049
2051
2053
2055
2057
2059
2061
2063
2065
2067
2069
2071
2073
2075
70.0%
80.0%
90.0%
60.0%
50.0%
40.0%
30.0%
20.0%
10.0%
0.0%
employed, and employees, and are now being unified for the military as well. Should the pension spending is maintained at 11 percent of GDP, average benefits would fall to approximately 42 percent of average wage and remain roughly steady thereafter.
4.18. The reduction in relative benefits naturally translates into a reduction in pension spending relative to GDP. Pension expenditures, which are very high today at over 13 percent of GDP in 2013, are expected to drop to 11.5 percent as early as 2025 (Figure 4.6) without the 2014 reforms, but will still be above current EU levels of 9.5 percent of GDP. The Serbian Organic Budget System Law states that pension spending will fall until it reaches 11% of GDP, but does not specify what will happen once the spending levels begin to fall below that level. Clarifying this in the law (or through bylaws) should be among priorities for future legislative changes. As Serbian spending as a share of GDP continues to drop, it will reach the current EU levels by 2030 and will fall as low as 2.4 percent of GDP by 2075. Similarly, the current deficit in the Employee Pension Fund, which requires 4.2 percent of GDP in financing from the general budget, will revert to an increasingly large surplus beginning in 2023 (Figure 4.7).
Figure 4.5: Average Projected OldAge Benefits Relative to the Current Average Wage, 2013–2073(Percent)
Source: World Bank staff projections using World Bank PROST model (Pension Reform Options Simulation Toolkit) for the Employee Pension Fund, calibrated using 2013 data from the Pension Fund as a starting point.

36
II. OPPORTUNITIES AND OPTIONS FOR FISCAL CONSOLIDATION
Figure 4.6: Pension Spending, 2013 – 73(Percent of GDP)
Figure 4.8: Reduction in Benefits per Year of Early Retirement(Percent)
Figure 4.7: Pension Fund Balance, 2013 – 73(Percent of GDP)
Source: World Bank staff projections.
Source: World Bank staff projections. Source: World Bank
2.0%
4.0%
6.0%
8.0%
10.0%
12.0%
14.0%
16.0%
2013
2018
2023
2028
2033
2038
2048
2043
2053
2058
2063
2068
2073
10.0%
10.0%
5.0%
5.0%
0.0%
15.0%
20.0%
2013
2018
2023
2028
2033
2038
2048
2043
2053
2058
2063
2068
2073
Early Retirement
4.19. Another feature inherited from the old pension system which has been carried over to today is a flexible approach toward retirement. The law before the latest changes allowed three pathways to retirement: (1) men who had reached the age of 65 and women who had reached 60, with 15 years of service; (2) men and women who had reached 58 with 40 years of service for men and 38 for women; and (3) anyone with 45 years of service, regardless of age. For the second pathway ages
and years of service were phased in from the previous requirement of age 53 with only 35 years of service for women. As a result of these multiple pathways, individuals who retired relatively young were not considered early retirees but treated as fully privileged retirees. In most countries, if individuals retire at age 60 rather than 65, they will receive benefits for about 5 years longer. If people retiring at 65 are expected to receive benefits for 15 years on average, allowing retirement 5 years earlier will result in a benefits package that is about a third greater than for the person who retires at 65. To even things out, most countries actuarially reduce the benefit for the early retiree to compensate for the longer duration of receipt of benefits. Until the 2014 law, Serbia did not do that. It treated each of the pathways to retirement as eligible for the full pension, even though some were far more generous than others. Figure 4.8 shows the penalties as of 2015, but still shows Serbian penalties as being on the low end.
7
8
6
5
4
3
2
1
0
Luxe
mbo
urg
Norw
ay
Hung
ary
Czec
h Re
publ
ic
Germ
any
Serb
ia
Aust
ria
Gree
ce
Switz
erla
nd
Finl
and
Kore
a
Cana
da
Italy
Japa
n
Portu
gal
Slov
ak R
epub
lic
Swed
en US
Icel
and
Spai
n
4.20. Extended service privileges compound the impact of flexible retirement, resulting in large numbers of early retirees. While flexible retirement encouraged early retirement, the Serbian system also inherited the system of extended service privileges, in which individuals in quite a large number of occupations were given extended service credit. For example, for every 12 months they worked and paid contributions, they were given credit for as much as 18 months of service, with different amounts of extended service awarded to different occupations. For example, an individual who starts work at age 18 and works in an

37
II. OPPORTUNITIES AND OPTIONS FOR FISCAL CONSOLIDATION
occupation that gives 18 months credit for every 12 months actually worked can by age 48 accumulate the 45 years of service credit allowing retirement at any age and the pension would recognize 45 years of service. Employers of those in the privileged occupations are now charged additional contributions commensurate with the amount of extended service credit. The additional charge compensates for pensions being based on 45 years of service instead of 30, but does not compensate for the fact that the pension is received 17 years early (for a male employee), which more than doubles the cost to the country of the retirement package. While some who receive extended credit may have lower life expectancies, such as miners, there is no reason to expect that others who receive these benefits have lower life expectancies than the rest of the population. Even workers like miners are likely to leave behind widows and family members who will receive a survivor’s pension for a long time.
4.21. The combination of these two factors, flexible retirement without penalties and extended service privileges, explains the very high rate of young oldage retirement. Typically countries have a choice of paying adequate benefits to relatively older individuals or paying much lower benefits to a much larger group of people. Serbia’s attempt to pay relatively generous pensions to a wide range of people has led to the current situation. The government can still choose to pay low benefits to many people, but paying more adequate benefits to those who are unable to work is a more efficient use of limited resources.
C. Reforms Enacted in 2014 and Their Impact
4.22. The Government of Serbia undertook three sets of important pension reforms in 2014 to deal with both the generous benefits and early retirement that are the primary causes of overspending: it amended the pension law effective in January 2015; and it reduced pensions through the tax code effective in November 2014. The pension law, amended in July 2014, raised the retirement age for women gradually between 2015 and 2032 to 65, equal to that for men. And for the first time, actuarial reductions of 0.34 percent of the benefit per month of early retirement were enacted for those retiring before the age of 65. When the law is fully phased in, early retirement will only be allowed at age 60, but for now it is allowed at earlier ages but with a maximum reduction of 20 percent even if the number of years exceeds 5. However, extended service retirees will be allowed to continue retiring early, and some will not face the actuarial reduction, although there was some tightening of the extended service requirements. These
changes impact those yet to be retired. A second law, the Law of Temporary Reduction of Pension Payment which became effective in November 2014 temporarily reduced benefits above RSD 25,000 per month by 22 percent of the amount above RSD 25,000 and reduced benefits above RSD 40,000 by a further 3 percent of the amount above RSD 40,000. The Pension Insurance Law was also modified in December 2014 to suspend indexation of pensions in years when pension spending is expected to be above 11 percent of GDP (similar to the suspension of indexation of public sector wages discussed in Chapter 3).
4.23. Projections suggest that the reforms have a significant impact on the shortrun finances of the pension system. Given that benefits for those retiring early are now reduced, it is impossible to know how many people will actually retire early. The projections in Figure 4.5 are based on the assumption that 50 percent of people would continue to retire early. The reduction of 0.34 percent per month is a bit smaller than the actuarially fair reduction of 0.5 percent, so the system continues to provide a small subsidy for early retirement. The reduction of 4 percent per year of early retirement is a significant improvement on the previous 0, but remains on the relatively low side internationally (Figure 4.8). This subsidy to early retirement should encourage some people to continue retiring early, but the reduction may force others to postpone retirement and continue working. The assumption underlying the projections was that 50 percent of those currently retiring before 65 would continue to retire and 30 percent would continue working and contributing, with the remainder dropping out or joining the informal sector without claiming a pension.
4.24. The other variable affecting the impact of the 2014 reforms is the duration of the 2014 temporary reduction in pensions. The projections assume the reduction will last for 3 years, 2015–17. The reduction was modeled as a reduction in spending from the Pension Fund, even though the money may accrue to a different account as tax revenue. Should this reduction be extended or lifted early, the projected impact would of course be different. The small spending increase in 2018 comes from the assumed removal of the temporary reduction. The important outcome is that while there are short- to medium run improvements in pension system finances, the long-run problems stemming from indexation of the general point remain. It should be noted that while the pension reduction was billed as a 10 percent reduction in benefits, because it is levied only on the portion of benefits above the average pension, the reduction in pension spending is about 5.8 percent.

38
II. OPPORTUNITIES AND OPTIONS FOR FISCAL CONSOLIDATION
4.25. Given the sizable improvement in pension outcomes from enacting these painful reforms, it is important that the Government stay the course and allow them to bring the pension spending levels down to more manageable levels. Figure 4.9 shows that the reforms will succeed in bringing the pension spending down to the maximum 11 percent level by 2020.
0
2.0%
4.0%
6.0%
8.0%
10.0%
12.0%
2013
2014
2015
2016
2017
2018
2020
2019
2021
2022
2023
2024
2025
Pre-2014 2014 Reforms
14.0%
16.0%
Figure 4.9: Impact of 2014 Reforms on Pension Spending(Percent of GDP)
Source: World Bank staff calculations.
D. Issues Going Forward
4.26. The main shortrun issues relate to sustaining existing reforms, despite protests and potential improvements in the economy and the fiscal position. Serbia’s generous pension benefits need to be pared down. The initial efforts to date need to be continued. The increase in the retirement age and the penalties imposed on early retirement also need to be continued as Serbia moves toward international best practices. These are even more urgent given the large cohorts of early retirees retired in 2014. It is unfortunate that the timing of the introduction of these policies coincides with the downsizing of the public sector and the restructuring of public enterprises, but shifting the problem from one part of the government budget to another does not solve it. If the government faces absolute obstacles in downsizing and restructuring, it could opt to provide one-off severance payments to these workers or retrain them rather than pushing them into the pension system without penalties.
4.27. The government will need to begin soon to address the interrelated medium and longerterm issues remaining in the pension system. Most of the short-term
emergencies in the pension system were dealt with, to the extent politically possible, in 2014. However, as has already been shown, little effort has been put into addressing such medium-term issues as (1) societal expectations for the pension system; (2) de-linking of general point indexation from indexation of pensions post-retirement; (3) the rise of informal labor markets; and (4) the farmers’ pension system.
Societal Expectations vs. Pensioner Needs
4.28. Serbian society expects the pension system to pay average benefits of 70 percent of average wage, which is not affordable in Serbia or anywhere else in Europe. While the immediate cause of the high fiscal spending on pensions is the 2008 increase in pensions which raised the level to 70% of average wage, the question is why there were demands to raise pensions to such a high level compared to benefit levels in other countries that led to the Government’s decision to raise benefits in 2008. The average benefit, as calculated in Serbia, combines pensions paid for old age with those for disability and those for survivors across all the systems. Since survivor benefits are 70 percent of old-age benefits and one-third of the beneficiaries are survivors, keeping the average benefit at 70 percent of average wage means that the old-age benefit has to be substantially higher, 80 percent or more. Elsewhere in Europe, benefits for the newly retired average about 63 percent of the average wage. With inflation indexation of benefits post-retirement, as is typical, average old-age benefits are about 50 percent of the average wage. And with the aging of the population all over Europe, it is not clear that even this benefit level will be affordable for long.
4.29. Whenever benefits fall substantially below expectations in Serbia, political pressure starts to build to reverse the reforms. Under the 2005 law, indexation fell from the previous 50 percent of average wage growth and 50 percent of inflation to 37.5 percent of average wage growth and 62.5 percent of inflation in 2006 and to 25 percent of average wage growth and 75 percent of inflation in 2007. In 2007 wage growth in Serbia was substantial, close to 20 percent in real terms, which led to the perception that pensions had fallen behind wages and were falling far behind the 70 percent societal standard. As a result, after elections in 2008, there was a substantial increase in pensions in October, just as the financial crisis hit. Subsequently, while pensions were frozen for two years, wages actually fell, again boosting the ratio of pension benefits to average wages. Even the more drastic measures taken in 2014 were not sufficient to reverse the 2008 increase or bring benefits down to international levels.
4.30. The only way to avoid pension spikes of this type and to alleviate political pressure is to undertake a

39
II. OPPORTUNITIES AND OPTIONS FOR FISCAL CONSOLIDATION
Figure 4.10: Benefit Impact of Delinking General Point Value from Postretirement Indexation(Percent of Average Wage)
Source: World Bank staff calculations.
prolonged campaign to educate the public that the 70 percent standard is no longer achievable in Serbia, and that other European countries are not even trying to achieve that level. The fiscal difficulties that Serbia has faced in recent years has led to reactive pension policy, with efforts to reduce short-run spending in response to the latest crisis. People understand, more or less, that when the country is facing a crisis, there has to be belt-tightening all around. But when the fiscal situation improves, the expectation is that benefits will again rise to 70 percent of the average wage and some political parties publicly advocate for it. Little effort has been put into explaining that this target is no longer achievable. It is not clear that it ever was, but with today’s lower contribution rates, the aging of the population, and slower growth, it will not be achievable in the foreseeable future. Explaining this and showing that other countries do not see this as a reasonable target will help alleviate the political pressure that has led to spikes and later reversions.
4.31. Societal expectations vary widely by country and can be changed over time. Countries across Europe have widely differing expectations of their pension systems. In Russia, the norm of pension benefits that are 40 percent of the average wage is widely accepted. Comparisons with the past or comparisons across Europe on euro-equivalent benefit levels are not entirely useful, given that the cost of living so varies widely in European countries. Health care systems also vary widely across countries, with individuals responsible for varying amounts of their own health care needs. It is important to open discussion of the minimum benefits an elderly person in Serbia requires to live. The government could then propose a benefits package that is both affordable and adequate, making this the new societal expectation. Furthermore, it needs to be clear that benefits will probably be somewhat linked to an individual’s contributions and earnings but need not be linked to wages in society at large.
Delinking Indexation of General Points and Pension Indexation after Retirement
4.32. The juxtaposition of society’s current expectations with mediumrun benefit projections suggests an impending explosion. The steep drop in expected benefit levels shown in previous sections does not comport well with society’s benefits expectations. Countries faced with such a clash typically end up with ad hoc increases, particularly around elections, that break the logic of the pension system. Once people begin to feel uncertainty about what they will receive in benefits compared to what they contribute, or about whether they will even receive benefits, they tend to withdraw from the system, accelerating its breakdown.
4.33. It would be far better for the government to have a plan on how to reform the system before this breakdown begins to occur. Lessons from pension reforms throughout Europe and around the world are that gradual changes are easier for individuals to understand and incorporate than sudden shifts. Starting to incorporate changes now would smooth the path to whatever the final benefit structure is.
4.34. Gradually moving indexation of the general point to growth in average wages while retaining the indexation of pensions postretirement to inflation might be one way to move to a more sustainable pension system. Figure 4.10 shows the impact on benefits relative to average wage, if between 2016 and 2025 the value of the general point were gradually moved from inflation to average wage indexation, as is typical in other countries. Whether the ultimate benefit levels are adequate can be adjusted based on the outcome of the discussion suggested above, but moving in this direction avoids the abrupt reduction in benefits as a share of average wage. Figure 4.11 shows that delinking still allows pension spending as a share of GDP to fall to more typical levels.
0.0%
10.0%
20.0%
30.0%
40.0%
50.0%
60.0%
2013
2018
2023
2028
2033
2038
2048
2043
2053
2058
2063
2068
2073
Base Delink
70.0%
80.0%
90.0%

40
II. OPPORTUNITIES AND OPTIONS FOR FISCAL CONSOLIDATION
0
2.0%
4.0%
6.0%
8.0%
10.0%
12.0%
2014 Reforms Base De-link
14.0%
16.0%
2013
2018
2023
2028
2033
2038
2048
2043
2053
2058
2063
2068
2073
Figure 4.11: Pension Spending Impact of Delinking(Percent of GDP)
Figure 4.12: Percentage of Elderly Collecting Public Pensions Today and Estimated Percentage Eligible for Benefits in 2050 Based on Percentage of 3539 Year Olds Making Contributions Today(Percent)
Source: World Bank staff calculations.
Source: World Bank, Inverting Pyramid, 2014.
Impact of the Rise in Informality in Labor Markets
4.35. A third issue that needs to be considered in restructuring the pension system is the lower level of participation in the pension system than in the past and the consequent future rise in the number of elderly with no pension rights. In 2013, about 85 percent of the population over 65 received some type of public pension
LSTC HSTC YC
70%
80%
90%
60%
50%
40%
30%
20%
10%
0%
100%
Arm
enia
Alba
nia
Rom
ania
Russ
ia
Hung
ary
Bulg
aria
Bela
rus
Latv
ia
Croa
tia
Lith
uani
a
Czec
h Re
publ
ic
Esto
nia
Pola
nd
Slov
ak R
epub
lic
Geor
gia
Repu
blik
a Sr
pska
Bosn
ia F
eder
atio
n
Serb
ia
Azer
baija
n
Kyrg
yz R
epub
lic
Turk
ey
Kaza
khst
an
Tajik
istan
Koso
vo
2010 2050
benefit—old age, disability, or survivors. An even larger number benefited as a result of living with a spouse who received pension income. The rise of the informal labor market suggests that in the near future as people begin to reach retirement ages, and an increasing percentage may find themselves unable to work but ineligible for a pension. This phenomenon exists in almost all middle- income countries. While improved incentives and collection efforts can result in some additional formalization, substantial increases in formalization generally occur slowly along with economic growth. The current structure of the pension system as legislated, where 20-year-olds entering the labor market will see benefits falling drastically by the time they retire, does not offer much incentive to join the pension system.
4.36. Data provided by the Pension Fund of Serbia show that as few as 55 percent of the population in the 3539 age group, the prime working age group, are actually making contributions. Internationally, this same percentage of the population is roughly the group that is eligible for full pensions when they retire. Today, 77 percent of the elderly are collecting benefits, suggesting a future gap which may need to be covered through social assistance. Figure 4.12 shows the data for Serbia together with data for other transition countries.
4.37. Since a significant portion of those who became of working age after 1990 may not have ever participated in formal labor markets, Serbia probably has until 2025 or 2030 before it starts to see a rising number of elderly who are ineligible for any type of pension. However,

41
II. OPPORTUNITIES AND OPTIONS FOR FISCAL CONSOLIDATION
if the government should redesign or restructure the whole pension system, it would be worth keeping in mind that in future some fiscal resources may be needed to support those who are not eligible for a public pension, and thinking about how to design both systems to minimize disincentives to joining the formal system.
4.38. Countries typically pursue one or more of the following strategies to help alleviate poverty among the uncovered elderly: (1) provide a flat universal pension to all individuals above a certain age; (2) provide a targeted noncontributory benefit to the elderly poor; and (3) unify provisions for oldage poverty with the social assistance system.
• Since the universal pension would go to allindividuals above a certain age, it is typically the most costly of the three options but it offers the fewest disincentives to joining the formal system. Keeping benefits low and possibly making them available only at ages above the normal retirement age can help contain costs. • A noncontributory benefit targeted to the elderly
poor can involve as little targeting as whether an individual receives a state pension from the pension fund. This type of benefit is less costly overall, but can be more complicated and thus costly to administer. Furthermore, if individuals know they will receive benefits without having made any contributions, the cost of contributing becomes not only the cost of the contribution itself but the loss of noncontributory benefits, which combine to make formalization less attractive. Again, keeping benefits low and available at higher ages helps curb some of these disincentives. • Unifying old age anti-poverty programs with the
existing social assistance system has a number of advantages. Where the elderly live in households with nonelderly, providing benefits to households that are generally poor is more efficient than trying to determine whether the elderly person within a larger household is poor. There are dangers, however, that the elderly will be displaced from larger households in order to qualify for the benefit, which might increase total state support to the larger family unit but might result in greater isolation for the elderly. If the social assistance program is meant to provide for the poor elderly, its design may also need to be reviewed. Typically, elderly individuals accumulate assets over their lifetime to help protect them when they become unable to work. Some social assistance programs disqualify a household that owns even a few assets, even if they do not generate an income. For instance, an elderly household may own land that could be valuable, but the elderly individual or couple may not be able to provide enough labor to generate income from it.
4.39. Quasicontributory schemes, where individuals make only limited contributions but receive a more substantial benefit, are typically the worst option. Quasi-contributory schemes combine a huge element of social assistance with a limited element of contributory social insurance. Typically these schemes end up the worst of both worlds: they do not protect all poor elderly, since some people are too poor to make even the limited contributions. Individuals usually contribute as little as they can and for as short a time as they can to access the highly subsidized minimum benefit. Individuals always perceive their contributions as being more valuable than they typically are. When they have made even limited contributions, they feel they have a right to demand what they consider a decent pension, which leads to political pressure for higher and higher minimum benefits. If individuals have not been asked to make contributions, governments have more political space to provide benefits that are affordable.
Reform of the Farmers’ Pension Scheme
4.40. Farmers’ pension schemes are problematic throughout the world because of the difficulty of assessing farm income, when some of the output is consumed by farmer and family, and the difficulty of assigning income and contributions to family members who might provide some farm labor. While some of the difficulties with farmers’ pensions are similar to those for the self-employed, less farm income is typically monetized, fluctuating weather conditions make income more volatile, and regional dispersion makes collection, enforcement, and even delivery of benefits more difficult.
4.41. Setting up separate farmers’ systems allows the pension fund to assess flat contributions based on the area of the land, rather than the difficulty of measuring income. Some countries have set up separate farmers’ pension systems, among them Austria, Finland, France, Germany, Greece, Italy, Luxembourg, Poland, and Spain. However, all these systems require substantial state subsidies. Benefits can also be designed to recognize that farmers typically have a lower cost of living because they have less need to purchase housing and food than urban dwellers. Because farmers are often a vocal political group, their benefits far outstrip the contributions the pension fund can collect from them. These should therefore be considered quasi-contributory schemes. Furthermore, as a country urbanizes, fewer and fewer labor market entrants become farmers, reducing the number of contributors to a system that still has to support a sizable number of retirees. This leads to further financing needs from the state budget.

42
II. OPPORTUNITIES AND OPTIONS FOR FISCAL CONSOLIDATION
4.42. Integrating farmers into the national pension system has the advantage of accommodating workers who earn some income from agriculture and some from other sectors as well as workers who spend part of their career in agriculture, but then move to more urban areas, or vice versa. Some countries, like Serbia, have a relatively integrated system, with the only difference between farmers and non-farmers being the amount of the minimum pension. As long as the system is subsidized, farmers are less likely to contribute. They also tend to push for higher minimum pensions, making the argument that they contribute just like everyone else and should not be subject to lower pensions, even if they have fewer living expenses.
4.43. A third solution is to integrate those farmers who are willing and able to pay into the national pension system but to recognize that some will remain outside the formal labor system. Many of those who by choice or need remain outside the system will need some form of support. Since the choices are identical to those for other informal labor market workers, farmers should be treated similarly.
E. Conclusions and Recommendations
4.44. Serbian pension policy needs to keep its current focus on controlling spending on pensions and reducing the number of early retirees while beginning to move to a proactive discussion of how to provide oldage support in the medium and longer term and avoid the potential declines imbedded in the current legislation. Because pension spending is so high in Serbia, the government has rightfully focused on short-term measures to help alleviate fiscal pressures. However, projections of the system as currently legislated show decline in benefits over the medium to long term. Since abrupt shifts in policy are never beneficial for a program meant to provide long-term security over a person’s lifetime, the Government is urged to open a dialogue on reforming the system to allow time for gradual eventual reform.
4.45. The overall pension strategy needs to be reviewed to determine what the social needs really are and how best to fulfill them. Elements of the reform strategy should cover:•Discussionofminimumpensionerneeds,•A move away from equalizing pensions for different
cohorts of workers, which reduces the return for contributions for future cohorts, and toward linking contributions to benefits, not only within cohorts, but across cohorts as well, •Provisionforthosewhoarenotpartoftheformallabor
market,•Possiblerestructuringofthefarmers’pensionsystem.
4.46. Today’s political discussions are often focused on achieving quantitative targets such as 70 percent of average wage and not focused enough on what pensioners today really need. As subsequent generations experience income growth, they will expect it to be reflected in the pensions they themselves receive and will not be content with pensions that previous cohorts with lower incomes might have settled for. Informal labor markets are likely to remain a part of the economy until Serbia’s income levels are substantially higher. The government might want to think about how to provide at least survival-level benefits for those elderly who have no income. The government might also consider restructuring the farmers’ pension system, particularly if a targeted or noncontributory option is available for informal sector workers.
4.47. While there are legitimate concerns that reopening the pension dialogue at this moment of public sector restructuring might result in revisiting early retirement options, waiting to open the dialogue on the longer term issues also has costs. The longer the transition period when moving to a new benefit formula, the smaller inequities there will be across cohorts. Sharper inequities are likely to be less politically sustainable and risk allowing an implosion of the pension system. This consideration needs to be weighed against the risks of loosening the early retirement restrictions before they have become fully effective.

43
II. OPPORTUNITIES AND OPTIONS FOR FISCAL CONSOLIDATION
CHAPTER 5. SUBSIDIES AND STATE SUPPORT TO THE ECONOMY5.1. Serbia’s current system of public support to SOEs, agriculture, and the private sector is inefficient. Subsidies to SOEs do not encourage the recipient to be efficient themselves and generate significant direct and indirect pressures on the state budget. In recent years, the state has issued guarantees to support the liquidity of some SOEs in dire financial conditions, significantly adding to Serbia’s public debt. State support to public enterprises is also significant but often fragmented and the allocations lack transparency. Similarly, the current system of state support to agriculture, primarily based on area and animal payments, is not the most appropriate way to make the Serbian farms more productive and competitive during the process of EU accession and should be rethought. And state support to private investment and export promotion is fragmented, nontransparent, and lacks proper evaluation mechanisms.
5.2. In 2014 Serbia spent about 5.2 percent of GDP on subsidies and other forms of state support to the economy (Table 5.1 and Figures 5.1 and 5.2). Subsidies and state support analyzed in this chapter cover the general government level and include direct subsidies, soft loans, and called guarantees, which combined reached 5.2 percent of GDP in 2014—the highest level since 2000. This is about twice the amount the consolidated general government spending on public investments and is close to what the government spends on public health. State support to the economy increased most over the last three years in part as a result of activated guarantees. As resolution of SOEs was delayed, the government has continued to extend guarantees to SOEs, especially public utilities, often for liquidity purposes. A growing number of those guarantees have in turn been activated, resulting in
Table 5.1: General Government Support to Economy, 2014(in RSD billion and as % GDP)
Figure 5.1: State Support to the Economy, 200014(Percent of GDP)
Figure 5.2: Composition of State Support to the Economy, 200014 (Percent of GDP)
Subsidies, in cash
o/w central government
for agriculture
for railways
for SOEs
for tourism
other (culture, national TV etc.)
o/w subnational governments
Soft-loans
Amortization of issued guarantees / 1
202.0
117.0
87.6
37.1
13.3
18.7
0.4
18.3
29.4
55.4
29.6
5.2
3.0
2.3
1.0
0.3
0.5
0.0
0.5
0.8
1.4
0.8
as %GDP
Source: Ministry of Finance, IMFNotes: 1. amortization only, interest payments related to guarantees are added to the total spending on interest payments
Source: MOF. *Amortization only, interest payments related to guarantees are recorded as part of interest payments.
Source: MOF.
RSD, bn
an increase in activated guarantees from none in 2008 to almost 1 percent of GDP in 2014. Beyond these, the government is often called on to cover for unpaid social contributions, utilities bills, and taxes on behalf of SOEs, but information on how much is amounts spent is not available and is therefore not part of the analysis.21
5.3. This chapter analyzes the different types of state support for SOEs, agriculture, and private companies and explores options for reducing or rationalizing the subsidies to support fiscal consolidation. The chapter begins with the analysis of support for SOEs, followed by a review of the support to agriculture and to the private sector. It concludes with options for further reducing the subsidies or making them more efficient.
21 The government does not maintain an integrated, company-specific inventory of information on the forms of state support each enterprise receives.
2000
2001
2002
2003
2004
2005
2006
2007
2008
2009
2010
2011
2012
2013
2014
0.00
1.00
2.00
3.00
4.00
5.00
6.00 20
00
2001
2002
2003
2004
2005
2006
2007
2008
2009
2010
2011
2012
2013
2014
Subsidies, in cash Soft-loans Amortization of issued guarantees*
0.0
2.0
4.0
6.0

44
II. OPPORTUNITIES AND OPTIONS FOR FISCAL CONSOLIDATION
A. State Support to SOEs
5.4. Stateowned enterprises still loom large in Serbia’s economy. There are about 1,200 SOEs and they employ about 250,000 people (15 percent of formal employment in Serbia). These enterprises include several major public utilities, which are among the largest companies in Serbia, and numerous companies of various sizes in various sectors operating under different legal frameworks (see Box 5.1). Heterogeneous in nature, they can be segmented into two groups, state and socially owned enterprises, and municipally owned enterprises (Table 5.2). The first group includes public utilities, commercial companies, and companies in the Privatization Agency portfolio. The second group consists mainly of local utilities (water supply, district heating, cleaning, etc.) of different types and sizes; these are not covered in this report because their operational and financial (in) efficiency has been discussed in a recent municipal public finance review (World Bank 2013).
5.5. Many stateowned and public enterprises in Serbia are lossmaking and without state support financially nonviable. The combined losses of SOEs exceeded 1 billion euros in 2013, the latest year for which final accounts are available (Table 5.2). Losses are spread across all types of SOEs but are concentrated in former conglomerates which are officially ring-fenced from bankruptcy and exempted from paying taxes and social contributions. These companies account for nearly half of all losses. To stay afloat, SOEs receive not only significant direct budget subsidies and soft loans but also indirect support in various forms, including unpaid taxes and contributions, state guarantees for loans, and arrears to other state entities and public utilities. These forms of support have significant consequences, direct and indirect, for the state’s fiscal accounts. Moreover, given how fragmented state support to public enterprises is, how funds are allocated is far from transparent. Finally, the government does not maintain an integrated, company-specific inventory of information on the different forms of state support each enterprise receives.
Table 5.2: The Nonfinancial SOE Sector, 2013 unless Otherwise Indicated
Source: Agency for Business Registries, Privatization Agency.
No. of companies
Operating revenues
(EUR Million)
Net profit/loss(EUR Million)
Assets(EUR Million)
No. ofemployees
TOTAL (est.) 1,215 8,854 -1,055 34,190 251,8481. State and socially owned enterprises (est.) 566 7,301 -1,007 30,613 181,496
Public utilities 24 3,560 -323 20,031 77,078a. Large 6 3,353 -325 18,480 70,462
EPS .. 1,943 166 9,558 31,569Railroads .. 233 -73 2,428 19,896Post (core company) .. 201 25 305 15,133Srbijagas .. 610 -449 1,443 3,011 Srbijagas core company .. 583 -439 1,414 1,181EMS .. 168 14 751 1,348Roads .. 225 -9 4,024 1,335
b. Other (estimated) 18 207 2 1,551 6,616Commercial companies (est.) ~30 ~1,200 ~10 ~2,300 ~18,500
a. Selected large companies 5 1,092 9 2,156 16,404Telekom (core company) .. 765 135 1,639 9,073Smederevo steel smelter .. 189 -132 218 5,036Jat tehnika .. 25 0 20 953Prvi Partizan .. 54 5 67 889Airport Belgrade .. 59 0 211 453Other (excluding banks) ~25 .. .. .. ~2,000
Privatization Agency portfolio 514 2,449 -693 7,551 90,303a. Companies previously in restructuring 140 1,284 -488 5,876 55,330b. Other 374 1,165 -205 1,675 34,973
2. Municipal enterprises (est.) 649 .. .. .. 70,352Municipal utilities (data for 2012) 352 1,281 -46 3,110 55,583Other (data for 2010) 297 .. .. .. 14,769

45
II. OPPORTUNITIES AND OPTIONS FOR FISCAL CONSOLIDATION
Different types of SOEs operate under different legal frameworks in Serbia. Public enterprises (PEs) are governed by the Law on Public Enterprises (PE Law), which regulates PEs established by the Republic of Serbia, municipalities, and autonomous provinces and also regulates activities of general interest for any company in Serbia, public or private. All but a handful of national SOEs – including some of the largest, such as EPS, EMS, Post, Serbia Gas, Forestry Management, and Roads – and all 300-plus municipal utilities fall under the PE law. A second group of enterprises are those corporatized into mostly joint stock companies (JSCs) or in fewer cases as limited liability companies (LLCs), including Telekom, Galenika, Jat Aircraft Maintenance, Belgrade Airport, and Railroads. These companies operate under the Company Law that came into effect in February 2012. In addition to these two laws, the Founding Acts and each company's articles of association (except for LLCs) also govern the rights, duties, and liabilities of the "founder" (in the case of PEs) or the "shareholder" (in the case of JSCs and LLCs) toward the enterprise, and vice versa. The activities of both groups are also regulated by sector-specific laws, although those laws focus more on sector policy-making and regulation rather than governance. A third group are those belonging to the PA portfolio, whose governance is still defined by old company laws from the 1990s and the first half of 2000, which for other companies were replaced by the new company law of February 2012.
The state’s ownership rights are exercised mainly by line ministries—an arrangement that has often resulted in fragmented ownership and a lack of accountability for decision making and performance. Per the PE Law, the Republic of Serbia is the founder of PEs and the ownership rights are exercised by the Government of Serbia, which directly appoints PE boards and management, approves the annual business plans and development programs, and also approves a range of decisions related to, e.g., establishment of subsidiary companies, investments, prices, and profit distribution. For all practical purposes, however, given the direct reporting line between them and SOEs line ministries act as de facto owners. Line ministries manage the preparation, review, and approval of SOE business plans; nominate candidates for SOE boards and management; supervise SOE day-to-day operations; and monitor the performance of the enterprises in their portfolios. These arrangements result in a number of problems, among them: (1) the potential for conflicts between the policy-making and ownership roles of line ministries, since ministry SOEs can pursue policies that create disadvantages for private companies operating in the sector; (1) a lack of consistent approaches and good practices, which is often a result of different skill levels within government bodies (e.g., for drafting proper business plans); (3) increased scope for interference in day-to-day commercial decision-making, thereby undermining SOE boards; and (4) a lack of adequate monitoring and oversight of the SOE sector as a whole. To address some of these issues, the government in April 2015 adopted a decree to regulate the roles and responsibilities of the Ministries of Finance and Economy and line ministries for SOE monitoring, governance, financial reporting and transparency. It is moving to enhance the financial monitoring of SOEs by the MoF fiscal risk management unit.
Box 5.1: Legal Framework Governing the SOEs
Direct Budget Subsidies
5.6. The high direct budget subsidies to SOEs are largely due to the inefficiency of unreformed public utilities. Over the last five years, direct budget subsidies to SOEs averaged 0.9 percent of GDP, yet despite this significant support, most SOEs do not perform well in terms of either financial results (obvious from the combined SOEs losses of more than €1 billion in 2013) of operational efficiency.
5.7. By far the biggest SOE recipient of direct budget subsidies is Railways of Serbia. For the last five years, direct budget subsidies to Railways has averaged 0.4 percent of GDP annually, though gradually declining (from 0.47 percent of GDP in 2011 to 0.34 in 2014 and 0.30 in 2015). Railways of Serbia is characterized by overstaffing, declining passenger and freight traffic, and lack of investment in network upgrade, among other problems; because its revenues are less than half its operating expenditures, it depends fully on government support to stay afloat.22 In the Fiscal Strategy for 2015–17, as part of the IMF SBA the government has committed to a major restructuring of the company. The first steps were taken in early 2015: the Railway Reform Steering Committee was
22 For a detailed analysis see a Railway Policy Note, prepared by the World Bank team in 2014.23 Since the company is part of the consolidated general government budget, the effect of the change is budget-neutral.
established, and then the company was unbundled into separate passenger, freight, infrastructure, and holding company. The corporate restructuring plan centers on asset disposal, network re-optimization, and staff rationalization. It is expected that as a result of the restructuring, starting in 2018 the freight section will receive no further subsidies.
5.8. Roads of Serbia also receives substantial direct budget subsidies, which over the last three years averaged 0.2 percent of GDP annually, although until 2012, it did not receive any. However, in 2012 the financing model for the roads changed. With some revenues from tolls and excises redirected from the company budget to that of the central government, the company began to rely on direct budget subsidies from the state.23
5.9. JP Resavica, a coal mining company, is the third largest recipient of subsidies. Resavica’s direct budget subsidies have been going up: from 0.05 percent of GDP in

46
II. OPPORTUNITIES AND OPTIONS FOR FISCAL CONSOLIDATION
2012 to 0.11 in 2014. The company is probably not viable without direct budget support or a privatization that would reorganize the company to attract new investment. The government plans to resolve this company using a strategic partnership model, but it is not clear whether any investors are interested in the company.
5.10. Until 2012 companies in the Privatization Agency portfolio received considerable direct budget support, but have received far less since then. Until 2012 these companies had received on average about 0.3 percent of GDP annually in subsidies. By 2014 this was down to less than 0.05 percent. As the privatization process is completed, this form of state support is expected to disappear, although there is a risk that privatization delays or reversals could lead to continued or even increasing subsidies to these companies.
Debt Guarantees and Debt Service
5.11. Since in the past few years debt guarantees have become one of the main ways several large SOEs are supported, as a result the stock of debt guarantees has gone up sharply and so has the amount of debt service for called guarantees. The stock of state guarantees have gone from about 3 percent of GDP in 2007 to just under 8 percent in 2014 (Figure 5.3). In the same period the amount of debt service from called guarantees went from zero percent in 2007 to about 1.2 percent of GDP in 2014 and the situation is expected to worsen (Figure 5.4).
5.12. Until 2010 debt guarantees were used primarily to support public utilities investing in major infrastructure projects. However, in recent years, guarantees have been
Figure 5.3: Guaranteed Debt, 2007–14 (Percent of GDP)
Figure 5.4: Debt service for Guaranteed Debt (Interest and Principal) (Percent of GDP)
0.0
2.0
4.0
6.0
8.0
10.0
2007 2008 2009 2010 2011 2012 2013 2014
Liquidity - Other
Liquidity - Srbijagas
Projects - Other
Projects - Fiat
Projects - EPS
Projects - Railroads
Projects - Roads
0.0
0.2
0.4
0.6
0.8
1.0
1.2
1.4
2007 2008 2009 2010 2011 2012 2013 2014 2015
2016 2017
Agroziv
Smederevo Steel Mill
Galenika
Air Serbia
Railroads
Roads of Serbia
Srbijagas
p p p
Source: MoF.
Source: MoF.

47
II. OPPORTUNITIES AND OPTIONS FOR FISCAL CONSOLIDATION
issued to support SOE liquidity—in effect, replacing direct budget subsidies (Figure 5.3). In the last few years, guarantees have been issued not only to public utilities but also to several commercial SOEs, most notably Zelezara Smederevo and Galenika, in effect subsidizing commercial companies.
5.13. Most of the recent increases in guarantees has been for liquidity support to Srbijagas (Figure 5.3), which has been in constant financial difficulty. Low collection rates (typically less than 70 percent), driven primarily by inability to enforce payment from companies being restructured, such as Petrohemija, Azotara, and MSK, have been a problem but so have been the arrears of some district heating companies, the addition of noncore companies to its balance sheet through debt-equity swaps, and unfavorable pricing policy. Also contributing to the surge in debt guarantees have been roads, railways, EPS, and other companies, but these guarantees have mostly been for investment projects.
5.14. The growing stock of debt guarantees has pushed up amortization of debt service on called guarantees, particularly for Srbijagas, but also for Roads of Serbia and Serbia Railways. Amortization of called guarantees can be expected to stay elevated for the next several years (Figure 5.4). Now, however, the government has taken major steps to reduce the issuance of new guarantees; the 2015 Budget Law mandates no new state guarantees for liquidity support and quantitative limits on new guarantees for projects; this is a performance criterion for the IMF program.
5.15. Reforming major public utilities is critical to reduce debt guarantees and amortization, and thus ease the budgetary and debt pressure exerted by public utilities. The corporate restructuring plan for Srbijagas adopted in December 2014 unbundles distribution. The government also plans to divest non-core assets and resolve the companies that have accumulated the largest arrears to Srbijagas (Petrohemija, Azotara, MSK, Zelezara Smederevo). A separate financial restructuring plan is expected to be developed, which will be based on improved collection and higher transit and network fees. With regard to EPS, a deterioration of its financial position could present a major risk to the state budget. The government has committed to its comprehensive reform, which will streamline the organizational structure and management, right-size staff, and financial restructure the company based on improved collections, higher efficiency, cost savings, and tariff increases. The World Bank and the EBRD are supporting the EPS reforms.
5.16. If GoS manages to shift the debt service obligation from its books to enterprises which benefited from guarantees, savings could be significant. If all guarantees
issued to commercial SOEs are activated budget would need to pay about EUR 400 million annually to cover for those. However, if the government manage to restructure some of those enterprises benefitting most from guarantees, and require from those enterprises to service at least some if not all the debt savings could be between 0.3 and 0.4 percent of GDP annually (between 2016 and 2017)24 .
Indirect Support through Foregone Taxes, Contributions, and Utility Bills
5.17. Indirect support to SOEs is nontransparent, distortive, and inefficient. Some SOEs, especially those in the PA portfolio, receive a range of indirect support in the form of unpaid taxes, contributions, and utility bills. Altogether, indirect support for SOEs is estimated at more than €200 million, 0.6 percent of GDP, annually. Companies being restructured have accumulated more than €2.5 billion, 7.5 percent of GDP, of liabilities to the state as a creditor. Of this, according to the PA data, at least €400 million (1.2 percent of GDP) is towards public utilities. These companies also owe more than €2 billion of debt to private creditors, which so far has not been called in because the Privatization Law has so far provided protection against creditors. This protection was extended for another year for largest 17 enterprises in mid-2015. Beyond the fiscal implications, the indirect support tips the playing field against the private sector.
5.18. Some large public utilities benefit from the indirect support, but others are adversely affected by it. The Railways of Serbia continue to accumulate arrears to EPS, estimated in 2014 at € 10 million; and the accumulation in the first three months of 2015 was at the same pace as in 2014. The Railways of Serbia and RTB Bor, a copper smelter in the PA portfolio, are two of the largest debtors to EPS, undermining its financial position. And as already mentioned many of the financial difficulties of Srbijagas are caused by arrears accumulated by companies from the PA portfolio.
5.19. Although these indirect subsidies do not constitute a direct budget expenditure, they still have significant fiscal implications. Unpaid utility bills create problems for public utilities25, in particular in Srbijagas and EPS, which then results in their needing further guarantees or their guarantees are called and the government must amortize them. Moreover, the protection from creditors enjoyed by companies being under restructuring is seen
24 Under the assumption that GoS continues to service the debt of Railways, Roads of Serbia and for companies where such arrangement is part of the privatization agreement. In addition, it is assumed that only a portion of the guaranteed debt is assumed by SOEs.25 Some of these problems will be eventually resolve by revisions of the Law on Payment Deadlines, which is supported by the IMF program.

48
II. OPPORTUNITIES AND OPTIONS FOR FISCAL CONSOLIDATION
by the business community as a major distortion of the playing field and a significant deterrent to more private investment—finalization of privatization is regularly identified as a high priority by the Foreign Investors Council and other business groups.
B. State Support to Agriculture
5.20. Budget support to agriculture has been volatile in recent years and the policy objective is not clear. Agricultural subsidies support a range of programs in Serbia, from general services and support through output payments, rural development support, market support, and input subsidies to area and animal payments. Until 2011, most direct payments to producers consisted of input subsidies for diesel fuel and fertilizer, with the rest provided as price subsidies for cereals and oilseeds. Today, area and animal payments account for 60 percent of all direct payments, input subsidies for 20 percent, and producer subsidies for 15 percent. The significant variation in types and levels of support has created disincentives for long-term planning and investment in farms and agro-processing. Furthermore, as the following review will demonstrate, the current system of support based mainly on area and animal payments is not the most appropriate way to make Serbian farms more productive and competitive during the process of EU accession. It should be rethought over the medium term.
Current Types of Support
5.21. Budget support for agriculture has averaged about 4 percent of total spending (about 1 percent of GDP) since 2008. While this is lower than in Croatia and FYR of Macedonia, it seems reasonable for a middle-income economy where the share of agriculture in total GDP is about 15 percent (Table 5.3).
Table 5.3: Public Spending for the AgriFood Sector in Rural Areas (€/Ha utilized agriculture area – UAA)
Source: Agricultural Policy and European Integration in Southeastern Europe, FAO; Budapest, 2014.
5.22. As noted, the support covers a wide variety of programs (see Box 5.2). Among factors that have made state support for agriculture less effective are year-to-year volatility in program spending, and the allocation of resources across programs, commodities, farm types, and regions, which in some cases have been out of balance or have not provided the right incentives.
5.23. State support to agriculture in recent years has been volatile (Figure 5.5). Until 2011, most direct payments to producers were in the form of subsidies for diesel fuel and fertilizer and the rest subsidized prices for cereals and oilseeds. Payments for input subsidies were scaled down in 2012, after area and animal payments were reintroduced. The area and animal payments now account for 60 percent of all direct payments, input subsidies for 20 percent, and producer subsidies for 15 percent. The budget allocation for general services and support is only 1–2 percent of expenditures, which severely limits the capacity to provide essential public services, such as extension, research, animal breeding, plant and animal health, soil fertility control, and border control.
Country Annual Expenditure (Less Export Subsidies)
EU 27 475.9
Croatia 378.8
FYROM 147.7
Republic of Serbia 68.6
Montenegro 67.3
Bosnia and Herzegovina 48.4
Albania 24.1
Box 5.2: The Main Budget Support Programs for Agriculture
• Market support includes export refunds, intervention buying, and the costs of holding public reserves. In most years these measures accounted for less than 5 percent of total spending; they were phased out in 2011.
• Input subsidiesmainly cover diesel fuel and mineral fertilizer, although breeding animals were added in 2011. Until 2008 interest on short-term loans was also subsidized.
• Pricesubsidies, or output payments have mostly been used to support milk production. Wheat, sunflower and soybean prices were subsidized in 2004–2006 and tobacco prices until 2010.
• Areaandanimalpayments were first made in 2004–2008 and then re-introduced in 2012. Recently they have supported crop production (except vegetables and fodder crops) and dairy cattle.
• Ruraldevelopment measures emphasize support for investment by rural households in the renovation and construction of buildings, purchase of equipment and machinery, and renovation and planting of perennial crops. Priority is given to people in mountain areas and farmers under 40. Programs to diversify rural incomes and support farm enlargement and land consolidation were tried, but abandoned. Support for environmental protection is minimal; it is limited to the preservation of genetic resources and the development of organic farming.

49
II. OPPORTUNITIES AND OPTIONS FOR FISCAL CONSOLIDATION
Source: Ministry of Agriculture and Environmental Protection.
Figure 5.5: Budget Support to Agriculture by Type of Program (Million dinars, constant 2010 prices)
5.24. The volatility has contributed to the lack of clarity on agricultural policy. The significant variation in types and levels of support has created disincentives for long-term planning and investment in farms and agro-processing. The volatility is partly the result of year-to-year changes in budget support, particularly in 2009 when the allocation was cut by 30 percent – as shown in Figure 5.526 Continual changes to the forms of government support and changes to the level of spending on different programs are further sources of instability. Even within programs, eligibility criteria and level of support can change more than once in a single season. While the frequent changes in government may have heightened the volatility, at the core been the lack of clarity about policy.
5.25. The increasing emphasis on direct payments to farmers has caused a steep drop in support for rural development, from 6.8 billion dinars in 2006 (44 percent of spending) to 1.9 billion dinars in 2013 (7 percent). Producer subsidies (including area, output, and animal payments and input subsidies) are now the priority rather than promoting investment by farmers and agro-processors and support for farm restructuring. Some additional support for rural development comes from the Vojvodina regional government and local municipalities. Of the Vojvodina government’s 2015 agricultural budget of RSD 7.15 billion for 2015, RSD 680 million is allocated for investment and rural development – up from RSD 203 million in 2013. In 2013 and 2014 some 1,700 Vojvodina farms were provided with grants, low-interest loans, and loan guarantees to support investment in greenhouses, hail nets, irrigation, animal production, and household agro-processing. Another program provides annual payments of RSD 8,000–11,000/ha to farmers over 65 as an incentive to lease their land to younger famers. Local municipalities also finance a range of rural development activities, funded by
grants from government ministries. Some 64 municipalities requested funds of RSD 1.5 billion for rural development in 2013. Total public expenditure on rural development for 2013 (all sources combined) thus amounted to RSD 3.6 billion. This is still low relative to total public spending on agriculture, and for rural development needs.
5.26. Access to Ministry of Agriculture support programs is also problematic. The eligibility criteria for registration with the Farm Payment Agency (FPA) have been changed several times, and the institutional base for registration and payments still lacks capacity to cater to the hundreds of thousands of small farmers. Eligibility was limited in 2009 by restricting access to rural households with fully paid contributions to the Farmers Pension Fund. Since many rural people don’t use other pension insurance schemes, this excluded many potentially suitable beneficiaries. Further, new restrictions reduce support levels for older farmers (over 65 years old).
Beneficiaries of Budget Support
5.27. Trends in the number of beneficiaries have tracked the amount of budget support, rising until 2008, then falling after the budget cuts in 2009, and recovering slightly since 2011 (Figure 5.6). Only active farmers registered with the FPA can access support. Central Serbia has the highest number of beneficiaries, consistent with the high number of farmers in Sumadija, while Western Serbia, Vojvodina and Southern and Eastern Serbia have a similar, much lower, number of farmer beneficiaries.
0.0
10,000.0
20,000.0
30,000.0
2006 2007 2008 2009 2010 2011 2012 2013
Input Subsides
Area/Animal Payments
Rural Development
Other Support Measures
Output Payments
Market Support
General Services and Support
26 Excludes additional budget support for Vojvodina from the regional government.

50
II. OPPORTUNITIES AND OPTIONS FOR FISCAL CONSOLIDATION
5.28. Vojvodina farmers receive the largest allocation of budget support, despite the lower number of active farmers, due to the larger average size of farms in this region. Analysis of FPA payments for 2013 for
crop production, fuel subsidies, and crop and animal insurance shows that 60 percent went to Vojvodina, 24 percent to Sumadija and Western Serbia, and 9 percent to Southern and Eastern Serbia (Table 5.4). In 2013 these payments accounted for two-thirds of total budget support for agriculture. Note also the high average payments per active farm in Vojvodina and the low average payments in Southern and Eastern Serbia. There were no equivalent data available for livestock payments, but the regional allocation is likely to be similar to that for crops (see below).
5.29. Among commodities, cereal and industrial crops and dairy production are the major beneficiaries of budget support. The benefits of input subsidies, the main crop support vehicle, typically accrue to major crops, such as maize and wheat, and industrial crops, such as oilseeds and sugar beet. As the main producer of these crops, Vojvodina receives the highest proportion of direct payments for crop production.
Table 5.4: Budget Support for Crops, Fuel, and Insurance by Region, 2013
Figure 5.7: Milk Subsidies and Dairy Production, 2004–13
Sources: Ministry of Finance, Farm Payment Agency data, Bank Staff Calculations.
Sources: Ministry of Agriculture; Republic of Serbia Statistical Office.
Figure 5.6: Number of Active Farmers, 2006–13
Source: Farm Payment Agency.
0
100,000
200,000
300,000
400,000
2005
2006
2007
2008
2009
2010
2011
2012
2013
Serbia
Central Serbia
Southern and Eastern Serbia
Vojvodina
Sumadija and Western Serbia
500
0
1,000
1,500
2,000
2,500
3,000
3,500
4,000
4,500
0
100,000
200,000
300,000
400,000
500,000
600,000
700,000
800,000
2004 2005 2006 2007 2008 2009 2010 2011 2012 2013
Cow
Num
bers
/Pro
duct
ion
per c
ow
Prod
uctio
n/Su
bsid
ies
Dairy Cow Numbers Production/Cow Nominal Milk Subsidy (m dinar) Milk Production (million litres)
Expenditure (RSD ‘000)
Percent of Total Number of Active Farmers
Average Payment per Active Farmer (RSD)
Vojvodina 10,220,218.4 59.4% 81,847 124,870
Central Serbia 638,288.3 37.1% 235,353 27,122
Sumadija and Western Serbia 4,069,764.7 23.7% 151,569 26,851
Southern and Eastern Serbia 1,463,739.1 8.5% 83,874 17,452
Other areas 587,997.1 3.4% na na
Total 17,191,503.7 100.0% 317,200 54,198

51
II. OPPORTUNITIES AND OPTIONS FOR FISCAL CONSOLIDATION
5.30. In all cases, farm structure conditions the impact of budget support on production and performance. Vojvodina has been in a better position to seek support for crop production because it has a much greater proportion of larger farms (> 20 ha) that can benefit from demand for Serbia’s cereal and oilseed crops. The minimal response to milk subsidies reflects constraints related to farm structure. Dairy production is inhibited by the limited capacity or incentives for dairy farmers with fewer than 10 cows, who account for 87 percent of dairy farms and 60 percent of dairy cows, to raise more cows in order to reach the production threshold required for milk subsidies.27 Although it has a relatively small proportion of total dairy cows, Vojvodina is in the best position to benefit from milk subsidies because it has the highest proportion of larger herds (20 cows or more).
Reforming State Support to Agriculture
5.31. There is a considerable scope to improve the effectiveness of budget support for agriculture. This should begin by extending the policy focus to the medium-sized farmers who dominate Serbian agriculture, in order to broaden and deepen the basis for sector growth. A clearer focus would also help to stabilize the often erratic nature of agricultural policy, which is due in part to a lack of clarity on sector priorities.
5.32. Rebalance state support to favor rural development: A re-balancing of sector support is also required, with more resources should be allocated to support investments and rural development and less to direct budget support. This rebalancing would strengthen the government’s capacity to respond to the needs of medium-sized farmers for investment support and farm size expansion. The milk subsidy, which accounts to about 0.1 percent of GDP, should be phased out.
5.33. Facilitate increased farm size. The differing patterns of response to subsidies, by region and by commodity, show that direct subsidies have little impact on production where farm structure is not conducive to investment. The milk subsidy makes this especially apparent. Several critical changes are required to the budget support framework in the short term. To begin with, government should recognize how important land leasing is for increasing farm size by allowing farmers to access budget support for land leased from the state. Leases or rental agreements could be registered with the FPA to minimize fraud, but leased land should not be classified as ineligible for budget support, as it currently is.
5.34. Target area and animal payments more effectively. Area and animal headage payments reduce the incentive to raise production because they provide
support no matter what a farmer’s output. This is especially true for mixed-income farmers. Since farm earnings are unlikely to be a major source of household income for these holdings, they are likely to view government support as an income supplement rather than a resource to raise investment and productivity. Area and animal payments thus preserve a farm structure dominated by smaller farms, when the policy should be to change this structure by increasing farm size. A more targeted area and animal payments system would encourage farms to expand through land purchase or rental, thus addressing constraints imposed by the current farm structure. Rural households unwilling to increase the size of their farms could be given a supplemental area-based payment if they leased their land to farmers younger than 45.
5.35. Introduce a subsidy cap: At the larger end of the farm spectrum, policy makers need to limit the level of support provided to very large farms that have less need of public support. In the EU and other western countries, this is achieved through payment caps that set an upper limit on the total budget support a single farm can receive. The analysis of farm structure suggests that payments should be capped for farms of 100 ha or more or those with a standardized output of more than €100,000. This would affect about 0.5 percent of all agricultural holdings larger than 2 ha (approximately 1,850 farms), of which most (about 1,600) are in Vojvodina. These farms account for about 24 percent of land use, 10 percent of livestock, and 17 percent of sector output. The savings in subsidy payments could then be used either to reduce budget spending or be allocated to other programs. In December 2014, the Law on Agriculture was amended to eliminate subsidies for land over 20 ha and land leased from the Government of Serbia.
EU Support for Rural Development and Alignment with the Common Agricultural Policy
5.36. The Instrument for PreAccession Assistance in Rural Development 2014–20 (IPARD) is an EU program of support to preaccession countries to prepare their agriculture sectors for EU membership; it can substantially boost the resources Serbia can use for agriculture support (Box 5.3). Of the €175 million provided by the EU, most (€138.25 million) will be allocated for investment in commercial farming and agro-processing to improve competitiveness. This will be supplemented by smaller programs to support rural development and sustainable land management.
27 Dairy farmers need at least 5 milking cows to be eligible for milk subsidies (3,000 liters of milk per quarter sold to a commercial processor), a herd of at least 8–10 cows is required.
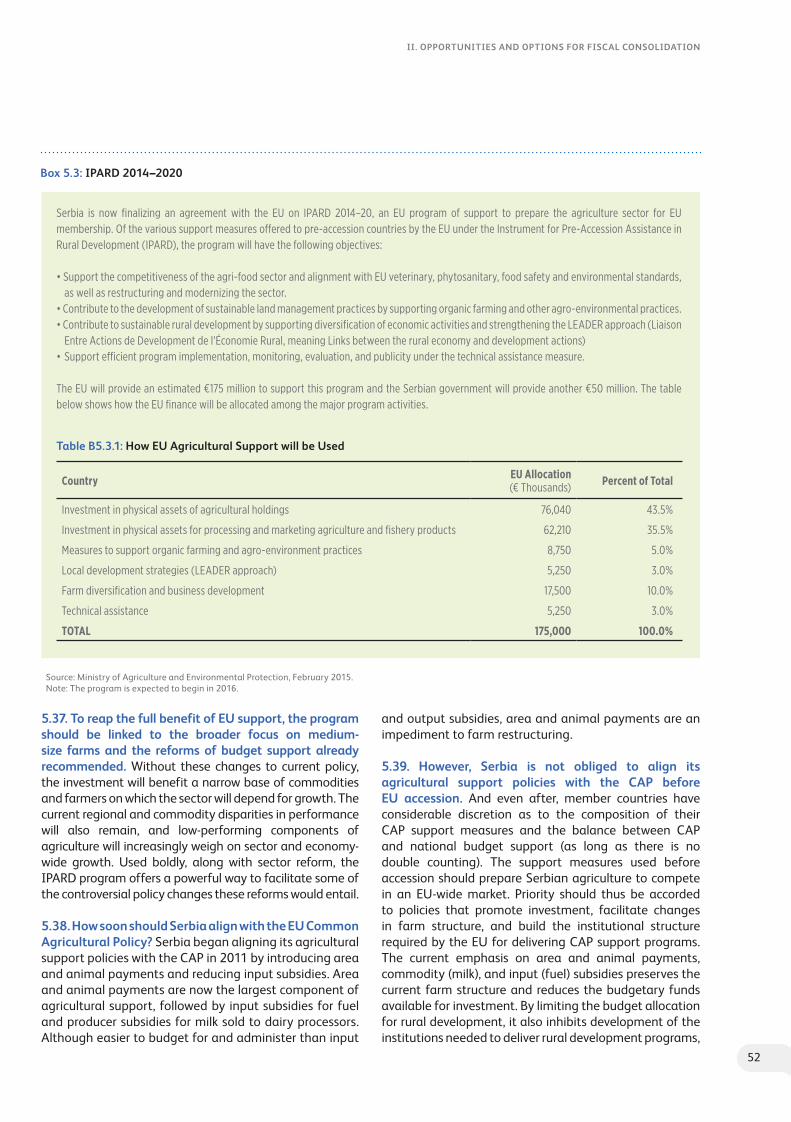
52
II. OPPORTUNITIES AND OPTIONS FOR FISCAL CONSOLIDATION
Serbia is now finalizing an agreement with the EU on IPARD 2014–20, an EU program of support to prepare the agriculture sector for EU membership. Of the various support measures offered to pre-accession countries by the EU under the Instrument for Pre-Accession Assistance in Rural Development (IPARD), the program will have the following objectives:
• Support the competitiveness of the agri-food sector and alignment with EU veterinary, phytosanitary, food safety and environmental standards, as well as restructuring and modernizing the sector.
• Contribute to the development of sustainable land management practices by supporting organic farming and other agro-environmental practices.• Contribute to sustainable rural development by supporting diversification of economic activities and strengthening the LEADER approach (Liaison
Entre Actions de Development de l'Économie Rural, meaning Links between the rural economy and development actions)• Support efficient program implementation, monitoring, evaluation, and publicity under the technical assistance measure.
The EU will provide an estimated €175 million to support this program and the Serbian government will provide another €50 million. The table below shows how the EU finance will be allocated among the major program activities.
Box 5.3: IPARD 2014–2020
Table B5.3.1: How EU Agricultural Support will be Used
Country EU Allocation(€ Thousands) Percent of Total
Investment in physical assets of agricultural holdings 76,040 43.5%
Investment in physical assets for processing and marketing agriculture and fishery products 62,210 35.5%
Measures to support organic farming and agro-environment practices 8,750 5.0%
Local development strategies (LEADER approach) 5,250 3.0%
Farm diversification and business development 17,500 10.0%
Technical assistance 5,250 3.0%
TOTAL 175,000 100.0%
5.37. To reap the full benefit of EU support, the program should be linked to the broader focus on mediumsize farms and the reforms of budget support already recommended. Without these changes to current policy, the investment will benefit a narrow base of commodities and farmers on which the sector will depend for growth. The current regional and commodity disparities in performance will also remain, and low-performing components of agriculture will increasingly weigh on sector and economy-wide growth. Used boldly, along with sector reform, the IPARD program offers a powerful way to facilitate some of the controversial policy changes these reforms would entail.
5.38. How soon should Serbia align with the EU Common Agricultural Policy? Serbia began aligning its agricultural support policies with the CAP in 2011 by introducing area and animal payments and reducing input subsidies. Area and animal payments are now the largest component of agricultural support, followed by input subsidies for fuel and producer subsidies for milk sold to dairy processors. Although easier to budget for and administer than input
and output subsidies, area and animal payments are an impediment to farm restructuring.
5.39. However, Serbia is not obliged to align its agricultural support policies with the CAP before EU accession. And even after, member countries have considerable discretion as to the composition of their CAP support measures and the balance between CAP and national budget support (as long as there is no double counting). The support measures used before accession should prepare Serbian agriculture to compete in an EU-wide market. Priority should thus be accorded to policies that promote investment, facilitate changes in farm structure, and build the institutional structure required by the EU for delivering CAP support programs. The current emphasis on area and animal payments, commodity (milk), and input (fuel) subsidies preserves the current farm structure and reduces the budgetary funds available for investment. By limiting the budget allocation for rural development, it also inhibits development of the institutions needed to deliver rural development programs,
Source: Ministry of Agriculture and Environmental Protection, February 2015.Note: The program is expected to begin in 2016.

53
II. OPPORTUNITIES AND OPTIONS FOR FISCAL CONSOLIDATION
thus restricting access to an increasingly important source of pre-and post-accession support for agriculture.
5.40. In the medium term area and animal payments need to be rethought. These payments are not the most appropriate way to make Serbian farms more productive and competitive during the process of EU accession. Indeed, the impact of area payments on farm productivity is highly questionable. The EU adopted area payments as a way to continue to extend considerable budgetary support to farmers with minimal impact on productivity. In fact Serbia needs maximum impact on productivity for minimum expenditure. Furthermore, neither Serbia nor the EU has objectives for area payments that could remotely be described as SMART,28 and it is hard to discuss how best to target payments without knowing what goal they are supposed to achieve. Basic area payments are also inefficient as a means of improving the environment, since the payments tend to be applied equally in very different ecological conditions and thus are not related either to the value of the environmental goods produced nor to the cost of producing them. Finally, as a means of supporting rural development, agricultural area payments miss the point that the majority of rural income already comes from nonagricultural sectors, which are likely to be the main sources of economic growth. While an urban-rural income transfer could bring a small net benefit to rural areas, it would also inhibit overall economic growth.
C. State Support to the Private Sector
5.41. The current system of state support for private investment and export promotion is fragmented and nontransparent, and it lacks an effective evaluation system. These agencies have overlapping mandates, and there are no clear coordination mechanisms or links to broader economic policy goals, e.g., value chains with solid export potential. Although significant public resources are spent on the support programs, it is not clear what their outcomes are and whether public resources are used efficiently. None of these agencies has been through a thorough impact assessment to evaluate results, although the few analyses that have been done indicate serious problems in their operations.29
5.42. State support to the private sector is mainly of two types: subsidies for strategic investors and support
28 Specific, Measurable, Achievable, Realistic, and Time-bound.29 See, for example, the two reports of the Anti-Corruption Council on the operations of the Development Fund and undue political influences http://www.antikorupcija-savet.gov.rs/izvestaji/cid1028-2585/izvestaj-analiza-politickog-uticaja-na-poslovanje-fonda-za-razvoj-republike-srbije and this report on the problems related to a program of subsidizing railcar production http://www.antikorupcija-savet.gov.rs/izvestaji/cid1028-2788/izvestaj-o-nenamenskom-trosenju-budzetskih-sredstava-na-programu-proizvodnje-i-remonta-sinskih-vozila-za-potrebe-zeleznice-srbije-ad (both reports available in Serbian only).
for export and investment promotion programs and development agencies. State subsidies to strategic investors mainly include subsidies to Fiat, the automobile company, and Air Serbia: in 2013–15 direct subsidies to the two averaged about 0.25 percent of GDP annually. While it is too early to estimate their full impact, some preliminary indications seem positive: Fiat has become by far the largest exporter in Serbia, and Air Serbia has completely revamped its fleet, significantly expanding its network, and after years of losses recorded a modest net profit in 2014. Because details of the contracts signed with both investors are not fully known, the full economic and fiscal impact of these transactions is difficult to estimate.
Support through Export and Investment Promotion Institutions
5.43. State support for private investors is currently administered by four different national agencies and a network of regional development agencies, all of which report to the Ministry of Economy (MoE):
•TheSerbianInvestmentandExportsPromotionAgency(SIEPA) is dedicated to helping foreign investors and buyers while raising Serbia's profile among international business leaders. Created by the government in 2001 with a mission to support both foreign companies seeking to set up or expand business in Serbia and Serbian companies doing business abroad, it administers per-job-created subsidies for private investors. Between 2007 and 2013, SIEPA spent in total about €260 million for these incentives, 0.8 percent of 2014 GDP.•TheaimoftheDevelopmentFund(DF) is topromote
economic development, improve competitiveness and foster employment and balanced regional development. It runs several subsidized loan programs, mostly targeting SMEs. Typically, these are for buying equipment, although in some cases, they are for operational capital. The programs are financed from their own revenues. In 2013 they amounted to about €100 million (0.3 percent of GDP) and in 2015 about €40mn (0.13 percent of GDP). The DF also administers loan programs financed from the budget; in 2014 about €65mn (0.2 percent of GDP) went to these activities, and in 2015, about €28mn (0.1 percent of GDP) is planned. The DF has also administered soft loans to SOEs from the PA portfolio, but these have plunged in recent years. Recent reports from the Anticorruption Council highlights several weaknesses in DF operations, many of them stemming from undue political influence and a lack of transparency.•The Export Credit and Insurance Agency (AOFI) was
established by law to promote exports and build foreign economic relations. It runs programs for short-term

54
II. OPPORTUNITIES AND OPTIONS FOR FISCAL CONSOLIDATION
export financing, factoring, export credit insurance, and guarantees, financed mostly through its own revenues. Over the past eight years the cumulative value of its programs is several hundred million Euros. •The National Agency for Regional Development
(NARD) was founded in 2009 at the discretion of the Government of the Republic of Serbia as a public agency tasked with professional and regulatory tasks of regional development. It runs subsidy programs, mostly targeting small and micro companies. NARD is the primary resource for information and coordination of institutional, entrepreneurial, and individual initiatives to develop all regions.
5.44. The government recently launched an initiative to consolidate and reform these agencies in order to make them more transparent and efficient and to align them with EU state aid policies. New and redesigned services are expected to be directed mainly to investment and export promotion, with a view to providing greater value to investors and exporters. Experience from successful agencies shows that export promotion would include building the image of the country (advertising but also advocacy); export support (exporter training, technical assistance, capacity building, especially in regulatory compliance, information on trade finance, logistics, customs, packaging, pricing); marketing (trade fairs, exporter and importer missions, follow-up services by representatives abroad); and market research and publications (general, sector, and firm-level information, such as market surveys, on-line information on export markets, publications encouraging firms to export, importer and exporter contact databases). Best practice suggests that good investment promotion intermediaries are customer-oriented, anticipating well in advance the information needs of potential investors. They are also prepared to provide easily navigable data on the resources and costs of doing business in an economy so that can investors can quickly do cost-benefit analyses. The reforms in Serbia are expected to move export and investment promotion services toward these best practices.
D. Conclusions and Recommendations
5.45. Much can be done to reduce state support to SOEs and increase the efficiency and effectiveness of subsidies to agriculture and the private sector.
Support to SOEs•AccelerateresolutionofthePAportfolio.Althoughthis
would have little direct impact on the budget, without it consolidating large public utilities will be very difficult.•Move quickly to reorganize large public utilities to
improve their financial performance and relieve the
budget of both subsidies to them and debt service for them.•Enforce strict payment discipline between SOEs with
zero tolerance for accumulation of arrears. To this end the government plans to expand the coverage of the Law on Payments in Commercial Transactions to cover transactions between public entities (for example, payments by Railways for electricity). This is a structural benchmark for the IMF program.•Eliminatealldebtguaranteesforliquiditysupport.Since
January 1, 2015 the government has not been issuing any new guarantees for liquidity support and is limiting project guarantees.
Support to Agriculture•Makesupportmorepredictableandimprovethepolicy
framework in general.•Rebalancestatesupportwithmoreresourcestosupport
rural development and less for direct budget support. •Facilitatethemovetolargerfarms,recognizetheroleof
land leasing in increasing farm size, and allow farmers to access budget support for leased as well as owned land. •Tightenthetargetingofareaandanimalpaymentsto
encourage farm expansion through, e.g., land purchase or rental or offer supplemental area-based payment if household lease land to farmers under 45;•Capsubsidiesandpayments,settingalimitonthetotal
budget support a single farm can receive, to limit the amounts provided to very large farms that have less need of public support.
Support to the Private Sector•Reform the state development and export promotion
agencies to ensure transparency and linkage to economic strategy generally, and periodically assess their effectiveness.

55
V. SUBSIDIES AND STATE SUPPORT TO THE ECONOMY
III. Opportunities for Improving the Efficiency and Equity of Public Spending in Social Sectors


57
III. OppOrtunItIes fOr ImprOvIng the effIcIency and equIty Of publIc spendIng In sOcIal sectOrs
CHAPTER 6. EDUCATION
6.1. Access to primary and secondary education is high, but coverage of preschool education is low by international standards. For the Roma community access to all levels of education is significantly lower than for the Serbian population as a whole, particularly for early childhood development (ECD) programs. Low ECD enrollments are a serious concern because education benefits are cumulative: children who participate in quality ECD programs later have higher cognitive development and school outcomes. Because ECD programs impart generic skills and ability to “learn how to learn,” it is more difficult and costly for individuals to catch up if they have a disadvantageous start. Among educational investments, ECD therefore offers the highest returns. This is particularly true for the marginalized Roma community, because their labor force participation is projected to rise over time.
6.2. Public spending on education at about around 5.2 percent of GDP, higher than regional peers, but the outcomes are far worse. As will be seen from this chapter, Serbia can heighten the efficiency of its education system by consolidating the school network, reducing and realigning the number of teachers, and introducing per capita financing. Serbia has an oversupply of teachers and the student population is declining. As a result, student teacher ratios are low: 12.7 for primary education and 11.1 for secondary. Because there are so many of them, teachers are the most expensive budget item. However, the World Bank analysis for Serbia (2012) reveals that teacher quality, not quantity, matters most to student learning. A possible solution to the large number of teachers would be to redeploy them, where possible, to expand preschool education coverage. The school network needs to be right-sized to reflect the demographic decline. While work has begun on this front in some municipalities, there is room to promote school network rationalization from a supra-municipality point of view and to include secondary schools. Resource allocation would be more effective if it were more transparent and would be enhanced by a move from inputs- based to per capita financing. Serbia has already begun to do this.
6.3. The objectives of this chapter are fourfold: (1) Review the status and quality of education and access to it in Serbia. (2) Provide a brief overview of how resources are allocated in education. (3) Identify opportunities for efficiency gains by consolidating the school network and the number of teachers and introducing per capita financing. (4) Provide complementary measures that, in addition to efficiency, can help improve the quality of service delivery. The analysis is directed to pre-university education, with brief attention to preprimary education, which is mostly a responsibility of local governments. 30
A. Quality of and Access to Education in Serbia
Quality of Education
6.4. Despite significant public spending, the quality of education in Serbia is still low. The government spends 5.2 percent of GDP (€1.5 billion) annually on education. Although higher than for most peers from the region, the amount is comparable to the average for OECD countries (5.3 percent of GDP). However, what matters significantly for learning is how resources are spent, because higher spending does not necessarily translate into higher learning outcomes (Hanushek 1986). Serbia’s performance is consistent with its per student spending in education but there is room for improvement. For instance, countries with similar per student spending, like Croatia and Latvia, perform better in international student assessments like PISA (Program for International Student Assessment; see Figure 6.1).31 Poland has demonstrated that with the same amount of resources for education and the right policies, student learning can be significantly improved.
6.5. PISA scores are in particular low. PISA is an international assessment that measures cognitive skills and how effectively students can apply their reading, mathematical and scientific skills to solve real-world problems.32 The latest PISA results (2012) show Serbia students behind the OECD average by about 1 year of schooling in mathematics. Serbia also has a much larger share of students that do not achieve basic proficiency. This is problematic because countries with a large proportion of students below proficiency averages are likely to lag when those students join the workforce (OECD 2014). The EU 2020 target is to have no more than 15 percent of students below PISA level 2. In Serbia 40 percent are considered functionally innumerate (below lever 2) in math and about 30 percent of students who are functionally illiterate in reading.
30 Preschool education was to some extent covered in the World Bank Serbia Municipal Public Expenditure Review.31 PISA is a worldwide study of the performance of 15-year-old students in mathematics, science, reading, and, since 2012, problem-solving. According to the OECD, 40 PISA points is equivalent to what students learn in one year of school (OECD 2012).32 PISA seems to be a good predictor of economic growth—far better than average schooling level—and there is international evidence that an increase of 50 points in PISA scores is associated with about 1 percentage point higher annual growth (Hanushek and Woessman 2007), an impact that shows in the medium term as cohorts enter the labor force and lasts for a long time.

58
III. OppOrtunItIes fOr ImprOvIng the effIcIency and equIty Of publIc spendIng In sOcIal sectOrs
0 2000 4000 6000 8000 10000 12000 14000 16000
340
380
420
460
500
540
580
Latin America East Asia Western Europe & US /CanadaEurope and Central Asia
Mat
h Sc
ore
PISA
201
2
Public expenditures per pupil (in PPP dollars), UNESCO 2012 or latest
Hong Kong Korea
Japan Switzerland
Netherlands Estonia Finland Poland
Belgium Austria
Australia Ireland
Slovenia
Denmark New Zealand Czech Republic
France United Kingdom
Iceland
Latvia Norway Portugal
Italy Spain
Slovak Republic United States
Lithuania Sweden
Hungary Croatia
Serbia
Romania Cyprus
Bulgaria Kazakhstan
Thailand Chile Malaysia
Mexico
Argentina
Colombia Indonesia
Peru
Israel
Figure 6.1: PISA Performance and Public Spending on Education
Source: UNESCO; OECD; World Bank staff estimates
6.6. Learning strategies, individual factors, and school resources help explain why Serbia is not doing as well as comparator countries (Figure 6.2). Student learning strategies, influenced by parents and teachers, are the techniques pupils use when studying. Learning strategies explain 7 points of the difference in score between Serbia and the OECD and teacher practices another 2 points. Other individual factors and school resources also contribute to the difference, but more of the Serbia-OECD difference remains unexplained because it is difficult for PISA to capture all the factors that influence classroom practices and learning. But there is international evidence that teacher effectiveness is very important for learning (World Bank 2014).
6.7. PISA is a samplebased test that does not measure quality or efficiency at the school level. To measure school quality, national assessments are needed, which Serbia currently does not do. Investment in student assessments using standardized instruments would improve the effectiveness and efficiency of the education system and give policy makers information so that they can monitor student learning; linked to information on school spending, which is currently available, it would make it possible to gauge the efficiency of the school and the system.

59
III. OppOrtunItIes fOr ImprOvIng the effIcIency and equIty Of publIc spendIng In sOcIal sectOrs
Source: OECD 2009.
OECD EU Bulgaria Germany Croatia Hungary Slovenia
Individual Factors
Socio-economic (individual)
Preschool
Socio-economic (peers)
School Resources
Teaching Practices
Learning Strategies
Unexplained
Actual Gap
-10
0
10
20
30
40
50
60
70
Figure 6.2: Reading Gap, Serbia and Comparator Countries (PISA 2009)
6.8. An Education Management Information System (EMIS) linking access, quality, and finance data would improve education governance and better inform policy decisionmaking. Serbia does not have a system that provides timely and disaggregated student and school-level data, as most top- performing countries do. An EMIS system was supported by the World Bank Delivery of Improved Local Services (DILS) project but it is still at early stages. While there is school-level information from different sources (e.g., financing and education data), it has not yet been integrated into a single system. Production and dissemination of reliable education statistics is absolutely necessary for effective management of education and for monitoring progress toward national and global targets. Having data from all levels of education on such statistics as repetition, dropout, and completion rates, learning outcomes, and expenditures per school is required to keep track of performance and to hold teachers and schools accountable33.
Access to Education
6.9. Access to primary and secondary education is adequate and comparable with comparator countries, although uneven for Roma children. In contrast, access to early childhood education (ECE) is both low and extremely
inequitable (Table 6.1). Preschool (ECE) in Serbia reaches only 52 percent of boys and 49 percent of girls—very low in comparison to the EU 2020 target of 95 percent of children enrolled in preschool education (starting at age 4). Access for Roma children is dismal, reaching only 5 percent of Roma boys and 7 percent of Roma girls34 (Figure 6.3B). Over 80 percent of wealthy children are enrolled in ECE but less than 10 percent of children in the poorest quintile. Uneven access to ECE is attributed to a combination of municipal fiscal capacity and parental affordability. Households cited access constraints, such as the costs of attendance programs, as the second most frequent reason for children not being enrolled in ECE programs (Figure 6.3A). The lack of access to ECE, and to child care more generally, is an important reason why few women participate in the labor force in Serbia (World Bank 2015).
33 Recent evidence from Mexico shows that using results from standardized tests as a diagnosis tool to design school improvement plans can be a cost-effective way of improving the quality of education services (De Hoyos, Garcia, and Patrinos, 2015).34 Refers to Roma children living in informal settlements. Source: UNICEF, Serbia MICS5 2014 and Serbia Roma Settlements 2014.

60
III. OppOrtunItIes fOr ImprOvIng the effIcIency and equIty Of publIc spendIng In sOcIal sectOrs
Table 6.1: Gross Enrollment Rates, Serbia and Comparator Countries
Figure 6.3: Early Childhood Education in Serbia, 2014
Source: UNESCO, UIS, 2014; OECD (Education at a Glance, 2011); and Government of Serbia, 2014.
6.10. The returns on ECD investments are among the highest in education. Enhanced access to high-quality ECE for all children, with an emphasis on expanding access for the Roma population, offers dual benefits of bridging the gap between Roma and non-Roma children
and developing skills to meet labor market demands. Ideally, ECE investments could be derived by repurposing some existing school infrastructure and using excess human resources in the education sector to expand ECE coverage in fiscally neutral ways.
Source: Serbia Multiple Indicator Cluster Survey (MICS), 2014.
Child ta
ken ca
re at home
Costly se
rvices
Overcrowded fa
scility
The fasci
lityy is
too far/N
o organized
Both parents unemployed
Other exp
enses too high
Disabled
Not much learning in
ECE program
Low-le
vel of se
rvices
Poor treatm
ent0
10
20
30
40
50
60
70
0
10
20
30
40
50
60
70
80
90
Poorest Second Middle Fourth Richest
Non-Roma Roma
8.6 5.7
31.6
3.2
41.6
5.9
52.6
7.6
81.6
5.8
A. Reasons for Nonattendance (in Percent) B. Percentage of Children aged 36-59 months in an organized ECE program
Pre-primary (2012)
Primary (2012)
Lower Secondary (2012)
Upper Secondary (2012)
Serbia 58 101 99 86
Croatia 63 97 103 95
Poland 78 99 98 97
OECD* 83 102 n/a 99
Bulgaria 86 99 87 98
Hungary 87 100 101 102
Estonia 93 98 101 112
Slovakia 91 102 98 90
Slovenia 94 99 95 99
B. Financing Education: Where Does the Money Go?
6.11. Serbia’s public spending on education are higher than the regional average. The government spends about 5.2 percent of GDP a year (€1.5 billion) on education35 (Figure 6.4) which means that Serbia spends almost 1 percent of GDP more on education than neighboring ECA countries (Figure 6.4). Total public

61
III. OppOrtunItIes fOr ImprOvIng the effIcIency and equIty Of publIc spendIng In sOcIal sectOrs
expenditure per student36 has increased for all levels of education, primarily as a result of a declining student population (UIS 2014). Education accounts for about 16
percent of Serbia’s total budget, similar to what many neighboring economies spend, which makes it the single largest sector directly funded from the national budget.
6
5
4
3
2
1
0
Romania Slovak Republic
Bulgaria Czech Republic
Croatia Central Europe and the Baltics
Hungary Serbia Europe & Central Asia
Figure 6.4: Public Spending on Education(Percent of GDP)
Source: World Bank Indicators. Data are average for 2006-2011 except for Serbia, where data are for 2014.
Source: Government of Republic of Serbia
35 This includes the amount transferred to Vojvodina government, which is then paid as teachers’ salaries.36 Expressed in international dollars (current) and adjusted in terms of purchasing power parity (PPP).37 Overall, education is free and the government provide textbooks for students in the first cycle of primary education (Serbia 2014). 38 Data from August 2014.38 It appears from payroll data for August 2014 that the base salary of a primary education teacher is about RSD 3,799 and of a secondary education teacher is RSD 4,100.
6.12. Primary education accounts for the largest share of total government spending. Although central government finances all levels of education, most of its education spending, about 42 percent, goes to primary education,37 followed by tertiary, 25 percent, and secondary, 22 percent. Research and development receives 9 percent (Table 6.2).
6.13. As in other countries, more than 70 percent, of recurrent central government spending on education goes to salaries. Only 5.7 percent goes to capital spending. Serbia has 155,000 employees in education, 28.6 percent of total general government employment.38 Of those in the education sector, 118,000 are permanently employed. Salaries of teachers, like public employees, have gone up in the last decade. However, in an effort to improve the fiscal balance Serbia lowered teacher salaries in 2014 as part of the reduction of public sector salaries by 10 percent.39 Teacher salaries are relatively flat and not based on performance. A World Bank report (2012) found that urban teachers are paid only 1 percent more than rural teachers on average as a result of higher educational qualifications. Because salaries are flat, greater financial resources for rural and less affluent areas often translate into more teachers rather than more qualified teachers.
Table 6.2: Public Expenditures on Education in the Republic of Serbia, 20102012 (Percent of the GDP)
2010 2011 2012
Preschool 1.0 1.0 1.1
Primary 2.1 2.1 2.1
Secondary 1.0 0.9 1.0
Higher Education 0.8 0.7 0.8
Education not classified by levels and ancillary services in education
0.4 0.3 0.4
Total 5.2 5.1 5.3
6.14. Preprimary education spending is highly regressive, but primary education spending is propoor. There are geographical disparities in access to ECD programs because preschool education is primarily funded by municipal budgets, which widely differ in resources. Further, up to 20 percent of the cost of these ECE services are recovered by user fees, so that the poorest households are unable to afford them. As a result, households from the top quintile that can afford preschool services are the primary beneficiary of government subsidies. This is highly regressive. In contrast, spending on primary education seems to benefit the poor because it is targeted to rural schools and schools that serve students from lower socioeconomic backgrounds, although it is not enough to offset the gap in performance between rural and urban students. Nonetheless, the system keeps producing better educational outcomes for urban and more affluent populations (World Bank 2012).

62
III. OppOrtunItIes fOr ImprOvIng the effIcIency and equIty Of publIc spendIng In sOcIal sectOrs
Source: Serbia Statistical Office data.Note: Number of full-time equivalent (FTE) teachers calculated as full-time + 0.56 * part-time; the 0.56 is estimated from payroll data.
Source: Serbia Statistical Office data.
Figure 6.5: Students, Classes, and Teachers, Primary and Secondary Education, 2000–13
Figure 6.6: FullTime and PartTime Teachers, Primary and Secondary, 2008–12
C. Opportunities for Enhancing Efficiency
Reducing the Number of Teachers
6.15. Serbia has an excess of primary and secondary teachers. Even with a declining student population and fewer classes, the total number of primary and secondary teachers has gone up over the last two decades. In 2012, there were 21 percent fewer students in primary schools than in 2000 and 13 percent fewer in secondary schools. Meanwhile, the number of primary teachers increased by 18 percent and of secondary teachers by 25 percent (Figure 6.5). Although the number of full-time teachers has declined slightly since 2010, the number of part-time teachers has been growing. By 2012, part-time teachers made up 40 percent of the total teacher workforce, up from 27 percent four years earlier (Figure 6.6).
Students Teachers (FTE) Teachers Classes
80
90
100
110
120
130
70
2000
= 10
0
Primary
2000
2001
2002
2003
2004
2005
2006
2007
2008
2009
2010
2011
2012
2013
Students Teachers (FTE) Teachers Classes
80
90
100
110
120
130
70
2000
= 10
0
Secondary
2000
2001
2002
2003
2004
2005
2006
2007
2008
2009
2010
2011
2012
2013
Full Time Part Time
Primary
0
20000
40000
60000
2008 2009 2010 2011 2012
Full Time Part Time
Secondary
0
10000
20000
40000
30000
2008 2009 2010 2011 2012
Source: Serbia Statistical Office data.

63
III. OppOrtunItIes fOr ImprOvIng the effIcIency and equIty Of publIc spendIng In sOcIal sectOrs
6.16. Studentteacher ratios (STRs) in Serbia have gone down so much in recent years that they are now far below EU and OECD averages. At 12.7 students per full-time equivalent (FTE) primary teacher Serbia is below two-thirds of OECD member countries, average 15.4 students per teacher. A ratio of 11.1 in secondary schools is also far below the OECD average of 13.5 (Figure 6.7). If the high number of part-time teachers is taken into account, the student-teacher ratio looks even lower: Serbian schools enroll 10.5 students for every primary teacher and 9.1 for every secondary teacher. Paradoxically, average class sizes in Serbia are somewhat higher than OECD benchmarks, averaging 23 students in primary school and 25 in secondary school. The large class sizes are probably because the Ministry of Education and Science (MoES) enforced minimum class sizes norms by for primary and secondary education in the 2009/2010 school year. The discrepancy between the low STR and the large average class size arises because 2.2 teachers are employed per class in primary schools and 2.8 in secondary. The ratios vary slightly by region. For instance, primary STRs are 14.6 in the Belgrade region and 11.6 in the central and South Serbia region. For secondary education, STRs of all regions tend to converge at 11. These ratios underscore the excessive number of teachers in Serbia compared to standard international practice.
6.17. Recent reductions in studentteacher ratios and average class sizes, however, are not likely to improve the quality of education. Evidence from the OECD suggests that the relationship between average class size and student learning outcomes is generally weak. For example, an analysis of PISA 2009 results found that “Class size in the language of instruction does not seem to have a direct impact on PISA performance in reading” for 15-year-olds.40 In fact, the study cites the example of Finland, where both large and small classes performed equally well in the reading assessment (Finland topped international PISA rankings in 2009). Meanwhile, students in France also perform well in PISA and their class size is similar to that of Serbian students. Further, the OECD concludes that large class sizes have not prevented many East Asian countries from having above-average performance (OECD 2012). The World Bank (2012) also found no effect of average class sizes on grade 8 exam scores in Serbia.
Figure 6.7: Primary and Secondary StudentTeacher Ratios, Serbia and the OECD, 200012
Source: World Bank Indicators. Data are average for 2006-2011 except for Serbia, where data are for 2014.
10
12
14
16
18
2004 2005 2003 200220012000 2006 2007 2008 2009 2010 2011 2012 2013
OECD (2012), Secondary Serbia, Primary OECD (2012), Secondary
13.2
11.5
12.9
11.4
13.0
11.6
13.0
11.3
12.7
11.1
15.4
13.5
16.6
15.3
Serbia, Secondary
40 OECD 2011. Education at a Glance. Indicator D2, box D2.1, p. 395.

64
III. OppOrtunItIes fOr ImprOvIng the effIcIency and equIty Of publIc spendIng In sOcIal sectOrs
Figure 6.8: Teacher Characteristics by UrbanRural Location and Quintile
Table 6.3: Primary and Secondary StudentTeacher Ratios by Region, Serbia, 2009–12
Primary Education
2009 2010 2011 2012
Serbia North 13.0 13.5 13.5 11.6
Belgrade region 13.9 14.2 14.5 14.6
Vojvodina 12.4 13.0 12.8 12.5
Serbia South 12.8 12.5 12.5 12.0
Šumadija and West Serbia 13.3 12.9 12.9 12.4
South and Eastern Serbia 12.1 12.0 12.0 11.6
Secondary Education
Serbia North 11.0 11.6 10.9 10.8
Belgrade region 10.8 11.2 11.0 10.7
Vojvodina 11.1 11.9 10.9 10.8
Serbia South 11.7 11.7 11.6 11.4
Šumadija and West Serbia 11.7 11.9 11.7 11.5
South and Eastern Serbia 11.8 11.3 11.4 11.3
Source: Serbia Statistical Office data.
Source: World Bank, 2012.
6.18. While a large number of teachers are employed in Serbia, their qualifications are unequally distributed and reinforce inequalities in the education system. A World Bank analysis (2012) found that teacher quality as measured by academic qualifications and years of experience do a great deal to explain differences in student performance between urban and rural schools in Serbia. A regression analysis showed that a one-year increase in average teacher experience corresponds to an increase in 8th grade exam results of up to 0.06 standard deviations,
which is statistically significant. A 10 percent increase in the number of teachers who have a university degree correlated with increases in exam scores of up to 0.20 standard deviations. This finding underscores the importance of teachers to student learning outcomes in Serbia. Students enrolled in the country’s large, urban schools have access to better-quality teachers who are likely to impart better learning than those in rural schools (Figure 6.8). Thus, it is the quality of teachers that matters for ensuring that students achieve the desired academic results, not the quantity.
Urban
perc
ent
Rural
55
60
65
70
75
80
Q1-Low Q2 Q3 Q4 Q5-High
50
78.8
73.971.7
66.964.5
61.4
64.6
52.7
68.5
59.8
Percent of teachers with a university degreeBy muncipality welfare quintiles and urban-rural location
Urban
year
s
Rural
14
15
16
17
18
19
Q1-Low Q2 Q3 Q4 Q5-High
13
15.4 15.615.416.0 16.1
16.6
15.3
16.517.1
Teacher’s average years of experiance 2010By muncipality welfare quintiles and urban-rural location
17.1

65
III. OppOrtunItIes fOr ImprOvIng the effIcIency and equIty Of publIc spendIng In sOcIal sectOrs
Consolidating the School Network
6.19. The Serbian education system needs to adapt to the declining student population. By 2030, the population of Serbia is expected to shrink by 11 percent, or 800,000 people, compared with 2013. As the school-age population continues to decrease (Figure 6.9), so does demand for education services. However, the school network, designed to meet past demographic needs, is still unchanged.
6.20. Serbia is yet to complete rightsizing its school network. The number of primary schools has is gradually dropped to reflect the decline in student population. In 2010 the Parliament issued a bylaw41 requiring municipal councils to prepare a plan for the number and territorial
distribution of primary schools within its jurisdiction. Schools within a municipality were to be merged with other schools unless either of two conditions apply: (1) enrollment is more than 400; or (2) the school has less than 400 students but there is no other primary school within 2 kilometers. Due to higher population densities, more urban schools were merged numbers than rural. In rural areas, schools are often more than 2 km apart, so smaller schools were retained due to equity concerns. School consolidation offers students from closing schools the opportunity to attend better and better-equipped schools. Although school consolidation has begun in primary schools, the secondary school network has marginally expanded. Possible explanations include higher enrollments in 4-year TVET (Figure 6.10).
Figure 6.9: Population of Serbia by Age Group, 1990–2050
Figure 6.10: Number of Primary and Secondary Schools, 2000–2013
0M
2M
4M
2010 20132006200019951990 2015 2020 2025 2030 2035 2040 2045 2050
15-6400-1465 and above
Source: World DataBank: Health, Nutrition, and Population Statistics, 2014.
Source: Serbia Statistical Office 2015.41 Bylaw N°80-2010, “On Criteria for Passing an Act on Preschool Institution Network and an Act on Primary School Network”.
0
100
200
300
400
500
2000/01 2006/05 2006/07 2007/08 2008/09 2009/10 2010/11 2011/12 2012 /13 2013/14
Number of secondary schools (RHS) Number of primary schools (LHS)
3300
3350
3400
3450
3500
3550
3600
3650

66
III. OppOrtunItIes fOr ImprOvIng the effIcIency and equIty Of publIc spendIng In sOcIal sectOrs
Box 6.1: School Network and Per Capita Financing in Moldova
Source: Olefir 2013
6.21. More schools need to be consolidated, particularly in urban areas. Although since 2000, the student population is down 21 percent in primary schools and 13 percent in secondary, in 2013, Serbia still had 95 percent of its primary schools, and there were actually 5 percent more secondary schools. There is room to continue the school consolidation process in the country, for both primary and secondary schooling. During 2010, consolidation focused on the municipal level. The next step would be to close primary and secondary schools that are less than 2 km apart if a supra-municipality view is used to look at the school network. The criteria would then be to look at the infrastructure of schools that are less than 2 km apart and close those that are of lower quality. To reduce the risk of dropouts, per capita financing and transportation options should also be considered for schools that target students from disadvantaged families or ethnic minorities. This is particularly important because historically students in some regions, like Central Serbia, have had to travel long distances to get to school and transportation costs were not covered (UNICEF 2002). See Box 6.1 for Moldova experience.
The school network in Moldova had not been adjusting to demographic shifts. While Moldova has 13 percent fewer schools than in 1991, as its d population declines it only needs to serve about half as many students now. As a result Moldova has a large network of small schools—260 students on average compared to 437 in 1991—with the median school operating at 54 percent of the capacity for which it was designed. Maintaining an oversized school network is inefficient and leads to misallocation of scarce resources.
The Government of Moldova has taken three measures to enhance efficiency, equity, and effectiveness in education: (1) It introduced per capita financing, as is common in OECD countries Moldova’s education financing is based on the number of students enrolled in a school rather than to school inputs. (2) School network consolidation was introduced. A feasibility assessment found that up to half of Moldova’s rural schools may need to be reorganized to adjust to declining student population. The assessment categorized schools as ones to close, ones to continue, and those that were uncertain. (3) Through better resource utilization a larger share of the budget was made available for quality enhancement programs. As a result, between 2007–2015, the number of teachers was reduced by 15 percent and some were redeployed. Local authorities used some savings from school consolidation to raise teacher salaries and improve the quality of education.
Introducing Per Capita Financing
6.22. As the population of schoolage children diminished with little change in the number of schools, classes, teachers, and other school inputs, schools in Serbia have become increasingly inefficient and unequal in their relative spending. The traditional education funding mechanism based on inputs rather than the number of students offers few incentives to improve efficiency. In contrast, per capita financing can effectively target poor and disadvantaged groups by adding weights for student characteristics to the funding formula. Per capita financing is a hallmark of countries with high-performing education systems and is widely used in ECA countries (Figure 6.11).
6.23. Over the last few years Serbia has tried unsuccessfully to introduce per capita financing. The 2009 Framework Law on Education envisioned gradual introduction of the new financing system, to be completed by 2014/15. Introduction of per capita financing was supported by the WB Delivery of Improved Local Services (DILS) project. The project envisioned the design of the funding formula (national and local), its piloting in municipalities, and scale-up. The pilots were conceptualized as theoretical simulations of per capita financing allocations, since current law does not allow transfer of resources per capita. This would allow the MoES to calculate how much each municipality would have received if the capitation formula were in place (World Bank 2012b). However, the national and local financing formulas were not fully developed and were not piloted. In fact, by June of 2012 the 16 municipalities that had enlisted for the pilots did not receive the informal but necessary approval from the Ministry of Education and Technological Development and withdrew. Although there were no pilots, thorough and substantial work was done on formulating the national formula.
6.24. There is an urgent need to reduce spending imbalances between schools by introducing per capita financing. Per student financing is a way to introduce a transparent system that could improve efficiency and equity and generate savings for reallocation within the sector. The previous work done is a good base from which to start if the government explores this type of efficiency mechanisms.

67
III. OppOrtunItIes fOr ImprOvIng the effIcIency and equIty Of publIc spendIng In sOcIal sectOrs
D. Conclusions and Recommendations
6.25. The budget envelope for education in Serbia is slightly higher than that of many other European countries, but its outcomes are not as good. One goal of educational financing should be to apply efficiency mechanisms that can create savings for either reinvesting in the system to support more efficient and effective ways to improve learning or to support the overall fiscal adjustment. The following recommendations would improve and the efficiency of spending and the quality of education. In addition, in order to benefit quickly from
Figure 6.11: Per Capita Financing of Education in ECA Countries
listed reforms the government should put additional effort to overcome issues related to data collection and dissemination.
6.26. Increase ECD coverage, particularly for Roma children, using existing facilities and redeploying teachers to the extent feasible; and as fiscal space opens, scale up investments in ECD programs. While this recommendation may increase present costs on ECD; it has one of the highest returns on investments.
Russian Federation
Estonia
Latvia
Lithuania
BelarusPoland
Czech Republic
Slovak Republic
HungarySlovenia Croatia
Bosnia &Herz.
Montenegro Kosovo
Serbia
Albania FYR Macedonia
Bulgaria
Turkey
Armenia
Georgia
Azerbaijan
Romania
Moldova
UkraineKazakhstan
Turkmenistan
Uzbekistan
Tajikistan
Kyrgyz Republic
Under discussion
Piloting
Widely introduced
Not started
No data
Source: World Bank

68
III. OppOrtunItIes fOr ImprOvIng the effIcIency and equIty Of publIc spendIng In sOcIal sectOrs
In addition, it helps levels the playing field and increase opportunities for children of all backgrounds.• Reducethenumberofprimaryandsecondaryteachers
by drafting a strategy to right-size the teaching workforce and undertaking teacher rationalization, including redeployment. This recommendation is linked to the rightsizing of the school network and has the potential to create savings that could be either brought back to the budget or reallocated to investments in the sector.• Improvetheequityofteacherqualityanddistribution
by reviewing current teacher deployment policies and realigning them to ensure that students in vulnerable and underserved areas have access to highly professional teachers.
• Evenouttheinequalitiesinspendingbetweenschoolsby replacing input-based budgeting with more per student financing; fully develop and pilot the funding formula; and rollout per student financing to a achieve transparent system for improving efficiency and equity.• Support student learning by regularly measuring
learning outcomes in each school; and linking schools resources (inputs) with learning scores (outputs) to better inform policy decision-making and achieve greater equity (through an EMIS system). While implementation of assessments and an EMIS system require investments, these are relatively minor compared to possible gains.

69
III. OppOrtunItIes fOr ImprOvIng the effIcIency and equIty Of publIc spendIng In sOcIal sectOrs
CHAPTER 7. HEALTH
A. Overview
7.1. While Serbia’s health outcomes compare well with those of countries at similar income levels, generous social health insurance benefits combined with inefficiencies in service delivery contribute to heavy spending on public health expenditure, service rationing, increased outofpocket payments, and hospital deficits. The Health Insurance Fund (HIF) has been becoming more an active as a purchaser of health services, but financing for both primary and hospital care is still primarily based on inputs, with few incentives for efficiency. The number of medical staff and the number of hospitals per 100,000 persons are similar to comparable countries, but Serbian health facilities employ too many nonmedical staff and have excess bed capacity. Social health insurance provides reasonably good financial protection for low income groups, but the poor are less likely to seek care for financial reasons, and out-of-pocket health spending has been increasing across all income groups.
7.2. Despite recent progress, inefficiencies in public spending persist for hospital care, primary care, pharmaceutical and medical devices, and the share of nonmedical staff is particularly high. In the hospital sector, bed capacity and admission rates are relatively high, and it appears that acute inpatient care is inefficient, since both hospital spending and average length of stay are higher than regional and EU averages. As for primary care, despite relatively high spending on prevention services, there are gaps in coverage of key preventive and primary health care services, and outpatient contact rates are relatively high. Improvements in efficiency could be stimulated by provider payment reforms that link budgets allocated to outputs and quality of care. The vast majority of transfers to primary care centers are currently based on line-item budgets, which give managers little flexibility or incentive to rationalize staffing and service provision, or to improve quality. Centralized procurement of hospital drugs, price negotiation for off–patent drugs, and improved drug price benchmarking could also help achieve savings beyond those already realized in recent years. Finally, while medical staff are within regional norms, the 25–30 percent share of nonmedical staff is twice as high as in OECD countries. The quality and efficiency of health care could be vastly improved by a shift to performance-based financing for both primary care and hospitals; further reforms to reduce costs for pharmaceuticals and medical devices, including ensuring that decisions to finance new drugs or expensive procedures are based on international evidence; and reduction of nonmedical personnel.
7.3. This chapter first review of the recent trends in health outcomes, coverage, and quality of health services in Serbia as compared with other upper
middleincome countries and the EU. This is followed by an analysis of health financing, public spending efficiency and opportunities for further savings, and financial health protection. It concludes with recommendations for short- and medium-term reforms.
B. Health Outcomes
7.4. Health outcomes have improved in recent years, and life expectancy and child health in Serbia compare well to those of countries at similar income levels. Since the mid-1990s, for instance, Serbia has gained four years of life expectancy at birth (to 75 in 2013). These gains were mostly accounted for by progress in treating cardiovascular diseases (+1.7 years), neonatal disorders (+0.6 years) and neoplasms (+0.4 years). Infant mortality rates are lower than the regional average and converging to EU levels. Improvements in infant and child mortality were a major contributor to the improvements in life expectancy.
7.5. As the population of Serbia is declining and aging, the burden of noncommunicable diseases is growing. Since 1990, the Serbian population has been eroding by an average of about -0.2 percent annually (Figure 7.1). By 2012 the percentage of the population aged 65 and above had gone up from 10 to 14 percent, and is it projected to reach 25 percent by 2050. Due to its aging population, the disease burden in Serbia is now weighted toward noncommunicable diseases (NCDs) and such external causes as injuries. The share of NCDs in total disability-adjusted life years has gone up from 81 percent in 1990 to 86 percent in 2010 (Figure 7. 2). The top three causes of premature death in 2010 were heart disease (19.9 percent), stroke (18.8 percent), and cancers (about 18 percent).42
7.6. The most important risk factors are diet, high blood pressure, smoking, household air pollution, and alcohol use. The prevalence of hypertension has been rising since 2000. The incidence of daily smoking among adults is 35.8 percent in 2013, compared to averages of 19 percent in the EU and 22 percent in the Western Balkans.43 Risky behaviors and substance abuse are major concerns, especially among youth.44
42 Almost 45 percent of total deaths are accounted for by cardiovascular diseases and neoplasms. Mortality from cardiovascular diseases is higher among men, while women suffer more from neoplasms. In 2013, 54 percent of the population over 15 reported at least one NCD, with incidence increasing with age and rates higher among women (59 percent).43 However, tobacco excise tax rates are slowly increased.44 According to a recent survey on substance use and gambling in Serbia, 13.3 percent of the respondents met the criteria for risky drinking and 6.2 percent for harmful or problematic drinking. Risky behavior in traffic is also common for drivers aged 18–34; more than 90 percent in that age group reported having driven under the influence of alcohol and exceeding speed limits. Source: Institute of Public Health of Serbia (2014) National Survey on Lifestyles of Citizens in Serbia.

70
III. OppOrtunItIes fOr ImprOvIng the effIcIency and equIty Of publIc spendIng In sOcIal sectOrs
Figure 7.1: Serbian Population Trends, 1990–2013
Figure 7.3: Child Immunization and Antenatal Care by Welfare Quintile (Percent)
Figure 7.2: Disease Burdens, Serbia, 1990 – 2010(Percent of Disability-Adjusted Life Years)
Source: WDI.
Source: Institute for Health Metrics and Evaluation and Serbia Statistical Yearbooks.
Source: MICS 2014. Note: Percent of children age 24-35 months who received all recom-mended vaccinations; percent of expectant mothers with 4 or more antenatal visits.
Populaton, total Populaton ages 65 and above (% of total)
6.8 0
2
4
6
8
10
12
14
16
6.9
7
7.1
7.2
7.3
7.4
7.5
7.6
7.7
7.8
Tota
l pop
ulat
ion
(mill
ion)
Perc
enta
ge o
f the
pop
ulat
ion
aged
65+
1990 1991
1992
1993
1994
1995
1996
1997
1998
1999
2000
20
01
2002
20
03
2004
20
05
2006
20
07
2008
20
09
2010
20
11 20
12
2013
0
2
4
6
8
10
1990 20001995 2005 2010
NCD (right)
12
78
79
80
81
82
83
84
85
86
87
88
Injuries (left)Communicable (left)
C. Coverage and Quality of Health Services
7.7. Coverage of maternal and child health services is good overall but with gaps for the poor and Roma. Full child immunization is better for the poorest quintile than the wealthiest, but lower for Roma (Figure 7.3). Although infant mortality rates are relatively low for the population as a whole, at 13 deaths per 1,000 live births they are twice as high for Roma (Figure 7.4). There is also a higher incidence of chronic malnutrition (stunting) among Roma children, despite recent improvements, which has serious implications for their cognitive development and lifelong earning potential. Low birthweight among children under 5 is also between two to three times higher for the Roma. Government programs such as the Roma health facilitators, who have reached 140,000 Roma since the program began in 2006, have helped improve their access to health services, and the MOH has begun to finance these positions through the budget. However, the percentage of women aged 20–24 who have had at least one live birth before age 18 is 1 percent for Serbia and 38 percent for Roma settlements; this is likely to have implications for both the education and the labor force participation of Roma women. Serbia’s total fertility rate is 1.6 births per women but 3.1 for the Roma (MICS 2014).
0%
10%
20%
30%
40%
50%
Roma SecondPoorest Middle Fourth Richest
60%
4+ ANC visits
100%
70%
80%
90%
Children Fully Immunized

71
III. OppOrtunItIes fOr ImprOvIng the effIcIency and equIty Of publIc spendIng In sOcIal sectOrs
Figure 7.4: Nutrition Outcomes (Percent)
Figure 7.5: Outpatient Contacts per Capita per Year
Figure 7.6: Agestandardized Prevalence of Chronic Conditions, Serbia and Comparators(0-64, per 100,000 citizens)
Figure 7.7: Preventive Examinations (Percentage of population with a preventive examination in the past 5 years)
Source: MICS 2014.Note: Stunted is defined as less than two standard deviations of average height for age.
Source: WHO Health for All Database.
Source: WHO Health for All Database.
Source: National Health Survey 2006, 2013.
0Stunting Low birthweight
Serbia Serbia Roma Settlements
2
4
6
8
10
12
14
16
18
20
7.8. Serbia has higher outpatient contacts per capita than the EU, but there are gaps in the coverage and quality of primary care and preventive services. Though decreasing, outpatient contacts per year are higher than the EU average (Figure 7.5). Despite more frequent contacts with doctors, age-standardized health outcomes for the main NCDs are below EU averages (Figure 7.6). While preventive examinations have increased since 2006 (Figure 7.7), preventive screening for breast cancer, cervical cancer, and colorectal cancer is still below the EU average (Figure 7.8). Diagnosis and treatment of hypertension is improving but not yet up to par. While nearly half of adults
5.0
5.5
6.0
6.5
7.0
7.5
8.0
8.5
9.0
9.5
10.0
2005 2006 2007 2008 2009 2010 2011
Serbia EUWesterns Balkans
0Malignantneoplasms
Diseases of circulatory system
Ischaemicheart disease
cerebrovascular diseases
Serbia Western Balkans EU
20
40
60
80
100
120
65Blood
pressure Blood sugar
Blood cholesterol
70
75
80
85
90
2006 2013
have hypertension or are at risk, only a third of all adults have been diagnosed. Of these, in 2013 about 10 percent of diagnosed cases were still untreated.
7.9. Hospital care increased between 2006 and 2013. The rate of hospitalization (hospital discharges) in Serbia (179 per 1,000) is higher than the averages in the OECD (156 per 1,000) and the Western Balkans (117 per 1,000). On average, in the 12 months period preceding the survey, 7.8 percent of respondents aged 15 or older declared having been treated in hospital, compared to 6.5 percent in 2006. This rate of hospitalization cannot be explained by the aging profile of the population alone; other factors are unnecessary hospital admissions,

72
III. OppOrtunItIes fOr ImprOvIng the effIcIency and equIty Of publIc spendIng In sOcIal sectOrs
Figure 7.8: Preventive Screening Rates
Figure 7.9: Total Public and Private Health Spending, 19952012, Serbia and Comparators(Percentage of GDP)
Figure 7.10: Total Public and Private Health Spending, 200513, Serbia and Comparators, (2005 USD per capita)
Source: National Health Survey 2013 and Health at a Glance 2014.
0Mammography
screeningCervical cancer
screeningColorectal cancer
screening
Serbia EU
10
20
30
40
70
50
60
7.12. Total public and private health spending at 10.5 percent of GDP is high, and has been going up faster than the regional average for the past decade. In 2013, total health spending in Serbia represented about 10.6 percent of GDP, compared to 8.6 percent for EU countries, or 7.1 percent for the Western Balkan countries (Figure 7.9). In absolute terms (Figure 7.10), total average health spending per capita (US$990) is higher than the average in the Western Balkans (US$790), but lower than the EU average (US$2,970).
UMIC West, Balkans
6
7
8
9
10
11To
tal h
ealth
exp
ende
ture
s (%
GDP)
1995
1996
1997
1998
1999
2000
20
01
2002
20
03
2004
20
05
2006
20
07
2008
20
09
2010
20
11 20
12
2013
EU-28 Serbia
shortcomings in primary care, excessive use of acute care beds for long-term care, and inadequate use of day surgeries.
7.10. Waitlists for elective procedures are both common and significantly longer than in OECD countries. According to HIF data, in 2013 nearly half (46.6 percent) of patients who underwent an intervention in Serbia had to go on a waitlist, and only a third of waitlisted patients (36 percent) actually received treatment. Average waiting time in 2013 was 450 days for a hip replacement, compared to 101 days on average in OECD countries, 707 days for a knee replacement (123 days in the OECD), and 260 days for cataract surgery (75 days in the OECD). Clearly, there is significant rationing of care despite high expenditures and a generous benefit package. Waiting lists encourage bribery, which is particularly prevalent in hospitals. Shortcomings in quality of care, waiting lists, and unofficial payments all contribute to dissatisfaction with public health services.
D. Health Financing and Expenditure: Trends and Composition
7.11. Health care in Serbia is provided both through public and private sector. Government health spending is mainly channeled through the HIF, which represented more than 90 percent of government health spending in 2013. The Law on Health Insurance governs both compulsory and voluntary health insurance. The HIF is in charge of managing and providing compulsory health insurance; voluntary insurance can be provided through private insurance. Other government health spending is mostly channeled through the budgets of subnational governments (7.5 percent in 2013).
UMIC West, Balkans EU-28 Serbia
0
500
1000
1500
2000
3000
2500
Tota
l hea
lth e
xpen
detu
res (
2005
USD
per
capi
tal)
1995
1996
1997
1998
1999
2000
20
01
2002
20
03
2004
20
05
2006
20
07
2008
20
09
2010
20
11 20
12
2013
Source: World Development Indicators and WHO Global Health Expenditure Database.
45 More than half of the adult population considers that corrupt practices occur often or very often in public hospitals, with doctors and nurses among the top three categories of public official bribe recipients.46 In 2013, slightly more than half of the respondents in Serbia declared being satisfied with public health services.

73
III. OppOrtunItIes fOr ImprOvIng the effIcIency and equIty Of publIc spendIng In sOcIal sectOrs
7.13. Serbia’s public health spending is significantly higher than that comparator countries, much of it driven by spending increases in the 2000s. Total government health spending went up from 5.2 percent of GDP in 2000 to 6.4 percent in 2013. This is higher than the average for upper-middle-income countries (3.9 percent) and slightly higher than the EU average (6.3 percent). In the Western Balkans, only the Bosnia and Herzegovina government spends more on health. In 2009–13, Serbia’s per capita government health spending was three times higher than the average for countries with similar GDPs (US$715 against US$298 per capita/year).
Figure 7.11: Private Outofpocket Health Payments, 1995 – 2012 (Percent of Total Health Expenditures)
Figure 7.12: Public Health Spending, 1995 – 2012 (Percent of GDP)
Source: WDI and WHO Global Health Expenditure database.
Source: WDI and WHO Global Health Expenditure database.
7.14. Despite Serbia’s high public spending, private outofpocket payments (OOP) for health care have also risen significantly in the past decade. OOP increased faster than government health spending between 2002 and 2012. While OOP represented 2 percent of GDP in 2002, the share rose to 4 percent in 2013 (Figure 7.11). Meanwhile, the government health spending-to-GDP ratio held steady at about 6.3 percent. The increase in the relative importance of OOP as a share of GDP contrasts with the average trend for the Western Balkans and to the levels observed in upper-middle-income-countries: typically higher government health spending and better insurance coverage reduces OOP spending on health (World Bank 2013).
UMIC Western Balkans
20
30
40
50
Out o
f poc
ket p
aym
ent (
%TH
E)
1995
1996
1997
1998
1999
2000
2001
2002
2003
2004
2005
2006
2007
2008
2009
2010
2011
2012
EU-28 Serbia
3
4
5
6
7
Publ
ic he
alth
exp
ende
ture
(%GD
P)
1995
1996
1997
1998
1999
2000
2001
2002
2003
2004
2005
2006
2007
2008
2009
2010
2011
2012
UMIC Western Balkans EU-28 Serbia

74
III. OppOrtunItIes fOr ImprOvIng the effIcIency and equIty Of publIc spendIng In sOcIal sectOrs
Table 7.1: HIF Revenue and Expenditures, 2008–14
Public Health Revenues and Expenditures
7.15. HIF’s revenues and expenditures both fell in real terms between 2008 and 2014. At 2010 constant prices, HIF revenues decreased on average by -3.2 percent a year, and expenditures by -2.7 percent over
Source: HIF budget and WDI.
2008 2009 2010 2011 2012 2013 2014 Annual Change (%)
Revenue (million RSD, nominal) 170,759 178,980 182,476 194,534 209,875 220,631 219,052 4.2%
Expenditure (million RSD, nominal) 165,624 177,311 183,025 193,295 205,836 211,894 218,827 4.8%
CPI (2010=1) 0.87 0.94 1.00 1.11 1.19 1.28 1.36 7.7%
Revenues (million RSD, real) 195,959 189,973 182,476 175,039 175,945 171,748 161,064 -3.2%
Expenditure (million RSD, real) 190,067 188,202 183,025 173,925 172,559 164,946 160,899 -2.7%
2008–14 (Table 1). Despite continued cost pressures, expenditures in 2014 were only slightly higher than in 2013 in nominal terms, due in part to the across-the-board wage cuts for all civil servants (see chapter 3) and to cost savings achieved on pharmaceutical procurement (see below).
7.16. A minority of the working population finances the majority of HIF revenue. Compulsory health insurance in Serbia follows a model of obligatory social insurance, where current revenues are generated through employer and employee contributions. Payroll tax contributions represent about two-thirds of HIF revenues; transfers from the government constitute most of the remaining
envelope. In 2013, about 6.9 million persons were insured, 40 percent of whom were employees, 28 percent pensioners, and 20 percent children, pregnant women, or other vulnerable groups (Figure 7.13). The government covers the cost for vulnerable groups (retired people, children, disabled, unemployed, etc.) per article 22 of the Law on Health Insurance.
Employees
Pensioners
Self-employed
Other
Persons receiving fees in case of unemployment
Insured in accordance with Article 22 of the Law on Health Insurance
41%
28%
8%
20%
2%
1%
Figure 7.13: Insurance Pool Composition
Source: HIF.
Figure 7.14: Insurance Revenue Composition
Source: HIF.
Employees
Pensioners
Self-employed
Persons receiving fees in case of unemployment
Insured in accordance with Article 22 of the Law on Health Insurance
Other
0%
66%
1%
24%
4%5%

75
III. OppOrtunItIes fOr ImprOvIng the effIcIency and equIty Of publIc spendIng In sOcIal sectOrs
7.17. The contribution rate for compulsory health insurance has gradually declined from 20.2 percent in 1994–96 to 16.2 percent in 1996–2001, 11.9 percent in 2001–04, and 12.3 percent in 2004, and in 2014 reached 10.3 percent. Reductions in contribution rates need to be accompanied by measures to better enforce revenue collection. Employers facing financial difficulties do not always pay their compulsory contributions to the HIF, and the economic crisis and the difficulties faced by SOEs have exacerbated the situation. Uncollected contributions have been ramping up in recent years; in 2013 they represented up to 40 percent of HIF revenues. Uncollected revenues are also driven by legal decisions on debt dormancy or write-offs for compulsory health insurance contributions, inefficient debt collection from health contribution payers by the tax administration, and lower effective budget transfers.47 The HIF was able to keep the budget balance mostly positive between 2008 and 2012 but by 2012 it had unpaid liabilities to health facilities equivalent to 6.6 percent of total HIF revenues. The HIF was able to resolve these liabilities, partly through an agreement with the government in September 2012 to convert RSD 13 billion of liabilities into public debt.
7.18. Wages and salaries represent about 55 percent of total health expenditure (6 percent of GDP); goods and services about 40 percent (4.2 percent of GDP); and capital spending less than 5 percent (0.4 percent of GDP). Most of the goods and services budget goes to drugs (25 percent of public health expenditure). Compared to EU countries, Serbia spends about 2 more percentage points of GDP on salaries (Figure 7.16); capital outlays, which used to be lower than in other countries in the region and the EU, are catching up with the EU level as a percentage of GDP (Figure 7.15).
47 Under Article 22 of the Law on Health Insurance, the monthly contribution base rate is set at 15 percent of average monthly salary in Serbia, but the actual rate on which contributions are calculated is lower.
Figure 7.15: Capital Outlays(as % of Total Health Expenditures)
Figure 7.16: Salaries(as % of Total Health Expenditures)
Western Balkans
1
0
2005
2006
2007
2008
2009
2010
2011
EU Serbia
2
3
4
5
6
7
8
9
10
Western Balkans
40
35
2005
2006
2007
2008
2009
2010
2011
EU Serbia
45
50
55
60
65
Source: HIF and WHO-Health for All database.
Source: HIF and WHO-Health for All database.
7.19. Most of the government health budget is directed to hospitals (56 percent in 2013, 3.5 percent of GDP). Although the share of total health spending allocated to hospitals has gone down since 2003, it is still slightly higher than the average in OECD countries (Figure 7.17). As a percentage of GDP, however (Figure 7.18), Serbia’s spending on hospitals (3.5 percent of GDP) is only slightly higher than in OECD countries (3.2 percent). Curative and rehabilitative services account for about half of total health expenditure (4.5 percent of GDP), similar to the OECD average (Figure 7.19). Serbia is also spending relatively more than the OECD average on prevention and public health services (Figure 7.20).
OECD
40
35
30
2003
2004
2005
2006
2007
2008
2009
2010
2013
2012
2011
Serbia
45
50
55
Figure 7.17: Spending on Hospitals (Percent of Total Health Spending)

76
III. OppOrtunItIes fOr ImprOvIng the effIcIency and equIty Of publIc spendIng In sOcIal sectOrs
Figure 7.18: Spending on Hospitals (Percent of GDP)
Figure 7.19: Spending on Curative Services (Percent of Total Health Spending)
Figure 7.20: Spending on Prevention (Percent of Total Health Spending)
Source: OECD Statistics and Serbia National Health Accounts (2014).
OECD
2.9
2.7
2.5
2003
2004
2005
2006
2007
2008
2009
2010
2013
2012
2011
Serbia
3.1
3.3
3.5
3.7
70
80
60
50
40
30
20
10
0
Israe
l
Unite
d St
ates
Aust
ralia
Unite
d Ki
ngdo
m
Japa
n
Swed
en
Icel
and
Gree
ce
Spai
n
Kore
a
New
Zea
land
Switz
erla
nd
Portu
gal
Aust
ria
Esto
nia
Finl
and
Czec
h Re
publ
ic
Fran
ce
Luxe
mbo
urg
Slov
enia
Denm
ark
Pola
nd
Germ
any
Serb
ia
Neth
erla
nds
Turk
ey
Hung
ary
Cana
da
Belg
ium
Slov
ak R
epub
lic
Norw
ay
Mex
ico
Chile
7
8
6
5
4
3
2
1
0
Serb
ia
New
Zea
land
Cana
da
Finl
and
Hung
ary
Neth
erla
nds
Slov
enia
Swed
en
Unite
d St
ates
Germ
any
Mex
ico
Slov
ak R
epub
lic
Japa
n
Esto
nia
Denm
ark
Switz
erla
nd
Pola
nd
Norw
ay
Fran
ce
Kore
a
Portu
gal
Czec
h Re
publ
ic
Aust
ralia
Spai
n
Luxe
mbo
urg
Aust
ria
Gree
ce
Belg
ium
Icel
and
Israe
l
Italy
Source: OECD Statistics and Serbia National Health Accounts (2014).

77
III. OppOrtunItIes fOr ImprOvIng the effIcIency and equIty Of publIc spendIng In sOcIal sectOrs
7.20. Spending on pharmaceuticals represented about 25 percent of total public health spending in 2013. The share of total pharmaceutical spending (public and private) in total health spending (Figure 7.21) is also significantly higher in Serbia (31 percent) than the regional average (18.4 percent for the Western Balkans) or the EU average (20.4 percent). Moreover, the pharmaceuticals share increased between 2005 and 2011 when it was decreasing in both the region and the EU. Total spending on pharmaceuticals
Figure 7.21: Pharmaceutical Spending(Percent of Total Health Spending)
Figure 7.23: Healthy Life Expectancy and Public Health Spending, 2012
Figure 7.22: Pharmaceutical Spending(Percent of GDP)
also went up as a proportion to GDP from 2 percent in 2005 to 3.3 percent in 2013 while in the region and the EU it held steady at about 1.8 percent (Figure 7.22). Serbia spends about twice as much as a share of public health spending than the EU average (12.3 percent48 ). Most of the spending on pharmaceuticals is driven by private expenditures. Such high private OOP payments on drugs despite high government spending indicates gaps and inefficiencies in public sector provision.
Western Balkans
19
17
15
2005
2006
2007
2008
2009
2010
2013
2012
2011
EUSerbia
21
23
25
27
29
33
Western Balkans
2005
2006
2007
2008
2009
2010
2013
2012
2011
EUSerbia
1.0
0.5
0.0
1.5
2.0
2.5
3.0
3.5
Source: WHO Health for All Database and Serbia National Health Accounts 2014.
Source: WDI; WHO
E. Efficiency of Public Health Spending
7.21. While life expectancy at birth49 is comparable to countries of similar income level, Serbia underperforms relative to what it spends on health. Based on 2012
data, annual public health spending in Serbia is about US$765 per capita (Figure 7.23), which on average should correspond to two more years than Serbia’s current life
75
70
65
60
55
55 148 403 764 1100 2980 8100
50
Mongolia
Bhutan
Turkmenistan
Syrian Arab Republic
IndiaPakistan
Indonesia
Philipines
Azerbaijan
MexicoHungary
Czech Republic
Tunisia
Singapure
CyprusKorea Rep.
Israel
Chile
LuxemburgBosnia and HercegovinaColumbiaChina Qatar
KazahstanRussian Federation
Algeria
Serbia
Public health expenditure per capita ( 2005 USD, Log scale)
Heal
thy
life
expe
ctan
cy a
t birt
h (W
HO)
48 OECD 2014 Health at a glance: Europe 2014, and WHO-GHED.49 Healthy life expectancy at birth (HALE) is a form of health expectancy that applies disability weights to health states to compute the equivalent number of years of life expected to be lived in full health.

78
III. OppOrtunItIes fOr ImprOvIng the effIcIency and equIty Of publIc spendIng In sOcIal sectOrs
Figure 7.24: Bed Density, 2005–11
Number of hospitals beds (per 100,000)
Figure 7.25: Hospital Admissions, 2005–11
Inpatient care discharges (per 100)
Figure 7.26: Average Acute Care Length of Stay, 2005–11
Source: WHO Health for All Database and Serbia National Health Ac-counts 2014.
Source: WHO Health for All Database.
Source: WHO Health for All Database and Serbia National Health Ac-counts 2014.
expectancy (65 years). Countries with level of healthy life expectancy (HALE) around 65 years old spend on average US$410 per capita—46 percent less than Serbia, suggesting that there is scope for making public spending more efficient.
7.22. Despite some progress in recent years, inefficiencies persist in public spending for hospital care, primary care, pharmaceutical and medical devices, and human resources (particularly excess nonmedical staff). These will be examined in turn.
7.23. In the hospitals sector, bed capacity and admission rates are relatively high, and there is scope to make acute inpatient care more efficient. The density of hospitals is aligned with the regional average in the Western Balkans, but the number of beds per 100,000 is much higher; in 2011 it was also high compared to the EU (Figure 7.24). Inpatient admissions have been increasing and met the EU average in 2011 but are much higher than the regional average (Figure 7.25). Though average length of acute care stay has been decreasing it is higher than both the EU and the regional average (Figure 7.26). Finally, while bed density is high, the occupancy rate has dropped from 80–85 percent in 2005–2006 to 65 percent in 2011 (Figure 7.27). The best performing OECD countries have achieved good health outcomes with lower bed capacity and admission rates through reforms to reinforce primary and preventive care and rationalize provision of acute and long-term care services.
Western Balkans
2005
2006
2007
2008
2009
2010
2011
EUSerbia
400
350
300
450
500
550
600
650
Western Balkans
2005
2006
2007
2008
2009
2010
2011
EUSerbia
12
10
8
14
16
18
20
Western Balkans
2005
2006
2007
2008
2009
2010
2011
EUSerbia
6.0
5.5
5.0
6.5
7.0
7.5
8.0
8.5
9.0
9.5

79
III. OppOrtunItIes fOr ImprOvIng the effIcIency and equIty Of publIc spendIng In sOcIal sectOrs
Figure 7.27: Bed Occupancy Rate for Acute Care, 2005–11
Source: WHO Health for All Database.
Western Balkans
2005
2006
2007
2008
2009
2010
2011
EUSerbia
60
55
50
65
70
75
80
85
90
95
7.24. There is considerable variation in primary care performance and efficiency. A 200950 study on the efficiency of Dom Zdravlja (DZ) showed that even for primary care centers with similar levels of staff, equipment, and space, there is substantial heterogeneity in output produced after controlling for catchment area characteristics. Though outpatient contact rates are relatively high, that is not always true for preventive and primary health care services, despite the relatively high spending on prevention services). Efficiency in primary care could be stimulated by introducing provider payment reforms to link budgets allocated to outputs and quality of care.
7.25. Coverage of medical staff is within regional norms, but the share of nonmedical staff is not. Physician density is higher than the regional average of 212 per 100,000 persons, but still lower than EU averages. Coverage for nurses (530 per 100,000), dentists (29 per 100,000) and pharmacists (30 per 100,000) is similar to other countries in the Western Balkans. Nonmedical staff, however, represent 25 to 30 percent of the health workforce—twice as high as can be seen in OECD countries. The share of nonmedical staff is particularly high in specialized hospitals (42 percent).
7.26. The provider payment system for both primary and hospital care is inputbased, with few if any incentives for quality or efficiency. Provider payment reforms have been
50 World Bank (2009) Serbia - Baseline Survey on Cost and Efficiency in Primary Health Care Centers before Provider Payment Reforms. Washington DC, World Bank.
on the policy agenda in Serbia for over a decade, with little or no progress. The government successfully introduced modest performance-based payments for primary care “chosen” doctors, in which their salary varied by 4 percent based on progress toward meeting service volume and coverage indicators. While this was a major reform in terms of introducing performance pay for public servants, Serbia still does not have a true capitation payment system for primary care based on the principle of “the money follows the patient.” The vast majority of transfers to primary care centers are based on line-item budgets, which gives managers little flexibility or incentive to rationalize staffing and service provision or improve quality. Similarly, while the MOH and HIF have moved to introduce output-based payments for acute care at hospitals, based on DRGs, the payment reforms have not been implemented, so hospitals are still paid on line-item budgets.
7.27. Payment reforms need to be accompanied by reforms to enhance the autonomy and accountability of health facilities, rationalize the hospital network and service provision, and professionalize managers. Recruitment of managers and staff has been subject to too much political influence, national and local; good managers who implement efficiency reforms (e.g., reduce staff or utility costs) are penalized by having their budgets cut. Managers currently have little authority to hire, reward, discipline, or even reallocate staff within their own facilities, and little flexibility to reallocate funds among line items. Payment reforms need to be accompanied by measures to increase their autonomy and accountability, particularly for hospitals, and to train and recruit a cadre of professional managers. Global experience has shown, however, that alone a shift to output-based payments is usually not adequate to rationalize staffing, hospital beds, and improve service efficiency (e.g., increased use of day surgeries, or shifting excess bed capacity from acute to long-term care). Supply side measures led by the MOH in coordination with HIF will be needed to support reforms.
7.28. In the past two years, the government has saved over €32.6 million through centralized procurement of hospital drugs, price negotiation for off–patent drugs, and better benchmarking of drug prices. HIF had been paying hospitals a lump-sum based on the reference price of drugs consumed, but hospitals were purchasing directly from wholesalers. Serbia has over 300 drug wholesalers, compared to no more than 10 in more efficient markets, and these wholesalers were competing for business by offering hospitals “rebates” of up to 30 percent of the drugs purchased. In 2013, the HIF piloted centralized procurement with framework contracts for hospital drugs, which eliminated rebates and resulted in cost savings of over €25 million. Further savings were achieved by negotiating prices for off-patent medicines and improved drug price benchmarking.

80
III. OppOrtunItIes fOr ImprOvIng the effIcIency and equIty Of publIc spendIng In sOcIal sectOrs
Source: HIF
7.29. HIF pharmaceutical expenditures are still high due to inadequate controls on volumes of outpatient prescription drugs and increased use in hospitals of highcost, patented medicines. The pharmaceutical market is dominated by branded generic products and the reimbursement drug list is based on drug brand names. Since prices are the same for all drugs with the same international non-proprietary name (INN), manufacturers are competing on volume. On the other hand, the share of new, high-cost patented medicines on the drug list is growing. Due to the high prices and increasing volume of these products, total spending on drugs has shot up (Table 7.2). Moreover, the average annual number of prescription drugs per insured person in Serbia was 12 to 14 in 2011–13 (HIF)—about twice the average in EU countries. This suggests serious inefficiencies driven by over-prescription, especially of antibiotics.
7.30. Social health insurance benefits are relatively generous, and systems are not yet in place to assess the costeffectiveness of decisions to expand benefits or reimburse new expensive drugs or procedures. The benefit package covers a wide range of services and treatments, but there are few mechanisms to ensure that any new services or medicines it covers are cost-effective or affordable within budget constraints. The use of health technology assessments (HTA) to assess clinical effectiveness and affordability is common in upper-income countries in the EU and could be adapted for Serbia.
7.31. Hospitals are accumulating payment arrears to suppliers. The significant cost reductions on pharmaceuticals through central procurement has led to savings at the center but contributed to financing problems for hospitals. Many were using their “rebates” from pharmaceutical purchases (up to 30 percent) to finance local spending, including hiring non-contractual staff who were not subject to central monitoring of staffing controls. According to HIF data, in 2011 the total payables to suppliers of 338 health institutions was RSD 36,839 million. The arrears had decreased only slightly
by 2013, with 336 health institutions owing suppliers RSD 24,970 million. Reports in the local press have highlighted cases of some hospitals having their bank accounts blocked due to arrears to supplier, which underscores the urgency of the situation. Despite earlier efforts to strengthen arrears monitoring systems, there is still no adequate system for tracking debts and arrear payments by indirect budget holders, such as health facilities.
F. Financial Protection
7.32. Despite the relatively high coverage of social insurance, there are still financial barriers to accessing health care services, especially among the most poor segments of the population. The proportion of household reporting unmet medical care need for financial reasons is nine times higher than the EU average (Figure 7.28). According to the 2013 SILC survey, more than 80 percent of respondents declared that they owned a valid insurance card. However, more than 10 percent of the poorest had forgone a visit to a doctor or a dentist that they needed (SILC 2013). Moreover, the poorest households are also less likely to spend OOP amounts, which also suggests that forgone health care for financial reasons is more likely among the poorest households.
7.33. As OOPs for health have risen over time, so too has the incidence of OOP causing poverty. Since 2008, the incidence of impoverishing payments has been more than 5 percent at a US$4 per capita/day poverty reference (ECAPOV data based on HBS 2008 to 2010). Without OOP, household consumption would have been higher, and the poverty headcount would have been lower by 16 percent (Figure 7.29). Based on the 2010 HBS, as US$4/day the poverty rate went up from 6.9 to 8 percent because of OOPs.
Table 7.2: Spending on the top 5 Patented Hospital Drugs, 2013(RSD, thousands)
INN BRAND2011
(RSD, 000)2012
(RSD, 000)2013
(RSD, 000)Y/Y change
2011-12Y/Y change
2012-13Change 2011-13
Trastuzumab HERCEPTIN 1,088,245 1,321,476 1,382,100 21.4% 4.6% 27.0%
Rituximab MABTHERA 383,964 455,426 476,753 18.6% 4.7% 24.2%
Capecitabine XELODA 109,539 160,057 183,150 46.1% 14.4% 67.2%
Cetuximab ERBITUX 131,530 138,863 182,032 5.6% 31.1% 38.4%
Infliximab REMICADE 105,631 100,432 168,423 -4.9% 67.7% 59.4%

81
III. OppOrtunItIes fOr ImprOvIng the effIcIency and equIty Of publIc spendIng In sOcIal sectOrs
Figure 7.28: Unmet Health Need for Financial Reasons(Percent)
Figure 7.29: Relative Increase in Poverty Due to OutofPocket Payments
Figure 7.30: Catastrophic Payments, 2003–10
Figure 7.31: Catastrophic Payments by Quintile, 2008–10
Source: National Health Survey 2013.
Source: ECAPOV data based on HBS 2008 to 2010.
Source: ECAPOV data based on HBS 2008 to 2010.
Source: ECAPOV data based on HBS 2003 to 2010
0
2
4
6
8
10
12
14
16
18
20
SerbiaLa
tvia
RomaniaGreece
Bulgaria
HungaryEU 28
Germany
Lithuania
Denmark
% in
cras
e in
pov
erty
hea
dcou
nt b
ecau
se o
f OPP
(P
L=$4
/pc/
day)
0
5
10
15
20
30
25
2005
2004
2003
2006
2007
2008
2009
2010
7.34. The incidence of catastrophic payments is higher on average among poor and elderly households. Less than 5 percent of households spend 10 percent or more of their budget on health, and less than 1 percent spend 25 percent or more (Figure 7.30). In 2010 (Figure 7.31), the incidence of catastrophic payments was still three times as high among the poorest 20 percent (the difference was fivefold in 2008 after the crisis). Not surprisingly, elderly citizens were more exposed to catastrophic payments, and nearly 25 percent of single persons over 65 had had to deal with catastrophic payments in the previous
months, mostly due to medicines. Payments on drugs represent more than half of total personal payments. This suggests a need to target policies to protect the poor and low-income elderly from health expenses, e.g., by reducing or waiving copayments for low-cost medicines to treat common chronic diseases.
40% 25%
Inci
denc
e of
cat
astr
ophi
c pa
ymen
t (%
popu
latio
n)2
1
0
3
4
5
2005
2004
2003
2006
2007
2008
2009
2010
10%
Incidence of catastrophic payments (OOP > 25% of total budget)
0Q1 Q2 Q3 Q4 Q5
2008 2009 2010
0.5
1
1.5
2
3
2.5

82
III. OppOrtunItIes fOr ImprOvIng the effIcIency and equIty Of publIc spendIng In sOcIal sectOrs
G. Conclusions and Recommendations
7.35. Given the current constrained fiscal environment, in the short term government should focus on implementing reforms that improve efficiency and fiscal sustainability without compromising access to health care services or their quality. Health spending is already high as a percentage of GDP and the government needs to close a large fiscal deficit. To design appropriate reforms in the health sector, the government needs better data management and improved oversight of use of funds within the network of health centers. HIF reports at aggregate level only, which prevents from more meaningful analysis. Priority measures that could contribute to improved efficiency gains over the short and long term are:
Short to Medium Term•Reduceexcessnoncontractedandnonmedicalstaff,
and urgently address payment arrears and financing imbalances for hospitals. Identify the numbers and costs of noncontracted staff, and identify scope for savings by reducing unnecessary nonmedical staff. Preliminary estimates suggest that if Serbia were to reduce non-medical staff to levels comparable with OECD averages savings could be up to 0.2 percent of GDP. Establish a transparent and consultative process for this.•Continue to work to achieve cost savings on
pharmaceutical and medical devices, while building up monitoring of prescription and dispensing practices. For outpatient prescription drugs, consider further reforms to reimbursement policies (e.g., flat dispensing fees or a regressive margin for medicines) and improve monitoring of prescription and dispensing practices to control volume. For higher-cost patented drugs, introduce such negotiation strategies as price-volume agreements to bring down costs.
Medium to Long term•Implement provider payment reforms for primary
care and hospitals, complemented by broader public administration reforms to improve the quality and accountability for service provision. Shift to performance-based financing for primary and hospital care (adjusted capitation financing for primary care; case payments based on DRGs for hospitals); right-size hospital networks and rationalize service provision based on an updated hospital master plan; and increase the accountability and autonomy of health facilities and managers. •Lay thegroundwork for addressing the challenges
of an aging population: rationalize hospital networks to convert excess hospital beds to long-term or social care; increase use of ambulatory care and day
surgeries; strengthen adherence to clinical guidelines and protocols; and more carefully monitor the quality of care and outcomes at all levels of the health system. •Build up the quality and coverage of primary and
preventive care, through, e.g., better screening and treatment of chronic diseases and promoting healthy behaviors, for a healthier population and reduced costs over the long term.

83
III. OppOrtunItIes fOr ImprOvIng the effIcIency and equIty Of publIc spendIng In sOcIal sectOrs
CHAPTER 8. SOCIAL ASSISTANCE
8.1. Serbia operates a large set of social assistance programs with multiple social objectives of poverty reduction; population growth (pronatality), and/or assistance to other vulnerable groups such as veterans and the disabled. It has only one explicit anti-poverty program—the means-tested financial social assistance program (FSA), previously called the Material Support for Low Income Households (MOP) program. The FSA is well-targeted and is the most cost-effective program, with 74 percent of all benefits reaching the poorest quintile, but its coverage is still low despite recent efforts to expand it. Other categorical and non-means-tested programs are the caregiver’s allowance, wage compensation during maternity leave, the birth grant allowance, benefits for foster care, waiver of school fees for vulnerable children, and a plethora of benefits for war veterans and families of fallen soldiers. Although the benefits are relatively generous, the impact of categorical programs on poverty is negligible. Among measures that could be considered to make Serbia’s social assistance more efficient and more equitable would be scaling back the wage compensation program and using the freed-up resources to expand FSA, further means-testing some of the categorical programs, and redesigning the FSA to introduce in-work benefits and remove disincentives for work.
8.2. This chapter begins with a broad review of the social objectives and the amount of public spending in Serbia’s principal social assistance programs. This is followed by an assessment of the effectiveness of both the means-tested poverty alleviation and non-means-tested categorical programs. The chapter concludes with recommendations for improving the efficiency and equity of current public spending on social assistance.
A. Social Protection in Serbia
8.3. Social protection in Serbia comprises numerous programs, from pensions and social assistance to labor market policies. Over time total outlays on social protection (SP) have risen, reaching about 16 percent of GDP in 2013 (Figure 8.1)—among the highest for ECA and only slightly lower than the EU average of 19 percent. Like most other ECA countries, the majority of SP outlays go to pensions, which represented 13.3 percent of Serbia’s GDP in 2013 (Figure 8.2). Social assistance represents about 2 percent of GDP and 12.5 percent of total SP spending; labor market policies, active and passive, amount for less than 1 percent of GDP.
8.4. Social protection accounts for over a third of total budget spending in Serbia. Serbia is among only a few ECA countries that spend more than 30 percent of total spending on social protection; the others are Ukraine, Romania, Montenegro, Bulgaria, Croatia, and Lithuania (ECA Social Protection Expenditure and Evaluation Database). The problems of the pension system and recommendations for improving it can be found in Chapter 4. This chapter is concerned with how social assistance programs can be made more effective.
Figure 8.1: Total Social Protection Spending in Serbia, 2005–13 (Percent of GDP)
Source: Europe and Central Asia Social Protection Expenditure and Evaluation Database, World Bank. Note: Spending on war veterans benefits was not available after 2011, and for subsequent years projections are based on past growth rates.
0.0
5.0
10.0
20.0
15.0Social Insurance
Labor Market
Social Assistance
2005
2006
2007
2008
2009
2010
2011
2012
2013

84
III. OppOrtunItIes fOr ImprOvIng the effIcIency and equIty Of publIc spendIng In sOcIal sectOrs
Figure 8.2: Social Protection Spending, years noted (Percent of GDP)
Source: ECA Social Protection Database, World Bank.
Tajikistan 2011
Kosovo 2013
Kazakhstan 2012
Azerbaijan 2011
Armenia 2012
Georgia 2013
Albania 2013
BIH 2009
Turkey 2013
FYR Macedonia 2011
Latvia 2012
Poland 2011
Kyrgyz Republic 2011
Belarus 2012
Moldova 2010
Bulgaria 2013
Estonia 2011
Croatia 2012
Lithuania 2009
Montenegro 2013
Serbia 2013
Romania 2010
Ukraine 20110% 5% 10% 15% 20%
Social Insurance
Labor Market
Social Assistance
8.5. Serbia’s numerous social assistance programs have a variety of social objectives. Broadly, their objectives can be divided into three groups: (1) poverty reduction, (2) population growth (pronatality), and (3) assistance to such vulnerable groups as veterans and the disabled. Serbia has only one explicit anti-poverty program—means-tested financial social assistance (FSA), previously called Material Support for Low Income Households (MOP). The other means-tested program is the pro-natalist child allowance program. Other programs are the caregiver’s allowance, wage compensation during maternity leave, the birth grant allowance, benefits for foster care, waiver of school fees for vulnerable children, and a plethora of benefits for war veterans and families of fallen soldiers. Other programs are categorical, and include the caregiver's allowance (non-contributory disability benefit); wage compensation during maternity leave (non-contributory); parental allowance (birth grant); benefit for foster care; school fee-waiver for vulnerable children; and a plethora of benefits for war veterans and for the families of fallen soldiers (See Box 8.1 for details of the main SA programs.) These programs are categorical and not explicitly means-tested, but may have positive distributional impacts due to the characteristics of their recipients. Municipalities also provide one-time assistance to vulnerable families. Finally, Serbia also operates social care services, such as day care programs and temporary shelter assistance for refugees as well as housing and heating allowances.

85
III. OppOrtunItIes fOr ImprOvIng the effIcIency and equIty Of publIc spendIng In sOcIal sectOrs
Targeted (means-tested) Noncontributory Programs: Financial Social Assistance (FSA), Serbia’s last resort social assistance program previously known as MOP (Materijalno obezbedenje porodice or Material Family Support), provides income support for families or households that meet certain eligibility criteria related to incomes, asset ownership, and employment status of able-bodied members. The amount of the benefit is the difference between an administratively preset income threshold for a unit of assistance of specific size (from one to six members), using explicit equivalence scales, with a threshold level of RSD 7,843, and the actual income of the unit needing assistance (household or family). Eligibility thresholds and maximum benefit levels are updated twice a year to track growth in consumer prices. The program is financed by the central budget and designed by the Ministry of Labor, Employment and Social Policy (MELSP); municipal Centers for Social Work (CSWs) administer eligibility verification, certification, and payments; the CSWs are deconcentrated bodies of MELSP. Eligibility is verified each year and whenever circumstances change. The law also introduced the concept of activating those who are able to work; prescribing for the first time that beneficiaries able to work have the obligation as well as the right to participate in activities leading to their inclusion in society.
The Child Allowance (CA) Program, financed by the MLSP, is intended to support the income of poor households with children. As in the FSA, eligibility is determined by asset tests. However, the benefit is fixed and does not vary with income. The income threshold of RSD 8,155 per family member is higher than for the FSA. Children are also required to attend school. Each child is entitled to the allowance until he or she reaches the age of 19 (26 if disabled). Households must reapply annually. Like to FSA, the child allowance is administered by the municipal CSW, where potential beneficiaries apply.
Categorical Noncontributory Programs:The maternity leave allowance compensates mothers for lost earnings during maternity leave. The benefit is based on the mother’s net wage in the 12 months before the maternity leave and the length of employment. If a mother has been employed for more than 6 months, her compensation equals 100 percent of her net wage; if employed 3 to 6 months, 60 percent; and if employed less than 3 months, 30 percent. The maximum monthly compensation is capped at five times the average monthly wage in Serbia. This benefit is generous relative to similar types of compensation in EU countries, including the new member states from Central and Eastern Europe, where most benefits are financed from insurance contributions.
The birth grant (parental allowance) was introduced in the 2002 amendment to the Law on Financial Support to Families with Children, and expanded in 2006 to allow benefits for first-born children. It is paid in one installment for the first child and in 24 monthly installments for the second, third, and fourth children. The amount of the benefit depends on birth order. To be eligible, the mother has to be entitled to health care.
Disability benefits include both a personal disability benefit and a caregiver’s allowance (allowance for provision of care by another person). These benefits are extended to persons who have a disability from birth or childhood or adults who have no social insurance against the risk of disability. Potential beneficiaries may apply to the CSW, where eligibility is determined based on an applicant’s medical condition. The caregiver allowance takes the form of monthly payments to individuals who require care and assistance with filling basic needs due to nature and the degree of the injury or illness.
War veteran benefits comprise various forms of income support to war veterans, survivors, civilian victims of war, and their families. Benefits include wage compensation for working veterans, cash compensation for disabled veterans, a caregiver’s allowance, and survivor’s benefits.
Box 8.1: Serbia’s Social Assistance Programs
Source: Adapted from “Activation and Smart Safety Nets in Serbia: Constraints in Beneficiary Profile, Benefit Design, and Institutional Capacity” (2013), World.
Social Assistance and Labor Spending: Regional Comparison
8.6. Serbia’s spending—2.08 percent of GDP—on social assistance is comparable to that of other ECA countries but lower than the EU average of 4.29 percent (Figure 8.3).51 Several new EU member states spend similar amounts—Poland, 2 percent; Latvia, 1.8 percent; and Lithuania, 2.4 percent—but others spend more: Hungary, 4.2 percent; Slovenia, 3.5 percent; and Slovakia, 2.8 percent.
8.7. Sixty percent of the Serbia’s SA spending goes to family and child allowance programs; only 30 percent is directed to poverty reduction (Figure 8.3). The outlays on family and child allowances52 represent 1.2 percent of GDP, and go to parental allowances (birth grants), wage compensation, child allowances, and foster care. Of these programs only the child allowance is means- tested, and thus has the additional objective of poverty reduction. The other categorical benefits (war veteran and disability benefits) represent 25 percent of SA spending (about 0.5 percent GDP).

86
III. OppOrtunItIes fOr ImprOvIng the effIcIency and equIty Of publIc spendIng In sOcIal sectOrs
Figure 8.3: Social Assistance Spending Percent of GDP, 2013 (war benefit simulated) 53
Figure 8.4: Serbia’s Social Assistance Spending in Serbia, by Program (Percent of GDP)
Source: Europe and Central Asia Social Protection expenditure and evaluation Database, World BankNote: Spending on war veterans benefits was not available after 2011; projections for subsequent years are based on past growth rates.
Source: Europe and Central Asia Social Protection expenditure and evaluation Database, World Bank.Note: Spending on war veterans benefits are not available after 2011; projections for subsequent years are based on past growth rates.
51 2011 value, ESSPROS database, Eurostat52 Family benefits programs are regulated by the law on financial support to families with children (2005).53 In Serbia, the main categories are (1) FSA; (2) family allowances: child allowance, parental allowance, wage compensation during maternity leave and foster care; (3) disability: caregiver allowance; (4) war veteran-related benefits: and (5) other: preschool allowance.
54 At the end of 2010, the formula for calculating the benefit was changed to ensure a tighter link between the employment and contribution record and the actual wage of the beneficiary mother, on one hand, and her compensation during maternity leave, on the other, and to limit previously existing possibilities for inflating the reference wage. As a result, in 2011 the cost of the wage compensation during maternity program was contained relative to 2010 despite a notable increase in the number of claimants.
0.0%
1.0%
2.0%
3.0%
4.0%
5.0%
6.0%
Other
Social/non-contributory pension
Low income/last-resort program
Family and child allowances
Disability benefits
Housing and utility
War veteran related benefits
Geor
gia
13
BIH
10
Croa
tia 12
Ukra
ine
12
Rom
ania
10
Esto
nia
11
Kyrg
yz R
epub
lic 12
Bela
rus 1
3
Lith
uani
a 09
Serb
ia 13
Alba
nia
13
Arm
enia
12
Mol
dova
13
Mon
tene
gro
13
Turk
ey 13
Koso
vo 13
FYR
Mac
edon
ia12
Kaza
khst
an 12
Azer
baija
n 11
Bulg
aria
13
Latv
ia 12
Pola
nd 13
Tajik
istan
11
8.8. The largest SA program is wage compensation during maternity leave whose spending has risen over the years, reaching about 0.66 percent of GDP in 2013 (Figure 8.4). While eligibility is directly related to employment status (formal workers and self-employed), the financing comes from the State Budget through the MLESP, so this program is treated as non-contributory. Although the rapid spending increase for this program was contained starting in 2011,54 it still accounts for more than one-third of total SA spending, and the cost
is twice the amount spent on FSA. Due to the link with employment, the program does not cover unemployed mothers or those who are out of the formal labor market. The benefit is proportional to previous wages, which decreases its ability to alleviate poverty but does allows for smoothing consumption before and after pregnancy. Similar programs that in some other ECA countries are usually contribution-based and part of the social insurance pillar, so they do not divert resources away from programs targeted to the poor.
0.00%
0.10%
0.20%
0.30%
0.40%
0.50%
0.60%
0.70%
0.80% Foster Care
Caregivers Allowance
Financial Social Assistance (FSA)
Family and Child Allowances
Child Allowance
Veterans and Disability Benefits
Wage Compensation During the Maternity Leave
2005 2006 2007 2008 2009 2010 2011 2012 2013
% o
f GDP

87
III. OppOrtunItIes fOr ImprOvIng the effIcIency and equIty Of publIc spendIng In sOcIal sectOrs
8.9. After the new Social Welfare Law in passed in 2011, spending on SA went up to 0.34 percent of GDP but it is still below the regional standard. The last resort program was thoroughly revamped in 2011 in order to expand coverage and the adequacy of the benefit; regulate the provision of social care services and link it to cash assistance (case management); and introduce behavioral conditions and incentives for activating
able-to-work beneficiaries (see Box 8.1).55 Consequently, spending on FSA almost doubled (from 0.16 percent of GDP in 2010 to 0.34 percent in 2013), though it is still below the regional average of 0.5 percent. In 2012 the number of beneficiaries also reached a historical record of more than 221,000 direct and indirect beneficiaries, and in 2013 beneficiaries constituted about 3 percent of the population in 2013 (Table 8.1).
Source: ECA Social Protection Expenditure and Evaluation Database, World Bank.
Table 8.1: FSA Spending and Beneficiaries, 2005–13
Figure 8.5: Meanstested and Nonmeanstested Social Assistance, 2006–13 (Percent of GDP)
FSA 2005 2006 2007 2008 2009 2010 2011 2012 2013
Spending (million RSD) 2,216 2,660 3,005 3,675 4,577 5,062 7,726 10,168 12,659
Beneficiaries 99,781 111,674 131,053 139,570 151,477 166,942 166,309 221,403 n.a.
55 Recently, the government has announced a proposed revision of the 2011 law that would increase activation of FSA beneficiaries and improvement the provision of public services in local communities.
8.10. Despite significant reforms in recent years to expand coverage, meanstested transfers still account for less spending than untargeted SA (Figure 8.5). The two means-tested programs have clear poverty alleviation objectives, and in the case of the child allowance an additional population growth objective; together they account for just 30 percent of spending and 0.68 percent of GDP. While this represents a significant increase, it is still relatively low compared to the share of non-means-tested benefits, which may be limiting the impact of social assistance on poverty.
8.11. It appears from the current composition of SA spending that there is room to make SA ore effective in addressing the government’s social policy objectives. Serbia’s population has been declining for the last 20 years (GoS, 2014) and participation in the labor market has
been very low, which explains the government programs to influence fertility choices. However, the evidence on the impact of pronatalist programs (mostly from wealthier countries) on fertility and the labor force participation rate of women is mixed. For instance, purely financial measures (birth bonuses, more generous allowances for higher-order births) have little or no impact.
8.12. Rationalizing the untargeted programs would create fiscal space for povertytargeted programs. Balancing multiple social policy objectives is always difficult, but given the evidence, rationalizing spending on untargeted categorical programs may create fiscal space to either combine them with other services to improve their impact, or expand poverty-targeted programs. The next section provides evidence on how well SA programs perform and analyzes coverage gaps and poverty impact.
Source: ECA Social Protection Expenditure and Evaluation Data-base, World Bank.
0.0%
0.50%
1.00%
1.50%
2.00%
Means Tested Social Assistance
Non-Means Tested Social Assistance
2006
2007
2008
2009
2010
2011
2012
2013
2.50%

88
III. OppOrtunItIes fOr ImprOvIng the effIcIency and equIty Of publIc spendIng In sOcIal sectOrs
56 The at-risk poverty line is 60 percent of the median equivalent income, using the OECD equivalence scale.
Source: Matkovic, G., Poverty in Serbia during the transition – Trends, policies, dilemmas. Paper presented at the World Bank International Con-ference on Poverty and Social Inclusion in the Western Balkans, Brussels, December 14-15, 2010
The 2011 Law on Social Welfare significantly changed the FSA benefit levels and coverage, particularly for beneficiaries living in multi-member households and for households where members are unable to work. In addition, FSA recipients are expected to become more active in addressing their problems. In nominal terms, the new benefit is set at a higher level, calculated on a new equivalence scale aligned to the modified OECD scale (1 for the first adult, 0.5 for the second and each additional adult, and 0.3 for the child). For households where no member is able to work, the law provides for a 20 percent benefit increase. The maximum number of eligible members was raised from five to six, while the nine-month eligibility timeframe for households where the majority of members is able to work remained unchanged. The land ownership threshold was increased from 0.5 to 1 hectare for households where all members are unable to work. The definition of individuals unable to work also changed to include college and university students, pregnant women and caretakers of disabled family members. These amendments are expected to increase the number of FSA recipients by 60 percent and spending on social assistance by 80 percent. There is a new emphasis on the activation of FSA recipients through education, training, employment and community based work. The new Law gives the possibility to the CSWs to sign agreements with beneficiaries for their activation (individual activation plans) and with other service providers, such as the National Employment Service.
Box 8.2: Main FSA Provisions Introduced by the New Law on Social Welfare
B. How Effective are Social Assistance Programs
8.14. Serbia faces a serious coverage gap: only 35 percent of the poorest quintile receives any social assistance. Poverty in Serbia is relatively high and the at-risk poverty rate was 24.5 percent in 2013, compared to a 16.6 percent average for the EU 2856. Coverage of the bottom quintile, which roughly corresponds to the poor in Serbia, is among the lowest (after Spain) among EU28 countries (Figure 8.6). Countries with similar or even less SA spending have been able to achieve higher coverage: in Latvia coverage of the poor reaches 70 percent and in Bulgaria it reaches 59 percent. Also, since most SA programs are not means-tested, it is not surprising that almost 15 percent of the richest quintile are covered by social assistance. Reforming these categorical programs should be a government priority; doing so could bring savings or allow resources to be reallocated to programs that do target the poor.
8.15. The impact of SA on poverty is limited by low coverage and inaccurate targeting. In fact, simulations showed that a shift of the resources from categorical programs to the well targeted FSA can reduce the overall at risk poverty rate by as much as 8 percentage points (i.e. the risk poverty rate would be 18.6 percent compared to the current rate of 24.5 percent). This is not surprising as some programs, starting with the largest in terms of spending, do not focus on the poor (low coverage and regressive distribution of benefits) but have other objectives, such as population growth or providing benefit to war veterans.
8.16. In general social assistance could be much better targeted: only 23 percent of all transfers go to the poorest quintile (Figure 8.7). This is largely because for the largest programs (e.g., maternity wage compensation), significant shares reach the wealthier half of the population. Compared to other countries, in Serbia a very low share of benefits accrue to the poorest. Similarly, the leakages of social transfers to the richest quintile (about 28 percent of all benefits) is the highest in the region (Figure 8.7). The benefit incidence is in fact higher for the richest quintile than for the poorest, because the main social assistance program, maternity wage compensation, is earnings-related.
8.13. Most public spending on labor market policies goes to passive measures. While spending on labor market policies totaled less than 1 percent of GDP, there is a large discrepancy in the amounts funds allocated to passive programs (financial assistance to unemployed) and active labor market policies (ALMPs). Passive ones are favored despite changes in the law on employment and unemployment insurance that opened some fiscal space to increase ALMP funding. There is an array of active measures, such as training (vocational and post-education); employment incentives (employment subsidies for self-employment, rehabilitation programs, and work ability assessments); and direct job creation through public work. However, ALMPs represented only 0.1 percent of GDP in 2013, low compared to most European countries, while passive measures (mainly unemployment benefits) accounted for 0.57 percent, relatively high for ECA countries.
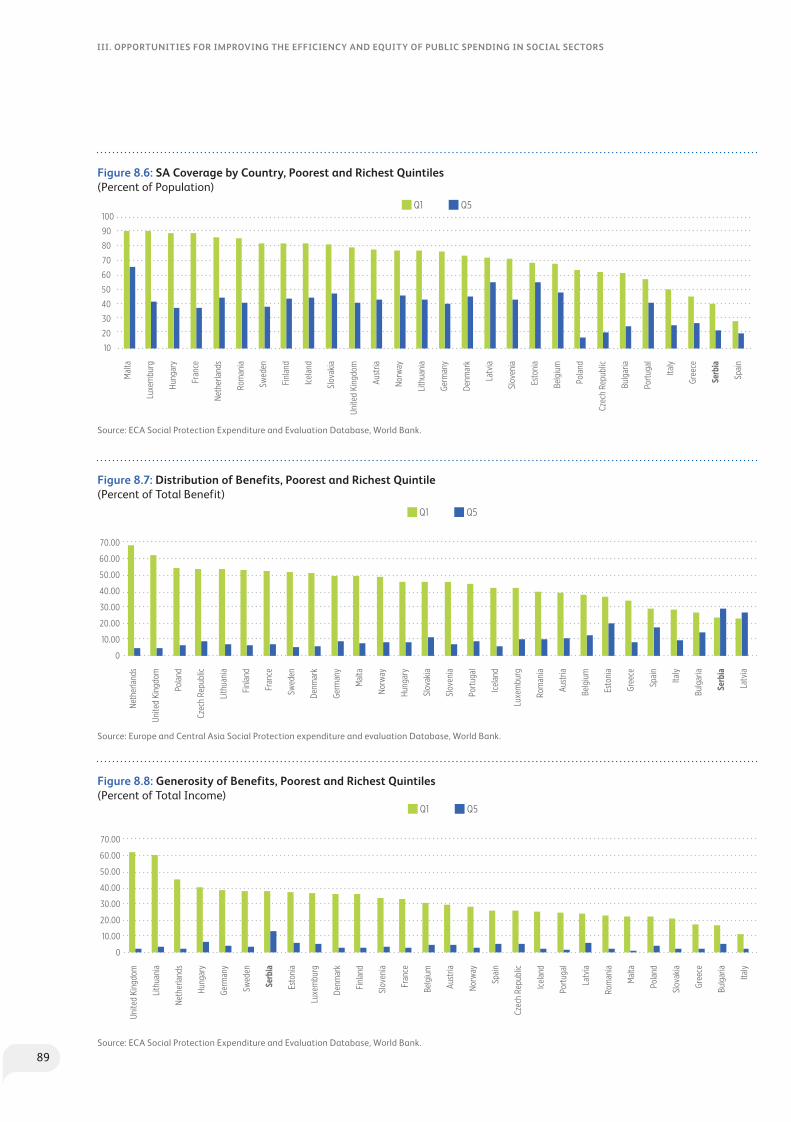
89
III. OppOrtunItIes fOr ImprOvIng the effIcIency and equIty Of publIc spendIng In sOcIal sectOrs
Figure 8.6: SA Coverage by Country, Poorest and Richest Quintiles (Percent of Population)
Figure 8.7: Distribution of Benefits, Poorest and Richest Quintile (Percent of Total Benefit)
Figure 8.8: Generosity of Benefits, Poorest and Richest Quintiles (Percent of Total Income)
Source: ECA Social Protection Expenditure and Evaluation Database, World Bank.
Source: Europe and Central Asia Social Protection expenditure and evaluation Database, World Bank.
Source: ECA Social Protection Expenditure and Evaluation Database, World Bank.
Mal
ta
Luxe
mbu
rg
Hung
ary
Fran
ce
Neth
erla
nds
Rom
ania
Swed
en
Finl
and
Icel
and
Slov
akia
Unite
d Ki
ngdo
m
Aust
ria
Norw
ay
Lith
uani
a
Germ
any
Denm
ark
Latv
ia
Slov
enia
Esto
nia
Belg
ium
Pola
nd
Czec
h Re
publ
ic
Bulg
aria
Portu
gal
Italy
Gree
ce
Serb
ia
Spai
n
Q1 Q5
70
80
90
100
60
50
40
30
20
10
Q1 Q5
70.00
60.00
50.00
40.00
30.00
20.00
10.00
0
Neth
erla
nds
Unite
d Ki
ngdo
m
Pola
nd
Czec
h Re
publ
ic
Lith
uani
a
Finl
and
Fran
ce
Swed
en
Denm
ark
Germ
any
Mal
ta
Norw
ay
Hung
ary
Slov
akia
Slov
enia
Portu
gal
Icel
and
Luxe
mbu
rg
Rom
ania
Aust
ria
Belg
ium
Esto
nia
Gree
ce
Spai
n
Italy
Bulg
aria
Serb
ia
Latv
ia
Q1 Q5
70.00
60.00
50.00
40.00
30.00
20.00
10.00
0
Unite
d Ki
ngdo
m
Lith
uani
a
Neth
erla
nds
Hung
ary
Germ
any
Swed
en
Serb
ia
Esto
nia
Luxe
mbu
rg
Denm
ark
Finl
and
Slov
enia
Fran
ce
Belg
ium
Aust
ria
Norw
ay
Spai
n
Czec
h Re
publ
ic
Icel
and
Portu
gal
Latv
ia
Rom
ania
Mal
ta
Pola
nd
Slov
akia
Gree
ce
Bulg
aria
Italy

90
III. OppOrtunItIes fOr ImprOvIng the effIcIency and equIty Of publIc spendIng In sOcIal sectOrs
Figure 8.9: Program Coverage and Coverage Distribution by Quintile (Percent of Population)
Source: ECA Social Protection Expenditure and Evaluation Database, World Bank.
8.17. The generosity of social assistance is relatively high in Serbia, for both the bottom and the wealthiest quintiles, compared to most EU28 countries (Figure 8.8). In fact, SA transfers represent 37 percent of total income for the bottom quintile, demonstrating not only that the level of transfers is relatively high, but also that the poor have very few other income sources and are relying on SA transfers to survive (Figure 8.8). For the richest quintile, SA transfers represent only 13.2 percent of income, but Serbia’s generosity to the richest is still higher than in any other country. The high level of benefits for the richest is because benefits in the maternity wage compensation program are higher for those whose previous earnings were high.
8.18. Overall SA performance masks significant differences in programs. Clearly, the performance of SA as a whole depends on the design of each benefit: a relatively small program that effectively targets the poor may be counterbalanced by a non-targeted scheme with larger coverage. To understand the interaction of SA programs in Serbia and to assess their relative performance, it is important to analyze program performance indicators.
C. Performance of Categorical (NonTargeted) Benefits
8.19. Categorical benefits, which are responsible for twothirds of Serbia’s SA spending, cover only a small share of the population and the poor (Figure 8.9). Parental allowance is the largest categorical program in terms of coverage, but it reaches only about 4 percent of the population; shares are even lower for maternity wage compensation at 2 percent and parental allowances at
just 0.5 percent. Worse, maternity wage compensation reaches only 0.4 percent of those in the bottom quintile but a full 4 percent in the wealthiest quintile. Coverage by quintile is fairly even for the parental allowance (a universal program) but increases for the higher quintiles for wage compensation and disability benefits.
Q1
Q2
Q3
Q4
Q5
0 2 4 6 8 10 12
War veteran benefit
Allowance for care
Wage compensation during maternity leave
Financial social assistance
Parental allowance
Child allowance

91
III. OppOrtunItIes fOr ImprOvIng the effIcIency and equIty Of publIc spendIng In sOcIal sectOrs
8.20. The distribution of transfers is regressive due to the high cost of wage compensation where only 2 percent of the transfers reach the poor (Figure 8.10). More than half of the benefits of that program accrue to the wealthiest 20 percent of the population, and 80 percent of total benefits go to the wealthiest 40 percent. In effect the program excludes women who are not
Figure 8.10: Benefits by Program and Quintile (Percent of Benefit)
Figure 8.11: Costbenefit Ratio of Social Assistance
Source: ECA Social Protection Expenditure and Evaluation Database, World Bank.
Source: World Bank.
70.0
80.0
60.0
50.0
40.0
30.0
20.0
10.0
0.0
Q2 Q3 Q4Q1 Q5
Parental allowance
Wage compensation during maternity leave
War veteran benefit
Child allowance
Monetary social assistance
Allowance for care
Monetary social assistance
Child allowance
Parental allowance
Allowance for care
Wage compensation during maternity leave
War veteran benefit
0.00 0.10 0.20 0.30 0.40 0.50 0.60 0.70 0.80 0.90 1.00
in the formal labor market, who most likely come from the poorest quintiles. Similarly, the distribution of war veteran benefits is quite regressive, with only 1 percent of total transfers directed to the poorest and more than 80 percent directed to the two wealthiest quintiles. The distribution of benefits is relatively even across quintiles for parental allowances and allowances for care.
8.21. Although they are relatively generous, the poverty impact of categorical programs is negligible. Wage compensation transfers represent about 22 percent
of the average income for all beneficiaries (16 percent for war veteran benefits, 7 percent for parental allowances) and about 21 percent of total income for the wealthiest quintile (29 percent for war veteran benefits, 4 percent for parental allowances) which are among the highest in any ECA country. Nevertheless, simulations have found that the poverty rate would have increased by only 0.1 percent if
there were no wage compensation program or war veteran benefits, and by 0.3 percent without the allowance for care. In other words, the cost-benefit ratio, which measures how effectively a transfer reduces the poverty gap, is low for categorical programs (Figure 8.11). The ratio represents the poverty gap reduction for each dinar spent on the program. The closest it is to 1, the better cost-benefit effectiveness is, as each spending reduces - by the same amount - the poverty gap (in this case below the first decile), and is not ‘lost’ to some non-poor households.

92
III. OppOrtunItIes fOr ImprOvIng the effIcIency and equIty Of publIc spendIng In sOcIal sectOrs
Figure 8.12: Coverage by Program and Quintile (Percent of Population)
Source: ECA Social Protection Expenditure and Evaluation Database, World Bank.
D. Performance of PovertyTargeted Programs
8.22. The child allowance reaches onefourth of the poorest quintile but is only modestly targeted. Child allowance is the largest program in terms of coverage, reaching almost 11 percent of the total population and 25 percent of the bottom quintile; coverage rates decrease by quintile. However, less than half of the transfers (46 percent) accrue to the poorest quintile, and 30 percent goes to the second poorest quintile. Despite low generosity, its impact on poverty is not insignificant, however, due to the breadth of its coverage. In the absence of the program poverty would be expected to increase by 0.8 percentage points.
8.23. The FSA is a welltargeted: 74 percent of its benefits reach the poorest quintile. Also, the inclusion error of the FSA is quite small, with only 1.6 percent of all benefits going to the richest quintile. Comparison of FSA with similar poverty-focused programs in other countries finds FSA well above average for targeting accuracy in the ECA region57 and on a par with the targeting of major programs in developed countries.
8.24. However, despite recent reforms its coverage is still low (Figure 8.12). The adoption of the Social Welfare Law in 2011 has resulted in an expansion of FSA, evidenced by a 30 percent increase in the number of beneficiaries. However, the FSA still does not provide sufficient coverage: FSA benefits go to only 11 percent of the poorest quintile.58 The low coverage of FSA may be due to non-take-up issues or to additional conditions of the means/asset-test (in addition to the income test). In fact, the eligibility threshold, RSD 5,300 is considerably
57 The regional average is based on targeting accuracy (share of transfers received by the poorest quintile) of last resort SA programs in other ECA countries, using harmonized consumption aggregate (ECA POV) and an absolute poverty line. Hence a direct comparison with the income-based and relative poverty
measurement used in this analysis is not the best option.58 Due to the significant differences between the list of programs included in the HBS and SILC (and changes in the poverty measurement methodology) it is not feasible to do a comparison of FSA coverage over time.
below the RSD 7,100 average for the bottom decile, which helps with targeting but also limits coverage.
8.25. Even with accurate targeting and relatively high average benefits, low coverage limits the impact of the FSA on poverty. Without FSA, the poverty rate would increase by 0.7 percent to 26.4 percent. Following the 2011 reform, FSA benefits are relatively more generous, constituting on average 32 percent of the total income for all beneficiaries, and 48 percent for those in the bottom quintile.
8.26. On the other hand, the FSA is Serbia’s most costeffective SA program. The FSA cost-benefit ratio, which represents how much the poverty gap is reduced by each RSD spent on the program, is 0.85, is the highest of all SA programs in Serbia. The closest this ratio for one SA program is to 1, the more effective that program from a cost-benefit standpoint is. This is a direct consequence of the high targeting precision of the FSA compared to other benefits.
8.27. The impact of SA on poverty could be enhanced by expansion of its coverage. In addition to the fact that coverage of the poor are low, the actual SA program may be undercovering some at-risk population groups, for instance, the elderly, only 8 percent of whom receive a SA transfer, and in particular, only 7 percent receive the FSA. Even though the recent reform raised the eligibility threshold, the asset test still prevents many elderly from being eligible. Coverage also depends on outreach efforts to identify those eligible, which is not very strong in Serbia, and on the administrative burden of attaining and maintaining eligibility, which is significant. This burden on the applicant is likely to be particularly heavy for minorities, such as Roma, resulting in limited coverage despite their vulnerability.
25.0
20.0
15.0
10.0
5.0
0.0
Q2 Q3 Q4Q1 Q5
Parental allowance
War veteran benefit
Wage compensation during maternity leave
Monetary social assistance
Child allowance
Allowance for care
30.0

93
III. OppOrtunItIes fOr ImprOvIng the effIcIency and equIty Of publIc spendIng In sOcIal sectOrs
59 The government is working on amending the Law on Financial Support to Family with Children. Details of the proposed amendments are expected to be available by June 2015. 60 Due to limitations of the SILC 2012 data, it is not possible to simulate the full eligibility criteria for FSA. The rudimentary simulations undertaken only consider the FSA income eligibility requirement (RSD 6,774 per equivalent adult in 2012) and not the asset test. The simulations are intended to be illustrative; estimating the full impact would require simulation of FSA full eligibility requirements and calculation of the actual benefit for each eligible household (compared to the average benefit used in the illustrative simulations).
8.28. There are implicit work disincentives in design of the FSA. Just as in many other ECA in the ECA region, FSA is designed so that each additional dinar a beneficiary earns is a dinar lost in benefits, since the benefit is calculated as the difference between a certain income threshold and the net income of beneficiary families. As a result, below the threshold there is no financial incentive for a family to earn more income because it will be automatically reduced from the benefit they receive—making this a 100 percent marginal effective tax rate. The CSW worker’s discretion in making the income assessment can also deter current benefit recipients from exiting the system. The procedure for determining FSA eligibility includes an assessment by the social worker, e.g., to identify possible foregone opportunities for earnings and to check for informal employment. Since there is no structured evaluation process, the CSW worker has some discretion in assessing certain elements of family income when applying income eligibility criteria. This could lead to denial of FSA for a current recipient if a different CSW worker comes up with a different estimate. Once approved, therefore, some recipients may feel reluctant to exit the system because of fears about future reentry.
8.29. Improving SA design is necessary but not sufficient. Redesigning the benefit design to provide more financial incentives to work would be insufficient unless other barriers to work are addressed, among them lack of skills, unavailability of support services, and high labor taxes on low-paid labor. Labor taxes in Serbia are average for higher-wage earners but very high for low-paid jobs. A comparison with OECD and neighboring countries shows that the tax wedge on less well-paid workers in Serbia is among the highest, 36.7 percent (World Bank 2012), due to the minimum social security contributions employees and employers are mandated to pay.
E. Conclusions and Recommendations
8.30. There is scope for Serbia to continue to modernize its safety net and make it more efficient and effective. The current safety net is designed to address multiple social policy objectives, but a large portion of the spending goes to non-poverty-targeted programs. Only 35 percent of the poorest quintile receive any SA transfer—very low compared to EU 28 countries, even those with similar levels of spending. Similarly, only 23 percent of all transfers go to the poorest quintile, while 28 percent accrues to the richest—the highest in the region. As a result, SA has very little impact on poverty.
8.31. While balancing multiple social policy objectives is challenging, SA spending could be made more effective by shifting resources from categorical to
targeted programs by redesigning elements of current programs. The Government could therefore consider the following reforms: • Scale back the wage compensation program59 and
use the freed-up resources to expand FSA, Serbia’s most effective SA program. Simulations60 indicate that if maternal wage compensation resources were used to provide average benefits to households that are below the income threshold but are currently not receiving FSA, the at risk-poverty rate would decline to 16.8 percent (about 8 percentage points), spending on FSA would more than double, and its coverage would expand from 3 to 11 percent of the population (with about 80% of the poorest quintile covered). •Means-test the parental allowance (birth grant).
Redesign the program, at a minimum to stop providing benefits to the wealthier 50 percent of the population, and channel the resulting savings (0.1 percent of GDP) to expanding FSA, child allowances, or childcare coverage. Another option could be to consolidate this program with child allowances. • Redesign the FSA to remove the built-in work
disincentives. Introduce in-work benefits. While this will not bring any fiscal savings in the short term (in fact it may temporarily increase the cost slightly), it would be worthwhile in the medium to long term because it would incentivize work, increase self-reliance, and allow some to eventually exit from the system completely. • Complement FSA redesign of FSA with more
determination implementation and enforcement of the activation of FSA beneficiaries, linking them with adequate and accessible employment support programs, and facilitating coordination between the National Employment Service and the CSWs. • Finally,toprotectthevulnerablefromanyenergytariff
increases, channel current or future subsidies through the current social assistance program to eliminate fragmentation and make such transfers more effective.


95
VIII. SOCIAL ASSISTANCE
IV. Distributional Impact of Fiscal Consolidation in Serbia


97
IV. DISTRIBUTIONAL IMPACT OF FISCAL CONSOLIDATION IN SERBIA
CHAPTER 9. DISTRIBUTIONAL IMPACT OF FISCAL CONSOLIDATION MEASURES
9.1. What might be the distributional implications of the main elements of the government’s fiscal consolidation program? The objective of this chapter is to make an initial assessment of this question focusing on core measures the government has announced in areas of public spending–i.e., reforms to the public administration wage bill, pensions, and state support to public enterprises (through resolution of the Privatization Agency portfolio and privatization generally) along with the proposed electricity price increase of 12 percent. The latter, which is to be confirmed reflects a rise in both excise taxes and tariffs as part of the financial restructuring for Elektroprivreda Srbije (EPS); a prior action for the first review under the IMF SBA program.61
9.2. Evidence on the potential incidence and direct channels of distributional impact of the main spending consolidation measures can inform analysis of options about any further consolidation measures and the political sustainability of reforms. The evidence presented below relies on a number of different datasets and sources to look at the potential near-term distributional impact of reforms that directly affect household incomes and expenditures. More detailed approaches could also inform discussion of the policy-tradeoffs from fiscal consolidation measures, for example, looking across the range of fiscal instruments or incorporating general equilibrium or the dynamic impacts of having more efficient and a higher quality of public service provision. It is also worth emphasizing that given the general fiscal constraints on Serbia it will be important to ensure that any temporary mitigating measures do not themselves give rise to sustained new spending obligations.
9.3. The remainder of this section is structured as follows: First are presented some characteristics of poverty and labor market profiles that relate to the groups most likely to be affected by fiscal consolidation measures, namely the public sector and SOE workers and pensioners. The chapter then presents evidence of the potential impacts of reforms on those areas.
A. Serbia’s Poverty and Labor Market Profile in Brief
9.4. Two facts about Serbia’s poverty and labor market profile are important to consider when looking at the distributional impact of core nearterm fiscal consolidation measures. The first is the relatively low risk of poverty for those who are retired compared to the national average. The second is that public sector workers on average are paid more than private sector workers.
9.5. On average pensioners in Serbia are at a relatively low risk of poverty, as measured by their incomes. Based on the 2014 SILC, individuals aged 65 and over have an at-risk of poverty rate of 20.7 percent; the general poverty rate is 25.6 percent.62 The poverty gender gap is reversed here with males aged 65 and over having a lower poverty rate than females of the same age compared with higher poverty rates for males relative to females in other age categories. As discussed in Chapter 4, early retirement is relatively common high in Serbia (i.e., those in receipt of pensions may not be elderly) and there may be elderly who are not retired. Looking at the split by labor market status, the retired, who account for 26 percent of the population aged 15 or more, have an average poverty rate of 13.0 percent compared with 15.1 percent for the employed, who account for 39 percent of the population aged 15 or more.63
9.6. As highlighted in Chapter 3, average wages are higher in the public than in the private sector. Based on LFS data for 2014, recent estimates from IPSOS indicate that this differential rises from 8 percent for the lowest decile of salaries up 38 percent in the 6th decile and 20 percent in the 9th. Of those occupations that can be paired across private and public sectors, the public has higher salaries in 85 percent of the 32 types of occupations for which comparison is possible.64 Public sector workers on average have higher education levels and years of experience but evidence suggests that these do not drive the wage premium with, for example, evidence from the LFS suggesting that on average SOE workers earn more than private sector workers for any given level of education, with the exception of tertiary.65
9.7. Public sector employment is more prevalent in the top income deciles (see Table 9.2). It accounts for about 33 percent of total employment in Serbia. For the bottom 40 percent of the income distribution, about 15 percent of those who are employed work in the public sector; in the top 60 percent, about 40 percent work
61 Government of Serbia Memorandum of Economic and Financial Policies, Attachment I, in IMF (2015), Republic of Serbia 2014 Article IV Consultation and Request for Stand-By Arrangement. 62 The at-risk-of-poverty threshold (relative poverty line) represents 60 percent of the median national disposable income in dinars. In the 2015 SILC for a single person household this was RSD 13,408 per month.63 Poverty figures from 2014 SILC headline indicators. Structure of the population by activity status from the 2013 SILC.64 Since the public sector wage cut of 10 percent, this is estimated to have fallen to 63 percent. 65 World Bank, “Addressing the poverty, gender, and social impacts of privatization in Serbia”, mimeo, prepared as background for the SOE DPL (World Bank, 2015, Serbia - First Programmatic State Owned Enterprises Reform Development Policy Loan Program Project).

98
IV. DISTRIBUTIONAL IMPACT OF FISCAL CONSOLIDATION IN SERBIA
Table 9.1: Atriskofpoverty Rate by Age and Labor Market Status
Table 9.2: Labor Force Statistics by Income Group, aged 18–65
Source: World Bank Serbia SCD. Based on Statistical Office of Republic of Serbia’s SILC data. Note: Labor force statistics derived from household surveys can differ slightly from those derived from the more specialized Labor Force Surveys, but comparisons across income groups are expected to be reliable.
in the public sector. Of employed workers at risk of poverty fewer than 10 percent work in the public sector. Taking into account the employment rate, then, about 5
percent of the bottom 40 and 3 percent of the poor are employed in the public sector, compared to 23 percent in the top 60 percent.
Source: 2014 SILC, NBS.
Male Female Total
Average 26.2 25.0 25.6
Age group:18–24 30.2 27.7 29.0
25–54 26.6 25.2 25.9
55–64 27.2 21.1 24.1
65 and over 17.9 22.8 20.7
Labor Market Status:Employed persons 16.4 13.4 15.1
Employees 8.4 8.7 8.6
Self-employed 39.7 36.0 38.4
Not employed 38.9 32.2 35.1
Unemployed 51.0 42.5 47.1
Retired 13.6 12.7 13.0
Other inactive persons 27.9 33.5 31.7
All Bottom 40% Top 60% Poor (below 60% median income) Non-Poor
Labor force participation (%) 71.9 71.4 72.1 72.1 71.8
Unemployment rate (%) 31.7 52.1 18.6 58.2 23.0
Employment rate (%) 49.0 34.2 58.7 30.2 55.3
Self-employment (% of employed) 24.7 49.3 15.4 62.1 18.0
Public sector (% of employed) 32.8 14.6 39.7 9.6 37.0
B. Public Sector Wage Bill Reforms
9.8. The negative impact on poverty of recent freezes and cuts in public sector wages is expected to be limited by the facts that public employees tend to be relatively well paid and far from the poverty line and that the cuts did not apply to lower salaries. The 2014 revised budget removed public sector wage indexation as of October 2014 and imposed a nominal 10 percent reduction in wage as of November 2014, excluding employees with salaries below RSD 25,000). Poverty and social impact analyses for the World Bank’s 2009 and 2011 Public Expenditure Development Policy Loans also noted that the civil service wage freezes these operations supported were expected to have little if any poverty impact because civil servants tend to be far from the poverty line.
9.9. However, rightsizing reforms leading to layoffs are clearly likely to have more direct impact on household incomes. In 2015 the government plans to reduce government employment by 5 percent (about 27,000 employees) through attrition and targeted separations by preparing wage bill envelopes for individual public institutions.66 Among the mitigation measures are severance payments, to be determined based on current legislation. To the extent that attrition is used, public employees may transition to pension status, limiting the impact on their incomes from the separation. The ability of those who lose their jobs to find new employment will depend on their education levels, skills, and age as well as geography. Further details of the profile of separated workers (as has been assessed for SOEs in the Privatization Portfolio) will be needed to assess the likely impact.
66 Government Memorandum of Economic and Financial Policies, IMF SBA program document, 2015.

99
IV. DISTRIBUTIONAL IMPACT OF FISCAL CONSOLIDATION IN SERBIA
C. Pension Reforms
9.10. The impact on poverty of the cuts in nominal pensions is mitigated by their progressivity. The 2014 Law on Temporary Reduction of Pensions as of November 2014 reduced pensions above RSD 25,000 per month by 22 percent and those above RSD 40,000 by 25 percent. These thresholds compare with a poverty line for single individuals of RSD 13,408, although individual pensions may be supporting the incomes of multiple household members. Using pension administrative data, it is possible to examine the distributional implications of the cuts on individual pensions. The implications of the parametric reforms to pensions that the government also introduced in 2014 (extending the statutory retirement age for women, increasing the minimum retirement age, and introducing actuarial penalties for early retirement) are less clear-cut. They may prompt individuals to work longer rather than retire but the impact on incomes will dependent on whether a pension is the sole source of income upon retirement or whether alternative employment is also sought.
9.11. Based on data on the beneficiaries of oldage pensions, about 43 percent had 2013 pensions below the lower threshold for cuts. From the average pension and the number of beneficiaries by age, it is possible to construct the distribution of old-age pension beneficiaries, who accounted for about 60 percent of those who received pensions in 2013 (Table 9.3). About 37 percent had pensions subject to the 22 percent cut and 19 percent were subject to the 25 percent cut. About 20 percent of those who had pensions whose monthly income was above RSD 25, per month would see it fall to below that level after the cut. Within the aggregate picture (Figures 9.1 and 9.2), there are substantial differences across pension types and gender. Army pensioners are significantly more likely, and self-employed pensioners significantly less, to be subject to the higher cuts. Almost all female old-age pensioners in 2013 had pensions below the RSD 25,000 threshold. Younger pensioners are more likely to have higher pensions, but also more likely to be able to find alternative sources of income.
Table 9.3: Old Age Pension Beneficiaries by Type and Pension Level, 2013
Employees ArmySelf-
Employed Total
Pension below RSD 25,000No. (000)
% total beneficiaries350.7 0.0 17.2 367.9
44.5% 0.1% 45.0% 43.4%
Pension above RSD 25,000 but below RSD 40,000No. (000)
% total beneficiaries293.3 4.6 18.6 316.5
37.3% 20.6% 48.9% 37.3%
Pension above RSD 40,000No. (000)
% total beneficiaries143.2 17.7 2.3 163.2
18.2% 79.3% 6.1% 19.3%
Memo: Number with pre-cut pension above RSD 25,000 lower threshold but post-cut pension below that
No. (000)% total beneficiaries
168.8 0.1 15.2 184.0
21.4% 0.4% 39.8% 21.7%
Number with pre-cut benefits above RSD 40,000 cut-off who would have higher benefit if pension were reduced to RSD 40,000 and taxed at a lower rate
No. (000) % total beneficiaries
14.8 1.2 0.3 16.3
1.9% 5.3% 0.9% 1.9%
Source: Pension administration database 2013. World Bank staff calculations.
9.12. To address the concern over the impact of earlier pension freezes, a qualitative study was conducted with focus group discussions and indepth interviews. This was motivated by findings, using simulations based on the 2009 Household Budget Survey, that prolonging the freeze through 2010 may have added 0.6 percentage points to the poverty incidence between 2009 and 2011, with more marked impacts in rural areas (note that this estimate is based on the previous HBS approach rather than the SILC).67 The qualitative research and its findings are of relevance for the recent cuts and the freeze in indexation of pensions.
9.13. Qualitative analysis illustrated the limited coping strategies of the poor and low to middle segment of pensions. The main coping strategies reported were reduced consumption (the predominant mechanism) and additional employment or support from family members (with agricultural pensioners using their own resources more). Given that consumption had been reduced over recent years, it was reported that there was limited space for further reductions. In terms of government SA
67 See World Bank Public Expenditure DPL in 2011. The qualitative research (IPSOS Strategic Marketing, Qualitative Assessment of the impact on pensioners of a freeze in pensions in Serbia 2010) was commissioned as background for the DPL.

100
IV. DISTRIBUTIONAL IMPACT OF FISCAL CONSOLIDATION IN SERBIA
Figure 9.1: Average Oldage Pensions by Benefit Level and Gender(Percent)
Figure 9.2: Average Oldage Pensions by Age and Gender (RSD 000 per month)
Source: Pension administration database 2013. World Bank staff calculations
Source: Pension administration database 2013. World Bank staff calculations.
programs, the perception was that they did not work well, with the most vulnerable pensioners having access to a very limited number of assistance programs, allowances, or benefits (for example, rural pensioners are affected by the criterion that owning 0.5 ha of land could preclude access to SA). From the perspective of providers of
services to pensioners, the most vulnerable groups were judged to be those with the lowest incomes (minimal income and agricultural pensioners), those pensioners with severe health problems, pensioners in rural areas and single households and two-member households living on a single pension.
0%
Men (post tax) Men
10%
20%
30%
40%
50%
60%
70%
10 20 30 40 50
80%
90%
100%
0%
10%
20%
30%
40%
50%
60%
70%
10 20 30 40 50
80%
90%
100%
Women (post tax) Women
60
50
60 70 80 90 10050
40
30
20
10
0
Men Women
Age

101
IV. DISTRIBUTIONAL IMPACT OF FISCAL CONSOLIDATION IN SERBIA
D. Reduced State Support to Public Enterprises
9.14. As discussed in Chapter 5, the government’s program of reform for state support to public enterprises incorporates both reductions in direct and indirect support and corporate and financial restructuring of major SOEs. The associated layoffs are a direct channel of impact on household welfare but can be mitigated by support to transition to new employment or through SA programs. The longer-term potential benefits of more efficient and higher-quality service delivery, the impact on fiscal savings and job creation and growth of the private sector are much harder to quantify.
9.15. Recent poverty and social impact analysis of the restructuring of companies in the Privatization Agency (PA) portfolio underscores the potentially significant direct welfare implications of job losses and the need to build up mitigation mechanisms (World Bank, 2015b). In the short run, the reforms will result in job losses. The authorities estimate that for the 140 PA companies being restructured as of August 2014 up to 30,000 jobs (of a total of 55,000) could be lost. Progressive divestiture of the remaining companies in the PA portfolio (374 companies with about 35,000 jobs) is not expected to result in massive job losses, because those companies already operate on a commercial basis without significant state support. Based on a multidisciplinary approach using quantitative and qualitative data, given the profile of workers currently in the PA portfolio, the impact of job losses on households is likely to be significant and there is a need for to build up the mitigation mechanisms used in the past.
9.16. Reemployment of workers in companies in the PA portfolio is likely to be difficult. Workers dismissed as part of previous privatizations have had great difficulties in finding new jobs, particularly workers with similar profiles to those in the PA portfolio: older, low-skilled, and living in areas that were greatly dependent on SOEs for employment . In a few areas, the share of employment in firms within the PA portfolio reaches 40 percent; levels of 15 percent are not uncommon. And dismissed workers who do find employment are most likely to do so in the informal sector as occasional laborers doing seasonal work. The lower quality of such jobs can add to the nonmonetary pressures on individuals. The analysis also found that gender differences that were identified in terms of the impact of redundancy or overall vulnerability mostly relate to cultural norms and traditional expectations that men would be the bread winners.
9.17. The ability of laidoff workers to cope by accessing savings or alternative incomes may be limited. The wage premia of PA workers is smaller than for the SOE sector as a
whole and only about 12 percent of PA workers report that they are able to save from their incomes (although this is higher than for the private sector). Their earning potential is also lower than that of workers in other SOEs or the private sector, although one in five has access to land that could be used for agricultural purposes. Compensation mechanisms under previous privatizations were mainly financial, from the Transition Fund, to limit the impact of temporary unemployment. Active labor market policies were not found to have been very effective in helping people to find jobs but the National Employment Service did guarantee access to health insurance. Other support measures, such as social assistance, were too small and had too-tight eligibility thresholds to benefit a significant proportion of the households that would be affected by privatization. Generally focus group discussions also found a fair amount of uncertainty or lack of information about the process of redundancy and workers’ rights.
9.18. For workers made redundant by the resolution of the PA portfolio, the authorities are committed to provide redundancy packages. In addition, a targeted expansion of NES services might help make them more relevant to the needs of workers in the SOE portfolio, particularly younger ones. Other prospective programs of support are direct provision of employment opportunities in public works programs and reduction of disincentives to employment creation.
9.19. Broadening the outlook to nonPA SOE workers who may face redundancy from restructuring, they too are likely to need support to manage the transition to new employment opportunities or retirement. As noted, the share of public sector workers among the poor is relatively low and the distribution of non-PA SOE wages is skewed to higher levels relative to the distribution of private formal and also PA SOE workers (Table 9.4). Non-wage benefits of about 27,000 RSD annually for non-PA SOE workers are about 15 percent higher than the levels for PA SOE workers and private formal workers.68 The education profile of PA and non-PA SOE workers also differs; the latter have more tertiary education, the rates of which in PA SOEs trail those of the private formal sector.
68 Interestingly, the benefits of public sector employment are such that almost 60 percent of individuals, when asked if which sector they would like to move to if they had another job, stated the public sector.

102
IV. DISTRIBUTIONAL IMPACT OF FISCAL CONSOLIDATION IN SERBIA
Table 9.4: Worker Characteristics and Wages, SOEs and the Private Sector (Percent)
Privatization Agency SOE SOE non-Privatization Agency Private formal Private informal
By educational attainment:
Less than secondary 10.6 12.2 10.9 24.6Lower secondary 35.6 19.1 29.2 35.4Upper secondary 36.7 40.8 40.5 35.4Tertiary 17.1 27.9 19.5 4.6
By wages (RSD/month):
Under 25,000 36.2 23.8 52.5 76.425,000 to 45,000 37.2 57.2 39.1 20.6Over 45,000 26.6 19.0 8.7 3.0
Source: World Bank, 2014, Addressing the poverty, gender and social impacts of privatization in Serbia, mimeo, based on LFS data.
E. Electricity Tariff Adjustment
9.20. Although not discussed in detail earlier in this report, a proposed increase in electricity costs due to a rise in excise duties and tariffs as part of the financial restructuring of EPS could have sizable distributional implications. Electricity is a vital energy source for households in Serbia and important component of their budgets. The analysis in this section draws on the findings from the 2013 HBS and is in the process of being updated.
9.21. Nationally electricity accounts for 72 percent of total household energy expenditures based on 2013
household budget survey data.69 It is also an important budget item: in 2013 households spent almost 7 percent of their budgets (close to 9 percent for households in the bottom quintile) on electricity alone (Table 9.5). About 18 percent of the households (36 percent in the bottom quintile) spend more than 10 percent of their budgets on electricity—a threshold that often seems to signal affordability concerns. Not surprisingly, households that rely on electricity as their main heating source have to spend more share of the household budget on electricity (9.2 percent); households that used district heating or gas spent, on average, less than 6 percent of their budget on electricity.
69 This section is based on World Bank (2012) “Electricity reforms and energy affordability in Serbia”, mimeo, which uses the 2010 HBS. This analysis is in the process of being updated to examine poverty and social impact of the current proposed changes in electricity tariffs and this section will be updated accordingly. There are some caveats on the use of HBS data: (1) The HBS only
captures energy expenditures, not physical consumption of energy by source (i.e., electricity consumption is calculated from expenditure data and administrative data on the household tariff structure). This implicitly assumes bills are paid in full. (2) Data on metering (whether single or double tariff) or electricity arrears are not available in the survey.
Table 9.5: Electricity and Energy Budget Shares by Quintile and Heating Group, 2013 (Percent)
Main Heating Source:
DistrictHeating
ElectricHeating Firewood Combined
Heating Gas Overall
Quintile Share of electricity in the household budget
1 6.9 10.3 8.8 9.9 9.8 8.92 6.5 11.6 8.0 9.5 7.7 8.23 6.0 10.0 6.7 7.9 6.2 6.94 5.6 9.4 5.9 6.6 5.4 6.25 3.7 6.4 4.6 4.5 4.3 4.5Overall 5.1 9.2 7.1 7.4 5.5 6.8
Total energy expenditures share in household budget1 17.5 10.6 10.1 12.2 17.4 10.72 16.7 11.7 10.4 14.4 14.3 11.73 17.2 10.1 11.6 12.4 13.1 12.74 15.7 9.6 12.5 11.9 13.2 13.15 11.4 6.6 12.8 9.9 11.8 11.3Overall 14.5 9.4 11.3 12.0 12.9 11.9

103
IV. DISTRIBUTIONAL IMPACT OF FISCAL CONSOLIDATION IN SERBIA
9.22. The highest budget share of electricity spending is reported by single elderly households (9 percent) followed by households below the national poverty line (9.0 percent). The shares of total energy expenditures tend to be lower than or close to the average for most groups, except single elderly households, for whom energy accounted for a larger share of the household budget (15 percent).
9.23. The estimated electricity tariff price increases of 12 percent in 2015 including both excise tax and tariff increases, will need to be accompanied by adequate protection of the poor and vulnerable. Indeed the new Energy Law 2014 stated that the vulnerable population needs to be protected. The nature of the tariff adjustment (application by tariff categories and levels of consumption) and its timing, along with any temporary compensation measures, will be a key determinant of their impact on poverty and vulnerability. Good targeting is crucial when working within a tight, and declining, fiscal envelope, and particularly when the objective is to alleviate the impact of price increases at the bottom of the welfare distribution. In addition, as highlighted in Chapter 8, any future protection should be channeled through current SA programs to eliminate fragmentation and make the transfers more effective. Simulations based on HBS 2013 data suggested that a 12 percent increase in household electricity prices would increase poverty by 0.3 percentage points.
9.24. The 2010 paper also spelled out the findings of focus group discussions on energy affordability with members of vulnerable groups, defined as members of poor households (with incomes of less than RSD 8,000 per household member)70. The high cost of electricity and unpaid electricity bills represent a considerable problem for vulnerable households. The discussions also confirm the importance of firewood in making warmth affordable, although it is less of an option in urban areas where buildings are not fitted with chimneys. Focus groups also confirmed that winter is a very stressful, particularly for poor people, with energy bills often representing 80 percent of what they might get from the main SA program. Some mechanisms for coping with energy payments are bad for the energy sector (theft, non-payment) or for households (growing debt, cutting consumption, being cold).
70 Results are based on a total of 12 Focus Groups, equally divided between recipients of the MOP and poor non-MOP recipients. Focus groups were also equally divided between Belgrade, Novi Sad and Nis (4 each), and between rural and urban areas.


105
REFERENCES
European Commission. 2013a. “Developing Personal and Household Services” European Commission. 2013b. Taxation trends in the European Union, 2013 edition, Luxembourg, 2013.
Gertler, P. et al. 2010. “Labor Market Returns to Early Childhood Stimulation: A 20-year Follow up to an Experimental Intervention in Jamaica.” California, University of California Berkeley
Government of the Republic of Serbia. 2014. “Employment and Social Reform Programme in the EU Enlargement Process. Belgrade: Government of Serbia Government of the Republic of Serbia. 2014. Second National Report on Social Inclusion and Poverty Reduction in the Republic of Serbia. Belgrade: Government of Serbia.
Hanushek, E. 1986. “The Economics of Schooling: Production and Efficiency in Public Schools.” in Journal of Economic Literature 26: 1141–77.Hanushek, E. and L. Woessmann. 2007. “The Role of Education Quality in Economic Growth.” World Bank Policy Research Working Paper 4122. Washington, DC: World Bank.
IMF. 2015. Republic of Serbia: 2014 Article IV Consultation and Request for Stand-by Arrangement—staff report. IMF Country Report No. 15/50. IMF, Washington, DC.IMF. 2013. Republic of Serbia: 2013 Article IV Consultation. IMF Country Report No. 13/206. IMF, Washington, DC.IMF. 2013. Republic of Serbia: Selected Issues Paper. IMF Country Report No. 13/207. IMF, Washington, DC.
Khwaja, Munawer, and Indira Iyer. 2013. Revenue Potential, Tax Space, and Tax Gap. World Bank
Matkovic, G. 2010. “Poverty in Serbia during the Transition—Trends, Policies, Dilemmas.” Paper presented at the World Bank International Conference on Poverty and Social Inclusion in the Western Balkans, Brussels, December 14–15.
OECD. 2014a. Education at a Glance.OECD. 2014b. PISA 2012 Results: What Students Know and Can Do. Volume 1. Paris: OECDOECD. 2013. PISA 2012 Assessment and Analytical Framework. Mathematics, Reading, Science, Problem-solving and Financial Literacy. Paris: OECD Publishing.OECD. 2010 Forum on Tax Administration in “Guidance and Specifications for Tax Compliance of Business and Accounting Software”
Olefir, A. 2013. Piloting Per-student Formula Financing in Moldova. Washington, DC: World Bank.
Schwarz, A.M., Arias, O.S. et al. The Inverting Pyramid: Pension Systems Facing Demographic Challenges in Europe and Central Asia. Washington, DC: World Bank.
Statistical Office of the Republic of Serbia. 2014. Education and Employment Indicators.
UNESCO. 2014. UNESCO Institute for Statistics.
UNICEF. 2015. Serbia Multiple Indicator Cluster Survey (MICS), 2014. UNICEF. 2002. Optimization of the Network of Schools in Serbia.
USAID. March 2013. The Shadow Economy in Serbia: New Findings and Recommendations for Reform.
World Bank. 2015a. Serbia Systematic Country Diagnostic. Washington DC.World Bank. 2015b. Serbia - First Programmatic State Owned Enterprises Reform Development Policy Loan Program Project. Washington DC. World Bank. 2014. Great Teachers: How to Raise Student Learning in Latin America and the Caribbean. Washington DC. World Bank. 2014. “Addressing the poverty, gender and social impacts of privatization in Serbia”, mimeo.World Bank. 2013a. Getting Better: Improving Health System Outcomes in Europe and Central Asia. Washington DC.
106
World Bank. 2013b. Serbia - Municipal Finance and Expenditure Review. Public Expenditure Review (PER). Washington DC. World Bank. 2012a. School Spending and Student Performance: BOOST Analysis of Resource Allocation in Serbian Primary Education. Washington DC.World Bank. 2012b. Serbia School Finance. SABER Country Report. Washington DC.World Bank. 2012c. “Implementing Activation and Graduation Measures for Social Assistance Beneficiaries in Selected Western Balkan Countries: A Review of National Experiences (SERBIA).” Background paper for Serbia country note prepared by Marina Petrovic. Washington DC.World Bank. 2012d. “Electricity reforms and energy affordability in Serbia”, mimeo.World Bank. 2011a. “Social Safety Nets in the Western Balkans: Design, Implementation, and Performance.” Report 54396-ECA, Washington DC.World Bank. 2011b. Serbia – Second Public Expenditure Development Policy Loan Project. Washington DC. World Bank. 2009a. Serbia - Programmatic Public Expenditure Development Policy Loan Program. Washington DC. World Bank. 2009b. Serbia - Baseline Survey on Cost and Efficiency in Primary Health Care Centers before Provider Payment Reforms. Washington DC.

107
Annex 1: StrAtegieS to CombAt the ShAdow eConomy
ANNEX 1: STRATEGIES TO COMBAT THE SHADOW ECONOMY: EXAMPLES FROM AROUND THE WORLD
Serbia’s shadow economy was estimated at 30.1 percent of GDP in 2010, according to the U.S. Agency for International Development (USAID) and the Foundation for the Advancement of Economics (FREN). Among the causes of the shadow economy are the relatively high fiscal burden on labor; complicated and costly tax procedures; a complicated and opaque tax system; and a poorly organized, understaffed, and underequipped tax administration. Other relevant factors are the poor quality of public services, which undermines taxpayer morale, and a culture of relatively high tolerance for the shadow economy. There may also be other institutional and economic factors that help to explain the breadth of the shadow economy. In some economies it has been observed that, owing to low productivity, many enterprises can only make a profit if they evade paying taxes. That may also be true in Serbia. The economic crisis may have exacerbated this situation and forced even more productive businesses to shift some of their operations into the informal sector.
Other features of the economy that have a significant bearing on the extent of the shadow economy are a high administrative burden on doing business; the low quality of the regulatory environment; and insecurity about the law. For example, according to the Doing Business 2015 report, on the Paying Taxes indicator, Serbia ranks as low as 165th out of 189 economies. As for regulatory quality, on the World Governance Indicators, Serbia scored –0.7 in 2013: the range is normally –2.5 (weak) to 2.5 (strong). The decision to operate informally is also affected by widespread corruption (on which Transparency International ranked Serbia 86 in 2011) and low tax morale.
This note focuses on strategies a tax regime might adopt to combat the shadow economy. These can broadly be grouped into two categories: (1) Measures to more effectively prevent, and (2) steps to curb cash transactions and incentivize cashless ones. Other ways to tackle the shadow economy, such as the development of a modern financial infrastructure with “plastic money” and e-payments, and strategies to change the compliance culture in a country, are not discussed here.
Preventing Tax Evasion More Effectively
One consequence of a large shadow economy is that is an incentive to underreport sales and economic activities. As
technology has changed the way cash sales are recorded, it has also thoroughly changed the techniques used to suppress sales.
“Skimming” has always existed in one form or another in order to, inter alia, evade taxes. Manual skimming could be achieved quite simply acts, by, e.g., failing to ring up cash sales in the cash register with the owner keeping the cash; or tampering with an electronic cash register to divert sales to a second cash register was kept off the books. This is most common in SMEs because they usually have fewer internal controls and are often closely-held businesses. The STS Report found a high incidence of sales made in cash in Serbia, which offers opportunities for skimming. In some cases, a business involved in skimming may keep separate sets of books and records, one for the tax authorities and the other for the owners, who may want to show the real sales to a potential buyer of the business. For example, skimming by closing the cash registers at a certain point in the evening resulted in large-scale fraud by an Australian restaurant: amended assessments issued to on the business owners amounted to $A8.4 million in tax and penalties (USAID 2013).
As technology automated sales records it also automated skimming. The first-generation suppression technology, which appeared shortly after the turn of the millennium, was Phantom-ware. Phantom-ware is a “hidden,” pre-installed programming option embedded within the operating system of a modern electronic cash register (ECR). It can be used to create virtually a second till and may preserve a digital (off-line) record of the skimming (a second set of digital books). Physical diversion of funds into a second drawer is no longer required, and the need for manual recordkeeping of the skim is eliminated. 71
The second generation is called Zappers. Zappers, which are more advanced technology than Phantom-ware, are special programming options added to ECRs or point of sale (POS) networks. They can be are carried on memory sticks or removable CDs or accessed through an Internet link. The programs are created by external software manufacturers, not till manufacturers (Ainsworth).
71 Ainsworth, p.1. Phantom-ware may exist on many systems for completely legitimate reasons, such as enabling the buyer of a second-hand ECR to clear the system before starting to use it. It is hidden because it would be undesirable to authorize random use by employees. Often it relies on manual reprogramming, in which case it is called self-help phantom-ware. Often assistance by suppliers is needed to bring up the hidden phantom-ware functions. The fact that reprogramming is not recorded makes it difficult to detect.

108
Annex 1: StrAtegieS to CombAt the ShAdow eConomy
Because Zappers are not integrated into operating systems, their use is difficult to detect. Zappers liberate owners from the need to personally operate the cash register. Remote skimming of cash transactions is now possible without the cashier who physically rings up the sale knowing. This attribute of Zappers allows skimming fraud to migrate beyond the traditional mom and pop stores. Zappers allow owners to place employees at the cash register, check their performance (monitor employee theft), but then remotely skim sales to cheat the taxman (Ainsworth: p. 1).
Awareness of the significant risks of sales suppression has led to a wide range of responses by tax authorities that can be effective in tackling the challenges and risks of electronic sales suppression. Those can be categorized as compliance oriented, audit, and fiscal till approaches. Of course in reality most government responses in fact consist of a broad mix of measures often combine two or even all three of these categories. Whatever the dominant line of response a country chooses, the measures taken need to be part of a strategic approach that includes:
• Risk assessment: risks can be identified by specialaudits targeted to specific industries. Extending the sample audits could help identify which retail and service sectors are most at risk. In many countries the focus is on restaurants but high risks have also been identified for small supermarket chains, retail pharmacies, hairdressers, and other service providers (OECD 2013, p. 23).•AnunderstandingofthePOSmarketandPOSsuppliers,both domestically and internationally owned, and their relative shares of the market (OECD 2013, p. 24).• Clear and consistent legislation that reflects thestrategic intent to combat electronic sales suppression, including laws criminalizing the supply, possession, or use of electronic sales suppression software (OECD 2013).
The ComplianceOriented Approach
The Forum on Tax Administration's report Monitoring Taxpayer’s Compliance (OECD 2013, p. 24) states that compliance by taxpayers can be viewed in terms of whether compliance is achieved voluntarily or is corrected by tax administration verification and enforcement actions.
Enforcing compliance via frequent checks, substantive audits, and prosecutions is an expensive way to ensure adequate compliance, so most tax administrations attempt to maximize voluntary compliance, encouraging taxpayers to cooperate and actively comply with the tax laws. This reduces the cost of administering the tax system but only practicable only when system requirements are well understood, relatively easy to comply with, and
generally accepted by businesses. Voluntary compliance works best where tax requirements are integrated with standard business record and accounting systems. When such systems are reliable, compliance costs for both businesses and tax administrations are likely to be minimized.72
The OECD Forum on Tax Administration in “Guidance and Specifications for Tax Compliance of Business and Accounting Software” provides recommendations for both tax administrators and software developers that apply to all accounting and business software and therefore include cash registers and POS systems (OECD 2010, p. 5).
The Guidance Note sets out seven principles (OECD 2010, p. 10) for computerized business and accounting systems. Based on those principles an innovative approach to voluntary compliance in this domain could be certification of the quality of POS systems. Specific standards for POS systems should apply internationally. This could have far-reaching benefits, substantially reducing the market for electronic sales suppression; providing tax administrators, software developers, and users with certainty about the compliance quality of POS systems; and reducing compliance costs for all (OECD 2013, p. 25).
Raising awareness of the devastating effects of sales suppression, both for tax revenues and for keeping the playing field level for private businesses, can also be part of the voluntary compliance approach.
The Audit Approach
The audit approach comprises a variety of methods, ranging from the individual audit of a retail taxpayer through specialized e-audits to criminal investigations of taxpayers and suppliers of sales suppression software. The basis for successful audits or investigations, however, is intelligence-gathering. Intelligence can originate both from public sources, such as ECR or POS manuals purchased from a bookstore, and from internal information gathered by tax officers during audits or investigations, such as a supplier’s client database. Tax laws must provide a legal basis for information-gathering.
In individual audits, traditional best audit practices such as calculation of private consumption, the search for negative cash holdings, gross profit analysis, volume control, and operating cash flow/ net sales ratios can prove useful to determine whether a business is likely to be engaging in electronic sales suppression. Auditors can
72 Tax Guidance Series-Record Keeping: www.oecd.org/dataoecd/29/25/31663144.pdf

109
Annex 1: StrAtegieS to CombAt the ShAdow eConomy
be taught how to obtain information from ECRs and POS systems to reveal suppressed transactions.
Many revenue authorities have trained specialized e-auditors in the use of computer-assisted audit tools and techniques (CAATTs) to import large datasets and carry out a wide range of analysis, and the use of specialized audit software such as IDEA, ACL, or SESAM (OECD 2013, p. 18).
After hardware and software are seized in a criminal investigation, testing and analysis in a computer forensic laboratory to search systems and tools that have been secured. While the prime focus for seizure of data will be the POS system, there are other sources for digital business information that may be relevant, such as computers with back office systems and external storage media that could be related to the use of zappers and phantom-ware. As long as seizure and review of such sources is legal, the challenge is to access the information so that it can be copied (OECD 2013, p. 20). If the digital analysis is aimed at detecting the existence of electronic sales suppression software, analysis will largely focus on program files and entries in the operating system. The analysis procedure varies and can often require a range of expertise. One approach used often good results is to obtain application software from the secured materials and review them. This can be done by running the program on another physical computer or on a virtual machine.
Finally, a full criminal investigation is a possibility, using traditional criminal investigative techniques and even undercover operations jointly with other law enforcement agencies to target POS manufacturers. When sufficient evidence has been obtained to indicate guilt beyond a reasonable doubt, the evidence is referred to a prosecutor for tax and any other criminal charges that may arise. The goal of criminal prosecution, in addition to punishing the offender, is to deter others from committing similar offenses and enhance compliance by communicating the message that tax evasion will be prosecuted and publicized.
The Fiscal Till Approach
A growing number of countries have chosen to make the use of fiscal tills mandatory: cash registers that are required to conform to a set of specified technical requirements (OECD 2013, p. 37), such as:
•electronicpreservationofdetaileddataontransactionsin specified formats, encrypted in specified ways, and stored on specified devices; • detailed records that are only available when the tax
auditor requires them;
•preservationofacompleteaudittrailandinsomecasesevent monitoring; • equipping the system with a monitoring apparatus of
some type; and • other technicalmeasures to guard against subsequent
alterations in a way that will ensure that data integrity is maintained (OECD 2013).
In early versions fiscal tills secured the sales data at the end of a day’s operations; today, data are generally secured at the time they are created.
The working method is as follows: At the end of every working day, the entrepreneur generates a daily financial report. All sales reflected in that report are written to a protected memory, where the counts are updated with the sales totals of that day. In some countries, the counts were expanded to include ticket counts, refund totals, and other items.
Originally, the ROM was sealed and secured in the machine itself by fixing it to the chassis with resin or epoxy. When cash registers became more and more sophisticated and systems became more and more PC-based, the protected memory could be placed instead in the separate printer (then called a fiscal printer).
A receipt issued states specifically whether it is a genuine fiscal receipt, representing a recorded sale, or is produced for training, as a pro forma invoice or a copy ticket. Fiscal receipts also have a stamp in the footer containing a logo that must meet specific requirements regarding font and lay-out (OECD 2013).
More recently, a growing number of countries, including Sweden, Turkey, the Netherlands, Greece, and many other EU members, are seeking to improve taxpayer compliance by mandating the use of certified cash register systems for all cash-related business or for all business in specified economic activities (e.g., restaurants). The aim is to stop abuse and protect honest business owners from unfair competition. This approach is characterized by the use of equipment that adds a digital signature to some or all of the data items on a receipt using encryption technology. This may include a monitoring device for storing receipt and signature data and updating grand totals in secure memory. Technical solutions of this kind not only add digital signatures, they also keep track of the tax-relevant data on receipts (OECD 2013).
A Sectoral Approach
A further refinement is for a tax administration to conduct its own analysis of informal sector tax risks in addition to general analysis of the contribution

110
Annex 1: StrAtegieS to CombAt the ShAdow eConomy
of specific business segments to informal activities generally. Tax-specific sector analysis is intended to identify economic sectors that combine a high incidence of shadow economy activities with above-average revenue potential. To be of practical relevance for compliance management, analysis needs to go one step further than the general plan for counteracting the shadow economy and identify precise subsegments of economic activities that require priority attention and specific strategies to improve compliance. Advanced
Source: OECD.
Table A1.1. Sectors where Tax Evasion is Prominent
Australia Belgium Canada Sweden USA
Construction Construction Construction Construction Car sales
Transport Gambling Hospitality sector Restaurants Construction
Restaurants Transport Agriculture Hairdressers Health care
Hairdressing and beauty salons Car sales Real estate agents Taxi companies Medical professions
Cleaning services Diamond industry Taxis Trade in used metals Restaurants
Clothing and textiles Dentists Hairdressing E commerce Real estate agents
Motor vehicle retailers E-commerce Labor providers
Art and antique dealing Heating oil distributors
tax administrations therefore have created sectoral risk maps of compliance in specific business segments. A common feature in such risk maps is the prominence of construction and transport (in particular taxi companies) as areas of widespread tax evasion.
It is therefore highly recommended that the Serbian tax administration draw up its own compliance risk map to identify priority areas for risk management.
Table A1.2: Denmark: Mapping of Compliance in Business Segments
Segment Noncompliant Businesses,Percent
Manufacturing 8
Construction 17
Wholesale and retail trade 14
Transportation 16
Hotels and restaurants 23
Consultancy 12
Finance and insurance 4
Examples from a tax gap and compliance analysis for Denmark shows the importance of properly prioritizing and focusing initiatives to reduce sector-specific informal activities. Continuous gap analysis also makes it possible to monitoring shadow economy trends in various industry
segments and the impact of compliance management activities.
An A.T. Kearney study of the shadow economy in Europe found that heavily regulated industries and those that require regular contracts with customers had the lowest levels of informality (Figures A1.1 and A1.2). Across Europe, the study found that informality is highest in construction, manufacturing, and wholesale and retail trade.Major improvements in reducing tax evasion can be
73 Hyung Chul Lee, Senior Public Sector Specialist; Congyan Tan, Economist; Mariela Sanchez, Consultant; and Dzmitry Yarashevich, Voice Secondee are major contributors to this section.
expected from more in-depth sectoral analysis and development of business-specific compliance improvement measures.
Curbing Cash Transactions73
The principal reason that shadow activities emerge all over the world is cash or payment for goods and services with cash, since cash makes it easier to conceal real incomes and almost impossible to trace such monetary transactions, thereby ensuring that this type of activity is concealed from tax and law enforcement as well as state statistics agencies; the consequences are concealment of real incomes and tax evasion. By tracking cash transactions and stimulating the use of cashless operations, the size of the informal economy would presumably shrink, and tax collection would rise. The experience of countries in Europe, America, and Asia proves the efficiency of encouraging non-cash payments–electronic banking channels or card payments—as a way to combat the shadow economy.
There are three main strategies that have been adopted:•Taxpoliciesandadministrativeeffortstoboostcashless
payments
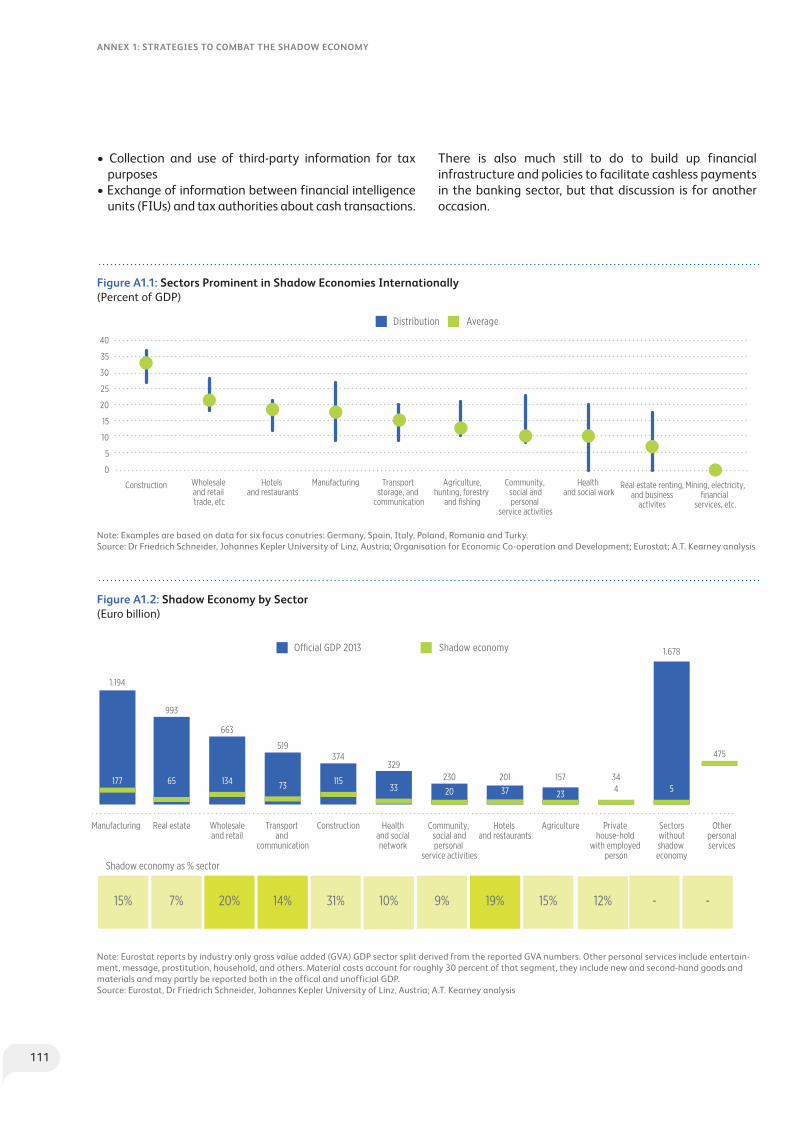
111
Annex 1: StrAtegieS to CombAt the ShAdow eConomy
Note: Examples are based on data for six focus conutries: Germany, Spain, Italy, Poland, Romania and Turky.Source: Dr Friedrich Schneider, Johannes Kepler University of Linz, Austria; Organisation for Economic Co-operation and Development; Eurostat; A.T. Kearney analysis
Note: Eurostat reports by industry only gross value added (GVA) GDP sector split derived from the reported GVA numbers. Other personal services include entertain-ment, message, prostitution, household, and others. Material costs account for roughly 30 percent of that segment, they include new and second-hand goods and materials and may partly be reported both in the offical and unofficial GDP.Source: Eurostat, Dr Friedrich Schneider, Johannes Kepler University of Linz, Austria; A.T. Kearney analysis
Figure A1.1: Sectors Prominent in Shadow Economies Internationally (Percent of GDP)
Figure A1.2: Shadow Economy by Sector(Euro billion)
35
40
30
25
20
15
10
5
0
Construction Wholesale and retail trade, etc
Hotels and restaurants
Manufacturing Transport storage, and
communication
Agriculture,hunting, forestry
and fishing
Community, social andpersonal
service activities
Health and social work
Real estate renting,and business
activites
Mining, electricity,financial
services, etc.
Distribution Average
O�cial GDP 2013 Shadow economy
ConstructionWholesaleand retail
Hotels and restaurants
Transport and
communication
Manufacturing
Shadow economy as % sector
AgricultureCommunity, social andpersonal
service activities
Health and social network
Real estate Private house-hold
with employed person
Sectorswithoutshadow economy
Otherpersonalservices
1.194
993
663
519374
329230 201 157 34
1.678
177 65 134 73 11533 20 37 23 4 5
475
15% 7% 20% 14% 31% 10% 9% 19% 15% 12% - -
• Collection and use of third-party information for taxpurposes•Exchangeofinformationbetweenfinancialintelligence
units (FIUs) and tax authorities about cash transactions.
There is also much still to do to build up financial infrastructure and policies to facilitate cashless payments in the banking sector, but that discussion is for another occasion.

112
Annex 1: StrAtegieS to CombAt the ShAdow eConomy
Tax Policies and Administrative Efforts to Boost Cashless Payments
A number of countries have provisions in their tax laws and financial sector regulations that give businesses disincentives for cash transactions and encourage individuals and businesses to conduct their financial dealings through banking channels. Individuals in particular need incentives that encourage cashless transactions. Cash transactions between business and individual consumers are a risk area. If individuals pay for the goods and services they consume, businesses have an opportunity to not report or to underreport the sales. However, consumers have no incentive to seek invoices or receipts, because they do not normally claim a tax credit for VAT or report it as an expense for their income tax. If businesses offer their customers a lower price if they pay in cash than competitors do, customers are very likely to accept the discount. Cases like this are very difficult for the authorities to detect, since there is no cross-checking and no conflicts of interest between sellers and buyers. Incentive programs must therefore be designed to encourage consumers to engage in cashless transactions. Here are some ideas from other countries that Serbia might use.
China: In 2007 China’s Ministry of Finance launched the public official card program and by 2011 its use was enforced. Officials in China’s central government must use a bank card to pay for 16 types of expense, from travel and meals to printing and conference registration fees. Initially adopted as an anti-corruption measure, it has also facilitated use of cashless transactions by public officials and encouraged business partners to adopt enabling infrastructures. Since 1999 local tax administrations in China have also held invoice lotteries with rewards for reporting tax-evasive activities. Recently, however, Beijing and some other local governments no longer do so due to the increasing prevalence of invoice usage and non-cash transactions.
Colombia: Article 850.1 of Colombia’s Tax Code gives individuals a 2 percent VAT refund on purchases made by debit and credit card or by electronic banking for products and services paid at the general 16 percent rate or 5 percent rate. Since January 1, 2014, Tax Code Article 771.5 had required that, for expenses to be deductible, they must be made through deposits in bank accounts, bank transfers, checks, and credit or debit cards. Al Cash payments will only be deductible if they are within certain ranges; different ranges apply for gambling.
European Union: Apart from facilitating electronic payments, some EU member states have adopted monetary incentives and deterrent measures to encourage formalization of the shadow economy. EU countries
consider undeclared work to be more problematic than undeclared or underreported goods or services (Jensen & Wohlbier, 2012). Several EU countries provide tax incentives to encourage individuals to declare payments for household service, which are otherwise highly likely to remain in the underground economy. They offer tax deductions for the expense of household cleaning, cooking, and laundry; care for children, old people, or disabled people; and maintaining a house maintenance to encourage movement of undeclared work into formal economy and create jobs. The scope of eligible services, the amount of the tax deduction, and other specific tax incentives vary by country; however the intention is to get undeclared services to be declared by subsidizing household service expenses to reduce the cost difference between formal and informal services. Public interventions to narrow the cost difference from direct subsidies to household service providers or users to such revenue expenditures as tax deductions and exemptions, or reduced VAT rates. The European Commission’s report “Developing Personal and Household Services” (2013) gives a detailed overview of tax incentives in the EU Member States.
Hong Kong: Hong Kong is known for the promotion of its public transport card, the Octopus card, which is a smartcard that stores value. Now Octopus is growing beyond the subways and ferry stations where it started to become an accepted form of payment at many retail establishments.
India: India’s Income Tax Act requires third parties, such as banks, companies, and property registries to regularly provide information on the financial transactions of taxpayers (Section 285BA). Since unaccounted money is often used to finance property transactions, this is an important source of information about possible cash transactions that the tax department can investigate. Two years ago another provision was added (Section 194IA) to provide for deduction of tax at source on all property transactions above Rupees 5 million. The purpose of this is to ensure that any hidden cash investment into property is recorded and at least minimum tax is collected.
Mexico: Since the Mexican Central Bank has a mandate to promote use of the most efficient payment instruments, in a number of ways, such as advertising campaigns, it encourages the use of credit transfers instead of checks or cash. Transition rules apply to secure rights and obligations acquired during the effective term of the law, such as the obligation to file tax returns. To allow the Mexican Tax Administration Service (SAT) to receive information on cash deposits, financial institutions must report cash deposits made to the accounts of taxpayers when the monthly amount accumulated in all the accounts a taxpayer holds in a single financial institution in the financial system exceeds Mex$15,000. All acquisitions of

113
Annex 1: StrAtegieS to CombAt the ShAdow eConomy
cashiers’ checks must also be reported. In January 2009, to combat fraud the Mexican Central Bank set a Mex$20,000 ceiling on bearer checks. The 2014 Tax Reform bill allows Mexican tax officials to screen credit-card data. Article 91 of the Mexican Income Tax Law, states that SAT may audit incomes if credit card expenditures do not match the individual’s declared income. Initiatives have also been launched to offer payment services via mobile phones.
The Federal Law on the Prevention and Identification of Operations with Illicit Resources, 2012, Article 32, prohibits use cash or precious metals over specified amounts for certain transactions. Other activities now regulated by the anti-money laundering (AML) rules are construction services, property development, and the sale or purchase of goods on behalf of clients; such services worth about Mex$ $500,000 must be reported. Similarly, the sale of new or used vehicles, boats or aircraft worth about Mex$400,000 must be reported and the use of cash for such sales is capped at about Mex$200,000; if a transaction has a higher price, the difference is to be paid by bank transfer or check.
Peru: Pursuant to Law No. 28194, obligations that are fulfilled through cash payments exceeding Soles74 3,500 or US$1,000 must be made by bank accounts, wire transfers, payment orders, credit cards, non-negotiable checks, or other means of payment provided by Peruvian financial entities. Obligations paid for in cash may not be deducted by the debtor as an expense or be used as a credit for tax purposes.
In their tax laws and financial sector regulations, a number of countries provide disincentives for cash transactions in business and encourage individuals and businesses to conduct their financial transactions through banking channels. Authorities find it hard to detect informal transactions in cash rather than transactions traceable through bank transfers and credit or check card payments. Informal firms—those not registered for tax—often pay or receive cash only for their business and also pay cash to their employees. Formal firms that want to under-report income prefer cash transactions and pay cash to their own informal employees. In either case, firms are evading income tax or VAT completely or partially, and informal employees are not subject to income and social security taxes. Having provisions in tax laws and financial sector regulations that give businesses disincentives for cash transactions and encourage individuals and businesses to conduct their financial transactions through banking channels ensures that the tax authorities can track business transactions to lower the risk of tax evasion. In terms of application of the
74 ‘Nuevo Sol’ is the Peruvian currency.75 These reforms were effective January 1, 2014. The Tax on Cash Deposits Law was approved by Mexican Congress on October 31, 2013 and published in the Official Gazette on December 11, 2013.
recommendations, there are two aspects: one, provisions in laws and regulations, i.e. the legal framework, and, two, required procedures needed to be laid down to ensure implementation. A number of countries have in place disincentives for businesses to use cash:
Colombia: A discount on retail sales tax was introduced to intensify the use of e-payment cards in Colombia.
EU: In 2010, the EU introduced a new rule (Directive 2010/45/EU) on e-invoicing, which liberalized e-invoicing requirements and to encourage e-invoicing adopted the principle of equal treatment of paper and electronic invoices in terms of integrity and authenticity of contents. One major development was that an e-invoice could be issued through any electronic channel and did not need advanced electronic signature or electronic data interchange (EDI), which had previously been required for e-invoicing. On the other hand, Chile, Korea, and Mexico recently adopted mandatory e-invoicing but only allow more structured electronic formats such as XML. Due to the EU’s recent liberalization, the share of e-invoicing among 17 billion invoices received by business and governments in Europe is estimated to have gone up from 8 percent in 2008 to 24 percent in 2014 (Koch-Billentis 2014, p. 32).
India: In India, the Income Tax Act discourages the use of cash for business transactions through Section 40A and Rule 6DD. For instance, Section 40A (3) and (3A) provide that any expense over Rupees 20,000 in a single day will not be deductible as a business expense if payment is not made through bank instruments. Rule-6DD identifies cases and circumstances in which a payment or aggregate payments exceeding Rupees 20,000 may be made to a person in a day through an instrument other than by an account payee check drawn on a bank or a bank draft.
Kazakhstan: The Resolution of the Government of the Republic of Kazakhstan (December 29, 2012 No. 1743) states that individuals who carry on certain types of business are obliged to accept payment cards and therefore to install POS terminals. Based on work performed in 2013, according to the Plan for 2013–15, the People’s Bank of Kazakhstan and Kazkommertsbank have introduced a service to accept payments through payment cards by means of POS-terminals whose cost is affordable to business entities (about 10,000 tenge, equal to about $55). Another five banks are considering doing the same.
Mexico: The 2014 Tax Reform bill package75 will require uniform creation of electronic invoices, and all invoices documenting transactions carried out by or between Mexican enterprise taxpayers must be electronic and made available through the Internet. Only certain small taxpayers are allowed to continue producing paper invoices.
114
Annex 1: StrAtegieS to CombAt the ShAdow eConomy
Furthermore, deduction of expenditures of a company in Mexico must be backed by a digital tax receipt (CFDI) according to article 29 of the Mexican Tax Code, and payments that exceed Mex$2,000 should be made through electronic funds transfer; personal check; credit, debit or service cards; or through an electronic pocketbook. To acquire fuel for sea, air, and land vehicles payment should be made using the methods specified even if the amount is lower Mex$2,000.
Lastly, the state has subsidized purchase and installation of electronic payment terminals in retail shops, which has significantly increased their use.
South Korea: Since the late 1990s a number of measures have been adopted to encourage electronic payments, among them electronic payments in business-to-consumer (B2C) and business-to-business transactions. Individual businesses that use double-entry bookkeeping should transfer and receive funds through a business bank account when they supply and purchase goods and services.
South Korea has also introduced measures to encourage record-traceable payments, such as credit cards, check cards, and electronically traceable cash receipts in B2C transactions. All these measures should give consumers incentives to prefer electronically traceable payments over cash. With these measures, consumers began to ask business sellers to accept credit cards, and it is now believed that by curbing cash translation the measures contributed to a considerable extent to broadening tax base. The basic idea is that the incentive structures motivate consumers to use traceable payment methods, which create a conflict of the interests of buyers and sellers: In this new setting business sellers really have to accept customers’ new payment demands.
The basic incentive is to allow credit card or check card usage as a deduction from the individual’s income when they file an income tax return. When it was introduced in 1999, 10 percent of credit or check card usage in value terms (not exceeding KWN 3 million, about US$2,900) that exceeded 10 percent of total wage income was eligible for income deduction. As a result, between 1998 and 20003 credit card usage soared at an annual growth rate of 57.6 percent in terms of number of transactions and 47.7 percent in terms of total value (Bank of Korea 2013 Since 2004, with mature usage of credit cards the incentives have been curtailed. As of 2013, 15 percent of credit card usage exceeding 25 percent of total wage income is an eligible deduction.
In 2005, electronically-traceable cash receipts were introduced so that consumers can pay cash and ask businesses to issue cash receipts if they do not want to a use credit or check card. Sellers then issue cash receipts through terminals that transfer the transaction information
electronically to the tax authority. Since 2007 it has been mandatory that designated businesses that provide goods and services primarily to consumers, such as lawyers, accountants, or doctors, should issue cash receipts at the consumer’s request. Since 2010, designated businesses have to issue cash receipts where the value exceeds KWN 300,000 (about US$290) even if the consumer does not request it. Businesses that violate the duty of issuing cash receipts are subject to a penalty of 50 percent of the transaction value. The value of cash receipt transactions increased 4.4 times after the receipts were introduced, from KWN 18.6 trillion in 2005 to KWN 82.4 trillion in 2012. The list designated businesses for which issuance of cash receipts is mandatory has continued to expand, and in July 2013 the threshold for mandatory issuance went down from KWN 300,000 to KWN 100,000.
Electronic Tax Invoices (ETI) for Curbing VAT Refund Fraud
It is believed that transactions between businesses are more transparent than those between businesses and consumers. Invoices are critical role for verifying transactions because they have a cross-checking function between business sellers and buyers in invoice-based input tax credit VAT system. However, there are still problems of input tax credit fraud based on fictitious invoices.
Korea introduced the electronic tax invoice (ETI) and the early warning system (EWS) to curb fictitious invoice fraud. The ETI has been recognized as a valid invoice since 1997. However, it only became mandatory in 2011 for all corporate businesses and in 2012 for individual businesses for which turnover exceeded KWN 1 billion (about US$ 990,000). The EWS to tackle possible frauds was established early in 2012 based on the ETI. The basic idea is that the EWS issues warnings of possible fraud even before a tax return is filed if it detects suspicious transactions from the real-time ETI information. The warnings prompt tax officials to check the site and visit taxpayers, and can also trigger tax investigations if needed. Even without investigation, it can warn taxpayers to file a correct tax return. It is reported that in 2012 EWS detected KWN 5.04 trillion in fictitious invoice transactions and charged KWN 374 billion in tax.
Mandatory Payments through a Business Bank Account
Individual businesses that should maintain double-entry bookkeeping according to the South Korean Income Tax Law and providers of professional services, such as lawyers, accountants, and doctors should use a business

115
Annex 1: StrAtegieS to CombAt the ShAdow eConomy
bank Account (BBA), when they supply or purchase goods and services for business purposes; when they pay or receive payments through financial institutions; and when they pay personal expenses or rent. This mandatory initiative took effect on January 1, 2007. Double-entry bookkeeping is mandatory for individual businesses whose annual sales exceed a designated amount, depending on the industry sector they are in. For example, the threshold for individual businesses in agriculture, forestry, fishery, mining, or wholesale or retail businesses is KRW 300 million (about US$ 300,000). Any individual businesses in that category that do not use BBAs are subject to a penalty of 0.2 percent of the noncompliant payment amount.
Taiwan and China: Invoicing is critical for both Taiwan and mainland China for tax compliance purposes, and modern systems are the foundation that supports a rising volume of cashless transactions. Although most invoicing is still paper-based, businesses increasingly use online systems.
Taiwan’s MoF initiated its e-invoice development project in 2004 and in 2010 the promotion of e-invoice applications project was proposed to extend the scope of adoption. The MoF has established an e-invoice platform to provide such services as invoice certification, tax services, data exchange, and statistical analysis.
While the Chinese76 government has not yet rolled out electronic invoicing for combined business and tax purposes, it has acknowledged the benefits of using information technologies for tax control. This led to the creation of the Golden Taxation Project (Figure A1.3) in 1994. This system is being rolled out gradually; where it is in place, its use is mandatory for all VAT-able invoices. The Golden Tax System is an on-line invoice-checking network based on paper invoices. It now links some 4,000 tax authorities at and above the county level. It is viewed as a major success since it has significantly decreased tax fraud. Currently the system is in its third rollout phase.
76 China’s Law on Administration of Taxation of the People’s Republic of China (2001) regulates tax compliance in mainland China. The implantation ordinance of the law No. 362 Decree of State Council of the People’s Republic of China—Regulation of Implementation of Tax Collection and Administration of the People’s Republic of China (2002) also rules tax compliance.
Figure A1.3: Rollout of the Chinese “Golden Tax System”
1st Stage 2nd Stage 3rd StageLaunched two separate running systems which are ”Anti-counterfeiting taxation system” and Cross-check auditing system”
50cities was picked fore test running.
Could deemed as handwork computerization.
The online taxation network covering all of the tax bureau at and above country level.
The network contains 11 sub systems which covering the whole process of VAT taxation. (refer to the next side)
All of the ordinary VAT taxpayers are compulsive to be involved
Estimated 5 years construction and 8billin RMB investment
A overall taxation CTAIS (China Taxation Administration Information System) will be established.
Including 7 sub-systems, 36 modules.
The 7 sub-system are: enagment, taxation, auditing, punishment, execution, relief, monitoring system.
Covering all catageories of a taxes taxation and auditing
To link and share inforamtion with commercial bureau, banks, customs and statistic deprtment.
Aiming to cover VAT taxation and on-line checking system Aiming to covering all categories of taxes
Taiwan now has a lottery mechanism to encourage consumers to get B2C invoices. The Government of Taiwan introduced the Taiwan receipt lottery as early as 1951 as an incentive to raise revenues. As of 2011 prizes ranged from NT 200 to NT 10 million and total prizes amounted to NT 7 billion (US$20 million).
Turkey: As part of an initiative to reduce the number of cash transactions, Turkey established new payment requirements and mechanisms. Payments of amounts over TL 8,000 and any rental payments over TL 500 must be made through the banking system or a postal office. Self-employed doctors, dentists, and veterinarians must use POS devices in their offices. For receipts to be accepted, they must be generated by these devices. To help eliminate the informal economy, enterprises employing more than 10 employees must pay their salaries, including bonuses, through banks.
116
Annex 1: StrAtegieS to CombAt the ShAdow eConomy
Several countries, among them France, Turkey, Greece, Italy, Sweden, Norway, and the Netherlands, have also imposed caps on cash payments, require merchants to issue receipts for each transaction, and have allowed merchants to refuse cash to compel the use of cards. These measures have made fiscal controls easier and have allowed merchants to make major changes to gain efficiency.
Collection of Thirdpart Information for Tax Purposes
Countries across the world provide for third parties such as financial institutions to share information regularly with tax authorities or other financial intelligence units (FIUs). Some have already been covered in previous sections. There follows the experiences of several countries with the collection and sharing of cash transactions data with the competent authorities.
Colombia: The law requires financial institutions to keep records of account holders and financial transactions for five years. Secrecy laws have not been an impediment to bank cooperation with law enforcement officials, since Colombian law makes an exemption to client confidentiality rules when a financial institution suspects money laundering. General negligence laws and criminal fraud provisions ensure that the financial sector complies with its responsibilities while protecting consumer rights. The Financial Superintendent supervises obligated entities. In June 2008, the Financial Superintendent issued a circular effective that October77 that further tightened financial reporting requirements for the financial, insurance, and securities sectors, with strict deadlines for submitting regular transaction reports: financial entities have to report monthly cash transactions over Col$10 million (US$5,000), wire transfers of US$500 equivalent, and transactions of smaller amounts that over a month add up to Col50 million or US$50,000, and wire transfers of US$1,500 equivalent.
Providers of mobile banking services in Colombia must share the following information with the tax authorities to be eligible for the 2 percent VAT refund on purchases made by debit and credit card, as well as electronic banking for products and services paid at the general 16 percent rate or 5 percent rate: the basis for calculating the two VAT points to be refunded, the total amount of VAT generated and paid in the transaction (at the general 16 or 5 percent rate), and the information of the parties to the transaction.
India: Provisions in the Prevention of Money Laundering Act (PMLA) 2002 and in the Financial Intelligence Unit operating rules form the core of the legal framework India has put in place to combat money laundering. The directors of the FIU-INDIA and of enforcement have been given exclusive and concurrent powers to implement the provisions. The regulations require reporting of cash transactions to the tax authorities, which allows them to investigate cases to determine if the cash represents unaccounted income that can be made taxable. The PMLA and rules impose the following obligations:
•Banking companies, financial institutions andintermediaries to verify identity of clients.
•Allreportingentitiesmustreporttothedirector,FIU-INDon all purchases and sales by any person of immovable property valued at Rs 5 million or more that is registered by the reporting entity.
•Allreportingentitiesmustreporttothedirector,FIU-INDon all cross-border wire transfers valued at more than Rs500,000 or its equivalent in foreign currency when either the origin or the destination of the funds is India.
•Every banking company, financial institution, andintermediary, must report to FIU-IND information on all cash transactions where forged or counterfeit currency notes or bank notes have been used as genuine or where any forgery of a valuable security or a document has taken place to facilitate a transaction.
•Every reporting entity (a banking company, financialinstitution, intermediary or a person carrying on a designated business or profession) must maintain records and furnish information78 to FIU-IND relating to:
- All cash transactions valued at more than Rs 1 million (10 lakhs) or the equivalent in foreign currency
- All series of cash transactions integrally connected to each other that have been valued at less than Rs 1 million (10 lakhs) or the equivalent in foreign currency where all transactions in the series took place within a month
- All transactions involving receipts by nonprofit organizations valued at more than more than Rs1 million, or the equivalent in foreign currency
- All cash transactions where forged or counterfeit currency notes or bank notes have been used as genuine or where any forgery of a valuable security or a document has taken place to facilitate the transactions
- All suspicious transactions, whether or not made in cash- All cross-border wire transfers of the value of more than Rs
500,000 (five lakhs) or the equivalent in foreign currency where either the origin or destination of the funds is India
- All purchase and sale by any person of immovable property valued at Rs 5 million (50 lakhs) or more that is registered by the reporting entity.
77 External Circular No. 022 2007, regarding the System for Preventing Assets Laundering and Terrorism Financing (“SARLAFT”). The 2009 regulation incorporates some new reporting standards that must be adhered to in reporting to the regulator.78 In India, the Income Tax Act also requires third parties such as banks, companies and property registries to regularly provide information on the financial transactions of taxpayers (Section 285BA).

117
Annex 1: StrAtegieS to CombAt the ShAdow eConomy
Mexico: As part of the National Anti-Money Laundering (AML) / Countering the Financing of Terrorism (CFT) Strategy, Mexico has restricted the use of cash in its financial sector.79 The AML/CFT General Provisions for banking institutions were amended on June 16, 2010 to: •LimittheamountsofUS$incashthatbankinginstitutions
are allowed to accept from clients or occasional customers through deposits or other transactions, and•Obligate banking institutions to report transactions
involving US$ in cash that exceed the limits set in the regulations.
On September 9, 2010, almost identical rules were imposed on currency exchanges and securities brokerages. New requirements have also been put in place for identifying clients performing transactions in smaller amounts (starting at US$ 500), which should counter structuring of transactions to avoid detection of suspicious transaction reports (a.k.a., smurfing). For wire transfers, the authorities report that the threshold has been changed to US$1,000.
Financial institutions in Mexico also have to report cash deposits made to taxpayer accounts when the accumulated monthly total of cash deposits in all the accounts a taxpayer holds in a single financial institution exceeds Mex$15,000. All acquisitions of cashiers checks must also be reported.
Peru: Law Nº 2830680 requires that any person, national or alien, entering or leaving the country, must declare under oath, cash or financial instruments he or she carries for amounts greater than US$10,000 or its equivalent in local or foreign currency.81 Moreover, Law Nº 28306 requires records of cash transactions (Article 9) and the recording and notification of cash transactions. That obligation applies to certain institutions and individuals specified in article 8 of the law.
South Korea: To collect the information needed for taxation, Korea enacted the Act on the Submission and Management of Taxation Data in 2000. It required that central government agencies, local governments, financial institutions, public or private organizations that receive subsidies from the government or public organizations, and state-owned companies regularly provide specified tax-related information to the National Tax Service.
Information Exchanges between FIUs and the Tax Authorities
Recent efforts to draw up effective strategies for anti-money laundering and combating the financing of terrorism (AML/CFT) bring together distinct but related
79 Refer to section 4 for more details.80 For an English version, see Act Nº 28306.81 6th complementary, transitory, and final provisions of Act Nº 28306
aspects of financial systems and criminal law. FIUs are an important component of these strategies. An FIU is a central national agency responsible for receiving, analyzing, and transmitting disclosures on suspicious transactions to the competent authorities. Combating the crimes of money laundering and financing terrorism is essential to the integrity of financial systems but if such efforts are to be successful, traditional law-enforcement methods need to be supported by contributions from the financial system itself, in particular by financial institutions implementing know-your-customer principles and reporting suspicious transactions to an FIU. The following examples illustrate how FIUs are set up, collect information, and share it with tax authorities.
Colombia: Colombia’s FIU (Unidad de Información y Análisis Financiero/ UIAF) is the central authority for reporting unusual financial operations. The unit operates within the Ministry of Treasury and Public Credit, along with other AML regulators established by the law. The UIAF investigates unusual financial operations reported by certain sectors of the economy that are obliged to report directly because they are especially vulnerable to money-laundering related activities, and any person or entity who reports voluntarily.
The main functions of the UIAF, as established by Law 526 of 1999, are to:• detect and prevent possible asset laundering and
terrorist financing in all economic activities;•collect,centralize,andanalyzetheinformationreceived
from financial institutions, other companies, and individuals;•reportspecificcasestotheSuperintendenceofFinance,
the Tax Administration, and the Prosecutor’s Office;• carry out AML studies and provide best practice
guidelines for sectors and economic operations characterized by a particular risk of money laundering occurring; and •propose new AML control mechanisms and amend
those already operative.
Mexico: In 2004, the Mexican federal government created its FIU with the primary function, aligned with international standards, of being the national governmental body responsible for receiving, analyzing, and disseminating financial information concerning transactions suspected of being related to money laundering or terrorist financing (ML/TF).
Peru: Peru’s FIU is the ‘Unidad de Inteligencia Financiera del Perú (UIF-Perú)’. The UIF-Peru is a unit of the Peruvian Regulator for Banks, Insurance Companies and Pension Funds (SBS) and is responsible for receiving, analyzing, processing, and transmitting information in order to detect (ML/TF). The UIF-Peru also helps obligated

118
Annex 1: StrAtegieS to CombAt the ShAdow eConomy
individuals or organizations (those covered by the AML or CTF laws) to contributes to establish specialized systems to detect ML/TF operations.
Ireland: Ireland requires financial institutions and other reporting entities to submit Suspicious Transaction Reports to both the tax administration and the FIU, and broad gateways permit the agencies to share information. After the requirement that financial institutions submit suspicious transaction reports to the tax administration was introduced in 2003, the Irish Revenue carried out extensive discussions with the institutions. These emphasized the obligation to submit suspicious transaction reports where there were suspicions of money laundering and the predicate offense was a possible tax crime. The campaign was successful: suspicious transaction reports submitted went up from about 3,000 in 2003 to 5,000 in 2004 and 14,000 in 2008. About 80 percent of the reports received relate to possible tax offenses. Since 2003, Irish Revenue has settled 578 civil tax assessments supported by information in the suspicious transaction reports, raising additional revenue €60.1 million. Currently 25 tax crime prosecutions underway in Ireland were initiated based on information in suspicious transaction reports. Specialists from the FIU and the tax administration meet regularly to discuss their analyses of suspicious transaction reports, coordinate investigations where there is evidence of both tax and non-tax offenses, and discuss broader operational issues related to money laundering investigations. Each agency also attends feedback meetings between the other agency and businesses required to submit reports. This ensures that the agencies display a united front in their dealings with the public.
Turkey: In 2009 and 2010 the Turkish FIU received suspicious transaction reports related to possible usury carried out using POS machines. Specialists within the FIU analyzed these reports and determined that, in addition to usury, the predicate offenses underlying the reports included possible tax crimes. The FIU shared its analysis with the Tax Inspection Board, which investigates tax crimes in Turkey. The board launched a number of investigations, during which officials identified additional unreported taxable income and evidence of tax offenses. The board shared the results of its investigations with the FIU, which resulted in the FIU submitting the case to the public prosecutor’s office for prosecution of money laundering offenses.
Australia: In Australia, the tax administration has a right of access to all FIU information, including direct access to all suspicious transaction reports, via a secure online connection. This may be used for any purpose relating to administration of taxes and enforcement of the tax law. The FIU also provides the tax administration with
complete data sets of suspicious transaction report information, which the tax administration uses in its automated data matching and data mining programs.
Italy: The Italian FIU has direct access to the Anagrafe dei Conti Account and Deposit Register maintained by the tax administration, which has information on accounts and financial transactions carried out by financial intermediaries. Since 2009, information obtained by the FIU from the Anagrafe dei Conti has been extremely useful. In particular, the information has been used in analyzing suspicious transaction reports, improving international cooperation by providing information to be shared with overseas FIUs, and enhancing the effectiveness of inspections and audits, especially those with respect to non-cooperative financial intermediaries. Legislation has also been passed that gives the Italian FIU direct access to the Anagrafe Tributaria (Tax Register) which will give the FIU access to information on Italian taxpayers. The Italian FIU has signed memoranda of understanding with the Bank of Italy and the Insurance Supervisory Authority setting out mutual obligations to share information and cooperate in combating money laundering and ensuring effective supervision. A memorandum of understanding is currently being negotiated between the FIU and the Securities Supervisory Authority. The Italian FIU works closely with the Guardia di Finanza; 97 percent of suspicious transaction reports are submitted to the Guardia di Finanza for investigation into suspected money laundering or tax evasion. The FIU may also delegate investigations and audits of non-cooperative financial intermediaries to the Guardia di Finanza.

119
ANNEX 2: PUBLIC AND PRIVATE SECTOR SALARIES BY OCCUPATION
Public sector 1 Administration 2
Before 10% reduction
After 10% reduction
Before 10% reduction
After 10% reduction
Information and communications technicians 78.9 % 71.0 % 78.9 % 71.0 %
Information and communications technology professionals 82.7 % 74.4 % 82.0 % 73.8 %
Administrative and commercial managers 90.6 % 81.5 % 91.9 % 82.7 %
Experts, sciences 94.6 % 85.1 % 94.3 % 84.8 %
Refuse and other elementary workers 98.8 % 88.9 % 100.2 % 90.2 %
Cleaners and helpers 100.9 % 90.8 % 102.6 % 92.4 %
Personal service workers 101.4 % 91.3 % 102.7 % 92.4 %
Building and related trades workers, excluding electricians 101.5 % 91.3 % 102.4 % 92.1 %
Production and specialized services managers 101.7 % 91.6 % 103.9 % 93.6 %
General and keyboard clerks 102.2 % 92.0 % 102.4 % 92.2 %
Food processing, wood working, garment and other crafts, and related trades workers
103.5 % 93.2 % 103.1 % 92.8 %
Laborers in mining, construction, manufacturing, and transport 104.1 % 93.7 % 104.9 % 94.4 %
Legal, social, cultural, and related associate professionals 104.2 % 93.8 % 105.1 % 94.6 %
Health-associated professionals 104.6 % 94.2 % 110.2 % 99.2 %
Legal, social, and cultural professionals 104.8 % 94.3 % 106.8 % 96.1 %
Business and administration professionals 105.3 % 94.8 % 105.2 % 94.7 %
Other clerical support workers 108.4 % 97.6 % 108.4 % 97.5 %
Customer services clerks 109.4 % 98.5 % 110.9 % 99.8 %
Business and administration associate professionals 110.2 % 99.1 % 110.6 % 99.6 %
Teaching professionals 110.2 % 99.2 % 104.8 % 94.3 %
Numerical and material recording clerks 111.9 % 100.7 % 111.4 % 100.3 %
Drivers and mobile plant operators 113.4 % 102.0 % 114.4 % 102.9 %
Sales workers 114.5 % 103.1 % 114.7 % 103.2 %
Metal, machinery, and related trades workers 119.0 % 107.1 % 119.0 % 107.1 %
Other / unspecified 121.0 % 108.9 % 119.1 % 107.2 %
Chief executives, senior officials, and legislators 121.1 % 109.0 % 122.5 % 110.3 %
Electrical and electronic trades workers 121.6 % 109.4 % 123.3 % 111.0 %
Agricultural, forestry and fishery laborers 123.1 % 110.8 % 122.2 % 110.0 %
Science and engineering associates professionals 125.9 % 113.3 % 124.7 % 112.3 %
Health professionals 126.9 % 114.3 % 127.0 % 114.3 %
Stationary plant and machine operators 132.7 % 119.4 % 132.1 % 118.9 %
Protective services workers 157.1 % 141.4 % 157.3 % 141.6 %
ANNEX 2: PUBLIC AND PRIVATE SECTOR SALARIES BY OCCUPATION (PRIVATE SECTOR INDEX=100)
Source: Serbia Labor Force Survey 2014; analysis by IPSOS.
1 Includes state and local governments. 2 Includes central public administration but not state-owned enterprises.