Embed Size (px)
Citation preview
Public Health Annual ReportBlackpool 2012
Public Health Annual ReportBlackpool 2012
Acknowledgements
Editorial group and analytical content was undertaken by:
Lynn Donkin, Public Health Specialist
Bob Harbin, Public Health Specialist
Jonathan Peters, Senior Public Health Information Analyst
Viv Maguire, Tobacco Control Development Facilitator
With additional thanks to the following people for their contributions:
Professor Chris Bentley, HINST Associates
Nicola Stubbins, Blackpool Council

Page 1 of 26
Public Health Annual ReportBlackpool 2012
Contents
Foreword 2
The challenge of improving life expectancy and reducing inequalities in Blackpool 4
The NHS reforms and public health in Blackpool 16
Introducing Blackpool Health and Wellbeing Board 16
New arrangements for Joint Strategic Needs Assessment 16
Introducing the Public Health Outcomes Framework 17
Appendix 1 Health Profile 2012: Blackpool 18
Appendix 2 Trends in life expectancy and mortality 19
List of Figures & Tables
Figure 1a: Life expectancy by electoral ward 5
Figure 1b: Disability-free life expectancy by electoral ward 5
Figure 2: Life expectancy variation illustrated by bus routes 7
Figure 3: Life expectancy and disability-free life expectancy inequalities: comparison of Bloomfield and Norbreck wards 6
Figure 4: Mortality from all causes in Blackpool, 2008-10 8
Figure 5a: Excess male mortality (%), Blackpool versus all Spearhead areas, 2006-08 9
Figure 5b: Excess female mortality (%), Blackpool versus all Spearhead areas, 2006-08 9
Figure 6a: Contribution to life expectancy by cause, Blackpool (males) 10
Figure 6b: Contribution to life expectancy by cause, Blackpool (females) 11
Table 1: Summary of main causes of reduced life expectancy in Blackpool (months of life lost), 2007 to 2009 12
Figure 7: Setting ambitions: male mortality in Spearhead areas in the North West 13
Table 2: Estimated numbers of lives Blackpool needs to save to reach the best of the spearhead PCTs in the North West (Warrington) by 2014 -2016
13
Figure 8: Timescales for interventions to increase life expectancy 15
List of Figures & Tables in the Appendix
Figure A1: Extract from Association of Public Health Observatories (APHO) Health Profile: Blackpool 2012 18
Figure A2.1: Trends in life expectancy – Males 19
Figure A2.2: Trends in life expectancy – Females 19
Table A2.1: Life expectancy at birth (1991-93 to 2008-10) 20
Figure A2.3: Trends in infant mortality 21
Figure A2.4: Trends in cancer mortality in people under age 75 22
Figure A2.5: Trends in circulatory disease mortality in people under age 75 22
Figure A2.6: Trends in mortality from accidents – all ages 23
Figure A2.7: Trends in mortality from suicide and injury undetermined – all ages 23

Page 2 of 26
Public Health Annual ReportBlackpool 2012
Foreword
I am pleased to present my Public Health Annual Report for Blackpool for 2012. The purpose of the Report is to provide an independent assessment of the health of the people of Blackpool, and to draw attention to particular issues or concerns where action can be taken to improve the health and wellbeing of the local population.
In recent years I have discussed the findings of Professor Michael Marmot’s independent review of health inequalities. Tackling health inequalities remains a significant challenge in Blackpool and I continue the theme in this year’s report. Life expectancy continues to be the worst in the country for men in Blackpool and the third worst for women and the trend seen in recent years is worrying. Although we are seeing life expectancy improving in the town, it isn’t improving as fast here as it is for the country as a whole, meaning that even though health is improving in the town the people of Blackpool continue to experience amongst the lowest life expectancy in the country. Life expectancy needs to improve faster here than elsewhere if we are to change this. In this year’s report I present an in depth analysis of the causes of reduced life expectancy in Blackpool (page 4). This work presents a detailed epidemiological study of the causes
of inequality in life expectancy, and also looks at the short and long term impact of a range of interventions that are required to improve life expectancy and reduce inequalities. The interventions are based on well established evidence from research on what works in practice for a range of the key diseases and conditions contributing to reduced life expectancy in Blackpool. Some of these interventions are already in place and working well in the town whilst others will require strengthening or extending to increase their impact.
Last year’s report included three key recommendations to improve the health of young children. I am particularly pleased that the findings of the Child Poverty Needs Assessment and Joint Strategic Needs Assessment analyses have informed the development of the draft priorities for the Health and Wellbeing Strategy and feature in this list of priorities. This is key to enabling the Health and Wellbeing Board to ensure that the commissioning of services is coordinated across the local organisations. The remaining recommendations of ensuring delivery of the full range of effective interventions so that all children are given the best start in life, a key action in reducing inequalities, continue to stand.

Public Health Annual ReportBlackpool 2012
The past year has seen the Coalition government’s planned reforms of the NHS start to take shape. For public health the NHS reforms present a significant change which will see local NHS public health teams move into local authorities. A new body, Public Health England, will incorporate the current Health Protection Agency and take responsibility for Vaccination and Immunisation Programmes and National Screening Programmes. On pages 16-17, we take a look at some of the key features of these reforms and what they will look like in Blackpool where a number of key changes are already underway. A shadow Clinical Commissioning Consortia and the Health and Wellbeing Board has been established. The preparation of a Health and Wellbeing Strategy is well underway, and arrangements for the Joint Strategic Needs Assessment process have been revised in line with the new responsibilities. The reforms focus on achieving health outcomes for the population and reducing inequalities in health and the new national Public Health Outcomes Framework has set out the broad range of opportunities to improve and protect health across the life course, improve life expectancy and reduce inequalities in health.
This next year will clearly be a year of transition and preparations are being made to ensure smooth transfer of NHS Blackpool’s Public Health team to Blackpool Council. Organisational change of this magnitude is a significant undertaking but I look forward to the seeing the Directorate of Public Health build on our existing strong relationship with Blackpool Council colleagues, and also to working with the Heath and Wellbeing Board to ensure that everyone in Blackpool has the opportunity for the best possible health in the future.
Dr Arif Rajpura Director of Public Health
Page 3 of 26

Page 4 of 26
Public Health Annual ReportBlackpool 2012
The challenge of improving life expectancy and reducing inequalities in Blackpool
Professor Michael Marmot’s report, Fairer Society, Healthy Lives (2010) examined the fundamental reasons for inequalities in health and the extent of these inequalities across the country. The report noted that in England’s poorest neighbourhoods, people die, on average, seven years earlier than in the most affluent. In this section of the Public Health Report, we outline the situation in Blackpool. This is particularly relevant to the changes in the Public Health function following the Health and Social Care Act, 2012.
Reduced life expectancy is perhaps the ultimate health inequality as well as a population scale series of human tragedies. It is also a general indicator of a population’s health and wellbeing. Low life expectancy is accomplished by a longer period spent in ill health, with all the associated suffering and problems.
This section of the Public Health Report profiles Blackpool’s mortality and life expectancy and shows the scale of the challenge faced by local partners. It outlines the key approaches and future directions for this work.
Life expectancy is the average age a baby born today would be expected to live to given the current death rates (see Box 1 Life expectancy). It is a commonly accepted way of summarising the different death rates experienced across age groups.
Life expectancy is improving in Blackpool, though not as fast as in the rest of the country (See Appendix 2, Figures A2.1, A2.2 and Table A2.1). This increasing gap is particularly the case for men. For a number of years male life expectancy has been the lowest in the country, closely followed by Manchester and Liverpool. Life expectancy in women is also lower than nationally and is currently the third worst. To try to close this gap Blackpool needs to improve faster than the rest of the country. This is a massive challenge in view of the strong and well-evidenced link between deprivation, economic performance and life expectancy.
As noted earlier, Marmot’s report highlights the seven year average gap in life expectancy between deprived areas, such as Blackpool, and more affluent areas. Blackpool has no small area census output areas in the top 20% nationally and is specifically mentioned by Marmot’s report as having 17 years less life expectancy than the best area in the country, Chelsea & Westminster.
Compared to the rest of the country, Blackpool men lose on average five years and women over three years life expectancy. In addition, there is considerable variation across the borough. This local variation is amongst the steepest in the North West.
Box 1 - Life expectancy
The average age a baby born today could be expected to reach given the current death rates at all ages.
Blackpool’s life expectancy in 2008-2010 was 73.6 years for men and 79.4 years for women compared with England’s 78.6 years for men and 82.6 years for women.
So a baby boy born today in Blackpool could be expected to live on average 5.0 years less than the average and a baby girl 3.2 years less.
It varies considerably across the borough from 71.7 years in Bloomfield to 81.0 years in Norbreck.

Page 5 of 26
Public Health Annual ReportBlackpool 2012
Figure 1a: Life expectancy by electoral ward
BloomfieldBloomfieldBloomfieldBloomfieldBloomfieldBloomfieldBloomfieldBloomfieldBloomfield
TyldesleyTyldesleyTyldesleyTyldesleyTyldesleyTyldesleyTyldesleyTyldesleyTyldesley
VictoriaVictoriaVictoriaVictoriaVictoriaVictoriaVictoriaVictoriaVictoria
AnchorsholmeAnchorsholmeAnchorsholmeAnchorsholmeAnchorsholmeAnchorsholmeAnchorsholmeAnchorsholmeAnchorsholme
Hawes SideHawes SideHawes SideHawes SideHawes SideHawes SideHawes SideHawes SideHawes Side
ClaremontClaremontClaremontClaremontClaremontClaremontClaremontClaremontClaremont
TalbotTalbotTalbotTalbotTalbotTalbotTalbotTalbotTalbot
GreenlandsGreenlandsGreenlandsGreenlandsGreenlandsGreenlandsGreenlandsGreenlandsGreenlands
WarbreckWarbreckWarbreckWarbreckWarbreckWarbreckWarbreckWarbreckWarbreck
MartonMartonMartonMartonMartonMartonMartonMartonMarton
BisphamBisphamBisphamBisphamBisphamBisphamBisphamBisphamBispham
BrunswickBrunswickBrunswickBrunswickBrunswickBrunswickBrunswickBrunswickBrunswick
Cli�onCli�onCli�onCli�onCli�onCli�onCli�onCli�onCli�on
HighfieldHighfieldHighfieldHighfieldHighfieldHighfieldHighfieldHighfieldHighfield
IngthorpeIngthorpeIngthorpeIngthorpeIngthorpeIngthorpeIngthorpeIngthorpeIngthorpe
LaytonLaytonLaytonLaytonLaytonLaytonLaytonLaytonLayton
NorbreckNorbreckNorbreckNorbreckNorbreckNorbreckNorbreckNorbreckNorbreck
ParkParkParkParkParkParkParkParkPark
Squires GateSquires GateSquires GateSquires GateSquires GateSquires GateSquires GateSquires GateSquires GateStanleyStanleyStanleyStanleyStanleyStanleyStanleyStanleyStanley
WaterlooWaterlooWaterlooWaterlooWaterlooWaterlooWaterlooWaterlooWaterloo
Figure 1b: Disability-free life expectancy by electoral ward
LE and DFLEBlackpool Wards - 2006-2010
80.4 to 10076.8 to 80.473.2 to 76.869.6 to 73.266 to 69.662.4 to 6658.8 to 62.455.2 to 58.851.6 to 55.248 to 51.6
LE and DFLEBlackpool Wards - 2006-2010
80.4 to 10076.8 to 80.473.2 to 76.869.6 to 73.266 to 69.662.4 to 6658.8 to 62.455.2 to 58.851.6 to 55.248 to 51.6

Page 6 of 26
Public Health Annual ReportBlackpool 2012
One way in which other places have profiled local variation in health is to show how life expectancy changes in traversing a city or region. For example, a commonly presented statistic is that a year of life expectancy is lost between each station on the Jubilee line on the London Underground from Westminster to Canning Town. Blackpool lacks an underground system but similar comparisons are possible using local bus routes. Figure 2 shows the life expectancy along three of the local bus routes chosen because they spanned much of the borough. Although there have been some changes in routes since this map was drawn, this nevertheless illustrates the variation in life expectancy within the town and demonstrates the dramatic difference seen in the space of only a few miles; for instance, travelling south on the Number 1 bus from the Blackpool boundary, there is a fall in life expectancy of nine years within a few miles.
Another measure often presented alongside life expectancy is healthy life expectancy. This is a measure of the average length of life spent in good or very good health. It recognises that, towards the end of life, there is a varying period of poor health.
Because it is calculated using data from the National Census it is usually most accurate immediately following the release of the census data. However, until these data are available, a proxy measure, disability-free life expectancy (DFLE) can be calculated using available data on local disability. Figure 1b profiles these differences in DFLE across local wards.
This demonstrates some further stark comparisons between areas. While there is a nine year difference in life expectancy between Blackpool wards, there is also a 21 year difference in DFLE. Figure 3 shows these data in relation to two of our wards at each extreme, Norbreck and Bloomfield wards.
Box 2 - Healthy life expectancy
A measure of the average age a baby born today could expect to live in good or very good health. This is calculated by the Office of National Statistics using the Census question on self- perceived health.
As the latest Census data are not yet available, we have calculated a proxy measure – disability-free life expectancy (DFLE) derived from data on local disability. This estimates the average length of life spent without disability due to some long-term health condition.
It ranges from 49.6 years in Bloomfield to 70.9 years in Norbreck. So there is a gap of 21.3 years between Blackpool wards.
0 10
Total life expectancy
Disability-free life expectancy
20 30 40 50 60 70 80 90
Bloomfield
Norbreck
Figure 3: Life expectancy and disability-free life expectancy inequalities

Page 7 of 26
Public Health Annual ReportBlackpool 2012
Figure 2: Life expectancy variation illustrated by bus routes
80
76
73
80
8978
78
7777
77
73
7277
7881
81
77
73
7372
77
7777
72 72
73
72
74
76
Route 1
Route 15
Route 4

Page 8 of 26
Public Health Annual ReportBlackpool 2012
Breast cancer, 2%Colorectal cancer, 3%
Lung cancer, 7%
Prostate cancer, 2%
Cervical cancer, 0.3%Oesophageal cancer, 1%
Stomach cancer, 1%Bladder cancer, 1%
Other cancer, 10%
Acute myocardial infarction, 8%
Circulatory, IHD not AMI, 6%
Stroke, 8%Circulatory other, 9%
Pneumonia, 7%
COPD other, 5%
Liver disease inc. cirrhosis, 3%
Infectious diseases, 1%
UTI infection, 1%
Diabetes, 1%Dementia / altzheimers, 4%
Parkinsons disease, 1%
Old age / frailty, 2%
Other, 17%
Cancer 25%
Circulatory disease
32%
Respiratory disease
13%
All other causes
30%
Factors influencing mortality and life expectancy
The main causes of death in Blackpool are shown in Figure 4.
These proportions of deaths due to each of the main causes are similar to those seen nationally. Circulatory disease, including heart disease and stroke, makes up the greatest proportion (32%). Cancers, especially lung, bowel, breast and prostate cancers are the next most frequently recorded cause (25%). Respiratory disease, including bronchitis/emphysema and pneumonia make up 13% of all deaths.
However, these represent the causes of all deaths whereas life expectancy is influenced not just by the total number of deaths, but also by the age at which death occurs. A death at a younger age has a larger impact on life expectancy than one later in life.
Figure 4: Mortality from all causes in Blackpool 2008-10

Page 9 of 26
Public Health Annual ReportBlackpool 2012
One way of considering the age distribution of deaths is to compare excess deaths across the age range. Excess deaths are those where the death rate for an age group is higher than the comparator, for example England. However comparisons with England are slightly misleading, so we have chosen to compare Blackpool’s age specific deaths with those in the former Spearhead group of districts. Spearheads were areas which had three of the following: high deprivation, high heart disease death rates, high cancer death rates, and/or low life expectancy.
The graphs in Figures 5a and 5b show how the excess deaths are distributed across the age spectrum for males and females in Blackpool. It shows where the death rates differ by age. It profiles where the Spearheads differ from England (shaded area) and where Blackpool differs from the Spearheads. Note that the graphs show the proportional effect not the absolute number of deaths.
Figure 5a: Excess male mortality (%), Blackpool versus All Spearhead areas, 2006-08
Figure 5b: Excess female mortality (%), Blackpool versus All Spearhead areas, 2006-08
The age profiles of Blackpool’s excess deaths differ from that of the other Spearhead areas, particularly for males. The excess in deaths in the Spearheads relative to England is mainly in the 55-74 age range. In Blackpool, excess deaths occur earlier among the age range 25-55. This is also seen, but to a lesser extent, in female deaths. Deaths at an early age have a proportionally higher impact on life expectancy, as each younger death removes more years off the average life expectancy than a death at an older age.
0%
2%
4%
6%
8%
10%
12%
14%
16%
< 1y
r
1-4
5-9
10-1
4
15-1
9
20-2
4
25-2
9
30-3
4
35-3
9
40-4
4
45-4
9
50-5
4
55-5
9
60-6
4
65-6
9
70-7
4
75-7
9
80-8
4
85+
Exce
ss M
orta
lity
Age band
Excess Male Mortality (%) - Blackpool vs. All Spearheads
England Spearhead Group BlackpoolSource: London Health Observatory
0%
2%
4%
6%
8%
10%
12%
14%
16%
< 1y
r
1-4
5-9
10-1
4
15-1
9
20-2
4
25-2
9
30-3
4
35-3
9
40-4
4
45-4
9
50-5
4
55-5
9
60-6
4
65-6
9
70-7
4
75-7
9
80-8
4
85+
Exce
ss M
orta
lity
Age band England Spearhead Group BlackpoolSource: London Health ObservatorySource: London Health Observatory
Page 10 of 26
Public Health Annual ReportBlackpool 2012
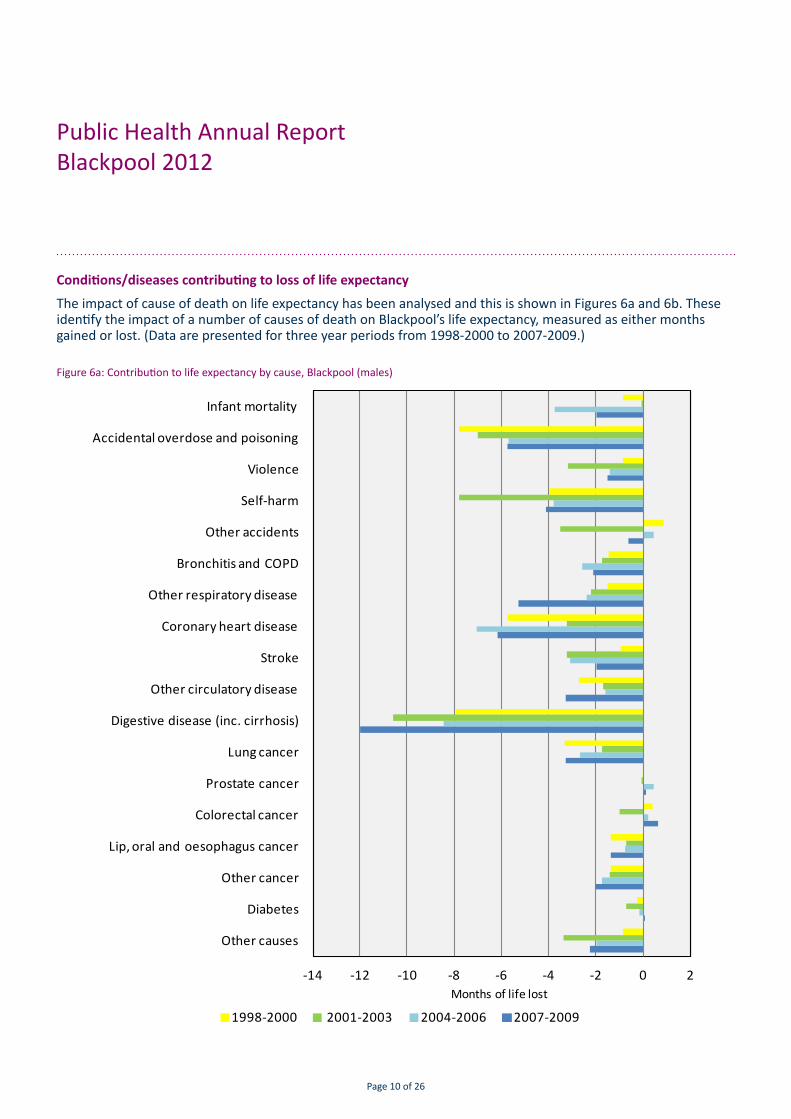
Conditions/diseases contributing to loss of life expectancy
The impact of cause of death on life expectancy has been analysed and this is shown in Figures 6a and 6b. These identify the impact of a number of causes of death on Blackpool’s life expectancy, measured as either months gained or lost. (Data are presented for three year periods from 1998-2000 to 2007-2009.)
Figure 6a: Contribution to life expectancy by cause, Blackpool (males)
-14 -12 -10 -8 -6 -4 -2 0 2
Other causes
Diabetes
Other cancer
Lip, oral and oesophagus cancer
Colorectal cancer
Prostate cancer
Lung cancer
Digestive disease (inc. cirrhosis)
Other circulatory disease
Stroke
Coronary heart disease
Other respiratory disease
Bronchitis and COPD
Other accidents
Self-harm
Violence
Accidental overdose and poisoning
Infant mortality
1998-2000 2001-2003 2004-2006 2007-2009
Months of life lost

Page 11 of 26
Public Health Annual ReportBlackpool 2012
Figure 6b: Contribution to life expectancy by cause, Blackpool (females)
-10 -8 -6 -4 -2 0 2
Other causes
Diabetes
Other cancer
Lip, oral and oesophagus cancer
Colorectal cancer
Prostate cancer
Lung cancer
Digestive disease (inc. cirrhosis)
Other circulatory disease
Stroke
Coronary heart disease
Other respiratory disease
Bronchitis and COPD
Other accidents
Self-harm
Violence
Accidental overdose and poisoning
Infant mortality
1998-2000 2001-2003 2004-2006 2007-2009
Months of life lost

Page 12 of 26
Public Health Annual ReportBlackpool 2012
The latest data (2007-9) are also summarised in Table 1 showing the causes responsible for the greatest loss of life expectancy.
Table 1: Summary of main causes of reduced life expectancy in Blackpool (months of life lost), 2007 to 2009
Men
Cause Months lost
Violence/self-harm/overdose & poisoning
-12.06
Digestive disease including cirrhosis
-12.02
Circulatory disease -11.46
Respiratory -7.46
Cancers -6.06
Infant mortality -1.99
Women
Cause Months lost
Digestive disease including cirrhosis
-7.16
Cancers -4.89
Respiratory -4.57
Circulatory disease -2.82
Violence/self-harm/overdose & poisoning
-2.5
Infant mortality -1.38
Three groups of causes are together responsible for over three years loss of male life expectancy. Violence/self-harm/overdose and poisoning, digestive diseases including cirrhosis, and circulatory disease are responsible for three of the five years difference in male life expectancy between Blackpool and England. Respiratory disease and cancers, chiefly lung cancer, make up over a year of the remainder.
Female life expectancy is particularly influenced by digestive diseases including cirrhosis, and cancers, which in total make up over a year of the three years loss of life expectancy compared with England. Respiratory and circulatory diseases make up over seven months of the remainder.
A number of these causes are closely related to particular lifestyle risk factors. For example, alcohol is the key risk factor for cirrhosis and makes a large contribution to violence/self-harm and circulatory disease. Tobacco use is a risk factor for circulatory disease, respiratory disease and lung cancer. Substance misuse is associated with deaths due to self-harm and overdose/poisoning.
Taking action to reduce inequalities
In 2009 the National Support Team for Health Inequalities (NST) visited Blackpool as part of a series of visits to Spearhead areas. The purpose of their visits was to review work already underway and to help shape future action in the most challenged Primary Care Trust areas. Since then, Professor Chris Bentley, the team leader has provided ongoing support to NHS Blackpool’s work. One of Professor Bentley’s recommendations was to identify the scale of the challenge by modelling the improvement required in terms of the number of deaths that would need to be prevented to improve life expectancy. These were modelled against the best of a comparable peer group. The work examined what progress would be needed to match Warrington, the best of the Spearheads in the North West.

Page 13 of 26
Public Health Annual ReportBlackpool 2012
Figure 7 shows the current gap between Blackpool’s male mortality rate and the other North West spearhead PCTs. Warrington has the lowest mortality rate and, in order to reach their current mortality levels by 2015, Blackpool would need to save over 700 male lives and 500 female lives. Our local mortality rates are falling and, on current rates of progress it is estimated that 280 male and 188 fewer female deaths would occur by 2015. To meet this ambition of matching the current best rate would require a further reduction of 438 male and 234 deaths. This gives a quantitative idea of the scale of challenge.
Table 2: Estimated numbers of lives Blackpool needs to save to reach the best of the Spearhead PCTs in the North West (Warrington) by 2014 -2016
Death reduction on current trajectory
Extra deaths reduction needed
in addition
Men 281 438
Women 188 234
All 469 673
Figure 7: Setting ambitions: male mortality in Spearhead areas in the North West
0
100
200
300
400
500
600
700
800
900
1000
Mal
e A
AA
CM p
er 1
00,0
00
Male all-age, all-cause mortality (AAACM) rates by Primary Care Trust, 2008-10Blackpool
Warrington
England

Page 14 of 26
Public Health Annual ReportBlackpool 2012
The work with the NST has identified some of the shorter-term actions with the potential to reduce mortality. Some of the key ones are listed below:
■ secondary prevention for cardiovascular (CVD) events
■ additional treatment for hypertensives
■ warfarin for atrial fibrillation >65 years
■ improving diabetes management
■ treating CVD risk among Chronic Obstructive Pulmonary Disease (COPD) patients
■ reducing smoking in pregnancy
■ reducing harmful alcohol consumption
■ increasing rates of early presentation of lung cancer
■ providing stop smoking interventions
■ reducing excess winter deaths, for example through warmer homes initiatives and support for those at greatest risk
■ providing flu vaccination for those with existing health conditions
Modelling the possible impact of these interventions shows that, if fully implemented, they have the potential to reduce deaths by around 235 a year.
General Practices across Blackpool have adopted a number of these interventions, including a Locally Enhanced Service (LES) for CVD to identify people at highest risk of disease and introducing screening and treatment for atrial fibrillation.
We have seen some progress. Life expectancy is improving, albeit slowly. Our local heart disease mortality rates are falling. Work on smoking in pregnancy has seen a reduction in local rates of smoking among pregnant women from 35% to 29%. The newly established Clinical Commissioning Group (CCG) has funded a hypertension project to identify and treat those with existing but undiagnosed hypertension. Hypertension has been termed the ‘silent killer’ as it often is symptom free. However it is a major risk factor for stroke and heart disease.
It is obviously important that we make progress on these actions as they have the potential for short to medium term benefit. However the underlying causes of inequalities in health are complex and intractable. Professor David Hunter, an advisor to the Marmot commission described health inequalities as “wicked” problems, meaning they are complex and sometimes difficult to define.
As well as an immediate approach with potential for more rapid short term impact, the NST pointed towards the need for actions across medium and long term time scales (Figure 8). Key amongst these will be to continue work on the lifestyle factors, primarily smoking, alcohol and drug misuse, and weight management. A review of the local alcohol strategy is underway and this involves a wide range of local organisations and services affected by high levels of alcohol misuse in the town including the NHS, police, local authority licensing team, and service providers.

Page 15 of 26
Public Health Annual ReportBlackpool 2012
Continuing to make progress
At the start of this section we made reference to the Marmot Review. The underlying causes of health inequalities involve complex long-term interactions between a range of factors, such as education, housing, income, environmental and social networks as well as those more immediate to particular lifestyle factors. Marmot’s Review includes a recommendation to strengthen the role and impact of ill health prevention and this is progressing in Blackpool.
His further recommendations include:
■ giving every child the best start in life
■ enabling all children, young people and adults to maximise their capabilities and have control over their lives
■ creating fair employment and good work for all
■ ensuring a healthy living standard for all
■ creating and developing sustainable places and communities
To make significant progress on these requires action from partners across Blackpool. As noted in the Foreword of this report, from April 2013, the Public Health function will become the responsibility of the local authority. They are the pivotal partner in addressing the wider determinants of health. This change will include a new Public Health Outcomes Framework with life expectancy, together with reducing local inequalities, as underpinning indicators. It represents a major organisational change which will have to create a system capable of tackling the major challenge outlined in this section. However, Blackpool should be well placed as previous working relations between local organisations, particularly the Public Health Directorate and the Council, have been close and productive.
2005 2010 2015 2020
Timescales for Interventions to increase life expectancy
A
B
C
For example intervening through lifestyle and behavioural change such as stopping smoking, reducing alcohol related harm and weight management to reduce mortality in the medium term
For example intervening to modify the social determinants of health such as worklessness, poor housing, poverty and poor education attainment to impact on mortality in the long term
For example intervening to reduce risk of mortality in people with established disease such as CVD, cancer, diabetes
Figure 8: Timescales for interventions to increase life expectancy
The advice of the NST was to seek to achieve a balance between these different approaches and activities. Short-term interventions will not deal with the fundamental problems and root causes of our health inequalities. Equally, a focus on long term determinants of health will ignore the high level of current need and potential benefits.

Page 16 of 26
Public Health Annual ReportBlackpool 2012
The NHS reforms and public health in Blackpool
The Coalition government has set out an ambitious set of reforms for the NHS (Equity and Excellence: Liberating the NHS, DH, 2010) and public health (Healthy Lives, Healthy People: Our strategy for public health in England, 2010). In this section of the report we take a look at three changes arising from these reforms, specifically:
1. the creation of local Health and Wellbeing Boards covering upper tier local authority areas,
2. new arrangements for Joint Strategic Needs Assessment (JSNA) which has a key role in the reformed system for informing the Health and Wellbeing Strategy,
3. the introduction of a Public Health Outcomes Framework, a range of indicators which reflect the new systems focus on achieving health outcomes for the population and reducing inequalities in health.
Introducing Blackpool Health and Wellbeing Board
The reforms will see the creation of Health and Wellbeing Boards which will act as a forum for local commissioners across the NHS, public health and social care, elected representatives, and representatives of HealthWatch to discuss how to work together to better the health and wellbeing outcomes of the people in their area. The Health and Wellbeing Boards will involve democratically elected representatives and patient representatives, and bring them together with local commissioners across health, public health, and social care.
A shadow Health and Wellbeing Board was established in Blackpool in December 2011. The Board was formed in response to the Government’s re-organisation of health services. The Board has been meeting regularly, and have looked at priorities to inform the development of the new joint health and wellbeing strategy.
The approach to the composition of the shadow Health and Wellbeing Board has been to retain a small and strategic core group during the development phase of the Board. This largely reflects the core membership that was set out in the Health and Social Care Bill with the addition of representation from NHS Blackpool and Lancashire Constabulary. Membership will be reviewed as part of the ongoing development of the shadow Board.
The issues facing Blackpool are challenging, so it has been necessary to go through a process of prioritisation to determine areas of focus for the Health and Wellbeing Board. Work is ongoing to produce a joint health and wellbeing strategy for Blackpool which is expected to be published early 2013.
New arrangements for Joint Strategic Needs Assessment
Joint Strategic Needs Assessment (JSNA) is a process to analyse the health and wellbeing needs and inequalities of populations to inform and guide commissioning of health, wellbeing and social care services within a local authority area.
The forthcoming NHS reforms propose a central role for JSNAs so that Health and Wellbeing Board partners jointly analyse current and future health needs of populations. Local authorities and clinical commissioning consortia will have equal and explicit obligation to produce a JSNA and a joint health and wellbeing strategy to inform and guide the commissioning of health, wellbeing and social care services.
JSNA Blackpool

Page 17 of 26
Public Health Annual ReportBlackpool 2012
The process for JSNA in Blackpool is well established with an active Working Group of analysts from the public health team and local authority delivering joint analyses and projects. Membership of the JSNA Strategic Group has been reviewed and the group now functions as a subgroup of the shadow Blackpool Health and Wellbeing Board. The group is chaired by the Director of Public Health and membership includes a GP representative from Blackpool’s Clinical Commissioning Group (CCG).
Analyses from the JSNA are being used by the shadow Health and Wellbeing Board to inform the development of priorities for the health and wellbeing strategy.
Introducing the Public Health Outcomes Framework
The public health reforms set out by the Coalition government in Healthy Lives, Healthy People recognise the importance of broader social determinants like poverty, education, housing, employment, crime and pollution, on health. The new system focuses on achieving health outcomes for the population and reducing inequalities in health and the subsequent Public Health Outcomes Framework sets out the broad range of opportunities to improve and protect health across the life course and to reduce inequalities in health.
The framework’s vision is to improve and protect the nation’s health and wellbeing, and improve the health of the poorest fastest. There are two high level outcomes:
1. increased life expectancy, and
2. reduced differences in life expectancy and healthy life expectancy between communities.
Although this is a national framework, the emphasis on improving the health of the poorest fastest and reducing inequalities is particularly relevant to Blackpool where male life expectancy is the lowest in the country, and where there are significant inequalities within the town.
The high level outcomes are underpinned by a broad range of indicators grouped into four domains:
1. Improving the wider determinants of health
■ Objective: improvements against wider factors that affect health and wellbeing and health inequalities
2. Health improvement
■ People are helped to live healthy lifestyles, make healthy choices and reduce health inequalities
3. Health protection,
■ The population’s health is protected from major incidents and other threats, while reducing health inequalities
4. Healthcare public health and preventing premature mortality.
■ Reduced numbers of people living with preventable ill health and people dying prematurely, while reducing the gap between communities
As highlighted earlier in the report, making progress in these outcomes will require the collective efforts of all parts of the new public health system, and across public services and wider society. The framework indicates the respective roles of local government, the NHS and Public Health England, and their delivery of improved health and wellbeing outcomes for the people and communities they serve.
Page 18 of 26
Public Health Annual ReportBlackpool 2012
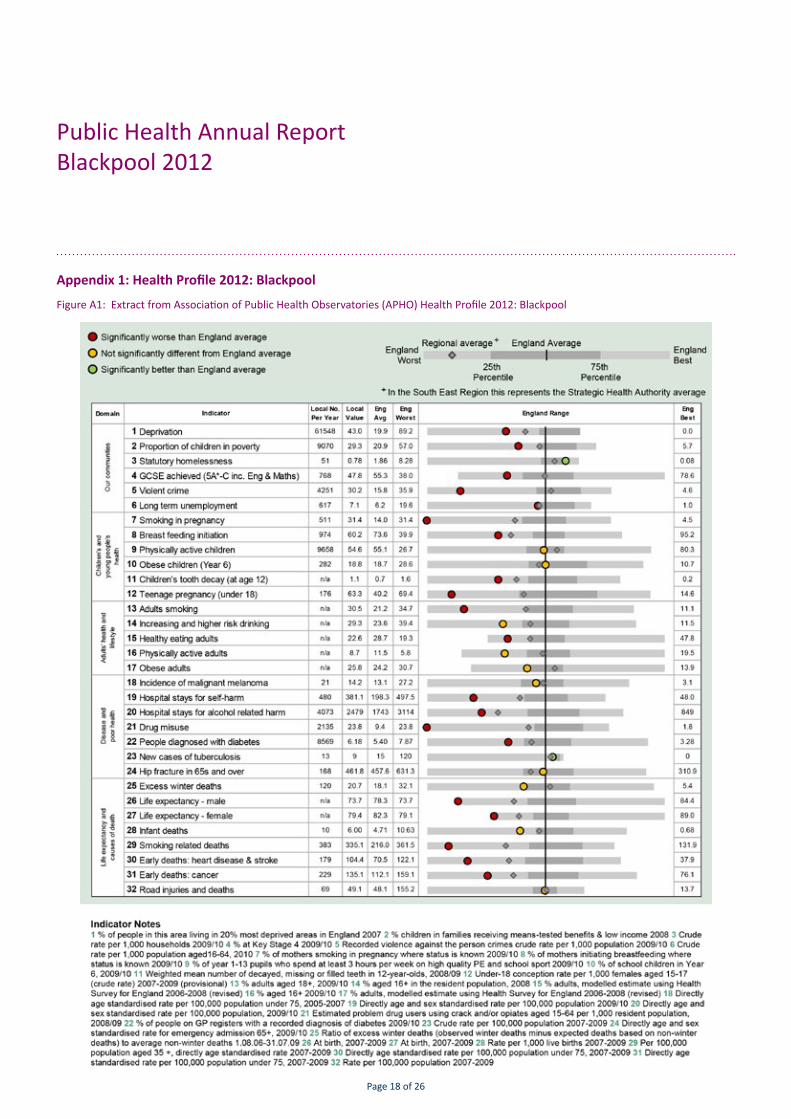
Appendix 1: Health Profile 2012: Blackpool
Figure A1: Extract from Association of Public Health Observatories (APHO) Health Profile 2012: Blackpool

Page 19 of 26
Public Health Annual ReportBlackpool 2012
74
75
76
77
78
79
80
81
82
83
Life
exp
ecta
ncy
at b
irth
Years (pooled)
ENGLAND AND WALES NORTH WEST Blackpool UA
66
68
70
72
74
76
78
80
Life
exp
ecta
ncy
at b
irth
Years (pooled)
ENGLAND AND WALES NORTH WEST Blackpool UA
Appendix 2: Trends in life expectancy and mortality
Life expectancy
The national DH health inequalities target was “To reduce the gap in life expectancy at birth between the fifth of local authorities with the worst health and deprivation indicators (known as ‘the Spearhead Group’) and the population as a whole (England), by at least 10% by 2010”. Blackpool is a ‘Spearhead’ area.
Figure A2.1: Trends in life expectancy - Males
Figure A2.2: Trends in life expectancy - Females
Source data: Compendium of Clinical and Health Indicators
Source data: Compendium of Clinical and Health Indicators

Page 20 of 26
Public Health Annual ReportBlackpool 2012
Appendix 2 continued...
Life expectancy in Blackpool has improved in recent years. Despite this improvement, life expectancy in Blackpool has been increasing at a slower rate than the country as a whole, and the gap between life expectancy in Blackpool and the national average continues to widen.
1991-9
3
1992-9
4
1993-9
5
1994-9
6
1995-9
7
1996-9
8
1997-9
9
1998-0
0
1999-0
1
2000-0
2
2001-0
3
2002-0
4
2003-0
5
2004-0
6
2005-0
7
2006-0
8
2007-0
9
2008-1
0
MalesEngland and Wales 73.6 73.9 74.1 74.3 74.5 74.7 75.0 75.3 75.6 75.9 76.1 76.4 76.8 77.2 77.5 77.8 78.1 78.5North West 72.4 72.7 72.8 73.1 73.2 73.4 73.6 73.9 74.2 74.6 74.8 75.1 75.4 75.7 76.0 76.3 76.6 77.0Blackpool 71.6 71.5 71.0 71.5 71.6 72.1 72.2 72.2 72.0 71.7 72.0 72.8 73.2 73.3 73.2 73.5 73.7 73.6England and Wales 79.1 79.3 79.4 79.6 79.6 79.8 79.9 80.1 80.3 80.6 80.7 80.8 81.1 81.5 81.7 82.0 82.2 82.5North West 77.9 78.1 78.3 78.5 78.5 78.5 78.6 78.9 79.1 79.4 79.4 79.7 79.9 80.3 80.5 80.6 80.8 81.1Blackpool 78.3 78.6 78.0 77.7 77.3 77.4 77.9 78.2 78.4 78.4 78.4 78.4 78.8 78.7 79.0 78.8 79.4 79.4
Females
Males
Table A2.1: Life expectancy at birth (1991-93 to 2008-10)

Page 21 of 26
Public Health Annual ReportBlackpool 2012
0
2
4
6
8
10
12
1997 1998 1999 2000 2001 2002 2003 2004 2005 2006 2007 2008 2009 2010
Infa
nt m
orta
lity
rate
per
1,0
00 li
ve b
irths
England and Wales
North West
Blackpool
Infant mortality
The national DH target was “Starting with children under one year, by 2010 to reduce by at least 10% the gap in mortality between the routine and manual group and the population as a whole. The baseline, for comparison, is 1997-99”.
The infant mortality rate for Blackpool is based on only a few deaths each year and so needs to be interpreted carefully as it is subject to natural year on year variation. Overall the trend in infant mortality is similar to the average for the North West region.
Premature mortality
The national DH health inequalities targets were to “Substantially reduce mortality rates by 2010:
■ from cancer in people under age 75 with a reduction in the inequalities gap of at least 6% between the fifth of areas with the worst health and deprivation indicators and the population as a whole
■ from heart disease and stroke and related diseases in people under age 75 with a reduction in the inequalities gap of 40% between the fifth of areas with the worst health and deprivation indicators and the population as a whole”
The national DH mortality targets are:
■ To reduce the death rate from cancer in people under age 75 years by at least 20% by 2010
■ To reduce the death rate from all circulatory diseases in people under age 75 years by at least 40% by 2010
■ To reduce the death rate from suicide and undetermined injury by at least 20% by 2010
■ To reduce the death rate from accidents by at least 20% by 2010
Figure A2.3: Trends in infant mortalitySource data: Compendium of Clinical and Health Indicators

Page 22 of 26
Public Health Annual ReportBlackpool 2012
0
20
40
60
80
100
120
140
160
180
200
1993 1994 1995 1996 1997 1998 1999 2000 2001 2002 2003 2004 2005 2006 2007 2008 2009 2010
Dire
ctly
Sta
ndar
dise
d R
ate
per 1
00,0
00 p
opul
atio
n
England and Wales North West Blackpool
The trend in mortality from cancers and circulatory diseases amongst people under age 75 show an overall pattern of improvement. However mortality rates remain higher than the regional and national average in both cases.
Figure A2.4: Trends in cancer mortality in people under age 75
Figure A2.5: Trends in circulatory disease mortality in people under age 75
Source data: Compendium of Clinical and Health Indicators
0
50
100
150
200
250
1993 1994 1995 1996 1997 1998 1999 2000 2001 2002 2003 2004 2005 2006 2007 2008 2009 2010
Dire
ctly
Sta
ndar
dise
d R
ate
per 1
00,0
00 p
opul
atio
n
Year
England and Wales North West Blackpool
Source data: Compendium of Clinical and Health Indicators

Page 23 of 26
Public Health Annual ReportBlackpool 2012
0
2
4
6
8
10
12
14
16
18
20
1993 1994 1995 1996 1997 1998 1999 2000 2001 2002 2003 2004 2005 2006 2007 2008 2009 2010
Dir
ectl
y St
anda
rdis
ed R
ate
per
100,
000
Popu
lati
on
Year
ENGLAND AND WALES North West Blackpool
0
5
10
15
20
25
30
35
40
Dire
ctly
Sta
ndar
dise
d R
ate
per 1
00,0
00 p
opul
atio
n
England and Wales North West Blackpool
Mortality rates from accidents amongst Blackpool people of all ages are similar to the North West average. Accident mortality rates are based on small numbers of actual deaths so rates are sensitive to natural variations in the actual number of cases and apparent spikes should be interpreted with caution.
Mortality rates from suicide and undetermined injury are also based on only a few actual deaths and figures for single years must be viewed with care. The overall trend shows rates in Blackpool tend to be higher than both the North West region and national average. Rates for the North West region appear to have reduced slightly over the past decade.
Figure A2.6: Trends in mortality from accidents - all ages
Figure A2.7: Trends in mortality from suicide and injury undetermined – all ages
Source data: Compendium of Clinical and Health Indicators
Page 24 of 26
Public Health Annual ReportBlackpool 2012
Finding out more
Blackpool Joint Strategic Needs Assessment (JSNA) www.blackpooljsna.org.uk
Blackpool Council www.blackpool.gov.uk
Health Profiles from Association of Public Health Observatories www.healthprofiles.info
National Statistics www.statistics.gov.uk
NHS Choices www.nhs.uk
Stop smoking www.smokefree.nhs.uk


J109283 0313
Prepared by:
Directorate of Public Health, NHS Blackpool, Blackpool Stadium, Seasiders Way, Blackpool FY1 6JX
Published March 2013.
Published to the Blackpool JSNA website, in electronic PDF format.
www.blackpooljsna.org.uk