Embed Size (px)
Citation preview

1
Public Health Information Services (PHIS)
Toolkit
Version: October 2018

2
Authors
This document was developed by members of the Public Health Information Services (PHIS) Task
Team of the Global Health Cluster. Contributors included Nada Abdelmagid (Save the Children),
Olivier Le Polain (Public Health England), Francesco Checchi (LSHTM), Boris Pavlin (WHO), and all
members of the Global Health Cluster’s PHIS Task Team.
Acronyms
CDC Centers for Disease Control and Prevention
DHIS2 District Health Information System 2
ENA Emergency Nutrition Assessment
EWAR Early Warning Alert and Response
GHC Global Health Cluster
HC Health Cluster
HCC Health Cluster Coordinator
HeRAMS Health Resources Availability Monitoring System
HESPER Humanitarian Emergency Settings Perceived Needs
HMIS Health Management Information System
IASC Inter-Agency Standing Committee
IMO Information Management Officer
IRA Initial Rapid Assessment
MIRA Multi-Sector Initial Rapid Assessment
OIM Operational Indicator Monitoring
PHIS Public Health Information Services
PHO Public Health Officer
PHSA Public Health Situation Analysis
PSD Preliminary Scenario Definition
RHA Rapid Health Assessment
SMART Standardised Monitoring and Assessment of Relief and Transition
SSA Surveillance System for Attacks on Health Care

3
Table of contents
Acronyms ............................................................................................................................................................ 2
Acknowledgements .......................................................................................................................................... 4
1. INTRODUCTION ........................................................................................................................................... 5
1.1 Background ......................................................................................................................................... 5
1.2 Purpose of the PHIS Toolkit ................................................................................................................. 5
1.3 Target audience ................................................................................................................................. 5
1.4 Summary of guidance and applications to support Public Health Information Services ......... 6
2. TOOLS FOR MEASURING THE HEALTH STATUS AND THREATS FOR AFFECTED POPULATIONS ............ 11
2.1 Public Health Situation Analysis (PHSA) .......................................................................................... 11
2.2 Rapid Assessment ............................................................................................................................. 12
2.2.1 Multi-Sector Initial Rapid Assessment (MIRA) .............................................................................. 12
2.2.2 Initial Rapid Assessment ................................................................................................................. 15
2.2.3 Rapid Health Assessment (RHA) .................................................................................................... 15
2.3 Humanitarian Emergency Settings Perceived Needs (HESPER) Scale ...................................... 15
2.4 Early Warning Alert and Response (EWAR) ................................................................................... 16
2.5 Population Mortality Estimation ...................................................................................................... 16
2.6 Surveillance System for Attacks on Health Care (SSA) (formerly Measuring Violence against
Health [MVH]) ............................................................................................................................................... 16
3. TOOLS FOR MEASURING HEALTH RESOURCES AND SERVICES AVAILABILITY...................................... 17
3.1 Who, What, Where (3W) Matrix ...................................................................................................... 17
3.2 Partners’ List ....................................................................................................................................... 19
3.3 Health Resources and Services Availability Monitoring System (HeRAMS) ............................... 20
4. TOOLS FOR MEASURING HEALTH SYSTEM PERFORMANCE ................................................................... 23
4.1 Health Management Information System (HMIS) ......................................................................... 23
4.2 Vaccination Coverage Estimation ................................................................................................. 23
4.3 Operational Indicator Monitoring .................................................................................................. 25
4.4 Health Cluster Bulletin....................................................................................................................... 26
4.5 Ad hoc Infographics ........................................................................................................................ 26
5. MISCELLANOUS PUBLIC HEALTH INFORMATION TOOLS & RESOURCES .............................................. 28
5.1 General Templates ........................................................................................................................... 28
5.2 Other Resources ............................................................................................................................... 28

4
Table of figures and tables
Table 1: Availability of guidance and applications to support PHIS ......................................................... 10 Table 2: Public Health Situation Analysis Tools .............................................................................................. 11 Table 3: Example of information collected for 3W ...................................................................................... 18 Table 4: Example of information collected for partner’s list ....................................................................... 19
Figure 1: Excerpt from health section of MIRA Report (Escalation of conflict, Central African Republic,
January 2014 (interagency initiative)): ......................................................................................................... 13 Figure 2: Excerpt from Health Cluster 3W operational presence map (Conflict, South Sudan, 2017: 3W
operational partners’ presence): .................................................................................................................. 19 Figure 3: Excerpt from HeRAMS Report (Conflict, Syria 2016: Annual HeRAMS Report (Turkey Hub) –
3rd Quarter 2016 Snapshot for Public Health Centres in Syria (WHO Syria Country Office)): ................ 21 Figure 4: Excerpt from HeRAMS Report (Conflict, Yemen, 2016: Service Availability and Health
Facilities Functionality in 16 Governorates): ................................................................................................. 22 Figure 5: Calculation of administrative vaccination coverage using routine EPI data ......................... 23 Figure 6: Excerpt from Vaccination Coverage Report (Conflict/Cholera Outbreak, Iraq, 2015): ........ 24 Figure 7: Excerpt from Health Indicators Report (Conflict, Syria, 2017: Health indicators report - April
2017): ................................................................................................................................................................. 25 Figure 8: Excerpt from Health Cluster Dashboard (Conflict, Afghanistan, 2017): ................................... 27
Acknowledgements
We gratefully acknowledge funding and in-kind support from the European Commission
Humanitarian Office (DG ECHO), the United States Agency for International Development’s Office
of Foreign Disaster Assistance (USAID/OFDA), the World Health Organization, Save the Children, the
United States Centers for Disease Control and Prevention, and Public Health England.
5
1. INTRODUCTION
1.1 Background
At country and subnational levels, public health information needs are not consistently met by
Health Clusters, partly due to short-staffed Health Cluster teams, and multiple and conflicting public
health information priorities of different stakeholders. To cope with these challenges, Health Clusters
usually attempt to develop local solutions, many of which vary significantly in quality and pose a
high workload on Health Cluster teams.
The Global Health Cluster (GHC) is seeking to address these and other public health information
challenges through the roll out of the Global Public Health Information Services (PHIS) Standards.
These standards are also accompanied by a set of practical tools to simultaneously standardise and
support public health information functions at national and sub-national levels.
1.2 Purpose of the PHIS Toolkit
This PHIS Toolkit complements the Global PHIS Standards. The Toolkit assembles guidance, templates
and best-practice examples for each core, additional and context-specific public health
information service, as outlined in the PHIS Standards. It also includes additional general tools and
resources to support information management functions in activated Health Clusters or equivalent
coordination mechanisms.
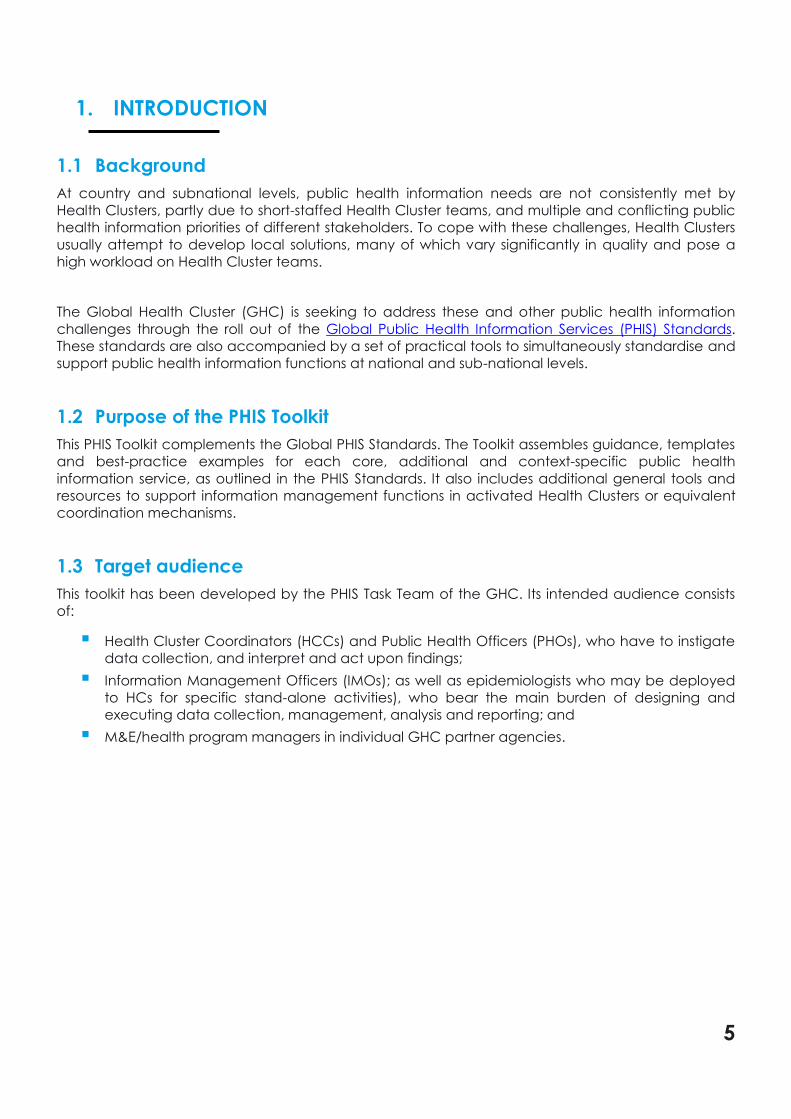
1.3 Target audience
This toolkit has been developed by the PHIS Task Team of the GHC. Its intended audience consists
of:
▪ Health Cluster Coordinators (HCCs) and Public Health Officers (PHOs), who have to instigate
data collection, and interpret and act upon findings;
▪ Information Management Officers (IMOs); as well as epidemiologists who may be deployed
to HCs for specific stand-alone activities), who bear the main burden of designing and
executing data collection, management, analysis and reporting; and
▪ M&E/health program managers in individual GHC partner agencies.

6
1.4 Summary of guidance and applications to support Public Health Information Services
Domain Service Guidance for
design/methodology
Data collection tool(s) Available software
/application
Reporting
Template(s)
Guidance for
interpretation/
use
Other
He
alth
Sta
tus
an
d T
hre
ats
fo
r A
ffe
cte
d P
op
ula
tio
ns
Public Health
Situation Analysis
(PHSA)
• Public Health Situation
Analysis Standard
Operating Procedures
• None Not needed • PHSA (long-form)
template – English • PHSA (short-form)
template – English • PHSA (long-form)
template – French
• PHSA (short-form)
template - French
None
n/a
Rapid Assessment
Multi-Sector Initial Rapid
Assessment (MIRA)
• Multi-Sector Initial
Rapid Assessment
(MIRA) Guidance
• MIRA Framework
MIRA Investigation Forms
Two applications to
facilitate the choice of
questions and
questionnaire design
under development by
ACAPS and CDC.
• MIRA Preliminary
Scenario
Definitions (PSD)
Template
• MIRA Report
Template
None n/a
Initial Rapid Assessment
(IRA) Tool
• Guidance Note
• Aide Memoire for Field
Teams
• IRA for Adolescent
Sexual and
Reproductive Health in
Emergency Settings
(adjunct to main tool)
• Field Assessment
Form
• Secondary data
template
• Data Entry and
Reporting Tool
• IRA Software User
Guide
• Data Entry and
Reporting Tool
• IRA Software User
Guide
None n/a
Rapid Health Assessment
(RHA) Tool
Guidelines and comments
• Field Questionnaire
• Data Compilation
Template
None • RHA Report
Template
None n/a
Humanitarian
Emergency
Settings Perceived
Needs (HESPER)
Scale
The HESPER manual
A simplified version for
acute emergencies
(HESPER light) is being
developed and planned
for use in 2018.
The HESPER manual
Appendix 1: HESPER
Scale
None The HESPER manual
Appendix 3: Example
HESPER Report
None The HESPER
manual
Appendix 2:
Training manual
for interviewers

7
Domain Service Guidance for
design/methodology
Data collection tool(s) Available software
/application
Reporting
Template(s)
Guidance for
interpretation/
use
Other
Early Warning Alert
and Response
(EWAR)
• Outbreak surveillance
and response in
humanitarian
emergencies: WHO
guidelines for EWARN
implementation
• Global EWARS Project
Global EWARS Project Global EWARS Project Global EWARS
Project
Global EWARS
Project
n/a
Population
mortality
estimation
(There is no
consensus about
the method for
prospective
surveillance or
other approaches
most appropriate
in crises)
The Standardised
Monitoring and Assessment
of Relief and Transition
(SMART) method
The Standardised
Monitoring and
Assessment of Relief and
Transition (SMART)
method (data to be
collected listed in
manual but not
formatted into a tool)
ENA (Emergency
Nutrition Assessment)
software
The Standardised
Monitoring and
Assessment of Relief
and Transition
(SMART) method
The
Standardised
Monitoring and
Assessment of
Relief and
Transition
(SMART)
method
SMART
Capacity
Building
Toolbox
The WHO verbal autopsy
method (not simplified for
crises)
The WHO verbal autopsy
method
• The WHO verbal
autopsy method
• InterVA
• SmartVA
None None n/a
Surveillance
System for Attacks
on Health Care
(SSA)
SSA guidance is in
development
SSA WEB None None Attacks on
Health Care

8
Domain Service Guidance for
design/methodology
Data collection tool(s) Available software
/application
Reporting
Template(s)
Guidance for
interpretation/
use
Other H
ea
lth
Re
sou
rce
s a
nd
Ava
ila
bility
Who, What, Where
(3W) matrix
The GHC is currently
developing and piloting a
Web App with an
accompanying manual for
3Ws.
(Several context-specific
forms are available)
ReportHub
None None n/a
Partners’ List
None None None No Recommended
Template
n/a n/a
Health Resources
Availability
Monitoring System
(HeRAMS)
• HeRAMS user guide:
Approach & Roles and
Responsibilities of the
Cluster
• HeRAMS health services
checklist
None
(Several context-specific
forms are available)
HeRAMS None None HeRAMS
website at
WHO
He
alth
Sy
ste
m P
erf
orm
an
ce
Health
Management
Information System
(HMIS)
(no light HMIS
option is currently
available for
emergency
settings)
None None None None None Possible
options:
UNHCR’s TWINE
in the acute
phase
DHIS 2 in the
protracted
phase.
Vaccination
coverage
estimation
• WHO’s administrative
method for vaccination
coverage estimation
• WHO’s Vaccination
• WHO’s Vaccination
Coverage Cluster
Surveys: Reference
Manual Annex H:
WHO is planning the
development of
standard questionnaires
and R/Stata analysis
WHO’s Vaccination
Coverage Cluster
Surveys: Reference
• WHO’s
Vaccinatio
n Coverage
Cluster
WHO has
launched an e-
course:
Vaccination

9
Domain Service Guidance for
design/methodology
Data collection tool(s) Available software
/application
Reporting
Template(s)
Guidance for
interpretation/
use
Other
(Existing materials
are not designed
for emergencies
and may need
extensive
adaptation for
difficult contexts
with limited data
for sample
selection)
Coverage Cluster
Surveys: Reference
Manual
• Vaccine Coverage Post
Implementation of a
Mass Vaccination
Campaign with Oral
Cholera Vaccine
Sample survey forms
• Vaccine Coverage
Post Implementation
of a Mass
Vaccination
Campaign with Oral
Cholera Vaccine
Appendix 4:
Examples of data
collection forms
Scripts Manual
Surveys:
Reference
Manual
• Vaccine
Coverage
Post
Implementa
tion of a
Mass
Vaccinatio
n
Campaign
with Oral
Cholera
Vaccine
Coverage
Survey Scholar;
UNICEF also
offers related e-
courses
Operational
Indicator
Monitoring
• Global Health Cluster
Suggested Set of Core
Indicators and
Benchmarks by
Category
• Monitoring Framework
under development
Under development
ActivityInfo
None None n/a
Health Cluster
Bulletin
n/a None None Template
None n/a
Ad hoc
Infographics
For tables, graphs,
diagrams, and
dashboards:
• Built-in infographic
functionalities
software/applications
(e.g. Word, Excel,
Access - ActivityInfo,
STATA, SPSS, R, etc…)
For GIS:
• Comparison of
Geographic Information
Systems (GIS) software
n/a For tables, graphs,
diagrams, and
dashboards:
• Built-in infographic
functionalities
software/applications
(e.g. Word, Excel,
Access - ActivityInfo,
STATA, SPSS, R, etc…)
For GIS:
• ArcGIS resource
manuals
None None • ArcGIS
Training from
Esri
• MAPACTION
Humanitarian
Mapping
Training

10
Domain Service Guidance for
design/methodology
Data collection tool(s) Available software
/application
Reporting
Template(s)
Guidance for
interpretation/
use
Other
• ArcGIS resource
manuals
• QGIS resource manuals
• Adobe Illustrator
• Adobe InDesign
• AMCharts
• QGIS resource
manuals
• Adobe Illustrator
• Adobe InDesign
• AMCharts
• Tableau.com
• Power BI
Ad
ditio
na
l M
isc
ella
ne
ou
s
Pu
blic
He
alth
In
form
atio
n
Too
ls &
Re
sou
rce
s
General Templates
for Health Cluster
Documents
n/a n/a n/a • Visual Identity
Guidelines
• Health Cluster
Logo Usage Policy
• Letterhead
template
• Presentation
template
• Document
template
n/a n/a
Table 1: Availability of guidance and applications to support PHIS

11
2. TOOLS FOR MEASURING THE HEALTH STATUS AND THREATS FOR AFFECTED
POPULATIONS
2.1 Public Health Situation Analysis (PHSA)
The Public Health Situation Analysis (PHSA) is a background document, which initially synthesises the already available (i.e. secondary)
data from a wide array of sources to characterize epidemiologic conditions, existing health needs and possible health threats faced by
the crisis-affected population, and is then continuously updated as more information (including from primary data) is gathered. It
identifies the major areas for health action to respond to and recover from the crisis at hand. It is relevant for preparedness as well as
response planning.
PHSA Tools How to use
Public Health Situation Analysis Standard Operating
Procedures This SOP describes the process of creating a PHSA. It is primarily written with the Cluster
Lead Agency in mind.
PHSA (short-form) template – English
PHSA (short-form) template - French
This is the suggested template for developing the initial PHSA that is undertaken in the first
48-72 hours of a new-onset emergency (English and French versions).
PHSA (long-form) template – English
PHSA (long-form) template – French
This is the suggested template for developing the more comprehensive PHSA that builds
upon the initial PHSA and should be completed within undertaken in the first 14 days of a
new-onset emergency and is updated continuously thereafter (English and French
versions).
Table 2: Public Health Situation Analysis Tools
Training for PHSA is included in the curriculum for the joint Health Cluster Coordination Training for Health Cluster Coordinators and
Information Management Officers. Please refer to this link for updates on up and coming courses: http://www.who.int/health-
cluster/capacity-building/training-courses/en/. As of this writing, about 13 countries have PHSAs.

12
2.2 Rapid Assessment
2.2.1 Multi-Sector Initial Rapid Assessment (MIRA) The MIRA is the main inter-cluster approach to joint rapid assessments and is a particularly useful tool
in sudden-onset emergencies. MIRA is a methodology; in each situation, customised data collection
tools are developed for various methods, such as observations, key informant interviews, focus
group discussions, and household surveys. The information is then summarised across sectors,
including health. The contribution of the HC to MIRA may vary depending on the scenario and the
feasibility of collecting data.
The MIRA Toolbox contains the following:
▪ Multi-Sector Initial Rapid Assessment (MIRA) Guidance outlines the key steps required, as well as
associated roles and responsibilities.
▪ MIRA Framework asks key questions to inform initial planning. The role of the Health Cluster is to
provide health-specific inputs into responses for key questions posed by the MIRA framework. A
synthesized PHSA will simplify the process of providing inputs into the MIRA framework.
▪ MIRA Preliminary Scenario Definitions (PSD) Template is produced within the first 72 hours. The role
of the Health Cluster is to provide health-specific inputs into the PSD. A synthesized PHSA will
simplify the process of providing inputs into the MIRA PSD.
▪ MIRA Investigation Forms are generic simplified data collection tools. This template can be used
as is, or elaborated/edited by the Health Cluster when providing health-specific inputs into the
MIRA design of data collection tools and training of enumerators.
▪ MIRA Report Template is where all the information collected in the assessment is synthesized into
a narrative document. The role of the Health Cluster is to provide health-specific inputs into
different sections of the MIRA report. A synthesized PHSA as well as information from the primary
data will simplify the process of providing inputs into the MIRA framework.
▪ Two applications to facilitate the choice of questions and questionnaire design are under
development by ACAPS and US Centers for Disease Control and Prevention (CDC).
Since its introduction in 2012, and subsequent revision in 2015, MIRA has been implemented in
several emergencies and some reports have been published. A good example of a MIRA report
can be found here: Escalation of conflict, Central African Republic, January 2014 (interagency
initiative)

13
Figure 1: Excerpt from health section of MIRA Report (Escalation of conflict, Central African Republic, January
2014 (interagency initiative)):

14

15
2.2.2 Initial Rapid Assessment
The two tools described below can be used by the Health Cluster as they are, or adapted to the
local context. They can be used when organising and coordinating more in-depth, health-specific
rapid assessments, or when supporting individual HC partners with their own local rapid health
assessments.
The Inter-Agency Standing Committee (IASC)’s Health, Nutrition & WASH Clusters jointly developed
an Initial Rapid Assessment (IRA) Tool. Unlike MIRA which is a methodological approach, IRA is a tool
with questionnaires that cover in-depth sectoral information, specifically for health, WASH and
nutrition (it covers population’s risks as well as health facility assessments).
The IRA toolbox contains the following:
▪ Guidance Notes
▪ Field Assessment Form
▪ Secondary Data Template
▪ Data Entry and Reporting Tool
▪ Aide Memoire for Field Teams
▪ Initial Rapid Assessment for Adolescent Sexual and Reproductive Health in Emergency
Settings (adjunct to main tool, developed jointly by Save the Children and UNFPA)
2.2.3 Rapid Health Assessment (RHA) The Global Health Cluster’s Rapid Health Assessment Tool (RHA) is a component of the Inter-Cluster
Rapid Assessment Tool. It can be used is to be used as part of a multi-cluster assessment or as a
stand-alone tool.
The RHA toolbox contains the following:
▪ Guidelines and Comments
▪ Field Questionnaire
▪ Data Compilation Template
▪ Report Template
An updated methodology and tools for RHA is currently under development.
2.3 Humanitarian Emergency Settings Perceived Needs (HESPER) Scale
The Humanitarian Emergency Settings Perceived Needs Scale (HESPER) is a method for assessing
intersectoral perceived needs of populations affected by large-scale crises in a valid and reliable
manner. It is composed of 26 questions including three on health. HESPER information should
complement secondary data and other assessment information in order to compose, and update,
the Public Health Situation Analysis and other sectoral analyses.
The HESPER manual includes the HESPER Scale and a detailed explanation of how to use the HESPER
Scale, how to train interviewers, and how to organise, analyse and report on a HESPER survey.

16
Since its introduction in 2011, the HESPER scale has been used 4 times, including among Syrian
refugees in Turkey in 2014. It remains the only tool that focuses on what crisis-affected populations
perceive as their key needs.
2.4 Early Warning Alert and Response (EWAR)
EWAR is a blanket term for the surveillance and response to acute events of public health concern
(e.g., outbreaks of epidemic-prone diseases). The EWAR function can be implemented through
myriad modalities (sometimes referred to as EWAR Systems, EWARS; or EWAR Networks, EWARN).
EWAR should be viewed as a complement to HMIS, with minimal overlap between the two and a
different frequency of reporting. The event-based focus of EWAR is data-light and can be
implemented rapidly even without indicator-based data reporting. The following tools are available
to support EWAR implementation or strengthening:
▪ Outbreak surveillance and response in humanitarian emergencies: WHO guidelines for
EWARN implementation. This guide provides a standard framework and best current practice
for implementation of an EWAR following a crisis. These guidelines are intended for all
individuals responsible for disease surveillance activities at all levels. The example of Early
Warning Disease Surveillance After a Flood Emergency in Pakistan in 2010 shows how the
different components of EWAR were implemented.
▪ The Global EWARS Project is a simple, lightweight electronic EWAR system that can be
rapidly configured and deployed to support disease surveillance, alert and response in
emergencies. In addition to the application, a start-up kit containing all the hardware
needed to launch the EWAR project in-country (“EWARS in a Box”), is available from WHO.
2.5 Population Mortality Estimation
There are many methods for conducting mortality estimation in crises, depending on the context
and the desired use (advocacy, research, operational planning, etc.). The Standardised Monitoring
and Assessment of Relief and Transition (SMART) method enables survey-based estimation of
anthropometry, mortality rates and vaccination coverage. It is mainly conceived for fairly simple
estimation scenarios. The ENA (Emergency Nutrition Assessment) software supports design, data
management and analysis of SMART mortality and anthropometric surveys. Here is an example of
using the SMART methodology for mortality assessment from the Food Security and Analysis Unit -
Somalia: Guidelines for Emergency Nutrition & Mortality Surveys in Somalia, June 2011.
A manual and automated analysis tool for determining causes of death are available for the WHO's
verbal autopsy method, but is not simplified for crises. Analytical tools for cause of death assignment
using the data collected by the WHO’s verbal autopsy method are InterVA and SmartVA.
2.6 Surveillance System for Attacks on Health Care (SSA) (formerly
Measuring Violence against Health [MVH])
WHO is currently rolling out a Surveillance System of Attacks on Health Care (SSA). The purpose of
the WHO SSA is to systematically collect and make available data on attacks on health care, and
their impact on public health, in countries facing emergencies.
17
The SSA toolbox includes a standard SSA data collection template, a web-enabled secure global
database for data entry and generation of automated infographics and reports, and a scoring
algorithm for verification of reported attacks.
3. TOOLS FOR MEASURING HEALTH RESOURCES AND
SERVICES AVAILABILITY
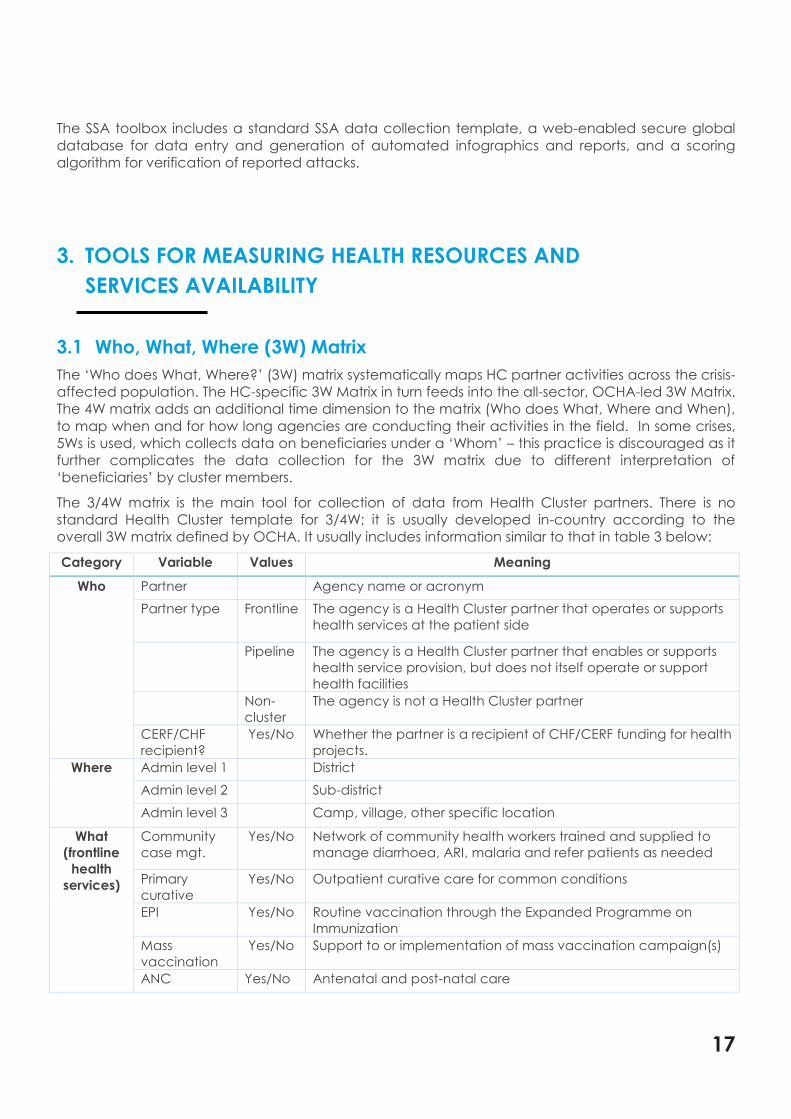
3.1 Who, What, Where (3W) Matrix
The ‘Who does What, Where?’ (3W) matrix systematically maps HC partner activities across the crisis-
affected population. The HC-specific 3W Matrix in turn feeds into the all-sector, OCHA-led 3W Matrix.
The 4W matrix adds an additional time dimension to the matrix (Who does What, Where and When),
to map when and for how long agencies are conducting their activities in the field. In some crises,
5Ws is used, which collects data on beneficiaries under a ‘Whom’ – this practice is discouraged as it
further complicates the data collection for the 3W matrix due to different interpretation of
‘beneficiaries’ by cluster members.
The 3/4W matrix is the main tool for collection of data from Health Cluster partners. There is no
standard Health Cluster template for 3/4W; it is usually developed in-country according to the
overall 3W matrix defined by OCHA. It usually includes information similar to that in table 3 below:
Category Variable Values Meaning
Who Partner Agency name or acronym
Partner type Frontline The agency is a Health Cluster partner that operates or supports
health services at the patient side
Pipeline The agency is a Health Cluster partner that enables or supports
health service provision, but does not itself operate or support
health facilities
Non-
cluster
The agency is not a Health Cluster partner
CERF/CHF
recipient?
Yes/No Whether the partner is a recipient of CHF/CERF funding for health
projects.
Where Admin level 1 District
Admin level 2 Sub-district
Admin level 3 Camp, village, other specific location
What
(frontline
health
services)
Community
case mgt.
Yes/No Network of community health workers trained and supplied to
manage diarrhoea, ARI, malaria and refer patients as needed
Primary
curative
Yes/No Outpatient curative care for common conditions
EPI Yes/No Routine vaccination through the Expanded Programme on
Immunization
Mass
vaccination
Yes/No Support to or implementation of mass vaccination campaign(s)
ANC Yes/No Antenatal and post-natal care

18
BEmONC Yes/No Basic emergency obstetric and neonatal care (includes safe
birth attendance by skilled personnel)
CEmONC Yes/No Comprehensive emergency obstetric and neonatal care
(includes Caesarean section and blood transfusion)
HIV Yes/No Services for people living with HIV (voluntary counselling and
testing, prevention of mother-to-child transmission, and/or
antiretroviral treatment)
TB Yes/No Testing and at least first-line treatment and follow-up of
tuberculosis
SGBV Yes/No Clinical management of sexual and gender-based violence
MHPSS Yes/No Treatment of and referral for mental health and psychosocial
support
Paediatric
secondary
care
Yes/No Paediatric ward
General
secondary
care
Yes/No General adult ward
Surgery and
trauma
Yes/No Surgical management of trauma injuries
Other
(specify)
Yes/No Any other specific services, e.g. vertical neglected tropical
disease programmes, vector control, eye care, etc.
What
(pipeline
health
services)
Funding Yes/No Provision of funding to frontline providers
Drug
donations
Yes/No Donation of kits and other pharmaceutical supplies
Cold chain
and vaccines
Yes/No Provision of cold chain equipment, vaccines and vaccination
supplies
Logistics
support
Yes/No Transport of drugs, patients or medical teams; warehousing;
other logistics support for frontline providers
Coordination Yes/No Health Cluster coordination (national or sub-national)
Health
information
Yes/No Epidemic alert and response, health information on activities,
health service functionality, health service performance, etc.
Traning and
technical
support
Yes/No Capacity building on specific areas of health service provision,
supervision of service quality, creation and dissemination of
technical guidelines and policy
Other
(specify)
Any other pipeline health services
Table 3: Example of information collected for 3W
Some clusters are using ReportHub (supported by iMMAP) as their 3/4W reporting tool, including all
clusters in Afghanistan, and Health, WASH and Nutrition Clusters in Ethiopia. ReportHub has built-in
automated analysis and data visualization features. Once partners submit a report on ReportHub,
cluster indicators become available in real-time and are directly linked to UNOCHA's Humanitarian
Programme Cycle tools for Humanitarian Response Plan reporting.
Once data are collected and compiled, 3W/4W products such as reports, infographics and maps
can be produced.
Many Clusters share their 3/4Ws on humanitarianresponse.info.

19
Figure 2: Excerpt from Health Cluster 3W operational presence map (Conflict, South Sudan, 2017: 3W
operational partners’ presence):
3.2 Partners’ List
The Partners’ List is a constantly updated database of contact details for HC partners, collected
to both facilitate communication among agencies and the work of the HC coordination team.
The main tool here is the partner list template which mainly includes the type of membership in
the cluster, contact details and some information on partner operations and capacities (but
does not duplicate information in the 3Ws or HeRAMS).
There is no standard template for partner lists, but it usually includes the following information:
Agency
Focal point
name
Focal point
designation/job
title
Focal point
email address
Focal point
telephone
number
Date of last
update to
information
Table 4: Example of information collected for partner’s list
Examples of partner lists are:
▪ Cyclone, Fiji, 2016
▪ Nigeria: Health sector Partners Contact List
Many Clusters share their Partner Lists on humanitarianresponse.info.
20
3.3 Health Resources and Services Availability Monitoring System
(HeRAMS)
The Health Resources and Services Availability Monitoring System (HeRAMS) is designed to
systematically monitor the availability of health services to affected populations. It maps all health
delivery points within the crisis-affected area.
The following tools are available to support HeRAMS implementation or strengthening:
▪ HeRAMS user guide: Approach & Roles and Responsibilities of the Cluster. This guide
describes the rationale of HeRAMS, the data levels and requirements and the methodology.
▪ HeRAMS health services checklist. This document describes the key health services to be
delivered at community, mobile, primary, secondary and tertiary levels. The document acts
as a checklist for the services expected at the different levels of care. It is an essential tool
when developing the localised design and data collection materials for HeRAMS in-country.
An online tool has been developed for HeRAMS and is currently hosted by WHO’s HeRAMS platform.
More information on this HeRAMS online tool can be found in this flyer.

21
Figure 3: Excerpt from HeRAMS Report (Conflict, Syria 2016: Annual HeRAMS Report (Turkey Hub) – 3rd Quarter
2016 Snapshot for Public Health Centres in Syria (WHO Syria Country Office)):
22
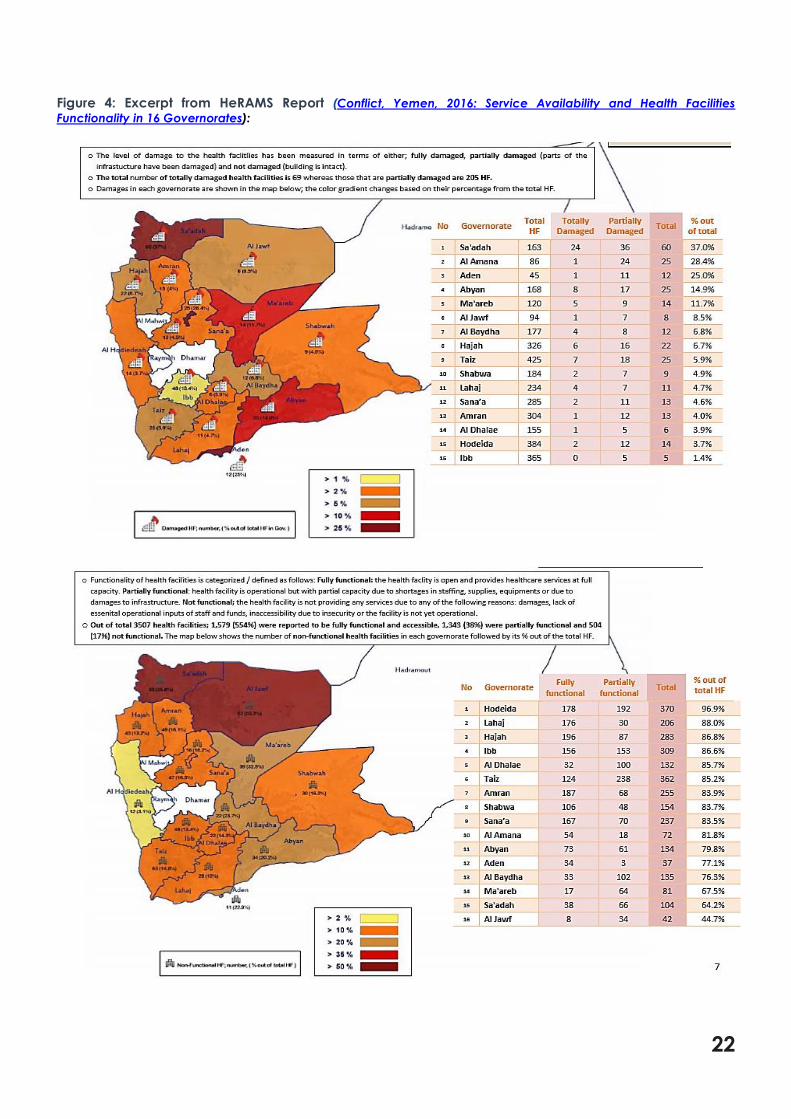
Figure 4: Excerpt from HeRAMS Report (Conflict, Yemen, 2016: Service Availability and Health Facilities
Functionality in 16 Governorates):
23
4. TOOLS FOR MEASURING HEALTH SYSTEM PERFORMANCE
4.1 Health Management Information System (HMIS)
A Health Management Information System (HMIS) collects, analyses and reports data from health
providers and facilities on causes of consultation and hospitalisation, services and patient clinical
outcomes. The role of the HC is usually to support and improve existing HMIS in-country, and
harmonise the different HMIS implemented by HC partners, by introducing a common set of
indicators, data collection instruments and procedures, health facility datasets, catchment
population assumptions, software application, etc…. In rare occasions where there is no existing
HMIS in-country, the HC should support local health authorities and HC partners in setting up an
HMIS.
The most widely used HMIS in most crisis-affected countries is District Health Information Software 2
(DHIS 2). This data analytics and management platform is completely web-based and has built-in
visualization and analysis features. Extensive guidance on tools needed to implement and support
DHIS2 operations can be found here. As DHIS 2 can be resource-intensive to implement,
development of a lighter version for crisis settings is under discussion.
In acute crises, UNHCR’s TWINE is a possible existing option, and works especially well in camp and
urban settings. Generic forms and complete guidance for roll-out is available on the website.
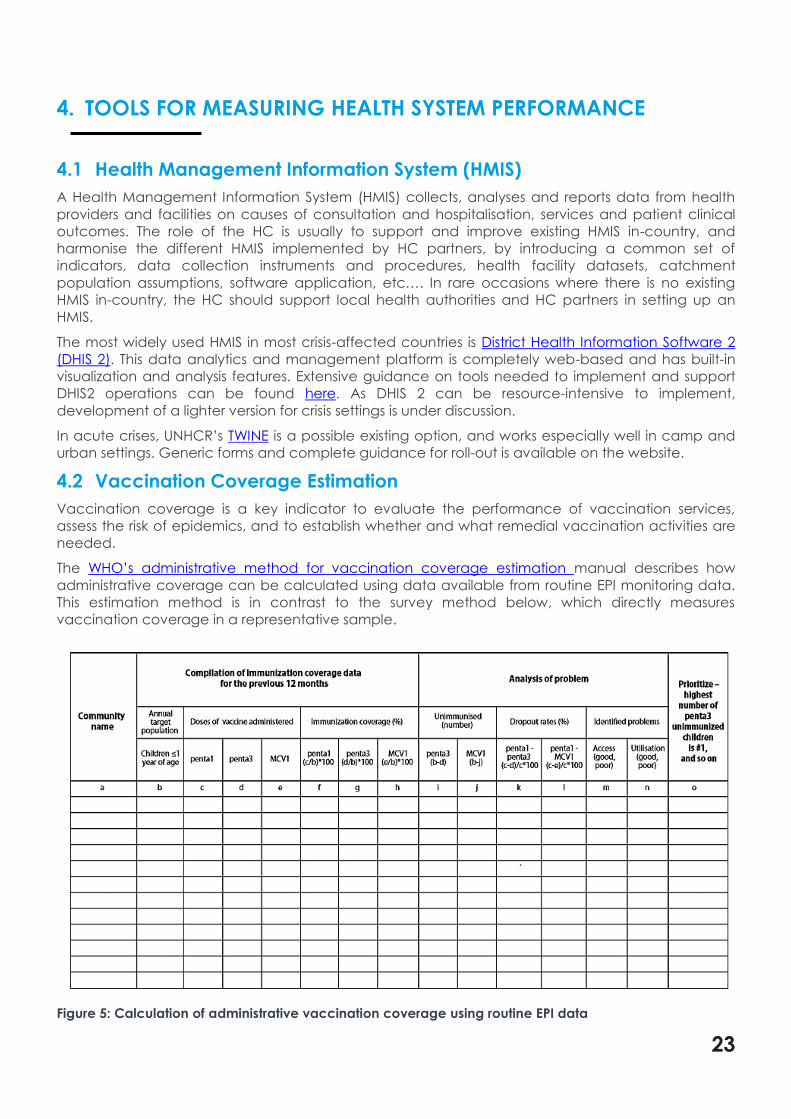
4.2 Vaccination Coverage Estimation
Vaccination coverage is a key indicator to evaluate the performance of vaccination services,
assess the risk of epidemics, and to establish whether and what remedial vaccination activities are
needed.
The WHO’s administrative method for vaccination coverage estimation manual describes how
administrative coverage can be calculated using data available from routine EPI monitoring data.
This estimation method is in contrast to the survey method below, which directly measures
vaccination coverage in a representative sample.
Figure 5: Calculation of administrative vaccination coverage using routine EPI data

24
The WHO’s Vaccination Coverage Cluster Surveys: Reference Manual covers the design of the
sampling frame, planning and implementing the fieldwork, data entry, cleaning, and management,
tabulations and analyses, as well as interpretation, formatting, and sharing results.
In addition, a separate set of guidelines exists for Vaccine Coverage Post Implementation of a Mass
Vaccination Campaign with Oral Cholera Vaccine, and follows a similar cluster sampling method as
outlined in the Reference Manual above.
Figure 6: Excerpt from Vaccination Coverage Report (Conflict/Cholera Outbreak, Iraq, 2015):
WHO has launched a learning initiative aimed at epidemiologists and statisticians interested in
leading or supporting vaccination coverage surveys, the Vaccination Coverage Survey Scholar.
Those interested are encouraged to regularly check the WHO Immunization M&E webpage as well
as TechNet-21 for future course announcements as well as to access material on vaccination
coverage surveys. UNICEF also offers related e-courses.
Other tools under development include software with standard code for analysing immunization
survey data, training materials and methods, a step-by-step guide to survey implementation, and a
discussion paper on defining the role of coverage surveys.

25
4.3 Operational Indicator Monitoring
The Operational Indicator Monitoring (OIM) service aggregates and reports a small set of key
performance indicators for the HC response as a whole. OIM captures data generated by HC
partners and other systems, e.g. HMIS (see above). The process for doing so is necessarily different in
every HC, depending on available data sources. A framework for capturing core and
supplementary OIM indicators, and a software platform to do so, are under development. One
currently commonly used platform for OIM is the ActivityInfo Monitoring & Evaluation software for
humanitarian operations.
Below are some of useful tools to support the process:
▪ Global Health Cluster Suggested Set of Core Indicators and Benchmarks by Category : an
excerpt from the Health Cluster Guide
▪ Indicators Registry: The indicators listed in the registry have been developed by the global
clusters. It is recommended to adopt and use the indicators listed as ‘key’ to allow
comparison of needs and response monitoring across countries
After data collection and analysis, various products using OIM information can be generated.
Figure 7: Excerpt from Health Indicators Report (Conflict, Syria, 2017: Health indicators report - April 2017):

26
4.4 Health Cluster Bulletin
The Health Cluster Bulletin is a frequent publication that provides an overview of the main public
health needs, key health information including trends, and activities of HC partners. The Health
Cluster Bulletin’s purpose is mainly to keep all HC partners and other stakeholders informed of Health
Cluster activities.
A typical Health Cluster Bulletin should have the following structure:
▪ cover page with title, crisis name, reporting period, HC partners and observers;
▪ highlights of the previous time period (since publication of the last bulletin);
▪ information from health assessments during the time period;
▪ information from different surveillance / monitoring systems during the time period;
▪ summary needs and gaps during the time period;
▪ information about/from coordination meetings during the time period;
▪ agency activities during the time period;
▪ capacity building during the time period;
▪ funds requested and received during the time period;
▪ useful contact details, including key staff at national and/or at each sub-national level where
the humanitarian activities are ongoing
The Health Cluster Bulletin template can be found here.
4.5 Ad hoc Infographics
Infographics are typically commissioned by the HCC or prepared by an IMO to complement and
help illustrate information arising from other public health information services, e.g. the PHSA, a HC
Bulletin, or a HeRAMS report. Occasionally, they may be presented as a standalone information
product, or included in presentations for various audiences. Infographics for PHIS can include tables,
graphs, diagrams, dashboards or maps.
▪ Tools for tables, graphs, diagrams, and dashboards:
• Automated/built-in infographic functionalities of word processing, spreadsheet and
database management software/applications (e.g. Microsoft’s Word, Excel, Access).
• Automated/built in infographic functionalities of data collection, analysis and reporting
software (e.g. ActivityInfo, STATA, SPSS, R, etc…)
▪ Tools for maps:
• ArcGIS (proprietary) with resource manuals
• QGIS (open-access) with resource manuals
• ArcGIS Training from Esri
• MAPACTION Humanitarian Mapping Training
A comparison of commonly used mapping tools can be found here.

27
Figure 8: Excerpt from Health Cluster Dashboard (Conflict, Afghanistan, 2017):

28
5. MISCELLANOUS PUBLIC HEALTH INFORMATION TOOLS &
RESOURCES
5.1 General Templates
The GHC has developed branding guidelines and general templates for Health Cluster products.
These include:
▪ Health Cluster Visual Identity Guidelines
▪ Health Cluster Logo Usage Policy
▪ Health Cluster letterhead template (Word)
▪ Health Cluster presentation template (PowerPoint)
▪ Health Cluster document template (Word)
5.2 Other Resources
Here are some miscellaneous tools that may be of use to PHIS functions in activated clusters.
▪ Field Guide for the Use of Geo-Codes: provides an overview of the use of geographic coding
(known as geo-codes) or position codes (known as P-codes), which define unique
identification numbers for areas and facilities.