Embed Size (px)
Citation preview

Public Health Surveillance
Alberto Maria Segre
Department of Computer Science
The University of Iowa
Iowa City, IA 52246
http://compepi.cs.uiowa.edu/

What is Surveillance?
‘‘The continuous, systematic collection, analysis, and interpretation of health-
related data needed for the planning, implementation, and evaluation of public
health practice.’’
The goal is to tie disease activity to geographic location.
Serves as an early warning system for impending public health emergencies.
Documents the impact of an intervention, or tracks progress towards specified
goals, such as mitigation or containment.
Monitors and clarifies the epidemiology of health problems, informing public
health policy and strategies.

Syndromic Surveillance
Syndromic means ‘‘factors related to disease,’’ e.g., symptoms.
Syndromic surveillance samples and collects disease-related data to impute the
speed, size and tempo of an outbreak. When does it start? How fast does it grow?
How long does it last?
As an example, when tracking influenza, we track %ILI, or ‘‘percent influenza-
like illness,’’ defined as the proportion of outpatients seen with ‘‘fever of 37.8C
or higher combined with a cough and/or sore throat but no other apparent cause.’’
Other, non syndromic, surveillance systems might track factors on the periphery
of real disease data, such as people’s perceptions of disease, or other behaviors
(e.g., hand hygiene, cell-phone social distancing measures) that are indirectly
related to disease.

Example: Google Flu Trends
In 2008, Google flu trends used Google search term frequency and (geographic)
origin to track %ILI by geographic area.
Flu trends used IP address location from the search to determine geographic area,
anonymizing individual user queries by aggregating up.
They reported surprising accuracy values, and seemed to ‘‘lead’’ CDC’s ability to
estimate onset and peak of the curve by about two weeks.
Unfortunately, in 2013 Google flu trends spectacularly underperformed. Why?

Example: Google Flu Trends
Goodle flu trends overfits the data.
People who search for flu aren’t really good at diagnosing flu; "cough" and
"fever" are not specific to flu, and searches for individual flu-like symptoms may
not meet the definition of ILI.
Correlation is not causality; some accused Google flu trends of simply predicting
"winter."
Searches for flu related issue closely track news about the flu; later, Google
corrected for prevalence of flu in news.

Example: Using Twitter to Monitor Public Health Concerns
During the 2009 H1N1 swine flu epidemic (originating in Mexico and US), we
quickly assembled a system to collect all tweets that contained what we
determined were influenza-related words.
A total of 686,812 H1N1-related tweets out of 607,576,369 total tweets in a
5-week period starting 4/28/09.
Each tweet contains a geolocation code: sometimes, the mobile device reports
GPS coordinates; other times, we used the user’s self-declared home location.
We were hoping that tweet analysis would provide an inexpensive way to
determine not only levels of anxiety and concern but also to gauge response to
news and official public health messaging.

Example: Using Twitter to Monitor Public Health Concerns
0
1
2
3
4
5
6
7
8
9
Oct 01 Nov 01 Dec 01 Jan 01 Feb 01 Mar 01 Apr 01 May 01
ILI%
Date
Weekly Reported and Estimated ILI% (Nationwide)
EstimatedReported
Overall performance.

Example: Using Twitter to Monitor Public Health Concerns
0
1
2
3
4
5
6
7
8
9
Oct 01 Nov 01 Dec 01 Jan 01 Feb 01 Mar 01 Apr 01 May 01
ILI%
Date
Weekly Reported and Estimated ILI% (CDC Region 2)
EstimatedReported
Out-of-sample validation: predicting region 2 ILI from other region’s tweets.

Live Twitter Feed for H1N1 Swine Flu

Example: Craigslist, Internet-Mediated Anonymous Sex, and STDs
The reemergence of syphilis at the end of the 1990’s is likely due to the advent of
internet-mediated anonymous sexual encounters, most typically within the MSM
community.
This community accounts for about 2% of the population, but 63% of new HIV
cases, which are not uniformly distributed among racial and ethnic MSM
subpopulations.
Understanding the online hookup market is a critical step to understanding STD
disparities and designing effective public health interventions.
In 2008-10, we collected 136M Craigslist personals ads to understand the
geographic footprints and sexual behaviors of anonymous casual sex-seeking
individuals in order to understand their impact on STD transmission.

Example: Craigslist, Internet-Mediated Anonymous Sex, and STDs
In collaboration with the Boston Department of Public Health, we were able to
use the Craigslist corpus to build an accurate picture of risky sexual behaviors at
very high geographic resolution.
http://vimeo.com/48687015

Example: Craigslist, Internet-Mediated Anonymous Sex, and STDs
These projects, as well as our work on instrumenting HCWs and monitoring
hand-hygiene compliance, can be seen as surveillance efforts, but they are not
really syndromic surveillance.
To some degree, they all exhibit the same problems as Google Flu Trends
(overfitting, correlation/causality, etc.).
The paper we discuss today is different; maybe less sexy from a big data
perspective, but it relies on professionals making judgments about actual
symptoms, rather than indirect measurements of behaviors or effects of disease.

Sentinel Surveillance
IDPH runs an ILI surveillence network using volunteer sentinel providers.
These volunteer sentinel providers report their weekly patient visits and the
number of patients with ILI.
Because they are not paid for their efforts, these providers represent a
convenience sample of pediatricians, internists, family practice physicians, group
practices and hospital clinics.
Not everyone volunteers; there are some costs, which are largely supported by the
providers, as well as IDPH.
The assigned paper addresses a very specific issue: how can we get the best
information while minimizing cost?

Optimizing Influenza Surveillance
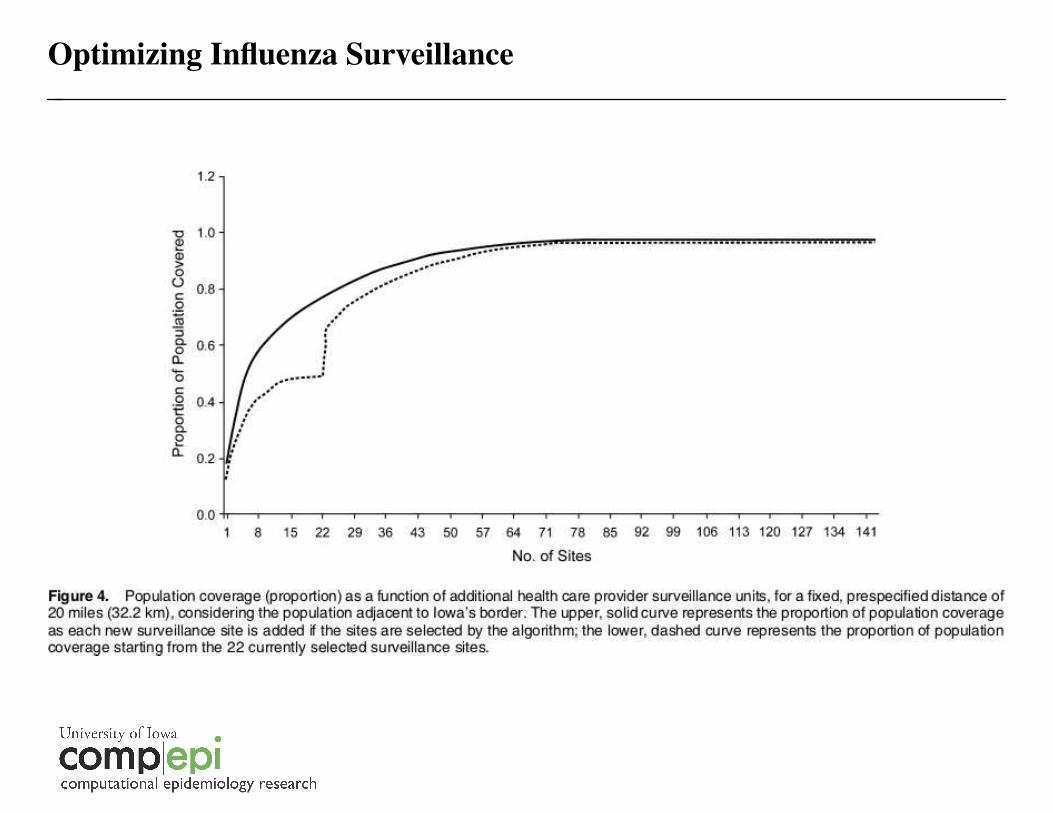
Because the network is all volunteer, the 22 existing 2009 surveillance sites were
not placed in geographically optimal locations.
Are the sites truly representative of the extend of disease? Do they capture
sufficient activity? How does one choose the ‘‘best’’ sites?
As usual, what emerges is a location optimization problem, where a utility
function needs to be formulated to meet some defined surveillance goal.
One view is to treat this as a facilities location problem, where we maximize the
population "covered" within a certain geographic radius from each sentinel
location.

Optimizing Influenza Surveillance
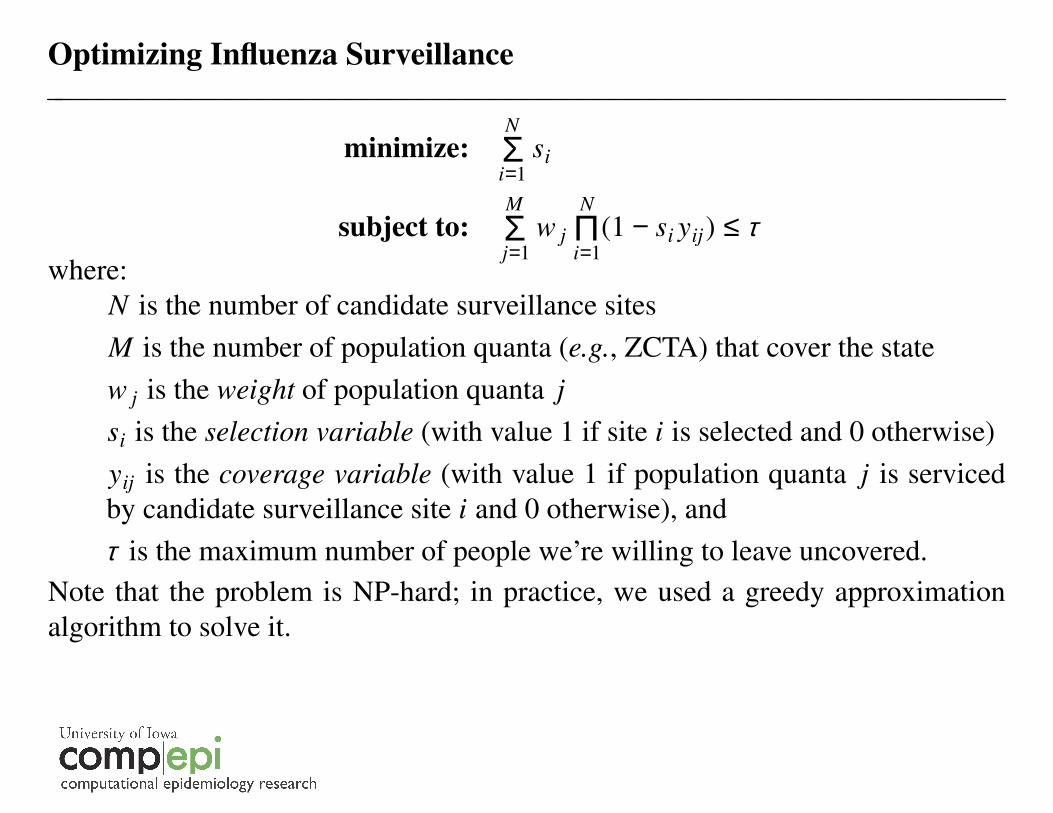
Optimizing Influenza Surveillance
minimize:N
i=1Σ si
subject to:M
j=1Σ w j
N
i=1Π(1 − si yij) ≤ τ
where:
N is the number of candidate surveillance sites
M is the number of population quanta (e.g., ZCTA) that cover the state
w j is the weight of population quanta j
si is the selection variable (with value 1 if site i is selected and 0 otherwise)
yij is the coverage variable (with value 1 if population quanta j is serviced
by candidate surveillance site i and 0 otherwise), and
τ is the maximum number of people we’re willing to leave uncovered.
Note that the problem is NP-hard; in practice, we used a greedy approximation
algorithm to solve it.


Optimizing Influenza Surveillance
Optimizing Influenza Surveillance
There are a number of underlying assumptions. First, influenza does not respect
political borders. There is much more activity in Council Bluffs than what can be
accounted for by Council Bluffs alone.
Second, we assume travel and mixing are uniform by distance, and not by time
(can you find I80 on the map?).
Third, assumes all individuals are equal, and at equal risk for disease: is
"maximal coverage" even the right utility function?
Fourth, assumes each sentinel site has unlimited capacity for, e.g., testing, and
therefore doesn’t ever miss a case regardless of how busy they might be.
Optimizing Influenza Surveillance


Optimizing Influenza Surveillance
A subsequent paper addresses a few more of these issues and poses a slightly
different question: if designing a network, how many sites do we need?
Fairchild, Polgreen, Foster, Rushton and Segre (2013), ‘‘How Many Suffice? A
Computational Framework for Sizing Sentinel Surveillance Networks,’’ in
International Journal of Health Geographics 12:56

Optimizing Influenza Surveillance
The paper describes a capacitated maximal coverage that limits each site to a
certain capacity, allowing multiple sites to be co-located if capacity requires it.
It compares both capacitated and non-capacitated MCMs with an alternative k-
median model that minimizes the sum of the distances from each individual to
their nearest site.
It uses the Huff metric, a probabilistic geographic measure that captures the
chance that a case will be ‘‘noticed’’ in a sentinel site’s catchment area to
evaluate performance of the network (and not simply maximal coverage).
Finally, it uses simulation to optimize the size of the surveillance network for
both intensity and timing of outbreaks based on eight years of Medicaid data and
the Huff metric.