Embed Size (px)
Citation preview
Public health trends of foodborne diseasesSalmonella, Campylobacter and Listeria in Belgium as examples
Niko Speybroeck1, Brecht Devleesschauwer2, Lamarana Diallo1,Dirk Berkvens3, Sophie Bertrand4, Olivier Vandenberg5, Juanita
Haagsma6, Arie Havelaar2, Luc Vanholme7, Sophie Quoilin5, PatrickBrandt8, and Charline Maertens de Noordhout1
1Université catholique de Louvain, Brussels 2University of Florida, Florida 3Institute of Tropical Medicine,Antwerp 4Institute of Public Health, Brussels 5Saint-Pierre University hospital, Brussels 6Erasmus,Rotterdam 7Federal Agency for the Safety of the Food Chain, Brussels 8University of Texas, Dallas
Symposium of the Scientific Committee of the Belgian Food Safety Agency11/03/2016
(Belgian Food Safety Agency Symposium) Public health trends of foodborne diseases March 2016 1 / 29
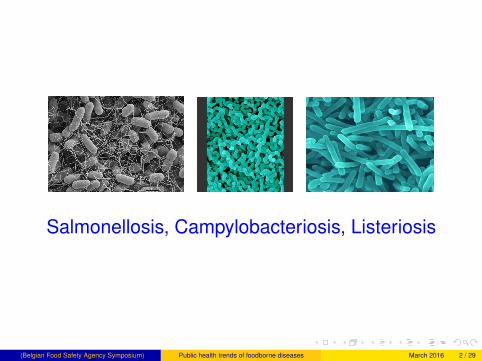
Salmonellosis, Campylobacteriosis, Listeriosis
(Belgian Food Safety Agency Symposium) Public health trends of foodborne diseases March 2016 2 / 29
Salmonellosis, Campylobacteriosis, Listeriosis
The Question...
(Belgian Food Safety Agency Symposium) Public health trends of foodborne diseases March 2016 3 / 29
Temporal: Time
(Belgian Food Safety Agency Symposium) Public health trends of foodborne diseases March 2016 4 / 29

S...
(Belgian Food Safety Agency Symposium) Public health trends of foodborne diseases March 2016 4 / 29
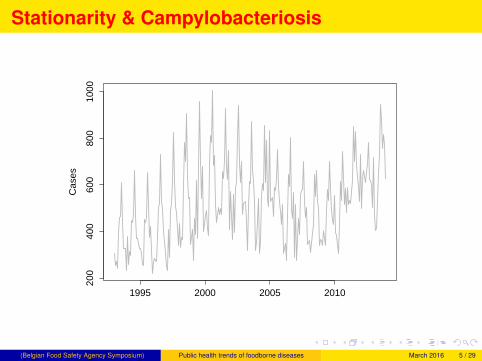
Stationarity & Campylobacteriosis
Cas
es
1995 2000 2005 2010
200
400
600
800
1000
(Belgian Food Safety Agency Symposium) Public health trends of foodborne diseases March 2016 5 / 29
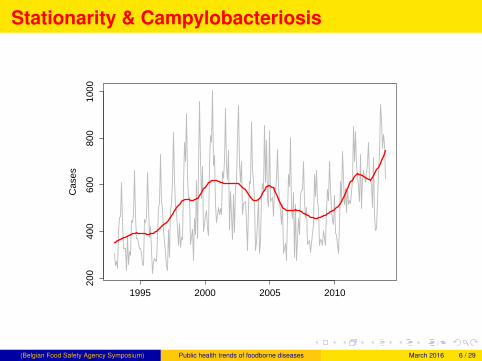
Stationarity & Campylobacteriosis
Cas
es
1995 2000 2005 2010
200
400
600
800
1000
(Belgian Food Safety Agency Symposium) Public health trends of foodborne diseases March 2016 6 / 29
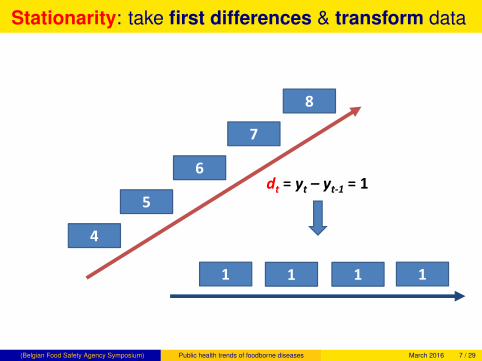
Stationarity: take first differences & transform data
45
67
8
dt = yt – yt-1 = 1
1 1 1 1
(Belgian Food Safety Agency Symposium) Public health trends of foodborne diseases March 2016 7 / 29
Correlation ⇒Auto-Correlation
(Belgian Food Safety Agency Symposium) Public health trends of foodborne diseases March 2016 7 / 29
Auto-correlation
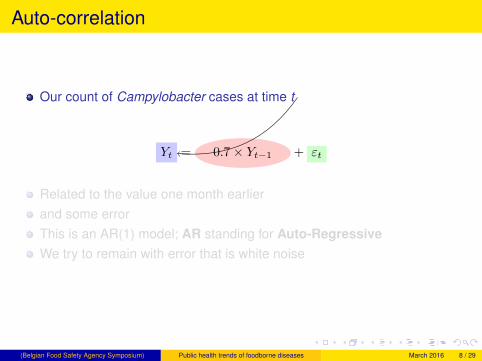
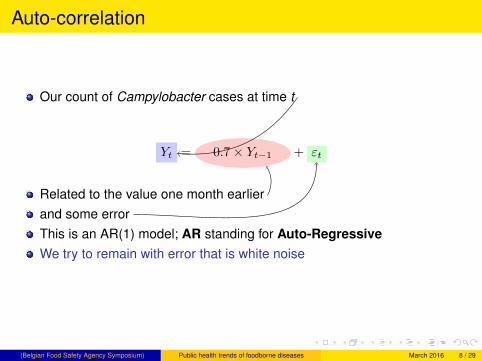
Our count of Campylobacter cases at time t
Yt = 0.7× Yt−1 + εt
Related to the value one month earlierand some errorThis is an AR(1) model; AR standing for Auto-RegressiveWe try to remain with error that is white noise
(Belgian Food Safety Agency Symposium) Public health trends of foodborne diseases March 2016 8 / 29
Auto-correlation
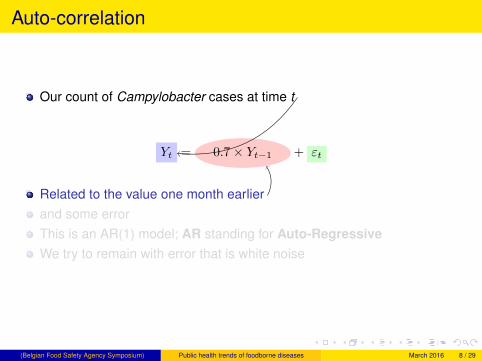
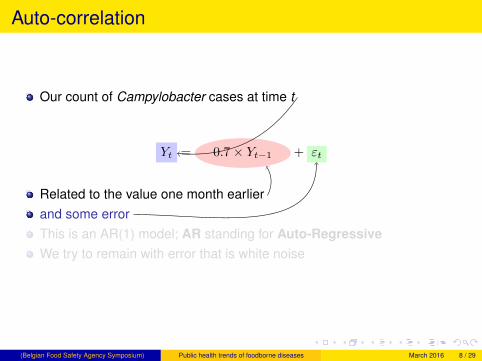
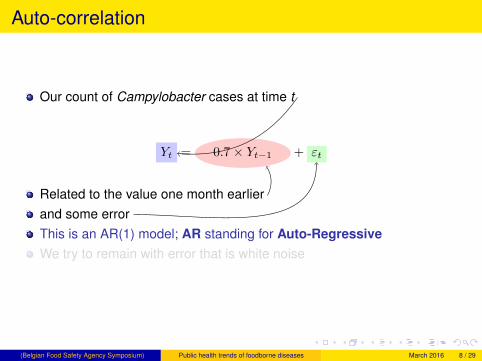
Our count of Campylobacter cases at time t
Yt = 0.7× Yt−1 + εt
Related to the value one month earlierand some errorThis is an AR(1) model; AR standing for Auto-RegressiveWe try to remain with error that is white noise
(Belgian Food Safety Agency Symposium) Public health trends of foodborne diseases March 2016 8 / 29
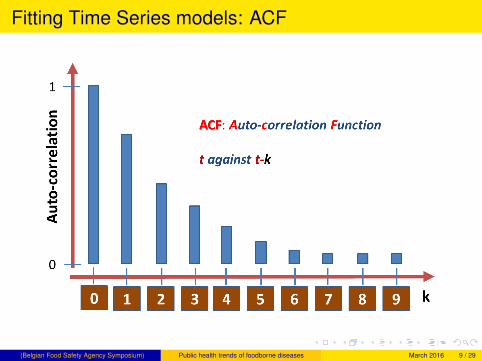
Fitting Time Series models: ACF
(Belgian Food Safety Agency Symposium) Public health trends of foodborne diseases March 2016 9 / 29
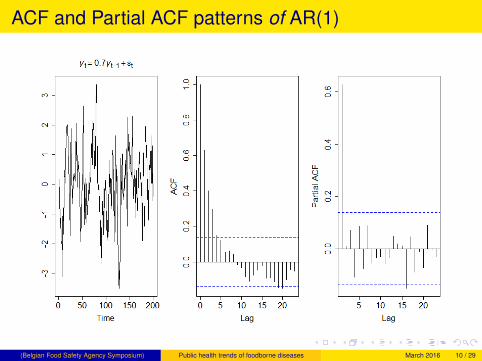
ACF and Partial ACF patterns of AR(1)
(Belgian Food Safety Agency Symposium) Public health trends of foodborne diseases March 2016 10 / 29
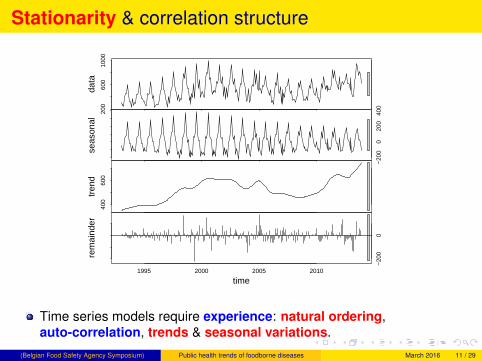
Stationarity & correlation structure
200
600
1000
data
−20
00
200
400
seas
onal
400
600
tren
d
−20
00
1995 2000 2005 2010
rem
aind
er
time
Time series models require experience: natural ordering,auto-correlation, trends & seasonal variations.
(Belgian Food Safety Agency Symposium) Public health trends of foodborne diseases March 2016 11 / 29
Fitting Time Series models: Basic Steps
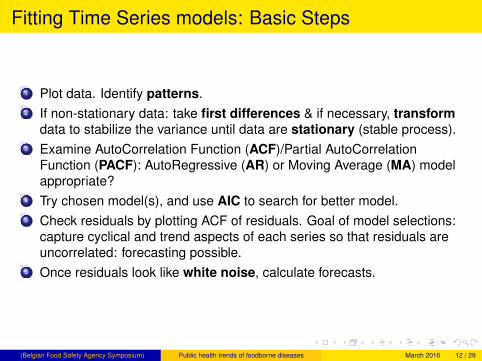
1 Plot data. Identify patterns.2 If non-stationary data: take first differences & if necessary, transform
data to stabilize the variance until data are stationary (stable process).3 Examine AutoCorrelation Function (ACF)/Partial AutoCorrelation
Function (PACF): AutoRegressive (AR) or Moving Average (MA) modelappropriate?
4 Try chosen model(s), and use AIC to search for better model.5 Check residuals by plotting ACF of residuals. Goal of model selections:
capture cyclical and trend aspects of each series so that residuals areuncorrelated: forecasting possible.
6 Once residuals look like white noise, calculate forecasts.
(Belgian Food Safety Agency Symposium) Public health trends of foodborne diseases March 2016 12 / 29
From data to forecasting
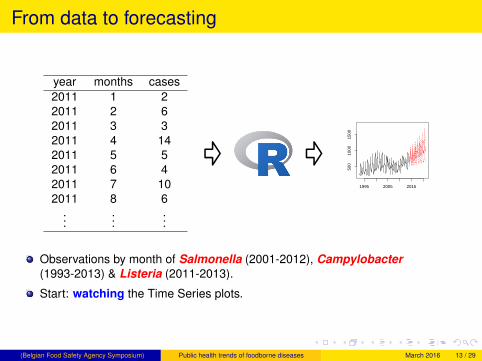
year months cases2011 1 22011 2 62011 3 32011 4 142011 5 52011 6 42011 7 102011 8 6
......
...
1995 2005 2015
500
1000
1500
Observations by month of Salmonella (2001-2012), Campylobacter(1993-2013) & Listeria (2011-2013).
Start: watching the Time Series plots.
(Belgian Food Safety Agency Symposium) Public health trends of foodborne diseases March 2016 13 / 29
The data: Salmonella
050
010
0015
0020
00C
ases
Sal
mon
ella
Jan 2001
Jan 2002
Jan 2003
Jan 2004
Jan 2005
Jan 2006
Jan 2007
Jan 2008
Jan 2009
Jan 2010
Jan 2011
Jan 2012
Month
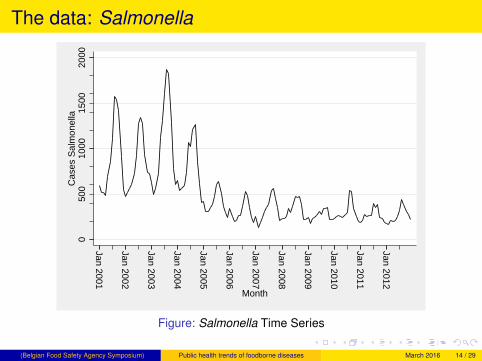
Figure: Salmonella Time Series
(Belgian Food Safety Agency Symposium) Public health trends of foodborne diseases March 2016 14 / 29
The data: Campylobacter
200
400
600
800
1000
Cas
es C
ampy
loba
cter
Jan 1992
Jan 1994
Jan 1996
Jan 1998
Jan 2000
Jan 2002
Jan 2004
Jan 2006
Jan 2008
Jan 2010
Jan 2012
Jan 2014
Month
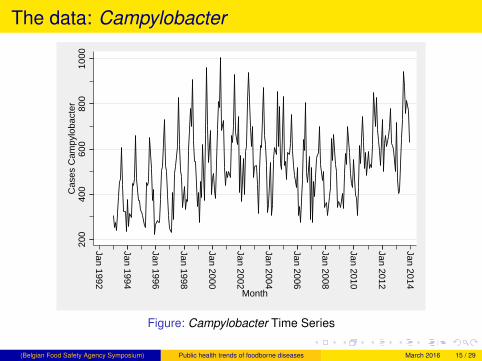
Figure: Campylobacter Time Series
(Belgian Food Safety Agency Symposium) Public health trends of foodborne diseases March 2016 15 / 29
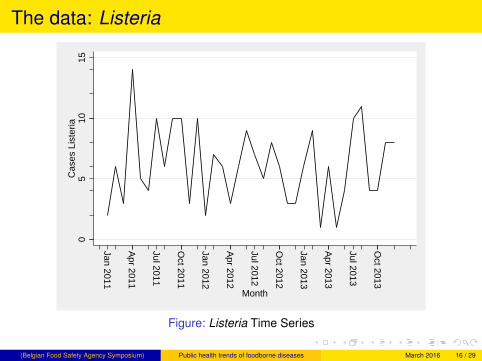
The data: Listeria
05
1015
Cas
es L
iste
ria
Jan 2011
Apr 2011
Jul 2011
Oct 2011
Jan 2012
Apr 2012
Jul 2012
Oct 2012
Jan 2013
Apr 2013
Jul 2013
Oct 2013
Month
Figure: Listeria Time Series
(Belgian Food Safety Agency Symposium) Public health trends of foodborne diseases March 2016 16 / 29
Exploratory work0
500
1000
1500
2000
Cas
es S
alm
onel
la
Jan 2001
Jan 2002
Jan 2003
Jan 2004
Jan 2005
Jan 2006
Jan 2007
Jan 2008
Jan 2009
Jan 2010
Jan 2011
Jan 2012
Month
200
400
600
800
1000
Cas
es C
ampy
loba
cter
Jan 1992
Jan 1994
Jan 1996
Jan 1998
Jan 2000
Jan 2002
Jan 2004
Jan 2006
Jan 2008
Jan 2010
Jan 2012
Jan 2014
Month
05
1015
Cas
es L
iste
ria
Jan 2011
Apr 2011
Jul 2011
Oct 2011
Jan 2012
Apr 2012
Jul 2012
Oct 2012
Jan 2013
Apr 2013
Jul 2013
Oct 2013
Month
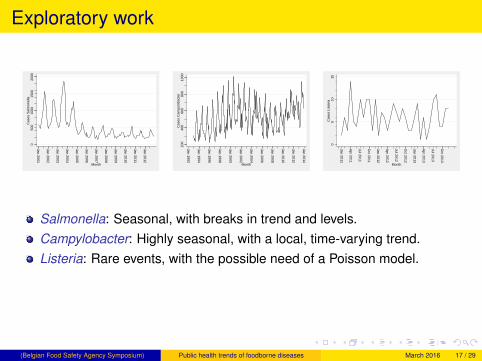
Salmonella: Seasonal, with breaks in trend and levels.Campylobacter: Highly seasonal, with a local, time-varying trend.Listeria: Rare events, with the possible need of a Poisson model.
(Belgian Food Safety Agency Symposium) Public health trends of foodborne diseases March 2016 17 / 29
Models Selected0
500
1000
1500
2000
Cas
es S
alm
onel
la
Jan 2001
Jan 2002
Jan 2003
Jan 2004
Jan 2005
Jan 2006
Jan 2007
Jan 2008
Jan 2009
Jan 2010
Jan 2011
Jan 2012
Month
200
400
600
800
1000
Cas
es C
ampy
loba
cter
Jan 1992
Jan 1994
Jan 1996
Jan 1998
Jan 2000
Jan 2002
Jan 2004
Jan 2006
Jan 2008
Jan 2010
Jan 2012
Jan 2014
Month
05
1015
Cas
es L
iste
ria
Jan 2011
Apr 2011
Jul 2011
Oct 2011
Jan 2012
Apr 2012
Jul 2012
Oct 2012
Jan 2013
Apr 2013
Jul 2013
Oct 2013
Month
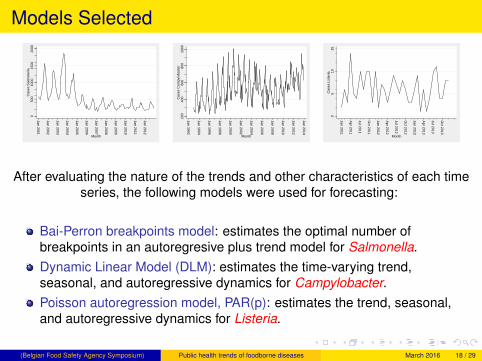
After evaluating the nature of the trends and other characteristics of each timeseries, the following models were used for forecasting:
Bai-Perron breakpoints model: estimates the optimal number ofbreakpoints in an autoregresive plus trend model for Salmonella.Dynamic Linear Model (DLM): estimates the time-varying trend,seasonal, and autoregressive dynamics for Campylobacter.Poisson autoregression model, PAR(p): estimates the trend, seasonal,and autoregressive dynamics for Listeria.
(Belgian Food Safety Agency Symposium) Public health trends of foodborne diseases March 2016 18 / 29
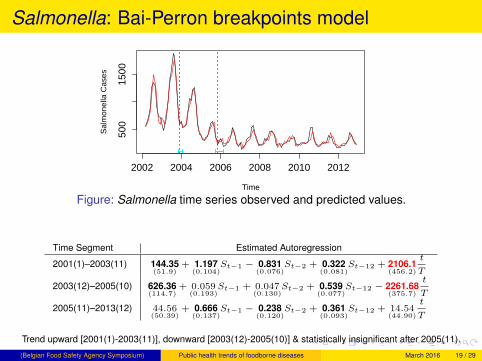
Salmonella: Bai-Perron breakpoints model
Time
Sal
mon
ella
Cas
es
2002 2004 2006 2008 2010 2012
500
1500
Figure: Salmonella time series observed and predicted values.
Time Segment Estimated Autoregression
2001(1)–2003(11) 144.35(51.9)
+ 1.197(0.104)
St−1 − 0.831(0.076)
St−2 + 0.322(0.081)
St−12 + 2106.1(456.2)
t
T
2003(12)–2005(10) 626.36(114.7)
+ 0.059(0.193)
St−1 + 0.047(0.130)
St−2 + 0.539(0.077)
St−12 − 2261.68(375.7)
t
T
2005(11)–2013(12) 44.56(50.39)
+ 0.666(0.137)
St−1 − 0.238(0.120)
St−2 + 0.361(0.093)
St−12 + 14.54(44.90)
t
T
Trend upward [2001(1)-2003(11)], downward [2003(12)-2005(10)] & statistically insignificant after 2005(11).
(Belgian Food Safety Agency Symposium) Public health trends of foodborne diseases March 2016 19 / 29
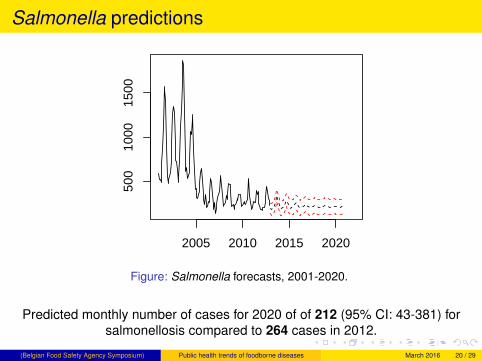
Salmonella predictions
2005 2010 2015 2020
500
1000
1500
Figure: Salmonella forecasts, 2001-2020.
Predicted monthly number of cases for 2020 of of 212 (95% CI: 43-381) forsalmonellosis compared to 264 cases in 2012.
(Belgian Food Safety Agency Symposium) Public health trends of foodborne diseases March 2016 20 / 29
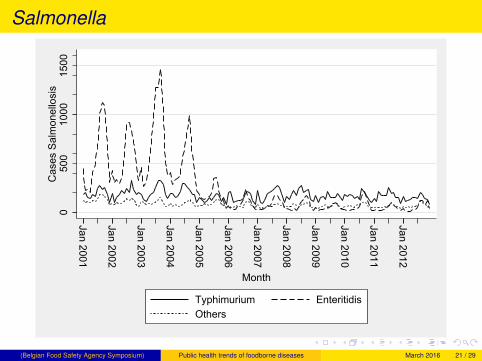
Salmonella
050
010
0015
00C
ases
Sal
mon
ello
sis
Jan 2001
Jan 2002
Jan 2003
Jan 2004
Jan 2005
Jan 2006
Jan 2007
Jan 2008
Jan 2009
Jan 2010
Jan 2011
Jan 2012
Month
Typhimurium EnteritidisOthers
(Belgian Food Safety Agency Symposium) Public health trends of foodborne diseases March 2016 21 / 29
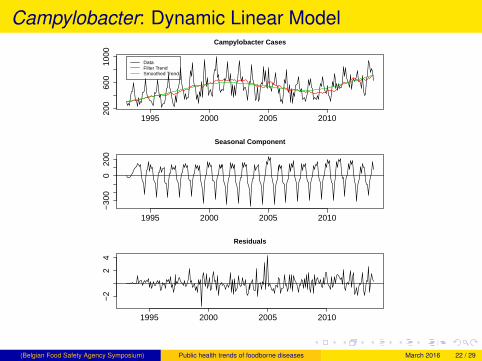
Campylobacter: Dynamic Linear ModelCampylobacter Cases
1995 2000 2005 2010
200
600
1000
DataFilter TrendSmoothed Trend
Seasonal Component
1995 2000 2005 2010
−30
00
200
Residuals
1995 2000 2005 2010
−2
24
(Belgian Food Safety Agency Symposium) Public health trends of foodborne diseases March 2016 22 / 29
Dynamic Linear Model: Trying to follow the coast-line
(Belgian Food Safety Agency Symposium) Public health trends of foodborne diseases March 2016 23 / 29
Campylobacter predictions
1995 2005 2015
500
1000
1500
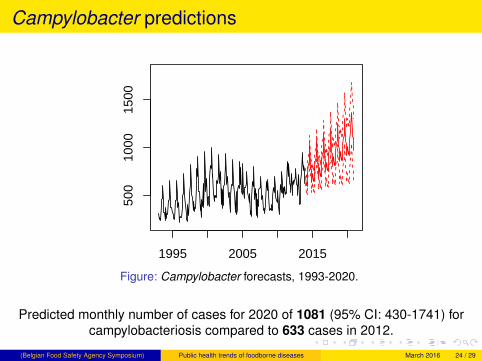
Figure: Campylobacter forecasts, 1993-2020.
Predicted monthly number of cases for 2020 of 1081 (95% CI: 430-1741) forcampylobacteriosis compared to 633 cases in 2012.
(Belgian Food Safety Agency Symposium) Public health trends of foodborne diseases March 2016 24 / 29
Listeria: Poisson autoregression model
24
68
1014
2011 2012 2013 2014
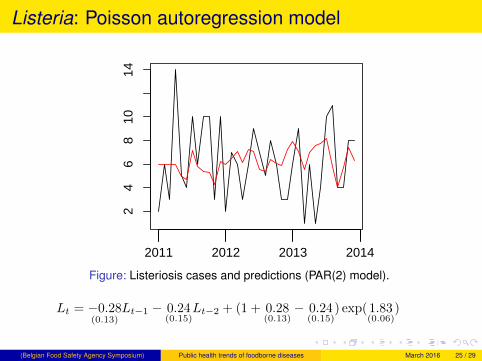
Figure: Listeriosis cases and predictions (PAR(2) model).
Lt = −0.28(0.13)
Lt−1 − 0.24(0.15)
Lt−2 + (1 + 0.28(0.13)
− 0.24(0.15)
) exp(1.83(0.06)
)
(Belgian Food Safety Agency Symposium) Public health trends of foodborne diseases March 2016 25 / 29
Listeria predictions
2011 2012 2013 2014 2015
24
68
1014
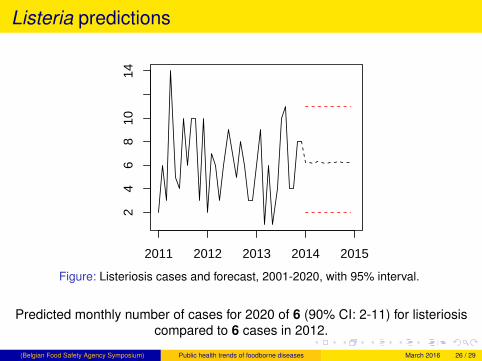
Figure: Listeriosis cases and forecast, 2001-2020, with 95% interval.
Predicted monthly number of cases for 2020 of 6 (90% CI: 2-11) for listeriosiscompared to 6 cases in 2012.
(Belgian Food Safety Agency Symposium) Public health trends of foodborne diseases March 2016 26 / 29
Summary
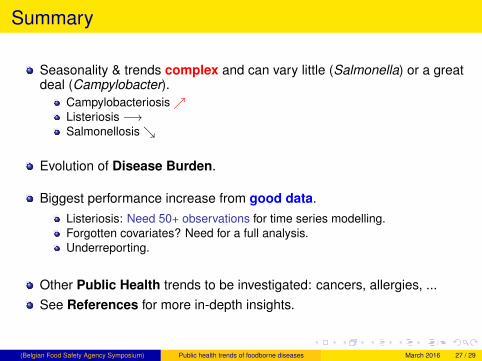
Seasonality & trends complex and can vary little (Salmonella) or a greatdeal (Campylobacter).
Campylobacteriosis↗Listeriosis −→Salmonellosis↘
Evolution of Disease Burden.
Biggest performance increase from good data.Listeriosis: Need 50+ observations for time series modelling.Forgotten covariates? Need for a full analysis.Underreporting.
Other Public Health trends to be investigated: cancers, allergies, ...See References for more in-depth insights.
(Belgian Food Safety Agency Symposium) Public health trends of foodborne diseases March 2016 27 / 29

For Further Reading I
C. Chatfield.The Analysis of Time Series, 5th ed.Chapman & Hall, New York, 1996.
T.C. Mills.Time series techniques for economists.Cambridge University Press, 1990.
R.H. Shumway and D.S. Stoffer.Time Series Analysis and its Applications. With R Examples, 2nd ed.Springer, 2006.
R.J. Hyndman, and G. AthanasopoulosForecasting: principles and practice.OTexts, Melbourne, Australia, 2014.
G. Petris, S. Petrone, and P. Campagnoli.Dynamic Linear Models with R.Springer, 2009.
(Belgian Food Safety Agency Symposium) Public health trends of foodborne diseases March 2016 28 / 29
For Further Reading II
J.M. Collard, et al.Drastic decrease of Salmonella Enteritidis isolated from humans inBelgium in 2005, shift in phage types and influence on foodborneoutbreaks.Epidemiology and Infection, 136: 771-781, 2008.
J. Bai, and P. Perron.Estimating and testing linear models with multiple structural changes.Econometrica, 66: 47-78, 1998.
P.T. Brandt, and J.T. Williams.A linear Poisson autoregressive model: The Poisson AR(p) model.Political Analysis 9: 164-184, 2001.
(Belgian Food Safety Agency Symposium) Public health trends of foodborne diseases March 2016 29 / 29