Embed Size (px)
Citation preview

Public Library Mobile App Survey
January 2018
Conducted by:
Sponsored by:

Table of Contents Page
Introduction/Objectives 3
Methodology 3
Results summary 4-6
Library Apps and Mobile Optimized Websites 7
Reasons for Not Having a Mobile App 8
Considering a Mobile App 9
Importance of App Functions 10
Vendor Apps 11
App Functionality 12
Desired App Functions 13
Satisfaction with Integration of App and ILS 14
Marketing the App 15
App Usage 16
Mobile App Spending 17
Mobile App Vendors 17
Consortial Access and Branding 18
Usage Analytics 19
Challenges 20
Demographics 21-22
Mobile App Survey January 2018 2
Public Library Mobile App Survey

Mobile App Survey January 2018 3
Study Objectives: SirsiDynix teamed up with Library Journal research to create a survey for public libraries about mobile apps. Objectives of the study were to learn:
- Percentage of libraries with mobile apps. - App features that are most important to libraries
- Functionality libraries wish their app had. - How libraries market their app. - Vendors used for apps. - If libraries do not have an app, why not?
Methodology: An LJ branded survey invitation was emailed to a list of public librarians on December 8, 2017. A drawing for a $100 American Express gift cards was offered as incentive to reply. The survey closed on January 3, 2018. The survey was programmed, deployed and tabulated by Library Journal Research.
Results in this top-line report are based on 618 public libraries. Duplicate responses from the same library were removed from the sample. Charts in this report are based on total responding unless otherwise noted. (Reduced bases are noted in the upper right hand corner of the page.) The data is unweighted. Much of the data in this report is filtered by library size. The sizes are based on population served: - Small libraries serve populations under 25,000. - Medium sized libraries serve populations between 25,000 and 99,999. - Large libraries serve populations between 100,000 and 499,999. - Very large libraries serve 500,000 or more.
Public Library Mobile App Survey January 2018

Mobile App Survey January 2018 4
Results Summary
Mobile Apps and Mobile-Optimized Websites • Just over a third of all respondents have a mobile app (37%). The percentage rises with
size of library and ranges from 22% of the smallest libraries to 69% of the largest. • The overall percentage of public libraries with a mobile-optimized website is 72%. The
percentage range is smaller, with 65% of small to 77% of large libraries employing mobile optimization.
Why Not Have App? (based on libraries without an app) • The availability of a mobile-optimized website is the primary reason given by libraries for
not developing a mobile app. Lack of funding and the availability of individual vendor apps for select resources also play a role.
Considering an App? (based on libraries without an app) • Only 9% of libraries without a mobile app are considering purchasing or developing one.
For those who plan to develop an app, ten percent already have one in development, and another 27% expect an app in the next year.
Important App Functions (based on libraries without an app) • If they were to develop an app, the functionality that is most important includes access to
the catalog, library calendar/events listing, ebook & eaudio checkouts, text notifications, and mobile library card/digital barcode. All of these functions were rated as ‘essential’ or ‘important’ by over 80% of respondents.
Vendor Apps (based on libraries without an app) • OverDrive/Libby tops the list of vendor apps that are marketed directly to patrons by
libraries without their own app. RBdigital, hoopla, Mango Languages, and Zinio round out the top five vendor apps marketed by libraries.
App Functionality Offered (based on libraries with a mobile app) • Providing access to the library catalog is a nearly universal app function, offered by almost
all respondents, regardless of library size. Library calendar/events listing, ebook & eaudio checkouts, and mobile library card/digital barcode are available on about two-thirds of libraries’ apps, except those used by the smallest libraries.
App Functionality Desired (based on libraries with a mobile app) • Additional app functionality most desired by libraries is fine payment, the inclusion of a
library calendar/events listing, ebook/eaudio checkout capability, and mobile library cards/electronic barcodes.

Mobile App Survey January 2018 5
Results Summary continued
Satisfaction with Integration of App and ILS (based on libraries with a mobile app) • Over half of respondents are either very satisfied (16%) or satisfied (43%) with the
integration of their app with their ILS. A net 12% are either not too or not at all satisfied. Satisfaction is highest among library directors/managers and lowest among technical services personnel.
Marketing the App (based on libraries with a mobile app) • The top three methods of informing patrons about the library app are through the library
website, social media, and word of mouth by library staff
• The list below compares the essential/important functions named by libraries without an app to the app functions currently offered and additional functionality desired by libraries with an app.
• Fine payment, text notifications, and remote sign up emerge as functions that are currently not offered by most apps, but are highly desired.
Essential/Important App Functions
App Functionality Offered
Add’l Functionality Desired
(Libraries without app) (Libraries with mobile app)
Access to catalog 96% 97% 0%
Library calendar/events 98% 68% 62%
Ebook/Eaudio checkouts 89% 60% 56%
Mobile library card/ Digital barcode
84% 60% 55%
Integration with other electronic resources
73% 47% 47%
Social media integration 70% 39% 39%
Text notifications 88% 28% 51%
Remote sign up for events/card
77% 27% 51%
Fine payment 77% 26% 69%

Mobile App Survey January 2018 6
Results Summary continued
App Usage (based on libraries with a mobile app) • Respondents estimate that 12% of their library users have downloaded the app to
their device(s). • About one-third (38%) of respondents say their app appeals to specific library
customers. The user segments identified as most likely to download the app are parents, younger adults, students, tech savvy users, and power users.
Mobile App Vendor (based on libraries with an app) • Boopsie is the most commonly used app vendor , with SirsiDynix and
Bibliocommons rounding out the top three. Mobile App Spending (based on libraries with an app) • The average amount spent on a library app last year was approximately $6,500.
However, nearly half of respondents spent less than $5,000. Consortial Apps and Branding (based on libraries with an app) • One-in-five libraries with an app accesses it through a consortium. Small libraries
are most likely to have their app made possible through a consortium. • Of those with consortial access, 60% have their app individually branded, If the
app is not branded, over half would like it to be. Usage Analytics (based on libraries with an app) • Forty percent of respondents say they receive usage statistics from their app
vendor. A high percentage, 44%, were unaware of the answer

Library Apps and Mobile-Optimized Websites
37%
22%
37% 44%
69% 72%
65%
74% 77% 75%
0%
10%
20%
30%
40%
50%
60%
70%
80%
90%
Total Small Medium Large Very Large
Have aLibraryApp
Website isMobile-Optimized
Q. Does your library currently have an app? Q. Is your library’s website mobile-optimized?
7 Mobile App Survey January 2018
• Just over one-third of all respondents have a mobile app (37%). The number rises with the size of the population served, from 22% of the smallest libraries to 69% of the largest.
• Mobile-optimized websites are more prevalent, with up to
three-quarters of libraries having them.
All respon-dents
Size of Library

Reasons for Not Having a Mobile App
Mobile App Survey January 2018
Q. What is the primary reason your library does not have its own app?
8
15%
5%
20%
5%
55%
11%
11%
15%
19%
33%
10%
9%
17%
20%
32%
11%
5%
21%
16%
22%
25%
12%
8%
14%
16%
20%
30%
Other
Library app is planned or indevelopment
No demand from patrons
We recommend individualvendor apps
Lack of funding for app orwebsite upgrade
No need because we have amobile-optimized website
Total
Small
Medium
Large
Very Large0%
12% 11%
If No Library App
• The availability of a mobile-optimized website is the most popular reason libraries without an app do not develop one. Lack of funding and the availability of vendor apps for select resources (such as OverDrive or hoopla) also play a role. One-in-five small libraries cites lack of demand from patrons as a reason.
• For libraries that report having a mobile-optimized website, the percentage
naming website optimization as a reason climbs to 43%.

Mobile App Survey January 2018
Considering a Mobile Library App
Q. Is your library considering buying or developing a mobile app?
9
Other services considered critical: Reviews from respected sources, easy return policy, multi user capability, duplicate checking, discounts, ability to edit orders.
If No Library App
Yes, 9%
No, 59%
Don't know, 33%
• Only 9% of libraries without a mobile app are considering purchasing or developing one. The ‘Yes’ percentage rises to 13% among library directors answering the survey, and presumably they have the best understanding of the long range plans for the library.
• For those who plan to develop an app, ten percent already have one in development, and another 27% expect it in the next year.
Considering developing an App?
Size of Library Job Function
Small Medium Large Very Large
Directors/Managers
Public Services
Technical services
Yes 8% 11% 8% 5% 13% 6% 4%
No 67% 50% 58% 42% 70% 39% 66%
Don’t know 24% 39% 34% 53% 17% 55% 30%
Considering an app?
21%
8%
34%
27%
10%
Don’t know
Longer than 2 years
In the next two years
In the next year
Currently in development
If yes, when will you have app?

Mobile App Survey January 2018
Importance of App functions
Library calendar/events
Access to catalog
Ebook/Eaudio checlouts
Text notifications
Mobile library card/digital barcode
Remote sign up for events/card
Fine payment
Integration with electronic resources
Social media integration
Features for kids/teens
Librarian chat
Mapping
Streaming music/movies
Patrons ratings and reviews
Essential
Important
96.4%
89.3%
87.5%
83.9%
76.8%
76.8%
73.2%
69.6%
54.5%
48.2%
48.1%
42.9%
Q. How important would each of the following app functions be to your library?
10
NET % Essential/Important
98.2%
If No Library App
33.9%
• The functionality that is most important to libraries when developing a mobile app includes library calendar/events listing, access to catalog, ebook/eaudio checkouts, and text notifications. Access to the catalog has the highest ‘essential’ ratings.
• Streaming music/movies, patron ratings/reviews, librarian chat, and mapping are nice to have, but fall at the bottom of the list of app requirements.

Mobile App Survey January 2018
Vendor Apps
86%
51%
39%
37%
35%
22%
12%
10%
8%
7%
3%
2%
15%
OverDrive/Libby
RBdigital
hoopla
Mango Languages
Zinio
Freegal
cloudLibrary
Axis 360
Freading
Biblioboard
Comics Plus
SimplyE
Other*
Q. If you don’t have your own app, do you encourage patrons to try any of the following vendor apps?
11
If No Library App
• OverDrive/Libby tops the list of vendor apps that are marketed directly to patrons by libraries without their own app. RBdigital is in second place, named by over half of respondents. Hoopla, Mango Languages, and Zinio are all promoted by over a third of respondents.
* Write-in answers featured Bookmyne, Flipster, Rosetta Stone, & Pronunciator.

App Functionality
Mobile App Survey January 2018
Q. What types of functionality does your app currently offer?
Total
Library Size
Small Medium Large Very Large
Access to catalog 97% 95% 97% 98% 97%
Library calendar/events 68% 63% 78% 66% 60%
Ebook/Eaudio checkouts 60% 45% 66% 61% 62%
Mobile library card/ Digital barcode
60% 35% 59% 63% 84%
Integration with other electronic resources
47% 38% 50% 52% 43%
Social media integration 39% 38% 35% 42% 43%
Text notifications 28% 28% 40% 23% 16%
Remote sign up for events or library card
27% 20% 32% 28% 24%
Mapping 26% 18% 22% 28% 41%
Fine payment 26% 18% 19% 33% 35%
Patron ratings/reviews 24% 15% 25% 30% 24%
Streaming movies/music 22% 20% 28% 17% 19%
Features for kids/teens 18% 10% 22% 17% 19%
Librarian chat 9% 3% 12% 11% 8%
Other 7% 5% 4% 13% 5%
12
• Providing access to the library catalog is a nearly universal app function (97%), no matter the library size. Library calendar/event listings, ebook/eaudio checkouts, and mobile library cards/digital barcodes are available on about two-thirds of libraries’ apps (except those used by the smallest libraries).
• At the very largest libraries, offering a mobile library card with a digital barcode is an extremely common function, second only to access to catalog.
Libraries with an
App

Mobile App Survey January 2018
Desired App Functions
Q. Do you wish your app had additional functionality? (Please check all that apply)
13
Libraries with an
App
• Fine payment, the inclusion of a library calendar/events listing, ebook/eaudio checkout capability, and mobile library cards/electronic barcodes are the most desired app functions of those who do not currently have them.
15%
29%
30%
32%
39%
41%
47%
51%
51%
55%
56%
62%
69%
Mapping
Features for kids/teens
Patron ratings/reviews
Streaming movies/music
Social media integration
Librarian chat
Integration with electronic resources
Text notifications
Remote sign up for events/card
Mobile library card/digital barcode
Ebook/Eaudio checkouts
Library calendar/events
Fine payment
Additional Functionality Desired*
* Each response is based on those libraries that do not currently have the function.

Mobile App Survey January 2018 14
Satisfaction with Integration of App and ILS
Q. How satisfied are you with the integration between your mobile app and your library management system (ILS)?
0%
11%
24%
41%
24%
0%
15%
32%
39%
14%
6%
6%
34%
49%
6%
1%
11%
28%
43%
16%
Not at all satisfied
Not too satisfied
Somewhat satisfied
Satisfied
Very Satisfied
Total
Tech Services
Public Services
Administration
Libraries with an
App
• Sixteen percent of all respondents are very satisfied with the integration between the mobile app and the library’s management system. Satisfaction is highest among library directors/managers and lowest among technical services personnel.

Mobile App Survey January 2018
Marketing the App
64%
35%
30%
22%
19%
12%
6%
6%
6%
9%
Website
Social media
Word of mouth/Librarystaff
Flyers
Posters/Signage
Newsletter
Bookmarks
Upon library cardregistration
No marketing
Q. How do you market the availability of your app to patrons?*
15
Word of mouth plays a larger role in libraries serving 50,000 or more, because they have more staff.
Libraries with an
App
* These percentages were coded from responses to an open-ended question.
• The top three methods of informing patrons about the library app are the library website, social media, and word of mouth by library staff.

Mobile App Survey January 2018 16
App Usage
Q. Approximately what percent of library users has downloaded the app to a device since your app became available?
5%
20%
12%
26%
27%
11%
Over 30%
21% - 30%
11% - 20%
6% - 10%
3% - 5%
Less than 3%
20% 10%
6% 6%
12% 16% 16% 16%
OtherDon't know
Everyone but seniorsPower users
Tech savvy usersStudents
Younger adultsParents
If yes, which segments?
Average = 12.3%
Yes, 38% Not
really, 62%
Q. Is the app especially popular with specific segment(s) of your users?
• Respondents estimate that an average of 12% of their library users have downloaded the app to their device(s). About one-third of respondents say their app appeals to specific library customers. The user segments identified as most likely to download the app are parents, younger adults, students, tech savvy users, and power users.
Libraries with an
App

Mobile App Survey January 2018 17
Mobile App Spending
Q. Approximately what was your library’s spending on its mobile app last year?*
Total
Library Size
Small** Medium** Large** Very Large**
Average $6,465 $3,770 $4,841 $8,276 $12,000
Median $ $4,910 $3,437 $4,166 $7,083 $15,833
** Small base size
Mobile App Vendor Used Q. What vendor do you use for your app?
* Based on respondents who were involved in the development and purchasing process of their app.
• The average app spending last year was $6,465. However, nearly half of respondents spent less than $5,000 last year.
Total
Library Size
Small** Medium Large Very Large**
Boopsie 32% 32% 32% 35% 29%
SirsiDynix 18% 14% 25% 16% 11%
Bibliocommons 12% 4% 5% 16% 25%
Capira 4% 7% 4% 4% 0%
Developed in-house 3% 4% 2% 6% 0%
Innovative Interfaces 2% 4% 0% 2% 4%
TLC 1% 0% 0% 2% 0%
Other 13% 18% 14% 7% 14%
Don’t know 17% 18% 19% 13% 18%
Libraries with an
App
• Among our respondents, Boopsie is the most commonly used app vendor. SirsiDynix and Bibliocommons round out the top three.

Mobile App Survey January 2018 18
• “Service, price, selection.” “So that all departments were using same vendor.“
• “New supplier offered free shipping. Previous charged $8 per shipment.”
• “Statewide coop (MHEC) -- vendor discounts.” • “Moved to outsource processing for print materials.” • “Their accounting person made a racist statement against
Native Americans.”
Consortial Access and Branding
21%
54%
25%
42% 45%
13%
23%
53%
25%
16%
62%
22%
4%
53%
43%
Yes No Don't know
Total
Small
Medium
Large
Very Large
Q. Is your library’s app made available through a consortium?
Q. If yes above, is the app individually branded for your library?
Libraries with an
App
Q. If not branded, would you prefer to have your app be branded?*
Yes, 60%
No, 40%
Yes, 57%
No, 43%
*small base
• One-in-five libraries with an app accesses it through a consortium. Small libraries are most likely to have their app made possible through a consortium.

Mobile App Survey January 2018 19
Usage Analytics
Q. Do you receive usage analytics from your app provider (e.g., number of connections to the catalog, number of ebook checkouts, etc.)?
40%
15% 44%
Yes
No
Don't know
Libraries with an
App
• Forty percent of respondents say they receive usage statistics from their app vendor. Fifteen percent do not, and 44% did not know the answer to the question. Technical services staff were most likely to report receiving usage statistics.
Receive Usage Statistics?
Size of Library Job Function
Small Medium Large Very Large
Directors/Managers
Public Services
Technical services
Yes 30% 42% 48% 32% 33% 28% 65%
No 20% 19% 11% 11% 27% 3% 23%
Don’t know 50% 39% 41% 57% 40% 69% 13%
Getting the word out and getting patrons to sign up/use Getting the word out and getting patrons to sign up/use
up/use
Mobile App Survey January 2018 20
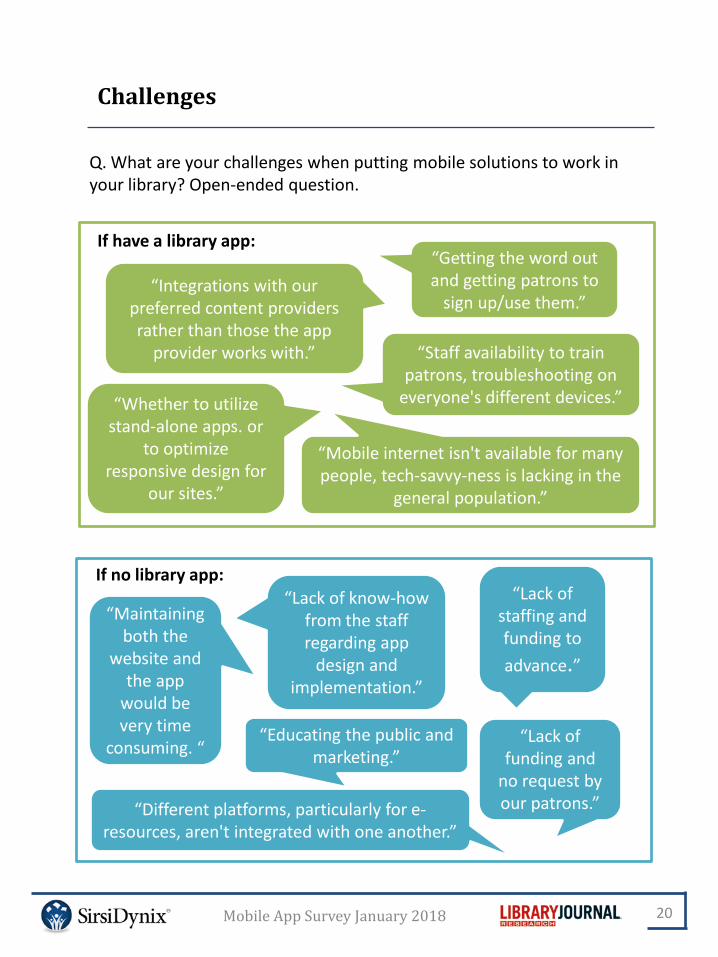
Challenges
Q. What are your challenges when putting mobile solutions to work in your library? Open-ended question.
If have a library app:
If no library app:
“Getting the word out and getting patrons to
sign up/use them.” “Integrations with our
preferred content providers rather than those the app
provider works with.” “Staff availability to train patrons, troubleshooting on
everyone's different devices.” “Whether to utilize stand-alone apps. or
to optimize responsive design for
our sites.”
“Mobile internet isn't available for many people, tech-savvy-ness is lacking in the
general population.”
“Lack of funding and
no request by our patrons.”
“Lack of staffing and funding to advance.”
“Maintaining both the
website and the app
would be very time
consuming. “
“Lack of know-how from the staff regarding app
design and implementation.”
“Educating the public and marketing.”
“Different platforms, particularly for e-resources, aren't integrated with one another.”
Mobile App Survey January 2018 21
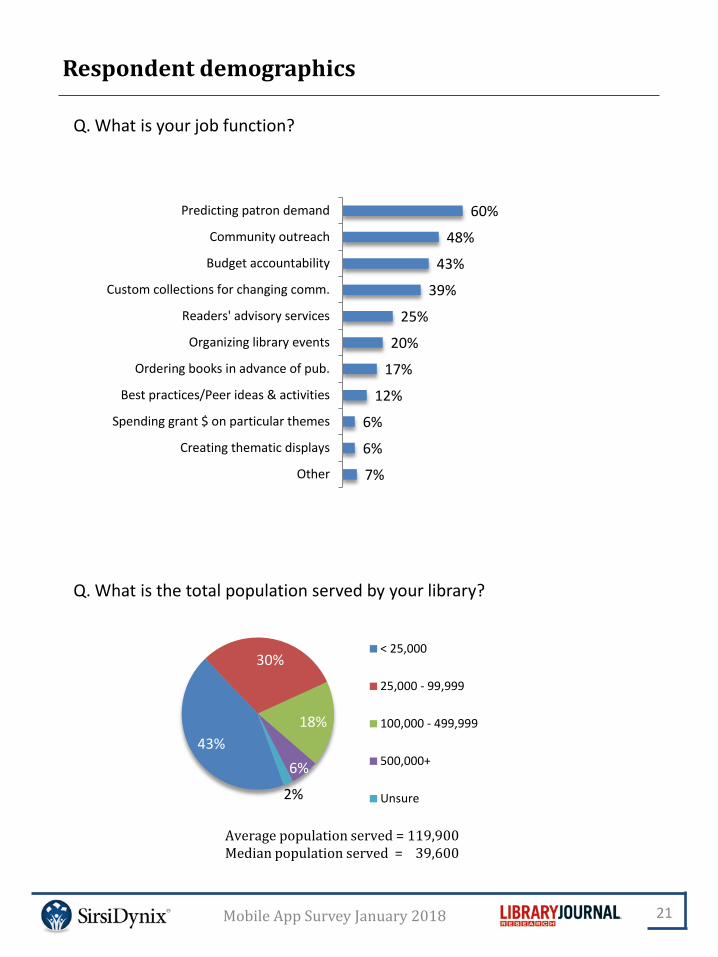
Q. What is your job function?
7%
6%
6%
12%
17%
20%
25%
39%
43%
48%
60%
Other
Creating thematic displays
Spending grant $ on particular themes
Best practices/Peer ideas & activities
Ordering books in advance of pub.
Organizing library events
Readers' advisory services
Custom collections for changing comm.
Budget accountability
Community outreach
Predicting patron demand
Respondent demographics
Q. What is the total population served by your library?
43%
30%
18%
6%
< 25,000
25,000 - 99,999
100,000 - 499,999
500,000+
Unsure
Average population served = 119,900 Median population served = 39,600
2%

Mobile App Survey January 2018 22
Q. How involved were you in the development and purchasing process for your library’s mobile app?
18%
17%
64%
I signed off
I maderecommendations
I was not involved
• One third of the respondents to this survey were directly involved in the development or purchasing process of the mobile app for their library.
Libraries with an
App