Embed Size (px)
Citation preview

Standard Eurobarometer 79
Spring 2013
PUBLIC OPINION IN THE EUROPEAN UNION
FIRST RESULTS
Fieldwork: May 2013
Publication: July 2013
This survey has been requested and co-ordinated by the European Commission,
Directorate-General for Communication.
http://ec.europa.eu/public_opinion/index_en.htm
This document does not represent the point of view of the European Commission. The interpretations and opinions contained in it are solely those of the authors.
Standard Eurobarometer 79 / Spring 2013 – TNS opinion & social

Standard Eurobarometer 79 Spring 2013
First results
Survey carried out by TNS opinion & social at the request of the European Commission’s
Directorate-General for Communication
Survey coordinated by the European Commission’s Directorate-General for Communication
(DG COMM “Research and Speechwriting” Unit)

STANDARD EUROBAROMETER 79 FIRST RESULTS – SPRING 2013
1
TABLE OF CONTENTS
INTRODUCTION .................................................................................................. 3
I. EU Citizenship ............................................................................................... 5
1. Feeling like a citizen of the European Union: trend ............................................................... 5
2. Feeling like a citizen of the European Union: national results ............................................... 5
3. Knowledge of rights as a citizen of the European Union: trend ............................................. 6
4. Knowledge of rights as a citizen of the European Union: national results ............................. 6
5. Information about EU citizens’ rights: trend ......................................................................... 7
6. Information about EU citizens’ rights: national results ......................................................... 7
7. Most positive result of the European Union: trend ............................................................... 8
II. Europeans and political institutions .............................................................. 9
1. Trust in national governments and parliaments and in the European Union: trend .............. 9
2. The image of the European Union: trend ............................................................................ 10
3. The future of the European Union: trend ........................................................................... 10
4. The future of the European Union: national results ............................................................ 11
5. My voice counts in the European Union: trend ................................................................... 11
6. My voice counts in the European Union: national results ................................................... 12
7. Awareness of the European Parliament: trend ................................................................... 13
8. Knowledge of how the members of the European Parliament are appointed: trend ........... 14
9. Knowledge of how the members of the European Parliament are appointed: national
results and evolutions ....................................................................................................... 15
III. Europeans and the economic situation ....................................................... 16
1. Assessment of the current situation: general and personal aspects .................................... 16
2. Current situation of the economy at national level: trend .................................................. 17
3. Current situation of the economy at national level: national results ................................... 18
IV. The main concerns of Europeans ................................................................ 19
1. Main concerns at national level.......................................................................................... 19
2. Main concerns at national level: national results................................................................ 20
3. Main concerns at personal level ......................................................................................... 21
4. Main concerns at European level: evolutions ..................................................................... 21
5. Expectations for the next twelve months: general and personal aspects ............................ 22

STANDARD EUROBAROMETER 79 FIRST RESULTS – SPRING 2013
2
V. The crisis .................................................................................................... 23
1. Support for European economic and monetary union with a single currency, the euro:
trend ................................................................................................................................. 23
2. Support for European economic and monetary union with a single currency, the euro:
national results and evolutions ......................................................................................... 24
3. Impact of the crisis on jobs: trend ...................................................................................... 25
4. Impact of the crisis on jobs: national results and evolutions ............................................... 25
5. The consequences of the crisis for the European Union ...................................................... 27
6. What is the most effective level at which to tackle the crisis? ............................................ 27
7. EU’s voice counts in the world: trend ................................................................................. 28
8. EU’s voice counts in the world: national results.................................................................. 28
VI. Europe 2020 ............................................................................................... 29
1. Perceived importance of the Europe 2020 strategy initiatives ............................................ 29
2. The Europe 2020 targets .................................................................................................... 31
3. Overall ............................................................................................................................... 32
CONCLUSION .................................................................................................... 33
ANNEXES
Technical specifications

STANDARD EUROBAROMETER 79 FIRST RESULTS – SPRING 2013
3
INTRODUCTION
This report presents the first results of the Standard Eurobarometer 79 survey, which was carried out between 10 and 26 May 2013 in 34 countries or territories1: the 27 European Union Member States, the six candidate countries (Croatia, the Former Yugoslav Republic of Macedonia, Turkey, Iceland, Montenegro and Serbia), and the Turkish Cypriot Community in the part of the country that is not controlled by the government of the Republic of Cyprus. Croatia joined the EU on 1 July 2013, but was not a Member State of the European Union when the fieldwork was conducted. Therefore, the weighted average for the European Union presented in this report and annex represents the 27 countries which were EU Member States at the time of the fieldwork.
This “First results” report provides a selection of data on various topics such as the economy and the European political situation. It is published jointly with the results of the Standard Eurobarometer questions on the economic crisis and other political trends in the EU, which are set out in an annex.
The previous Standard Eurobarometer survey of autumn 2012 (EB78) was marked by the relative stability of most indicators regarding perceptions of the economic situation, which remained at a rather weak level. Most of the indicators of support for the European Union and its institutions were also fairly stable.
Since the Standard Eurobarometer survey of autumn 2012 (EB78), national elections have taken place in Cyprus, the Czech Republic, Italy and Malta.
In early May 2013, just before the beginning of the fieldwork for this Standard Eurobarometer survey, the spring 2013 forecasts were published by the European Commission2. Though growth in GDP is expected to be negative in the EU (-0.1%) and the euro area (-0.4%) in 2013, a real-terms increase is expected in 2014: economic activity is forecast to expand by 1.4% in the EU and 1.2 % in the euro area.
2013 is the European Year of Citizens3. The aim of this initiative is to promote the rights that all EU citizens enjoy, to underline the concept of EU citizenship, to highlight voting rights and to encourage people take part in the forthcoming May 2014 European elections.
Since September 2012, the European Commission has been organising Citizens’ Dialogues4, which are opportunities for EU citizens themselves to talk to EU Commissioners about topics such as Europe and the crisis, EU citizens’ rights, and the future of Europe. These Citizens' Dialogues are held in cities all over Europe.
This report focuses on the results obtained in the 27 EU Member States and Croatia and is divided into six parts. The first part analyses questions linked to EU citizenship, while the second considers how respondents view political institutions: national governments and parliaments, and the EU.
1 Please consult the technical specifications for the exact fieldwork dates in each Member State 2 http://ec.europa.eu/economy_finance/eu/forecasts/2013_spring_forecast_en.htm

STANDARD EUROBAROMETER 79 FIRST RESULTS – SPRING 2013
4
The third part details how Europeans perceive the current economic situation, while the fourth part looks at the main concerns of Europeans and their expectations. The fifth part is devoted to the euro and the issues raised by the crisis and the sixth part examines the way in which Europeans perceive the various initiatives of the Europe 2020 strategy.
As these questions have been asked in previous Standard Eurobarometer surveys we are able to analyse trends in opinion.
The methodology used is that of the Eurobarometer surveys carried out by the Directorate-General for Communication (“Research and Speechwriting” Unit)5. A technical note concerning the interviews conducted by the member institutes of the TNS Opinion & Social network is annexed to this report. It also specifies the confidence intervals6.
In this report, the following abbreviations are used:
ABBREVIATIONS BE Belgium LV Latvia CZ Czech Republic LU Luxembourg BG Bulgaria HU Hungary DK Denmark MT Malta DE Germany NL The Netherlands EE Estonia AT Austria EL Greece PL Poland ES Spain PT Portugal FR France RO Romania IE Ireland SI Slovenia IT Italy SK Slovakia CY Republic of Cyprus*** FI Finland LT Lithuania SE Sweden UK The United Kingdom CY (tcc) Turkish Cypriot Community HR Croatia EU27 European Union – 27 Member States TR Turkey
MK Former Yugoslav Republic of Macedonia **** EU15 BE, IT, FR, DE, LU, NL, DK, UK, IE, PT, ES, EL, AT,
SE, FI* IS Iceland NMS12 BG, CZ, EE, CY, LT, LV, MT, HU, PL, RO, SI, SK**
ME Montenegro EURO AREA BE, FR, IT, LU, DE, AT, ES, PT, IE, NL, FI, EL, EE, SI, CY, MT, SK
RS Serbia NON-EURO AREA BG, CZ, DK, LV, LT, HU, PL, RO, SE, UK
* EU15 refers to the 15 European Union Member States before the enlargements of 2004 and 2007
** The NMS12 countries are the 12 “new Member States” that joined the European Union at the time of the 2004 and 2007 enlargements
*** Cyprus as a whole is one of the 27 European Union Member States. However, the “acquis communautaire” has been suspended in the part of the country which is not controlled by the government of the Republic of Cyprus. For practical reasons, only the interviews carried out in the part of the country controlled by the government of the Republic of Cyprus are included in the “CY” category and in the EU27 average. The interviews carried out in the part of the country that is not controlled by the government of the Republic of Cyprus are included in the “CY(tcc)” [tcc: Turkish Cypriot Community category]
**** Provisional abbreviation which in no way prejudges the definitive name of this country, which will be agreed once the current negotiations at the United Nations have been completed
* * * * * We wish to thank all the people interviewed throughout Europe
who took the time to take part in this survey.
Without their active participation, this survey would not have been possible.
3 http://europa.eu/citizens-2013/en/home 4 http://ec.europa.eu/debate-future-europe/citizens-dialogues/index_en.htm 5 http://ec.europa.eu/public_opinion/index_en.htm 6 The results tables are annexed. It should be noted that the total of the percentages indicated in the tables in this report may exceed 100% when the respondent was able to choose several answers to the same question.

STANDARD EUROBAROMETER 79 FIRST RESULTS – SPRING 2013
5
I. EU Citizenship
1. Feeling like a citizen of the European Union: trend
An absolute majority of Europeans feel that they are citizens of the EU, and this opinion is stable (62%, -1 since autumn 2012). More than a third disagree with this statement (37%, +1). Since spring 2010 (EB73), this feeling of being a European citizen has changed little, varying between 61% and 63%.
2. Feeling like a citizen of the European Union: national results
Wide differences exist between countries: more than three in four respondents in Luxembourg, Malta and Slovakia feel that they are citizens of the EU, while less than half do so in Bulgaria, the United Kingdom, Cyprus and Greece. However, these are the only four Member States where a majority of respondents do not feel that they are citizens of the EU.
Sharing the European currency strengthens this feeling to some extent: 64% of respondents within the euro area feel they are citizens of the EU, compared with 57% outside it.

STANDARD EUROBAROMETER 79 FIRST RESULTS – SPRING 2013
6
3. Knowledge of rights as a citizen of the European Union: trend
Close to half of Europeans know what their rights are as citizens of the EU (46%, +1 since autumn 2012). A slight majority say that they do not know their rights as citizens of the EU (53%, -1). After a 5-point increase between spring 2010 (EB73) and spring 2011 (EB75) (from 42% up to 47%), this knowledge of rights as EU citizens has varied little since spring 2011, between 47% and 45%.
4. Knowledge of rights as a citizen of the European Union: national results
In 14 Member States, majorities of respondents say that they know their rights as EU citizens, with the highest levels measured in Luxembourg (67%, +4), Finland (65%, -2) and Germany (61%, +3). Significant differences have been observed since autumn 2012 in Portugal (+10 to 45%), Romania, (+8 to 43%) and Slovakia (+7 to 59%).

STANDARD EUROBAROMETER 79 FIRST RESULTS – SPRING 2013
7
5. Information about EU citizens’ rights: trend
A large majority of European citizens would like to know more about their rights as citizens of the EU (59%). However, this proportion has decreased since the Standard Eurobarometer survey of spring 2010 (EB73), when 72% shared this opinion. Conversely, the proportion saying that they are not interested in knowing more about their rights has increased, from 26% in spring 2010 up to 39% in spring 2013.
6. Information about EU citizens’ rights: national results
In 23 EU Member States, a majority of respondents would like to know more about their rights as citizens of the EU. This opinion is the most widespread in Cyprus (86%), Slovakia (76%) and Sweden (75%). Conversely, in four Member States majorities of respondents say that they would not like to know more about their rights: Finland (50%), the United Kingdom (51%), Portugal (54%) and Austria (59%).

STANDARD EUROBAROMETER 79 FIRST RESULTS – SPRING 2013
8
7. Most positive result of the European Union: trend
The free movement of people, good and services within the EU (56%, +4) and peace amongst the Member States of the EU (53%, +3) continue to be seen as by far the most positive results of the EU. Both items are mentioned by more than half the respondents, in proportions that have actually increased since autumn 2012.
All other items are cited by between around a quarter and a fifth of respondents: the euro (24%, -1), student exchange programmes such as ERASMUS (23%, +1), the political and diplomatic influence of the EU in the rest of the world (20%, stable), the economic power of the EU (20%, stable) and the level of social welfare (healthcare, education, pensions) in the EU (19%, +1). The common agricultural policy (12%, +1) continues to bring up the rear. The proportion of Europeans spontaneously answering “none” has decreased slightly (11%, -2).

STANDARD EUROBAROMETER 79 FIRST RESULTS – SPRING 2013
9
II. Europeans and political institutions
1. Trust in national governments and parliaments and in the European
Union: trend
Trust levels in political institutions continue to decrease, though there is still more trust in the European Union than in national institutions. After a 2-point decrease, trust in the European Union has fallen back to the spring 2012 level (EB77). It is still higher than the levels recorded for national governments (25%, -2) and parliaments (26%, -2), which are also facing a slight decrease.

STANDARD EUROBAROMETER 79 FIRST RESULTS – SPRING 2013
10
2. The image of the European Union: trend
The image of the EU is stable. A majority of Europeans have a neutral image of the EU (39%, =), and the proportion of respondents for whom it conjures up a positive image continues to be just higher than the proportion for whom it is negative (30% positive, unchanged; 29% negative, unchanged).
3. The future of the European Union: trend
Europeans are fairly evenly divided about the future of the EU. Close to half of them are optimistic (49%), whereas 46% are pessimistic. These results are almost unchanged since autumn 2012 (50% optimistic, vs. 45% pessimistic).

STANDARD EUROBAROMETER 79 FIRST RESULTS – SPRING 2013
11
4. The future of the European Union: national results
In 19 countries, majorities of respondents say that they are optimistic about the future of the EU, led by Denmark (72%), Estonia (64%), Lithuania (64%), Malta (63%) and Poland (63%). At the other end of the scale, majorities are pessimistic in nine countries, in particular in Portugal (67%), Cyprus (69%) and Greece (69%).
5. My voice counts in the European Union: trend
More than two-thirds of Europeans say that their voice does not count in the EU (67%), a 3-point increase taking this score to its highest level since autumn 2004 (EB62) when the question was first asked. This proportion has increased almost continuously since spring 2009 (EB71), from 53% up to 67%. Slightly more than a quarter of respondents (28%, -3) agree that their voice counts in the EU.

STANDARD EUROBAROMETER 79 FIRST RESULTS – SPRING 2013
12
6. My voice counts in the European Union: national results
In 24 EU Member States, absolute majorities of respondents disagree that their voice counts in the EU. This opinion is most widespread in Greece (89%) and Cyprus (89%), but is also very common in Portugal (81%), in Italy (78%) and in Spain (77%). These five countries in the south of the EU are joined by the Czech Republic (81%) and Estonia (77%).
In three countries majorities of the population consider that their voice does count in the EU: Denmark (56%), Croatia (48% vs. 45%) and Malta (45% vs. 43%).

STANDARD EUROBAROMETER 79 FIRST RESULTS – SPRING 2013
13
7. Awareness of the European Parliament: trend
In May 2014, Europeans will elect their representatives to the European Parliament. Nine in ten say they have heard of this institution (90%, -1 since autumn 2012). This proportion has registered little evolution over time, varying only within a narrow range of 87% to 91% since spring 2006.
Awareness of the European Parliament is widespread in every Member State: the proportion of respondents that have heard of the European Parliament ranges from 98% in Denmark, Slovenia and Finland to 85% in the United Kingdom and 84% in Italy.

STANDARD EUROBAROMETER 79 FIRST RESULTS – SPRING 2013
14
8. Knowledge of how the members of the European Parliament are appointed: trend
An outright majority of Europeans know that the members of the European Parliament are directly elected by the citizens of each Member State (52%, unchanged since autumn 2012); conversely, close to three in ten Europeans think that this statement is false (29%, -1) and 19% (+1) do not know. Since spring 2010 (EB73), knowledge of how MEPs are appointed has declined from 59% down to 52% in spring 2013.

STANDARD EUROBAROMETER 79 FIRST RESULTS – SPRING 2013
15
9. Knowledge of how the members of the European Parliament are appointed: national results and evolutions
Outright majorities of respondents know how MEPs are appointed in 22 Member States, led by Malta (86%), Cyprus (83%) and Greece (81%). Knowledge has increased most substantially in Latvia (63%, +10 since autumn 2012) and Sweden (59%, +6). Conversely, a 10-point decrease is observed in Spain (42%). In Croatia, where MEPs were elected in April 2013 in anticipation of the country’s accession to the EU (on 1 July 2013), knowledge has increased spectacularly since autumn 2012 (78%, +40 points).
STANDARD EUROBAROMETER 79 FIRST RESULTS – SPRING 2013
16
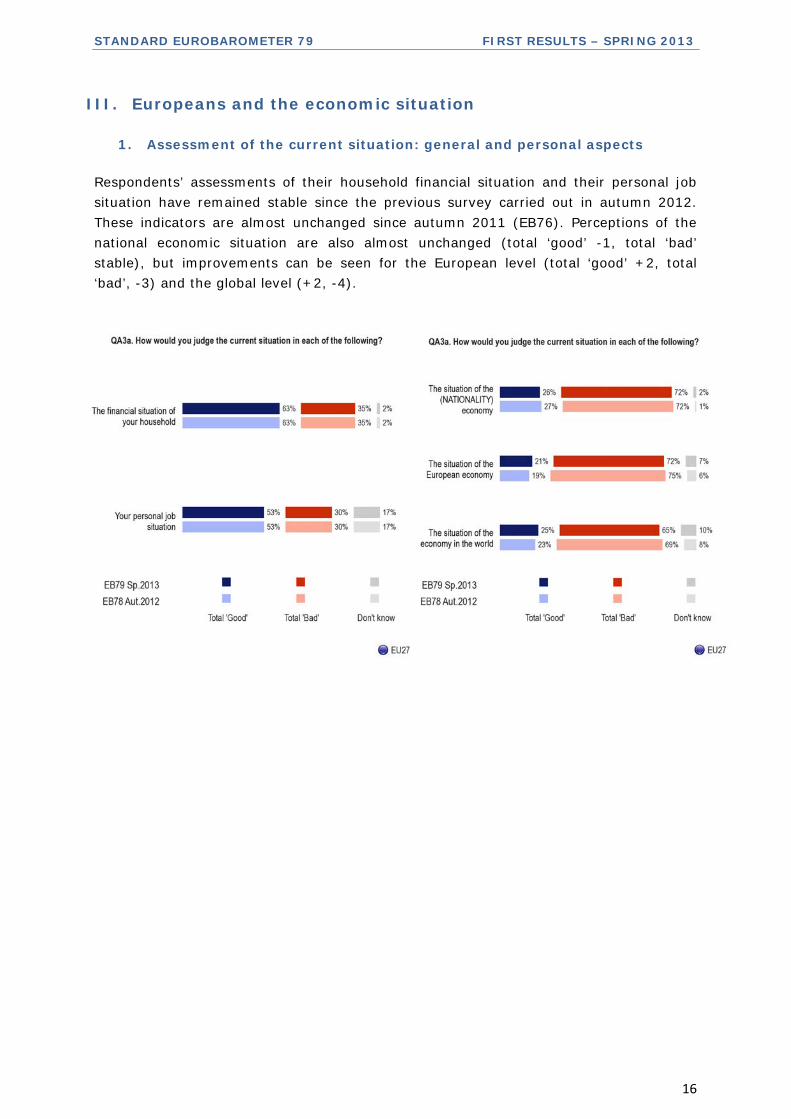
III. Europeans and the economic situation
1. Assessment of the current situation: general and personal aspects
Respondents’ assessments of their household financial situation and their personal job situation have remained stable since the previous survey carried out in autumn 2012. These indicators are almost unchanged since autumn 2011 (EB76). Perceptions of the national economic situation are also almost unchanged (total ‘good’ -1, total ‘bad’ stable), but improvements can be seen for the European level (total ‘good’ +2, total ‘bad’, -3) and the global level (+2, -4).

STANDARD EUROBAROMETER 79 FIRST RESULTS – SPRING 2013
17
2. Current situation of the economy at national level: trend
Perceptions of the national economy remain stable, and positive answers are at a very low level. Only 26% of Europeans consider that the situation of their national economy is ‘very’ or ‘rather’ good. This stability at EU level conceals striking evolutions in both directions nationally.

STANDARD EUROBAROMETER 79 FIRST RESULTS – SPRING 2013
18
3. Current situation of the economy at national level: national results
Perceptions of the current situation of the national economy vary widely between EU Member States. In Sweden, Germany and Luxembourg, three-quarters or more of respondents continue to consider that the economic situation of their country is good, whereas there are now six Member States in which less than 5% of respondents agree: Greece and Spain have been joined by Slovenia, Portugal, Bulgaria and Cyprus. In four other Member States, less than 10% of respondents agree: Romania, Ireland, Italy and France. The gap between countries where the national economic situation is seen in a positive light and those where it is not is widening. It now stands at 79 percentage points between Sweden and Spain whereas it was 74 points between Sweden and Greece in autumn 2012.

STANDARD EUROBAROMETER 79 FIRST RESULTS – SPRING 2013
19
IV. The main concerns of Europeans
1. Main concerns at national level
Unemployment continues to widen its lead as the first issue concerning Europeans at national level: after a 3-point increase, more than half of Europeans mention this item. Three other economic issues follow, but these have all lost ground: the economic situation (33%, -4), rising prices (20%, -4), and government debt (15%, -2). As in autumn 2012, all other issues are mentioned by less than one in eight Europeans and are very stable (1-point change maximum); immigration is the only exception, with a 2-point rise to 10%.

STANDARD EUROBAROMETER 79 FIRST RESULTS – SPRING 2013
20
2. Main concerns at national level: national results
In every country, respondents consider that economic matters are the main issues that their country is facing at the moment. Except in Malta, where respondents identify immigration as their main national problem (29%), the first item of concern is directly related to the economy. Unemployment is now the most frequently mentioned issue in 21 countries, and was cited by more than seven in ten respondents in Spain (79%), Cyprus (72%, in second place), and Portugal (72%). The economic situation is the first item mentioned in Cyprus (75%, following a 10-point increase), Slovenia (57%), and Romania (44%). Rising prices are the main concern in Estonia (51%) and Austria (38%). As in spring and autumn 2012, Germany is the only country where government debt is the main worry for respondents (29%), despite a 5-point decrease.

STANDARD EUROBAROMETER 79 FIRST RESULTS – SPRING 2013
21
3. Main concerns at personal level
Despite a 3-point fall, rising prices/inflation continues to be by far the main personal concern of Europeans (41%). The next four issues are also all financial and economic in nature: unemployment (22%, +1), the national economic situation (18%, -1), taxation (16%, unchanged) and the household financial situation (16%, +1).
4. Main concerns at European level: evolutions
Although the economic situation is still seen by Europeans as the most important issue facing the EU (48%), it has nevertheless registered a 5-point fall since autumn 2012. Meanwhile, unemployment (38%) has moved in the opposite direction and has registered a 2-point increase. The state of Member States' public finances remains the third most important issue (30%, -2).

STANDARD EUROBAROMETER 79 FIRST RESULTS – SPRING 2013
22
5. Expectations for the next twelve months: general and personal aspects
While perceptions of their personal situation are unchanged, Europeans’ short-term expectations show some improvement: optimism has remained fairly stable, but pessimism has declined. Although large majorities continue to consider that the next twelve months will be the same for the household financial situation (60%, +4 percentage points) and their personal job situation (61%, +2), fewer respondents expect the situation to worsen in both cases (19%, -4 and 11%, -1 respectively).
This phenomenon - increases in the proportion of “same” in combination with decreases in “worse” - is even more striking in the case of the economy, where it can be seen at national (“same” 44%, +5; “worse” 34%, -6), European (“same” 41%, +4; “worse” 32%, -7) and global level (“same” 44%, +4; “worse” 27%, -6).

STANDARD EUROBAROMETER 79 FIRST RESULTS – SPRING 2013
23
V. The crisis
1. Support for European economic and monetary union with a single
currency, the euro: trend
A majority of Europeans support European economic and monetary union with a single currency, the euro (51%, -2 percentage points since autumn 2012), and 42% oppose it (+2).

STANDARD EUROBAROMETER 79 FIRST RESULTS – SPRING 2013
24
2. Support for European economic and monetary union with a single
currency, the euro: national results and evolutions
There is still a large difference in between support within the euro area (62%, -4) and outside it (29%, -1).
Support for the euro varies between EU Member States. Three-quarters or more of respondents are in favour of the single currency in Slovakia (77%), Slovenia (77%), Luxembourg (77%), Belgium (76%) and Finland (75%), compared with only a quarter or less of respondents in the Czech Republic (25%), Sweden (19%) and the United Kingdom (15%).
Support for the euro increased significantly in Latvia, (+8 percentage points to 43%) and Belgium (+7 points to 76%), and also in Croatia (+9 points at 61%); it fell most notably in Poland (-7 to 29%), France (-7 to 62%), the Netherlands (-7 to 68%) and Spain (-11 to 52%).

STANDARD EUROBAROMETER 79 FIRST RESULTS – SPRING 2013
25
3. Impact of the crisis on jobs: trend
The feeling that the impact of the crisis on the job market has already reached its peak has gained significant ground since autumn 2012: more than a third of Europeans now believe this to be the case (36%, +7 percentage points), the highest level since the Standard Eurobarometer survey of spring 2011 (EB75). Although an absolute majority of respondents continue to believe that "the worst is still to come" (55%, -7), this view is now less widespread.
4. Impact of the crisis on jobs: national results and evolutions
Opinions as to whether the worst impact of the economic crisis on the job market is still to come differ sharply between countries: in 19 countries, a majority of respondents hold this view, including more than two-thirds in Cyprus (83%), Portugal (75%), Slovenia (73%), Greece (68%) and France (68%). Less than a third do so in Bulgaria (31%). In eight EU Member States, a majority of respondents believe that the impact of the crisis has reached its peak. Public opinion in Slovakia is evenly divided on this question (46% vs. 46%).

STANDARD EUROBAROMETER 79 FIRST RESULTS – SPRING 2013
26
The view that the impact of the crisis has reached its peak has gained ground in no fewer than 24 EU Member States. The most striking evolutions have been observed in Sweden (+18 percentage points, to 42%), Belgium (+17, 38%), and Slovakia (+16, 46%).
Respondents outside the euro area are still more likely than those in the euro area to say that the impact of the crisis on the job market has reached its peak (40% and 33%, respectively) but this opinion has gained ground in both groups (both +6 since autumn 2012).

STANDARD EUROBAROMETER 79 FIRST RESULTS – SPRING 2013
27
5. The consequences of the crisis for the European Union
European public opinion has changed little regarding the consequences of the crisis for the EU and its citizens: as in autumn 2012, a large majority of Europeans say that EU countries will have to work more closely together (84%, -1 percentage point). More than half of Europeans also believe that the EU will be stronger in the long run as a result of the crisis (53%, stable). The feeling of being closer to the citizens in other European countries as a consequence of the crisis has lost some ground (42%, -2), but a solid majority of Europeans continue to think that the European Union has sufficient power and tools to defend the economic interests of Europe in the global economy (60%, -1 since autumn 2012, and -3 since spring 2012).
6. What is the most effective level at which to tackle the crisis?
The hierarchy of the actors best placed to take effective action against the effects of the economic and financial crisis is unchanged since autumn 2012: despite a 1-point
decrease, the EU is still seen as the best placed actor (22%, -1), closely followed by the national government (21%, +1). The G20 (13%, -1), the IMF, (13%, unchanged) and the United States (8%, unchanged) continue to be less mentioned.

STANDARD EUROBAROMETER 79 FIRST RESULTS – SPRING 2013
28
7. EU’s voice counts in the world: trend
While more than two-thirds of Europeans consider that their voice does not count in the EU, the exact same proportion agrees that the EU’s voice counts in the world (67%, vs. 27% who disagree with this statement). This opinion is almost unchanged since autumn 2012 (66% agree, vs. 28%).
8. EU’s voice counts in the world: national results
Citizens are in no doubt as to the European Union’s global influence: absolute majorities of respondents agree that EU’s voice counts in the world in all Member States. In Denmark (85%), Sweden (82%), Luxembourg (81%), Latvia (79%), Estonia (78%), Finland (77%), and Hungary, the Netherlands and Poland (75% in each country), at least two-third of the population agree with this statement. Although still the majority opinion, this view is less widespread in Portugal (59%), the United Kingdom (58%) and Italy (50%)
STANDARD EUROBAROMETER 79 FIRST RESULTS – SPRING 2013
29
VI. Europe 2020
1. Perceived importance of the Europe 2020 strategy initiatives
Absolute majorities of Europeans say that the seven objectives of the Europe 2020 strategy are important. The proportion answering ‘important’ varies between 80% for “to modernise labour markets, with a view to raising employment levels” and 50% for “to develop the e-economy by strengthening ultra-fast Internet within the EU”. Since autumn 2012 (EB78), judgements have remained stable for two of the seven initiatives tested, while small (2-point) decreases have been recorded for the remaining five. Over the longer term, the perceived importance of these initiatives has grown (by between +2 and +4) since the first time this question was asked, in the Standard Eurobarometer survey of spring 2010 (EB73, at the time when the Europe 2020 strategy was launched7). Only “to support an economy that uses less natural resources and emits less greenhouse gas” has seen no change over this period.
More than three-quarters of Europeans consider that it is important “to modernise labour markets, with a view to raising employment levels” (80%, unchanged since autumn 2012) and “to help the poor and socially excluded and enable them to play an active part in society” (78%, -2) in order for the European Union to emerge from the present financial and economic crisis and prepare for the next decade.
7 The European Commission launched the Europe 2020 strategy in March 2010 in order to prepare the European economy for the key issues and challenges of the 2010-2020 decade. http://ec.europa.eu/europe2020/index_en.htm

STANDARD EUROBAROMETER 79 FIRST RESULTS – SPRING 2013
30
More than two-thirds of Europeans think that it is important “to support an economy that uses less natural resources and emits less greenhouse gas” (73%, -2), “to help the EU’s industrial base to be more competitive by promoting entrepreneurship and developing new skills” (70%, -2) and “to enhance the quality and appeal of the EU’s higher education system” (69%, -2).
Despite a 2-point decrease, 61% of Europeans still think it is important “to increase support for research and development policies and turn inventions into products”. “To develop the e-economy by strengthening ultra-fast Internet within the EU” is unchanged (50%, =).

STANDARD EUROBAROMETER 79 FIRST RESULTS – SPRING 2013
31
2. The Europe 2020 targets
All the Europe 2020 strategy targets are considered “about right” by majorities of Europeans, in most cases by absolute majorities.
As in autumn 2012, the most credible targets are “three-quarters of men and women between 20 and 64 years of age should have a job” (59%, =) and “to increase energy efficiency in the EU by 20% by 2020” (59%, =). They are followed by “to increase the share of renewable energy in the EU by 20% by 2020” (57%, =), “the share of funds invested in research and development should reach 3% of the wealth produced in the EU each year” (56%, -1) and “to reduce EU greenhouse gas emissions by at least 20% by 2020 compared to 1990” (54%, -1).
Around half of Europeans consider that it is reasonable that “the number of young people leaving school with no qualifications should fall to 10%” (51%, =) and that “the number of Europeans living below the poverty line should be reduced by a quarter by 2020” (49%, =).
Finally, 47% of Europeans believe that “at least 40% of the younger generation should have a degree or a diploma” (-1 since autumn 2012).

STANDARD EUROBAROMETER 79 FIRST RESULTS – SPRING 2013
32
3. Overall
European citizens continue to consider that the European Union is going “in the right direction” to emerge from the crisis and face the new world challenges (42%, +1 percentage point since autumn 2012). Conversely, three Europeans in ten think that the EU is going in the wrong direction (30%, -2). One in five replied spontaneously “neither the one nor the other” (20%, +2) and 8% (-1) say that they “don’t know”.
The feeling that the EU is going in the right direction continues to be much more widespread outside the euro area (50%, +1, vs. 26%, -3) than inside it (37%, unchanged, vs. 32%, -1).

STANDARD EUROBAROMETER 79 FIRST RESULTS – SPRING 2013
33
CONCLUSION
The results from this Standard Eurobarometer survey conducted in May 2013, during the European Year of Citizens, reveal that a clear majority of Europeans feel they are citizens of the EU. When it comes to the knowledge of rights as citizens of the EU, Europeans are divided: more than half do not know their rights, but a strong minority declare that they do so. The willingness to know more about these rights is widespread: close to six EU citizens in ten would like to know more about it. However, this proportion has lost ground since spring 2010. The free movement of people, good and services within the EU and peace amongst the Member States of the EU remain, far ahead the other dimensions, perceived as the most positive results of the EU.
The indicators of support in the EU are generally stable: the image of the EU remains unchanged since autumn 2012, with the proportion of Europeans having a positive image of the EU just ahead the proportion of whom it is negative. Trust in the EU registers a slight decrease, but it is still higher than the levels recorded for national governments and parliaments. A majority of citizens are optimistic regarding the future of the European Union. A year ahead of the 2014 European elections, half of Europeans know that MEPs are directly elected by the citizens of the different EU Member States, and nine in ten have heard of the European Parliament, the institution to which they will elect their representatives in May 2014.
Large majorities of Europeans continue to say that the current economic situation is bad at national, European and global levels. Wide differences exist between EU Member States and the gap between them has tended to widen since autumn 2012. In comparison with autumn 2012, expectations for the coming twelve months have improved, especially for the situation of the economy, but also, to a lesser extent, for the personal situation.
The most striking improvement is in public perceptions of the impact of the crisis on the job market: the view that this impact has reached its peak has gained ground sharply, almost approaching the level of spring 2010. The euro is supported by an outright majority of Europeans and the European Union continues to be seen as the actor best able to take effective action to tackle the effects of the crisis.
The continuing high degree of importance ascribed by the public to the Europe 2020 strategy objectives suggests that citizens are of one mind with the EU when it comes to the actions put in place to exit the crisis; further, a relative majority of Europeans think that the EU is going in the right direction to emerge from the crisis and face the new challenges.

STANDARD EUROBAROMETER 79 PUBLIC OPINION IN THE EU – SPRING 2013
TS1
STANDARD EUROBAROMETER 79 Public opinion in the European Union
TECHNICAL SPECIFICATIONS Between the 10th and 26th of May 2013 TNS Opinion & Social, a consortium created between TNS plc and TNS opinion, carried out the wave 79.3 of the EUROBAROMETER survey, on request of the EUROPEAN COMMISSION, Directorate-General for Communication, “Research and Speechwriting”. The wave 79.3 is the STANDARD EUROBAROMETER 79 survey and covers the population of the respective nationalities of the European Union Member States, resident in each of the Member States and aged 15 years and over. The STANDARD EUROBAROMETER 79 survey has also been conducted in the six candidate countries (Croatia, Turkey, the Former Yugoslav Republic of Macedonia, Iceland, Montenegro and Serbia) and in the Turkish Cypriot Community. In these countries, the survey covers the national population of citizens and the population of citizens of all the European Union Member States that are residents in these countries and have a sufficient command of the national languages to answer the questionnaire. The basic sample design applied in all states is a multi-stage, random (probability) one. In each country, a number of sampling points was drawn with probability proportional to population size (for a total coverage of the country) and to population density.
In order to do so, the sampling points were drawn systematically from each of the "administrative regional units", after stratification by individual unit and type of area. They thus represent the whole territory of the countries surveyed according to the EUROSTAT NUTS II (or equivalent) and according to the distribution of the resident population of the respective nationalities in terms of metropolitan, urban and rural areas. In each of the selected sampling points, a starting address was drawn, at random. Further addresses (every Nth address) were selected by standard "random route" procedures, from the initial address. In each household, the respondent was drawn, at random (following the "closest birthday rule"). All interviews were conducted face-to-face in people's homes and in the appropriate national language. As far as the data capture is concerned, CAPI (Computer Assisted Personal Interview) was used in those countries where this technique was available. For each country a comparison between the sample and the universe was carried out. The Universe description was derived from Eurostat population data or from national statistics offices. For all countries surveyed, a national weighting procedure, using marginal and intercellular weighting, was carried out based on this Universe description. In all countries, gender, age, region and size of locality were introduced in the iteration procedure. For international weighting (i.e. EU averages), TNS Opinion & Social applies the official population figures as provided by EUROSTAT or national statistic offices. The total population figures for input in this post-weighting procedure are listed below.

STANDARD EUROBAROMETER 79 PUBLIC OPINION IN THE EU – SPRING 2013
TS2
Readers are reminded that survey results are estimations, the accuracy of which, everything being equal, rests upon the sample size and upon the observed percentage. With samples of about 1,000 interviews, the real percentages vary within the following confidence limits:
various sample sizes are in rows various observed results are in columns
5% 10% 15% 20% 25% 30% 35% 40% 45% 50%
95% 90% 85% 80% 75% 70% 65% 60% 55% 50%
N=50 6,0 8,3 9,9 11,1 12,0 12,7 13,2 13,6 13,8 13,9 N=50
N=500 1,9 2,6 3,1 3,5 3,8 4,0 4,2 4,3 4,4 4,4 N=500
N=1000 1,4 1,9 2,2 2,5 2,7 2,8 3,0 3,0 3,1 3,1 N=1000
N=1500 1,1 1,5 1,8 2,0 2,2 2,3 2,4 2,5 2,5 2,5 N=1500
N=2000 1,0 1,3 1,6 1,8 1,9 2,0 2,1 2,1 2,2 2,2 N=2000
N=3000 0,8 1,1 1,3 1,4 1,5 1,6 1,7 1,8 1,8 1,8 N=3000
N=4000 0,7 0,9 1,1 1,2 1,3 1,4 1,5 1,5 1,5 1,5 N=4000
N=5000 0,6 0,8 1,0 1,1 1,2 1,3 1,3 1,4 1,4 1,4 N=5000
N=6000 0,6 0,8 0,9 1,0 1,1 1,2 1,2 1,2 1,3 1,3 N=6000
N=7000 0,5 0,7 0,8 0,9 1,0 1,1 1,1 1,1 1,2 1,2 N=7000
N=7500 0,5 0,7 0,8 0,9 1,0 1,0 1,1 1,1 1,1 1,1 N=7500
N=8000 0,5 0,7 0,8 0,9 0,9 1,0 1,0 1,1 1,1 1,1 N=8000
N=9000 0,5 0,6 0,7 0,8 0,9 0,9 1,0 1,0 1,0 1,0 N=9000
N=10000 0,4 0,6 0,7 0,8 0,8 0,9 0,9 1,0 1,0 1,0 N=10000
N=11000 0,4 0,6 0,7 0,7 0,8 0,9 0,9 0,9 0,9 0,9 N=11000
N=12000 0,4 0,5 0,6 0,7 0,8 0,8 0,9 0,9 0,9 0,9 N=12000
N=13000 0,4 0,5 0,6 0,7 0,7 0,8 0,8 0,8 0,9 0,9 N=13000
N=14000 0,4 0,5 0,6 0,7 0,7 0,8 0,8 0,8 0,8 0,8 N=14000
N=15000 0,3 0,5 0,6 0,6 0,7 0,7 0,8 0,8 0,8 0,8 N=15000
5% 10% 15% 20% 25% 30% 35% 40% 45% 50%
95% 90% 85% 80% 75% 70% 65% 60% 55% 50%
Statistical Margins due to the sampling process
(at the 95% level of confidence)

STANDARD EUROBAROMETER 79 PUBLIC OPINION IN THE EU – SPRING 2013
TS3
ABBR. COUNTRIES INSTITUTES N° INTERVIEWS
FIELDWORK DATES
POPULATION 15+
BE Belgium TNS Dimarso 1.013 11/05/2013 26/05/2013 8.939.546 BG Bulgaria TNS BBSS 1.029 13/05/2013 20/05/2013 6.537.510 CZ Czech Rep. TNS Aisa 1.001 11/05/2013 24/05/2013 9.012.443 DK Denmark TNS Gallup DK 1.005 10/05/2013 26/05/2013 4.561.264 DE Germany TNS Infratest 1.554 10/05/2013 26/05/2013 64.336.389 EE Estonia Emor 1.002 10/05/2013 26/05/2013 945.733 IE Ireland IMS Millward Brown 1.002 11/05/2013 26/05/2013 3.522.000 EL Greece TNS ICAP 1.000 11/05/2013 25/05/2013 8.693.566 ES Spain TNS Demoscopia 1.011 13/05/2013 26/05/2013 39.127.930 FR France TNS Sofres 1.019 11/05/2013 25/05/2013 47.756.439 IT Italy TNS Italia 1.011 11/05/2013 24/05/2013 51.862.391 CY Rep. of Cyprus Synovate 505 10/05/2013 25/05/2013 660.400 LV Latvia TNS Latvia 1.002 10/05/2013 26/05/2013 1.447.866 LT Lithuania TNS LT 1.029 10/05/2013 26/05/2013 2.829.740 LU Luxembourg TNS ILReS 505 10/05/2013 26/05/2013 434.878 HU Hungary TNS Hoffmann Kft 1.027 11/05/2013 25/05/2013 8.320.614 MT Malta MISCO 500 10/05/2013 26/05/2013 335.476 NL Netherlands TNS NIPO 1.021 11/05/2013 26/05/2013 13.371.980
AT Austria Österreichisches Gallup-Institut 999 10/05/2013 26/05/2013 7.009.827
PL Poland TNS OBOP 1.000 11/05/2013 26/05/2013 32.413.735 PT Portugal TNS EUROTESTE 1.004 11/05/2013 26/05/2013 8.080.915 RO Romania TNS CSOP 1.083 11/05/2013 21/05/2013 18.246.731 SI Slovenia RM PLUS 1.011 11/05/2013 26/05/2013 1.759.701 SK Slovakia TNS Slovakia 1.000 10/05/2013 24/05/2013 4.549.955 FI Finland TNS Gallup Oy 956 10/05/2013 26/05/2013 4.440.004 SE Sweden TNS GALLUP 1.011 11/05/2013 26/05/2013 7.791.240 UK United Kingdom TNS UK 1.305 11/05/2013 26/05/2013 51.848.010
TOTAL EU27 26.605 10/05/2013 26/05/2013 408.836.283
CY(tcc) Turkish Cypriot Community Kadem 500 11/05/2013 23/05/2013 143.226
HR Croatia Puls 1.000 14/05/2013 26/05/2013 3.749.400 TR Turkey TNS PIAR 1.001 11/05/2013 24/05/2013 54.844.406
MK Former Yugoslav Rep. of Macedonia TNS Brima 1.056 11/05/2013 20/05/2013 1.678.404
IS Iceland Capacent 511 11/05/2013 26/05/2013 252.277 ME Montenegro TNS Medium Gallup 1.015 11/05/2013 24/05/2013 492.265 RS Serbia TNS Medium Gallup 1.006 11/05/2013 25/05/2013 6.409.693
TOTAL 32.694 10/05/2013 26/05/2013 476.405.954