Embed Size (px)
Citation preview
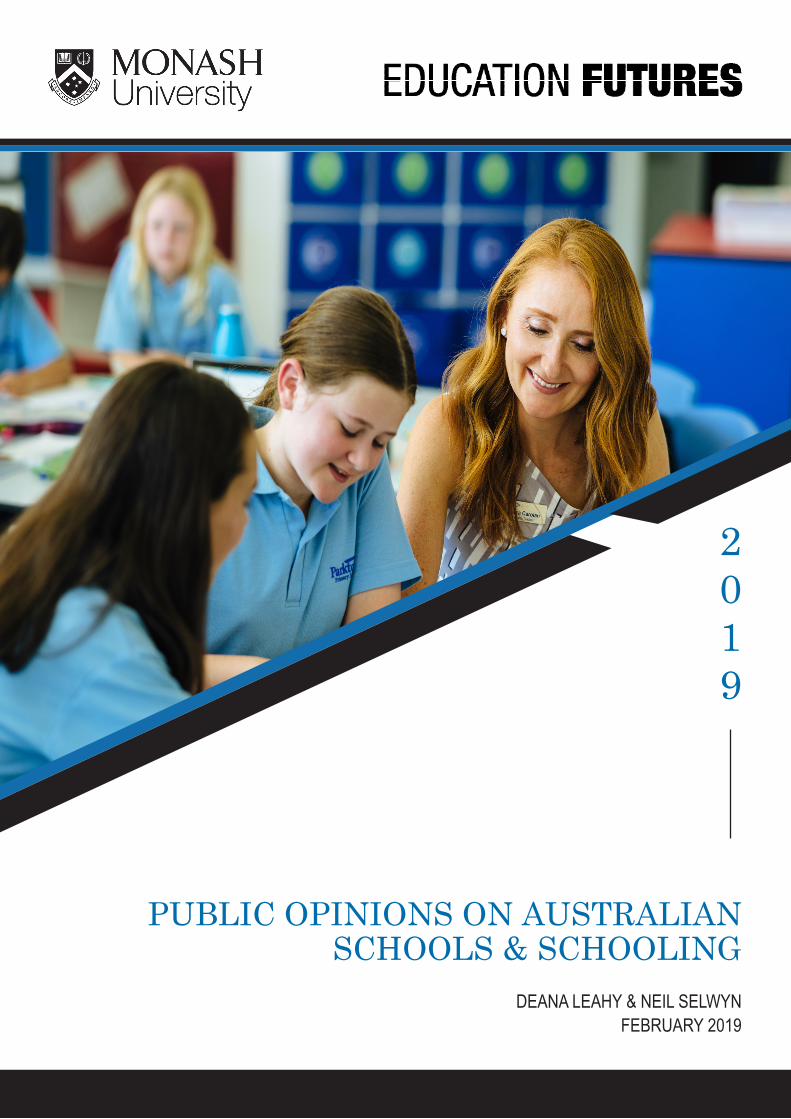
PUBLIC OPINIONS ON AUSTRALIAN SCHOOLS & SCHOOLING
DEANA LEAHY & NEIL SELWYNFEBRUARY 2019
2019
PAGE 1PAGE 1
BACKGROUND
Public debate on schools and schooling is a prominent part of Australian politics. Recent years have seen a series of controversies about what is taught in Australian schools, alongside criticisms of the quality of teaching and resulting learning outcomes. Recent headlines have pointed to a perceived declining quality of teachers and teacher education, alongside increasing concerns over poor student discipline and behaviour. The relatively low standing of Australian schools, in terms of the OECD Programme for International Student Assessment (PISA) rankings, has led to continued headlines of “Students’ falling test scores costing the nation $120b in lost GDP” (ABC News, 3 April 2018) and “Australia faces a slide into national illiteracy” (The Age, 21 March 2018).
Elsewhere, controversy over initiatives such as the Safe Schools program continues to prompt conservative criticisms along the lines of “Progressive fads promote cultural illiteracy in schools” (The Australian, 18 Jan 2019) and “Focus on soft skills will lead us astray” (The Australian, 26 Nov 2018). Conversely, progressive critics bemoan schools as being out-of-touch and out-of-date. As an example: “Australian schools ‘not preparing students for real life’” (9News, 29 July 2018) and “Antiquated school day is failing everyone” (Sydney Morning Herald, 16 June 2018). All told, the public can be forgiven for presuming Australian schools to be in need of considerable improvement.
So what does the Australian public make of the nation’s schools? Amidst ongoing media and political discussions of failing schools, crises in teacher quality and classroom behaviour, it is surprisingly rare to canvas public opinion on schools in detail. We believe that this sort of information should be an important element of the national education debate. For example, one of the few regular surveys of public opinion on education is the US-based ‘Phi Delta Kappa’ ‘PDK Poll of the Public’s Attitudes Toward the Public Schools’. Starting in 1969, the PDK poll has provided annual insights into public opinion about relevant issues in K-12 education. The 2018 PDK poll canvased over 1000 US adults on their views about teacher pay, teacher strikes, school spending, college tuition, and expectations for all children. Data of this sort provides a rich picture of how opinions on US schools are patterned, and has become a key part of informing the national debate on US education.
Against this background, there is definite value in canvassing public opinion on education in Australia. As such, this report presents an initial snapshot account of public opinion in Australia regarding schools and schooling. Based on a nationally-representative survey of 2052 adults, the report addresses the following questions:
• How do people rate the current performance of Australian public schools in terms of learning outcomes?• How do people think Australian public schools will be performing in 10 years’ time?• What characteristics and qualities do people think are most important in relation to children’s education?• Which areas of the current school curriculum should be given more emphasis and time within Australian public schools
over the next few years?• What new learning areas do people think should be taught in public schools?
Our key aim in asking these questions is to explore where notable differences exist in public opinion on the state of Australian schools. This includes looking for differences between voters of the main political parties, between parents and non-parents, people living in different areas, and those with different educational backgrounds. We are particularly interested in identifying the key demographic patterning of public opinion. This might include differences between different socio economic groups, ages, gender, levels of household income and cultural & linguistic diversity.
Attribution: Deana Leahy & Neil Selwyn (2019). Public opinions on Australian schools and schooling. Melbourne, Monash University
RESEARCH REPORT
PAGE 1PAGE 2
As this report details, perhaps the most surprising initial findings from our survey is that we did not find particularly high levels of dissatisfaction about the current and future state of school performance. Nevertheless, some notable differences are apparent between age cohorts, income groups, and other demographic characteristics. These findings have significant implications for the development of education policymaking, education practice and perhaps rebalancing the ways in which education is publically discussed and debated over the next ten years or so.
Attribution: Deana Leahy & Neil Selwyn (2019). Public opinions on Australian schools and schooling. Melbourne, Monash University
RESEARCH REPORT
PAGE 1PAGE 3
METHODOLOGY
This report presents an analysis of data generated by a nationally-representative survey of 2052 Australian adults. A 45-item questionnaire was developed to gauge public opinions on Australian schools. Two sections of the survey concentrated on the current use of digital technology in schools, as well as the future of schools in an increasingly digital age (these technology-related issues are reported separately — see Selwyn [January 2019] ‘Digital Lessons’ report). This present report provides an overview of the survey sections relating to public opinions on Australian school performance, curriculum subjects, and future priorities.
The research was conducted by Whereto Research using participants from the Online Research Unit (ORU) online panel cohort. The survey was administered to members of the ORU panel, and responses collected between 11 and 30 November 2018. This resulted in a sample of 2052 adult residents eligible to vote Australia.
The final sample (see Table 1) was broadly representative of Australian population figures in terms of gender, age, region and socio economic status (see Appendix for further details).
Attribution: Deana Leahy & Neil Selwyn (2019). Public opinions on Australian schools and schooling. Melbourne, Monash University
RESEARCH REPORT

PAGE 1PAGE 4
Attribution: Deana Leahy & Neil Selwyn (2019). Public opinions on Australian schools and schooling. Melbourne, Monash University
RESEARCH REPORT
n PercentageGenderMale 1008 49.3Female 1038 50.7Age range (years)18-29 435 21.230-39 375 18.340-49 387 18.950-59 355 17.360+ 500 24.4Socio-economic status (postcode data)Low 534 26.0Medium 847 41.3High 671 32.7Urbanity (postcode data)Metro 1158 75.9Regional 494 24.1Household compositionHousehold with child(ren) who are currently attending school 469 22.9Household with no children currently attending school 1583 77.1Family backgroundHave/have had children attending school 909 44.3Have not had children attending school 1143 55.7State*New South Wales (NSW) 659 32.1Victoria (VIC) 519 25.3Queensland (QLD) 413 20.1Western Australia (WA) 217 10.6South Australia (SA) 143 7.0Tasmania (TAS) 46 2.2Australian Capital Territory (ACT) 41 2.0Northern Territory (NT) 14 0.7Speak a language other than English at home?Yes 348 17.2No 1679 82.8Annual household income before taxUp to $39,999 428 24.5$40,000 to $79,999 542 31.1$80,000 to $119,999 424 24.3$120,000 to $199,999 285 16.3$200,000 or more 65 3.7Highest education level completedYear 12 or below 538 26.7TAFE/Technical 228 11.3Certificate or Diploma 449 22.3University degree or higher 802 39.8Voter preference at last Federal electionLiberal/National Alliance 673 47.4Labor 583 41.2The Greens 163 11.5Sector where children attend(ed) schoolGovernment school 600 67.1Catholic school 186 20.8Independent/ private school 108 12.1
Table 1: Survey sample (n=2052) by main demographic characteristics
* Subsequent reporting of data by State will only include the five most populous States for which relatively large sub-samples were collected.
PAGE 1PAGE 5
RESULTS
1. PUBLIC OPINIONS ON SCHOOLS’ PERFORMANCE
The first issue that the survey explored was how well respondents feel Australian schools are performing. Respondents were asked questions regarding their opinions on how well they felt Australian schools were currently performing, as well as how well they thought schools would be performing in ten years’ time.
Any discussion of school performance is inevitably subjective. For these opening questions, the definition of ‘performance’ is specified as relating to learning outcomes. Respondents’ views on the specific areas of learning that they think schools should be concentrating on are explored in subsequent sections of the survey.
1.1 How well Australian schools are currently performing
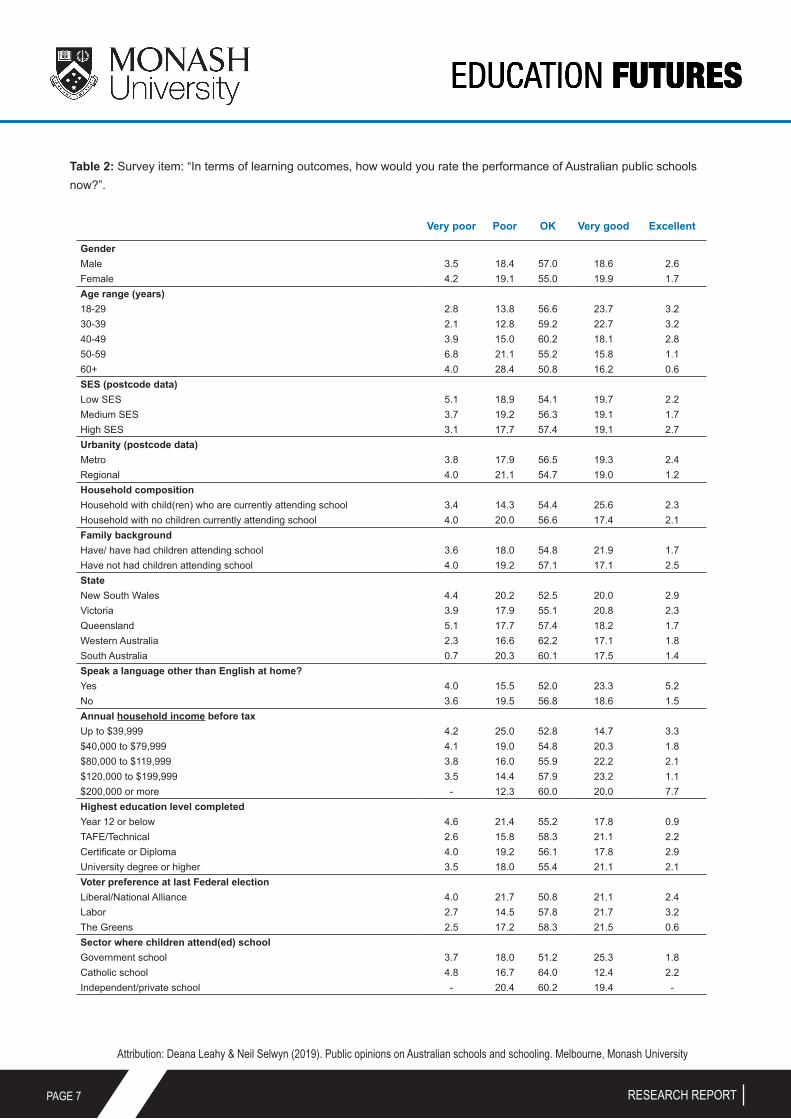
In these broad terms, we find a substantial proportion of respondents to be relatively satisfied with the current performance of Australian public schools. In response to the item, “In terms of learning outcomes, how would you rate the performance of Australian public schools now?”, the most popular judgement is ‘OK’ (56.1 percent of respondents), with a further 21.3 percent giving ratings of ‘very good’ or ‘excellent’. In contrast, just over one-fifth of the sample (22.5 percent) give ratings of ‘poor’ or ‘very poor’.
Differences in responses to this question by respondent characteristics are presented in Table 2. This shows the overall pattern of responses to be fairly stable across most key demographic characteristics with broadly similar patterns between residents of regional and metropolitan areas, different levels of educational background, political preference and so on.
The most notable difference is in terms of age group. Here we find adults in older age groups to be more negative. For example, 32.4 percent of respondents aged 60+ years deem schools to be ‘poor’ or ‘very poor’, compared to those aged 18-29 years (16.6%) and 30-39 years (14.9%).
A few other minor differences are also worth noting:
• Respondents with children currently attending school are more likely to rate schools as ‘very good’ or ‘excellent’ (27.9%) as compared to those without children at school (19.5%).
• Higher levels of satisfaction are evident amongst respondents in households where a language other than English is spoken at home (28.5% rating schools as ‘very good’ or ‘excellent’ as compared to 21.1% of respondents in English-only households).
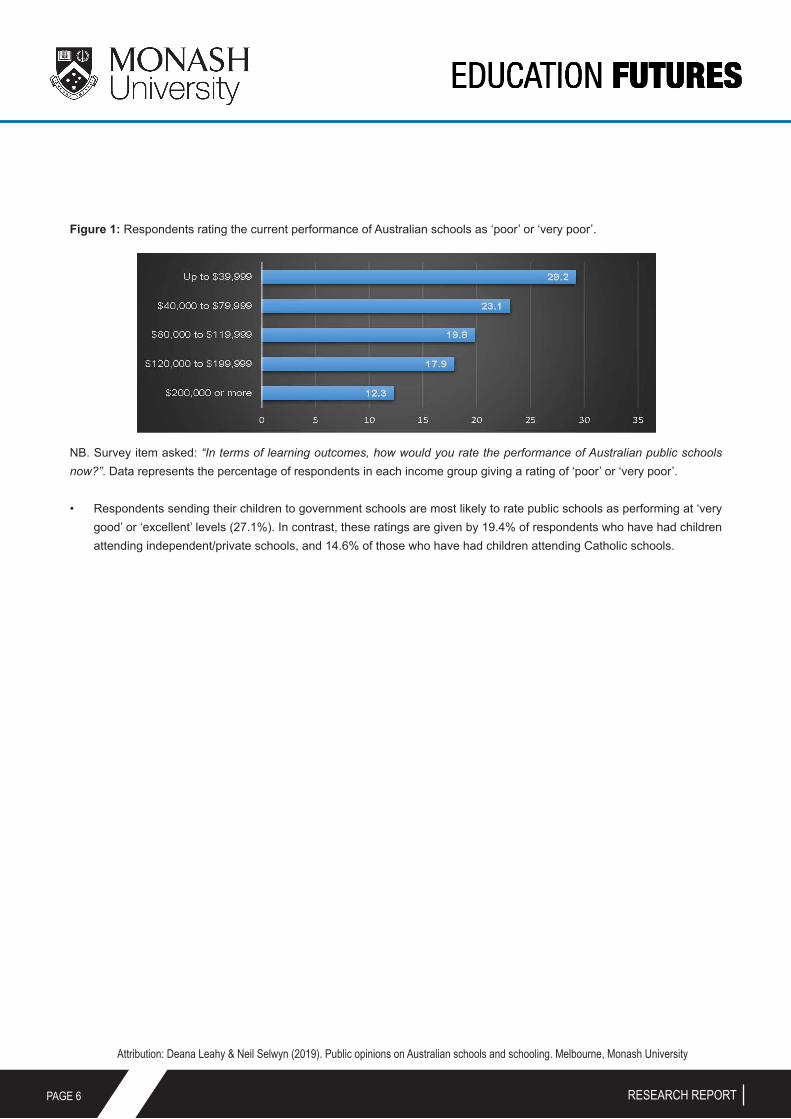
• Dis-satisfaction with current school performance is more pronounced amongst those respondents with lower levels of household income. Here we find 29.2 percent of respondents in the lowest income group (Up to $39,999) to rate the current performance of Australian schools as ‘poor’ or ‘very poor’. In contrast, these ratings are only given by 12.3% of respondents in the “$200,000 or more” income band (see Figure 1).
Attribution: Deana Leahy & Neil Selwyn (2019). Public opinions on Australian schools and schooling. Melbourne, Monash University
RESEARCH REPORT
PAGE 1PAGE 6
Figure 1: Respondents rating the current performance of Australian schools as ‘poor’ or ‘very poor’.
NB. Survey item asked: “In terms of learning outcomes, how would you rate the performance of Australian public schools now?”. Data represents the percentage of respondents in each income group giving a rating of ‘poor’ or ‘very poor’.
• Respondents sending their children to government schools are most likely to rate public schools as performing at ‘very good’ or ‘excellent’ levels (27.1%). In contrast, these ratings are given by 19.4% of respondents who have had children attending independent/private schools, and 14.6% of those who have had children attending Catholic schools.
Attribution: Deana Leahy & Neil Selwyn (2019). Public opinions on Australian schools and schooling. Melbourne, Monash University
RESEARCH REPORT
PAGE 1PAGE 7
Table 2: Survey item: “In terms of learning outcomes, how would you rate the performance of Australian public schools now?”.
Attribution: Deana Leahy & Neil Selwyn (2019). Public opinions on Australian schools and schooling. Melbourne, Monash University
RESEARCH REPORT
Very poor Poor OK Very good Excellent
GenderMale 3.5 18.4 57.0 18.6 2.6Female 4.2 19.1 55.0 19.9 1.7Age range (years)18-29 2.8 13.8 56.6 23.7 3.230-39 2.1 12.8 59.2 22.7 3.240-49 3.9 15.0 60.2 18.1 2.850-59 6.8 21.1 55.2 15.8 1.160+ 4.0 28.4 50.8 16.2 0.6SES (postcode data)Low SES 5.1 18.9 54.1 19.7 2.2Medium SES 3.7 19.2 56.3 19.1 1.7High SES 3.1 17.7 57.4 19.1 2.7Urbanity (postcode data)Metro 3.8 17.9 56.5 19.3 2.4Regional 4.0 21.1 54.7 19.0 1.2Household compositionHousehold with child(ren) who are currently attending school 3.4 14.3 54.4 25.6 2.3Household with no children currently attending school 4.0 20.0 56.6 17.4 2.1Family backgroundHave/ have had children attending school 3.6 18.0 54.8 21.9 1.7Have not had children attending school 4.0 19.2 57.1 17.1 2.5StateNew South Wales 4.4 20.2 52.5 20.0 2.9Victoria 3.9 17.9 55.1 20.8 2.3Queensland 5.1 17.7 57.4 18.2 1.7Western Australia 2.3 16.6 62.2 17.1 1.8South Australia 0.7 20.3 60.1 17.5 1.4Speak a language other than English at home?Yes 4.0 15.5 52.0 23.3 5.2No 3.6 19.5 56.8 18.6 1.5Annual household income before taxUp to $39,999 4.2 25.0 52.8 14.7 3.3$40,000 to $79,999 4.1 19.0 54.8 20.3 1.8$80,000 to $119,999 3.8 16.0 55.9 22.2 2.1$120,000 to $199,999 3.5 14.4 57.9 23.2 1.1$200,000 or more - 12.3 60.0 20.0 7.7Highest education level completedYear 12 or below 4.6 21.4 55.2 17.8 0.9TAFE/Technical 2.6 15.8 58.3 21.1 2.2Certificate or Diploma 4.0 19.2 56.1 17.8 2.9University degree or higher 3.5 18.0 55.4 21.1 2.1Voter preference at last Federal electionLiberal/National Alliance 4.0 21.7 50.8 21.1 2.4Labor 2.7 14.5 57.8 21.7 3.2The Greens 2.5 17.2 58.3 21.5 0.6Sector where children attend(ed) schoolGovernment school 3.7 18.0 51.2 25.3 1.8Catholic school 4.8 16.7 64.0 12.4 2.2Independent/private school - 20.4 60.2 19.4 -
PAGE 1PAGE 8
1.2 How well Australian schools will perform in the future
Alongside these views on the current performance of schools, the survey also explored people’s future expectations. This took the form of a question: “In terms of learning outcomes, how do you think Australian public schools will be performing in 10 years’ time?”.
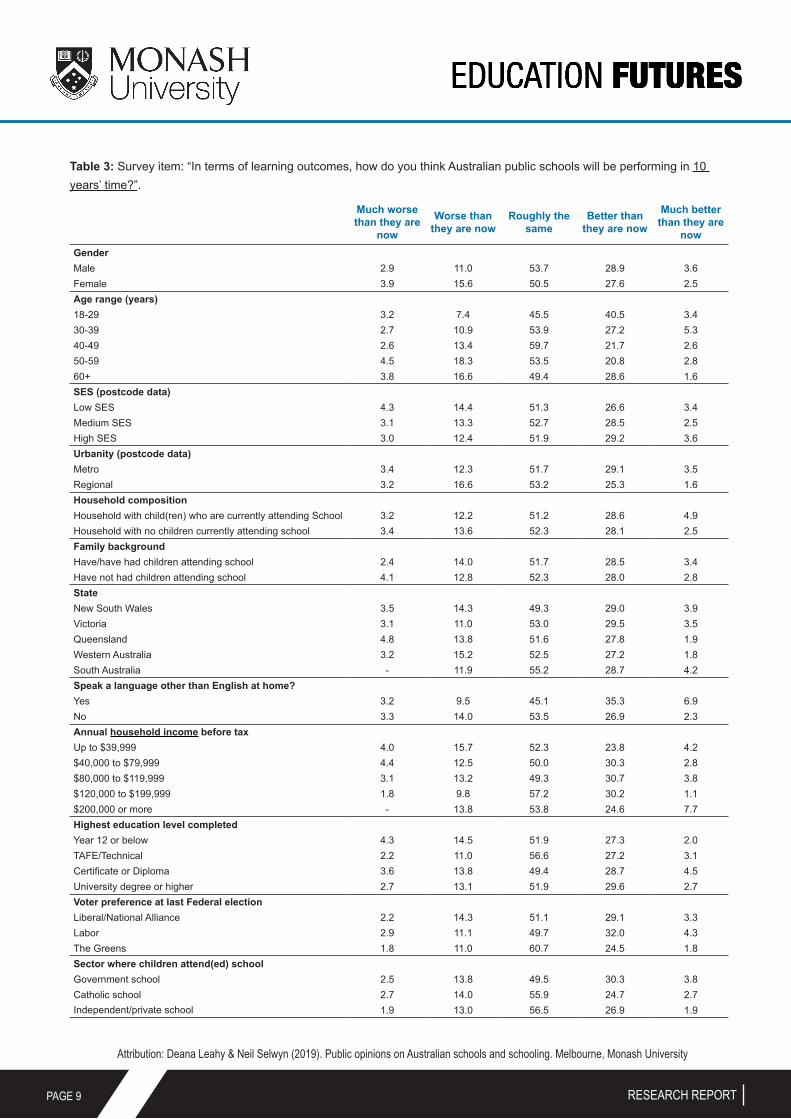
Here we find respondents to be mostly hopeful with 31.3 percent expecting schools to be ‘Better than they are now’ or ‘Much better than they are now’, and further 52.0 percent reckoning schools will stay ‘roughly the same’.
As Table 3 shows, the general pattern of responses is fairly stable across most key demographic characteristics. However, we do find notable age-related differences in these views of schools’ future performance. In particular, we find younger respondents to be more optimistic about the future. 43.9% of respondents in the ‘18-29 years’ age group expect schools to be ‘Much/Better than they are now’, as compared to only 23.6% of those aged ‘50-59 years’ and 24.3% of those aged ‘40-49 years’.
The other notable difference is in terms of respondents in households where a language other than English is spoken at home (42.2% expecting schools to be ‘Better’ or ‘Much better’ as compared to 29.2% of respondents in English-only households).
Attribution: Deana Leahy & Neil Selwyn (2019). Public opinions on Australian schools and schooling. Melbourne, Monash University
RESEARCH REPORT
PAGE 1PAGE 9
Table 3: Survey item: “In terms of learning outcomes, how do you think Australian public schools will be performing in 10 years’ time?”.
Attribution: Deana Leahy & Neil Selwyn (2019). Public opinions on Australian schools and schooling. Melbourne, Monash University
RESEARCH REPORT
Much worse than they are
now
Worse than they are now
Roughly the same
Better than they are now
Much better than they are
nowGenderMale 2.9 11.0 53.7 28.9 3.6Female 3.9 15.6 50.5 27.6 2.5Age range (years)18-29 3.2 7.4 45.5 40.5 3.430-39 2.7 10.9 53.9 27.2 5.340-49 2.6 13.4 59.7 21.7 2.650-59 4.5 18.3 53.5 20.8 2.860+ 3.8 16.6 49.4 28.6 1.6SES (postcode data)Low SES 4.3 14.4 51.3 26.6 3.4Medium SES 3.1 13.3 52.7 28.5 2.5High SES 3.0 12.4 51.9 29.2 3.6Urbanity (postcode data)Metro 3.4 12.3 51.7 29.1 3.5Regional 3.2 16.6 53.2 25.3 1.6Household compositionHousehold with child(ren) who are currently attending School 3.2 12.2 51.2 28.6 4.9Household with no children currently attending school 3.4 13.6 52.3 28.1 2.5Family backgroundHave/have had children attending school 2.4 14.0 51.7 28.5 3.4Have not had children attending school 4.1 12.8 52.3 28.0 2.8StateNew South Wales 3.5 14.3 49.3 29.0 3.9Victoria 3.1 11.0 53.0 29.5 3.5Queensland 4.8 13.8 51.6 27.8 1.9Western Australia 3.2 15.2 52.5 27.2 1.8South Australia - 11.9 55.2 28.7 4.2Speak a language other than English at home?Yes 3.2 9.5 45.1 35.3 6.9No 3.3 14.0 53.5 26.9 2.3Annual household income before taxUp to $39,999 4.0 15.7 52.3 23.8 4.2$40,000 to $79,999 4.4 12.5 50.0 30.3 2.8$80,000 to $119,999 3.1 13.2 49.3 30.7 3.8$120,000 to $199,999 1.8 9.8 57.2 30.2 1.1$200,000 or more - 13.8 53.8 24.6 7.7Highest education level completedYear 12 or below 4.3 14.5 51.9 27.3 2.0TAFE/Technical 2.2 11.0 56.6 27.2 3.1Certificate or Diploma 3.6 13.8 49.4 28.7 4.5University degree or higher 2.7 13.1 51.9 29.6 2.7Voter preference at last Federal electionLiberal/National Alliance 2.2 14.3 51.1 29.1 3.3Labor 2.9 11.1 49.7 32.0 4.3The Greens 1.8 11.0 60.7 24.5 1.8Sector where children attend(ed) schoolGovernment school 2.5 13.8 49.5 30.3 3.8Catholic school 2.7 14.0 55.9 24.7 2.7Independent/private school 1.9 13.0 56.5 26.9 1.9
PAGE 1PAGE 10
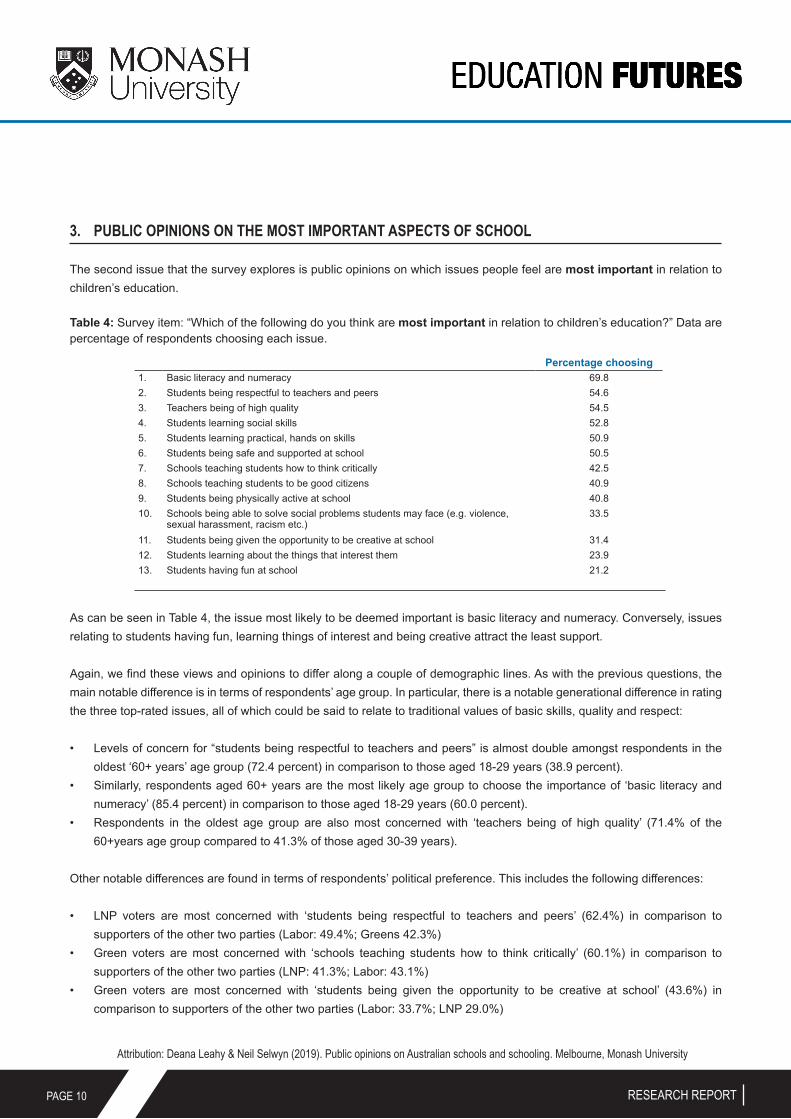
3. PUBLIC OPINIONS ON THE MOST IMPORTANT ASPECTS OF SCHOOL
The second issue that the survey explores is public opinions on which issues people feel are most important in relation to children’s education.
Table 4: Survey item: “Which of the following do you think are most important in relation to children’s education?” Data are percentage of respondents choosing each issue.
As can be seen in Table 4, the issue most likely to be deemed important is basic literacy and numeracy. Conversely, issues relating to students having fun, learning things of interest and being creative attract the least support.
Again, we find these views and opinions to differ along a couple of demographic lines. As with the previous questions, the main notable difference is in terms of respondents’ age group. In particular, there is a notable generational difference in rating the three top-rated issues, all of which could be said to relate to traditional values of basic skills, quality and respect:
• Levels of concern for “students being respectful to teachers and peers” is almost double amongst respondents in the oldest ‘60+ years’ age group (72.4 percent) in comparison to those aged 18-29 years (38.9 percent).
• Similarly, respondents aged 60+ years are the most likely age group to choose the importance of ‘basic literacy and numeracy’ (85.4 percent) in comparison to those aged 18-29 years (60.0 percent).
• Respondents in the oldest age group are also most concerned with ‘teachers being of high quality’ (71.4% of the 60+years age group compared to 41.3% of those aged 30-39 years).
Other notable differences are found in terms of respondents’ political preference. This includes the following differences:
• LNP voters are most concerned with ‘students being respectful to teachers and peers’ (62.4%) in comparison to supporters of the other two parties (Labor: 49.4%; Greens 42.3%)
• Green voters are most concerned with ‘schools teaching students how to think critically’ (60.1%) in comparison to supporters of the other two parties (LNP: 41.3%; Labor: 43.1%)
• Green voters are most concerned with ‘students being given the opportunity to be creative at school’ (43.6%) in comparison to supporters of the other two parties (Labor: 33.7%; LNP 29.0%)
Attribution: Deana Leahy & Neil Selwyn (2019). Public opinions on Australian schools and schooling. Melbourne, Monash University
RESEARCH REPORT
Percentage choosing1. Basic literacy and numeracy 69.82. Students being respectful to teachers and peers 54.63. Teachers being of high quality 54.54. Students learning social skills 52.85. Students learning practical, hands on skills 50.96. Students being safe and supported at school 50.57. Schools teaching students how to think critically 42.58. Schools teaching students to be good citizens 40.99. Students being physically active at school 40.810. Schools being able to solve social problems students may face (e.g. violence,
sexual harassment, racism etc.)33.5
11. Students being given the opportunity to be creative at school 31.412. Students learning about the things that interest them 23.913. Students having fun at school 21.2

PAGE 1PAGE 11
Otherwise, we find a few other individual differences are with regards to specific issues. These include:
• Respondents with a university degree or higher are most concerned with ‘schools teaching students how to think critically’ (56.2%) in comparison to 29.8% of those with a TAFE/ technical college background.
• Support for ‘basic literacy and numeracy’ is notably higher amongst respondents who live in households where only English is spoken (74.0 percent) in comparison to 52.0 percent of respondents living in households where a language other than English is spoken.
• Respondents who had sent their children to government schools are most concerned with ‘students having fun at school’ (25.5%) in comparison to parents of Catholic school students (14.5%) and independent/private school students (18.5%).
Attribution: Deana Leahy & Neil Selwyn (2019). Public opinions on Australian schools and schooling. Melbourne, Monash University
RESEARCH REPORT
PAGE 1PAGE 12
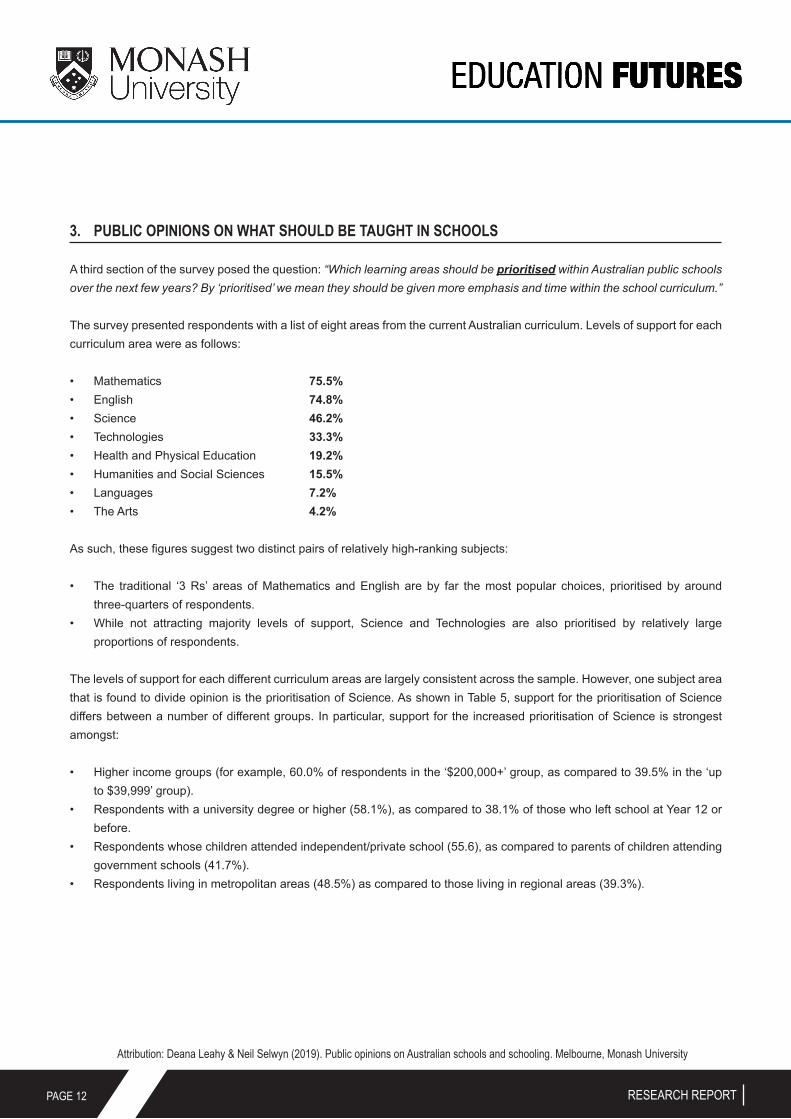
3. PUBLIC OPINIONS ON WHAT SHOULD BE TAUGHT IN SCHOOLS
A third section of the survey posed the question: “Which learning areas should be prioritised within Australian public schools over the next few years? By ‘prioritised’ we mean they should be given more emphasis and time within the school curriculum.”
The survey presented respondents with a list of eight areas from the current Australian curriculum. Levels of support for each curriculum area were as follows:
• Mathematics 75.5%• English 74.8%• Science 46.2%• Technologies 33.3%• Health and Physical Education 19.2%• Humanities and Social Sciences 15.5%• Languages 7.2%• The Arts 4.2%
As such, these figures suggest two distinct pairs of relatively high-ranking subjects:
• The traditional ‘3 Rs’ areas of Mathematics and English are by far the most popular choices, prioritised by around three-quarters of respondents.
• While not attracting majority levels of support, Science and Technologies are also prioritised by relatively large proportions of respondents.
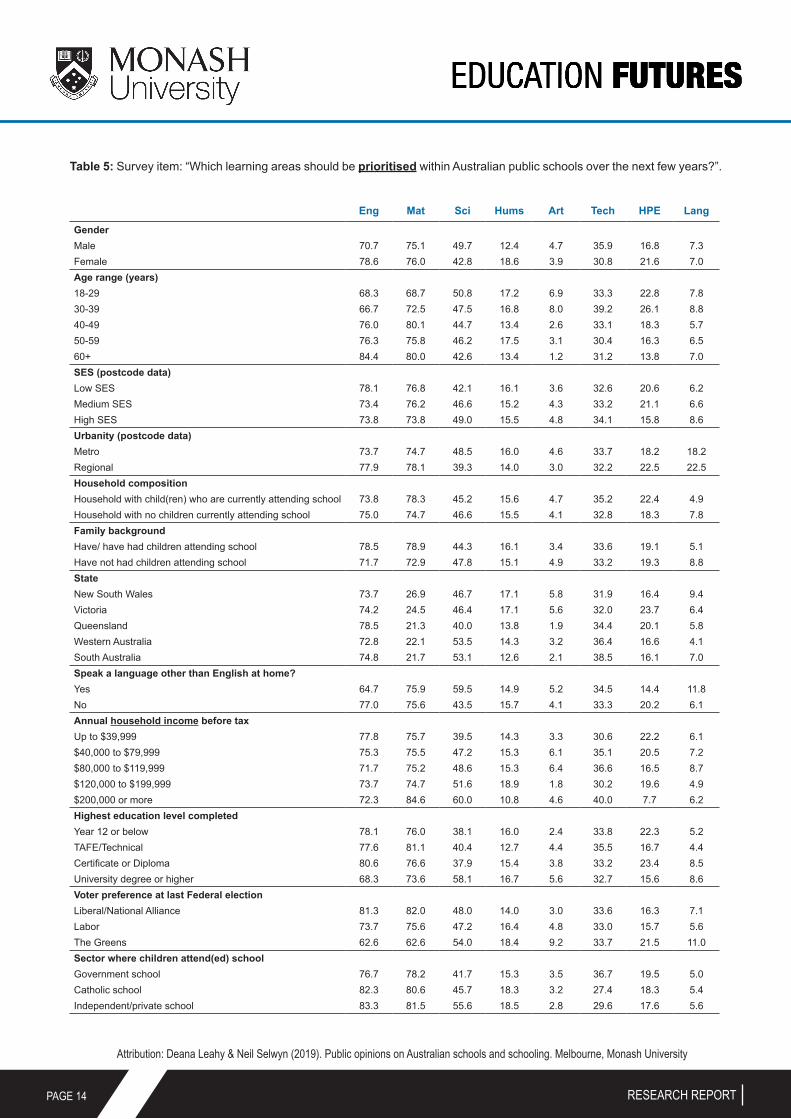
The levels of support for each different curriculum areas are largely consistent across the sample. However, one subject area that is found to divide opinion is the prioritisation of Science. As shown in Table 5, support for the prioritisation of Science differs between a number of different groups. In particular, support for the increased prioritisation of Science is strongest amongst:
• Higher income groups (for example, 60.0% of respondents in the ‘$200,000+’ group, as compared to 39.5% in the ‘up to $39,999’ group).
• Respondents with a university degree or higher (58.1%), as compared to 38.1% of those who left school at Year 12 or before.
• Respondents whose children attended independent/private school (55.6), as compared to parents of children attending government schools (41.7%).
• Respondents living in metropolitan areas (48.5%) as compared to those living in regional areas (39.3%).
Attribution: Deana Leahy & Neil Selwyn (2019). Public opinions on Australian schools and schooling. Melbourne, Monash University
RESEARCH REPORT
PAGE 1PAGE 13
In addition, a few specific differences are evident between younger and older respondents:
• Respondents in the oldest age group of 60+ years are the most likely to support prioritisation of English (84.4% as compared to 66.7% of those aged 30-39 years).
• Respondents aged 60+ years are also the least supportive age group of the prioritisation of Health & Physical Education.• While overall support for the prioritisation of Arts teaching is small, this is found predominantly amongst the younger age
groups (i.e. respondents aged 18-29 years and 30-39 years).
Attribution: Deana Leahy & Neil Selwyn (2019). Public opinions on Australian schools and schooling. Melbourne, Monash University
RESEARCH REPORT
PAGE 1PAGE 14
Table 5: Survey item: “Which learning areas should be prioritised within Australian public schools over the next few years?”.
Attribution: Deana Leahy & Neil Selwyn (2019). Public opinions on Australian schools and schooling. Melbourne, Monash University
RESEARCH REPORT
Eng Mat Sci Hums Art Tech HPE LangGenderMale 70.7 75.1 49.7 12.4 4.7 35.9 16.8 7.3Female 78.6 76.0 42.8 18.6 3.9 30.8 21.6 7.0Age range (years)18-29 68.3 68.7 50.8 17.2 6.9 33.3 22.8 7.830-39 66.7 72.5 47.5 16.8 8.0 39.2 26.1 8.840-49 76.0 80.1 44.7 13.4 2.6 33.1 18.3 5.750-59 76.3 75.8 46.2 17.5 3.1 30.4 16.3 6.560+ 84.4 80.0 42.6 13.4 1.2 31.2 13.8 7.0SES (postcode data)Low SES 78.1 76.8 42.1 16.1 3.6 32.6 20.6 6.2Medium SES 73.4 76.2 46.6 15.2 4.3 33.2 21.1 6.6High SES 73.8 73.8 49.0 15.5 4.8 34.1 15.8 8.6Urbanity (postcode data)Metro 73.7 74.7 48.5 16.0 4.6 33.7 18.2 18.2Regional 77.9 78.1 39.3 14.0 3.0 32.2 22.5 22.5Household compositionHousehold with child(ren) who are currently attending school 73.8 78.3 45.2 15.6 4.7 35.2 22.4 4.9Household with no children currently attending school 75.0 74.7 46.6 15.5 4.1 32.8 18.3 7.8Family backgroundHave/ have had children attending school 78.5 78.9 44.3 16.1 3.4 33.6 19.1 5.1Have not had children attending school 71.7 72.9 47.8 15.1 4.9 33.2 19.3 8.8StateNew South Wales 73.7 26.9 46.7 17.1 5.8 31.9 16.4 9.4Victoria 74.2 24.5 46.4 17.1 5.6 32.0 23.7 6.4Queensland 78.5 21.3 40.0 13.8 1.9 34.4 20.1 5.8Western Australia 72.8 22.1 53.5 14.3 3.2 36.4 16.6 4.1South Australia 74.8 21.7 53.1 12.6 2.1 38.5 16.1 7.0Speak a language other than English at home?Yes 64.7 75.9 59.5 14.9 5.2 34.5 14.4 11.8No 77.0 75.6 43.5 15.7 4.1 33.3 20.2 6.1Annual household income before taxUp to $39,999 77.8 75.7 39.5 14.3 3.3 30.6 22.2 6.1$40,000 to $79,999 75.3 75.5 47.2 15.3 6.1 35.1 20.5 7.2$80,000 to $119,999 71.7 75.2 48.6 15.3 6.4 36.6 16.5 8.7$120,000 to $199,999 73.7 74.7 51.6 18.9 1.8 30.2 19.6 4.9$200,000 or more 72.3 84.6 60.0 10.8 4.6 40.0 7.7 6.2Highest education level completedYear 12 or below 78.1 76.0 38.1 16.0 2.4 33.8 22.3 5.2TAFE/Technical 77.6 81.1 40.4 12.7 4.4 35.5 16.7 4.4Certificate or Diploma 80.6 76.6 37.9 15.4 3.8 33.2 23.4 8.5University degree or higher 68.3 73.6 58.1 16.7 5.6 32.7 15.6 8.6Voter preference at last Federal electionLiberal/National Alliance 81.3 82.0 48.0 14.0 3.0 33.6 16.3 7.1Labor 73.7 75.6 47.2 16.4 4.8 33.0 15.7 5.6The Greens 62.6 62.6 54.0 18.4 9.2 33.7 21.5 11.0Sector where children attend(ed) schoolGovernment school 76.7 78.2 41.7 15.3 3.5 36.7 19.5 5.0Catholic school 82.3 80.6 45.7 18.3 3.2 27.4 18.3 5.4Independent/private school 83.3 81.5 55.6 18.5 2.8 29.6 17.6 5.6
PAGE 1PAGE 15
A final open-ended survey item asked respondents “Are there any new learning areas that you think should be taught in public schools?”. Just over one-fifth of the sample answered ‘Yes’ to this statement and offered a response (20.9 percent, n=428). These related to four broad areas that people want to see included in what schools teach. Over half of these responses relate to what could be broadly termed ‘life skills’ (n=248, 12.1 percent of the overall sample). This typically includes responses such as:
“Use of money and money management. Also general life skills as unfortunately not enough kids will have parents to actually be bothered to educate them or simply parents don’t know themselves.” [Male, 30-39 years, QLD]
“How to actually function throughout life, e.g. basic cooking, doing laundry, doing taxes, dealing with bank statements and loans, how to buy a house, what services we require from lawyers etc.” [Female, 18-29 years, VIC]
“How to ‘adult’. Taxes, budgets etc.” [Female, 18-29 years, NSW]
“General living. e.g. growing vegetables, how to understand your home loan, car loan etc., how to fill in forms. Just those things that children don’t seem to learn from their parents these days but would make a world of difference to not only their lives post school but society as a whole.” [Female, 40-49 years, QLD]
“Contemporary life skills — a compulsory 1-hour a week class on skills needed that parents seem continually unable to teach their children i.e. Preparation for jobs (bank account, TFN, smart casual dressing, resume writing, superannuation, personal presentation), career and study pathways information, cooking guidance, filing tax, conflict de-escalation, first aid training, critical literacy (i.e. Assessing risk, scams, health claims etc.) Virtually a more comprehensive course on life, health and wellbeing than the current health course.” [Female, 18-29 years, WA]
Three other clusters also emerge from these responses, albeit in much smaller numbers. One set of responses relate to what might be termed ‘traditional knowledge and values’ (n=59, 2.9 percent of the overall sample). This typically includes responses such as:
“Religious instruction and Australia’s Judeo-Christian Heritage.” [Female, 18-29 years, WA]
“History of Western civilisation, the enlightenment and why the west separated religion from the law of the land.” [Male, 60+ years, QLD]
“They should be taught how to respect the wisdom of elders which seems to have gone out the window these days.” [Female, 50-59 years, VIC]
‘Values. In Japan, students are first taught good manners and how to respect other people.” [Female, 30-39 years, QLD]
Another set of responses relate to what might be termed ‘progressive knowledge and values’ (n=53, 2.6 percent of the overall sample). This typically includes responses such as:
“Tolerance and discrimination. Emphasise that it is our differences that what make us unique and special - all of us.” [Male, 40-49 years, WA]
“More of a focus on understanding differences between people, diversity, and more of a focus on Australian history.” [Female, 18-29 years, VIC]
Attribution: Deana Leahy & Neil Selwyn (2019). Public opinions on Australian schools and schooling. Melbourne, Monash University
RESEARCH REPORT
PAGE 1PAGE 16
“How to think critically and make informed decisions. How to take responsibility for your own actions. Respect for others in society in all walks of life.” [Female, 40-49 years, WA]
“Australia’s indigenous history and prehistory. Sustainable living lessons.” [Male, 18-29 years, SA]
A final set of responses related to specific ‘technology-related knowledge and skills; (n=55, 2.7 percent of the overall sample). This typically includes responses such as:
“Technology, coding, artificial intelligence.” [Female, 40-49 years, NSW]
“Robotics, Engineering, Coding/programming. Logical thinking, problem solving.” [Male, 40-49 years, TAS]
“Machine learning.” [Male, 50-59 years, SA]
“Coding, anything to do with new technology.” [Female, 30-39 years, QLD]
“Artificial intelligence, virtual reality.” [Male, 18-29 years, NSW]
As might be expected, these calls for new areas of teaching differ between various demographic characteristics. Most significantly, we find suggestions for the inclusion of various ‘life skills’ teaching in schools to be strongest amongst the following groups:
• Younger age groups: 66.7% of respondents aged 18-29 years offering a suggestion of a new area of teaching focused on life skills. In comparison, ‘life skills’ featured in 51.4% of suggestions from respondents aged 60+ years.
• Women: 68.8% of women offering a suggestion of a new area of teaching focused on life skills. In comparison, ‘life skills’ featured in 44.7% of suggestions from men.
• School sector: 63.4% of government school parents offering a suggestion of a new teaching area focused on life skills. In comparison, ‘life skills’ featured in 47.4% of suggestions from independent/private school parents.
While involving much smaller numbers, it is also interesting to note heightened support for the teaching of ‘traditional knowledge and values’ amongst respondents in the 60+ years age group and/or people who voted for the LNP. Elsewhere, support for the teaching of ‘progressive knowledge and values’ is strongest in the 60+ age group and/or those respondents who have sent children to independent/private schools. These trends are worth exploring in further research, but only relate to relatively small numbers compared to the rest of the survey.
Attribution: Deana Leahy & Neil Selwyn (2019). Public opinions on Australian schools and schooling. Melbourne, Monash University
RESEARCH REPORT
PAGE 1PAGE 17
Attribution: Deana Leahy & Neil Selwyn (2019). Public opinions on Australian schools and schooling. Melbourne, Monash University
RESEARCH REPORT
DISCUSSION POINTS
1. PUBLIC OPINIONS ON SCHOOLS ARE RELATIVELY POSITIVE
Most of the Australian public do not see their schools as being in ‘crisis’ or ‘failing’.
Our survey finds a majority verdict that Australian schools are currently performing ‘OK’ (or better). We also find a majority expectation that this level of performance is likely to stay ‘roughly the same’ (or better) in years to come. While these might not seem like ringing endorsements, they do represent a more positive outlook on the state of schooling than is often reported. While debates around public education are understandably contentious, our findings suggest that politicians, news media and other commentators can afford to be more positive in framing these debates.
2. TRADITIONAL ASPECTS OF EDUCATION CONTINUE TO MATTER
The majority of people are concerned with maintaining ‘traditional’ aspects of what is taught in schools.
Our survey finds people most interested in maintaining English and Mathematics teaching, and ensuring that students have basic levels of numeracy and literacy. We also find high levels of concern with students ‘being respectful’ and ‘teachers being of high quality’. In contrast with these fundamentals, people show less support for what might be seen as progressive and/or liberal aspects of schooling. For example, there is minority concern with students learning things of interest, or being ‘given the opportunity to be creative’. Echoing long-standing arguments over the persistence of divides between the ‘two cultures’, we find much more support for prioritising Science and Technology in schools than that for prioritising Languages and The Arts.
In our opinion, these splits point to an opportunity to broaden the collective ‘educational imagination’ of Australia. The argument can be made that Australian schools will be strongest if they excel in all these areas. Australian schools are already involved in many successful applications of interest-driven learning, Arts-based creative education and citizenship education. In this sense, there is a clear opportunity for schools to better engage parents and local communities in the ways in which such approaches are being integrated into teaching and learning processes, while continuing to also prioritise what people currently perceive to be ‘the basics.’
3. RECOGNISING GENERATIONAL DIVERSITY IN HOW EDUCATION IS SEEN
The main demographic divide in people’s views of school that our survey shows is between age groups.
Our survey finds far fewer differences than expected in terms of people’s political preferences, socio economic status and parents/non-parents. However, respondents in the oldest age group (60+ years) are notably less optimistic, and more concerned with issues of student respect and teacher quality. This finding raises two possible explanations. It could be argued that older people are basing their ideas on out-dated recollections and experiences of their own schooling and/or their children’s schooling. On the other hand, these differences might reflect greater life-experience and the capacity to take a long-view on current developments.

PAGE 1PAGE 18
In our opinion, there is certainly a need to better reflect the views of younger age groups in discussions of education practice and policy (especially those with recent direct experience of schools). Yet this need not be at the expense of also listening more to the views of older generations. Indeed, it is salutatory that older survey respondents are most likely to suggest the teaching of traditional values and the teaching of progressive values. This finding reminds us that there is not one unified ‘older generation’ voice, but a range of views, ideas and standpoints that is worth drawing on when discussing education.
4. ADDRESSING UNEVEN SUPPORT FOR SCIENCE IN SCHOOL
Unlike other subject areas, public support for the prioritisation of Science teaching is divided in terms of specific demographic groups — notably prevalent amongst people in higher income groups, university educated, living in metropolitan areas and/or with children who attended independent/private school.
Nearly half our respondents support the prioritisation of Science teaching in school. Indeed, there has been a sustained push of so-called ‘STEM’ teaching in Australian schools during the 2010s. However, this message appears to be resonating with specific segments of the population. The need for increased Science education is certainly not accepted across all of the Australian population. There is a need to better promote Science teaching to those segments of the population who perhaps currently feel less included in these debates.
In our opinion, these findings highlight the danger of creating a STEM education ‘filter bubble’. Instead, there is a clear need for Science education professionals to work harder to get their findings and recommendations across all sections of the population. Conversely, there is also a need to reflect on why these professional science education assumptions are not resonating fully with the wider public.
5. PUBLIC OPINION ON SCHOOLS IS SURPRISINGLY BI-PARTISAN
Public views on schools and schooling appear to be relatively bi-partisan. Politicians, policymakers and govern-ments should work together to develop policies with cross-party support.
While debates around education are often contentious, our survey found far fewer divides and schisms in public opinions around schools and schooling than might be expected. In particular, we find few differences in opinions between voters of the main political parties. This suggests that policy work in the area of public schools can afford to be a more consensual issue. Australian politicians, policymakers and governments should feel comfortable to work together in developing school-related policies with cross-party support.
Attribution: Deana Leahy & Neil Selwyn (2019). Public opinions on Australian schools and schooling. Melbourne, Monash University
RESEARCH REPORT
PAGE 1PAGE 19
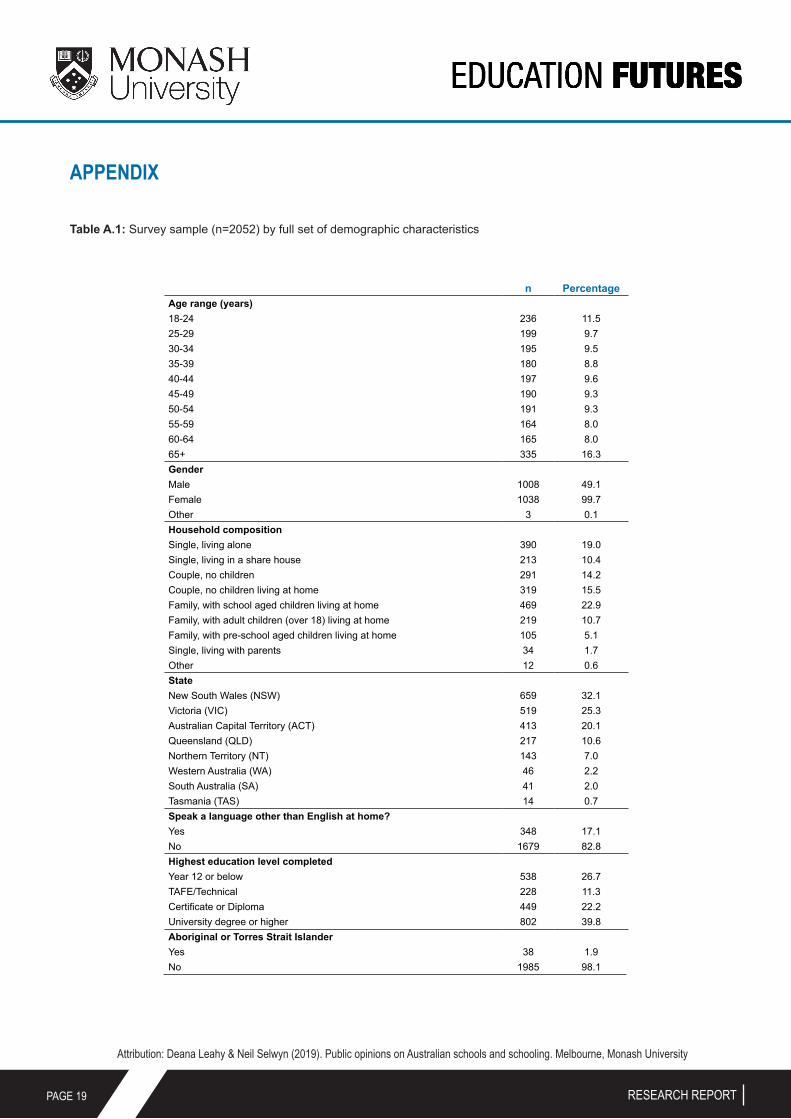
APPENDIX
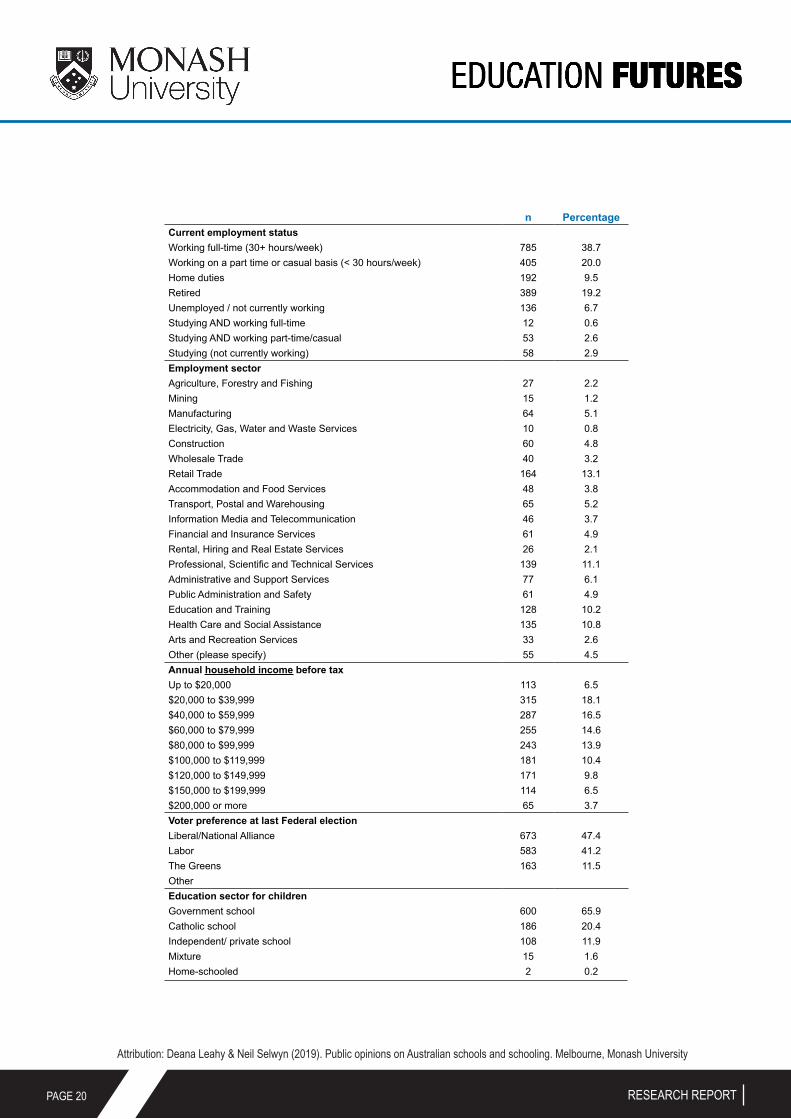
Table A.1: Survey sample (n=2052) by full set of demographic characteristics
Attribution: Deana Leahy & Neil Selwyn (2019). Public opinions on Australian schools and schooling. Melbourne, Monash University
RESEARCH REPORT
n PercentageAge range (years)18-24 236 11.525-29 199 9.730-34 195 9.535-39 180 8.840-44 197 9.645-49 190 9.350-54 191 9.355-59 164 8.060-64 165 8.065+ 335 16.3GenderMale 1008 49.1Female 1038 99.7Other 3 0.1Household compositionSingle, living alone 390 19.0Single, living in a share house 213 10.4Couple, no children 291 14.2Couple, no children living at home 319 15.5Family, with school aged children living at home 469 22.9Family, with adult children (over 18) living at home 219 10.7Family, with pre-school aged children living at home 105 5.1Single, living with parents 34 1.7Other 12 0.6StateNew South Wales (NSW) 659 32.1Victoria (VIC) 519 25.3Australian Capital Territory (ACT) 413 20.1Queensland (QLD) 217 10.6Northern Territory (NT) 143 7.0Western Australia (WA) 46 2.2South Australia (SA) 41 2.0Tasmania (TAS) 14 0.7Speak a language other than English at home?Yes 348 17.1No 1679 82.8Highest education level completedYear 12 or below 538 26.7TAFE/Technical 228 11.3Certificate or Diploma 449 22.2University degree or higher 802 39.8Aboriginal or Torres Strait IslanderYes 38 1.9No 1985 98.1
PAGE 1PAGE 20
n PercentageCurrent employment statusWorking full-time (30+ hours/week) 785 38.7Working on a part time or casual basis (< 30 hours/week) 405 20.0Home duties 192 9.5Retired 389 19.2Unemployed / not currently working 136 6.7Studying AND working full-time 12 0.6Studying AND working part-time/casual 53 2.6Studying (not currently working) 58 2.9Employment sectorAgriculture, Forestry and Fishing 27 2.2Mining 15 1.2Manufacturing 64 5.1Electricity, Gas, Water and Waste Services 10 0.8Construction 60 4.8Wholesale Trade 40 3.2Retail Trade 164 13.1Accommodation and Food Services 48 3.8Transport, Postal and Warehousing 65 5.2Information Media and Telecommunication 46 3.7Financial and Insurance Services 61 4.9Rental, Hiring and Real Estate Services 26 2.1Professional, Scientific and Technical Services 139 11.1Administrative and Support Services 77 6.1Public Administration and Safety 61 4.9Education and Training 128 10.2Health Care and Social Assistance 135 10.8Arts and Recreation Services 33 2.6Other (please specify) 55 4.5Annual household income before taxUp to $20,000 113 6.5$20,000 to $39,999 315 18.1$40,000 to $59,999 287 16.5$60,000 to $79,999 255 14.6$80,000 to $99,999 243 13.9$100,000 to $119,999 181 10.4$120,000 to $149,999 171 9.8$150,000 to $199,999 114 6.5$200,000 or more 65 3.7Voter preference at last Federal electionLiberal/National Alliance 673 47.4Labor 583 41.2The Greens 163 11.5OtherEducation sector for childrenGovernment school 600 65.9Catholic school 186 20.4Independent/ private school 108 11.9Mixture 15 1.6Home-schooled 2 0.2
Attribution: Deana Leahy & Neil Selwyn (2019). Public opinions on Australian schools and schooling. Melbourne, Monash University
RESEARCH REPORT
PAGE 1PAGE 21
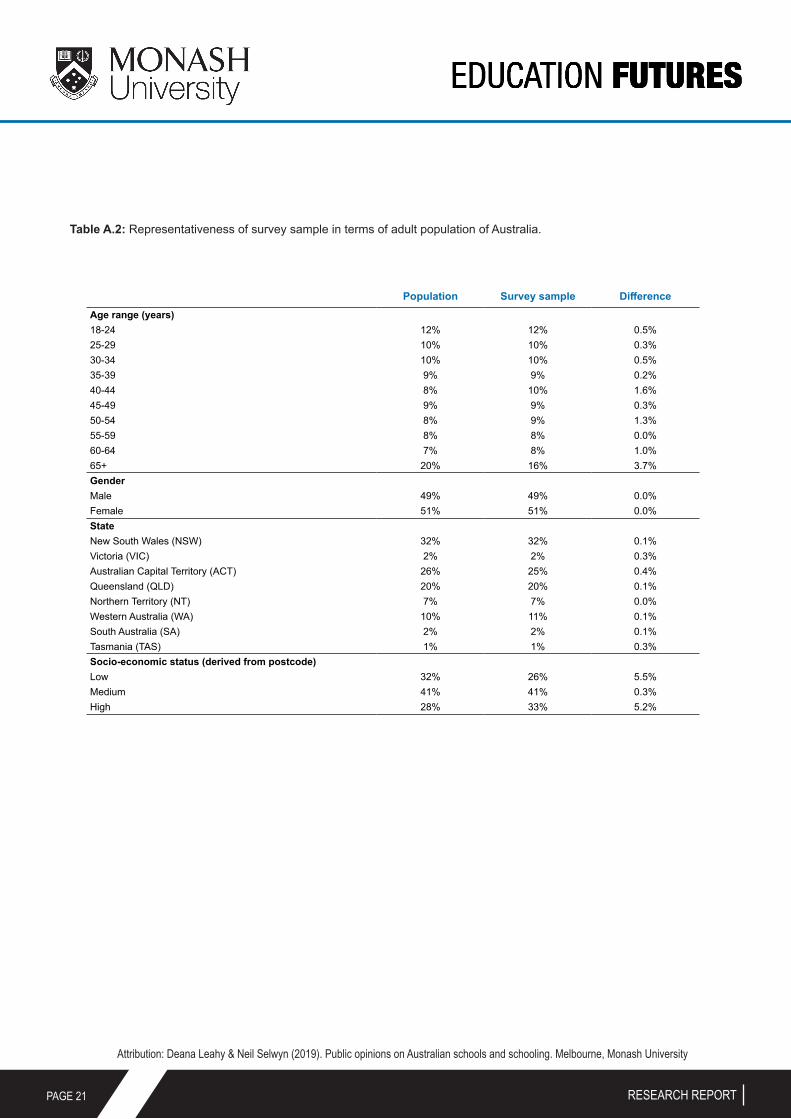
Table A.2: Representativeness of survey sample in terms of adult population of Australia.
Population Survey sample DifferenceAge range (years)18-24 12% 12% 0.5%25-29 10% 10% 0.3%30-34 10% 10% 0.5%35-39 9% 9% 0.2%40-44 8% 10% 1.6%45-49 9% 9% 0.3%50-54 8% 9% 1.3%55-59 8% 8% 0.0%60-64 7% 8% 1.0%65+ 20% 16% 3.7%GenderMale 49% 49% 0.0%Female 51% 51% 0.0%StateNew South Wales (NSW) 32% 32% 0.1%Victoria (VIC) 2% 2% 0.3%Australian Capital Territory (ACT) 26% 25% 0.4%Queensland (QLD) 20% 20% 0.1%Northern Territory (NT) 7% 7% 0.0%Western Australia (WA) 10% 11% 0.1%South Australia (SA) 2% 2% 0.1%Tasmania (TAS) 1% 1% 0.3%Socio-economic status (derived from postcode)Low 32% 26% 5.5%Medium 41% 41% 0.3%High 28% 33% 5.2%
Attribution: Deana Leahy & Neil Selwyn (2019). Public opinions on Australian schools and schooling. Melbourne, Monash University
RESEARCH REPORT

Education FuturesFaculty of Education
Monash University19 Ancora Imparo Way
Clayton VIC 3800Australia
www.monash.edu/edfutures [email protected]
Twitter: @EDUC_FUTURES
CRICOS provider: Monash University 00008C